Sampling networks of ecological interactions Pedro Jordano *a a Integrative Ecology Group, Estación Biológica de Doñana, Consejo Superior de Investigaciones Científicas (EBD-CSIC), Avenida Americo Vespucio s/n, E–41092 Sevilla, Spain Sevilla, September 2, 2015 Summary 1. Sampling ecological interactions presents similar challenges, problems, poten- tial biases, and constraints as sampling individuals and species in biodiversity inventories. Interactions are just pairwise relationships among individuals of two different species, such as those among plants and their seed dispersers in frugivory interactions or those among plants and their pollinators. Sampling interactions is a fundamental step to build robustly estimated interaction networks, yet few analyses have attempted a formal approach to their sam- pling protocols. * [email protected]1 . CC-BY-NC-ND 4.0 International license not peer-reviewed) is the author/funder. It is made available under a The copyright holder for this preprint (which was . http://dx.doi.org/10.1101/025734 doi: bioRxiv preprint first posted online Sep. 1, 2015;
Transcript
Sampling networks of ecological interactions
Pedro Jordano∗a
aIntegrative Ecology Group, Estación Biológica de Doñana, Consejo
Superior de Investigaciones Científicas (EBD-CSIC), Avenida
Americo Vespucio s/n, E–41092 Sevilla, Spain
Sevilla, September 2, 2015
Summary
1. Sampling ecological interactions presents similar challenges, problems, poten-
tial biases, and constraints as sampling individuals and species in biodiversity
inventories. Interactions are just pairwise relationships among individuals of
two different species, such as those among plants and their seed dispersers in
frugivory interactions or those among plants and their pollinators. Sampling
interactions is a fundamental step to build robustly estimated interaction
networks, yet few analyses have attempted a formal approach to their sam-
.CC-BY-NC-ND 4.0 International licensenot peer-reviewed) is the author/funder. It is made available under aThe copyright holder for this preprint (which was. http://dx.doi.org/10.1101/025734doi: bioRxiv preprint first posted online Sep. 1, 2015;
2. Robust estimates of the actual number of interactions (links) within diver-
sified ecological networks require adequate sampling effort that needs to be
explicitly gauged. Yet we still lack a sampling theory explicitly focusing on
ecological interactions.
3. While the complete inventory of interactions is likely impossible, a robust
characterization of its main patterns and metrics is probably realistic. We
must acknowledge that a sizable fraction of the maximum number of interac-
tions Imax among, say, A animal species and P plant species (i.e., Imax = AP )
is impossible to record due to forbidden links, i.e., life-history restrictions.
Thus, the number of observed interactions I in robustly sampled networks is
typically I << Imax, resulting in extremely sparse interaction matrices with
low connectance.
4. Reasons for forbidden links are multiple but mainly stem from spatial and
temporal uncoupling of partner species encounters and from intrinsically low
probabilities of interspecific encounter for many of the potential pairwise
interactions. Adequately assessing the completeness of a network of ecolog-
ical interactions thus needs a deep knowledge of the natural history details
embedded, so that forbidden links can be “discounted” when addressing sam-
pling effort.
5. Here I provide a review and outline a conceptual framework for interaction
sampling by building an explicit analogue to individuals and species sam-
pling, thus extending diversity-monitoring approaches to the characterization
of complex networks of ecological interactions. This is crucial to assess the
fast-paced and devastating effects of defaunation-driven loss of key ecological
2
.CC-BY-NC-ND 4.0 International licensenot peer-reviewed) is the author/funder. It is made available under aThe copyright holder for this preprint (which was. http://dx.doi.org/10.1101/025734doi: bioRxiv preprint first posted online Sep. 1, 2015;
2011). Recent effort has been also focused at defining essential biodiversity vari-8
ables (EBV) (Pereira et al., 2013) that can be sampled and measured repeatedly9
to complement biodiversity estimates. Yet sampling species or taxa-specific EBVs10
is just probing a single component of biodiversity; interactions among species are11
another fundamental component, the one that supports the existence, but in some12
3
.CC-BY-NC-ND 4.0 International licensenot peer-reviewed) is the author/funder. It is made available under aThe copyright holder for this preprint (which was. http://dx.doi.org/10.1101/025734doi: bioRxiv preprint first posted online Sep. 1, 2015;
be a central issue when identifying and diagnosing ecosystem services (e.g., polli-32
nation, natural seeding by frugivores, etc.). Fortunately, all the whole battery of33
biodiversity-related tools used by ecologists to sample biodiversity (species, sensu34
stricto) can be extended and applied to the sampling of interactions. Analogs35
are evident between these approaches (Colwell, Dunn & Harris, 2012). Monitor-36
ing interactions is analogous to any biodiversity sampling [i.e., a species inventory37
4
.CC-BY-NC-ND 4.0 International licensenot peer-reviewed) is the author/funder. It is made available under aThe copyright holder for this preprint (which was. http://dx.doi.org/10.1101/025734doi: bioRxiv preprint first posted online Sep. 1, 2015;
.CC-BY-NC-ND 4.0 International licensenot peer-reviewed) is the author/funder. It is made available under aThe copyright holder for this preprint (which was. http://dx.doi.org/10.1101/025734doi: bioRxiv preprint first posted online Sep. 1, 2015;
Williams, 2015). The sampling approaches have been extended to predict patterns66
of coextintions in interaction assemblages (e.g., hosts-parasites) (Colwell, Dunn &67
Harris, 2012). Most empirical studies provide no estimate of sampling effort, im-68
plicitly assuming that the reported network patterns and metrics are robust. Yet69
recent evidences point out that number of partner species detected, number of70
actual links, and some aggregate statistics describing network patterns, are prone71
to sampling bias (Nielsen & Bascompte, 2007; Dorado et al., 2011; Olesen et al.,72
2011; Chacoff et al., 2012; Rivera-Hutinel et al., 2012; Olito & Fox, 2014; Frund,73
McCann & Williams, 2015). Most of these evidences, however, come either from74
simulation studies (Frund, McCann & Williams, 2015) or from relatively species-75
poor assemblages. Even for species-rich, tropical assemblages it might be erroneous76
to conclude that network data routinely come from insufficiently sampled datasets77
(Ollerton & Cranmer, 2002; Chacoff et al., 2012), given the extremely sparse nature78
of these interaction matrices because of the prevalence of forbidden links (which,79
by definition, cannot be documented despite extensive sampling effort). However,80
most certainly, sampling limitations pervade biodiversity inventories in tropical81
areas (Coddington et al., 2009) and we might rightly expect that frequent inter-82
actions may be over-represented and rare interactions may be missed entirely in83
studies of mega-diverse assemblages (Bascompte & Jordano, 2014); but, to what84
extent?85
6
.CC-BY-NC-ND 4.0 International licensenot peer-reviewed) is the author/funder. It is made available under aThe copyright holder for this preprint (which was. http://dx.doi.org/10.1101/025734doi: bioRxiv preprint first posted online Sep. 1, 2015;
When we sample interactions in the field we record the presence of two species that87
interact in some way. For example, Snow and Snow(1988) recorded an interaction88
whenever they saw a bird “touching” a fruit on a plant. We observe and record89
feeding observations, visitation, occupancy, presence in pollen loads or in fecal90
samples, etc., of individual animals or plants and accumulate pairwise interactions,91
i.e., lists of species partners and the frequencies with which we observe them.92
Therefore, estimating the sampling completeness of pairwise interactions for a93
whole network, requires some gauging of the sampling completeness (i.e., how the94
number (richness) of distinct pairwise interactions accumulates as sampling effort95
is increased) and/or estimating the uncertainty around the missed links (Wells &96
O’Hara, 2012).97
Most types of ecological interactions can be illustrated with bipartite graphs,98
with two or more distinct groups of interacting partners (Bascompte & Jordano,99
2014); for illustration purposes I’ll focus more specifically on plant-animal interac-100
tions. Sampling interactions requires filling the cells of an interaction matrix with101
data. The matrix, ∆ = AP , is a 2D representation of the interactions among,102
say, A animal species (rows) and P plant species (columns) (Jordano, 1987; Bas-103
compte & Jordano, 2014). The matrix entries illustrate the values of the pairwise104
interactions visualized in the ∆ matrix, and can be 0 or 1, for presence-absence105
of a given pairwise interaction, or take a quantitative weight wji to represent the106
interaction intensity or unidirectional effect of species j on species i (Bascompte107
& Jordano, 2014; Vazquez et al., 2015). The outcomes of most ecological inter-108
actions are dependent on frequency of encounters (e.g., visit rate of pollinators,109
7
.CC-BY-NC-ND 4.0 International licensenot peer-reviewed) is the author/funder. It is made available under aThe copyright holder for this preprint (which was. http://dx.doi.org/10.1101/025734doi: bioRxiv preprint first posted online Sep. 1, 2015;
We need to define two basic steps in the sampling of interactions: 1) which114
type of interactions we sample; and 2) which type of record we get to document115
the existence of an interaction. In step #1 we need to take into account whether116
we are sampling the whole community of interactor species (all the animals, all117
the plants) or just a subset of them, i.e., a sub matrix ∆m,n of m < A animal118
species and n < P plant species of the adjacency matrix ∆AP . Subsets can be:119
a) all the potential plants interacting with a subset of the animals (Fig. 1a); b)120
all the potential animal species interacting with a subset of the plant species (Fig.121
1b); c) a subset of all the potential animal species interacting with a subset of all122
the plant species (Fig. 1c). While some discussion has considered how to establish123
the limits of what represents a network (Strogatz, 2001) (in analogy to discussion124
on food-web limits; Cohen, 1978), it must be noted that situations a-c in Fig.125
1 do not represent complete interaction networks. As vividly stated by Cohen126
et al. (1993): “As more comprehensive, more detailed, more explicit webs become127
available, smaller, highly aggregated, incompletely described webs may progressively128
be dropped from analyses of web structure (though such webs may remain useful for129
other purposes, such as pedagogy)”. Subnet sampling is generalized in studies of130
biological networks (e.g., protein interactions, gene regulation), yet it is important131
to recognize that most properties of subnetworks (even random subsamples) do132
not represent properties of whole networks (Stumpf, Wiuf & May, 2005).133
In step #2 above we face the problem of the type of record we take to sample134
8
.CC-BY-NC-ND 4.0 International licensenot peer-reviewed) is the author/funder. It is made available under aThe copyright holder for this preprint (which was. http://dx.doi.org/10.1101/025734doi: bioRxiv preprint first posted online Sep. 1, 2015;
interactions. This is important because it defines whether we approach the problem135
of filling up the interaction matrix in a “zoo-centric” way or in a “phyto-centric”136
way. Zoo-centric studies directly sample animal activity and document the plants137
‘touched’ by the animal. For example, analysis of pollen samples recovered from the138
body of pollinators, analysis of fecal samples of frugivores, radio-tracking data, etc.139
Phyto-centric studies take samples of focal individual plant species and document140
which animals ‘arrive’ or ‘touch’ the plants. Examples include focal watches of141
fruiting or flowering plants to record visitation by animals, raising insect herbivores142
from seed samples, identifying herbivory marks in samples of leaves, etc.143
Most recent analyses of plant-animal interaction networks are phyto-centric;144
just 3.5% of available plant-pollinator (N= 58) or 36.6% plant-frugivore (N= 22)145
interaction datasets are zoo-centric (see Schleuning et al., 2012). Moreover, most146
available datasets on host-parasite (parasitoid) or plant-herbivore interactions are147
“host-centric” or phyto-centric (e.g., Thébault & Fontaine, 2010; Morris et al.,148
2013; Eklöf et al., 2013). This may be related to a variety of causes, like preferred149
methodologies by researchers working with a particular group or system, logistic150
limitations, or inherent taxonomic focus of the research questions. A likely result151
of phyto-centric sampling would be adjacency matrices with large A : P ratios.152
In any case we don’t have a clear view of the potential biases that taxa-focused153
sampling may generate in observed network patterns, for example by generating154
consistently asymmetric interaction matrices (Dormann et al., 2009). System sym-155
metry has been suggested to influence estimations of generalization levels in plants156
and animals when measured as IA and IP (Elberling & Olesen, 1999); thus, differ-157
ences in IA and IP between networks may arise from different A : P ratios rather158
than other ecological factors (Olesen & Jordano, 2002).159
9
.CC-BY-NC-ND 4.0 International licensenot peer-reviewed) is the author/funder. It is made available under aThe copyright holder for this preprint (which was. http://dx.doi.org/10.1101/025734doi: bioRxiv preprint first posted online Sep. 1, 2015;
Interestingly enough, quite complete analyses of interaction networks can be160
obtained when combining both phyto-centric and zoo-centric sampling. For ex-161
ample, Bosch et al. (2009) showed that the addition of pollen load data on top162
of focal-plant sampling of pollinators unveiled a significant number of interac-163
tions, resulting in important network structural changes. Connectance increased164
1.43-fold, mean plant connectivity went from 18.5 to 26.4, and mean pollinator165
connectivity from 2.9 to 4.1; moreover, extreme specialist pollinator species (sin-166
gletons in the adjacency matrix) decreased 0.6-fold. (Olesen et al. 2011) identified167
pollen loads on sampled insects and added the new links to an observation-based168
visitation matrix, with an extra 5% of links representing the estimated number169
of missing links in the pollination network. The overlap between observational170
and pollen-load recorded links was only 33%, underscoring the value of combin-171
ing methodological approaches. Zoo-centric sampling has recently been extended172
with the use of DNA-barcoding, for example with plant-herbivore (Jurado-Rivera173
et al., 2009), host-parasiotid (Wirta et al., 2014), and plant-frugivore interactions174
(González-Varo, Arroyo & Jordano, 2014). For mutualistic networks we would ex-175
pect that zoo-centric sampling could help unveiling interactions for rare species or176
for relatively common species which are difficult to sample by direct observation.177
Future methodological work may provide significant advances showing how mixing178
different sampling strategies strengthens the completeness of network data. These179
mixed strategies may combine, for instance, timed watches at focal plants, spot180
censuses along walked transects, pollen load or seed contents analyses, monitoring181
with camera traps, and DNA barcoding records. We might expect increased power182
of these mixed sampling approaches when combining different methods from both183
phyto- and zoo-centric perspectives (Bosch et al., 2009; Bluthgen, 2010). Note also184
10
.CC-BY-NC-ND 4.0 International licensenot peer-reviewed) is the author/funder. It is made available under aThe copyright holder for this preprint (which was. http://dx.doi.org/10.1101/025734doi: bioRxiv preprint first posted online Sep. 1, 2015;
that the different methods could be applied in different combinations to the two185
distinct sets of species. However, there are no tested protocols and/or sampling186
designs for ecological interaction studies to suggest an optimum combination of187
approaches. Ideally, pilot studies would provide adequate information for each188
specific study setting.189
Sampling interactions: rationale190
The number of distinct pairwise interactions that we can record in a landscape191
(an area of relatively homogeneous vegetation, analogous to the one we would192
use to monitor species diversity) is equivalent to the number of distinct classes in193
which we can classify the recorded encounters among individuals of two different194
species. Yet, individual-based interaction networks have been only recently studied195
(Dupont, Trøjelsgaard & Olesen, 2011; Wells & O’Hara, 2012). The most usual196
approach has been to pool indiviudal-based interaction data into species-based197
summaries, an approach that ignores the fact that only a fraction of individuals198
may actually interact given a per capita interaction effect (Wells & O’Hara, 2012).199
Wells & O’Hara (2012) illustrate the pros and cons of the approach. We walk in200
the forest and see a blackbird Tm picking an ivy Hh fruit and ingesting it: we201
have a record for Tm − Hh interaction. We keep advancing and record again a202
blackbird feeding on hawthorn Cm fruits so we record a Tm − Cm interaction;203
as we advance we encounter another ivy plant and record a blackcap swallowing a204
fruit so we now have a new Sa −Hh interaction, and so on. At the end we have205
a series of classes (e.g., Sa − Hh, Tm − Hh, Tm − Cm, etc.), along with their206
observed frequencies. Bunge & Fitzpatrick (1993) review the main aspects and ap-207
11
.CC-BY-NC-ND 4.0 International licensenot peer-reviewed) is the author/funder. It is made available under aThe copyright holder for this preprint (which was. http://dx.doi.org/10.1101/025734doi: bioRxiv preprint first posted online Sep. 1, 2015;
proaches to estimate the number of distinct classes C in a sample of observations.208
Our main problem then turns to estimate the number of true missed links, i.e.,209
those that can’t be accounted for by biological constraints and that might suggest210
undersampling. Thus, the sampling of interactions in nature, as the sampling of211
species, is a cumulative process. In our analysis, we are not re-sampling individ-212
uals, but interactions, so we made interaction-based accumulation curves. If an213
interaction-based curve points towards a robust sampling, it does mean that no214
new interactions are likely to be recorded, irrespectively of the species, as it is a215
whole-network sampling approach (N. Gotelli, pers. com.). We add new, distinct,216
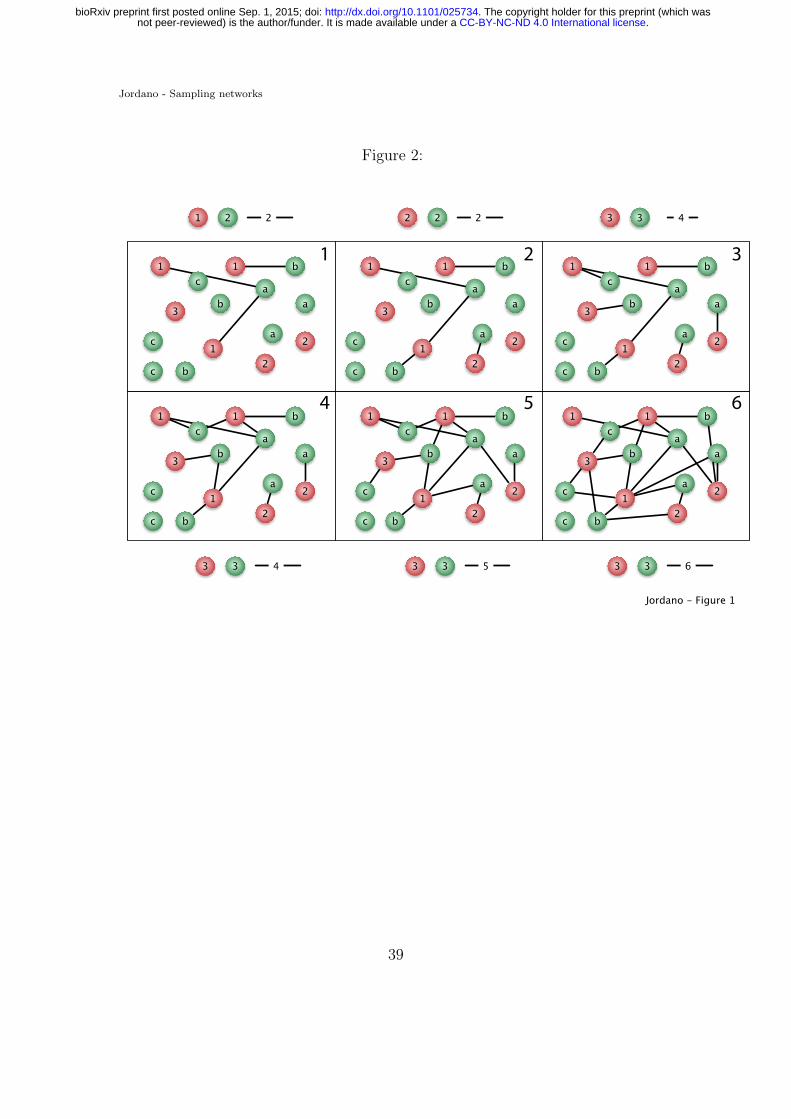
interactions recorded as we increase sampling effort (Fig. 2). We can obtain an217
Interaction Accumulation Curve (IAC) analogous to a Species cumulating Curve218
(SAC) (see Supplementary Online Material): the observed number of distinct219
pairwise interactions in a survey or collection as a function of the accumulated220
number of observations or samples (Colwell, 2009).221
Our sampling above would have resulted in a vector n = [n1...nC ]′ where ni is222
the number of records in the ith class. As stressed by Bunge & Fitzpatrick (1993),223
however, the ith class would appear in the sample if and only if ni > 0, and we224
don’t know a priori which ni are zero. So, n is not observable. Rather, what we225
get is a vector c = [c1...cn]′ where cj is the number of classes represented j times226
in our sampling: c1 is the number of singletons (interactions recorded once), c2227
is the number of twin pairs (interactions wkth just two records), c3 the number228
of triplets, etc. The problem thus turns to be estimating the number of distinct229
classes C from the vector of cj values and the frequency of unobserved interactions230
(see “The real missing links” below).231
Estimating the number of interactions with resulting robust estimates of net-232
12
.CC-BY-NC-ND 4.0 International licensenot peer-reviewed) is the author/funder. It is made available under aThe copyright holder for this preprint (which was. http://dx.doi.org/10.1101/025734doi: bioRxiv preprint first posted online Sep. 1, 2015;
1). Forbidden links are thus represented as structural zeroes in the interaction ma-252
trix, i.e., matrix cells that cannot get a non-zero value. We might expect different253
types of FL to occupy different parts of the ∆ matrix, with missing cells due to254
phenological uncoupling, FLP , largely distributed in the lower-right half ∆ matrix255
and actually missed links ML distributed in its central part (Olesen et al., 2010).256
Yet, most of these aspects remain understudied. Therefore, we need to account for257
13
.CC-BY-NC-ND 4.0 International licensenot peer-reviewed) is the author/funder. It is made available under aThe copyright holder for this preprint (which was. http://dx.doi.org/10.1101/025734doi: bioRxiv preprint first posted online Sep. 1, 2015;
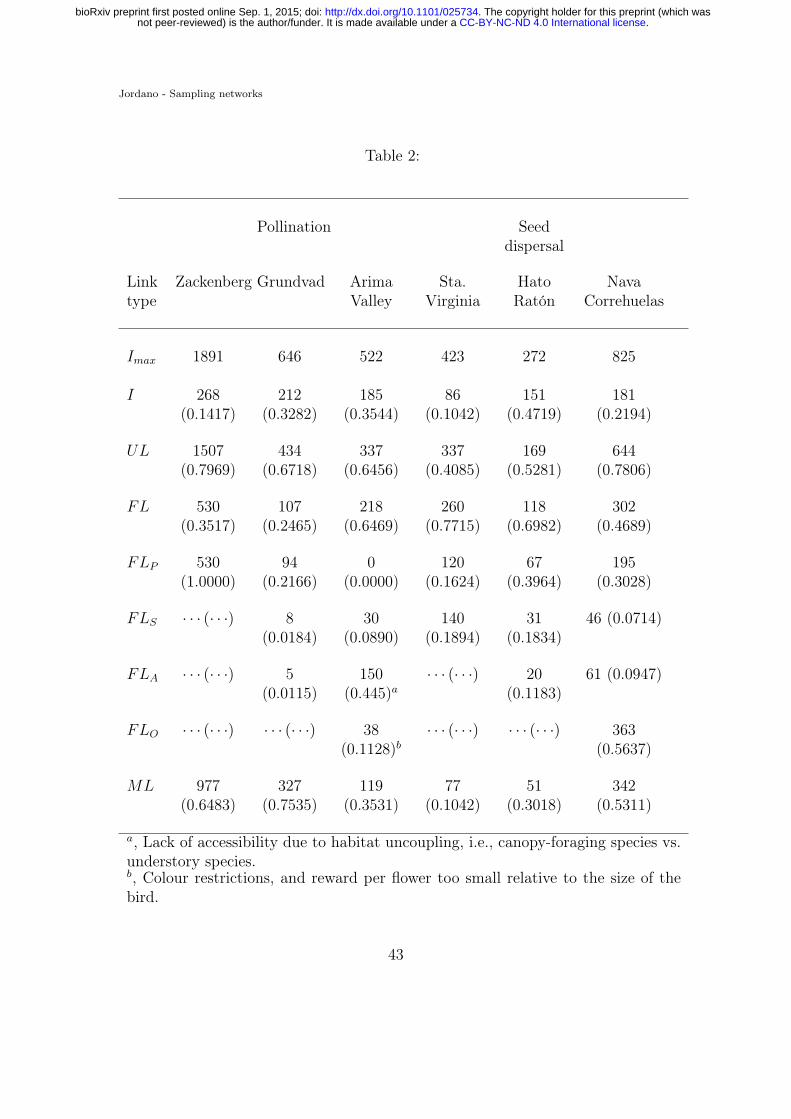
networks) (Table 1). Phenological unmatching is also prevalent in most networks,276
and may add up to explain ca. 25–40% of the forbidden links, especially in highly277
seasonal habitats, and up to 20% when estimated relative to the total number278
of unobserved interactions (Table 2). In any case, we might expect that a frac-279
tion of the missing links ML would be eventually explained by further biological280
reasons, depending on the knowledge of natural details of the particular systems.281
Our goal as naturalists would be to reduce the fraction of UL which remain as282
14
.CC-BY-NC-ND 4.0 International licensenot peer-reviewed) is the author/funder. It is made available under aThe copyright holder for this preprint (which was. http://dx.doi.org/10.1101/025734doi: bioRxiv preprint first posted online Sep. 1, 2015;
missing links; to this end we might search for additional biological constraints or283
increase sampling effort. For instance, habitat use patterns by hummingbirds in284
the Arima Valley network (Table 2; Snow & Snow, 1972) impose a marked pattern285
of microhabitat mismatches causing up to 44.5% of the forbidden links. A myr-286
iad of biological causes beyond those included as FL in Table 2 may contribute287
explanations for UL: limits of color perception and or partial preferences, pres-288
ence of secondary metabolites in fruit pulp and leaves, toxins and combinations289
of monosaccharides in nectar, etc. However, it is surprising that just the limited290
set of forbidden link types considered in Table 1 explain between 24.6–77.2% of291
the unobserved links. Notably, the Arima Valley, Santa Virgńia, and Hato Ratón292
networks have > 60% of the unobserved links explained, which might be related293
to the fact that they are subnetworks (Arima Valley, Santa Virgínia) or relatively294
small networks (Hato Ratón). All this means that empirical networks may have295
sizable fractions of structural zeroes. Ignoring this biological fact may contribute296
to wrongly inferring undersampling of interactions in real-world assemblages.297
To sum up, two elements of inference are required in the analysis of unobserved298
interactions in ecological interaction networks: first, detailed natural history infor-299
mation on the participant species that allows the inference of biological constraints300
imposing forbidden links, so that structural zeroes can by identified in the adja-301
cency matrix. Second, a critical analysis of sampling robustness and a robust302
estimate of the actual fraction of missing links, M , resulting in a robust estimate303
of I. In the next sections I explore these elements of inference. The basic proposal304
is to use IACs to assess the robustness of interaction sampling, then scale the305
asymptotic estimate of interactions richness to account for the unrealizable FL.306
15
.CC-BY-NC-ND 4.0 International licensenot peer-reviewed) is the author/funder. It is made available under aThe copyright holder for this preprint (which was. http://dx.doi.org/10.1101/025734doi: bioRxiv preprint first posted online Sep. 1, 2015;
Another frequently used alternative is the Chao2 estimator, SChao2 (Gotelli &311
Colwell, 2001), which has been reported to have a limited bias for small sample312
16
.CC-BY-NC-ND 4.0 International licensenot peer-reviewed) is the author/funder. It is made available under aThe copyright holder for this preprint (which was. http://dx.doi.org/10.1101/025734doi: bioRxiv preprint first posted online Sep. 1, 2015;
A plot of the cumulative number of species recorded, Sn, as a function of some314
measure of sampling effort (say, n samples taken) yields the species accumulation315
curve (SAC) or collector’s curve (Colwell & Coddington, 1994). Such a curve316
eventually reaches an asymptote converging with Sest. Similarly, interaction accu-317
mulation curves (IAC), analogous to SACs, can be used to assess the robustness318
of interactions sampling for plant-animal community datasets (Jordano, 1987; Jor-319
dano, Vázquez & Bascompte, 2009; Olesen et al., 2011). For instance, a random320
accumulator function (e.g., library vegan in the R Package, R Development Core321
Team, 2010) which finds the mean IAC and its standard deviation from random322
permutations of the data, or subsampling without replacement (Gotelli & Colwell,323
2001) can be used to estimate the expected number of distinct pairwise interactions324
included in a given sampling of records (Jordano, Vázquez & Bascompte, 2009;325
Olesen et al., 2011). This is analogous to a biodiversity sampling matrix with326
species as rows and sampling units (e.g., quadrats) as columns (Jordano, Vázquez327
& Bascompte, 2009). In this way we effectively extend sampling theory developed328
for species diversity to the sampling of ecological interactions. Yet future theoret-329
ical work will be needed to formally assess the similarities and differences in the330
two approaches and developing biologically meaningful null models of expected331
interaction richness with added sampling effort.332
17
.CC-BY-NC-ND 4.0 International licensenot peer-reviewed) is the author/funder. It is made available under aThe copyright holder for this preprint (which was. http://dx.doi.org/10.1101/025734doi: bioRxiv preprint first posted online Sep. 1, 2015;
should be noted that the asymptotic estimate of interaction richness implicitly355
ignores the fact that, due to forbidden links, a number of pairwise interactions356
18
.CC-BY-NC-ND 4.0 International licensenot peer-reviewed) is the author/funder. It is made available under aThe copyright holder for this preprint (which was. http://dx.doi.org/10.1101/025734doi: bioRxiv preprint first posted online Sep. 1, 2015;
among the Imax number specified in the adjacency matrix ∆ cannot be recorded,357
irrespective of sampling effort. Therefore, the asymptotic value most likely is an358
overestimate of the actual maximum number of links that can be present in an359
assemblage. If forbidden links are taken into account, the asymptotic estimate360
should be lower. Yet, to the best of my knowledge, there is no theory developed361
to estimate this “biologically real” asymptotic value. Not unexpectedly, most re-362
cent analyses of sampling effort in ecological network studies found evidences of363
undersampling (Chacoff et al., 2012). This needs not to be true, especially when364
interaction subwebs are studied (Olesen et al., 2011; Vizentin-Bugoni, Maruyama365
& Sazima, 2014), and once the issue of structural zeroes in the interaction matrices366
is effectively incorporated in the estimates.367
For example, mixture models incorporating detectabilities have been proposed368
to effectively account for rare species (Mao & Colwell, 2005). In an analogous line,369
mixture models could be extended to samples of pairwise interactions, also with370
specific detectability values. These detection rate/odds could be variable among371
groups of interactions, depending on their specific detectability. For example,372
detectability of flower-pollinator interactions involving bumblebees could have a373
higher detectability than flower-pollinator pairwise interactions involving, say, ni-374
tidulid beetles. These more homogeneous groupings of pairwise interactions within375
a network define modules (Bascompte & Jordano, 2014), so we might expect that376
interactions of a given module (e.g., plants and their hummingbird pollinators; Fig.377
1a) may share similar detectability values, in an analogous way to species groups378
receiving homogeneous detectability values in mixture models (Mao & Colwell,379
2005). In its simplest form, this would result in a sample with multiple pairwise380
interactions detected, in which the number of interaction events recorded for each381
19
.CC-BY-NC-ND 4.0 International licensenot peer-reviewed) is the author/funder. It is made available under aThe copyright holder for this preprint (which was. http://dx.doi.org/10.1101/025734doi: bioRxiv preprint first posted online Sep. 1, 2015;
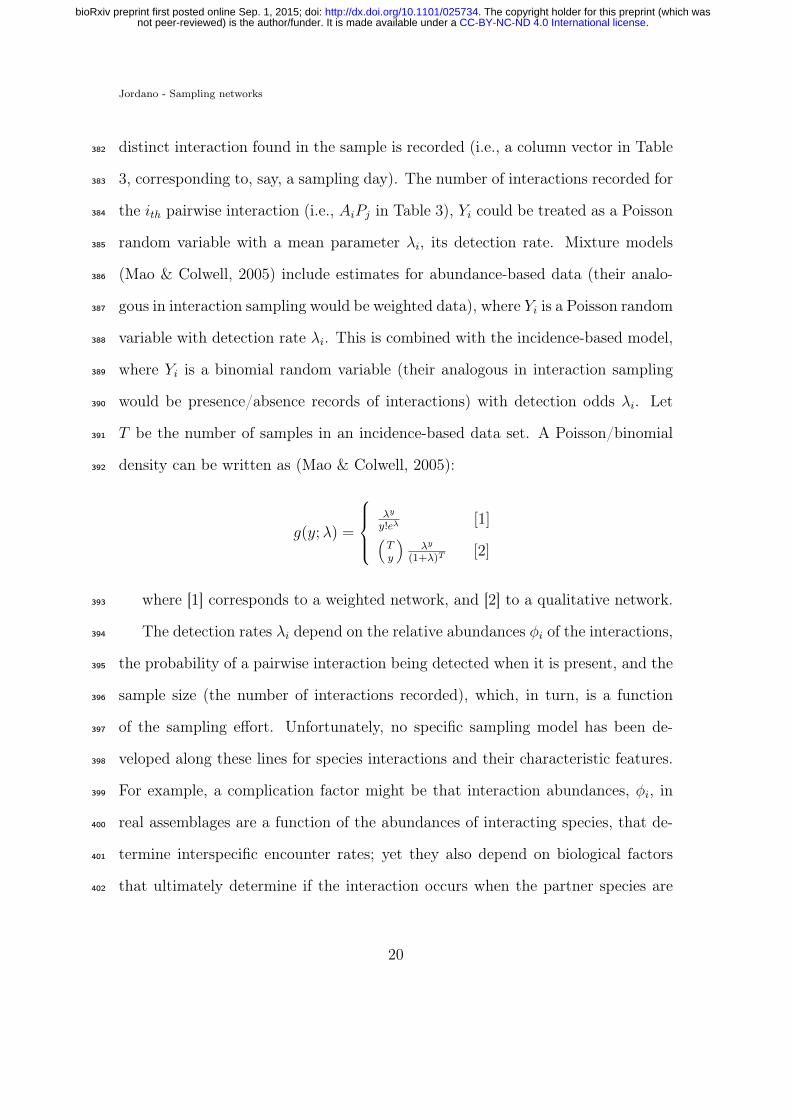
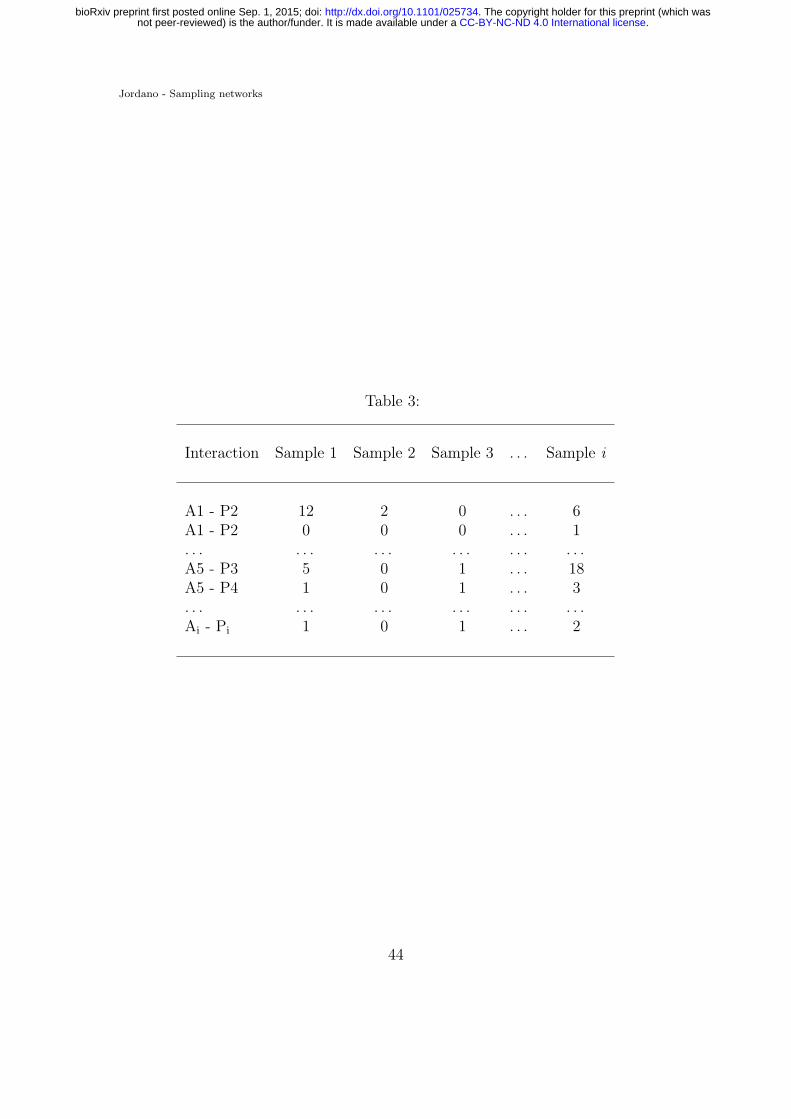
distinct interaction found in the sample is recorded (i.e., a column vector in Table382
3, corresponding to, say, a sampling day). The number of interactions recorded for383
the ith pairwise interaction (i.e., AiPj in Table 3), Yi could be treated as a Poisson384
random variable with a mean parameter λi, its detection rate. Mixture models385
(Mao & Colwell, 2005) include estimates for abundance-based data (their analo-386
gous in interaction sampling would be weighted data), where Yi is a Poisson random387
variable with detection rate λi. This is combined with the incidence-based model,388
where Yi is a binomial random variable (their analogous in interaction sampling389
would be presence/absence records of interactions) with detection odds λi. Let390
T be the number of samples in an incidence-based data set. A Poisson/binomial391
density can be written as (Mao & Colwell, 2005):392
g(y;λ) =
λy
y!eλ[1](
Ty
)λy
(1+λ)T[2]
where [1] corresponds to a weighted network, and [2] to a qualitative network.393
The detection rates λi depend on the relative abundances φi of the interactions,394
the probability of a pairwise interaction being detected when it is present, and the395
sample size (the number of interactions recorded), which, in turn, is a function396
of the sampling effort. Unfortunately, no specific sampling model has been de-397
veloped along these lines for species interactions and their characteristic features.398
For example, a complication factor might be that interaction abundances, φi, in399
real assemblages are a function of the abundances of interacting species, that de-400
termine interspecific encounter rates; yet they also depend on biological factors401
that ultimately determine if the interaction occurs when the partner species are402
20
.CC-BY-NC-ND 4.0 International licensenot peer-reviewed) is the author/funder. It is made available under aThe copyright holder for this preprint (which was. http://dx.doi.org/10.1101/025734doi: bioRxiv preprint first posted online Sep. 1, 2015;
2012) should incorporate not only interspecific encounter probabilities, but also408
interaction detectabilities, phenotypic matching and incidence of forbidden links.409
The real missing links410
Given that a fraction of unobserved interactions can be accounted for by for-411
bidden links, what about the remaining missing interactions? We have already412
discussed that some of these could still be related to unaccounted constraints, and413
still others would be certainly attributable to insufficient sampling. Would this414
always be the case? Multispecific assemblages of distinct taxonomic relatedness,415
whose interactions can be represented as bipartite networks (e.g., host-parasite,416
plant-animal mutualisms, plant-herbivore interactions- with two distinct sets of417
unrelated higher taxa), are shaped by interspecific encounters among individuals418
of the partner species (Fig. 2). A crucial ecological aspect limiting these inter-419
actions is the probability of interspecific encounter, i.e., the probability that two420
individuals of the partner species actually encounter each other in nature.421
Given log-normally distributed abundances of the two species groups, the ex-422
pected “neutral” probabilities of interspecific encounter (PIE) would be simply the423
product of the two lognormal distributions. Thus, we might expect that for low424
PIE values, pairwise interactions would be either extremely difficult to sample, or425
21
.CC-BY-NC-ND 4.0 International licensenot peer-reviewed) is the author/funder. It is made available under aThe copyright holder for this preprint (which was. http://dx.doi.org/10.1101/025734doi: bioRxiv preprint first posted online Sep. 1, 2015;
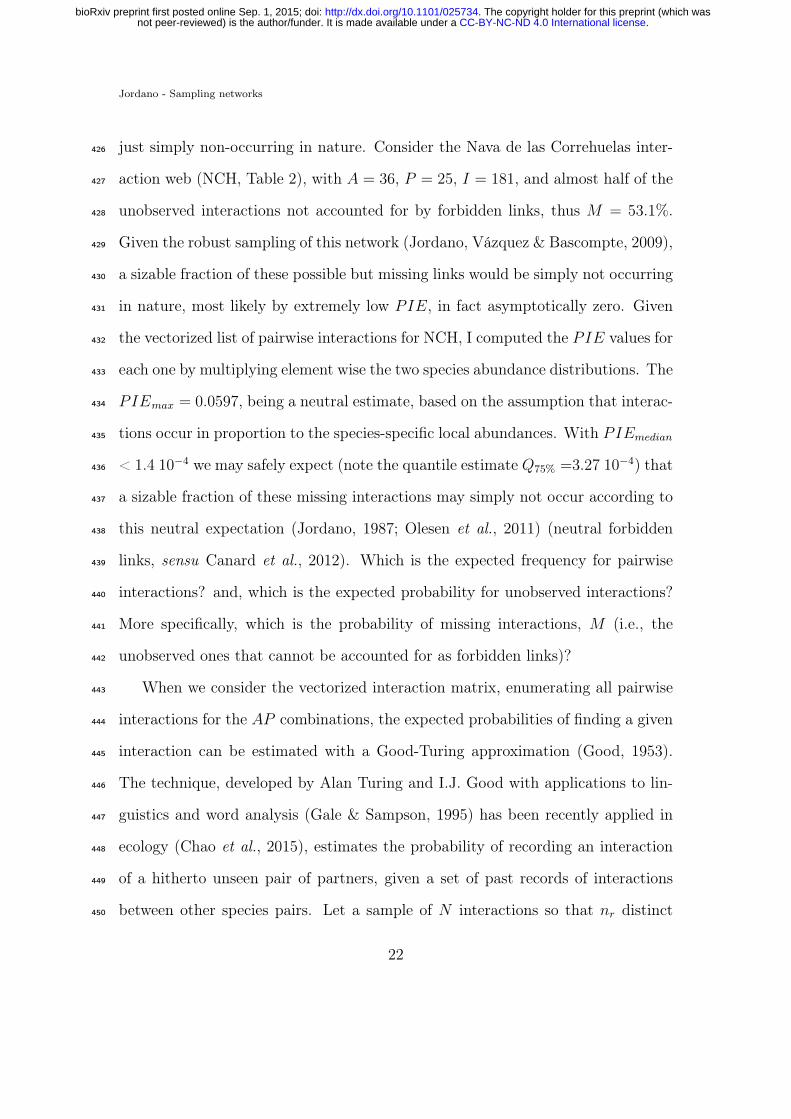
just simply non-occurring in nature. Consider the Nava de las Correhuelas inter-426
action web (NCH, Table 2), with A = 36, P = 25, I = 181, and almost half of the427
unobserved interactions not accounted for by forbidden links, thus M = 53.1%.428
Given the robust sampling of this network (Jordano, Vázquez & Bascompte, 2009),429
a sizable fraction of these possible but missing links would be simply not occurring430
in nature, most likely by extremely low PIE, in fact asymptotically zero. Given431
the vectorized list of pairwise interactions for NCH, I computed the PIE values for432
each one by multiplying element wise the two species abundance distributions. The433
PIEmax = 0.0597, being a neutral estimate, based on the assumption that interac-434
tions occur in proportion to the species-specific local abundances. With PIEmedian435
< 1.4 10−4 we may safely expect (note the quantile estimate Q75% =3.27 10−4) that436
a sizable fraction of these missing interactions may simply not occur according to437
this neutral expectation (Jordano, 1987; Olesen et al., 2011) (neutral forbidden438
links, sensu Canard et al., 2012). Which is the expected frequency for pairwise439
interactions? and, which is the expected probability for unobserved interactions?440
More specifically, which is the probability of missing interactions, M (i.e., the441
unobserved ones that cannot be accounted for as forbidden links)?442
When we consider the vectorized interaction matrix, enumerating all pairwise443
interactions for the AP combinations, the expected probabilities of finding a given444
interaction can be estimated with a Good-Turing approximation (Good, 1953).445
The technique, developed by Alan Turing and I.J. Good with applications to lin-446
guistics and word analysis (Gale & Sampson, 1995) has been recently applied in447
ecology (Chao et al., 2015), estimates the probability of recording an interaction448
of a hitherto unseen pair of partners, given a set of past records of interactions449
between other species pairs. Let a sample of N interactions so that nr distinct450
22
.CC-BY-NC-ND 4.0 International licensenot peer-reviewed) is the author/funder. It is made available under aThe copyright holder for this preprint (which was. http://dx.doi.org/10.1101/025734doi: bioRxiv preprint first posted online Sep. 1, 2015;
pairwise interactions have exactly r records. All Good-Turing estimators obtain451
the underlying frequencies of events as:452
P (X) =(NX + 1)
T(1 − E(1)
T) (1)
where X is the pairwise interaction, NX is the number of times interaction X453
is recorded, T is the sample size (number of distinct interactions recorded) and454
E(1) is an estimate of how many different interactions were recorded exactly once.455
Strictly speaking Equation (1) gives the probability that the next interaction type456
recorded will be X, after sampling a given assemblage of interacting species. In457
other words, we scale down the maximum-likelihood estimator nT
by a factor of458
1−E(1)T
. This reduces all the probabilities for interactions we have recorded, and459
makes room for interactions we haven’t seen. If we sum over the interactions we460
have seen, then the sum of P (X) is 1 − 1−E(1)T
. Because probabilities sum to one,461
we have the left-over probability of Pnew = E(1)T
of seeing something new, where462
new means that we sample a new pairwise interaction.463
Note, however, that Good-Turing estimators, as the traditional asymptotic464
estimators, do not account in our case for the forbidden interactions. To account for465
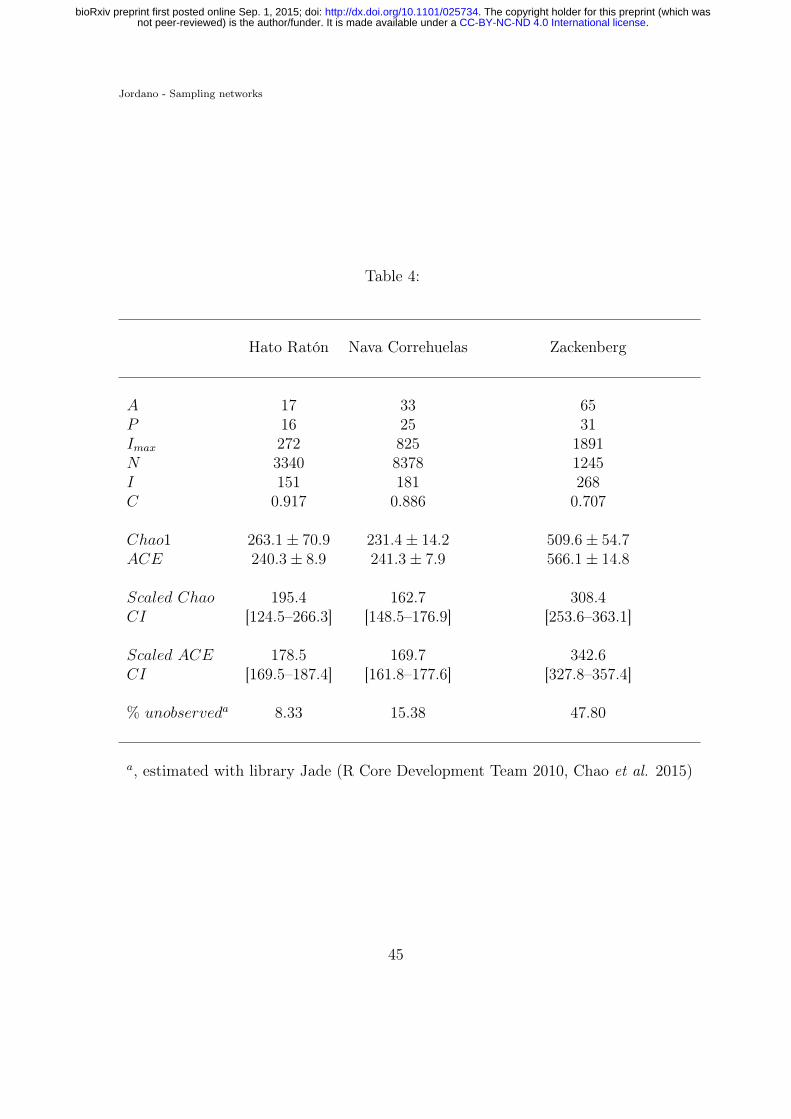
these FL I re-scaled the asymptotic estimates, so that a more meaningful estimate466
could be obtained (Table 4). The scaling was calculated as [Chao1∗(I+ML)]/AP ,467
just correcting for the FL frequency, given that I+ML represent the total feasible468
interactions when discounting the forbidden links (Table 1). After scaling, observed469
I values (Table 2) are within the Chao1 and ACE asymptotic estimates but below470
the ACE estimates for Hato Ratón and Zackenberg (Table 4). Thus, even after471
re-scaling for FL, it is likely that adequate characterization of most interaction472
23
.CC-BY-NC-ND 4.0 International licensenot peer-reviewed) is the author/funder. It is made available under aThe copyright holder for this preprint (which was. http://dx.doi.org/10.1101/025734doi: bioRxiv preprint first posted online Sep. 1, 2015;
networks will require intensive sampling effort.473
Discussion474
Recent work has inferred that most data available for interaction networks are475
incomplete due to undersampling, resulting in a variety of biased parameters and476
network patterns (Chacoff et al., 2012). It is important to note, however, that477
in practice, many surveyed networks to date have been subnets of much larger478
networks. This is true for protein interaction, gene regulation, and metabolic479
networks, where only a subset of the molecular entities in a cell have been sam-480
pled (Stumpf, Wiuf & May, 2005). Despite recent attempts to document whole481
ecosystem meta-networks (Pocock, Evans & Memmott, 2012), it is likely that most482
ecological interaction networks will illustrate just major ecosystem compartments.483
Due to their high generalization, high temporal and spatial turnover, and high484
complexity of association patterns, adequate sampling of ecological interaction485
networks requires extremely large sampling effort. Undersampling of ecological486
networks may originate from the analysis of assemblage subsets (e.g., taxonomi-487
cally or functionally defined), and/or from logistically-limited sampling effort. It488
is extremely hard to robustly sample the set of biotic interactions even for rela-489
tively simple, species-poor assemblages; yet, concluding that all ecological network490
datasets are undersampled would be unrealistic. The reason stems from a biologi-491
cal fact: a sizeable fraction of the maximum, potential links that can be recorded492
among two distinct sets of species is simply unobservable, irrespective of sampling493
effort (Jordano, 1987).494
Missing links are a characteristic feature of all plant-animal interaction net-495
24
.CC-BY-NC-ND 4.0 International licensenot peer-reviewed) is the author/funder. It is made available under aThe copyright holder for this preprint (which was. http://dx.doi.org/10.1101/025734doi: bioRxiv preprint first posted online Sep. 1, 2015;
works, and likely pervade other ecological interactions. Important natural history496
details explain a fraction of them, resulting in unrealizable interactions (i.e., for-497
bidden interactions) that define structural zeroes in the interaction matrices and498
contribute to their extreme sparseness. Sampling interactions is a way to monitor499
biodiversity beyond the simple enumeration of component species and to develop500
efficient and robust inventories of functional interactions. Yet no sampling theory501
for interactions is available. Some key components of this sampling are analo-502
gous to species sampling and traditional biodiversity inventories; however, there503
are important differences. Focusing just on the realized interactions or treating504
missing interactions as the expected unique result of sampling bias would miss505
important components to understand how mutualisms coevolve within complex506
webs of interdependence among species.507
Contrary to species inventories, a sizable fraction of non-observed pairwise508
interactions cannot be sampled, due to biological constraints that forbid their oc-509
currence. A re-scaling of traditional asymptotic estimates for interaction richness510
can be applied whenever the knowledge of natural history details about the study511
system is sufficient to estimate at least the main causes of forbidden links. More-512
over, recent implementations of inference methods for unobserved species (Chao513
et al., 2015) or for individual-based data (Wells & O’Hara, 2012) can be combined514
with the forbidden link approach, yet they do not account either for the existence515
of these ecological constraints.516
Ecological interactions provide the wireframe supporting the lives of species,517
and they also embed crucial ecosystem functions which are fundamental for sup-518
porting the Earth system. Yet we still have a limited knowledge of the biodiversity519
of ecological interactions, but they are being lost (extinct) at a very fast pace, fre-520
25
.CC-BY-NC-ND 4.0 International licensenot peer-reviewed) is the author/funder. It is made available under aThe copyright holder for this preprint (which was. http://dx.doi.org/10.1101/025734doi: bioRxiv preprint first posted online Sep. 1, 2015;
quently preceding species extinctions (Valiente-Banuet et al., 2014). We urgently521
need robust techniques to assess the completeness of ecological interactions net-522
works because this knowledge will allow the identification of the minimal compo-523
nents of their ecological complexity that need to be restored to rebuild functional524
ecosystems after perturbations.525
Acknowledgements526
I am indebted to Jens M. Olesen, Alfredo Valido, Jordi Bascompte, Thomas527
Lewinshon, John N. Thompson, Nick Gotelli, Carsten Dormann, and Paulo R.528
Guimaraes Jr. for useful and thoughtful discussion at different stages of this529
manuscript. Jeferson Vizentin-Bugoni kindly helped with the Sta Virgínia data.530
Jens M. Olesen kindly made available the Grundvad dataset; together with Robert531
Colwell, Néstor Pérez-Méndez, JuanPe González-Varo, and Paco Rodríguez pro-532
vided most useful comments to a final version of the ms. The study was supported533
by a Junta de Andalucía Excellence Grant (RNM–5731), as well as a Severo Ochoa534
Excellence Award from the Ministerio de Economía y Competitividad (SEV–2012–535
0262). The Agencia de Medio Ambiente, Junta de Andalucía, provided generous536
facilities that made possible my long-term field work in different natural parks.537
Data accessiblity538
This review does not use new raw data, but includes some re-analyses of previously539
published material. All the original data supporting the paper, R code, supple-540
mentary figures, and summaries of analytical protocols is available at the author’s541
26
.CC-BY-NC-ND 4.0 International licensenot peer-reviewed) is the author/funder. It is made available under aThe copyright holder for this preprint (which was. http://dx.doi.org/10.1101/025734doi: bioRxiv preprint first posted online Sep. 1, 2015;
Banasek-Richter, C., Cattin, M. & Bersier, L. (2004) Sampling effects and the ro-545
bustness of quantitative and qualitative food-web descriptors. Journal of Theo-546
retical Biology, 226, 23–32.547
Bascompte, J. & Jordano, P. (2014) Mutualistic networks. Monographs in Popu-548
lation Biology, No. 53. Princeton University Press, Princeton, NJ.549
Bersier, L., Banasek-Richter, C. & Cattin, M. (2002) Quantitative descriptors of550
food-web matrices. Ecology, 83, 2394–2407.551
Bluthgen, N. (2010) Why network analysis is often disconnected from community552
ecology: A critique and an ecologist’s guide. Basic And Applied Ecology, 11,553
185–195.554
Bosch, J., Martín González, A.M., Rodrigo, A. & Navarro, D. (2009) Plant-555
pollinator networks: adding the pollinator’s perspective. Ecology Letters, 12,556
409–419.557
Brose, U., Martinez, N. & Williams, R. (2003) Estimating species richness: Sen-558
sitivity to sample coverage and insensitivity to spatial patterns. Ecology, 84,559
2364–2377.560
Bunge, J. & Fitzpatrick, M. (1993) Estimating the number of species: a review.561
Journal of the American Statistical Association, 88, 364–373.562
27
.CC-BY-NC-ND 4.0 International licensenot peer-reviewed) is the author/funder. It is made available under aThe copyright holder for this preprint (which was. http://dx.doi.org/10.1101/025734doi: bioRxiv preprint first posted online Sep. 1, 2015;
.CC-BY-NC-ND 4.0 International licensenot peer-reviewed) is the author/funder. It is made available under aThe copyright holder for this preprint (which was. http://dx.doi.org/10.1101/025734doi: bioRxiv preprint first posted online Sep. 1, 2015;
.CC-BY-NC-ND 4.0 International licensenot peer-reviewed) is the author/funder. It is made available under aThe copyright holder for this preprint (which was. http://dx.doi.org/10.1101/025734doi: bioRxiv preprint first posted online Sep. 1, 2015;
versity Frontiers in Measurement and Assessment (eds. A.E. Magurran & B.J.625
McGill), pp. 39–54. Oxford University Press, Oxford, UK.626
30
.CC-BY-NC-ND 4.0 International licensenot peer-reviewed) is the author/funder. It is made available under aThe copyright holder for this preprint (which was. http://dx.doi.org/10.1101/025734doi: bioRxiv preprint first posted online Sep. 1, 2015;
Gotelli, N. & Colwell, R. (2001) Quantifying biodiversity: procedures and pitfalls627
in the measurement and comparison of species richness. Ecology Letters, 4,628
379–391.629
Hortal, J., Borges, P. & Gaspar, C. (2006) Evaluating the performance of species630
richness estimators: sensitivity to sample grain size. Journal of Animal Ecology,631
75, 274–287.632
Ibanez, S. (2012) Optimizing size thresholds in a plant–pollinator interaction web:633
towards a mechanistic understanding of ecological networks. Oecologia, 170,634
233–242.635
Jordano, P. (1987) Patterns of mutualistic interactions in pollination and seed dis-636
persal: connectance, dependence asymmetries, and coevolution. The American637
Naturalist, 129, 657–677.638
Jordano, P., Bascompte, J. & Olesen, J. (2003) Invariant properties in coevolu-639
tionary networks of plant-animal interactions. Ecology Letters, 6, 69–81.640
Jordano, P., Vázquez, D. & Bascompte, J. (2009) Redes complejas de interac-641
ciones planta—animal. Ecología y evolución de interacciones planta-animal (eds.642
R. Medel, R. Dirzo & R. Zamora), pp. 17–41. Editorial Universitaria, Santiago,643
Chile.644
Jurado-Rivera, J.A., Vogler, A.P., Reid, C.A.M., Petitpierre, E. & Gomez-Zurita,645
J. (2009) DNA barcoding insect-host plant associations. Proceedings Of The646
Royal Society B-Biological Sciences, 276, 639–648.647
31
.CC-BY-NC-ND 4.0 International licensenot peer-reviewed) is the author/funder. It is made available under aThe copyright holder for this preprint (which was. http://dx.doi.org/10.1101/025734doi: bioRxiv preprint first posted online Sep. 1, 2015;
action networks are structured independently of latitude and host guild. Ecology664
Letters, 17, 340–349.665
Nielsen, A. & Bascompte, J. (2007) Ecological networks, nestedness and sampling666
effort. Journal of Ecology, 95, 1134–1141–1141.667
Olesen, J.M., Bascompte, J., Dupont, Y.L., Elberling, H. & Jordano, P. (2011)668
32
.CC-BY-NC-ND 4.0 International licensenot peer-reviewed) is the author/funder. It is made available under aThe copyright holder for this preprint (which was. http://dx.doi.org/10.1101/025734doi: bioRxiv preprint first posted online Sep. 1, 2015;
N., Dulloo, E., Faith, D., Freyhof, J., Gregory, R.D., Heip, C., Hoft, R., Hurtt,683
G., Jetz, W., Karp, D.S., Mcgeoch, M., Obura, D., Onoda, Y., Pettorelli, N.,684
Reyers, B., Sayre, R., Scharlemann, J.P.W., Stuart, S., Turak, E., Walpole, M.685
& Wegmann, M. (2013) Essential biodiversity variables. Science, 339, 277–278.686
Pocock, M.J.O., Evans, D.M. & Memmott, J. (2012) The Robustness and Restora-687
tion of a Network of Ecological Networks. Science, 335, 973–977.688
Preston, F. (1948) The commonness, and rarity, of species. Ecology, 29, 254–283.689
33
.CC-BY-NC-ND 4.0 International licensenot peer-reviewed) is the author/funder. It is made available under aThe copyright holder for this preprint (which was. http://dx.doi.org/10.1101/025734doi: bioRxiv preprint first posted online Sep. 1, 2015;
Snow, B. & Snow, D. (1972) Feeding niches of hummingbirds in a Trinidad valley.704
Journal of Animal Ecology, 41, 471–485.705
Snow, B. & Snow, D. (1988) Birds and berries. Poyser, Calton, UK.706
Stang, M., Klinkhamer, P., Waser, N.M., Stang, I. & van der Meijden, E. (2009)707
Size-specific interaction patterns and size matching in a plant-pollinator inter-708
action web. Annals Of Botany, 103, 1459–1469.709
Strogatz, S. (2001) Exploring complex networks. Nature, 410, 268–276.710
Stumpf, M.P.H., Wiuf, C. & May, R.M. (2005) Subnets of scale-free networks are711
34
.CC-BY-NC-ND 4.0 International licensenot peer-reviewed) is the author/funder. It is made available under aThe copyright holder for this preprint (which was. http://dx.doi.org/10.1101/025734doi: bioRxiv preprint first posted online Sep. 1, 2015;
minants of the structure of plant-animal mutualistic networks. Ecology, 90,722
2039–2046.723
Vazquez, D.P., Ramos-Jiliberto, R., Urbani, P. & Valdovinos, F.S. (2015) A con-724
ceptual framework for studying the strength of plant-animal mutualistic inter-725
actions. Ecology Letters, 18, 385–400.726
Vazquez, D., Morris, W. & Jordano, P. (2005) Interaction frequency as a surrogate727
for the total effect of animal mutualists on plants. Ecology Letters, 8, 1088–1094.728
Vizentin-Bugoni, J., Maruyama, P.K. & Sazima, M. (2014) Processes entangling729
interactions in communities: forbidden links are more important than abundance730
in a hummingbird-plant network. Proceedings Of The Royal Society B-Biological731
Sciences, 281, 20132397–20132397.732
Wells, K. & O’Hara, R.B. (2012) Species interactions: estimating per-individual733
35
.CC-BY-NC-ND 4.0 International licensenot peer-reviewed) is the author/funder. It is made available under aThe copyright holder for this preprint (which was. http://dx.doi.org/10.1101/025734doi: bioRxiv preprint first posted online Sep. 1, 2015;
interaction strength and covariates before simplifying data into per-species eco-734
logical networks. Methods in Ecology and Evolution, 4, 1–8.735
Wirta, H.K., Hebert, P.D.N., Kaartinen, R., Prosser, S.W., Várkonyi, G. & Roslin,736
T. (2014) Complementary molecular information changes our perception of food737
web structure. Proceedings of the National Academy of Sciences USA, 111,738
1885–1890.739
36
.CC-BY-NC-ND 4.0 International licensenot peer-reviewed) is the author/funder. It is made available under aThe copyright holder for this preprint (which was. http://dx.doi.org/10.1101/025734doi: bioRxiv preprint first posted online Sep. 1, 2015;
tions) usually focus on different types of subsampling the full network, yielding742
submatrices ∆[m,n] of the full interaction matrix ∆ with A and P animal and743
plant species. a) all the potential plants interacting with a subset of the animals744
(e.g., studying just the hummingbird-pollinated flower species in a community);745
b) all the potential animal species interacting with a subset of the plant species746
(e.g., studying the frugivore species feeding on figs Ficus in a community); and c)747
sampling a subset of all the potential animal species interacting with a subset of all748
the plant species (e.g., studying the plant-frugivore interactions of the rainforest749
understory).750
751
Figure 2. Sampling species interactions in natural communities. Suppose an752
assemblage with A = 3 animal species (red, species 1–3 with three, two, and 1753
individuals, respectively) and P = 3 plant species (green, species a-c with three754
individuals each) (colored balls), sampled with increasing effort in steps 1 to 6755
(panels). In Step 1 we record animal species 1 and plant species 1 and 2 with756
a total of three interactions (black lines) represented as two distinct interactions:757
1 − a and 1 − b. As we advance our sampling (panels 1 to 6, illustrating e.g.,758
additional sampling days) we record new distinct interactions. Note that we actu-759
ally sample and record interactions among individuals, yet we pool the data across760
species to get a species by species interaction matrix. Few network analyses have761
been carried out on individual data(Dupont et al., 2014).762
763
37
.CC-BY-NC-ND 4.0 International licensenot peer-reviewed) is the author/funder. It is made available under aThe copyright holder for this preprint (which was. http://dx.doi.org/10.1101/025734doi: bioRxiv preprint first posted online Sep. 1, 2015;
.CC-BY-NC-ND 4.0 International licensenot peer-reviewed) is the author/funder. It is made available under aThe copyright holder for this preprint (which was. http://dx.doi.org/10.1101/025734doi: bioRxiv preprint first posted online Sep. 1, 2015;
.CC-BY-NC-ND 4.0 International licensenot peer-reviewed) is the author/funder. It is made available under aThe copyright holder for this preprint (which was. http://dx.doi.org/10.1101/025734doi: bioRxiv preprint first posted online Sep. 1, 2015;
restrictions; ML, unknown causes (missing links). Relative frequencies (in paren-778
theses) calculated over Imax = AP for I,ML, and FL; for all forbidden links types,779
calculated over FL. References, from left to right: Olesen et al. 2008; Olesen &780
Myrthue unpubl.; Snow & Snow 1972 and Jordano et al. 2006; Vizentin-Bugoni781
et al. 2014; Jordano et al. 2009; Olesen et al. 2011.782
783
Table 3. A vectorized interaction matrix.784
785
Table 4. Sampling statistics for three plant-animal interaction networks (Olesen786
et al. 2011). Symbols as in Table 1; N , number of records; Chao1 and ACE are787
asymptotic estimators for the number of distinct pairwise interactions I (Hortal788
40
.CC-BY-NC-ND 4.0 International licensenot peer-reviewed) is the author/funder. It is made available under aThe copyright holder for this preprint (which was. http://dx.doi.org/10.1101/025734doi: bioRxiv preprint first posted online Sep. 1, 2015;
et al. 2006), and their standard errors; C, sample coverage for rare interactions789
(Chao & Jost 2012). Scaled asymptotic estimators and their confidence intervals790
(CI) were calculated by weighting Chao1 and ACE with the observed frequencies791
of forbidden links.792
793
41
.CC-BY-NC-ND 4.0 International licensenot peer-reviewed) is the author/funder. It is made available under aThe copyright holder for this preprint (which was. http://dx.doi.org/10.1101/025734doi: bioRxiv preprint first posted online Sep. 1, 2015;
Potential links Imax = AP Size of network matrix, i.e. maximum number ofpotentially observable interactions;A and P , numbers of interacting animal andplant species, respectively.
Observed links I Total number of observed links in the network givena sufficient sampling effort. Number of ones in theadjacency matrix.
Unobserved links UL = Imax − I Number of zeroes in the adjacency matrix.
Forbidden links FL Number of links, which remain unobserved becauseof linkage constraints, irrespectively of sufficientsampling effort.
Missing links ML = AP − I − FL Number of links, which may exist in nature but needmore sampling effort and/or additional samplingmethods to be observed.
42
.CC-BY-NC-ND 4.0 International licensenot peer-reviewed) is the author/funder. It is made available under aThe copyright holder for this preprint (which was. http://dx.doi.org/10.1101/025734doi: bioRxiv preprint first posted online Sep. 1, 2015;
a, Lack of accessibility due to habitat uncoupling, i.e., canopy-foraging species vs.understory species.b, Colour restrictions, and reward per flower too small relative to the size of thebird.
43
.CC-BY-NC-ND 4.0 International licensenot peer-reviewed) is the author/funder. It is made available under aThe copyright holder for this preprint (which was. http://dx.doi.org/10.1101/025734doi: bioRxiv preprint first posted online Sep. 1, 2015;
.CC-BY-NC-ND 4.0 International licensenot peer-reviewed) is the author/funder. It is made available under aThe copyright holder for this preprint (which was. http://dx.doi.org/10.1101/025734doi: bioRxiv preprint first posted online Sep. 1, 2015;
a, estimated with library Jade (R Core Development Team 2010, Chao et al. 2015)
45
.CC-BY-NC-ND 4.0 International licensenot peer-reviewed) is the author/funder. It is made available under aThe copyright holder for this preprint (which was. http://dx.doi.org/10.1101/025734doi: bioRxiv preprint first posted online Sep. 1, 2015;