I STATION BULLETIN 383 SAMPLING PRESERVING TESTING MILK OREGON . STATE SYSTEM OF HIGHER EDUCATION AGRICULTURAL EXPERIMENT. STATION OREGON . STATE. COLLEGE CORVALLIS DECEMBER 1940 G. H. Wilster R. P. Robichaux
Transcript
I STATION BULLETIN 383
SAMPLING PRESERVING TESTING MILK
OREGON . STATE SYSTEM OF HIGHER EDUCATIONAGRICULTURAL EXPERIMENT. STATION
OREGON . STATE. COLLEGECORVALLIS
DECEMBER 1940
G. H. WilsterR. P. Robichaux
PREFACE
BECAUSEof the development of prob-
lems concerning methods of sampling,preserving, and testing milk the OregonMilk Control Board, in pursuance of theAct that created the board, requested theOregon Agricultural Experiment Station toinvestigate the subject.
The study was undertaken in April 1939by the Experiment Station with funds pro-vided by the Milk Control Board.
This bulletin gives a complete report ofthe significant findings obtained during theinvestigation.
On the basis of the data obtained andobservations made, a complete set of direc-tions for sampling, preserving, and testingmilk has been prepared and is presented inthis bulletin. The Experiment Station be-lieves that if these directions are accuratelyfollOwed, milk can be marketed without dis-crimination against the buyer or the seller.
Director
TABLE OF CONTENTSPage
Summary and Conclusions 4
Purpose and Plan of Study 7
Preliminary Investigation and Preparation 8
Methods and Procedures Used for the Part of the Investigation thatInvolved Daily and Composite Testing 9
Survey of Sampling and Testing Procedures in Portland Milk Plants 12
Accuracy of Milk-Test Bottles 13
Results from the Investigation 14
Daily Versus Composite Testing of Milk 14
Comparison of the Results Obtained when Milk Samples WereTested Daily and when 5-Day, 7-Day, and 15-Day CompositeSamples Were Tested 14
Frequency Distribution of the Differences Between the Average
Daily and the 7-Day and the 15-Day Composite Samples 16
Determination of the Fat Content of the Milk Used in the In-vestigation by the Mojonnier Method 17
Miscellaneous Studies, Including Sampling Milk at Milk Plants, Stor-
ing Composite Samples, Testing Procedures, etc. 19
Sampling and Storing Composite Samples 19
Variations in Testing Procedure 29
Directions for Sampling, Preserving, and Testing Milk for Fat by the
Babcock Method 35
Sampling, Preserving, and Storing Samples 36
Glassware 37
Centrifuge 38
Miscellaneous Equipment and Reagents 38
Preparing the Milk Samples for Testing 39
Directions for Testing Milk by the Babcock Method 40
Causes of Variation in Milk Tests 42
Important Points in Testing Milk 43
Acknowledgments 44
SUMMARY AND CONCLUSIONS
A. DAILY VERSUS COMPOSITE TESTING OF MILK
During the period May 1939 to April 1940, 2,064 tests forfat in milk were made by the Babcock method in accordancewith a standardized procedure and 1,032 tests for fat weremade by the Mojonnier method.
When composite samples of milk were tested by theBabcock method the results showed small decreases in the fatpercentages as compared with the average fat percentagesobtained from the testing of the milk daily.
A statistical analysis of the results failed to show thatthe decreases obtained with the composite method of testinghad much significance. The trend observed, however, was inone direction: the fat tests with the composite method weregenerally lower than with the daily method.
Testing all the samples by the Mojonnier method alsogave small decreases for the composite method of testing.
B. MISCELLANEOUS STUDIES, INCLUDING SAMPLING MILKAT MILK PLANTS, STORING COMPOSITE SAMPLES, TESTINGPROCEDURES, ETC.
This involved making more than 2,000 individual tests onmilk.
When milk was received at milk plants, the agitationto which the milk was subjected when it was dumped into theweighing vats from the cans, not previously stirred, was notsufficient to obtain a representative sample.
A mixing and sampling device constructed at the Ex-periment Station proved to be an aid in obtaining a representa-tive sample of milk deliveries at milk plants.
With composite samples of milk the failure to mix dailythe contents of the bottles or allowing the bottles to remainat room temperature long enough each day to increase thetemperature of the milk before the samples were returned tothe refrigerator caused a greater decrease in the average testthan was the case when the composites were mixed daily andreturned to the refrigerator promptly after the daily additionsof milk. The refrigerator temperature was kept at from 35'to4O°F.
When composite samples were kept at room temper-ature (approximately 70° F.) greater decreases from the aver-age daily test were obtained than when the samples werestored in a refrigerator.
Formalin did not prove superior to mercuric chloridefor preserving composite samples of milk when sterilized bot-tles were used, regardless of the time and temperature at whichthe samples were held.
The addition of saponin to composite samples of milkdid not prove of any benefit in arresting decreases, in the fatpercentages of composite samples.
No significant difference was obtained in the fat testsfrom preserved milk that had been stored in rubber-stopperedsample bottles for periods of 7 and 14 days at 400 F. and frompreserved milk of the same lot measured into 8-per-cent testbottles, tightly stoppered, and then stored for 7 and 14 daysat 40° F.
Varying the temperature of the milk at the time ofwithdrawing the 17.6 cc. charge of milk used for the Babcocktest by only a small amount, such as 12° F. from 68° F., didnot cause any measurable change in the final results. Measuringat 1000 F. instead of at 68° F. decreased the average fat reading0.05. Measuring the milk at a temperature of 120° F. as com-pared with measuring at 55° F. caused a difference in the testof 0.08. The lower test was obtained from the milk measuredat 120° F. The generally recognized variation permitted is from60° to 70° F.
Legally standard Babcock 8-per-cent milk-test bottleswere found to vary as much as 0.015 cc. above and 0.018 cc.below the correct capacity of 1.600 cc. of the graduated por-tion of the neck. Variations of the graduated portion of theneck from 1.585 cc. to 1.615 cc. were found to cause measur-able differences in the fat reading.
Standardization of the strength, temperature, andamount of acid used for the Babcock test was found to benecessary, if dependable, uniform, and accurate results wereto be obtained.
A speed of 200 revolutions per minute below the speci-fied speed of a 20-inch diameter centrifuge gave fat tests thataveraged 0.112 per cent less than those obtained at the correctspeed. A speed of 200 revolutions per minute above thespecified speed for a 20-inch diameter centrifuge gave anaverage increase of only 0.009 in the readings.
- 12. Measuring the fat columns immediately when bottles- were removed from the centrifuge, the interior of which was- maintained at from 175° to 180° F., resulted in tests that
were 0.046 per cent higher, on an average, than tests afterthe bottles and contents had been maintained in the water bathat a temperature of 138° F. for not less than 5 minutes.
When tests were being measured, a higher temperaturethan normal gave a higher fat percentage, and a lower tern-perature gave a lower fat percentage.
The length of time the test bottles and contents re-mained in the water bath at 138° F. after the first 5 minuteshad no effect on the fat readings.
The use of a reading lamp, equipped with a magnifying
columns from 1,044 samples of milk tested in duplicate andmeasured by the same operator gave 646 tests that showed novariation between the duplicates, 380 that showed a variationof 0.05, and 18 that showed a variation of 0.10. No variationgreater than 0.10 occurred.
The duplicate tests from 834 of the 1,044 samples weremeasured by a second person. The individual readings ob-tained by the two persons agreed exactly or within 0.05 percent in the majority of the readings. A variation of 0.1 percent occurred with 27 of the tests; the second reader obtaineda reading 0.1 per cent higher than the first reader 17 timesand a reading 0.1 per cent lower 10 times.
C. DIRECTIONS FOR SAMPLING, PRESERVING, AND TESTINGMILK FOR FAT.
On the basis of the results obtained and observations madein this study, directions for the sampling, preserving, and test- -
ing of milk have been prepared. If these directions are ac-curately followed, errors in testing will be reduced to a mini-mum.
In the determination of the fat content of milk receivedat milk plants it is impossible to reach absolute perfection. -
Small variations due to slight inaccuracies in the glasswareused and normal small errors by the operator are bound tooccur. The determination should be made with such accuracyand integrity that duplicate determinations will not vary bymore than 0.1 in the fat percentage.
If the fat tests are carefully and honestly made, smallvariations, over a period of time, will give an average thatclosely approaches the true value. Under these circumstances -
neither the seller nor the buyer of the milk will be favored.
glass, and needle-pointed calipers when measuring the fat I
ISampling, Preserving, and TestingMilk
By
G. H. WILSTER, Professor of Dairy Manufacturing, andR. P. ROBICHAUX, Research Assistant in Dairy Manufacturing*
Purpose and Plan of Study
()F the approximately 100 billion pounds of milk produced in the UnitedStates in 1937, 31 billion pounds were skimmed for sale as butterfat and
39 billion pounds were sold as milk to market milk plants and different manu-facturing plants. Of the 1 billion pounds of milk produced in Oregon during1937, 522 million pounds were skimmed for sale as butterfat and 501 millionpounds were sold to different dairy plants.
The Babcock test is universally used in the United States for determiningthe amount of fat in milk and cream. It is recognized as one of two officialmethods by the Association of Official Agricultural Chemists.t The methodsof this association are commonly recognized as official by law-enforcing agenciesin the different states.
The Oregon law requires that "Every milk products plant shall at all timesemploy a licensed tester, who shall sample and test all milk or cream purchasedor received by such plant and who shall be responsible for the operation of theBabcock test of such milk products plant. Every milk products plant shall takeaccurate samples of any milk or cream received. It shall be unlawful for anymilk products plant or any agent or employee or tester thereof to underweigh,undertest, or overtest, or incorrectly weigh, measure or test any, milk or creamreceived or purchased, or to fraudulently manipulate any weight, test, or measureof any milk or cream, or to make any false entry thereof as to weight or testor measure thereof upon any statement, record, invoice or milk or cream testsheet."
The present Oregon law governing the purchase of milk and cream further-more provides that composite samples of milk must not be made up over aperiod longer than 15 days or twice a month, and that the glassware and otherequipment used in testing and also the procedure of testing be in accordancewith certain specific standards.
The State Department of Agriculture is vested with authority to enforcethe law that governs the purchase of milk and cream in accordance with theBabcock test.
In 1938 the Central Testing Laboratory at Portland was established. Thislaboratory has been testing most of the market milk sold in Portland. It isoperated on a cost basis by the State Department of Agriculture.
The Oregon Milk Control Board needed further scientific data regardingsampling and testing milk. It made available to the Oregon Agricultural Ex-periment Station necessary funds for conducting an investigation on thissubj ect.
Resigned.t Official and Tentative Methods of Analysis of the Association of Official Agricultural
Chemists, 4th ed. 1935. Published by the Association of Official Agricultural Chemists,Washington, D. C.
Section 41.718 Oregon Code 1935 Supplement.
8 AGRICULTURAL EXPERIMENT STATION BULLETIN 383
Because of the difference in results obtained by using various methodsand procedures in sampling and testing and because of the variations obtainedby different operators of the Babcock test, the immediate problem was to findout whether the conflicting results were due to faulty equipment and proceduresor to inaccuracies in the method.
The investigation as outlined by the Oregon Agricultural ExperimentStation involved, (1) a study of the variations between different methods ofsampling, preserving, and testing milk for fat during various seasons in accord-ance with a standardized procedure, and (2) a study to determine the errorin the results obtained in the Babcock test when unstandardized practices wereused. The purpose of this was to try to solve the problem whereby the sampling,preserving, and testing of milk for fat could be more uniformly accomplishedby different operators in dairy plants.
PRELIMINARY INVESTIGATION ANDPREPARATION
Before proceeding with the investigation proper, it was deemed necessaryto obtain the best type of equipment for sampling and testing, and also neces-sary to adapt methods and procedures in accordance with the official specifica-
-
Figure 1. Babcock testing equipment used in the investigation.Sulphuric acid container and burette.Reading lamp for measuring fat columns.Combined water-tempering bath for milk samples (68 F.) and final tests (l3S F.).Automatic control (at right bottom of tank) (for 6U F.).Automatic control (for 13U F.).Electric heating element (for l3U F.) (at left bottom of tank).Magnetic water valve (for 6U F.).Centrifuge, electrically operated, equipped with an electric heater.Speed indicator. . .'.Indicating thermometer.Interval timer. - .
Hot water container.
SAMPLING, PRESERVING, TESTING MILI 9
lions in order to develop a high degree of accuracy in the investigational work.This preliminary work extended over a period of approximately 1 month.Because certain pieces of equipment and apparatus could not be purchased, itwas necessary to design and construct them at Oregon State College. Thiswas done in order that a considerable number of samples could be tested ac-curately and efficiently
METHODS AND PROCEDURES USED FOR THEPART OF THE INVESTIGATION THAT
INVOLVED DAILY ANDCOMPOSITE TESTING
In order to study the seasonal variations, if any, it was decided to dividethe observations into a number of periods, or units. A unit meant the collectionof six samples of milk daily for daily and composite testing; five samples wereobtained at a commercial market-milk plant in the city of Corvallis and onesample was obtained in the Experiment Station dairy products laboratory. Thesewere collected over a period of 15 days for each unit.
When sampling the milk, about 1 pint representing the well-mixed milkdelivered by each producer was mixed thoroughly by pouring from one con-tainer to another until six pourings had been completed. A i-ounce portion ofthis sample was then poured into each of three rubber-stoppered sample bottles,to which one No. 1 mercuric chloride (corrosive sublimate) tablet had beenadded. The average weight of a tablet was 0.4 gram. The tablets were reportedby the manufacturer to contain 68 per cent mercuric chloride. Two of thebottles were of the 8-ounce size for 5- and 7-day composites and one bottle
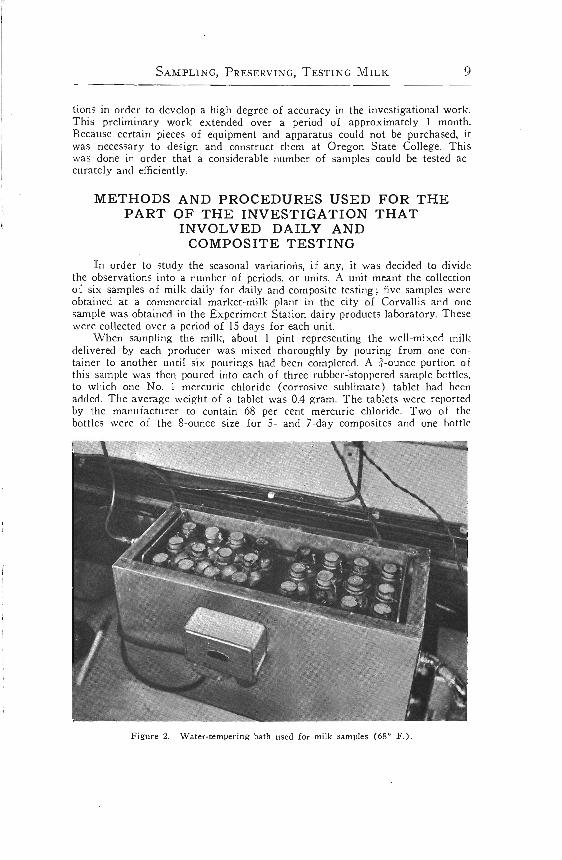
Figure 2. Water-tempering bath used for milk samples (65 F.).
10 AGRICULTURAL EXPERIMENT STATION BULLETIN 383
was of the 16-ounce size for the 15-day composite. Another sample (about4 ounces) was placed in a rubber-stoppered bottle for the daily test.
A total of 10 units extending over a period of 10 months was completed.This covered the four seasons of the year from spring 1939 to spring 1940.In the first two units, 5-, 7-, and 15-day composite samples were used. In theremaining eight units, only the 7- and 15-day composite methods of testingwere compared with the daily method.
I
Figure 3. Water-tempering bath used for test bottles (138° F.).
The composite samples were stored in the refrigerators in the two dif-ferent establishments at a temperature of from 35° to 400 F. Thu sampleswere mixed with a rotary motion each day after the addition of the dailyportion until all the cream had been removed from the sidcs of the bottles. Thesamples were then tilted to mix completely the contents of the bottles. Thecomposite samples were returned to the refrigerator as soon as possible afterthe addition of the daily portions.
Both the fresh and composite samples were handled and tested as follows:The samples were placed in a water bath maintained automatically at a
temperature of 68° F. by means of an electric regulating device. They werekept in this water bath for approximately I hour.
The standard Babcock milk-measuring pipettes were used. They weregraduated to hold 17.6 cc. The pipettes were guaranteed by the manufacturersto he within ±0.01 cc. of the correct capacity.
Standard 8-per-cent Babcock test bottles were used. No test bottle wasused that had a variation in the total volume of the graduated portin of thebottle greater than 0,005 cc. as determined by the use of mercury deliveredby means of a specially constructed burette.
SAMPLING, PRESERVING, TESTING MILI 11
The sulphuric acid used was tested for its specific gravity at 600 F. bymeans of an acid hydrometer. The acid was always standardized and checkedby means of a hydrometer so that it had a specific gravity of 1.825 or 1.830.The acid purchased usually had a specific gravity of 1.835 to 1.840. Dilutionof the acid was usually done by adding slowly 2 liters of acid to about 40 cc.cold distilled water. The standardized acid was then cooled to the proper tem-perature in a water bath before being used.
Figure 4. Showing the advantage of using a lamp and magnifying glass for measuring fatcolumns. The test bottle is attached at the top to the lamp. The complete length of thefat column is illuminated.
12 AGRICULTURAL EXPERIMENT STATION BULLETIN 383
The acid when added to the milk was of a temperature of from 60° to70° F. The milk in the test bottles was brought to a uniform temperature beforethe acid was added by placing the rack containing the test bottles in a bathof cold water for about 5 minutes.
An electrically driven centrifuge equipped with a speedometer was used.The air in the centrifuge was maintained during the centrifuging at a tem-perature of from 135° to 140° F. by means of an electric heater.
Distilled water was added to the test bottles after the first and secondcentrifuging periods. The water was of a temperature of from 140° to 150° F.
The test bottles and contents were centrifuged at the proper speed forperiods of 5 minutes, 2 minutes, and 1 minute. A time-alarm clock was used fordetermining the centrifuging periods.
After the centrifuging, the bottles were placed in a water-tempering bathwith the part of the neck that contained the fat column submerged. The tem-perature of the water was 138° F. This was automatically maintained by meansof an electric heating unit. The bottles were kept in this bath for not lessthan 5 minutes prior to measuring the fat.
All determinations from each sample of milk were made in duplicate andthe fat columns were nearly always measured by two different persons. Theaverage of the four readings was accepted as the result for each determination.No difficulty was experienced with charred or curdy fat columns. Differencesgreater than 0.1 per cent between duplicates did not occur.
A specially constructed reading lamp equipped with a magnifying glasswas used when measuring the fat column. The fat column was measured to thenearest 0.05 per cent. (See Figure 4.)
The two test bottles used when testing each daily sample were nearly alwaysused when testing the composite sample that represented the daily additions.
Needle-pointed calipers were used for measuring the fat column. The fatwas measured from the lowest extreme point of the column to the extremetop of the meniscus on the surface.
The composite samples of milk were handled and tested identically withthe daily fresh samples except when it was impossible to obtain a good mix-ture of the cream with the underlying milk. The samples were then heatedto a temperature of 100° F., mixed thoroughly, and subsequently cooled to atemperature of 68° F. before measuring the necessary amount.
SURVEY OF SAMPLING AND TESTINGPROCEDURES IN PORTLAND
MILK PLANTS
In addition to the preliminary testing work described above, a survey wasmade of the methods of sampling, preparing composite samples, and storingsamples, and of the types of milk-weighing vats used. A total of 20 differentmarket-milk plants was visited. The survey was made jointly with a representa-tive of the Portland Central Testing Laboratory.
The methods of obtaining the daily sample portion from the milk in theweighing vat and mixing this with the milk from previous shipments in thesample bottle varied between the different plants.
In all the plants, the milk in each can was stirred by means of a suitablestirrer in accordance with the rules of the Testing Laboratory. In severalplants, the milk was stirred not only before but also after it had been dumped
SAMPLING, PRESERVING, TESTING MILK 13
into the weighing vat. In one plant, a mechanical stirrer was used for mixingthe milk in the weighing vat. After the milk had been placed in the weighingvats, a f-ounce sample was taken by means of a flat-bottomed f-ounce dipper.When the weighing vat was too small to hold all of the milk in the ship-ment, the lot of milk was divided and a f-ounce sample was taken fromeach vat. These portions were mixed together and a i-ounce portion was takenof this mixture to be added to the composite sample bottle. The standardf-ounce dipper as required by the Portland Central Testing Laboratory wasused in all plants. The method of securing an aliquot portion of the milk ineach delivery by means of a proportional sampler was not used in any of theplants visited.
The weighing vats used were not of uniform construction. Some had squarebottoms and others had rounded bottoms. Most of the vats were equipped forgravity drainage but in two plants a suction pump was used for pumping themilk out of the vat. It was observed that when pumps were used a consider-able amount of foam remained in the weighing vat. Little or no foam remainedwhen the vats were emptied by gravity through an outlet valve located in thebottom of the vat. Most of the vats were suspended on regular hanging deviceswith a dial scale arrangement but others were placed on platform beam scalesof different types.
The ideal method of adding the daily portion to the sample bottle is torotate each bottle gently after the addition of each portion until all of thecream has been removed from the side of the bottle, and then tipping thebottle to reincorporate any moisture that had accumulated through condensationon the side of the bottle and stopper and then return the sample to the coolerbefore it has been heated to any considerable extent. In some plants the bottleswere hardly handled at all in order to mix the samples. Some bottles weremerely shaken a little without tipping to remove the material from the sideof the bottle and the stopper. Some, however, were shaken vigorously after theaddition of the daily portion. Upon examination of samples kept at the differentplants, it was found that a number of them showed a churned condition. Somehad fat and cream adhering to the inside upper surface of the bottle, while milkwas spilled on the outside of some bottles. Most of the samples, however, werefound to be in a good condition.
In most cases all of the composite samples were removed from the plantrefrigerator early during the morning, in some instances a considerable timebefore the milk was received. The sample bottles were left out of the refriger-ator at room temperature on the receiving platform until the last sample hadbeen taken. Occasionally, this required a total period of 5 hours or more.
ACCURACY OF MILK-TEST BOTTLES
Another preliminary investigation was a determination of the accuracyof the graduated portion of the standard milk-test bottle. The Oregon lawrequires this to be graduated from 0 to 8 per cent, with the smallest divisionsrepresenting 0.1 per cent fat.
For this work, the Experiment Station designed and had constructed aburette. This burette was checked for accuracy by the U. S. Bureau of Stand-ards, Washington, D. C. Redistilled mercury was used in calibration.
14 AGRICULTURAL EXPERIMENT STATION BULLETIN 383
The following results were obtained:Number of bottles checked 356Number of bottles found to hold 1.600 cc. mercury at20° C. ± 0.005 cc. tolerance (equivalent of 0.025 percent fat) 264Number of bottles with 0.005 cc. tolerance found tohold 1.600 cc. or more (43.9 per cent of 264) 116Number of bottles with 0.005 cc. tolerance found tohold 1.599 cc. and under (56.1 per cent of 264) 148Number of bottles found to hold more than 1.605 cc. 37Number of bottles found to hold under 1.595 cc. 55Number of bottles found to be within the state toler-ance of ± 0.02 cc. (equivalent of 0.1 per cent fat) 356
Resuks from the InvestigationDAILY VERSUS COMPOSITE TESTING OF MILK
COMPARISON OF THE RESULTS OBTAINED WHEN MILKSAMPLES WERE TESTED DAILY AND WHEN
5-DAY, 7-DAY, AND 15-DAY COMPOSITESAMPLES WERE TESTED
A total of 2,064 individual determinations was made, using the Babcockmethod of testing. All the samples of milk were tested in accordance with astandardized procedure decided upon and already described, after the preliminarymonth of observations and testing. The methods used were in harmony withthose of the Association of Official Agricultural Chemists* and also with themethods and procedures outlined in the Oregon state law except as indicated.fAll samples were tested in duplicate and the fat column in each bottle wasgenerally measured by two different men. The average of the four readingswas taken as the final test. All measurements were made to the nearest 0.05per cent fat.
Space does not permit the inclusion of a complete tabulation of all theindividual tests obtained. The complete record of this is on file at the OregonAgricultural Experiment Station. In Table 1 are given in summarized formthe average fat percentages obtained in the investigational work. Since themeasurements were made to the nearest 0.05 per cent, three decimals are
° See reference on page 7.Oregon Code 1930, Oregon Code 1935 supplement, and Chapter 116, Oregon
Laws 1939.ection 41-711 Oregon Code 1930 specifies that the pipette used should deliver 17.6 cc.
water at 20° C. This is apparently a misprint. The common pipette used is graduated tohold 17.6 cc. This latter type of pipette was therefore used.
The speeds given by the Association of Official Agricultural Chemists are slightly atvariance with those given in Section 41-713, Oregon Code, 1930. The latter appears to bein error for the 24.inch.diameter centrifuge wheel and does not give the speed for the22.inch wheel. The speed of the centrifuge used was that specified by the Association ofOfficial Agricultural Chemists. In a letter to the senior author under date of November 25,1940, Mr. A. W. Metzger, Chief of the Division of Foods and Dairies, State Departmentof Agriculture, writes as follows regarding this matter: The difference between theOregon law and the method as recommended by the Association of Official AgriculturalChemists has no doubt crept into the Oregon law through typographical errors. It is theintention of the Department of Agriculture to bring this matter to the attention of tIje Corn.mittee on Foods and Dairies at the 1941 legislative session and ask that the law be made toconform to the methods as prescribed by the Association of Official Agricultural Chemists."
used in giving the average results. Although this third decimal is not verysignificant, it does assist in showing the trend and was therefore used for thispurpose.
It is evident from the data presented that regardless of whether the 5-,7-, or 15-day composite method of sampling and testing was used the difference
Tsble 1. AVERAGE DAILY AND COMPOSITE TESTS. STANDARDIZED PROCEDURE. 2,064 INDI-VIDUAL DETERMINATIONS BARCOde METHOD
Number ofdaily samples
Babcock averagedaily test
Babcock averagecomposite test
Decrease in percentagedue to composite
testing
between the average daily tests and the composite test representing the samemilk was quite consistent. Slightly lower results were obtained with the com-posite method of testing than with the daily method. The decrease in the aver-age percentage of fat as compared to the average daily tests amounted to 0.016for the 5-day composites, 0.02 1 for the 7-day composites, and 0.027 for the15-day composites.
The data obtained were subjected to statistical analysis. The statisticaltreatment failed to demonstrate a significant difference between the differentmeans.
In Table 2 are shown the average daily and the average composite testsin the 10 different units. These tests were summarized in Table 1.
Table 2. A COMPARISON OF THE AVERAGE DAILY TESTS tN THE 10 UNITs WITH THEAVERAGE 7-DAY AND 15-DAY COMPOSITE TESTS. 900 SAMPLES MARKET MILK USED.
Babcock method
The average 7-day composite test was lower than the average daily testin nine units, and it was higher in one unit. When it was higher, the differenceamounted to 0.013, and when it was lower the difference amounted to from 0.003to 0.035.
The average 15-day composite test was lower than the average daily testin nine units and it was higher in one unit. When it was higher the differenceamounted to 0.003 and when it was lower the difference amounted to from 0.004to 0.063.
The greatest decreases in the 15-day composite test occurred during thetwo winter months December and January (Units 8 and 9).
The data obtained in the study confirm the recently reported findings at theIllinois Agricultural Experiment Station by Tracy and Tuckey,* who foundslight decreases in the fat percentages on 7-day composites as compared withthe results from daily testing. The differences amounted to 0.061 per centfor the first period of the winter series, 0.026 per cent for the second periodof the winter series, and 0.020 per cent for the summer series. The milk from425 producers was used for the two winter series and from 50 producersfor the summer series.
At the Michigan Agricultural Experiment Station Lucast compared thedaily and bimonthly composite methods of testing over a period of 5 months.The milk used in the investigation was sold by 21 producers to the CollegeDairy Department. The daily average per cent fat for all samples was 0.11higher than the average for all composite samples, while for individual patronsthe differences in the percentage ranged from 0.03 to 0.16. In every case theaverage daily test was higher than the average of the composite tests.
FREQUENCY DISTRIBUTION OF THE DIFFERENCES BE-TWEEN THE AVERAGE DAILY AND THE 7-DAY AND
THE 15-DAY COMPOSITE SAMPLES (OregonAgricultural Experiment Station).
A frequency distribution of the differences between the average daily andthe 7-day and 15-day composite samples is given in Tables 3 and 4.
Table 3. FREQUENCY DISTRIRUTION OF THE DIFFESENCES BETWEEN THE AVERAGE DAILYAND THE 7.]iy COMPOSITE TESTS.60 comparisonsBabcock method
(Tnits 1 to 10 inclusive)
Average composite testlower than daily test Frequency
Per cent fat Number of times0.17 1
.13 1
.10 2
.08 2
.07 1
.06 2
.05 1
.04 5
.03 11
.02 10
.01 4
.00 4
.01 4
.02 6
.03 2
.04 2
.06 1
.10 1
Total 60
Average (mean) difference, in per cent, 0.021.Per cent times composites lower than average daily 66.7Per cent times composites higher than average daily 26.7Per cent times composites the same as average daily 6.6
Tracy, P. H., and Tuckey, S. L. Accuracy of Methods of Sampling Milk Deliveriesat Milk Plants. Univ. of Ill. Agri. Exp. Sta. Bulletin 459, 1939.
t Lucas, P. S. Factors Involved in Accuracy of Testing Milk Samples. MichiganAgri. Exp. Sta. Tech. Bul. 158, 1938.
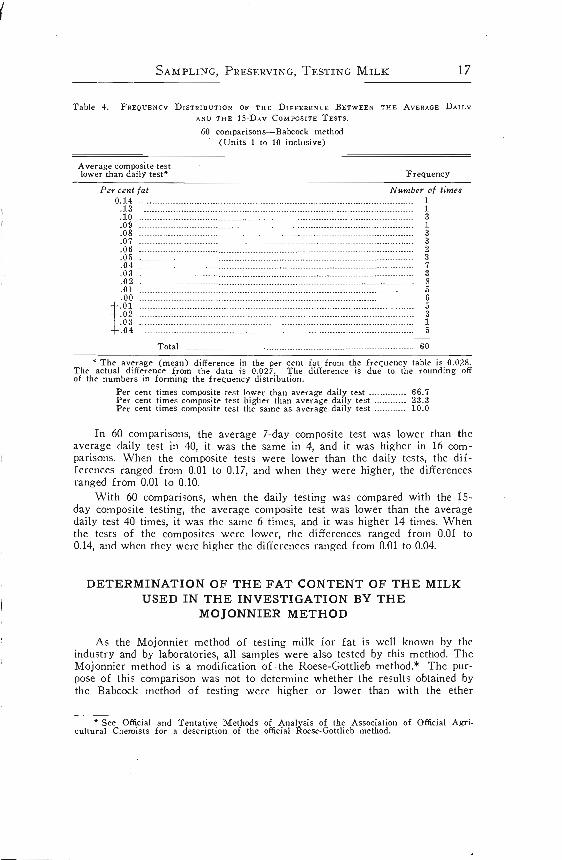
Table 4. FREQUENCY DISTRIBUTION OF THE DIFFERENCE BETwEEN THE AVERAGE DAILYAND THE 15-DAY COMPOSITE TESTs.
60 comparisonsBabcock method(Units 1 to 10 inclusive)
Total 60
The average (mean) difference in the per cent fat from the frequency table is 0.028.Tile actual difference from tile data is 0.027. Tile difference is due to the rounding offof the numbers in forming the frequency distribution.
Per cent times composite test lower than average daily test 66.7Per cent times composite test higher than average daily test 233Per cent times composite test the same as average daily test 10.0
In 60 comparisons, the average 7-day composite test was lower than theaverage daily test in 40, it was the same in 4, and it was higher in 16 com-parisons. When the composite tests were lower than the daily tests, the dif-ferences ranged from 0.01 to 0.17, and when they were higher, the differencesranged from 0.01 to 0.10.
With 60 comparisons, when the daily testing was compared with the 15-day composite testing, the average composite test was lower than the averagedaily test 40 times, it was the same 6 times, and it was higher 14 times. Whenthe tests of the composites were lower, the differences ranged from 0.01 to014, and when they were higher the differences ranged from 0.01 to 0.04.
DETERMINATION OF THE FAT CONTENT OF THE MILKUSED IN THE INVESTIGATION BY THE
MOJONNIER METHOD
As the Mojonnier method of testing milk for fat is well known by theindustry and by laboratories, all samples were also tested by this method. TheMojonnier method is a modification of the Roese-Gottlieb method.* The pur-pose of this comparison was not to determine whether the results obtained bythe Babcock method of testing were higher or lower than with the ether
See Official and Tentative Methods of Analysis of the Association of Official Agri.cultural Chemists for a description of the official Roese.Gottlieb method.
Average composite testlower than daily test Frequency
extraction method, but to determine by means of an entirely different methodwhether the differences, if any, as obtained by the Babcock method betweenthe testing of individual daily samples and composite samples of milk weresimilar in both methods of testing. All the daily samples and all the compositesamples tested by the Babcock method were, accordingly, also tested by theMojonnier ether extraction method. Only single determinations were made oneach sample. The milk charge for each determination was weighed on ananalytical balance.
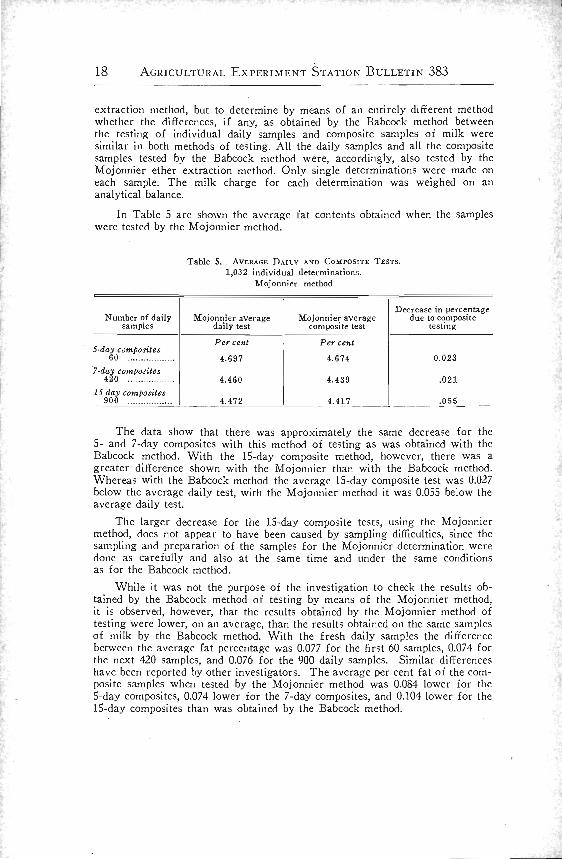
In Table 5 are shown the average fat contents obtained when the sampleswere tested by the Mojonnier method.
Table 5. AVERAGE DAILY AND CoMposiTE Tssis.1,032 individual determinations.
Mojonnier method
Number of dailysamples
Mojonnier averagedaily test
Mojonnier averagecomposite test
Decrease in percentagedue to composite
testing
The data show that there was approximately the same decrease for the5- and 7-day composites with this method of testing as was obtained with theBabcock method. With the 15-day composite method, however, there was agreater difference shown with the Mojonnier than with the Babcock method.Whereas with the Babcock method the average 15-day composite test was 0.027below the average daily test, with the Mojonnier method it was 0.055 below theaverage daily test.
The larger decrease for the 15-day composite tests, using the Mojonniermethod, does not appear to have been caused by sampling difficulties, since thesampling and preparation of the samples for the Mojonnier determination weredone as carefully and also at the same time and under the same conditionsas for the Babcock method.
While it was not the purpose of the investigation to check the results ob-tained by the Babcock method of testing by means of the Mojonnier method,it is observed, however, that the results obtained by the Mojonnier method oftesting were lower, on an average, than the results obtained on the same samplesof milk by the Babcock method. With the fresh daily samples the differencebetween the average fat percentage was 0.077 for the first 60 samples, 0.074 forthe next 420 samples, and 0.076 for the 900 daily samples. Similar differenceshave been reported by other investigators. The average per cent fat of the com-posite samples when tested by the Mojonnier method was 0.084 lower for the5-day composites, 0.074 lower for the 7-day composites, and 0.104 lower for the15-day composites than was obtained by the Babcock method.
5.day composites60 4.697 4.674 0.022
7-day composites420 4.460 4.42 9 .021
15-day composites900 4.472 4.417 .055
Per cent Per Cent
SAMPLING, PRESERVING, TESTING MILK 19
MISCELLANEOUS STUDIES, INCLUDING SAMPLINGMILK AT MILK PLANTS, STORING COM-
POSITE SAMPLES, TESTINGPROCEDURES, ETC.
The purpose of this phase of the investigation was to determine to whatextent different methods and procedures in sampling milk, storing the com-posite samples, and testing the milk for fat affected the results obtained. It hadbeen suggested to the Experiment Station by the members of the industryand also by members of the State Department of Agriculture that these methodsand procedures be thoroughly investigated. The results from this work shouldbe valuable as a guide to the formulation of rules for sampling, storing com-posite samples, and testing milk in different milk plants with the view ofunifying the methods and practices and thus avoiding discrepancies.
1. SAMPLING AND STORING COMPOSITE SAMPLES
(A). Milk-receiving vats. The rules made by the Central TestingLaboratory at Portland for weighing and sampling of milk call for the stirringof each can of milk thoroughly by means of a rolled- or smooth-edge per-forated stirring rod before the milk is poured into the weighing vat. Theyrequire also that the milk be poured into the weighing vat within 2 or 3 minutesafter it has been stirred. Immediately after the milk from each lot has beenplaced in the weighing vat, a it-ounce sample of the milk should be transferredto the sample bottle. The dipper used must first be filled with milk and emptiedin each lot of milk to be sampled before the sample is obtained and trans-ferred to the sample bottle.
In order to investigate whether or not it is necessary to stir the milkin the vat after the milk has been poured into the weighing vat, samples weretaken in seven Portland milk plants that used the several different types ofweighing vats. From 6 to 12 lots of milk received at each plant were sampledand tested. The milk was not stirred in the can prior to dumping. None of thevats was equipped with a mechanical stirrer. The milk was sampled by meansof a dipper from the part of the vat from which the sample was usually with-drawn immediately after the milk had been placed in the vat without stirringin the vat. The milk in the vat was then thoroughly stirred by means of astirring rod and another sample was taken by means of a dipper. All determina-tions in the laboratory were made in duplicate and the fat column in each bottlewas measured by two different persons, The results obtained arc shown inTable 6.
It will be noted that in six of the plants the average test after stirringthe milk in the vat resulted in a lower test and in one it resulted in a highertest. In the six plants where there was a decrease, as a result of stirring, thedecreases in per cent fat ranged from 0.008 to 0.075. In the plant where therewas an increase this amounted to 0.070.
The data showed that when milk was delivered to milk plants and notpreviously stirred when it was sampled from the milk-weighing vats, differencesin the test of the milk occurred. Some form of stirring device is apparentlynecessary for stirring the milk in the vat before a sample is obtained.
20 AGRICULTURAL EXPERIMENT STATION BULLETIN 383
Table 6. A COMPARISON OF TESTS OF MILK OBTAINED FROM WEIGHING VATS IN PORTLANDMILK PLANTS BEFORE AND AFTER STIRRING THE MILK IN THE VATS.
Frequency distribution
Mszzienum differences in tests of stirred and unstirred nIilk
The results obtained at plant G did not compare with those obtained atthe other six plants. The weighing vat used in this plant was rectangular inshape and had the dimensions 52 inches long, 32 inches wide, and 20 inchesleep. The milk entered the center of the vat, whereas the sample was takenfrom one end of the vat. This may account for the higher average test thatwas obtained after the milk had been stirred. At any rate, the results obtainedwith this vat show the necessity for a thorough stirring of the milk beforesampling it.
In a plant in Illinois where the milk-weighing vat was of such a con-struction that little mixing took place when the milk was poured into it Tracey
Milk plantNumberlots milk
Times testhigherbeforestirring
Times testlower
beforestirring
Times testno dIffer-
ent beforeand afterstirring
A 10 6 1 3B 6 I 3C 6 2
....3 1
D 6 2 2 2E 12 6 4 2F 12 5 4 3G 10 2 7 1
Total 62 26 21 15
Milk plant Number lots milkMaximum difference intest of individual lots
Capacity in vat in vatNumber of of weigh- (average (average
Milk plant lots tested log vat test) test)
Gallons Per cent Per cent
Test afterstirring
lower thantest before
Stirring
0.0 75.042.033.009.025.008
+070
and Tuckey* found that with 72 lots of milk the average test of the milktaken from the front of the vat before the milk was stirred was 4.40 per centand from the rear of the vat it was 4.60 per cent, a difference of 0.20 per cent.The average test of the milk after it had been stirred with a stirring rod wts4.51 per cent. Variations in the test of the milk obtained from the front andrear of the vat ranged from 0 to 1.0 per cent fat in the 72 lots of milk.
(B). Sampling devices. Two different sampling devices for obtaining asample of milk that would be representative of each shipment of milk werestudied.
(I) The sampling tray. The construction and use of the sampling trayare shown in Figure 5. The tray was constructed at the Oregon AgriculturalExperiment Station.f The tray was located on top of the milk-weighingvat. When the milk was poured into this tray, it traveled to the end of thetray, after which, because of the curved shape of the rear end of the tray, aportion of it returned to the front, effecting a mixing. The mixed milk passedout through two portholes located at the front of the tray. A perforatedpipe that extended to the outside was located directly under these ports forthe purpose of collecting a proportionate amount of the milk as it passed tothe milk-weighing vat. This milk was used for the it-ounce portion necessaryfor the composite sample.
In order to determine whether or not this method of sampling was accurate,six comparisons were made using milk that was not stirred in the cans before itwas poured into the sampling tray, and two comparisons were made when themilk was stirred in the cans before it was poured into the sampling tray. Theresults of two of these eight comparisons are shown in Table 7.
The average test for the six comparisons when the milk was not stirredbefore dumping was 5.05 per cent when the sampling tray was used as com-pared with a test of the heated milk in the pasteurizing vat of 5.08 per cent,a difference of only 0.03 in the percentage. In the two comparisons where themilk was stirred before dumping, there was no difference between the fat testobtained when the sampling tray was used and that of the test of the milk in thepasteurizing vat after it had been heated.
On the basis of the results obtained with the sampling tray, it would seemthat such a device may be of considerable advantage in milk plants for takingrepresentative samples of the milk delivered. Perhaps some modification of theconstruction of the tray may be desirable.
(2) The proportionate sampler. The following comparison was made tostudy the effect on the average fat test when a proportionate samplerl and adipper sampler were used for sampling milk from a herd of cows. Two samplesof milk were taken from the complete milking of each of 20 cows of theAgricultural Experiment Station dairy herd, which is composed of Hoisteins,Ayrshires, and Jerseys. One sample was taken by means of a i-ounce dipper,using an equal amount of the milk of each cow regardless of weight of milk.The other sample was taken with the proportionate sampler by adjusting thedial on the sampler before sampling in accordance with the weight of the
Tracey, P. H., and Tuckey, S. L. Accuracy of Methods of Sampling Milk Deliveriesat Milk Plants. Illinois Agr. Exp. Sta. But. 459, 1939.
t After sketch supplied by F. S. Board.Loaned to the Experiment Station by the Braun-Knecht-Hetmann Company of San
Francisco, California.
SAMPLING, PRESERVING, TESTING MILIC 21
I
Figure 5. Top: Construction of the sampling tray. Bottom: Using the sampling tray
22
befccre dumping
Table 7. Tire EFFICIENCY or IFIE SAMPLING TRAY IN MIXtNG MILK.
SAMPLING, PRESERVING, TESTING MILK 23
Table 8. SAMPLiNG MILK FROM A HERD OF Cows.0
(All breeds)
C No attempt was made to select tile same cows for each comparison.
Proportionate sample. Equal amountsNumber of Average of 20 samples svith )-ouncecomparison each comparison dipper samples Difference
Per cent fat Per cent fat
24 AGRICULTURAL EXPERIMENT STATION BULLETIN 383
milk produced by each cow so that a proportionate sample would be taken fromthe milk in accordance with the total pounds of milk produced.
The results obtained are shown in Table 8.The milk used in the experiment varied in weight, for each cow, from
8 to 35 pounds. The individual tests of the milk from the cows varied from2.6 to 6.6 per cent.
The data obtained show the importance of obtaining an aliquot sample whenthere is a considerable variation between the weights and the per cent of fatpresent in the milk produced by the cows. Although such variations would notbe expected in the milk received from each producer at a milk plant from dayto day, the experiment was conducted to show the inaccuracies that are likelyto occur in the event there is a considerable difference from day to day.
Table 9. THE EFFECT OF DIFFERENT METHODS or HANDLING AND STORING COMPOSITE
The samples that were not handled according to standardized procedure were heated to100 F., then cooled to 6& F. before testing. The fat column in each duplicate test wasmeasured by two men, and the average of the two measurements is given.
(C). Effect of the method of handling and storing composite sam-ples on the percentage of fat. The results obtained from using differentmethods in the handling and storing of composite samples are shown in Tables9 and 10. For this study two groups of composites, one 7-day and one 15-day,of eight samples each, were carried as follows:
A i-ounce dipper of the same sample of well-mixed milk was added to eachof the composite samples daily until tested.
Method used in handling tile samples Average test Lower than freshdaily test
Tested freshHandled according to standard i2ed pro.
cedi4re. Stored at 4O F.
Per cent fat4.30
Sample 1 4.28 0.02Sample 2 4.25 .05
Not sufficiently stirred daily to reincor.porate cream and moisture. Remainedat room temPerature 4 hours daily be-fore returning to 4O F storage
I
Sample 1 4.20 .10Sample 2 4.20 .10
Shaken vigorously up and down. Re.niained out at room temperature 4hours daily before returning to 4O F.storage
Sample 1 4.30 .00Sample 2 4.30 .00
Only slightly stirred daily. Kept at roomtemperature at all times. Bottles notsterilrzed at the beginning.
Sample 1 4.18 .12Sample 2 4.15 .15
Two samples from each set of composites were handled according tostandardized procedure; that is, they were stored in a dark place at 400 F.at all times and were only taken out each day to add the daily portion; theywere rotated gently to reincorporate the cream, and the bottles were tipped toreincorporate any moisture that had lodged on the inside of the bottles. Theywere then immediately returned to the cooler and kept at 400 F.
Two samples from each set of composites were stored at 40° F. but wereleft out at room temperature each day for 4 hours before being returned to thecooler. Also, they were rotated only slightly, not sufficiently to reincorporatethe cream and moisture.
Two samples from each set of composites were kept at room temperaturefor 4 hours each day after adding the daily portion and were shaken vigor-ously in an up-and-down motion to reincorporate the cream and moisture. Theremainder of the time they were stored at 40° F.
Two samples from each set of composites were stored at room temperaturethroughout the period. The bottles were not sterilized to begin with and werenot rotated thoroughly each day to mix the cream and milk serum.
It is evident from these results that even when composite samples aremade up over a period of 7 days it is necessary to use a low temperature(40° F.) for storing the samples and also to mix the contents of the bottles
Table 10. THE EFFECT OF DIFFERENT METHODS OF HANDLING AND STORING CosiposiTzMILK SAMPLES ON THE FINAL FAT TEST.
Tested freshHandled according to standardized pro.
ced u-re. Stored at 400 F.Sample 1Sample 2
Hot sufficiently stirred daily to reincor-porate cream and moisture. Remainedat room temperature 4 hours daily be-fore returning to 400 F. storage
Sample 1
Sample 2Shaken vigorously up and down. Re-
mnajned out at -room temperature 4hours daily before returning to 40° F.storage
Sample 1Sample 2
Only slightly stirred daily. He_pt atroom temperature at all times. Bottlesnot sterilized at the beginning
Sample 1
Sample 2
Before testing all samples were heated to 1000 F. in a water bath maintained at 110° F.and pipetted for the Babcock teat at that temperature after mixing the cream and serum bypouring from one container to another a total of six times. The samples kept at 40° F.and handled according to standardized procedure, the only ones that could have beensampled without heating due to the ease of reincorporating the cream, were also heated to100° F. in order to be assured of comparative results. The fat column in each duplicatetest was measured by two men, and the average of the two measurements is given.
Average testLower than fresh
daily test
Per cent fat4.10
4.10 0.004.10 .00
4.05 .054.03 07
4.00 .104.00 .10
4.00 .104.00 .10
SAMPLING, PRESERVING, TESTING MILK 25
26 AGRICULTURAL EXPERIMENT STATION BULLETIN 383
daily. Samples held at room temperature and not handled according to thestandard procedure as outlined had cream and dried material on the sides ofthe bottles and stoppers. This would not come off when pouring from one bottleto another at a temperature of 100° F., and it was necessary to scrape it off bymeans of a rubber policeman. It was difficult to get this material reincorpor-ated with the milk, even after the milk had been heated to 100° F. All thesamples except those handled according to the standardized procedure showedsigns of slight "oiling off" on heating. The method of mixing the samples dailyby shaking vigorously proved to be satisfactory in this experiment; this is notan approved method, however, and is not recommended. It may result in a con-siderable amount of churning.
With the 15-day composite samples, the experiment showed the desirabilityof handling these in accordance with the formerly mentioned standardized pro-cedure. By handling the samples in accordance with this procedure, it is usuallyunnecessary to heat the samples before testing in order to effect a completeremixing of the cream and the underlying milk. This can usually be accom-plished satisfactorily by rotating and tilting the bottle before the milk is heatedto a temperature of from 60° to 70° F. before measuring the milk.
The appearance of the 15-day composite milk samples at the end of the 15-day period before they were used for testing is shown in Figure 6.
The samples handled according to the standardized procedure were ina satisfactory condition.
.Figure 6. Comparison of fresh and 15-day composite samples. Top: Before stirring.
Bottom: After rotating bottles 15 seconds.1-2 Fresh milk.3.4 Composites handled in accordance with standardized procedure. Kept at 40° F.5-6 Composites held at room temperature 4 hours each day, balance of time at 40° F.
Bottles not rotated each day to reincorporate cream and milk.7-8 Composites handled as 5-6, but shaken vigorously daily when adding the daily
portion.9-10 Composites stored at room temperature during the 15-day period. Only slightly
stirred daily. A tough cream layer had formed on the surface, and moldinesswas observed on surface and on the underside of the stopper.
(D). The effect of the preservative used on the fat percentage. Inthis experiment it was the purpose to determine the effect of mercuric chlorideand of formalin as preservatives for milk samples that were stored under dif-ferent conditions of temperature and light.
One-gallon samples of milk were obtained from each of four differentdairy farms. Each sample of the well-mixed milk was tested in duplicate forfat by the Babcock method. Each of the four samples was then divided andplaced into 24 rubber-stoppered sample bottles. Each batch of 24 bottles wastreated and held as follows: Twelve samples from each batch were preservedwith two No. 1 mercuric chloride tablets, 4 were stored at 40° F. in darkness,4 were stored at 70° to 80° F. exposed to daylight, and 4 were stored at 70° F.in darkness. The other 12 samples from each batch were preserved with 0.5 cc.formalin. These were divided into groups of 4 and stored as with the mercuricchloride. The results obtained in this experiment are shown in Table 11. Theresults for the 15-day and 30-day periods only are shown.
Table 11. EFFECT OF TIME, METHOD OF HOLDING, AND TYPE OF PRESERVATIVE ON THE FINAL FATTEST OF COMPOSITE MILK SAMPLES°
Lotnumber
Preservedwith
mercuricchloride
Original held infat test darkness
Babcock at 40° F.
Per cent Per centfat fat
Preservedwith
formalinheld in
darknessat 40° F.
Per centfat
Preservedwith Preserved
mercuric with,chloride forrualin
exposed to exposed todaylight at daylight at
70° to 70° to50° F. SO' F.
Per ce-nt Per centfat fat
Preservedwith Preserved
mercuric withchloride formalinat 70° F. at 70° F.
in indarkness darkness
Per cent Per centfat fat
° When tested all samples were heated to 110° F. in a controlledtemperature water bath. Allsamples were measured at this temperature and tested according to standardized procedure, theaverage of duplicates being taken as the final fat test.
It was found that mercuric chloride was as effective as formalin forpreserving samples kept at a low holding temperature (40° F.). The time ofholding the composites at the low temperature did not seem to change theresults materially. There were no consistent results to show that one preserva-
Average 4.742 4.715 4.690 4.640 4.667 4.667 4.670Decrease in
average testas comparedwith orig-inal
I
.000 .027 :052 .102 .075 .075 .072
SAMPLING, PRESERVING, TESTING MILK 27
28 AGRICULTURAL EXPERIMENT STATION BULLETIN 383
tive was superior to the other in preventing a decline in the test at the highertemperatures, either when stored in darkness or in daylight. The results didnot show that it was advantageous to store composites in darkness insteadof in daylight.
The use of saponin and cholesterol in composite milk samples.To study whether or not the addition of saponin,* which is an emulsifyingagent, to the milk would aid in preventing a decrease in the test of compositesamples, a comparison was made that involved the testing of 180 daily samplesand 36 15-day composite samples in which mercuric chloride and saponin wereused with one set of samples and mercuric chloride alone with another set ofsamples. One No. 1 mercuric chloride tablet and 0.5 gram saponin were addedto each bottle in the one set of samples and one No. 1 mercuric chloride tabletwas added to each bottle in the other set of samples. When handled and testedby the Babcock method in accordance with the standardized procedure, it wasfound that the average test of the composite samples that contained saponinwas 0.020 lower than the average daily test, and the test of the composite sam-ples that contained no saponin was 0.02 1 lower. When tested by the Mojonniermethod the average test of the composite samples that contained saponin was0.010 higher than the average daily test and the test of the composite samplesthat contained no saponin was 0.038 lower. These results show that no materialbenefit was derived from the use of saponin for composite samples.
In another comparison when 0.5 gram cholesterol was added to each sampleat the beginning of the 15-day holding period, it was found that the samplesthat contained cholesterol were badly curdled at the end of the 15 days andcould not be tested. The samples had been held at a temperature of 400 F.
Comparison of the effect on the fat percentage of storing at400 F. Preserved milk in rubber-stoppered 8-ounce sample bottles andin tightly stoppered 8-per-cent milk test bottles for periods of 7 and 14days. Milk from the same lot was divided into 24 8-ounce sample bottles, using6 ounces of milk for each bottle. Two No. 1 mercuric chloride tablets wereadded to each bottle. The milk was tempered to 70° F. After thorough mixing,by means of a 17.6 cc. pipette, milk from each bottle was transferred to twosets of 8-per-cent milk-test bottles. The sample bottles were closed by meansof rubber stoppers and the test bottles by means of cork stoppers, tightly in-serted. One-half of the sample bottles and one-half of the test bottles were
Table 12. COMPARISON OF THE EFFECT ON THE FAT PERCENTAGE OF STORING AT 400 F.PRESERVED MILK IN RUBBER.STOPPERED 8-OUNCE SAMPLE BOTTLES AND IN CORK.
STOPPERED 8-PER-CENT MILK TEST BOTTLES FOIl PERIODS OF 7 TO 14 DAYS.
° A glucoside, which occurs in soap bark.
Average test
Kept in Change from Change fromNumber of Days Fresh sample test of Kept in test of
samples stored milk bottles fresh milk test bottles fresh milk
kept in a refrigerator maintained at a temperature of 400 F. for 7 days. Theothers were stored under the same conditions for 14 days. The samples weretested by the Babcock method at the end of each period. The results obtainedare shown in Table 12.
The difference obtained between the average of the fresh samples and theaverage of the preserved, stored samples was of no significance. The averagefat percentages of the milk stored in sample bottles for 7 and 14 days and thentested were little different from those of the milk stored in rubber-stoppered8-per-cent test bottles for the same periods. These results indicate that whererelatively large differences in daily and composite samples are obtained suchdifferences are due to difficulties and carelessness in sampling and storingsamples rather than due to a loss of fat in properly stored samples.
2. VARIATIONS IN TESTING PROCEDUREEffect of varying the temperature of the milk at the time of
pipetting on the fat test. The effect of measuring the charge of milk bythe standard 17.6 cc. pipette for the test bottle at a temperature other than at680 F. is shown in Table 13.
Table 13. EFFECT OF TESOPERATURE WHEN PIPETTING MILK ON FAT PERCENTAGE.
Average per cent of fat when milk pipetted at a temperature ofNumber oftests, each
comparison 68° F. 80° F. 68° F. 1000 F. 55° F. 120° F.
Per cent Per cent I Per cent Per cent Per cent Per cent
12 4.500 4.500 4.345 4.300 4.541 4:458
Difference .00 .05 .08
The data obtained show that the temperature at the time of pipetting thesample for the Babcock test is important. There was no measurable differencein the final fat test with a small difference of 12° (68° to 80° F.). There wasa decrease in the test of 0.05 when the milk was measured at 100° F.instead of at 68° F. With a difference of 65° (55° to 120° F'.), there was adifference in the average test of 0.08. The lowest test was obtainedwhen the higher temperatures were used. This can be explained by referringto the coefficient of expansion of milk in accordance with its temperature.In accordance with the work done by the U. S. Bureau of Standards* whenthe volume of 4-per-cent milk at 68° F. is 1.0, it is 0.9975 at 50° F., 1.0020at 80° F., 1.0040 at 90° F., 1.0065 at 100° F., 1.0085 at 110° F., and 1.0115at 120° F.
This is evidence to show the importance of using a temperature at thetime of measuring the charge of milk that is strictly in accordance with thatspecified by law.
Effect of a variation in the capacity of the graduated portionof milk test bottles on the fat percentage. The present Oregon lawt specifies
0 Bearce, H. W. Studies in the Expansion of Milk and Cream. Journal of Agricul.tural Research. Vol. III, No. 3, 1914.
t Section 41-703 and 41-711, Oregon Code, 1930.
30 AGRICULTURAL EXPERIMENT STATION BULLETIN 383
that milk test bottles shall be tested for accuracy by Oregon State College andonly those bottles can legally be used that do not vary more than 0.1 in thepercentage (0.02 cc.) at any point in the graduated portion of the bottle neck.Some plant operators believe that more accurate bottles should be used.
Of a total of 524 bottles examined, using the certified mercury-calibratingburette as previously described, it was found that 46 per cent of the bottleshad a capacity of the graduated portion of from 1.582 to 1.599 cc. inclusiveand 54 per cent contained from 1.600 to 1.615 cc. inclusive. The theoreticallycorrect capacity of the graduated portion of the 8-per-cent milk-test bottleis 1.600 cc.
In order to find out how significant a variation in the content of thegraduated portion might be in influencing the results obtained, two sets ofbottles, 12 to a set, were selected for this test. In one set were placed thebottles that were found to contain in the graduated portion from 1.585 to1.595 cc. inclusive. In the other set were placed the bottles that contained from1.605 to 1.615 cc. inclusive. By means of a 17.6 cc. pipette, well-mixed milkfrom the same sample of fresh milk was pipetted into each bottle in the twosets. The testing was done in accordance with the standardized procedure andthe fat columns were measured, using the reading lamp and a magnifying glass,by two different men reading independently of each other. The experiment wasrepeated, using a different sample of milk containing a higher percentage offat. The results obtained are shown in Table 14.
Table 14. EFFECT ON FAT TEST WHEN USING TEST BOTTLES OF VARYING CAPACITIES OF TIlEGRADUATED PoRTIoN.
(Average test)
Number Graduated poltion Graduated portion Difference inComparison of tests 1.585 to 1.595 cc. 1.605 to 1.615 cc. average test
Per cent Per cent Per cent
There was an average difference of 0.067 in the percentage in the firstcomparison, and 0.077 in the second comparison. The tests were the highestwith the bottles of the smaller neck capacity. This checks fairly well with thetheoretical computation.
In order to determine if similar results could be obtained at another labora-tory, the same test bottles were taken to the Central Testing Laboratory atPortland where the regular assistants made a similar comparison. The resultsobtained are shown in Table 15.
Table iS. EFFECT ON FAT TEST WHEN USING TEST BOTTLES OF VARYING CAPACITIES OFTIlE GRADUATED PORTION. TESTS MADE IN COMMERCIAL PRACTICE.
(Average test)
Comparison
2
Number Graduated portion Graduated portion Difference inof tests 1.585 to 1.595 cc. 1.605 to 1.615 cc. average test
Per cent Per cent Per cent
24 2.969 2.931 0.038
24 3.000 2.955 .045
1 12 3.977 3.910 0.067
2 12 4.796 4.719 .077
The measurements were made to the nearest 0.1 per cent. It will be notedthat the results obtained at the two laboratories were substantially similar.
(C). The use of sulphuric acid of unknown or incorrect strength intesting milk. Some operators of the Babcock test claim that it is possible toobtain accurate results when sulphuric acid of variable strength and temperatureis used, provided the amount of acid added to the milk is varied to allow forthe differences. This puts testing on a guess basis, and consistent and uniformresults cannot be obtained. It was found in this study that if uniform, accurateresults were to be obtained the strength and temperature of the acid should beproperly standardized.
In Figure 7 are shown tests obtained with acid that had not been stand-ardized for strength and temperature, and tests obtained when the acid had beenstandardized to the right strength and the correct temperature. The use of toostrong acid caused charring of the fat. Inaccurate results were obtained.
Figure 7. Results from using sulphuric acid of correct and incorrect strength. Left: Acidtoo strong. Rig/it: Acid correct strength, specific gravity 1.825.
A study was made of the sulphuric acid used by several dairy plants atCorvallis and in the dairy products laboratory at the College to determine thevariation, if any, in the specific gravity and acid concentration (per centHSSO) of the different lots. Six different lots of acid were examined. Dif-ferences were slight. The per cent acid by weight varied from 93.24 to 93.70.The theoretical specific gravity calculated from assaying ranged from 1.834 to1.838, while the specific gravity as determined by a hydrometer ranged from1.835 to 1.838.
(D). Effect of varying the speed of the centrifuge on the fat per-centage. The Babcock centrifuge is usually one of three different types;namely, motor driven, steam driven, or hand operated. The correct numlfer ofrevolutions per minute that a centrifuge should make is dependent on thediameter of the wheel measured from the bottom of opposite cups when theyare in an extended position. Variations from the correct speed may occur,however, either due to carelessness of the operator or to unavoidable causes,such as a sudden low steam pressure in the case of the steam turbine machine,
SAMPLING, PRESERVING, TESTING MILK 31
4I
32 AGRICULTURAL EXPERIMENT STATION BULLETIN 383
voltage drop in the case of the electric machine, and belt slippage in the caseof belt-driven machines.
It was found by Babcock* that to obtain a maximum separation of fat itwas necessary with a centrifuge wheel of a diameter of 18 inches to revolvethis at seven or eight hundred revolutions per minute. The centrifugal force towhich the contents of the test bottle were subjected was calculated to be 3065pounds per square inch. On this basis the speeds at which centrifuge wheelsof various diameters should revolve were calculated.
Results obtained from the use of three different speeds in 12 determinationsare shown in Table 16. The correct speed of the 20-inch wheel of the centrifugeused in this set of comparisons was, in accordance with the calculations, 759revolutions per minute.t For convenience, 760 revolutions were used.
Table 16. EFFECT OF VARYING THE SPEED OF A CENTRIFUGE 200 R.P.M. ABOvE AND BELOWTHE SPECIFIED SPEED ON THE FAT PERCENTAGE OF THE SAME SAMPLE OF MILN.
It would appear from these data that the speed of the centrifuge is ofextreme importance. A speed below that which is required for the diameter ofcentrifuge wheel had a very definite effect in lowering the fat percentageapproximately 0.1 per cent. A speed above that required resulted in little dif-ference from the normal.
(E). Effect of varying the temperature of the air in the centrifugeduring centrifuging on the final results. A number of Babcock centrifugesin milk plants are steam driven. Occasionally these machines become very hotduring centrifuging. If, contrary to state law, the fat columns are measured im-mediately after the bottles are removed from the centrifuge without first tem-pering the bottles and contents in a water bath maintained at the correct tem-perature, incorrect results may be expected. The effect of this on the fat per-centage was therefore investigated.
In Table 17 are shown the results that were obtained when the readingsof 24 tests from the same sample of milk were made with the fat at a tem-perature of 138° F. aqd at 180° F. An increase of 0.046 in the average
Farrington, E. H., and Woll, F. W. Testing Milk and Its Products, published byMendota Book Company, Madison, Wisconsin. 26th ed., 1924.
t See Methods of the Association of Official Agricultural Chemists.
Comparisonnumber
Specified R.P.Mstandard
(760)
200 R.P.M. 200 R.P.M.decrease from increase from
standard standard(560) (960)
Per Cent fat3.858.803.80
Per cent fat Per Cent fat3.70 3.853.70 3.803.65 3.80
test was obtained when the fat columns were measured at the higher tem-perature.
Table 17. EFFECT OP TUE TEMPERATURE OF THE FAT TN MILK TEST &TTLES ON THE TESTORTAINED.
Results of tests read before and after temperingin 138° F. water bath
Increase in testRead from tester Read from bath due to reading
Number of at 180° F. at 1380 F. at too hightests (too high) (correct) temperature
Average per Cent Average per cent
24 4554 4.508 0.046
(F). Effect of the temperature of the fat at the time of measuringthe fat column on the fat percentage. This series of comparisons involvedthe following: 24 different samples of milk were tested, and the test bottlesafter centrifuging were placed in a water bath, with the water at a tempera-ture of 150° F., for a period of 5 minutes. The fat columns were then measuredby means of a pair of needle-pointed calipers, using the illuminated readinglamp equipped with a magnifying lens as previously described. The test bottleswere returned to the water bath immediately after the fat columns weremeasured. After the 24 bottles had been returned to the bath, the temperatureof the water was reduced to 140° F. The fat columns were then again measured.This was repeated with water-bath temperatures of 130°, 120°, and 110° F.The results obtained are shown in Table 18.
Table 18. EFFECT OF THE WATER 0ATH TEMPERATURE ON THE FINAL FAT TEST.
Average per cent fat when read from a bath maintained at
Since a temperature of from 130° to 140° F. is standard, a higher readingwould be obtained with a temperature higher than this and a lower readingwould be obtained at a temperature lower than this.
(G). Effect of the length of time of holding completed tests in thewater-tempering bath before measiiring on the fat percentage. TheOregon law specifies that the fat column shall be measured at from 130° to140° F. and at no other temperature. Tempering the completed tests in a waterbath for 5 minutes may be considered the minimum time. An observation wasmade to determine the influence of holding the test bottles in the water bathfor 5 minutes and for 1 hour before reading. The results obtained are shownin Table 19.
24 3.950 3.904 3.894 3.893 3.891
Variation fromtest at 140°F. +0.046 0.000 i 0.010 0.011 0.011
140° F. 130.0 F. 120° F. 110° F
Per cent fat Per cent fat Per cent fat Per cent fat Per Cent fat
Number oftests 150° F.
34 AGRICULTURAL EXPERIMENT STATION BULLETIN 383
Table 19. EFFECT OF TIME OF TEMPERING THE FINISHED TESTS IN A WATER BATH ON THEFINAL FAT TEST
Number of testsGroup in each group
Grotip
1 (Corvallis) 56
2 (Portland) 72
Downward migration offat in necks (inches)
Samplestested
Fat column measured after tempering at138 F. for
Five minutes One hour
Average per cent fat Average Per cent fat
It will be observed that the average test was practically identical whetherthe samples had been held for 5 minutes or for 1 hour before the fat columnwas measured.
(H). Effect of adding water at a different temperature to test bot-tles after second centrifuging on the final fat percentage. When hotwater at a temperature considerably higher than that used for tempering thefinished tests in the water bath was used for adding to the test bottles beforethe last period of centrifuging, it was found that the fat column would belowered from 1 to 1 inches in the neck of the bottles during the subsequenttempering in the water bath. A series of 128 comparisons was made at Corvallisand at Portland in order to determine the effect of this on the readings. Theresults are shown in Table 20.
Table 20. EFFEcT OF THE TEMPERATURE OF THE WATER ADDED TO TEST BOTTLES AFTERTHE SECOND CENTRIFUGING PERIOD ON THE FINAL TEST. BOTTLES EEPT IN WATERBATH AT 138 F. FOR 5 MINUTES BEFORE MEASURING THE FAT.
Average fat Average fat I
test. Last test. Last Increasewater added water added due to fat145-150 F. 175-180 F. migration
The results obtained when the high-temperature water was used were onan average slightly higher than when the lower-temperature water was used.It was observed that when the high-temperature water was used, the meniscust the bottom of the fat column was more concave than when the lower-tem-
perature water was used. This would in part account for the higher readingthat was obtained with the former.
(I). Effect of the addition of glymol to the surface of the fatcolumn on the fat percentage. Because of the difficulty of locating the exacttipper point of the meniscus on the surface of the fat column in the milk-test
1 12 3.87 3.862 12 3.09 3.99
3 12 4.28 4.28
4 12 4.22 4.23
Per cent fat Per cent fat
4.864 4.883 0.0 19
4.460 4.4 70 0.010
Uitoi) (itolt)
SAMPLING, PRESERVING, TESTING MILK 35
bottle when reading, a comparison was made to determine towhat extent theelimination of the meniscus would have on the reading. This was accomplishedby the addition of glymol (a colored mineral oil) to the surface of the fatcolumn.
In 36 comparisons it was found that the addition of glymol causcd a re-duction in the average test of 0.192.
It should be pointed out here that the addition of glymol is not permittedfor milk tested under the provisions of the Oregon Babcock milk-testing law.
(J). Agreement of duplicate tests made by the Babcock method.The question often arises how closely duplicate tests made on the same sampleof milk, tested in accordance with the Babcock method, agree.
The results obtained on 1,044 duplicate tests made in the study that in-volved a comparison of daily and composite testing are shown in Table 21.The standardized procedure was used in testing. The measurements for fat weremade by the same person. It is seen that a variation of 0.1 in the percentageof the duplicates occurred with 18 of the 1,044 samples. This was the maximumvariation obtained.
Table 21. CHECKING DUPLICATE TESTS BY THE BABCOCK METHOD. SPECIAL READING
LIGHT USED.
The bottles used were accurate to withn 0.005 cc. of the total correctcapacity of 1.600 cc. of the graduated portion of the neck. The measurementswere all read to the nearest 0.05 per cent.
An examination of the data obtained when the fat column in the duplicateswas measured by a second person was also made. The readings obtained bythe two persons in the majority of instances agreed exactly or within 0.05 in thepercentage. Variations of 0.1 between the readings of the individual testsby the two persons occurred 27 times with the 834 samples in which the fatcolumns in the completed tests were measured by two persons. The secondreader obtained a higher reading 17 times and a lower reading 10 times. Nogreater difference than 0.10 in the percentage in the 4 measurements from eachsample of milk (each sample tested in duplicate and the fat measurements madeby two persons) occurred.
DIRECTIONS FOR SAMPLING, PRESERVING, ANDTESTING MILK FOR FAT BY THE
BABCOCK METHODOn the basis of the findings from the research reported in this bulletin,
there is presented below a set of directions for the sampling, preserving, andtesting of milk by the Babcock method. Accurately following these directionswill result in the seller and buyer receiving as near equity as it is believedpossible to obtain under practical commercial operation. There is nothing in
Number that varied in the percentage
Numberexact
checks 0.05 0.10More than
0.10
1,044 duplicatesamples tested 646 380 18 0
Per cent of total 61.9 38.4 1.7 0
36 AGRICULTURAL EXPERIMENT STATION BULLETIN 383
these directions that conflicts with the provisions of the present Oregon lawthat governs the sampling and testing of milk, except as indicated.
The methods and procedures used by milk plants in determining the fatcontent of the thousands of cans of milk received daily from dairy farmersmust be such that: (1) an accurate test is obtained, (2) the test is practical,and (3) the cost of each determination is not excessive.
Making composite samples over a period of 15 or 16 days and testingthese by the Babcock method at the end of that period was the system usedby Portland milk plants until the accuracy of this practice was questioned.With the establishment of the Portland Central Testing Laboratory the methodof making composite samples for each 7- to 8-day period and storing thesamples under refrigeration was adopted.
The method of making composite samples has some disadvantages. If notproperly handled the milk may sour and even curdle, churning may take placeif the milk is shaken too much, the milk may freeze, evaporation may occur,a tough cream layer may form on the surface of the milk, and mold maygrow on the surface of the milk and on the upper inside surface of the bottle.Composite samples that are in a poor physical condition cannot be correctlytested.
It was found in this investigation that when composite samples wereproperly prepared and handled it was possible to maintain the milk in a satis-factory condition for testing. The method used was outlined under the headingof "standardized procedure in preparing and handling composite samples."
It is believed that the 7-to-8-day composite method of preparing composites,and storing and testing them in accordance with the directions given below,is a practical method to use.
SAMPLING, PRESERVING, AND STORING SAMPLESSample bottle. The 8-ounce sample bottle with tightly fitting rubber
stopper should be used for the composite sample. The stopper should be chainedto the neck of the bottle. The stopper should b& replaced when it becomes hardor cracked. A permanent metal number plate for easy identification should beattached to the neck or stopper of the bottle. A sample bottle with a cylindricalbody approximately 140 millimeters high, with bottom approximately 60 milli-meters outside diameter, and opening in neck approximately 35 millimetersinside diameter, with gradual sloping neck from top of bottle to body for easycleaning, is recommended.
Stirring the milk. Unless a satisfactory mechanical stirrer is used,the milk in each can must be thoroughly stirred by means of a hand stirrerbefore it is poured into the weighing vat. The milk must be poured out intothe weighing vat within 5 minutes after it has been stirred. A stirring rod witha long handle and a perforated disk-shaped bottom should be used. The disk,if tinned steel or stainless steel, should either have a sanitary rolled edge orbe made of a material that will not scratch the tin coating on the inside of themilk cans during stirring.
Mechanical stirrer in milk-weighing vats. If it can be demon-strated that a mechanical stirrer or other mixing device will satisfactorily stirthe milk so that a uniform sample can be obtained, stirring the milk in the cansmay be omitted.
Sampling dipper. A i-ounce capacity, cylindrical, flat-bottomed, non-corrosive metal dipper should be used to measure the milk for the compositesample.
Sample bottle crates. Suitable crates should be provided for thestoring of the sample bottles containing milk.
Obtaining the sample. A f-ounce portion of each producer's milk fromeach delivery shall be transferred to the composite sample bottle. 'vVhen theshipment consists of more milk than the weighing vat will hold, the milk ship-ment should be divided into two or more equal parts. By means of a dipper,an equal amount of the well-mixed milk is taken from each of these partsfrom the milkweighing vat and placed in a clean, dry container. These portionsare then thoroughly mixed and from this a f-ounce amount is then transferredto the composite sample bottle.
After the addition of each daily portion to the sample bottle the stoppershould be placed tightly on the bottle and the bottle given a rotary motionuntil all of the cream has been thoroughly incorporated with the milk. Thebottle may also be gently tipped in order to incorporate any moisture and creamthat may have adhered to the inside top of the bottle or to the inside of thestopper. Rough handling must be avoided, otherwise churning will take place.
Preservative used. One mercuric chloride tablet of the No. 1 size,or equivalent, is sufficient for preserving a composite sample of first-qualitymilk made up over a period of 8 days. When the milk is of a poorer quality,two tablets may be necessary.
Storing the composite samples. The samples should be stored in arefrigerator at a temperature between 350 and 45° F. They must never hefrozen. They should be removed from the refrigerator only long enough forthe addition of the daily portions. In no case should the samples be allowedto remain out on the milk-receiving platform or elsewhere for more than 2hours. They should be protected from radiating heat from steam pipes orheaters and from direct sunlight. The samples should be stored in a speciallyconstructed cabinet provided with a lock. The keys to this cabinet shouldbe in the possession of the licensed sampler and tester.
Frequency of testing. All samples should be tested at the end of eachconsecutive 7- or 8-day sampling period.
Numbering bottles. The bottles should be legibly numbered. Per-manent metal numbers attached to the neck or stopper of the bottles arerecommended. Identification numbers can also be placed on the bottles bypasting gummed labels on the clean, dry bottles and writing the numbers onthe labels with India ink. After the ink has dried, a coating of clear varnishor shellac is applied over the numbers and label. Such a label will remain ingood condition for long periods and will withstand washing in soapy water.
Sampling abnormal milk. No attempt should be made to samplechurned, frozen, curdled, or otherwise abnormal milk.
GLASSWARE
All the glassware used in testing must conform to the specifications givenin the Oregon State law.* It must be clean and in good condition before it isused. (The milk-measuring pipette should be graduated to hold 17.6 cc.)t
- Even though the milk-test bottles conform to the standard required by law, slightvariations between the results may be obtained on account of small variations in the contentof the graduated portion of the neck.
f See Methods of the Association of OfficisI Agricultural Chemists,
SAMPLING, PRESERVING, TESTING MILI 37
38 AGRICULTURAL EXPERIMENT STATION BULLETIN 383
CENTRIFUGE
1. Speed. The centrifuge should rotate, when filled to capacity, at thecorrect speed. The centrifuge should not be permitted to vibrate. The followingare the speeds that must be used.* They vary slightly from those given in thepresent state law.
SPEED OF CENTRIFUGE WHEEL.
Diameter of wheel
By diameter of wheel is meant the distance between the inside bottoms ofopposite cups measured through the center of rotation of the centrifuge wheel,while the cups are horizontally extended.
Speedometer. An accurate speedometer should preferably be permanent-ly installed on the centrifuge.
Temperature of tester. The interior of the tester during centrifugingshould be maintained at a temperature of from 130° to 140° F. It is desirablethat the tester be equipped with an accurate Fahrenheit thermometer, perman-ently attached, so that the temperature within the centrifuge can be observed atall times.
MISCELLANEOUS EQUIPMENT AND REAGENTS
Acid dispenser. The burette or measuring device employed to deliversuphuric acid should be constructed to allow a 17.5 cc. portion of the acid tobe delivered to the test bottle accurately and without spilling.
Temperature of the acid. Some means should be provided wherebythe sulphuric acid can be maintained at a temperature of from 60° to 70° F.at the time it is used for testing.
Acid hydrometer. An accurate acid hydrometer should be availableso that the specific gravity of the acid used can be determined.
Sulphuric acid. The specific gravity of the sulphuric acid used shouldbe 1.825 or 1.830 at 60° F. Sulphuric acid of a specific gravity below 1.825should not be used. If the specific gravity of the acid is greater than 1.830 it
See Methods of the Association of Official Agricultural Chemists for correct speedsto use.
ni inches Revolutions per minute10 1,07412 98014 90916 84818 80020 75922 72424 693
SAMPLING, PRESERVING, TESTING MILK 39
may be standardized by mixing it with distilled water. Usually only a smallamount, about 1 or 2 cc. for each 100 cc. acid, is sufficient to lower the specificgravity to the density desired. Do not add the water to the acid, as this isdangerous. The acid should always be added to the water slowly. The tem-perature of the standardized acid should then be adjusted to 600 F. for de-termination of the specific gravity.
Water bath for tempering composite samples. A water bath fortempering composite samples before they are used in testing should be pro-vided. When a considerable number of samples are to be tested, it is convenientthat the tank be equipped with a thermometer and also with a regulating devicefor maintaining the temperature of the water at 600 to 700 F.
Water for adding to the test bottles. Distilled water or pure softwater must be used for adding to the test bottles.
Hot-water tank. A water tank should be provided for distilled or softwater used for adding to the test bottles. This tank should be constructed ofnonrust material and equipped with an indicating thermometer. For conven-ience it may also be equipped with an automatic heating device for heating thewater to and thaintaining it at the proper temperature. Oil, rust, and otherforeign material must be kept out of this water.
Water bath for test bottles. A water bath for tempering the testbottles and contents before measuring the fat column should be provided. Thisshould be equipped with an indicating thermometer, preferably permanentlyattached. When a large number of determinations are made, it is desirableto equip this tank with an automatic heating device for maintaining a tem-perature of 130' to 140' F.
Dividers or calipers. The dividers or calipers used for measuring thefat. column should be of the needle, or sharp-pointed type having a hinge jointand thumb-screw tightener.
Reading lamp. A lamp equipped with a magnifying glass is veryconvenient for making accurate fat measurements.
Time alarm clock. A time alarm clock or interval timer should beprovided so that it is possible accurately to determine the length of the threecentrifuging periods and also the length of time of keeping the test bottlesin the water bath prior to measuring the fat column.
PREPARING THE MILK SAMPLES FOR TESTING
1. Preparing composite samples. With properly handled composite sam-ples, ordinarily there should be no cream adhering to the side and stopper of thebottles after these have been gently rotated for a few seconds. The samples shouldbe kept in a water bath with the water maintained at a temperature of 60' to 70' F.for at least '1s
hour before the charge is transferred to the test bottle. If it isfound, however, that some cream adheres to the side of the bottle and stopperafter gently rotating them for a few seconds, the samples shall be handledas follows. Place the bottles in a water bath with the water at a temperatureof not over 110' F. The samples should be kept in this bath until the temper-ature of the milk reaches 100' F. With a bath equipped with automatic tem-
40 AGRICULTURAL EXPERIMENT STATION BULLETIN 383
perature control, this will probably require at least 30 minutes. The bottlesshould then be rotated until all of the cream from the sides and stoppers ofthe bottles has been removed. The samples are then placed in the water-tem-pering bath at from 60° to 70° F. and cooled to this temperature before theyare used in testing.
2. Preparing single samples. When it is desired to test single samplesof fresh milk, it is only necessary to place the samples in the water bath main-tained at 60° to 70° F. for half an hour before the sample is used in testing.
DIRECTIONS FOR TESTING MILK BY THEBABCOCK METHOD
Obtaining the charge for the test. Remove the sample from thewater-tempering bath and mix thoroughly by pouring from one container toanother until six separate pourings have been accomplished. Care should beexercised to prevent foaming. The extra container used in mixinga lippedglass beaker is satisfactoryshould be inverted over a suitable screen to drainbetween measuring the different samples.
Immediately after mixing, by means of a standard milk-measuring pipette,transfer the charge of the milk to the test bottle. This is done in the followingmanner V7ith the pipette tip below the surface of the milk the pipette is filleduntil the milk passes about 1 inch above the mark on the neck of the pipette.Then with the pipette held above the bottle and with the mark on the pipettehorizontal with the eyes, the milk is allowed to run out until the bottom of themeniscus of the milk in the pipette is even with the graduated mark on thepipette. This charge of milk without loss is allowed to drain into the test bottleby inserting all of the lower stem of the pipette inside the neck of the bottle.The last drop remaining in the tip of the pipette must be gently blown intothe test bottle.
Adding sulphuric acid to the milk. Sulphuric acid of correct strengthshould be added to the milk in the test bottle and mixed as follows: When asingle test is made, the full 17.5 cc. portion of acid is slowly added, withoutspilling, to the test bottle. The bottle is held in a tilted position during theaddition of the acid and carefully rotated so that all milk is removed from theinside neck of the bottle by the acid. Care should be exercised to prevent undueshaking of the bottle during the addition of the acid. The acid and milk arethen thoroughly mixed by rotating the bottle in a circular motion until all ofthe curd has been completely dissolved and the acid-milk mixture acquires adark chocolate-brown color. When more than one test is to be made, the acidmust be carefully added to each bottle before mixing. It is necessary that theacid and milk be of the correct temperature, from 60° to 70° F. The addition ofthe acid must be done with dispatch and skill, avoiding jostling or jarring themilk and acid before the mixing operation. The whole lot is then mixed atone time. This may be accomplished by placing the bottles in a wooden rack andshaking the rack with bottles in a rotary motion. When an automatic mixer isused the bottles can be placed in the mixer after the addition of the acid toeach bottle, provided the mixer is kept operating continuously.
Centrifuging. The bottles should be centrifuged as soon as possibleafter the reaction between the milk and the acid has been completed. Thecentrifuge should be properly balanced and the temperature of the interior
SAMPLING, PRESERVING, TESTING MILK 41
should be adjusted to 1300 to 1400 F. before the bottles are placed in it. Itshould be maintained at this temperature at all times during the centrifuging.The length of time of centrifuging should be accurately determined by theinterval timer. The centrifuging periods should be 5 minutes for the first,2 minutes for the second, and 1 minute for the third.
Addition of water to the test bottles. Distilled or other soft waterfree from oil, rust, or other foreign material at a temperature of 1400 to 1500 F.should be added to the bottles after the first centrifuging period until the fatrises to the bottom of the neck. After the second period of centrifuging, waterat the same temperature should be added until the contents of the bottle reachthe 7- or 8-per cent mark on the graduated scale.
Adjusting the temperature of the fat before measuring. Aftercentrifuging, the bottles should be placed in a water bath with the temperatureof the water maintained at 1300 to 1400 F. The top of the water should extendabove the top level of fat in the test bottles. All the bottles should remain inthis water for not less than 5 minutes until the fat column is in equilibriumand the lower fat surface has assumed final form before the measurementsare made.
Measuring the fat. The fat column should be measured in its entiretyby means of the calipers from its lower surface to the highest point of theupper meniscus. The measuring should be done immediately after removing eachbottle from the bath. Measuring the fat when test bottles are removed fromthe centrifuge will cause variable results and is contrary to the state law.
Recording results. The results should be immediately recorded onapproved record blanks.
Retesting. Retests should be made when charred material or undis-solved curd is present in the fat column, or when the fat column is milky orbrownish in color. The ideal fat column has a translucent amber or golden-yellow color.
Testing churned, frozen, or sour milk. Milk that is churned, frozen,or sour should not be used for testing.
Washing bottles used for composite samples. All the samplebottles used should be washed free of all milk and fatty material, using asoap solution or other cleaning solution and a brush. They should be thoroughlyrinsed in clean running water and should finally be sterilized by exposing themfor at least 1 minute in a solution containing not less than 100 parts per millionof available chlorine. The bottles must be dry before they are used for themilk samples. While not in use the clean sample bottles should be stored in aclean, dry place in an inverted position without the stoppers inserted.
Cleaning test bottles. The Babcock milk-test bottles should be thor-oughly cleaned after the test has been completed. The following method ofcleaning is recommended: The bottles should be emptied while the contentsare still warm. The bottles should be shaken while emptying to remove thesediment from the bottom of the bottles in order to facilitate efficient cleaning.If a special bottle-washing apparatus is not available, the following methodcan be used satisfactorily. A clamp with holes, preferably made of wood, con-structed to fit over the necks of the bottles is placed over the whole set of
42 AGRICULTURAL EXPERIMENT STATION BULLETIN 383
bottles held in a rack. Using a locking device to hold the clamp over the bottles,the whole rack of bottles is submerged upright in a solution of alkali or ina soap solution containing from 4 to 6 ounces of soap powder in 2 gallons ofwater. The temperature of the solution should be 140° F. or above. As it isnot necessary to place the hands in the water, it is possible to use this hightemperature. A container for holding the cleaning solution should be con-structed so that the necks of the bottles will be completely submerged. Fillingthe bottles about one-half full with solution, the rack with bottles is thenremoved, shaken, and emptied into the drain by inverting the whole rack atone time. This washing process is repeated for at least three times. Beforeemptying the bottles the last time, a test-bottle brush is used to remove anymaterial that may still adhere to the inside of the necks. The bottles are thenrinsed in soft, clear water, with the water at a temperature of 140° F. No soapor alkali is used in this water. All traces of cleaning solution must be removedfrom the bottles. The bottles are placed in an upright position for a few minutesuntil they have cooled. They are then placed in an inverted position on a rackfor complete drainage. The cleaned bottles should be entirely free from fator foreign matter and should have a clean, shiny appearance.
CAUSES OF VARIATION IN MILK TESTS
1. A curdy or milky fat column may be caused by one or more ofthe following:
Insufficient acid.Weak acid.Too low temperature of acid.Incomplete mixing of milk and acid.Placing bottles in centrifuge before reaction is completed.
2. A dark or charred fat column may be caused by one or more ofthe following:
Too much acid.Too strong acid.Too high temperature of acid or milk.Uneven mixing of acid and milk.Too long interval between thixing and centrifuging when the samples
are not being continuously shaken.
3. Too low results may be caused by one or more of the following:Improper sampling of milk when received.Improper mixing of milk samples.Water in sample bottle when adding the sample.Sample handled so that it is churned or "oiled off."Moldy or sour sample.Inaccurate glassware.Improper measuring of milk into test bottles.Too low temperature of acid and milk. Some of the fat is held by the
undissolved curd.Insufficient time of centrifuging.Insufficient speed of centrifuge. .
Measuring the fat column at a tempetature below 130° F.
SAMPLING, PRESERVING, TESTING MILK 43
4. Too high results may be caused by one or more of the following:Improper sampling of the milk when received.Improper measuring of the milk for the test bottle.Measuring the milk charge at temperatures below 600 F.Inaccurate glassware.Sample handled so that it is churned.Loose stoppers on composite sample bottles, causing evaporation of water
from the milk.Too high centrifuging temperature.Too hot water added to bottle in running tests.Measuring the fat column at temperatures above 1400 F.Charred particles in fat column.
5. Moldy surface on milk samples may be caused by one or moreof the following:
Using unsterilized bottles for storage of samples.Insufficient preservative added.Too high storage temperature.Improper mixing of the daily portion and failure to incorporate the
moisture and milk remaining on the side of bottle and stopper daily.This leaves part of the milk unpreserved.
6. Check testing. It is wise to make occasional check tests on the samesample of milk in order to judge one's ability to obtain consistent results. Dupli-cate analyses varying by more than 0.1 in the per cent fat should be rejectedand a retest should be made.
IMPORTANT POINTS IN TESTING MILK
The State law that governs testing milk, and methods of the Associationof Official Agricultural Chemists give certain requirements that must be ob-served when testing milk. They are:
Standard glassware.Sampling milk. Preparing, preserving, and storing composite samples.Speed of centrifuge wheel and speed indicator.Temperature of tester during centrifuging.Hot water bath.Measuring calipers.Specific gravity of sulphuric acid and size of acid measure.Temperature and condition of milk when measuring sample for testing.Method of adding acid and mixing it with the milk.Method of whirling the test bottles.Temperature of water to add to test bottles.Tempering finished tests in water bath.Measuring the fat column.
Elaborate equipment is not necessary in order to observe the above. Whena large number of determinations are to be made it will be found desirable touse certain specially constructed apparatus equipped with automatic control de-vices.
44 AGRICULTURAL EXPERIMENT STATION BULLETIN 383
ACKNOWLEDGMENTS
The liberal assistance by 0. G. Simpson and J. Spencer George of thePortland Central Testing Laboratory in connection with the studies that weremade at Portland is gratefully acknowledged.
The Experiment Station extends its thanks to F. F. Moser, Manager, Medo-Land Creamery, Corvallis, for his generous assistance in connection with theinvestigation.
The helpful suggestions made by A. W. Metzger, Chief, Division ofFoods and Dairies, and J. D. Patterson, Chief Chemist, Oregon State Depart-ment of Agriculture, and by several members of the dairy industry in con-nection with the work are also gratefully acknowledged.
The statistical analysis of the data obtained was supervised by Dr. W. J.Kirkham and his assistant, W. H. Huggins, of the Department of Mathe-matics, Oregon State College. The cooperation given is acknowledged.
The authors appreciate the suggestions made by Dr. J. R. Haag, Depart-ment of Chemistry, Oregon State College; by Professor P. M. Brandt, Head,Division of Animal Industries, Oregon State College; and by Dr. I. R. Jones,Professor of Dairy Husbandry, during the preparation of the manuscript. Thecooperation of R. E. Stout, Research Assistant, Department of Dairy Hus-bandry, was obtained during the progress of the investigation.
The authors acknowledge the assistance by C. G. Wiltshire, Superintend-ent of the College Plumbing and Steamfitting Department, in designing andconstructing some of the equipment used in the investigation.
J. Leo Fairbanks, Professor of Art, prepared the design for the cover page.
OREGON STATE BOARD OF HIGHER EDUCATIONF. E. Callister Albany IBeatrice Walton Sackett Mar.thfield
I C. A. Brand RoseburgE. C. Sammons Portland
I Robert W. Ruhi Medjordl Edgar William Smith Portland
Willard L. Marks Albany- R. C. Groesbeck Klamath FaiLt
Mac Hake PendletonFrederick M. Hunter, EdO., LED Chancellor of Higher Education
STAFF OF AGRICULTURAL EXPERIMENT STATIONStaff members marked arc United States Government investigators
stationed in OregonFrank Llewellyn Ballard B.S President of the State College
Wm. A. Schoenfeld, B.S.A., kB.A DirectorR. S. Besse M.S Assistant DirectorEsther McEinney . AccountantMargaret Hurst, B.S Secretary
Division of Agricultural EconomicsE. L. Potter, M.S Agricultural Economist; In Charge, Division of Agricultural
EconomicsAgricultural Economics
W. H. Dreesen, Ph.D Agricultural EconomistD. B. DeLoach, Ph.D Associate Economist
Farm Management0. C. Mumford, M.S Economist in ChargeG. W. Kuhiman, Ph.D Associate EconomistW. W. Gorton, M.S Assistant EconomistH. L. Thomas, M.5 Associate Agricultural Economist, Couservation Economic
Division, Soil Conservation.J. C. Moore, M.S State Representative, Division of State and Local
Planning, Bureau of Agricultural EconomicsV. tV. Baker, B.S Assistant Agricultural Economist, Division of Land Economics
Division of Animal IndustriesP. M. Brandt, A.M Dairy Husbandman; In Charge, Division of Animal Industries
Animal HusbandryR. G. Johnson, B.S Animal Husbandman0. M. Nelson, M.S Animal Husbandman
Dairy HusbandryG. H. Wilster, Ph.D Dairy HusbandmanI. R. Jones, Ph.D Dairy HusbandmanH. P. Ewalt, B.S Research Assistant (DairyHusbandryR. E. Stout, M.S Research Assistant (Dairy HusbandryV. P. Smith, B.S Research Assistant (Dairy Husbandry
Fish and Game ManagementR. E. Dimick, M.S Wildlife Conservationist in ChargeF. P. Griffiths, Ph.D Assistant ConservationistA. S. Einarsen B.S Associate Biologist. Bureau of Biological SurveyJay B Long, kS Research Assistant (Fish and Game Management)
Poultry HusbandryH. E. Cosby Poultry Husbandmani in ChargeF. L. Knowlton M.S Poultry HusbandmanW. T. Cooney, B.S Research Assistant (Poultry Husbandry)
Veterinary MedicineL N. Shaw1 0.5., D.V.M Veterinarian in ChargeE. M. Dickinson, D.V.M. M.S Associate Veterinarian0. H. Muth, D.V.M., M. Associate VeterinarianR. W. Dougherty, B.S., D.V.M Assistant VeterinarianA. S. Rosenwald, B.S., D.V.M Assistant VeterinarianRoland Scott, D.V.M Research Assistant (Veterinary Medicine)tRichard Shuman, D.V.M Junior Veterinarian, Bureau of Animal IndustriesM. P. Chapman, B.B.M Research Assistant (Veterinary Medicine)
t On leave.
STATION STAFF(Confiitued)Division of Plant Industries
R. Hyslop, B.S Agronomist; In Charge, Division of Plant industries
Farm CropsA. Schoth, M.S Agronomist; Division of Forage Crops and DiseasesD. Hill,.Ph.D Agronomist
it. E. Fore, Ph.D Associate AgronomistH. H. Rampton, M.S Assist. Agronomist (Division of Forage Crops and Diseases)L. E. Harris, M.S Assistant AgronomistH. E. Fisinelt, M.S Assistant AgronomistElton Nelson, B.S Agent, Division of Cotton and Other Fiber Crops and DiseasesLouisa A. Kanipe, B.S Junior Botanist, Division of Seed InvestigationsA. E. Gross, MS.. Research Assistant (Farm CropsL. R. Hansen, M.S Research Assistant (Farm CropsHenry R. Fortmann, B.S Research Graduate A,ssistant (Farm Crops
Food IndustriesH. Wiegand B.S.A Technologist in Charge
T. Onsdorff, M.S Associate TechnologistR. Mills, B.S Assistant Technologist\V. Harvey, M.S Research Assistant (Food Industries)
Horticult sireW. S. Brown M.S., D.Sc HorticulturistH. Hartman, M.S Horticulturist (PomologyA. I.,. B. Bouquet, M.S Horticulturist (Vegetable CropsC. E. Schuster, M.S Horticulturist (Division of Fruit and Vegetable Crops and
Diseases)\V. P. Duruz, Ph.D Horticulturist (Plant Propagation)?G. F. Waldo, M.S..........Associate Pomologist (Division of Fruit and Vegetable Crops
and Diseases)E. Hansen, M.S Assistant Horticulturist (Pomology)A. N. Roberts, B.S Research Assistant (Horticulture)
Soil ScienceW. L. Powers, Ph.D Soil Scientist in ChargeC. V. Ruzek, M.S Soil Scientist (FertilityM. R. Lewis, C.E Irrigation and Drainage Engineer, Soil Conservationit. E. Stephenson, Ph.D Soil ScientistE. F. Torgerson, B.S .Associate Soil Scientist (Soil Survey)J. M. Haley, B.S Assistant Irrigation Engineer, Cooperative Agent, Soil
Conservation ServiceA. W. Marsh, M.S Research Graduate Assistant (SoilsH. E. Clark, B.S Research Graduate Assistant (SoilsH. E. Dregne, M.S Research Graduate Assistant (Soils
Agricultural ChemistryJ. S. Jones, M.S.A Chemist in ChargeR. H. Robinson M.S Chemist (Insecticides and FungicidesJ. R. Haag, Ph.b Chemist (Animal NutritionH. E. Bullis M.S Associate ChemistM. B. Hatdi, M.S Assistant ChemistJ. C. Lewis, M.S Assistant Chemist
Agricultural EngineeringE. Price, B.S Agricultural Engineer in Charge
W. M. Hurst, M.A Agricultural Engineer, lureau of Agricultural Chemistryand Engirieering
H. R Sinnard, M.S Associate Agricultural Engineer (Farm Structures)C. I. Branton B.S Assistant Agricultural Engineer?
R. Staffor, Engineering Aid, Bureau of Agricultural Chemistry andEngineering
F. Carnes, B.S Junior Agricultural Engineer, Bureau of Agricultural Chemistry- and Engineering
L. M. Klein, B.S Mechanical Engineer, Bureau of Agricultural Chemistry andEngineering
BacteriologyG. V. Copson, M.S Bacteriologist in ChargeJ. E. Simmons, M.S Associate BacteriologistW. B. Bollen, Ph.D Associate BacteriologistF. J. Rudert, Ph.D Research Assistant (Bacteriology)
Entomology0. C. Mote, Ph.D.. Entomologist in Charge
On leave of absence.
STATION STAFF(Continued)B. G. Thompson Ph.D Associate EntomologistS. C. Jones, M. Assistant EntomologistK. W. Gray1 M.S Assistant EntomologistH. E. Morrison, M.S Assistant in EntomologyJoe Schuh, M.S Assistant in Entomology
Home EconomicsMaud M. Wilson, A M Home EconomistHelen McCullough, M.A Assistant Home Economist
Plant PathologyC. E. Owens, Ph.D Plant Pathologist in ChargeS. M. Zeller PILD Plant PathologistF. P. McWhorter. Ph.D Plant PathologistB. F. Dana, M.S Plant Pathologist (Division of Fruit and Vegetable Crops
and Diseases)F. D. Bailey, M.S Associate Plant Pathologist (Agricultural Marketing Service)P. W. Miller, Ph.D Associate Pathologist (Division of Fruit and Vegetable
Crops and DiseasesG. R. Hoerner, M.S Agent (Division of Drug and Related PlantsC. G. Walton, B.S Agent (Division of Drug and Related PlantsJohn Milbrath, Ph.D Assistant Plant Pathologist
Publications and News Service
C. D. Byrne Ed.D Director of InformationE. T. Reed kS, A B Editor of PublicationsD. M. GooAe, M.A Editor of PublicationsJ. C. Burtner, B.S In Charge of News Service
Branch Stations
L. Childs, A.B Superintendent, Hood River Branch Experiment Station, Hood RiverF. C. Reimer, M S Superintendent, Southern Oregon Branch Experiment
-Station, Talent
D. E. Richards, B.S Superintendent, Eastern Oregon Livestock BranchExperiment Station, Union
H. K. Dean, B.S Superintendent, Umatilla Branch Experiment Station(Division of Western Irrigation Agriculture), Hermiston
Obil Shattuck, M.S Superintendent, Harney Branch Experiment Station. BurnsH. B. Howell, B.S Superintendent, John Jacob Astor Branch Experiment
Station, AstoriaArch Work, B.S Associate Irrigation Engineer (Division of Irrigation)
MedfordG. A. Mitchell, B.S Superintendent, Pendleton Branch Station (Dry Land
Agriculture), PendletonK. B. Platt, M.S Superintendent and Assistant Range Examiner (Division of
Grazing), Squaw Butte Range Experiment Station, BurnsR. G. Johnson, B.S Leader of Livestock Research Projects, Squaw Butte Range
Experiment Station, BurnsM. M. Oveson, M.S Superintendent, Sherman Branch Experiment Station, MoroE. S. Degman, Ph.D Superintendent and Associate Pornologist, (Division of
Fruit and Vegetable Crops and Diseases), MedfordG. G. Brown, A.B., B.S Horticulturist, Hood River Branch Experiment Station,
Hood RiverL. G. Gentoer, M.S Associate Entomologist, Southern Oregon Branch
Experiment Station, TalentJ. F. Martin, M.S Assistant Agronomist (Division of Cereal Crops and
Diseases), Pendleton"R. E. Hutchison, M.S Assistant Superintendent, Harney Branch Experiment
Station, BurnsBruce Allyn, B.S Junior Irrigation Engineer (Division of Fruit and
Vegetable Crops and Diseases) MedfordJ R. Kienho!z, Ph.D Junior Pathologist (Division of Fruit aml Vegetable
Crops and Diseases), Hood RiveraR. W. Henderson, B.S Research Assistant, Sherman Branch Experiment
Station, MoroR. D. Frichtel, B.S Junior Range Examiner (Division of Grazing), Squaw
Butte Range Experiment Station, BurnsJoseph Belanger, B.S Cooperative Research Agent, Conservation Experiment