Department of Arctic and Marine Biology Sampling Site and Potential Errors in Estimating Total Body Water and Water Turnover Rate in Fasting Hooded Seals (Cystophora cristata) Fernando Alvira Iraizoz Master thesis in Biology BIO-3950 May, 2014
Transcript
Department of Arctic and Marine Biology
Sampling Site and Potential Errors in Estimating Total
Body Water and Water Turnover Rate in Fasting Hooded
Seals (Cystophora cristata)
Fernando Alvira Iraizoz
Master thesis in Biology BIO-3950
May, 2014
1
FACULTY OF BIOSCIENCES, FISHERIES AND ECONOMICS DEPARTMENT OF ARCTIC AND MARINE BIOLOGY ARCTIC UNIVERSITY OF NORWAY - UiT
Sampling Site and Potential Errors in Estimating
Total Body Water and Water Turnover Rate in
Fasting Hooded Seals (Cystophora cristata)
Fernando Alvira Iraizoz
Master thesis in Biology BIO-3950
May, 2014
2
3
Abstract
The purpose of this project is to study in detail the water balance and methodological
aspects of the use of the tritiated water method of hooded seals (Cystophora cristata).
Following 24 hours of fasting, 5 sub-adult hooded seals aged 1.5 years were injected
intravenously with a bolus dose of tritiated water through a catheter inserted into the
extradural intravertebral vein (EDV) at the level of the lumbar vertebra. A second
catheter was inserted at a lower level of the EDV and blood samples collected from
both at different intervals. An additional blood sample was collected from the femoral
vein. The seals were then reintroduced into seawater and fasted for a period of 4 days.
At the last day of the experiment blood samples were collected from a catheter
inserted into the EDV and from the femoral vein. The specific activity (SA) in plasma
samples was measured to assess if there were any differences between the sampling
sites. Total body water and turnover rate were determined according to the dilution
rate of tritiated water over time. No statistical differences were shown between the 2
catheters in EDV. However, differences between samples from the femoral vein and
EDV occurred in 2 of the seals. Total body water decreased on average (n = 5) 1.2 ± 0.1
l during the experimental period. Total rate of efflux was 2035 ± 145 ml · day-1 with a
daily net water loss of 297 ± 15 ml. All the seals showed a large extent of mariposia
during the 4 days of fasting (1147 ± 153 ml · day-1). It is concluded from this study that
sampling site does not affect the SA of 3H2O in plasma. However, the use of a second
catheter is strongly recommended to be sure to avoid any contamination. In addition,
it is concluded that sub-adult, fasting hooded seals drink seawater to a significant
extent.
4
5
Table of contents
Abstract 3
Table of contents 5
1. Introduction
1.1. Hooded seal (Cystophora cristata) 7
1.2. Water balance and homeostasis 8
1.2.1 Fresh water drinking 9
1.2.2 Free and metabolic water from food items 9
1.2.3 Metabolic water from fat reserves 9
1.2.4 Respiratory water influx 10
1.2.5 Mariposia 10
1.2.6 Respiratory evaporative water loss (REWL) 11
1.2.7 Cutaneous evaporation 12
1.2.8 Feces 12
1.2.9 Urine 13
1.3. Project purpose 13
2. Material and Methods
2.1. Animals 15
2.2. Experimental protocol 16
2.3. Plasma analysis 17
2.4. Estimating TBW and water turnover rate 18
2.4.1 cpm correction 18
2.4.2 TBW estimation 20
2.4.3 Water turnover rate 20
2.4.3.1 Metabolic water 21
2.4.3.2 Water influx via respiration 21
2.4.3.3 Sea water drinking 22
2.4.3.4 Respiratory evaporative water loss (REWL) 22
2.4.3.5 Cutaneous evaporation (CEWL) 23
2.4.3.6 Urine and feces 23
2.4.4 Fractionation 23
2.4.5 Exchange 23
2.5. Statistics 24
6
3. Results
3.1. Daily weight loss 25
3.2. Sampling site variation 26
3.3. Total body water 31
3.3.1 Plasma water content 31
3.3.2 Corrected cpm 32
3.3.3 TBW estimate: linear regression or mean value 32
3.4. Water turnover rate 33
4. Discussion
4.1. Daily weight loss 37
4.2. Sampling site 37
4.3. Total body water 39
4.4. Water turnover rate 40
Acknowledgements 43
References 45
Appendix 1 49
7
1. Introduction
1.1. Hooded Seal (Cystophora cristata)
Hooded seal (Cystophora cristata, Erxleben, 1777) is a large phocid that is silver-grey in
colour with irregularly distributed black spots covering most of the body and, most
often, black head. Males are in average 2.5 meters long and weight around 300 kg
while females are significantly smaller measuring in average 2.2 meters and weighting
around 200 kg. Adult males have an inflatable nasal sac that fully inflates, covering the
front of the face and the top of the head, during the mating season as a specific
courtship display (Kovacs, 2008). Blueback is the name given to newborn individuals of
this species due to their colour which is kept until the age of 2 years approximately.
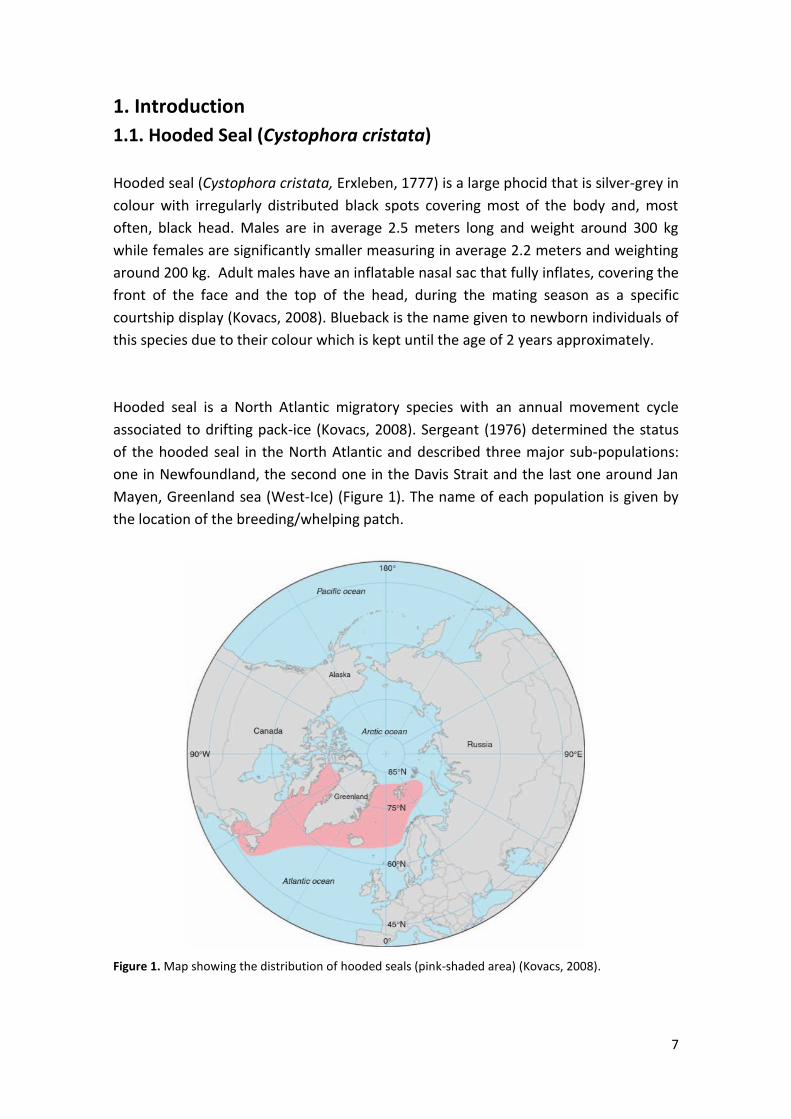
Hooded seal is a North Atlantic migratory species with an annual movement cycle
associated to drifting pack-ice (Kovacs, 2008). Sergeant (1976) determined the status
of the hooded seal in the North Atlantic and described three major sub-populations:
one in Newfoundland, the second one in the Davis Strait and the last one around Jan
Mayen, Greenland sea (West-Ice) (Figure 1). The name of each population is given by
the location of the breeding/whelping patch.
Figure 1. Map showing the distribution of hooded seals (pink-shaded area) (Kovacs, 2008).
8
Folkow et al. (1996) further described the annual distribution of hooded seals in the
Greenland and Norwegian seas. Studies based on satellite-linked transmitters showed
that seals perform long and repeated journeys to open waters as far as Faeroe Islands,
south Iceland, Bear island and Svalbard. However, in periods other than breeding and
moulting, seals spread further out into open sea and for longer periods of time (Folkow
et al., 1996; Folkow et al., 2010). Folkow et al. (2010) determined that the overall time
spent by a young of the year hooded seal in open ocean amounts to 76 % of its life.
This creates potential challenge for seals regarding to water balance (Folkow & Blix,
1987) and homeostasis since during that 76 % of the time they do not have access to
fresh water. In addition, the main food items for hooded seals are fish such as polar
where; 0.0484 is the conversion factor to convert kcal · day-1 to Watts and BM is body
mass. RMV was then calculated and converted to l · day-1.
22
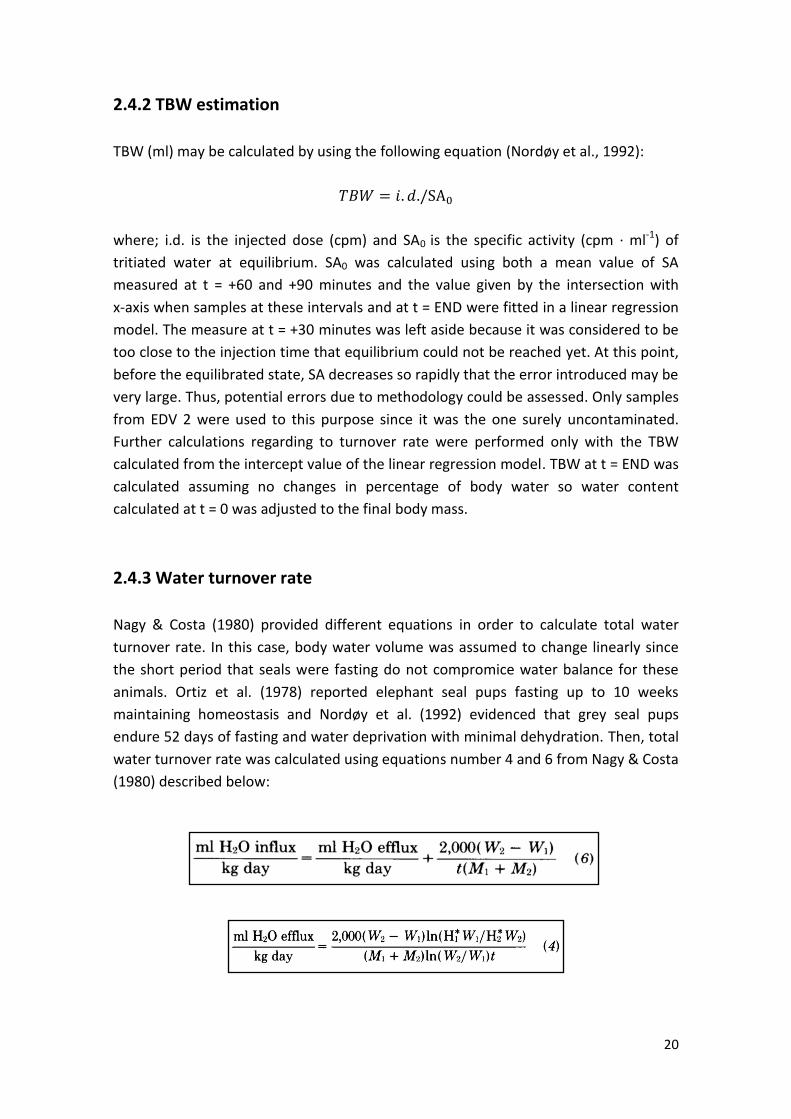
Assuming a 100 % saturation of water vapour in air (due to low ambient temperature
and seals breathing just above pool water) and knowing the ambient temperature the
amount of water in air was calculated. Firstly, PH2O was calculated:
PH2O = n · R · T / V
where; PH2O is partial pressure of water vapour in mm Hg, n is moles of water in
saturated air at a given temperature (0.40663 moles), R is the gas constant (0.0821 l ·
atm · mol-1 · K-1 ), T is the ambient temperature in Kelvin and V is volume (1000 litres).
Using the same formula, the volume of 1 mole of water vapour was also calculated at 1
atmosphere (Vmol). Then, water influx via respiration was calculated as follows:
Wi = RMV · PH2O / 760
where; Wi is inspired water in l · day-1, RMV is respiratory minute volume in litres ·
day-1, PH2O is partial pressure of water vapour in mm Hg and 760 is the standard
pressure in mm Hg. Then,
Winf = Wi / Vmol · 18
where; Winf is the amount of water entering the body in ml · day-1, Vmol is the volume
of 1 mole of water vapour at a given temperature in l · mol-1, and 18 is the molar mass
of water in grams · mol-1.
2.4.3.3 Sea water drinking
The extent of mariposia was estimated by subtracting metabolic water influx and
respiratory influx from total water input.
2.4.3.4 Respiratory evaporative water loss (REWL)
Respiratory evaporative water loss was calculated following the same procedure as
when calculating water influx via respiration (see section 2.4.3.2). Temperature of
exhaled air was adjusted according to Folkow & Blix (1987) to be 29oC.
23
2.4.3.5 Cutaneous evaporation (CEWL)
Cutaneous evaporation was calculated from data available for gray seals (H. grypus).
According to Nordøy et al. (1992), 34 % of total daily water efflux in a 39.5 kg grey seal
is due to cutaneous evaporation amounting to 3 ml · day-1 · kg-1. This value was used to
determine cutaneous evaporation in the hooded seals used to the present study by
extrapolating to the weight of the hooded seals.
2.4.3.6 Urine and feces
Water loss in feces was assumed to be negligible in fasting seals (Nordøy et al., 1992;
Storeheier & Nordøy, 2001). Urine production was calculated by subtracting
respiratory evaporative water loss (REWL) from total water turnover rate (assuming
100 % of urine to be water).
2.4.4 Fractionation
Isotope fractionation occurs since tritiated water (heavier; 3H2O) evaporates slower
than unlabeled water (lighter) so specific activity in water lost through respiration does
not equal that in body water (Nagy & Costa, 1980). Water turnover rate was corrected
for fractionation as follows:
where; rH2O is the corrected turnover rate in ml · day-1, fi is the fractionation factor, rG is
the gaseous fraction of turnover in ml · day-1 and rL is the liquid fraction of turnover in
ml · day-1. The fraction of turnover subjected to fractionation was calculated as the
percentage of gaseous fraction of turnover over the total turnover rate. The
fractionation factor introduced in the equation was 0.93 (Sepall & Mason, 1960).
2.4.5 Exchange
The hydrogen atoms of water molecules disassociate rapidly and can freely exchange
with hydrogen of organic molecules or become associated with non-aqueous
compounds. This introduces an error that must be taken into account (Nagy & Costa,
1980). TBW was not corrected for exchange due to the short equilibration time
24
decided. However, water turnover rate must be corrected as follows because
exchange may be considerable after 4 days:
where; (rH2O)calc is the uncorrected value of turnover in ml · day-1, rH2O is the corrected
turnover rate in ml · day-1, rRH2O is water lost from all remaining routes in ml · day-1,
rEH2O is water lost via expiration in ml · day-1, rI
H2O is water entry via inspiration in ml ·
day-1 and j is the ratio of the SA of inspired air to that of the body water (j = 0 because
the SA of the air is negligible under normal conditions).
2.5 Statistics
Specific activity, TBW and turnover rates of the different seals were analyzed by
Student's t test for either independent or paired samples as necessary. Normality tests
were done in all the cases and Levene's analysis for homoscedasticity performed when
Student's t test for independent samples was used. When Levene's test was significant
(differences between variances), a Welch's test was done instead. Those sets of
samples where normality was rejected were analyzed by a Mann-Whitney's U test.
Significant differences were determined when p<0.05; CI:95 %. Average values are
presented as ̅ ± SD (standard deviation).
25
3. Results
Body mass was recorded at the beginning and at the end of the experiment. Specific
activity (SA) of tritiated water was estimated at t = 0 and t = END from different
sampling sites and differences among them, TBW and turnover rate estimated
afterwards. Equilibrium for tritiated water distribution was estimated in 3 different
ways, described below, to elucidate the best option.
3.1 Daily weight loss
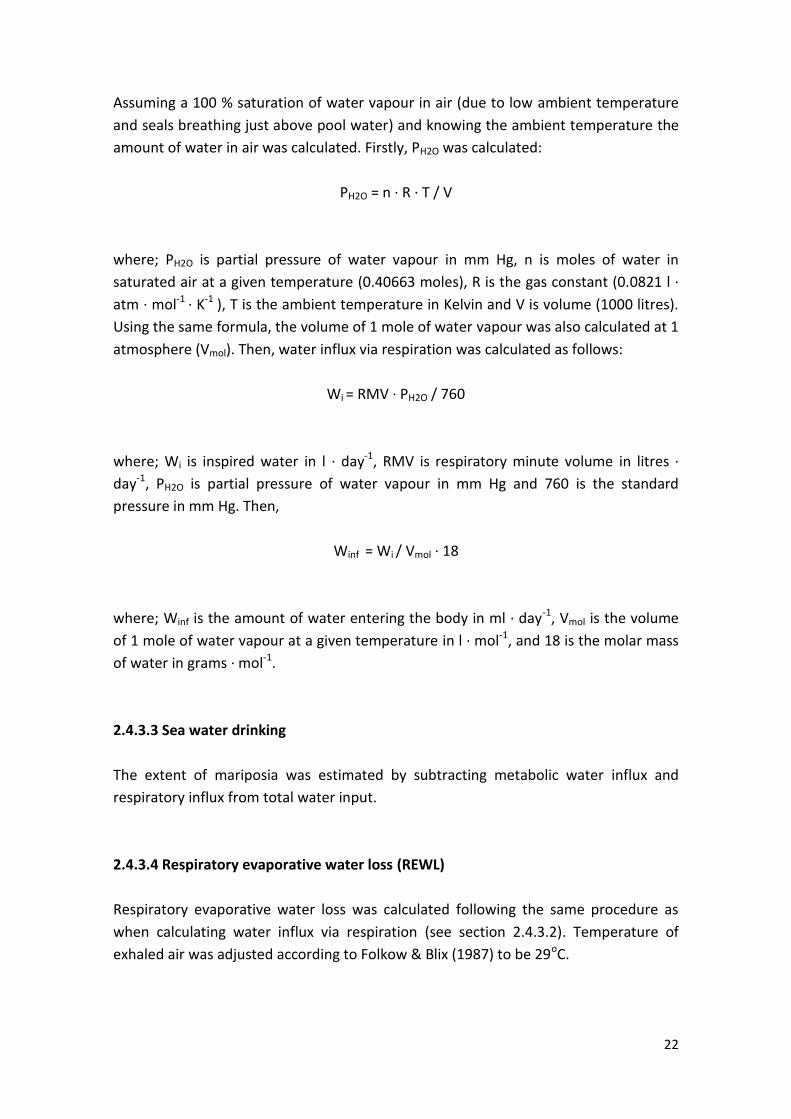
Body mass of seals at t = 0 was on average 91.7 ± 8.1 kg (range 83.4-103.5 kg). Mean
body mass at t = END was 88.8 ± 8.2 kg (range 80.2-100.6 kg). Average decrease of
body mass was 3.1 ± 0.4 % amounting to 2.8 ± 0.2 kg (range 2.6-3.2 kg) or 0.7 kg ·
day-1. All the seals were shown to lose weight in a similar manner and rate (Figure 4).
Figure 4. Average weight of seals (n=5) at t=0 and t=END with SD (above) and weight of each seal at t=0
and t=END (below).
91.68
88.84
80.00
85.00
90.00
95.00
100.00
105.00
Weight t=0 Weight t=END
Bo
dy
mas
s (k
g)
75.00
80.00
85.00
90.00
95.00
100.00
105.00
Weight t=0 Weight t=END
Bo
dy
mas
s (k
g)
Seal #1 Seal #2 Seal #3 Seal #4 Seal #5
26
3.2 Sampling site variation
Values of SA of 3H2O were used to estimate potential differences due to sampling site.
Both variation between the two catheters inserted into the extradural vein (EDV 1 and
EDV 2) and between them and samples taken from the flipper vein were analyzed. In
both cases, absolute values of cpm, without any correction, were used since, in order
to estimate differences, those are not required due to all the samples taken into
account in each comparison were subjected to the same treatment.
Seals #1, #2, #3 and #5 were used to estimate potential differences between EDV 1
and EDV 2. Seal #4 was rejected due to the catheter located in the upper part of the
spine (EDV 1) had to be taken away because it got blocked.
No statistical differences were shown between catheters EDV 1 and EDV 2 at any time (+30, +60 and +90 min) (Figure 5).
Figure 5. Mean activity values directly from scintillation counting in cpm (A) (circles) and standard deviation (lines) in cpm of the different samples collected from catheters EDV 1 (blue) and EDV 2 (green) plotted as a function of time (minutes), t = +30, +60 and +90 min.
1. Seal #1.
2. Seal #2.
3. Seal #3.
4. Seal #5
1
2
27
However, even though not significant, slight variation was shown between samples
from EDV 1 and EDV 2 and along the time in seals #1 and #2 (Figure 6).
Samples for these two seals were stored for 48 hours before analysis
oC) which may introduced an error due to the rapid decay rate of tritiated water.
This unexpected variation did not occur in seals #3 and #5 of which samples were
analyzed immediately after having been prepared (Figure 7).
3
4
Figure 5. Continued.
28
5600.00
5850.00
6100.00
6350.00
6600.00
6850.00
7100.00
t = +30 t = +60 t = +90 t = END
SA (
cpm
· m
l-1)
Time
EDV 1 EDV2
5400.00
5900.00
6400.00
6900.00
7400.00
7900.00
t = +30 t = +60 t = +90 t = END
SA (
cpm
· m
l-1)
Time
EDV 1 EDV 2
Figure 7. Specific activity (SA) in cpm · ml-1
of tritiated water plotted as a function of time in seal #3 (above) and #5 (below). t = +30 min, +60 min and +90 min correspond to day 1 of experiment and t = END to the last sample collected at day 4.
2400.00
2600.00
2800.00
3000.00
3200.00
3400.00
3600.00
3800.00
t = +30 t = +60 t = +90 t = END
SA (
cpm
· m
l-1)
Time
EDV 1 EDV 2
3000.00
3200.00
3400.00
3600.00
3800.00
4000.00
4200.00
4400.00
t = +30 t = +60 t = +90 t = END
SA (
cpm
· m
l-1)
Time
EDV 1 EDV 2
Figure 6. Specific activity (SA) in cpm · ml-1
of tritiated water plotted as a function of time in seal #1 (above) and #2 (below). t = +30 min, +60 min and +90 min correspond to day 1 of experiment and t = END to the last sample collected at day 4.
29
In addition, differences between samples collected from the EDV and the flipper vein
(FV) (in the hind flipper) were assessed at t = +60 and t = END. Samples from the EDV 2
were chosen to compare with those from the flipper vein at t = +60. The reason was
that this catheter was surly uncontaminated by tritiated water. Comparison was
performed 60 minutes after the injection because this time was considered long
enough to reach a homogenous distribution of 3H2O.
Seals #2 and #3 showed significant variations between samples from the EDV 2 and the
FV at t = +60; p<0.001 and p=0.008 (CI:95 %), respectively. Activity measured from the
EDV 2 at t = 60 in seal #2 was approximately twice than that measured from the FV.
This was most likely an error introduced by adding only half of the volume of plasma
from the FV to the counting vial. No other significant variations were shown among the
other seals at any time between EDV 2 and FV (Figure 8). Results from seal #4 at t =
END are not present because only one sample from FV was available so statistical
differences could not be assessed with a sample size of n = 1.
1
Figure 8. Mean activity values directly from scintillation counting in cpm (A) (circles) and standard deviation (lines) in cpm of the different samples collected from catheter EDV 2 (blue) and FV (green) as a function of time. t = 60 min corresponds to day 1 of experiment and t = END to 4 days after the injection. Asterisks (*) mark those samples where statistically significant differences were shown.
1. Seal #1.
2. Seal #2.
3. Seal #3.
4. Seal #4
5. Seal #5
2
*
30
3
*
*
4
5
Figure 8. Continued.
31
Seal #1 and #2 show an unexpected large variation between samples taken at t = +60
and t = END from FV. Values at the beginning of the experiment are actually higher
than those at the end which is, in principle, impossible. The rest of the animals (#3, #4
and #5) show little variation at different sampling sites and an expected variation in SA.
Again, this may be related with the storing of samples from seals #1 and #2 which
were kept within a plastic box in a room at 2oC during the 48 hours prior to analysis.
3.3 Total Body Water
Data based on isotope dilution rate was used to estimate TBW. Only seals #3, #4 and
#5 were utilized to estimate TBW. As mentioned before in section 3.2, samples from
seals #1 and #2 were stored 48h before analysis. This might be the reason why SA is
very low and the SD very large, compared to these in seals #3, #4 and #5 (Table 3). It
was decided to discard those samples when estimating TBW and turnover rate to avoid
the possibility of erroneous calculations.
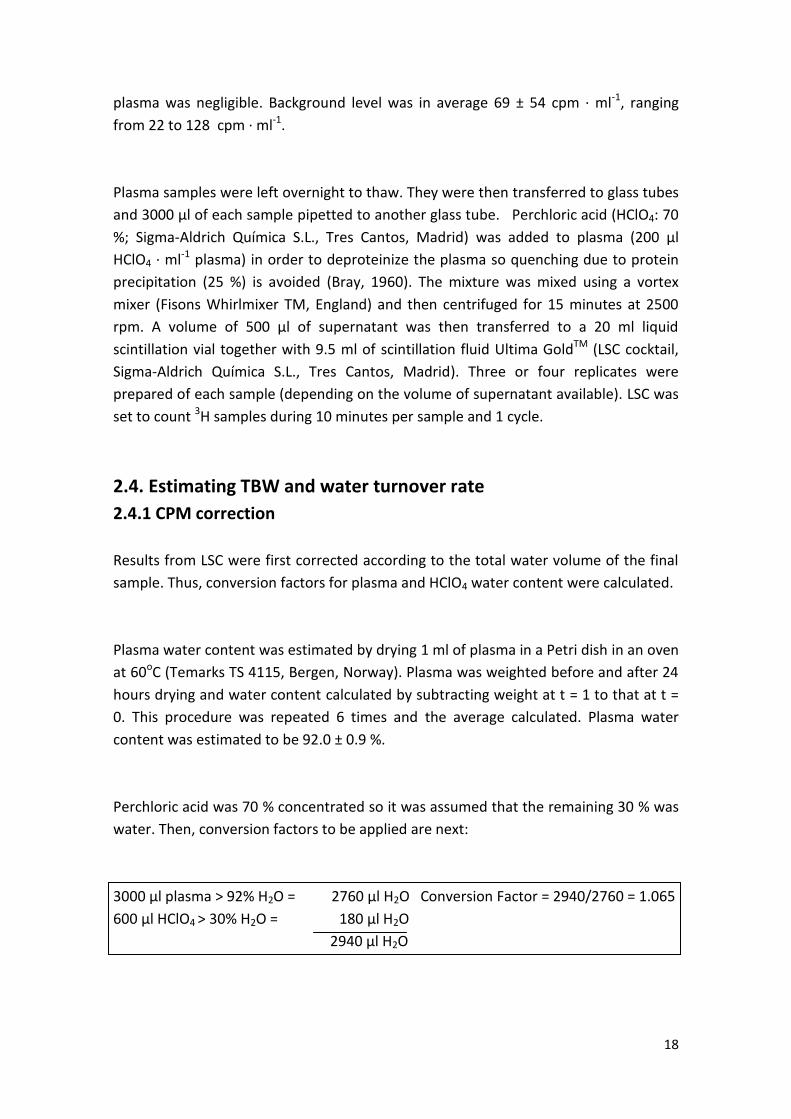
3.3.1 Plasma water content
Table 2 shows the results of the experimental estimation of plasma water content.
Average value, 92.1 %, was used then to adjust cpm values to the right water volume
present in the samples as described in section 2.4.1.
Table 1. Weights before and after 24 hours drying of 6 plasma samples and their water content as the
percentage of the wet weight. Average water content of all 6 samples is presented in the last row.
No. Sample Net Wet Weight
(g) t=0h
Net Dry Weight
(g) t=24h
Water Content
(%)
1 1.0233 0.0757 92.6024
2 1.0429 0.0994 90.4689
3 1.0553 0.0826 92.1728
4 1.0512 0.0747 92.8938
5 1.0444 0.0759 92.7327
6 1.0670 0.0900 91.5651
Average Water Content ± SD in
Plasma 92.1 ± 0.9
32
3.3.2 Corrected cpm values
Table 3 shows the corrected values of specific activity (cpm · ml-1) of the whole sample
set including those used in the calculations of both TBW and water turnover rate. They
were corrected as described in section 2.4.1. Original data set can be found in
Appendix 1.
Table 2. Mean values (corrected values) and standard deviations (SD) in cpm · ml
-1 of the SA of
3H2O in
plasma samples for each seal at every sampling time and site. Samples taken at t = +30, +60 and +90
correspond to day 1 of experiment and those taken at t = END to day 4 of experiment. Asterisks (*) mark
those seals that were not taken into account when estimating TBW and water turnover rate.
FV END 4527.55 701.46 2328.23 1571.28 5770.12 83.41 6406.02
6197.19 144.82
3.3.3 TBW estimate: linear regression or mean value.
When estimating TBW, SA at equilibrium was assumed to be 1) the mean value of SA
measured at t = +60 and +90 and 2) the value given by the intersection with x-axis
when cpm at these intervals and at t = END were fitted in a linear regression model.
There were no significant differences when calculating TBW using 1) the mean value or
2) linear regression value (p = 0.842; CI:95%; n = 3). Difference in TBW regarding to the
usage of 1) or 2) was 0.1 l (from 36.8 l to 36.7 l) (Table 4) amounting to 0.15 % of TBW.
The possible consequence is the overestimate of the efflux and influx rates. However,
no significant differences were found in this case either (p = 0.700 and 0.700,
respectively). Efflux and influx rates were 0.5 % and 0.6 % higher, respectively, when
using value 2). This amounted to 10 ml · day-1 in both cases.
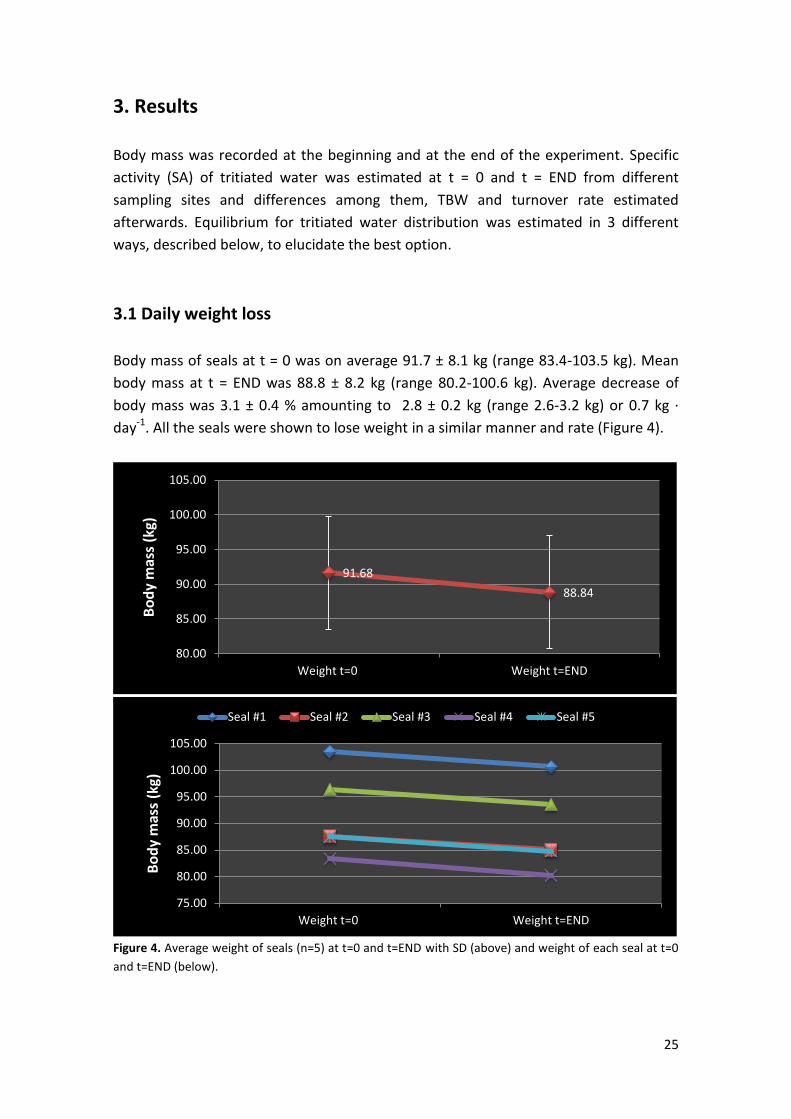
Total body water decreased on average 1.2 ± 0.1 l (p = 0.01) along the experiment,
from 36.7 ± 3.6 l to 35.5 ± 3.7 l; 297.6 ± 15.3 ml · day-1. TBW at t = END was calculated
33
from TBWLN (Table 4). TBWLN was considered the most precise value because it
extrapolates the SA to time zero.
Table 3. Total body water in litres at t = 0 and END for seals #3, #4 and #5. Superscripts M and LR mean that the calculations have been done with the mean value and with the linear regression value, respectively. Cu u v h h u ΔTBW .
The linear regression model was also performed using the values at t = +30, +60 and
+90 minutes, in order to detect the effect of using the 30 min value. The consequence
of this is an underestimation of TBW by about 4.8 ± 2.3 % (from 39.5 ± 4.1 l to 37.5 ±
4.9 l; n = 3) (p = 0.628; CI:95 %) and the overestimation of the efflux and influx rates by
12.3 ± 2.5 % and 14.5 ± 2.9 %, amounting to 331.3 ± 93.0 ml · day-1 (p = 0.158; CI:95 %)
and 347.2 ± 102.0 ml · day-1 (p = 0.160), respectively. The differences were still not
significant (CI:95%). As mentioned in section 2.4.2 the use of a specific activity too
close to the injection time (in this case 30 min) introduces an error.
3.4 Water turnover rate
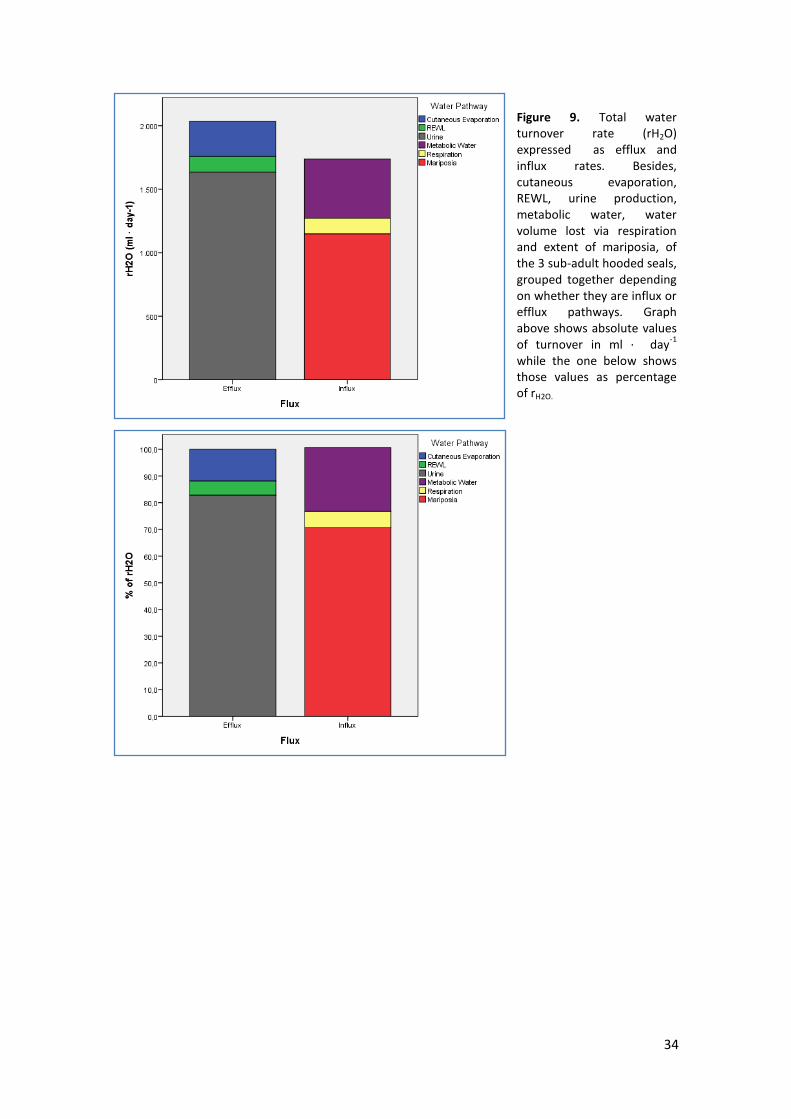
Total water turnover rate (rH2O) was estimated to be on average (n = 3) 2036 ± 145 ml ·
day-1, expressed as total daily water efflux. The average total daily water influx was
1738 ± 130 (Figure 9). Efflux was always higher than influx so seals showed a net loss of
water of 298 ± 15 ml · day-1 which results in a net loss of 1203 ± 62 ml during the
entire experiment of 4 days (Table 4).
Metabolic water, respiratory water influx and mariposia amounted to 467 (27 %), 123
(7 %) and 1148 (66 %) ml · day-1 of total daily influx, respectively. On the other hand,
cutaneous evaporation, REWL and urine produced amounted to 278 (14 %), 123 (6 %)
and 1635 (80 %) ml · day-1 of total daily efflux (Figure 9 and Table 5).
Figure 9. Total water turnover rate (rH2O) expressed as efflux and influx rates. Besides, cutaneous evaporation, REWL, urine production, metabolic water, water volume lost via respiration and extent of mariposia, of the 3 sub-adult hooded seals, grouped together depending on whether they are influx or efflux pathways. Graph above shows absolute values of turnover in ml · day
-1
while the one below shows those values as percentage of rH2O.
35
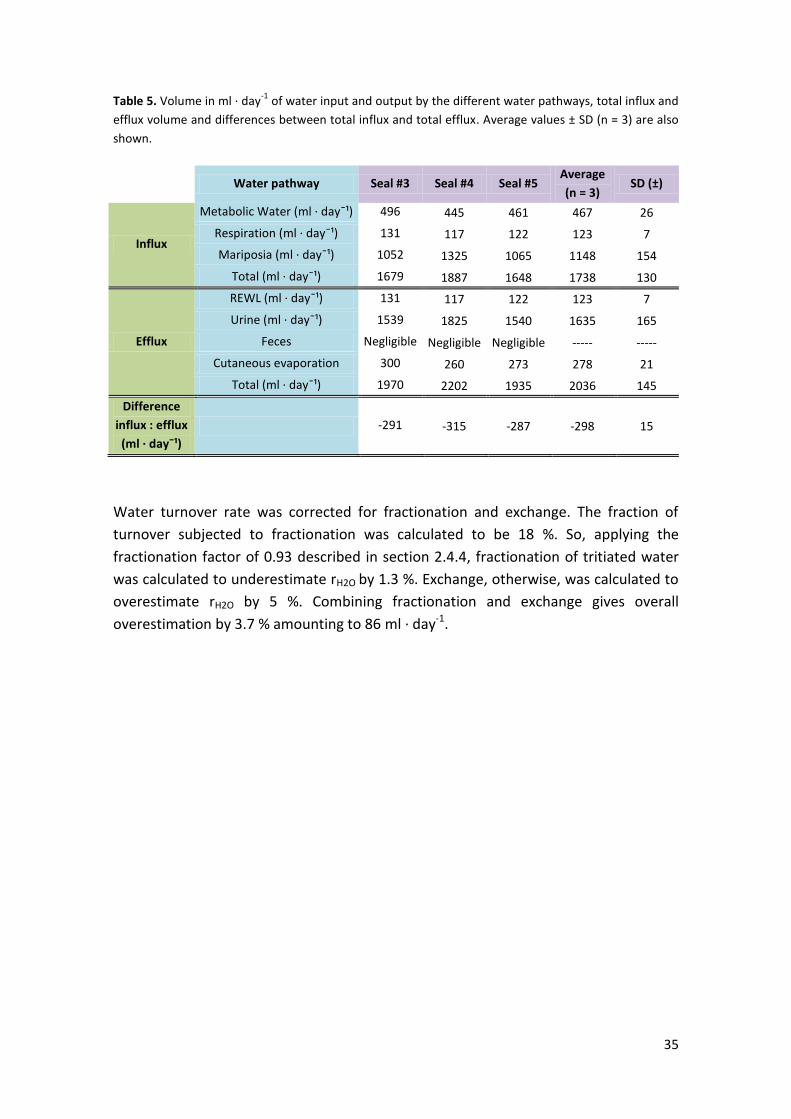
Table 5. Volume in ml · day-1
of water input and output by the different water pathways, total influx and
efflux volume and differences between total influx and total efflux. Average values ± SD (n = 3) are also
shown.
Water turnover rate was corrected for fractionation and exchange. The fraction of
turnover subjected to fractionation was calculated to be 18 %. So, applying the
fractionation factor of 0.93 described in section 2.4.4, fractionation of tritiated water
was calculated to underestimate rH2O by 1.3 %. Exchange, otherwise, was calculated to
overestimate rH2O by 5 %. Combining fractionation and exchange gives overall
overestimation by 3.7 % amounting to 86 ml · day-1.
Body mass decreased 3.1 ± 0.4 % amounting to 2.8 ± 0.2 kg in 4 days of fasting or 700 g
· day-1. Weight loss was partially due to the reduction in TBW (1.2 ± 0.1 l) during the
experimental period (1.2 ± 0.1 l). In addition, it has been suggested by an increase in
plasma urea in adult harp seals (P. groenlandicus) (Storeheier & Nordøy, 2001) that a
certain amount of muscle tissue is metabolized at the beginning of a fasting period.
This has been seen to be very low, but still important, in grey seal pups (H. grypus)
before entering into phase III of fasting (Nordøy et al., 1992). Nordøy et al. (1990)
calculated the amount of protein catabolized by grey seal pups (H. grypus) at the start
of the fasting period to be 0.5 g · day-1 · kg-1 (20 g · day-1) covering about 6% of daily
metabolic rate. Nordøy et al. (1993) calculated this value to be 0.9 g · day-1 · kg-1 (30 g ·
day-1) in early phase of fasting in harp seal pups (P. groenlandicus). Applying the later
value to the current study indicates that about 80 g of weight loss per day can be
attributed to protein catabolism. The remaining weight loss was in the current study
attributed to fat tissue catabolism.
Dehydration was not likely for this short experimental period (Nordøy et al., 1992;
Ortiz et al., 1978) even with a significant decrease in body weight (p = 0.01). Nordøy et
al. (1992) calculated the daily weight loss in fasting grey seals to be 10.6 g · kg-1 · day-1
after 52 days fasting and only minor dehydration was shown. Hooded seals on this
study lost on average 7.7 g · kg-1 · day-1.
4.2 Sampling site
Despite no significant differences between EDV 1 and EDV 2 at any time, some slight
variation was shown in seals #1 and #2. This is most likely due to the storage of the
samples at 2oC for 48 h prior to analysis. When plasma samples containing tritiated
water are mixed with the scintillation solvent the isotope starts decaying rapidly (beta
pulse decay time = 2-10 nanoseconds) (L'Annunziata, 2003) so they must be analyzed
as soon as they are ready. The second plausible hypothesis is that a small fraction of
the injected dose remains in the catheter, when this is not properly flushed with saline,
contaminating thus subsequent blood samples. This is supported by the lower SD
showed in most of the samples collected at the EDV 2 compared to those from the EDV
1 (used for administration of tritiated water).
38
The procedure was carefully followed and catheters gently flushed with saline after 3H2O dose was administered or blood samples collected (Nordøy et al., 1992; How &
Nordøy, 2007). Extreme care with regard to reuse of syringes and keeping the opening
of the catheter perfectly cleaned after usage is of high importance in order to avoid
potential errors in later estimations.
According with this line of argument the use of one catheter to administer the tritiated
water and a second catheter, EDV 2 in this case, for collecting blood samples is strongly
recommended to be sure to avoid any contamination. According to Gröning &
Rozanski (2003) one Tritium Unit (TU) (1 atom of 3H per 1018 atoms of hydrogen)
equals to 0.119 Bq · l-1. When injecting few mega-Becquerel (MBq) the number of
atoms left in the catheter may give huge errors during analysis in a LSC unless they are
cleaned properly.
Seals #2 and #3 showed significant differences between samples collected at EDV2 and
FV at t = +60. However, no other differences were found at any other time or seal. In
principle, blood samples from the EDV and FV should be identical, nevertheless, the
ability of seals to shut down vascularisation under some circumstances is well known.
For instance, when a seal performs a dive it carries out a selective peripheral
vasoconstriction. Most of the blood is driven to the brain while the rest of the body
must rely on local oxygen stores or anaerobic metabolism (Blix et al., 2010; Blix, 2005).
This method is also used to avoid heat loss. In this case, seals reduce peripheral
circulation to avoid warm blood going to the flippers, where insulation is least and
heat loss largest (Blix, 2005). A reduced blood flow to the flippers may thus prevent a
rapid equilibration of tritiated water with total body water as the more central vein,
EDV.
Stress is defined as the body's reaction to a change that requires a physical, mental or
emotional adjustment or response. It can come from any situation that makes the
animal feel frustrated, angry, nervous, or anxious. This behaviour was shown in all the
seals at some point during the experiment, mostly when the effect of the sedative
decreased with time. Recent studies have shown that levels of cortisol significantly
increased when Weddell seals (Leptonychotes weddellii) were handled by researchers
(Harcourt et al., 2010). Cortisol elevation is a common indicator of stress responses in
mammals (Harcourt et al., 2010). Cortisol, among other effects, inhibits vasodilatation
(Mangos et al., 2000) which may affect tritiated water distribution through the hind
flippers. Administering a light dose of diazepam would ameliorate the cortisol
response to handled animals (Harcourt et al., 2010).
39
In some of the seals used in the experiments a very low surface temperature of the
hind flippers was noticed, although not recorded. This indicates low blood flow due to
a stressful situation, since room temperature ( 6.5oC) would never compromize heat
balance in a hooded seal. Folkow & Blix (1987) concluded that the lower critical
temperature in grey seals (H. grypus) is set at about -11oC. In fact, the experience
during the experiment was that blood sampling from the hind flipper was more
difficult in those seals with lower flipper surface temperature.
Vasoconstriction due to stress may affect normal distribution of tritiated water. Since
the seal is restrained along the entire procedure, from 3H2O dose administration to
the last blood sampling (around 2.5 h), during the day one of experiment, this is a very
plausible reason why those variations were seen between EDV 2 and FV.
This do not only give an error in later analysis but also makes the sampling much more
difficult. Collecting blood samples from the femoral vein when vasculature is nearly
non-existing is very difficult and the volume of blood collected often very small and
limited. Firstly, a low sampled volume of plasma results in a reduced number of
replicates affecting the statistical analysis. Secondly, mistakes or unexpected problems
during plasma analysis may end up in gaps in the sample set which makes it impossible
to compare some parameters.
In conclusion, the use of a second catheter for collecting the samples seems to be the
best option regarding the tritiated water methodology. The only risk of this method is
the increased possibilities of hemolysis compared with evacuated tubes used in the
flipper vein, probably due to syringe suction during sampling which creates more
pressure than a vacutainer (Kennedy et al., 1996). Kennedy et al. (1996) recommend
the use of vacutainer adapters to catheters to reduce pressure during the suction of
the blood. Frothing of the blood as it passes through the catheter also may provoke
hemolysis as well as the pressure applied by pulling and pushing down the plunger of
the syringe (Arzoumanian, 2003). However, if a gentle suction is performed, plasma
samples obtained from a catheter should be of best quality.
4.3 Total body water
In order to make accurate estimations of total body water (TBW), values of SA
measured at t = +60, +90 minutes and END were fitted in a linear regression model in
order to extrapolate the SA to time zero. During the equilibration time, before any
40
sample has been collected, some tritium leaves the body since the seal starts
eliminating tritiated water via respiration as soon as it enters the body. Therefore,
dilution rate is biased. The linear regression model was also generated with the values
of SA measured at t = +30, +60 and +90 minutes. In this case, the calculated SA at t = 0
was so large that TBW was calculated to be underestimated 4.8 ± 2.3 % and water
efflux and influx overestimated 12.3 ± 2.5 % and 14.5 ± 2.9 %, respectively. This
suggests that t = +30 minutes is too close to the injection time so the value of SA was
slightly higher than that at equilibrium. Therefore, it was concluded that equilibrium
has not been reached yet at this time.
The last calculation done was with the mean value of SA at t = +60 and +90. The result
varied so little from the value obtained in the linear regression involving t = +60, +90
minutes and END. This strongly suggests a low linear fractional turnover rate.
According to the results obtained from the different methods it was concluded that
the usage of a linear regression model including values at t = +60, +90 minutes and
END is the best option to best estimate TBW. The use of a linear regression model to
extrapolate a data series is suggested and supported by Chow & Lin (1971). Thus, TBW
decreased during the experimental period 1.2 ± 0.1 l, from 36.7 ± 3.6 l to 35.5 ± 3.7 l
amounting to 297.6 ± 15.3 ml · day-1.
4.4 Water turnover rate
An animal which water balance is in a steady state must match daily water influx and
efflux (Depocas et al., 1971). Nagy and Costa (1980) provided equations to be used
whether the body water pool remains constant, changes linearly or experiences
exponential variation. In addition, potential errors are provided for those cases where
the equation is wrongly elected, which could be as high as ±100 %.
In this case, the equation for linear changes in TBW was chosen. As mentioned above,
TBW of the seals decreased in average 1.2 ± 0.1 l during 4 days of fasting (297.6 ± 15.3
ml · day-1). It is well known that such a short period is unlikely to compromise water
balance in seals. This is supported by Nordøy et al. (1992) where grey seals were fasted
for 52 days with a daily water efflux of 362 ± 17 ml · day-1 and only showed minor
dehydration, so the equation for exponential changes was rejected in this study.
41
Equation for steady state was also rejected because TBW decreased during fasting as a
function of time as mentioned before. The low fractional turnover rate mentioned in
section 4.3 suggests that the equation for linear changes is the most correct in this
case.
According to this line of argument the quantity of water influx and efflux were
calculated to be 1737.8 ± 129.9 and 2035.5 ± 145.2 ml · day-1. Metabolic water,
respiration and mariposia amounted to 466.97 (26.9 %), 123.20 (7.1 %) and 1147.63
(66.0 %) ml · day-1 of total daily influx, respectively. On the other hand, cutaneous
evaporation, REWL and urine produced amounted to 277.63 (13.6 %), 123.22 (6.1 %)
and 1634.61 (80.3 %) ml · day-1 of total daily efflux, respectively.
Metabolic water and water influx via respiration compare well to those suggested by
Skalstad & Nordøy (2000) and Depocas et al. (1971), respectively. Besides, both values
were calculated from well established methods. Metabolic water was calculated based
on the Kleiber's equation and respiratory influx from equations provided by Folkow &
Blix (1987).
However, the extent of mariposia in hooded seals was estimated to be slightly higher
than this in previous publications (Skalstad & Nordøy, 2000). The hypothesis suggested
based on this study is that hooded seals increase the extent of mariposia as soon as
other sources of water, food in the case of fasting seals, are deprived. This means that,
under normal conditions, mariposia is kept below the maximum capacity, which
increases when the deprivation of a source of water occurs. This is supported by How
& Nordøy (2007) where fasting and dehydrated harp seals were shown to partly
restore water balance after 1 l seawater administration which it is a very similar value
to that obtained in this study. Skalstad & Nordøy (2000) showed values of mariposia in
hooded seal of 10 ml · day-1 · kg-1 (300 ml · day-1) while seals were fed on fresh herring.
In that study, free and metabolic water on ingested food and respiratory influx were
calculated to be 1750 ml · day-1 and 114 ml · day-1, respectively. It seems that
deprivation of food is partly compensated by an increase in metabolic water
production from fat reserves (466 ml · day-1) and a small increase in seawater drinking
13 ml · day-1 · kg-1 (1147 ml · day-1) since respiratory water influx (123 ml · day-1) is
comparable to that of Skalstad & Nordøy (2000).
The reason may be that producing water from fat reserves involves a certain loss of
blubber content with the corresponding loss of energy store and insulating layer which
42
is of extreme importance for hooded seals living in a cold environment. However,
seawater drinking appears not to provide negative physiological effects in hooded
(Skalstad & Nordøy, 2000) and harp seals (Skalstad & Nordøy, 2000; Storeheier &
Nordøy, 2001) where values of urine and plasma osmolality went back to baseline
levels after seawater exposure. This hypothesis reinforces the function of mariposia
suggested in early studies, such as providing urinary osmotic space for urea (Wolf et
al., 1959). How & Nordøy (2007) showed a clear decrease in plasma urea after
seawater administration. In hydrated fasting seals, providing urinary space for urea
seems to be the main goal of mariposia. This is the most likely purpose of the
mariposia seen in the current study. However, in a state of strong dehydration, the
extent of mariposia may be expected to increase considerably to maintain water
balance and reduce fat metabolism.
The urine production is also higher than that estimated in other publications
(Storeheier & Nordøy, 2001; Skalstad & Nordøy, 2000). This results from the elevated
mariposia. The same increase was shown by How & Nordøy (2007) and Storeheier &
Nordøy (2001) after seawater administration, since urine in the unique mechanism to
excrete the excess of salts in fasting hooded seals.
43
Acknowledgements
This MSc thesis was performed within the Arctic Animal Physiology Research Group at the Arctic University of Norway. I wish to strongly thank: Professor Dr. Philos Erling S. Nordøy for kindly supervise this project, for all those hours spent reading, discussing and correcting and for invaluable help during experiments. I must say that I have learnt so much with him. Technical stuff at AAB for giving me a hand, or two, as soon as I needed when handling the animals. My office mates, Maria and Pauke, for making the long days easier and friends for making this two years amazing. Specially, to Libe for being there during great and also hard moments.
44
45
References
Arzoumanian, L. (2003). What is hemolysis? Tech Talk. 2; 1-2. Blix, A. S. (2005). Arctic Animals and their Adaptations to Life on the Edge. Trondheim,
Norway. Tapir Academic Press. Blix, A. S., Iversen, J. A., & Paasche, A. (1973). On the feeding and health of young
hooded seals (Cystophora cristata) and harp seals (Pagophilus groenlandicus) in captivity. Norw. J. Zool. 21; 55-58.
Blix, A. S., Walloe, L., Messelt, E. B., & Folkow, L. P. (2010). Selective brain cooling and its vascular basis in diving seals. J. Exp. Biol. 213; 2610-2616.
Bray, G. A. (1960). A simple efficient liquid scintillator for counting aqueous solutions in a liquid scintillation counter. Anal. Biochem. 1; 279-285.
Brunborg, L. A., Julshamn, K., Nortvedt, R., & Frøyland, L. (2006). Nutritional composition of blubber and meat of hooded seal (Cystophora cristata) and harp seal (Phagophilus groenlandicus) from Greenland. Food Chem. 96; 524-531.
Chow, G. C., & Lin, A.-l. (1971). Linear unbiased interpolation,distribution and extrapolation of time series by related series. Rev. Econ. Stat. 53; 372-375.
Depocas, F., Hart, J. S., & Fisher, H. D. (1971). Sea water drinking and water flux in starved and in fed harbour seals, Phoca vitulina. Can. J. Physiol. Pharmacol. 49; 53-62.
Fetcher Jr, E. S., & Fetcher, G. W. (1942). Experiments on the osmotic regulation of dolphins. Cell. Comp. Physiol. 19; 123-130.
Fetcher Jr., E. S. (1939). The water balance in marine mammals. Q. Rev. Biol. 14; 451-459.
Folkow, L. P., & Blix, A. S. (1987). Nasal heat and water exchange in grey seals. Am. J. Physiol. (Regulatory Integrative Comp. Physiol.) 22; R883-R889.
Folkow, L. P., Mårtensson, P.-E., & Blix, A. S. (1996). Annual distribution of hooded seals (Cystophora cristata) in Greenland and Norwegian seas. Polar. biol. 16; 179-189.
Folkow, L. P., Nordøy, E. S., & Blix, A. S. (2010). Remarkable development of diving performance and migrations of hooded seal (Cystophora cristata) during their first year of life. Polar. Biol. 33; 433-441.
Gröning, M., & Rozanski, K. (2003). Uncertainity assessment of environmental measurements of tritium in water. Accred. Qual. Assur. 8; 359–366.
Harcourt, R. G., Turner, E., Hall, A., Waas, J. R., & Hindell, M. (2010). Effect of capture stress on free-ranging, reproductively active male Weddell seals. J. Comp. Physiol. A. 196; 147-154.
Haug, T., Nilsen, K. T., Lindblom, L., & Lindstrøm, U. (2007). Diet of hooded seals (Cystophora cristata) in coastal water and drift ice waters along the east coast of Greenland. Mar. Biol. 3; 123-133.
Hill, R. W., Wise, G. A., & Anderson, M. (2012). Animal Physiology. Sunderland, Massachusetts, USA. Sinauer Associates.
Hong, S. k., Elsner, R., Claybaugh, J. R., & Ronald, K. (1982). Renal Functions of the Baikal Seal Pusa sibirica and Ringed Seal Pusa hispida. Physiol. Zool. 55; 289-299.
How, O.-J., & Nordøy, E. S. (2007). Seawater drinking restores water balance in dehydrated harp seals. J. Comp. Physiol. B. 177; 535-542.
46
Irving, L., Fisher, K. C., & McIntosh, F. C. (1935). The water balance of a marine mammal, the seal. J. Cell. Comp. Physiol. 6; 387-391.
Jakobsen, I. (2011). Feilkilder ved bruk av tritiert vannmetode på fastende klappmyss (Cystophora cristata). Tromsø, Norway. Universitetet i Tromsø. Pp.
Kennedy, C., Angermuller, S., King, R., Noviello, S., Walker, J., Warden, J., et al. (1996). A comparison of hemolysis rates using intrvenous catheters versus venipuncture tubes for obtaining blood samples. J. Emerg. Nurs. 22; 566-569.
Kleiber, M. (1961). The Fire of Life. An Introduction of Animal Energetics. New York, USA. John Wiley & Sons, Inc. Pp. 454.
Kovacs, K. M. (2008). Hooded Seal. Pp. 569-573 in Encyclopedia of Marine Mammals (Perrin, W. F. ed). Academic Press.
L'Annunziata, M. F. (2003). Handbook of radioactivity analysis. United States. Academic Press.
Lester, C. W., & Costa, D. P. (2006). Water conservation in fasting northern elephant seals (Mirounga angustirostris). J. Exp. Biol. 209; 4283-4294.
Lifson, N., & McClintock, R. (1966). Theory of use of the turnover rates of body water for measuring energy and material balance. J. Theoret. Biol. 12; 46-74.
Mangos, G. J., Walker, B. R., Kelly, J. J., Lawson, J. A., Webb, D. J., & Withworth, J. A. (2000). Cortisol inhibits cholinergic vasodilatation in human forearm. Am. J. Med. 13; 1155-1160.
Matsuura, D. T., & Whittow, G. C. (1973). Evaporative heat loss in California sea lions and harbor seal. Comp. Biochem. Physiol. 48(A); 9-20.
McMahon, C., van den Hoff, J., & Burton, H. (2005). Handling intensity and short- and long-term survival of elephant seals: addressing and quantifying research effects on wild animals. Ambio. 34; 426-429.
Nagy, K. A., & Costa, D. P. (1980). Water flux in animals: analysis of potential errors in the tritiated water method. Am. J. Physiol. 238; R454-R465.
Nordøy, E. S., Aakvaag, A., & Larsen, T. S. (1993). Adaptations to fasting in harp seal pups. Physiol. Zool. 66; 926-945.
Nordøy, E. S., Ingebretsen, O. C., & Blix, A. S. (1990). Depressed metabolism and low protein catabolism in fasting grey seal pups. Acta. Physiol. Scand. 139; 361-369.
Nordøy, E. S., Stijfhoorn, D. E., Råheim, A., & Blix, A. S. (1992). Water flux and early signs of entrance into phase III of fasting in grey seal pups. Acta. Physiol. Scand. 144; 477-482.
Ortiz, C. L., Costa, D., & Le Boeuf, B. J. (1978). Water and energy flux in elephant seal pups fasting under natural conditions. Physiol. Zool. 51; 166-178.
Ortiz, R. M. (2001). Osmorregulation in marine mammals. J. Exp. Biol. 204; 1831-1844. Reilly, J. J., & Fedak, M. A. (1990). Measurement of the body composition of living gray
seals by hydrogen isotope dilution. J. Appl. Physiol. 69; 885-891. Renouf, D., Noseworthy, E., & Scott, M. C. (1990). Daily fresh water consumption by
captive harp seals (Phoca groenlandica). Mar. Mammal. Sci. 6; 253-257. Schmidt-Nielsen, K. (1979). Animal physiology. Adaptations and environment (2nd ed.).
Cambridge, UK: Cambridge university press. Sepall, O., & Mason, S. G. (1960). Vapour/liquid partition of tritium in tritiated water.
Can. J. Chem. 38; 2024-2025. Sergeant, D. E. (1976). History and present status of populations of harp and hooded
seals. Biol. Conserv. 10; 95-118.
47
Skalstad, I., & Nordøy, E. S. (2000). Experimental evidence of seawater drinking in juvenile hooded (Cystophora cristata) and harp (Phoca groenlandica). J. Comp. Physiol. B. 170; 395-401.
Skog, E. B., & Folkow, L. P. (1994). Nasal heat and water exchange is not an effector mechanism for water balance regulation in grey seals. Acta. Physiol. Scand. 151; 233-240.
Storeheier, P. V., & Nordøy, E. S. (2001). Physiological effects of seawater intake in adult harp seals during phase I of fasting. Comp. Biochem. Phys. A. 118; 307-315.
Tarasoff, F. J., & Toews, D. P. (1972). Tho osmotic and ionic regulatory capacities of the kidney of the harbor seal, Phoca vitulina. J. Comp. Physiol. 81; 121-132.
Verlo, A. (2012). Seawater consumption in dehydated hooded seals (Cystophora cristata). Master Thesis, UiT.
Wolf, A. V., Pentiss, P. G., Douglas, L. G., & Swett, R. J. (1959). Potability of seawater with special reference to the cat. Am. J. Physiol. 196; 633-641.