Artículo / Article Estimadores de muestreo para inventario de plantaciones forestales comerciales de eucalipto en el sureste mexicano Sampling estimators for an inventory of commercial eucalyptus forest plantations in southeastern Mexico María Angélica Roldán-Cortés 1 , Héctor Manuel De Los Santos-Posadas 1 , Hugo Ramírez-Maldonado 2 , José René Valdez-Lazalde 1 , Gregorio Ángeles-Pérez 1 y Alejandro Velázquez-Martínez 1 Resumen El estudio se desarrolló con datos de las plantaciones de Eucalyptus urophylla propiedad de la empresa Forestaciones Operativas de México S. A. de C. V., establecidas en los municipios de Agua Dulce y Las Choapas, en el estado de Veracruz. En un inventario forestal se busca el balance entre el costo mínimo de implementación y la confiabilidad y precisión estadística máximas. Este balance es crítico particularmente en inventarios de plantaciones forestales de superficies extensas. El presente estudio toma como base datos de inventarios operativos para evaluar diversos estimadores de muestreo clásico en plantaciones forestales comerciales de eucalipto con el fin de determinar un esquema óptimo que tome en cuenta el error de muestreo máximo permisible y al mismo tiempo permita reducir los costos. Los resultados sugieren que el estimador mejor evaluado para esta población fue uno de proporciones (razón) volumen total y edad estratificado a nivel de clases de edad. En precisión resultó ser el estimador de razón de volumen total y del área basal con estratificación a nivel de predios. Para el primer caso, en un umbral de 5 % de error de muestreo, es posible reducir el tamaño de muestra en 84.7 %; en el segundo, la reducción puede ser de 89.9 %. Palabras clave: Estimador, Eucalyptus urophylla S.T. Blake, inventario forestal, método de muestreo, plantación forestal, razón estratificada. Abstract This study is based on data from Eucalyptus urophylla plantations, property of Forestaciones Operativas de México S. A. de C. V., established in the municipalities of Agua Dulce and Las Choapas, in the state of Veracruz. A forest inventory seeks balance between the minimum implementation cost and the maximum confidence levels and statistical accuracy. This balance is critical, particularly in in- ventories of forest plantations on extensive lands. This study draws upon data from operative inventories to evaluate various estimators of classic samplings in commercial eucalyptus forest plantations in order to determine an optimal scheme that may take into account the maximum permissible sampling error and at the same time allow cost reduction. The results suggest that the estimator regarded as the best for this population was the total volume/age proportion (ratio), stratified by age classes. The total volume/baseline area ratio stratified by plots proved to be the most accurate. For the first case, within a 5 % sampling error threshold, it is possible to reduce the sample size by 84.7 %; in the second, it can be reduced by 89.9 %. Key words: Estimator, Eucalyptus urophylla S.T. Blake, forest inventory, sampling method, forest plantation, stratified ratio. Fecha de recepción/date of receipt: 20 de febrero de 2013; Fecha de aceptación/date of acceptance: 6 de marzo de 2013. 1 Programa Forestal. Colegio de Postgraduados. Correo-e: [email protected]. 2 División de Ciencias Forestales. Universidad Autónoma Chapingo.
Transcript
Artículo / Article
Estimadores de muestreo para inventario de plantaciones forestales comerciales de eucalipto en el sureste mexicano
Sampling estimators for an inventory of commercial eucalyptus forest plantations in southeastern Mexico
María Angélica Roldán-Cortés1, Héctor Manuel De Los Santos-Posadas1, Hugo Ramírez-Maldonado2, José René Valdez-Lazalde1, Gregorio Ángeles-Pérez1 y Alejandro Velázquez-Martínez1
Resumen
El estudio se desarrolló con datos de las plantaciones de Eucalyptus urophylla propiedad de la empresa Forestaciones Operativas de México S. A. de C. V., establecidas en los municipios de Agua Dulce y Las Choapas, en el estado de Veracruz. En un inventario forestal se busca el balance entre el costo mínimo de implementación y la confiabilidad y precisión estadística máximas. Este balance es crítico particularmente en inventarios de plantaciones forestales de superficies extensas. El presente estudio toma como base datos de inventarios operativos para evaluar diversos estimadores de muestreo clásico en plantaciones forestales comerciales de eucalipto con el fin de determinar un esquema óptimo que tome en cuenta el error de muestreo máximo permisible y al mismo tiempo permita reducir los costos. Los resultados sugieren que el estimador mejor evaluado para esta población fue uno de proporciones (razón) volumen total y edad estratificado a nivel de clases de edad. En precisión resultó ser el estimador de razón de volumen total y del área basal con estratificación a nivel de predios. Para el primer caso, en un umbral de 5 % de error de muestreo, es posible reducir el tamaño de muestra en 84.7 %; en el segundo, la reducción puede ser de 89.9 %.
This study is based on data from Eucalyptus urophylla plantations, property of Forestaciones Operativas de México S. A. de C. V., established in the municipalities of Agua Dulce and Las Choapas, in the state of Veracruz. A forest inventory seeks balance between the minimum implementation cost and the maximum confidence levels and statistical accuracy. This balance is critical, particularly in in-ventories of forest plantations on extensive lands. This study draws upon data from operative inventories to evaluate various estimators of classic samplings in commercial eucalyptus forest plantations in order to determine an optimal scheme that may take into account the maximum permissible sampling error and at the same time allow cost reduction. The results suggest that the estimator regarded as the best for this population was the total volume/age proportion (ratio), stratified by age classes. The total volume/baseline area ratio stratified by plots proved to be the most accurate. For the first case, within a 5 % sampling error threshold, it is possible to reduce the sample size by 84.7 %; in the second, it can be reduced by 89.9 %.
Fecha de recepción/date of receipt: 20 de febrero de 2013; Fecha de aceptación/date of acceptance: 6 de marzo de 2013.1 Programa Forestal. Colegio de Postgraduados. Correo-e: [email protected] División de Ciencias Forestales. Universidad Autónoma Chapingo.
Roldán-Cortés et al., Estimadores de muestreo para inventario de plantaciones...
39
Introduction
Most inventories of forest resources resort to design-based classic sampling tools (simple random and stratified sampling estimators) and model-based estimators (regression and proportion estimators), which, depending on the type of data collected in field (in sites with fixed or varying dimensions, also known as the Bitterlich sampling technique), it is possible to attain various levels of accuracy (Ruíz, 1982; Schreuder et al., 1992). These estimators may be combined with information from remote sensors to obtain interest population estimates (Schreuder et al., 2006; Köhl et al., 2006; Aguirre-Salado et al., 2009). There are, besides, estimators based on non-parametric techniques –e.g. re-sampling (the Bootstrap and Jackknife methods)–, on the game theory, like the Monte Carlo estimators (Manly, 1997), or on geostatistics (Loukas et al., 1998; Renard et al., 2004), as well as on Bayesian methods (Manly 1997; Köhl et al., 2006); these procedures are considered to be some of the main contributions of the statistical theory to forest inventory estimation.
Forest inventories carried out through sampling have a two-fold purpose: 1) to obtain reliable results for planning forestry activities, and 2) to reduce the cost and time of the data collection. Although these two goals may appear to be opposed, they can both be attained using robust estimators and inventory data (Schreuder et al., 2006).
In 2007, Forestaciones Operativas de México S. A. de C. V. (FOMEX), an enterprise that owns the most important eucalyptus plantations in Mexico, the improvement of inventory protocols –from the in-field data collection to the analysis of these data– was proposed as a strategy of interest. This enterprise carries out a yearly inventory based on the systematic sampling of a total surface of approximately 10 000 ha, it set out to explore methodologies considered as a classic sampling, i.e. traditional, regularly utilized methods, like the simple random sampling, the stratified sampling, and the ratio and regression estimators, which allow quantifying the timber in a nearly optimal way, reducing measurement costs and with a level of accuracy that meets the expectations of the enterprise.
Within this context, this study tested various sampling estimators, by comparing and analyzing them, in order to define which estimators can be utilized to carry out the inventory of FOMEX-owned Eucalyptus urophylla S. T. Blake commercial forest plantations at a reduced cost.
Materials and Methods
Study area
The study was developed using data from FOMEX-owned Eucalyptus urophylla plantations established in the municipalities
Introducción
La mayoría de los inventarios de recursos forestales recurren a herramientas de muestreo clásico basado en diseño (estimadores de muestreo simple al azar y muestreo estratificado) y estimadores basados en modelos (estimadores de regresión y proporción), que dependiendo del tipo de datos tomados en campo (sitios de dimensiones fijas o de dimensiones variables, también conocido como muestreo de Bitterlich), es factible obtener diferentes niveles de precisión (Ruíz, 1982; Schreuder et al., 1992). Estos estimadores se pueden combinar con información procedente de sensores remotos para obtener estimaciones de la población de interés (Schreuder et al., 2006; Köhl et al., 2006; Aguirre-Salado et al., 2009). Existen, además, las basadas en técnicas no paramétricas como el re-muestreo (métodos Bootstrap y Jackknife) (Köhl et al., 2006), las fundamentadas en la teoría de juegos como los estimadores Monte Carlo (Manly, 1997), o en la teoría geoestadística (Loukas et al., 1998; Renard et al., 2004) y también los métodos bayesianos (Manly, 1997; Köhl et al., 2006); estas procedimientos se cuentan entre los aportes más importantes de la teoría estadística a la estimación del inventario forestal.
Al realizar un inventario forestal a través del muestreo se buscan dos objetivos: 1) obtener resultados confiables para la planeación de las actividades silvícolas y 2) que los costos y tiempos de la toma de información sean reducidos. Aunque en apariencia antagónicos, ambos se pueden atender al emplear estimadores robustos e información del inventario (Schreuder et al., 2006).
En 2007, Forestaciones Operativas de México S. A. de C. V. (FOMEX), empresa que tiene las plantaciones de eucalipto más importantes de México, se planteó como estrategia de interés la mejora en los protocolos del inventario, desde la toma de datos en campo hasta el análisis de los mismos. A partir de que esta empresa realiza cada año el levantamiento con base en un muestreo sistemático de una superficie total de 10 000 ha, aproximadamente, se propuso explorar metodologías que consideran un muestreo clásico, es decir, métodos tradicionales y regularmente utilizados, como es el caso del muestreo simple al azar, el estratificado y los estimadores de razón y regresión, que permiten la cuantificación de la madera de manera cercana al óptimo, reduciendo costos en mediciones y con una precisión que satisfaga las expectativas de la empresa.
Es en este contexto que en el presente trabajo se probaron diversos estimadores de muestreo para definir el inventario de las plantaciones forestales comerciales de Eucalyptus urophylla S. T. Blake, propiedad de FOMEX, que mediante una comparación y análisis de los mismos, determine cuál o cuáles harán posible lo anterior y a un costo menor al actual.
Rev. Mex. Cien. For. Vol. 5 Núm. 26
40
Materiales y Métodos
Área de estudio
El estudio se desarrolló con datos de las plantaciones de Eucalyptus urophylla propiedad de la empresa FOMEX, establecidas en los municipios de Agua Dulce y Las Choapas, en el estado de Veracruz (17°55’ norte y 94°06’ oeste) con clima cálido-regular y temperatura promedio de 27 °C. Los temas de vegetación en el municipio son selva baja perennifolia y caducifolia (Méndez et al., 2008; Pérez et al., 2009). Otra parte de las plantaciones está ubicada en la región de Huimanguillo, Tabasco (17°19’ norte y 93°23’ oeste), donde el clima predominante es cálido-húmedo con abundantes lluvias en verano y temperatura media anual de 26.2 °C, con máximas hasta de 45 °C. En la zona existen áreas con vegetación diversa, entre la que destaca la selva alta perennifolia (Méndez et al., 2008; Velázquez et al., 2009; Conafor, 2009).
Datos dasométricos
Se establecieron sitios rectangulares de 20 m de ancho por 25 m de largo (500 m2) separados por 200 m entre sí de forma sistemática, aunque este sistema de muestreo no es probabilístico, permite una distribución uniforme y equidistante de la muestra. En cada sitio se contaron los árboles y se les midió el diámetro normal y la altura total; con forcípula (Haglöf Mantax de treinta pulgadas) o cinta diamétrica (Forestry Suppliers Steel Diameter Tape 343D) y con clinómetro Suunto PM5/360PCe.
Se utilizaron dos bases de datos de mediciones realizadas en 2008 y 2009 en 144 predios, con plantaciones de diferentes edades, lo que dio un total de 1 288 sitios. En la base del inventario de 2008 se incluyeron 49 predios que acumulan 2 196 ha y edades de 1 a 14 años, con 351 sitios de muestreo. Respecto a la base del año 2009, se trabajó en 135 predios con una superficie de 4 784 ha y se muestrearon 937 sitios con edades que entre 1 y 14 años. Para calcular la cantidad de madera de los sitios se utilizaron las ecuaciones de volumen locales propias de FOMEX.
Estimadores muestrales
Para determinar el inventario de las plantaciones de FOMEX, se manejaron estimadores que surgieron del muestreo clásico, tales como el muestreo simple al azar, el estratificado, el de razón y regresión y el de razón bajo estratificación (Sukhatme, 1956; Sukhatme y Sukhatme, 1970; Villa, 1971), estos últimos han sido poco usados en México para inventarios forestales. Para evaluar la eficiencia de dichos estimadores se partió de dos medidas de muestreo: la primera, el error de muestreo (o
of Agua Dulce and Las Choapas, in the state of Veracruz (17°55’ north and 94°06’ west), with a warm-temperate climate and an average temperature of 27 °C. The predominant vegetation in the area consists of low evergreen and deciduous rain forests (Méndez et al., 2008; Pérez et al., 2009). Another part of the plantations is located in the Huimaguillo region, in Tabasco (17°19’ north and 93°23’ west), which has a predominantly warm-humid climate with abundant summer rains and a mean annual temperature of 26.2 °C, with maximum temperatures of up to 45 °C. This region includes areas with a varied vegetation, among which tall perennial forests are prevalent (Méndez et al., 2008; Velázquez et al., 2009; Conafor, 2009).
Dasometric data
20 m wide and 25 m long (500 m2) rectangular sites were systematically established, separated by a regular distance of 200 m; although this sampling system is not probabilistic, it allows a uniform, equidistant distribution of the sample. The trees in each site were counted, and their normal diameter and total height were measured using a 30 inch caliper (Haglöf Mantax ) or a measuring tape (Forestry Suppliers Steel Diameter Tape343D) and a Suunto PM5/360PCe clinometer .
Two databases of measurements carried out in 2008 and 2009 were used; the measurements were made in 144 plots with plantations of various ages, in a total of 1 288 sites. The database of the 2008 inventory includes 49 plots, which add up to 2 196 ha and cover ages between 1 and 14 years, with 351 sampling sites. As for the 2009 database, the measurements were made in 135 plots with a surface of 4 784 ha, which included 937 sampling sites; the ages of the plantations ranged between 1 and 14 years. Local volume equations of FOMEX were used to calculate the amount of timber in the sites.
Sampling estimators
Estimators based on classic sampling –such as simple random, stratified, ratio, regression, and ratio with stratification samplings– were utilized to determine the inventory of the FOMEX plantations (Sukhatme, 1956; Sukhatme and Sukhatme, 1970; Villa, 1971). The latter have seldom been used in Mexico for forest inventories. Assessment of the efficiency of these estimators was based on two sampling measurements: sampling error (or accuracy in relation to the mean) and sampling size at various levels of sampling error, both with a statistical confidence interval of 95 %. These simple measures allow assessment of the efficiency with which the total variance is grouped under a particular estimator and sampling design. Based on the results thus obtained, an in-field sampling strategy (sampling estimators) is suggested that will favor the reduction of the inventory’s total cost.
Roldán-Cortés et al., Estimadores de muestreo para inventario de plantaciones...
41
Simple Random Sampling (SRS)
The SRS assumes that n sampling units are selected at random from the n units present in the population in such a way that the combination of the n units is equally likely to become the selected sample (Kish, 1975; Cochran, 1977; Kish, 1995; Thompson, 2002). The value of the ith sampling unit is defined by the total volume of wood with bark per site (m3). Each inventory year was considered as a different population.
The formulas depicted in Table 1 describe the SRS estimators (Schumacher and Chapman, 1942; Sukhatme, 1956; Freese, 1962; Scheaffer et al., 1987; Särndal et al., 1992; Kish, 1995; Torres and Magaña, 2001; Thompson, 2002; Schreuder et al., 2006; Köhl et al., 2006):
Stratified sampling
According to this approach, the population is divided into non-overlapping populations known as strata (Schumacher and Chapman, 1942; Särndal, et al., 1992; Kish, 1995; Johnson, 2000; Thompson, 2002). In each stratum a (random or systematic) sample of independent inventory sites is selected
precisión respecto a la media) y la segunda, el tamaño de muestra a diferentes niveles de error de muestreo, ambos con una confiabilidad estadística de referencia de 95 %. Estas medidas sencillas permiten calificar qué tan eficientemente se agrupa la varianza total bajo cierto estimador y diseño de muestreo. A partir de los resultados obtenidos se sugiere una estrategia de muestreo (estimadores muestrales) en campo que favorecerá la reducción del costo total del inventario.
Muestreo Simple Aleatorio (MSA)
El MSA asume que las n unidades de muestreo son seleccionadas de las n unidades presentes en la población de manera aleatoria, de tal forma que la combinación de las n unidades es igualmente probable de ser la muestra seleccionada (Kish, 1975; Cochran, 1977; Kish, 1995; Thompson, 2002). El valor de la i-ésima unidad muestral está definido por el volumen total de madera con corteza por sitio (m3). Cada año de inventario se consideró como una población distinta.
Las fórmulas descritas en el Cuadro 1 describen los estimadores del MSA (Schumacher y Chapman, 1942; Sukhatme, 1956; Freese, 1962; Scheaffer et al., 1987; Särndal et al., 1992; Kish, 1995; Torres y Magaña, 2001; Thompson, 2002; Schreuder et al., 2006; Köhl et al., 2006):
Cuadro 1. Estimadores del Muestreo Simple Aleatorio.
Estimador Ecuación
Media muestral (1)
Varianza de la variable en la muestra (2)
Varianza de la media (3)
Inventario o Población Total (4)
Estimación del tamaño de muestra (5)
yi = Volumen con corteza en m3 en el i-ésimo sitio de muestreo; N = Número total de unidades de muestreo en la población; n = Número de unidades incluidas en la
muestra; B = Tamaño aceptable del error de estimación o de muestreo; t = Distribución t de Student.
Rev. Mex. Cien. For. Vol. 5 Núm. 26
42
(Cochran, 1977). Stratification reduces the variation within the stratum (Cochran, 1977; Bell, 1998). Therefore, the method requires strata to be as heterogenous as possible between each other but as homogenous as possible within each. Based on an improved inventory design grouping and weighing the variances, this method seeks to reduce the variance of the estimated mean (Sukhatme, 1956; Schumacher and Chapman, 1942; Villa and Caballero, 1976; Särndal, et al., 1992; Kish, 1995; Thompson, 2002).
It was decided to test two types of stratification for the study data: a) by plot, each being considered as equal to a stratum, and b) by age, defining each one-year age class as a stratum, as the age of most planted plots is counted in months. Although other stratification forms may be suggested, including soil type, the genetic material utilized, baseline density, etc., for the time being these two forms were considered the most helpful and sufficient for the management of the plantations.
The formulas in Table 2 were utilized to calculate the estimators for which the data of each stratum were systematically collected (Sukhatme, 1956; Freese, 1962; Cochran, 1977; Scheaffer et al., 1987; Särndal, et al., 1992; Kish, 1995; Thompson, 2002):
Stratified sampling allows allotting the sample to each stratum in various ways, resulting in different sample sizes according to the magnitude or size of the stratum, the variability of the sizes and the cost of measuring them; therefore, there are different estimation errors (Johnson, 2000).
Table 1. Simple Random Sampling Estimators.
Estimator Equation
Sample mean (1)
Variable variance in the sample (2)
Variance of the mean (3)
Total Inventory or Population (4)
Sample size estimation (5)
yi = Volume of wood with bark in m3 at the ith sampling site; N = Total number of sampling units in the population; n = Number of units included in the simple; B = Acceptable
size of the estimation or sampling error; t = Student’s t-distribution.
Muestreo Estratificado
En este enfoque, la población es dividida en sub-poblaciones no traslapadas llamadas estratos (Schumacher y Chapman, 1942; Särndal, et al., 1992; Kish, 1995; Johnson, 2000; Thompson, 2002). En cada estrato se selecciona una muestra (aleatoria o sistemática) de sitios de inventario, los cuales son independientes (Cochran, 1977). Con la estratificación se reduce la variación en el estrato (Cochran, 1977; Bell, 1998). Por lo tanto, el método requiere que los estratos sean lo más heterogéneo posible entre ellos pero lo más homogéneo posible dentro de cada uno. Este método busca, a partir de un mejor diseño del inventario que agrupa y pondera las varianzas, reducir la varianza de la media estimada a partir de la muestra (Sukhatme, 1956; Schumacher y Chapman, 1942; Villa y Caballero, 1976; Särndal, et al., 1992; Kish, 1995; Thompson, 2002).
Para los datos bajo estudio se decidió probar dos tipos de estratificación: a) Cada predio como estrato y b) Cada edad (clases de edad de 1 año) como estrato, ya que en la mayoría de los predios plantados se conoce la edad en meses. Aunque pueden sugerirse otras formas de estratificación, como tipo de suelo, material genético usado, densidad inicial utilizada, etc., por el momento para la administración de las plantaciones estas dos formas se consideraron las más útiles y suficientes.
Las fórmulas del Cuadro 2 se emplearon para obtener los estimadores en los que los datos en cada estrato se han recolectado de manera sistemática (Sukhatme, 1956; Freese, 1962; Cochran, 1977; Scheaffer et al., 1987; Särndal, et al., 1992; Kish, 1995; Thompson, 2002):
Roldán-Cortés et al., Estimadores de muestreo para inventario de plantaciones...
43
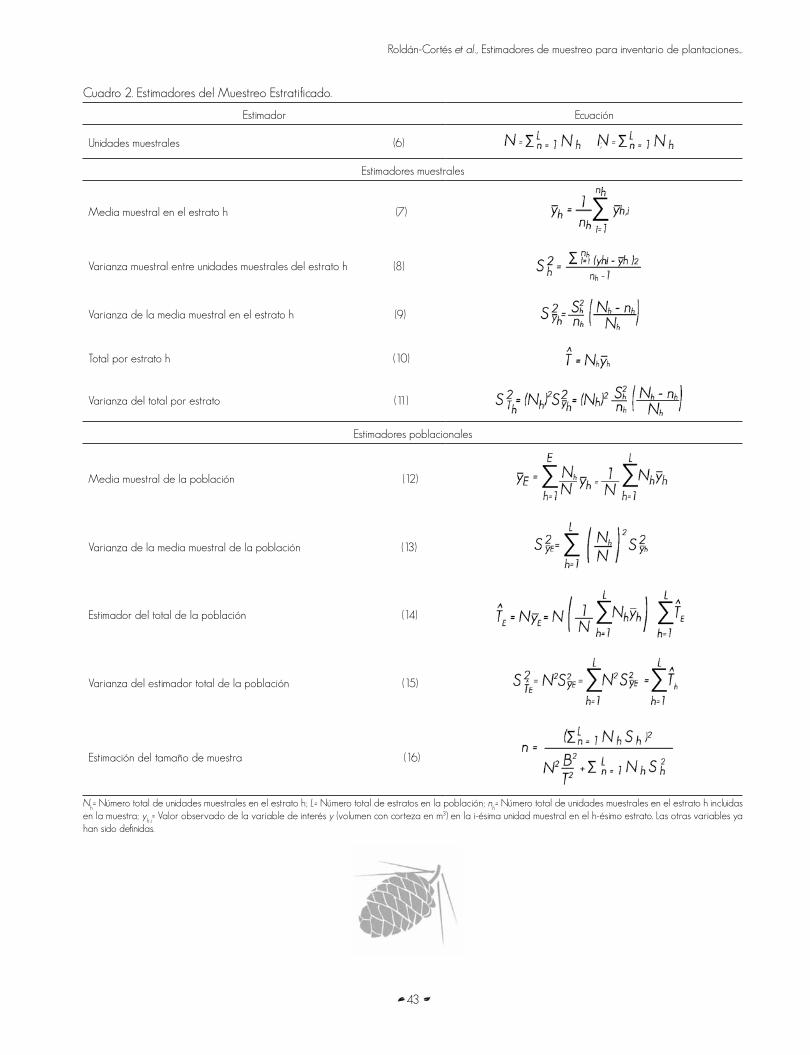
Cuadro 2. Estimadores del Muestreo Estratificado.
Estimador Ecuación
Unidades muestrales (6) ;
Estimadores muestrales
Media muestral en el estrato h (7)
Varianza muestral entre unidades muestrales del estrato h (8)
Varianza de la media muestral en el estrato h (9)
Total por estrato h (10)
Varianza del total por estrato (11)
Estimadores poblacionales
Media muestral de la población (12)
Varianza de la media muestral de la población (13)
Estimador del total de la población (14)
Varianza del estimador total de la población (15)
Estimación del tamaño de muestra (16)
Nh= Número total de unidades muestrales en el estrato h; L= Número total de estratos en la población; n
h= Número total de unidades muestrales en el estrato h incluidas
en la muestra; yh,i= Valor observado de la variable de interés y (volumen con corteza en m3) en la i-ésima unidad muestral en el h-ésimo estrato. Las otras variables ya
han sido definidas.
Rev. Mex. Cien. For. Vol. 5 Núm. 26
44
Table 2. Stratified Sampling Estimators.
Estimator Equation
Sampling units (6) ;
Sampling estimators
Sample mean in stratum h (7)
Sample variance between the sampling units of stratum h (8)
Variance of the simple mean in stratum h (9)
Total for stratum h (10)
Variance of the total for each stratum (11)
Population estimators
Population sample mean (12)
Variance of the population sample mean (13)
Total population estimator (14)
Variance of the total population estimator (15)
Sample size estimation (16)
Nh = Total number of sampling units in stratum h; L = Total number of strata in the population; n
h = Total number of sampling units in stratum h included in the
sample; yh,I
= Observed value of the interest variable y (volume of wood with bark in m3) in the ith sampling unit in the hth stratum. The other variables have already been defined.
El muestreo estratificado permite asignar la muestra a cada estrato de varias maneras, de lo que resultan tamaños diferentes de muestra según la magnitud o el tamaño del estrato, la variabilidad de los mismos y el costo por medirlos, por lo que se tienen diferentes errores de estimación (Johnson, 2000).
Ratio (Proportion) and Regression Estimators
The Proportion (Ratio) estimation method uses auxiliary information and, under certain conditions, provides estimations with higher levels of confidence and accuracy than simple averages. It is a more efficient method for estimating the population mean whenever the ratio between the interest variable (volume per
Roldán-Cortés et al., Estimadores de muestreo para inventario de plantaciones...
45
Estimadores de Razón (Proporción) y Regresión
El método de estimación de Proporción (Razón) usa información auxiliar y, bajo ciertas condiciones, proporciona estimaciones de mayor confiabilidad y precisión que los promedios simples. Es un método más eficaz para estimar la media poblacional si la relación entre la variable de interés (volumen por sitio) y una variable auxiliar dada (medida en el sitio) es lineal y pasa a través del origen, si están altamente correlacionadas. Estos estimadores son sesgados por definición, pero son precisos al tener varianzas reducidas. Cuando las condiciones anteriores se cumplen hacen que el sesgo desaparezca o sea muy pequeño como para considerarse significativo. En muestras grandes, los estimadores de razón serán más eficientes que los obtenidos con un muestreo basado en la media aritmética simple como en el MSA. Se requieren condiciones semejantes para el estimador de regresión pero en este caso no es necesario que la relación entre la variable principal y la variable auxiliar pase por el origen (Sukhatme, 1956; Scheaffer et al., 1987; Thompson, 2002).
Para lograr que el muestreo sea eficiente en términos de costo, es deseable que la variable auxiliar además sea fácil de medir (Köhl et al., 2006). El uso de estos estimadores no excluye extensiones lógicas como seria la estratificación, esto se discute más adelante (Thompson, 2002). En este primer caso, en ambos estimadores el diseño asumido es claramente bajo MSA.
Uno de los supuestos básicos para el uso de este tipo de estimadores es que el valor de la variable auxiliar a nivel poblacional es conocido sin error de muestreo; esto es posible en ciertos casos, pero en ocasiones es necesario asumir un valor muestral como verdadero, dependiendo de la información disponible de la variable auxiliar. Para este estudio se probaron dos variables auxiliares: el área basal y la edad, misma que cumple con los supuestos del estimador ya que en cada predio se tiene el registro de la fecha de plantación. En el área basal se utiliza como media poblacional el valor de la estimación bajo estratificación, que debe ser estadísticamente más precisa que la obtenida mediante el MSA.
Se puede apreciar que el estimador de razón implica la construcción de una nueva variable aleatoria, que en muchos casos tiene implicaciones prácticas para el inventario forestal. Si el cociente utilizado es el volumen total sobre el área basal existe, entonces, una proporción que describe la cantidad de m3 en pie por cada m2 de área basal, de modo que si se conoce de manera precisa el área basal, la estimación del volumen total es fácil de determinar. Así, la proporción volumen-edad-1 (años) permitirá obtener una medida del crecimiento anual esperado. Las fórmulas del Cuadro 3 se utilizaron para calcular sus valores estimados (Scheaffer et al., 1987; Thompson, 2002; Kölh et al., 2006).
site) and a given auxiliary variable (measured in the site) is linear and passes through the origin, if they are highly correlated. These estimators are biased by definition, but they are accurate, since they have limited variances. When the previous conditions are met, they eliminate or greatly reduce the bias, and therefore it cannot be considered significant. In large samples, the ratio estimators will be more efficient than those obtained using a sampling based on the simple arithmetic mean as with SRS. Similar conditions are required for the regression estimator, but in this case it is not necessary for the main variable and the auxiliary variable to pass through the origin (Sukhatme, 1956; Scheaffer et al., 1987; Thompson, 2002).
Ideally, in order to carry out a cost-effective sampling, the auxiliary variable should also be easy to measure (Köhl et al., 2006). The use of these estimators does not include logical extensions like stratification; this is discussed below (Thompson, 2002). In this first case, the design assumed is clearly SRS-based for both estimators.
One of the basic assumptions for using this type of estimators is that it allows calculating the value of the auxiliary variable at a population level without sampling error; this may be so in certain cases; however, sometimes it is necessary to assume a sample value as true, depending on the available information on the auxiliary variable. For this study, two auxiliary variables were tested: the baseline area and the age; the latter meets the assumptions for the estimator, since there are records of the plantation date for each plot. For the baseline area, the utilized population mean is the value estimated under stratification, which must be statistically more accurate than that obtained using SRS.
The ratio estimator entails the construction of a new random variable, which in many cases has practical implications for the forest inventory. If the utilized ratio is the total volume divided by the baseline area, then there is a proportion that describes the number of m3 of standing volume for each m2 of baseline area, and therefore the total volume can be easily estimated if the baseline area is accurately known. Thus, the volume-age-1 (years) ratio made it possible to obtain a measure of the annual expected growth. The formulas in Table 3 were used to calculate the estimated values of these variables (Scheaffer et al., 1987; Thompson, 2002; Kölh et al., 2006).
Rev. Mex. Cien. For. Vol. 5 Núm. 26
46
Cuadro 3. Estimadores de Razón (proporción) y Regresión.
Estimador Ecuación
Razón (17)
Estimadores de Razón
Estimador de Razón (18)
Media (19)
Varianza de la Razón (20)
Varianza de la Media (21)
Tamaño de muestra (22)
Estimadores de Regresión
Media (23)
Pendiente (24)
Varianza de la Media (25)
Tamaño de muestra (26)
µy = Media poblacional de la variable de interés (principal);
µ
x= Media poblacional de la variable auxiliar; = Tamaño aceptable del error de estimación o de
muestreo; LREG
= Tamaño aceptable del error de estimación o de muestreo respecto a . Las otras variables ya han sido definidas.
Roldán-Cortés et al., Estimadores de muestreo para inventario de plantaciones...
47
Table 3. Ratio (Proportion) and Regression Estimators.
Estimator Equation
Ratio (17)
Ratio Estimators
Ratio Estimator (18)
Mean (19)
Variance of the Ratio (20)
Variance of the Mean (21)
Sample size (22)
Regression estimators
Mean (23)
Slope (24)
Variance of the Mean (25)
Sample size (26)
µy = Population mean of the variable of interest (main variable); µ
x= Population mean of the auxiliary variable; = Acceptable size of the estimation or sampling error;
LREG
= Acceptable size of the estimation or sampling error with regard to . The other variables have already been defined.
Rev. Mex. Cien. For. Vol. 5 Núm. 26
48
En la estimación de la media poblacional (Ecuación 18) destaca la importancia de conocer con la mayor precisión posible el valor de la media poblacional de la variable auxiliar. Este valor funciona como un factor de ajuste de la media dependiendo del cociente . Si ; por consecuencia, de la correlación entre variables, se tiene un menor valor de la de interés y, por lo tanto, el uso de MSA hubiera sub-estimado el valor de la población. En el caso contrario, implica que el muestreo realizado tendería a sobre-estimar la población de interés (Shiver et al., 1996; Lohr, 2010). El muestreo se realiza bajo un esquema de MSA, por lo que el cálculo del tamaño de muestra se puede hacer con la ecuación 22.
De manera similar al estimador de razón, los estimadores de regresión compensan por exceso (por arriba) o por defecto (por abajo) de la media, pero en este caso es a través de una adición que tiene como base la pendiente de regresión (Shiver et al., 1996). A diferencia de ellos, funcionan más eficientemente cuando la relación entre la variable principal y la variable auxiliar no pasa por el origen (Shiver et al., 1996). A continuación se presentan los estimadores de regresión (Cuadro 3) que al igual que los de razón asumen que la muestra obtenida fue bajo MSA (Schreuder et al., 2006).
Estimadores de Razón bajo Estratificación
Los estimadores de razón bajo estratificación ofrecen una estimación satisfactoria del total de la población si el tamaño de la muestra dentro de cada estrato es suficientemente grande (usualmente mayor a 30, aunque dependerá de la naturaleza de la población muestreada y del grado de aproximación a la distribución normal requerida) y se trabaja con el apoyo de una razón ponderada (Sukhatme, 1956). Es posible, sin embargo, usar razones por estrato, pero se necesitaría todavía mayor tamaño muestral por estrato. Este estudio se enfocó solamente a los estimadores basados en la razón ponderada.
La estratificación propuesta así como las variables auxiliares utilizadas permitieron realizar la estimación poblacional de la manera siguiente:
• Estratificación por predio y uso de razones de Volumen Área basal-1
• Estratificación por edad (clase de edad) y uso de razones de Volumen Edad-1 (Edad exacta)
Los estimadores utilizados en este caso son (Cochran, 1977; Kölh et al., 2006) como se muestra en el Cuadro 4:
In regard to the population mean (Equation 18), it is crucial to know the value of the population mean of the auxiliary variable as accurately as possible. This value works as a mean adjustment factor, depending on the ratio. If , then the correlation between the variables has a lower value than the variable of interest and, therefore, the use of SRS would have resulted in an underestimation of the value of the population. In the opposite case, implies that the sampling will tend to overestimate the population of interest (Shiver et al., 1996; Lohr, 2010). The sampling is performed using an SRS scheme, and therefore the sample size can be determined using equation 22.
Like the ratio estimators, the regression estimators compensate for excess or defect (i.e. for values above or below the mean); however, in this case they do so through an addition based on the regression slope (Shiver et al., 1996). Unlike them, these estimators work more efficiently when the relationship between the main variable and the auxiliary variable does not pass through the origin (Shiver et al., 1996). Below (in Table 3) we show the regression estimators, which, like ratio estimators, assume that the sample was obtained using SRS (Schreuder et al., 2006).
Ratio Estimators under Stratification
The ratio estimators under stratification offer a satisfactory estimate of the total population provided that the sample from each stratum is large enough (usually over 30, although it will depend upon the nature of the sampled population and the degree of approximation to the normal distribution required), and that a weighted ratio is used (Sukhatme, 1956). It is possible to use ratios per stratum, but an even larger sample size per stratum would be required. This study focused only on the estimators based on the weighted ratio.
The proposed stratification and the auxiliary variables utilized allowed estimation of the population as follows:
• Stratification per plot and use of ratios of volume to baseline area ratios-1
• Stratification by age (age class) and use of ratios of volume to age-1 (exact age)
The estimators used in these cases (Cochran, 1977; Kölh et al.,
2006) are shown in Table 4:
Roldán-Cortés et al., Estimadores de muestreo para inventario de plantaciones...
49
Cuadro 4. Estimadores de Razón Estratificada.
Estimador Ecuación
Media (27)
Varianza (28)
Tamaño de muestra (29)
Table 4. Stratified Ratio Estimators.
Estimator Equation
Mean (27)
Variance (28)
Sample size (29)
Rev. Mex. Cien. For. Vol. 5 Núm. 26
50
Estimación del tamaño de muestra
De estos estimadores que combinan la estimación basada en modelos con un diseño de muestreo estratificado se decidió adaptar la fórmula de muestreo estratificado pero remplazando ad hoc los valores de de la ecuación 29 para el muestreo con estimadores de razón ponderada y los valores obtenidos con dicha expresión se sustituyen en la fórmula 16 con el mismo criterio de amplitud basado en el inventario.
Criterios de evaluación
Con la finalidad de definir cuál escenario de los métodos de muestreo probados fue el más recomendable, así como las ventajas que resultan de su aplicación, se consideró en primer lugar la precisión estimada al 95 % de confiablidad. Adicionalmente, se calculó el tamaño de muestra en intervalos por debajo de 10 % a fin de ofrecer una gama amplia de posibilidades sobre la intensidad de muestreo que se desea utilizar.
Resultados y Discusión
Volumen total y las variables auxiliares
Para las mediciones de 2008, los datos de volumen (m3 sitio-1) respecto al área basal en m2 sitio-1 tuvieron una correlación de 0.97 y a la edad en años, la correlación fue de 0.73; para el grupo de edades, la mayor cantidad de individuos pertenece a las clases de 4 a 6 años y de 8 a 10 años. Para 2009, la correlación entre el área basal (m2 sitio-1) y el volumen (m3 sitio-1) en el inventario fue de 0.97; la de edad respecto al volumen fue de 0.81.
Estos resultados sugieren que el área basal es fuerte candidata para usarse como variable auxiliar en la estimación del inventario, ya sea a través de estimadores de razón o de regresión.
En los resultados obtenidos por estimador muestral, los cuadros 5 y 6 muestran los valores estimados: media, varianza, inventario (existencias maderables totales), precisión y tamaños de muestra sugeridos para dos precisiones comunes en los datos tomados en el 2008 y 2009.
Sample size estimation
It was decided to adapt the formula of the stratified sampling from these estimators, which combine the model-based estimation with a stratified sampling design, through the ad hoc replacement, however, of the values of equations 29 for the sampling with weighted ratio estimators and the values obtained by means of this expression are substituted in formula 16 using the same width criterion based on the inventory.
Evaluation criteria
In order to determine which of the sampling method scenarios was the most recommendable, as well as the advantages resulting from its application, the accuracy estimated with a 95 % confidence interval was first considered. Furthermore, the sample size was estimated in intervals below 10 % in order to offer a broad range of possibilities above the desired sampling intensity.
Results and Discussion
Total volume and auxiliary variables
For the 2008 measurements, the ratio of volume (m3 site-1) to baseline area in m2 was 0.97, and the volume/age ratio in years was 0.73; for the age group, the largest amount of individuals belongs to the classes of 4 to 6 years and 8 to 10 years. For 2009, the correlation between the baseline area (m2 site-1) and the volume (m3 site-1) in the inventory was 0.97; the volume/age ratio was 0.81.
These results suggest that the baseline area is a strong candidate to be used as an auxiliary variable in the inventory estimation, using ratio or regression estimators.
Tables 5 and 6 show the estimated values obtained for each sampling estimator: mean, variance, inventory (total limber-yielding stock), precision and sample sizes suggested for two common accuracies in the data collected in 2008 and 2009:
2008 Inventory. When stratified by age of by plot, traditional estimators based only on the design show a substantially more accurate estimate of the average total volume per site (with accuracy gains of 2.2 % and 2.8 %, respectively) (Table 5). It should be considered that in this case the precision level established by the enterprise for its inventory –of 5 %– is surpassed. At the center is the estimation under stratification by age. Various authors have pointed out that it is possible to increase the accuracy of the estimates using stratification (Opsomer et al., 2010; Gilbert et al., 1998; Achard et al., 1998; Thrower, 1992).
Roldán-Cortés et al., Estimadores de muestreo para inventario de plantaciones...
51
Cuadro 5. Estimadores calculados para las mediciones del año 2008.
Var. = Varianza; n (10 %) = Tamaño de muestra para una precisión de 10 %; n (5 %) = Tamaño de muestra para una precisión de 5 %; R = Razón; β = Valor de la pendiente de regresión; R
p = Razón ponderada.
Table 6. Estimators calculated for the 2009 measurements.
Estimator Mean Mean Var. Inventory
(m3)Accuracy
n
(10 %)
n
(5 %)
Simple Random Sampling 3.71 0.009 354 600 5.0 236 938
Stratified by Age 4.30 0.004 411 354 2.8 48 191
Stratified by Plot 4.30 0.003 411 315 2.5 26 95
R
Ratio of Volume to Baseline Area-1 4.05 7.26 0.003 387 542 2.9 29 118
Volume/Age-1 Ratio 4.00 0.87 0.01 382 757 5.0 48 192
β
Regression of Volume to Baseline Area-1 4.18 9.95 0.001 399858 1.3 15 61
Stratified Ratio of Volume to Baseline Area-1 4.30 7.70 0.00005 411 315 0.34 19 89
Var. = Variance; n (10 %) = sample size for a 10 % accuracy; n (5 % )= Sample size for a 5 % accuracy; R = Ratio; β = Value of the regression slope; Rp = Weighted ratio.
Roldán-Cortés et al., Estimadores de muestreo para inventario de plantaciones...
53
Inventario 2008. Para los estimadores tradicionales solo basados en diseño, se observa que al estratificar ya sea por edad o por predio se perfila una mejora sustancial en la precisión sobre el promedio del volumen total por sitio (ganancias de 2.2 y 2.8 %, respectivamente) (Cuadro 5). Habría que tener en cuenta que en este caso se rebasa la precisión fijada por la empresa para su inventario que es de 5 %. En el centro se ubica la estimación bajo estratificación por edad. Varios autores han señalado que a través de la estratificación se puede aumentar la precisión de las estimaciones (Opsomer et al., 2010; Gilbert et al., 1998; Achard et al., 1998; Thrower, 1992).
En el caso de la razón de volumen área basal-1 resultó que por cada m2 de AB en un sitio existen aproximadamente 8.05 m3 de volumen en pie. Este dato puede usarse para hacer inventarios rápidos como cuando solo se utiliza el relascopio para determinar el área basal. A su vez el estimador de razón volumen edad-1 sugiere que el incremento anual en las plantaciones es de 0.98 m3 sitio-1año-1 (19.6 m3 ha-1 año-1). Como en el estimador de la media de razón hace uso de µ
x
(la media poblacional de la variable auxiliar), se empleó la estimación del AB ponderada por el tamaño de los estratos en el muestreo estratificado. Además, con el uso de dicha variable, se tiene una ventaja adicional ya que de manera empírica combina un estimador de diseño estratificado (el AB) con uno bajo MSA (la razón VAB-1).
El valor ponderado de la edad de 5.9 años se obtuvo a partir de las clases generadas y su superficie. Aquí la variable auxiliar es realmente conocida sin error, por lo que los valores estimados de los estimadores muestrales se pueden considerar “estadísticamente correctos”. Este tipo de estimador tiene la ventaja de que permite predecir de manera directa qué pasaría con el volumen en pie si se dejara crecer la plantación con la misma superficie de un año a otro y cambiar la edad de referencia de 5.9 a 6.9 años. De igual manera, estimar el volumen del año previo es también posible, lo que es válido siempre y cuando ninguna superficie se coseche o siniestre de un año a otro, ni que tampoco se integren nuevas áreas dentro de este espacio de muestreo.
Por otro lado, los valores de los estimadores de regresión a pesar de ser sesgados, poseen la cualidad de ser bastante precisos, incluso más que aquellos calculados a través de proporción, lo que puede corroborarse en aquellos derivados de la regresión del volumen-área basal (VAB-1); (1.9 %) y volumen-edad (VAB-1); (4.4 %). Al igual que en los estimadores de proporción se hizo uso de la media poblacional del AB que resulta de los estimadores del muestreo estratificado por predio en dicho año.
Inventario 2009. De manera similar al inventario del 2008, en los estimadores tradicionales se tiene que al estratificar ya sea por edad o por predio existe una ganancia en la precisión sobre el promedio del volumen total por sitio (2.3 % para la
In the case of the ratio of volume to baseline area-1, for each m2 of BA in a site there are approximately 8.05 m3 of standing volume. This information may be used to carry out quick inventories, like when only the relascope is utilized to determine the baseline area.
At the same time, the estimator of the volume/age-1 ratio suggests that the annual increase in the plantations is 0.98 m3 site-1year-1 (19.6 m3 ha-1 año-1). Given that µ
x (the population
mean of the auxiliary variable) is used for the estimator of the mean ratio, the estimate of the weighted BA by stratum size was used in the stratified sampling. Besides, the use of this variable affords an additional advantage, since it empirically combines a stratified design estimator (BA) with an estimator using SRS (the VBA-1 ratio).
The weighted value of the age of 5.9 years was estimated based on the generated classes and their surface. Here, the auxiliary variable is indeed known without error, and therefore the estimated values of the sampling estimators may be considered “statistically correct”. This type of estimator has the advantage of allowing indirect prediction of what might happen to the standing volume if the plantation were to stop growing on the same surface from one year to the next and with the change of reference age from 5.9 to 6.9 years. Equally, it is possible to estimate the volume of the previous year, and this is valid as long as no surface is harvested or damaged from one year to the next or no new zones are integrated within this sampling area.
On the other hand, although the values of the regression estimators are biased, they have the quality of being quite precise, even more so than those calculated using the proportion, as may be verified in those derived from the regression of the ratio of volume to baseline area (VBA-1); (1.9 %) and volume/age ratio (VBA-1); (4.4 %). As in the case of the proportion estimators, the population mean of the BA resulting from the estimators of the stratified sampling per plot in that year was used.
2009 Inventory. As with the 2008 inventory, when stratified samplings by age or by plot were used for the traditional estimators, the accuracy of the average total volume per site increased (by 2.3 % by age and 2.5 % by plot). Also, stratification by plot turned out to be more accurate, although, based on its sampling framework, it can be regarded as an intermediate inventory, followed by the inventory using stratified samplings by age, with an accuracy below the maximum acceptable (2.8 %). In both cases, the accuracy is within the desirable limit established by the managers of the enterprise (5 %).
Rev. Mex. Cien. For. Vol. 5 Núm. 26
54
edad y 2.5 % por predio). También la estratificación por predio es más precisa, aunque se puede calificar como un inventario intermedio al considerar su marco de muestreo, seguido del inventario bajo estratificación por edad que arroja una precisión muy por debajo de la máxima aceptable (2.8 %). En ambos casos la precisión que se encuentra está dentro del límite deseable fijado por los administradores de la empresa (5 %).
Los estimadores de razón para 2009 señalaron que la razón de volumen área basal-1 indica que por cada m2 de AB, a nivel de ha o de sitio, existen 7.26 m3 de volumen en pie. Por otro lado, el estimador de razón volumen edad-1 propone un incremento anualizado de 0.87 m3 sitio-1 año-1, es decir, de 17.4 m3 ha-1 año-1.
A partir de las clases de edad generadas, se calculó la edad ponderada en 4.6 años, y se le considera como variable auxiliar que se puede asumir sin error. De todos los estimadores probados y bajo los criterios de evaluación establecidos, el mejor resultó ser el de razón volumen edad-1 estratificada por clase de edad.
De manera gráfica y al utilizar las fórmulas para estimar el tamaño de muestra a diferentes niveles de precisión (figuras 1 y 2), se aprecia que es posible mantener altas precisiones (menos de 5 %) por debajo de un tamaño de muestra de n≤ 400 para el 2008 y de n≤ 500 para el 2009. Esto implica que a pesar de las variaciones entre ellos, aparentemente mínima, la ganancia en precisión se intensifica.
The ratio estimators for 2009 pointed out that the ratio of volume to baseline area-1 indicates that for every m2 of BA, at a hectare or site level, there is a standing volume of 7.26 m3. On the other hand, the volume age-1 estimator proposes a yearly increase of 0.87 m3 site-1 year-1, i.e. of 17.4 m3 ha-1 year-1.
Based on the generated age classes, the weighted age was estimated to be 4.6 years, and it is considered as an auxiliary variable that may be assumed to be error-free. Of all the tested estimators and under the established evaluation criteria, the most accurate was the volume/age-1 ratio stratified by age class.
The graphs show that, when using the formulas to estimate the sample size at different levels of accuracy (figures 1 and 2), it is possible to maintain high levels of accuracy (less than 5 %) for a sample size below n≤ 400 for the year 2008, and n≤ 500 for 2009. This implies that, despite the apparently minimum variations between these, there is a greater accuracy gain.
Figura 1. Tamaños de muestra para los métodos de muestreo con mejor precisión en 2008.Figure 1. Sample sizes for the sampling methods with improved accuracy in 2008.
Roldán-Cortés et al., Estimadores de muestreo para inventario de plantaciones...
55
Conclusiones
El estimador de razón estratificada con base en el volumen y las variables edad y área basal hizo posible aumentar la precisión en todos los casos evaluados. Los estimadores de razón y regresión; considerando la edad y el área basal como variables auxiliares, ofrecieron las bondades deseadas para la realización del inventario ya que en muestras grandes, las estimaciones fueron más eficientes que las estimaciones de muestreo basados en la media aritmética simple.
A partir del interés de los administradores de la plantación de obtener inventarios anuales con una precisión de al menos 5 %, los estimadores recomendados satisfacen esta condición y para lograrlo resulta útil hacer uso de variables auxiliares, como la edad. Esto le otorga a la empresa una ventaja al respecto ya que cuenta con esta información; además de tener estimaciones eficientes, es posible también calcular de forma rápida el incremento medio por año, lo que puede ahorrar dinero y reducir esfuerzo para, siempre y cuando se trabaje con la proporción volumen edad-1 y clases de edad de un año, es que se puede planear el inventario de forma bi-anual.
Hasta este momento se han considerado estimadores a nivel poblacional. Para obtener los correspondientes a los predios de la empresa se podría implementar el uso del área basal como variable auxiliar, sin necesidad de que la precisión se vea sacrificada.
Figura 2. Tamaños de muestra para los estimadores con mejor precisión en 2009.Figure 2. Sample sizes for the sampling methods with improved accuracy in 2009.
Conclusions
The ratio estimator stratified by volume and the variables of age and baseline area made it possible to increase the accuracy in all assessed cases. Considering the age and the baseline area as auxiliary variables, the ratio and regression estimators provided the desired advantages for carrying out the inventory, given that sampling estimations based on large samples proved more efficient than those based on the simple arithmetic mean.
The recommended estimators, aided by the use of auxiliary variables like age, satisfy the plantation managers’ interest in obtaining yearly inventories with a level of accuracy of at least 5 %. This constitutes an advantage for the enterprise, since this information is available to it; besides having efficient estimations, it is also possible to readily estimate the mean increase per year. Planning a bi-annual inventory can save money and efforts, as long as the volume age-1 and one-year age classes are used.
So far, estimators have been considered at population level. The use of the baseline area as an auxiliary variable could be implemented in order to obtain the estimators for the plots of the enterprise without having to sacrifice the accuracy.
Acknowledgments
We wish to express our gratitude to Forestaciones Operativas de México S.A. de C.V. company especially to Engineers Eric Gordillo and Juan Ramón Aguilar for having facilitated this work by providing us access to their inventory databases.
End of the English version
Rev. Mex. Cien. For. Vol. 5 Núm. 26
56
Agradecimientos
A la empresa Forestaciones Operativas de México, especialmente a los Ing. Eric Gordillo y Juan Ramón Aguilar por las facilidades otorgadas para acceder a sus bases de datos de inventario.
Referencias
Achard, F., T. Richards and J. Gallego. 1998. A new sampling scheme for tropical forest monitoring using satellite imagry. In: Hansen, M. and T. Burk. (eds.). Integrated tools for natural resources inventories in the 21st century. August 16-20, 2008. Forest Service. Boise, ID, USA. pp. 607-613.
Aguirre-Salado, C. A., J. R. Valdez-Lazalde, G. Ángeles-Pérez, H. M. De Los Santos-Posadas, R. Haapanen y A. I. Aguirre-Salado. 2009. Mapeo de carbono arbóreo aéreo en bosques manejados de pino Patula en Hidalgo, México. Agrociencia 43: 209-220.
Bell, J. F. 1998. Basic truths for planning and executing an inventory. In: Hansen, M. and T. Burk. (eds.). Integrated tools for natural resources inventories in the 21st century. August 16-20, 2008. Forest Service. Boise, ID, USA. pp. 14-19.
Cochran, W. G. 1977. Sampling techniques. Third edition. John Wiley & Sons. New York, NY, USA. 428 p.
Comisión Nacional Forestal (Conafor) 2009. Situación actual y perspectivas de las plantaciones forestales comerciales en México. Comisión Nacional Forestal - Colegio de Postgraduados. Montecillo, Texcoco, Edo. de Méx., México. 429 p.
Freese, F. 1962. Muestreo forestal elemental. USDA FS Agriculture Handbook No. 232. Wasington, DC, USA. 91 p.
Gilbert, D., K. Tudor, S. Otukol and K. Jahraus.1998. Rebuilding our legacy inventories: identifiying the good and fixing the bad. In: Hansen, M. and T. Burk. (eds.). Integrated tools for natural resources inventories in the 21st century. August 16-20, 2008. Forest Service. Boise, ID, USA. pp. 50-59.
Johnson, W. E. 2000. Forest sampling desk reference. CRC Press LLC. Boca Ratón, FL, USA. 985 p.
Kish, L. 1975. Muestreo de encuestas. Traducido al español por Ricardo Vinós Cruz López. Editorial Trillas. México, D.F., México. 739 p.
Kish, L. 1995. Survey sampling. Willey Classics Library. New York, NY, USA. 643 p.Köhl, M., S. S. Magnussen and M. Marcheti. 2006. Sampling methods, remote
sensing and GIS multi resource forest inventory. Springer-Verlag Berlin Heidelberg, New York. 373 p.
Lohr, S. L. 2010. Sampling: design and analysis. Second Edition. Brooks 7 Cole, Cengage Learning. Boston, MA, USA. 596 p.
Loukas, G. A., B. Ramachandran, D. P. Brackett, H. Abd-El Rasol and X. Du. 1998. Multiresource inventories incorporating GIS, GPS and database management system. In: Hansen, M. and T. Burk. (eds.). Integrated tools for natural resources inventories in the 21st century.1998: August 16-20. Forest Service. Boise, ID, USA. pp. 1-7.
Manly B., F. J. 1997. Randomization, bootstrap and monte carlo methods in biology. Text in statistical science. 2nd. Ed. Chapman and Hall. London, UK. 399 p.
Méndez M., J. T., S. E. García D., B. Don Juan M. y L. Ángel A. 2008. Diagnóstico fitosanitario en plantaciones forestales comerciales en Las Choapas, Veracruz y Huimanguillo, Tabasco. Comisión Nacional Forestal. Gerencia Nacional de Sanidad. Universidad Autónoma Chapingo. Texcoco, Edo. de Méx., México. 97 p.
Opsomer, J. D., M. Francisco-Fernández and X. Li. 2010. Model based nonparametric variance estimation for systematic sampling. Department of Statistics, Colorado State University. Fort Collins, CO, USA. 23 p.
Pérez, S. R. 2010. Características edafológicas y potencial productivo de Eucalyptus urophylla y E. grandis en Huimanguillo, Tabasco. Tesis de Maestría. Colegio de Postgraduados. Montecillo, Edo. de Méx., México. 74 p.
Renard, P., D. Hélene and F. Roland. 2004. Geostatistics for environmental applications. Proceedings on the fifth european conference on geostatistics for environmental applications. Springer. New York, NY, USA. 480 p.
Ruiz A., M. 1982. Curso Sobre Inventarios Forestales. Breve Descripción de Algunas Técnicas de Muestreo. Instituto Nacional de Investigaciones Forestales. México, D.F., México. Boletín Divulgativo Núm. 61. 34 p.
Särndal, C. E., B. Swensson and J. Wretman. 1992. Model assisted survey sampling. Springer Series in Statistics. Springer-Verlag. New York, NY, USA. 694 p.
Scheaffer, R. L., W. Mendenhall y L. Ott. 1987. Elementos de muestreo. Grupo Editorial Iberoamérica. México, D.F., México. 321 p.
Schreuder, H. T., J. C. Rennie and M. Williams. 1992. Comparison of Three sampling Schemes for Estimating Frequency and D2H by Diameter Class a Simulation Study. Forest Ecology and Management 50: 117-131.
Schreuder, H. T., R. Ernst y H. Ramírez, M. 2006. Técnicas estadísticas para evaluación y monitoreo de recursos naturales. Universidad Autónoma Chapingo. Texcoco, Edo. de Méx, México. 144 p.
Schumacher, F. X. and R. A. Chapman. 1942. Sampling methods in forestry and range management. Duke University. School of forestry. Durham, NC, USA. Bulletin 7. 213 p.
Shiver, B. D. and B. E. Borders. 1996. Sampling Techniques for Forest Resource Inventory. John Wiley. New York, NY, USA. 356 p.
Sukhatme P., V. 1956. Teoría de encuestas por muestreo con aplicaciones. Secretaría de Economía. Dirección General de Estadística. Departamento de Muestreo. Fondo de Cultura Económica. México, D.F., México. 495 p.
Sukhatme, P. V. and B. V. Sukhatme. 1970. Sampling theory of surveys with application. Iowa State University. Ames, IA, USA. 452 p.
Torres R., J. M. y O. S. Magaña T. 2001. Evaluación de plantaciones forestales. Editorial Limusa. Grupo Noriega Editores. México, D.F., México. 472 p.
Thompson S., K. 2002. Sampling. Willey Series in Probability and Statistics. Pennsylvania State University. A Willey-Interscience Publication. Second Edition. New York, NY, USA. 367 p.
Thrower J., S. 1992. An historical summary of forest inventory sampling designs in British Columbia. Report to de B.C. Ministry of Forests Inventory Branch, Timber Inventory Task Force. Forest Research Consulting. Victoria, BC, Canada. 26 p.
Velázquez, M. A. 2009. Situación actual y perspectivas de las plantaciones forestales comerciales en México. Comisión Nacional Forestal. Colegio de Postgraduados. Montecillo, Edo. de Méx., México. 429 p.
Villa S., A. B. 1971. Generalidades sobre las técnicas de muestreo en inventarios forestales. In: Recopilación de notas sobre técnicas de muestreo usadas en inventarios forestales. Secretaría de Agricultura y Recursos Hidráulicos. Instituto Nacional de Investigaciones Forestales y Agropecuarias. División Forestal. México, D.F., México. Publicación Especial Núm. 64. 69 p.
Villa S., A. B. y M. Caballero D. 1976. Técnicas de muestreo usadas en México en inventarios forestales. Desarrollo histórico. In: Recopilación de Notas Sobre Técnicas de Muestreo Usadas en Inventarios Forestales. Secretaría de Agricultura y Recursos Hidráulicos. Instituto Nacional de Investigaciones Forestales y Agropecuarias. División Forestal. México, D.F., México. Publicación Especial Núm. 64. 69 p.
Roldán-Cortés et al., Estimadores de muestreo para inventario de plantaciones...