Samsung Electronics Co., Ltd. and Subsidiaries NOTES TO INTERIM CONSOLIDATED FINANCIAL STATEMENTS 14 1. General Information 1.1 Company Overview Samsung Electronics Co., Ltd. (“SEC”) was incorporated under the laws of the Republic of Korea in 1969 and listed its shares on the Korea Stock Exchange in 1975. SEC and its subsidiaries (collectively referred to as the “Group”) operate three business divisions: Consumer Electronics (“CE”), Information technology & Mobile communications (“IM”), and Device Solution (“DS”). The CE division includes digital TVs, monitors, printers, air conditioners and refrigerators and the IM division includes mobile phones, communication system, and computers. The DS division includes products such as memory and system LSI in the semiconductor business (“Semiconductor”), and LCD and OLED panels in the display business (“DP”). The Group is domiciled in the Republic of Korea and the address of its registered office is Suwon, the Republic of Korea. These interim consolidated financial statements have been prepared in accordance with Korean International Financial Reporting Standards (“K-IFRS”) 1110, Consolidated Financial Statements. SEC, as the controlling Company, consolidates its 161 subsidiaries including Samsung Display and Samsung Electronics America. The Group also applies the equity method of accounting to its 36 affiliates, including Samsung Electro-Mechanics. 1.2 Consolidated Subsidiaries (A) The consolidated subsidiaries as of March 31, 2015 are as follows: Area Subsidiaries Industry Percentage of ownership 1 Domestic High Pioneer Private Investment Trust #1 Technology business, Venture capital investments 100.0 Samsung Display (SDC) Manufacture and sale of display panels 84.8 SU Materials Manufacture of LCD components 50.0 STECO Manufacture of semiconductor components 70.0 SEMES Manufacture of semiconductor/FPD 91.5 Samsung Electronics Service Repair services for electronic devices 99.3 Samsung Electronics Sales Sale of electronic devices 100.0 Samsung Electronics Logitech General logistics agency 100.0 Samsung Medison Medical equipment 68.5 Samsung Venture Capital Union #6 Technology business, Venture capital investments 99.0 Samsung Venture Capital Union #14 Technology business, Venture capital investments 99.0 Samsung Venture Capital Union #20 Technology business, Venture capital investments 99.0 Samsung Venture Capital Union #21 Technology business, Venture capital investments 99.0 Samsung Venture Capital Union #22 Technology business, Venture capital investments 99.0 Samsung Venture Capital Union #23 Technology business, Venture capital investments 99.0 Samsung Venture Capital Union #26 Technology business, Venture capital investments 99.0 Samsung Venture Capital Union #27 Technology business, Venture capital investments 99.0 Samsung Venture Capital Union #28 Technology business, Venture capital investments 99.0
Transcript
Samsung Electronics Co., Ltd. and Subsidiaries
NOTES TO INTERIM CONSOLIDATED FINANCIAL STATEMENTS
14
1. General Information
1.1 Company Overview
Samsung Electronics Co., Ltd. (“SEC”) was incorporated under the laws of the Republic of Korea in 1969 and listed
its shares on the Korea Stock Exchange in 1975.
SEC and its subsidiaries (collectively referred to as the “Group”) operate three business divisions: Consumer
Electronics (“CE”), Information technology & Mobile communications (“IM”), and Device Solution (“DS”). The CE
division includes digital TVs, monitors, printers, air conditioners and refrigerators and the IM division includes
mobile phones, communication system, and computers. The DS division includes products such as memory and
system LSI in the semiconductor business (“Semiconductor”), and LCD and OLED panels in the display business
(“DP”). The Group is domiciled in the Republic of Korea and the address of its registered office is Suwon, the
Republic of Korea.
These interim consolidated financial statements have been prepared in accordance with Korean International
Financial Reporting Standards (“K-IFRS”) 1110, Consolidated Financial Statements. SEC, as the controlling
Company, consolidates its 161 subsidiaries including Samsung Display and Samsung Electronics America. The
Group also applies the equity method of accounting to its 36 affiliates, including Samsung Electro-Mechanics.
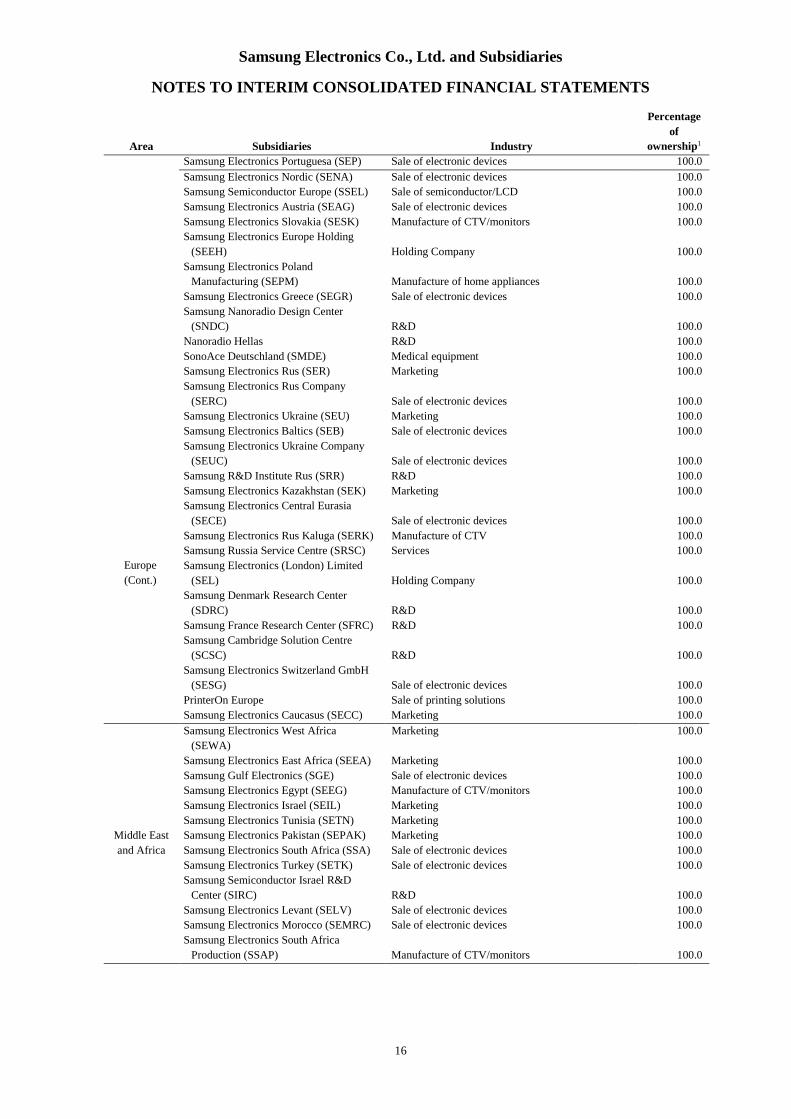
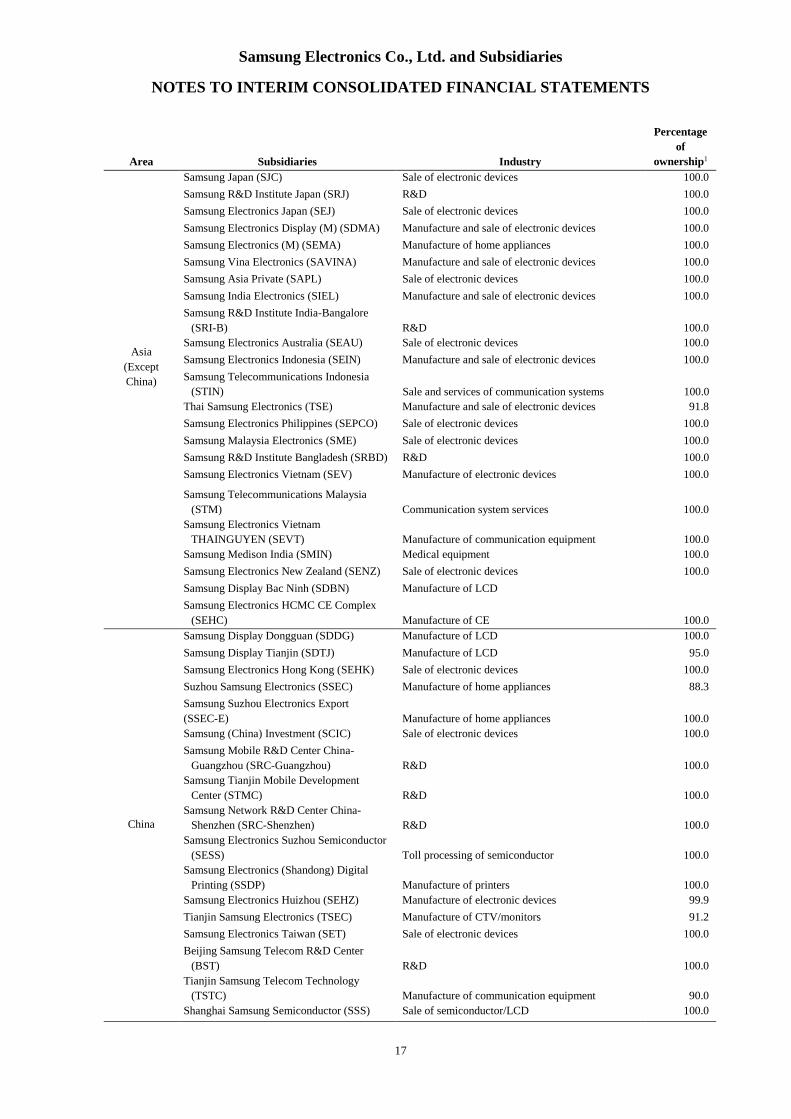
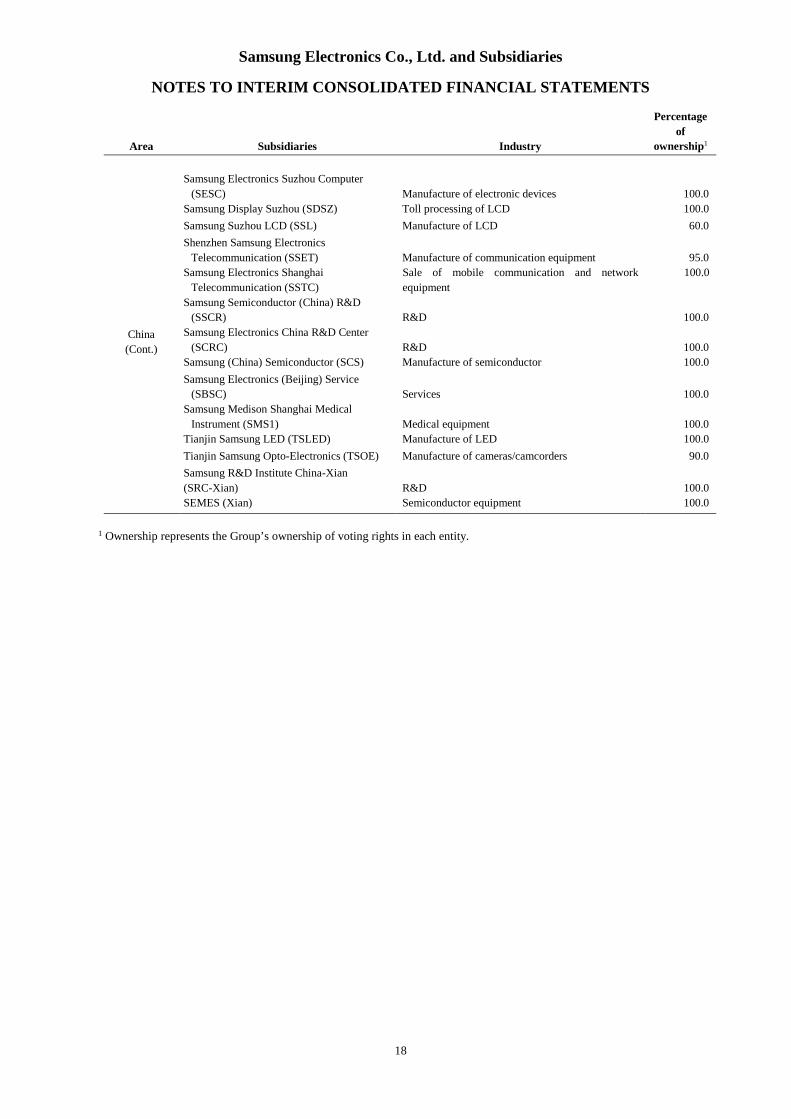
1.2 Consolidated Subsidiaries
(A) The consolidated subsidiaries as of March 31, 2015 are as follows:
Area Subsidiaries Industry
Percentage
of
ownership1
Domestic
High Pioneer Private Investment Trust #1 Technology business, Venture capital investments 100.0
Samsung Display (SDC) Manufacture and sale of display panels 84.8
SU Materials Manufacture of LCD components 50.0
STECO Manufacture of semiconductor components 70.0
SEMES Manufacture of semiconductor/FPD 91.5
Samsung Electronics Service Repair services for electronic devices 99.3
Samsung Electronics Sales Sale of electronic devices 100.0
Samsung Electronics Logitech General logistics agency 100.0
Samsung Medison Medical equipment 68.5
Samsung Venture Capital Union #6 Technology business, Venture capital investments 99.0
Samsung Venture Capital Union #14 Technology business, Venture capital investments 99.0
Samsung Venture Capital Union #20 Technology business, Venture capital investments 99.0
Samsung Venture Capital Union #21 Technology business, Venture capital investments 99.0
Samsung Venture Capital Union #22 Technology business, Venture capital investments 99.0
Samsung Venture Capital Union #23 Technology business, Venture capital investments 99.0
Samsung Venture Capital Union #26 Technology business, Venture capital investments 99.0
Samsung Venture Capital Union #27 Technology business, Venture capital investments 99.0
Samsung Venture Capital Union #28 Technology business, Venture capital investments 99.0
Samsung Electronics Co., Ltd. and Subsidiaries
NOTES TO INTERIM CONSOLIDATED FINANCIAL STATEMENTS
15
Area Subsidiaries Industry
Percentage
of
ownership1
America
Samsung Electronics America (SEA) Sale of electronic devices 100.0
NexusDX (Nexus) Medical equipment 100.0
Samsung Receivables (SRC) Credit management 100.0
NeuroLogica Medical equipment 100.0
Samsung Semiconductor (SSI) Sale of semiconductor/LCD 100.0
Samsung Electronics Canada (SECA) Sale of electronic devices 100.0
Samsung Research America (SRA) R&D 100.0
Grandis R&D 100.0
Samsung Mexicana (SAMEX) Manufacture of electronic devices 100.0
Samsung International (SII) Manufacture of CTV/monitors 100.0
Samsung Austin Semiconductor (SAS) Manufacture of semiconductor 100.0
Samsung Electronics Mexico (SEM) Sale of electronic devices 99.9
SEMES America (SEMESA) Semiconductor equipment 100.0
Samsung Electronics Digital Appliance
Mexico (SEDAM) Manufacture of electronic devices 99.9
Samsung Electronics Latinoamerica
Miami (SEMI) Sale of electronic devices 100.0
Nvelo Software 100.0
Samsung Electronics Latinoamerica
(SELA) Sale of electronic devices 100.0
Samsung Electronics Venezuela (SEVEN) Marketing and services 100.0
Samsung Electronica Colombia
(SAMCOL) Sale of electronic devices 100.0
Samsung Electronics Panama (SEPA) Consulting 100.0
Samsung Electronica da Amazonia
(SEDA)
Manufacture and sale of electronic devices 100.0
Samsung Electronics Argentina (SEASA) Marketing and services 100.0
Samsung Electronics Chile (SECH) Sale of electronic devices 100.0
Samsung Electronics Peru (SEPR) Sale of electronic devices 100.0
RT SV CO-INVEST (RT-SV) Technology business, Venture capital investments 99.9
Quietside Sale of heating and cooling products 100.0
SmartThings Sale of smart home electronics 100.0
PrinterOn Sale of printing solutions 100.0
PrinterOn America Sale of printing solutions 100.0
SIMPRESS Sale of printing solutions 100.0
LoopPay Develop and provide mobile payment service 100.0
YESCO Electronics Manufacture and sale of LED displays 100.0
Beijing Integrated Circuit Industry
International Fund (Beijing Fund) Venture capital investments 99.0
Europe
Samsung Electronics (UK) (SEUK) Sale of electronic devices 100.0
Samsung Electronics Holding (SEHG) Holding Company 100.0
Samsung Semiconductor Europe GmbH
(SSEG) Sale of semiconductor/LCD 100.0
Samsung Electronics GmbH (SEG) Sale of electronic devices 100.0
Samsung Electronics Iberia (SESA) Sale of electronic devices 100.0
Samsung Electronics France (SEF) Sale of electronic devices 100.0
Samsung Electronics Hungarian (SEH) Manufacture and sale of electronic devices 100.0
Samsung Electronics Czech and Slovak
(SECZ) Sale of electronic devices 100.0
Samsung Electronics Italia (SEI) Sale of electronic devices 100.0
Samsung Electronics Europe Logistics
(SELS) Logistics 100.0
Samsung Electronics Benelux (SEBN) Sale of electronic devices 100.0
Samsung Display Slovakia (SDSK) Toll processing of LCD 100.0
Samsung Electronics Romania (SEROM) Sale of electronic devices 100.0
Samsung Electronics Overseas (SEO) Sale of electronic devices 100.0
Samsung Electronics Polska (SEPOL) Sale of electronic devices 100.0
Samsung Electronics Co., Ltd. and Subsidiaries
NOTES TO INTERIM CONSOLIDATED FINANCIAL STATEMENTS
16
Area Subsidiaries Industry
Percentage
of
ownership1
Europe
(Cont.)
Samsung Electronics Portuguesa (SEP) Sale of electronic devices 100.0
Samsung Electronics Nordic (SENA) Sale of electronic devices 100.0
Samsung Semiconductor Europe (SSEL) Sale of semiconductor/LCD 100.0
Samsung Electronics Austria (SEAG) Sale of electronic devices 100.0
Samsung Electronics Slovakia (SESK) Manufacture of CTV/monitors 100.0
Samsung Electronics Europe Holding
(SEEH) Holding Company 100.0
Samsung Electronics Poland
Manufacturing (SEPM) Manufacture of home appliances 100.0
Samsung Electronics Greece (SEGR) Sale of electronic devices 100.0
Samsung Nanoradio Design Center
(SNDC) R&D 100.0
Nanoradio Hellas R&D 100.0
SonoAce Deutschland (SMDE) Medical equipment 100.0
Samsung Electronics Rus (SER) Marketing 100.0
Samsung Electronics Rus Company
(SERC) Sale of electronic devices 100.0
Samsung Electronics Ukraine (SEU) Marketing 100.0
Samsung Electronics Baltics (SEB) Sale of electronic devices 100.0
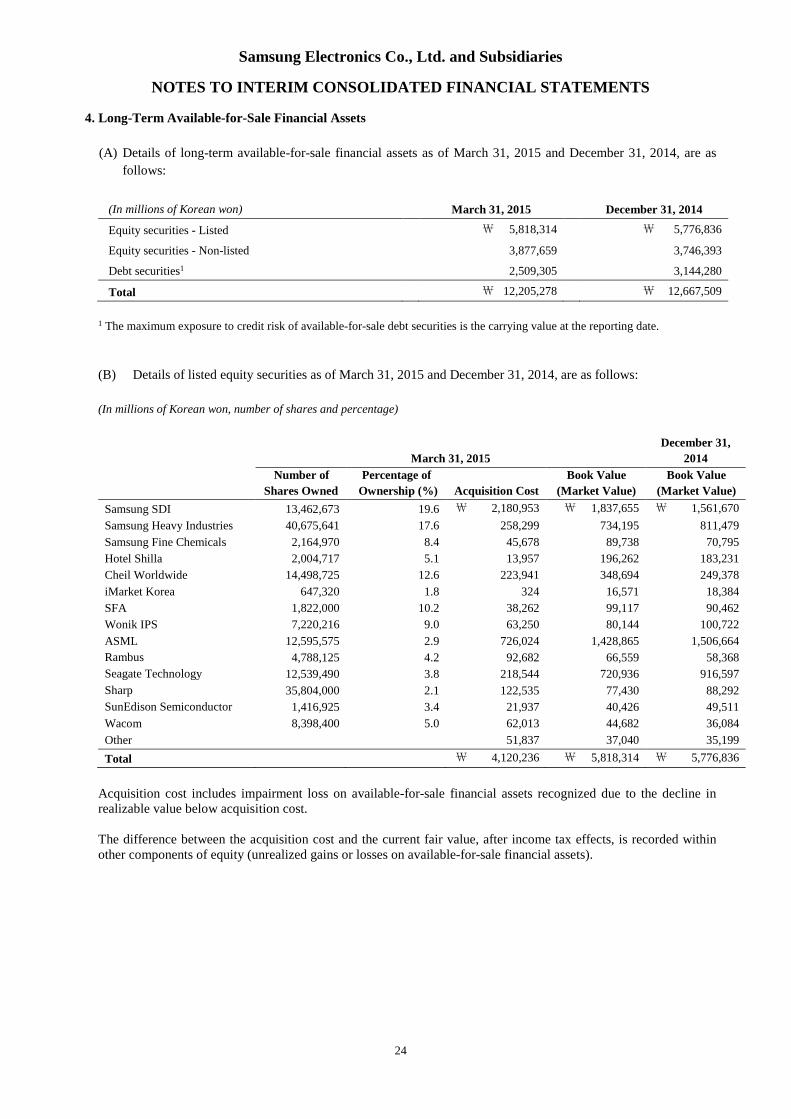
Acquisition cost includes impairment loss on available-for-sale financial assets recognized due to the decline inrealizable value below acquisition cost.
The difference between the acquisition cost and the current fair value, after income tax effects, is recorded withinother components of equity (unrealized gains or losses on available-for-sale financial assets).
Samsung Electronics Co., Ltd. and Subsidiaries
NOTES TO INTERIM CONSOLIDATED FINANCIAL STATEMENTS
25
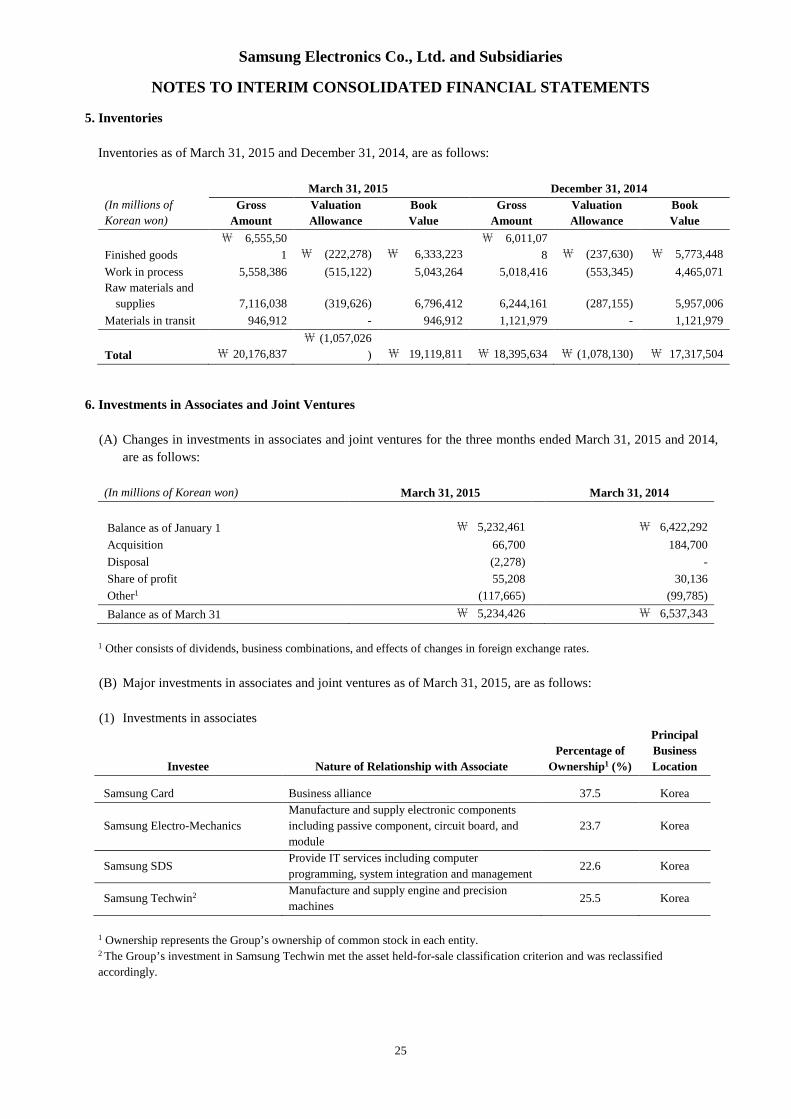
5. Inventories
Inventories as of March 31, 2015 and December 31, 2014, are as follows:
(In millions of
Korean won)
March 31, 2015 December 31, 2014
Gross
Amount
Valuation
Allowance
Book
Value
Gross
Amount
Valuation
Allowance
Book
Value
Finished goods
₩ 6,555,50
1 ₩ (222,278) ₩ 6,333,223
₩ 6,011,07
8 ₩ (237,630) ₩ 5,773,448
Work in process 5,558,386 (515,122) 5,043,264 5,018,416 (553,345) 4,465,071
(A) Changes in investments in associates and joint ventures for the three months ended March 31, 2015 and 2014,
are as follows:
(In millions of Korean won) March 31, 2015 March 31, 2014
Balance as of January 1 ₩ 5,232,461 ₩ 6,422,292
Acquisition 66,700 184,700
Disposal (2,278) -
Share of profit 55,208 30,136
Other1 (117,665) (99,785)
Balance as of March 31 ₩ 5,234,426 ₩ 6,537,343
1 Other consists of dividends, business combinations, and effects of changes in foreign exchange rates.
(B) Major investments in associates and joint ventures as of March 31, 2015, are as follows:
(1) Investments in associates
Investee Nature of Relationship with Associate
Percentage of
Ownership1 (%)
Principal
Business
Location
Samsung Card Business alliance 37.5 Korea
Samsung Electro-Mechanics
Manufacture and supply electronic components
including passive component, circuit board, and
module
23.7 Korea
Samsung SDSProvide IT services including computer
programming, system integration and management22.6 Korea
Samsung Techwin2 Manufacture and supply engine and precision
machines25.5 Korea
1 Ownership represents the Group’s ownership of common stock in each entity.2 The Group’s investment in Samsung Techwin met the asset held-for-sale classification criterion and was reclassified
accordingly.
Samsung Electronics Co., Ltd. and Subsidiaries
NOTES TO INTERIM CONSOLIDATED FINANCIAL STATEMENTS
26
Samsung Electronics Co., Ltd. and Subsidiaries
NOTES TO INTERIM CONSOLIDATED FINANCIAL STATEMENTS
27
(2) Investments in joint ventures
Investee Nature of Relationship with Joint Venture
Percentage of
Ownership1 (%)
Principal
Business
Location
Samsung Corning Advanced GlassManufacture and supply other industrial glass
devices50.0 Korea
1 Ownership represents the Group’s ownership of common stock in each entity.
(C) Details of investments in associates and joint ventures as of March 31, 2015 and December 31, 2014, are as follows:
(1) Investments in associates
(In millions of Korean won) March 31, 2015
Investee Acquisition cost Net asset value1 Book value
Samsung Card ₩ 1,538,540 ₩ 2,391,505 ₩ 2,352,351
Samsung Electro-Mechanics 359,237 993,466 999,274
Samsung SDS 147,963 937,048 960,580
Other 811,633 537,538 674,048
Total ₩ 2,857,373 ₩ 4,859,557 ₩ 4,986,253
(In millions of Korean won) December 31, 2014
Investee Acquisition cost Net asset value1 Book value
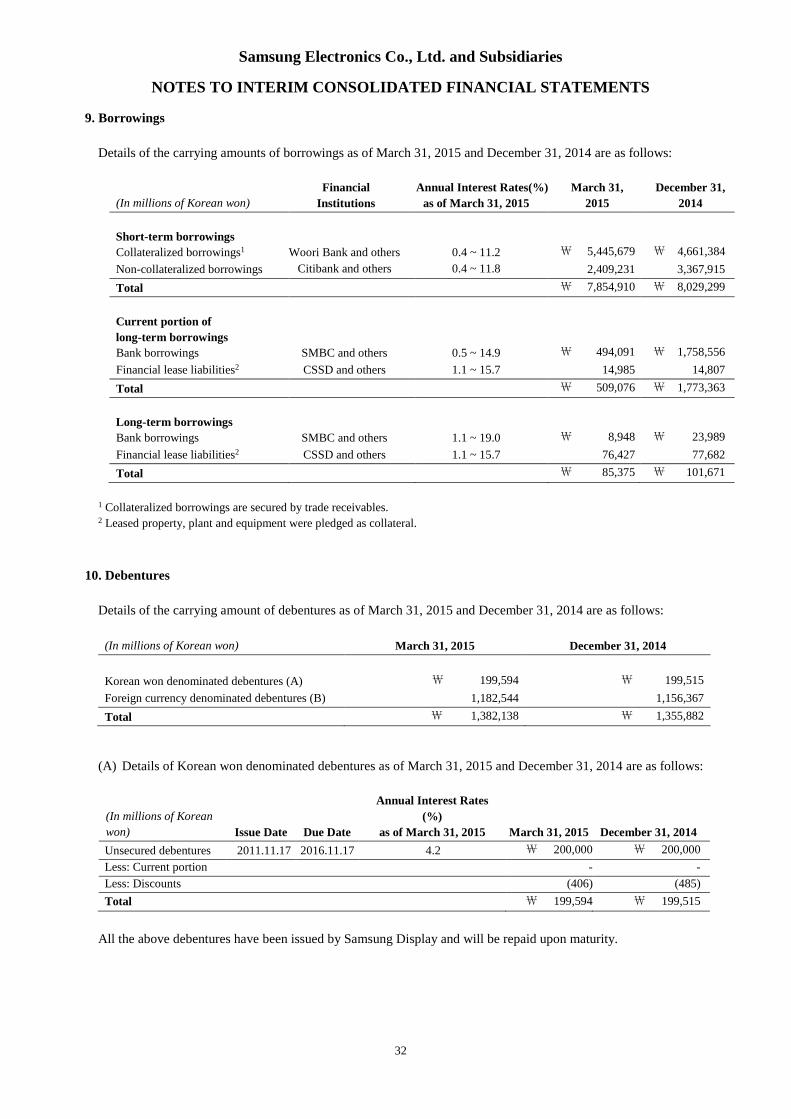
All the above debentures have been issued by Samsung Display and will be repaid upon maturity.
Samsung Electronics Co., Ltd. and Subsidiaries
NOTES TO INTERIM CONSOLIDATED FINANCIAL STATEMENTS
33
(B) Details of foreign currency denominated debentures as of March 31, 2015 and December 31, 2014 are as
follows:
(In millions of Korean
Won)
Issue
Date
Due
Date
Annual Interest Rates
(%)
as of March 31, 2015
March 31,
2015
December 31,
2014
US dollar denominated
straight bonds11997.10.02 2027.10.01 7.7 ₩ 71,825
(US$65 million)
₩ 71,448
(US$65 million)
US dollar denominated
unsecured bonds2 2012.4.10 2017.4.10 1.81,105,000
(US$1,000 million)
1,099,200
(US$1,000 million)
Simpress Corporate
Bond (ITAU)2011.9.13 2016.9.14 14.5
8,554
(BRL 25,000 thousand) -
Simpress Corporate
Bond (SANTANDER)2013.8.6 2018.8.6 15.0
20,530
(BRL 60,000 thousand) -
Less: Current Portion (15,670) (5,496)
Less: Discounts (7,695) (8,785)
Total ₩ 1,182,544 ₩ 1,156,367
1 US dollar denominated straight bonds are repaid annually for twenty years after a ten-year grace period from the date of
issuance. Interest is paid semi-annually.2 US dollar denominated unsecured bonds are issued by Samsung Electronics America, a subsidiary of the Group, and are repaid
in full upon maturity. Interest is paid semi-annually.
11. Net Defined Benefit Liabilities
(A) Details of net defined benefit liabilities recognized on the consolidated statements of financial position as of
March 31, 2015 and December 31, 2014 are as follows:
(In millions of Korean won) March 31, 2015 December 31, 2014
Present value of funded defined benefit obligations ₩ 7,682,020 ₩ 7,404,205
Present value of unfunded defined benefit obligations 118,808 138,042
Subtotal 7,800,828 7,542,247
Fair value of plan assets (7,327,506) (7,340,905)
Total ₩ 473,322 ₩ 201,342
(B) The amounts recognized in the consolidated statements of income for the three months ended March 31, 2015
and 2014 are as follows:
(In millions of Korean won) 2015 2014
Current service cost ₩ 289,985 ₩ 238,270
Interest cost 8,899 25,386
Past service cost - 128,747
Other 2,741 (2,259)
Total ₩ 301,625 ₩ 390,144
Samsung Electronics Co., Ltd. and Subsidiaries
NOTES TO INTERIM CONSOLIDATED FINANCIAL STATEMENTS
34
(C) The pension expenses related to defined benefit plans recognized on the consolidated statements of income for
the three months ended March 31, 2015 and 2014 are as follows:
(In millions of Korean won) 2015 2014
Cost of sales ₩ 132,625 ₩ 165,180
Selling and administrative expenses 169,000 224,964
Total ₩ 301,625 ₩ 390,144
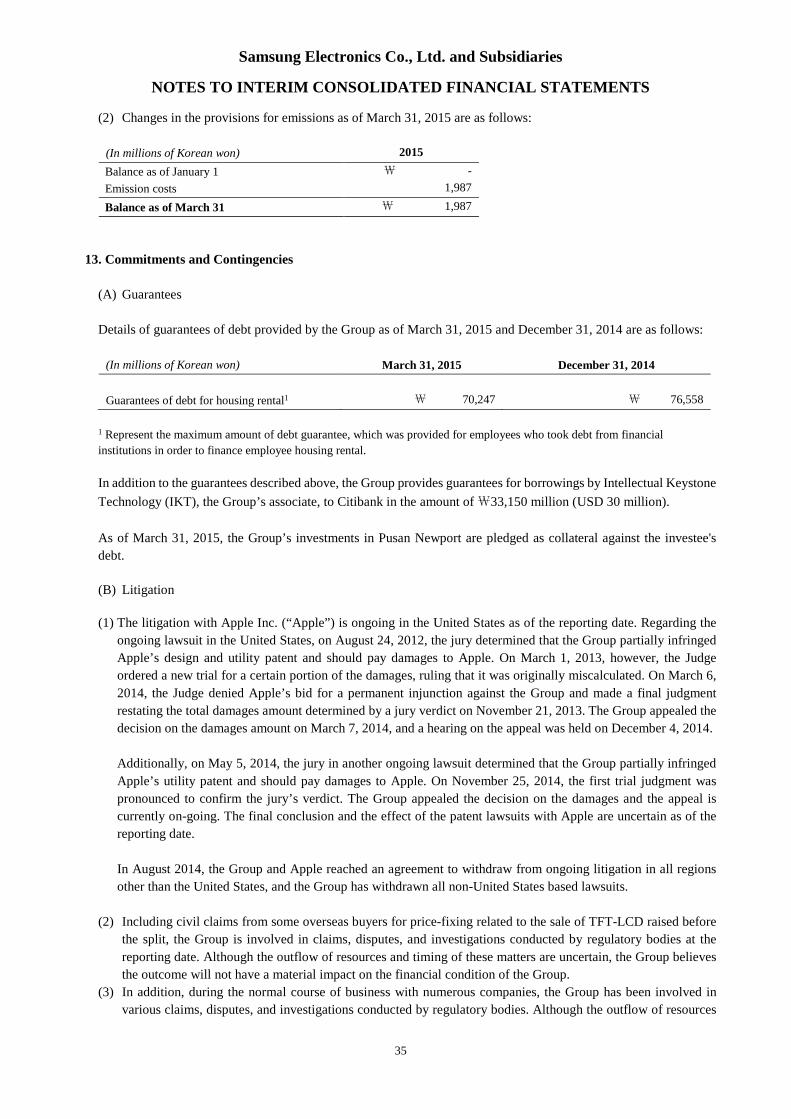
12. Provisions
Changes in the provisions during the three months ended March 31, 2015 are as follows:
(In millions of Korean won) Warranty (A)
Royalty
expenses (B)
Long-term
incentives (C) Bonus (D) Other (E) Total
Balance as of January 1, 2015 ₩ 1,829,068 ₩ 3,917,792 ₩ 730,464 ₩ - ₩ 13,476 ₩ 6,490,800
Charged to the statement of
income 417,193 253,996 43,664 900,949 16,352 1,632,154
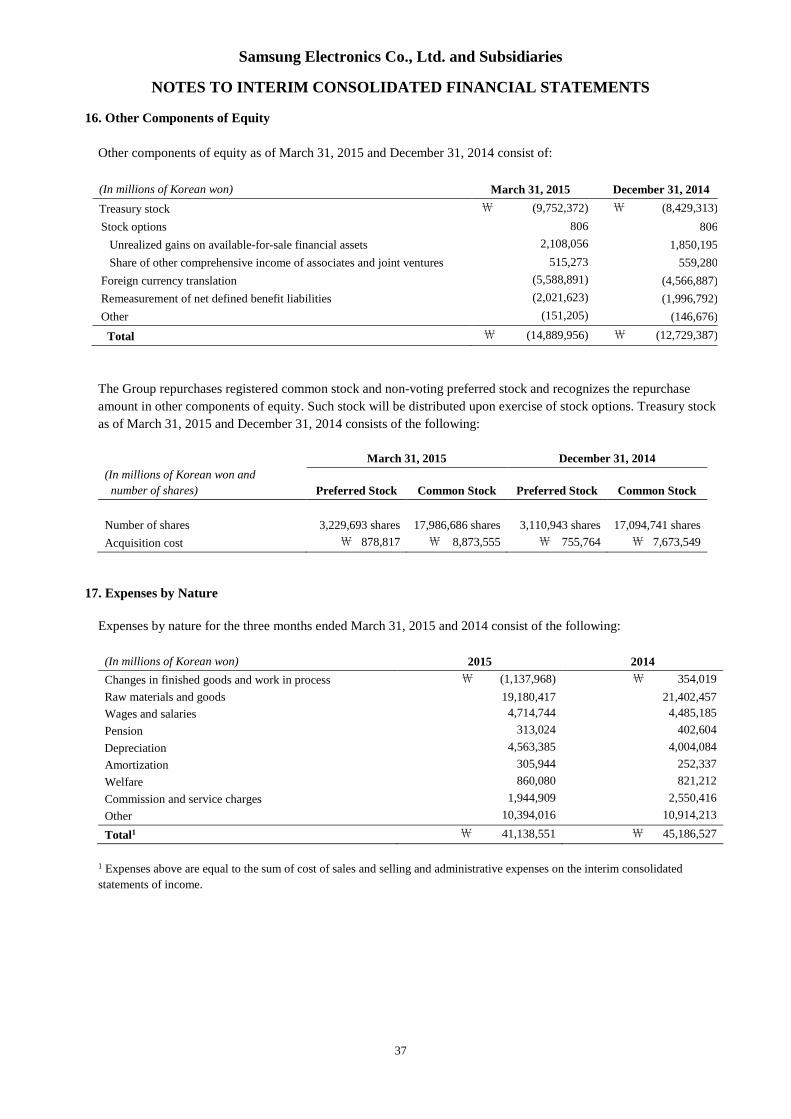
Expenses by nature for the three months ended March 31, 2015 and 2014 consist of the following:
(In millions of Korean won) 2015 2014
Changes in finished goods and work in process ₩ (1,137,968) ₩ 354,019
Raw materials and goods 19,180,417 21,402,457
Wages and salaries 4,714,744 4,485,185
Pension 313,024 402,604
Depreciation 4,563,385 4,004,084
Amortization 305,944 252,337
Welfare 860,080 821,212
Commission and service charges 1,944,909 2,550,416
Other 10,394,016 10,914,213
Total1 ₩ 41,138,551 ₩ 45,186,527
1 Expenses above are equal to the sum of cost of sales and selling and administrative expenses on the interim consolidated
statements of income.
Samsung Electronics Co., Ltd. and Subsidiaries
NOTES TO INTERIM CONSOLIDATED FINANCIAL STATEMENTS
38
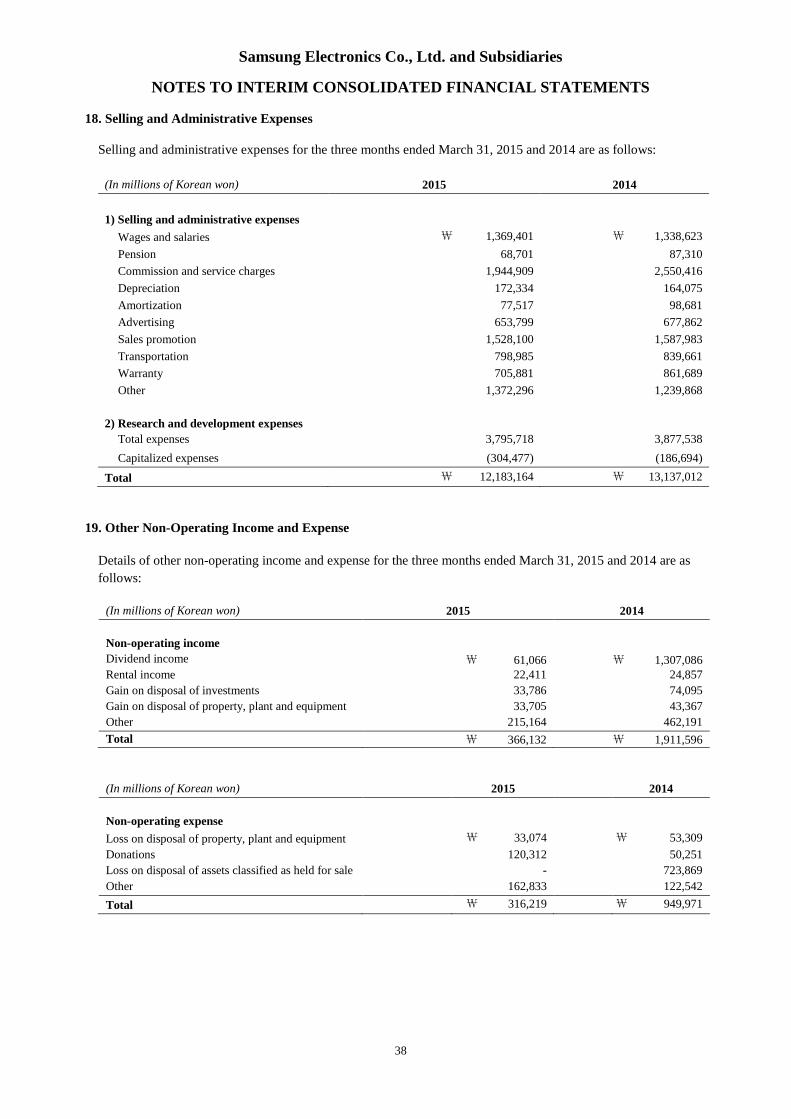
18. Selling and Administrative Expenses
Selling and administrative expenses for the three months ended March 31, 2015 and 2014 are as follows:
(In millions of Korean won) 2015 2014
1) Selling and administrative expenses
Wages and salaries ₩ 1,369,401 ₩ 1,338,623
Pension 68,701 87,310
Commission and service charges 1,944,909 2,550,416
Depreciation 172,334 164,075
Amortization 77,517 98,681
Advertising 653,799 677,862
Sales promotion 1,528,100 1,587,983
Transportation 798,985 839,661
Warranty 705,881 861,689
Other 1,372,296 1,239,868
2) Research and development expenses
Total expenses 3,795,718 3,877,538
Capitalized expenses (304,477) (186,694)
Total ₩ 12,183,164 ₩ 13,137,012
19. Other Non-Operating Income and Expense
Details of other non-operating income and expense for the three months ended March 31, 2015 and 2014 are as
follows:
(In millions of Korean won) 2015 2014
Non-operating income
Dividend income ₩ 61,066 ₩ 1,307,086Rental income 22,411 24,857
Gain on disposal of investments 33,786 74,095
Gain on disposal of property, plant and equipment 33,705 43,367
Other 215,164 462,191
Total ₩ 366,132 ₩ 1,911,596
(In millions of Korean won) 2015 2014
Non-operating expense
Loss on disposal of property, plant and equipment ₩ 33,074 ₩ 53,309
Donations 120,312 50,251
Loss on disposal of assets classified as held for sale - 723,869
Other 162,833 122,542
Total ₩ 316,219 ₩ 949,971
Samsung Electronics Co., Ltd. and Subsidiaries
NOTES TO INTERIM CONSOLIDATED FINANCIAL STATEMENTS
39
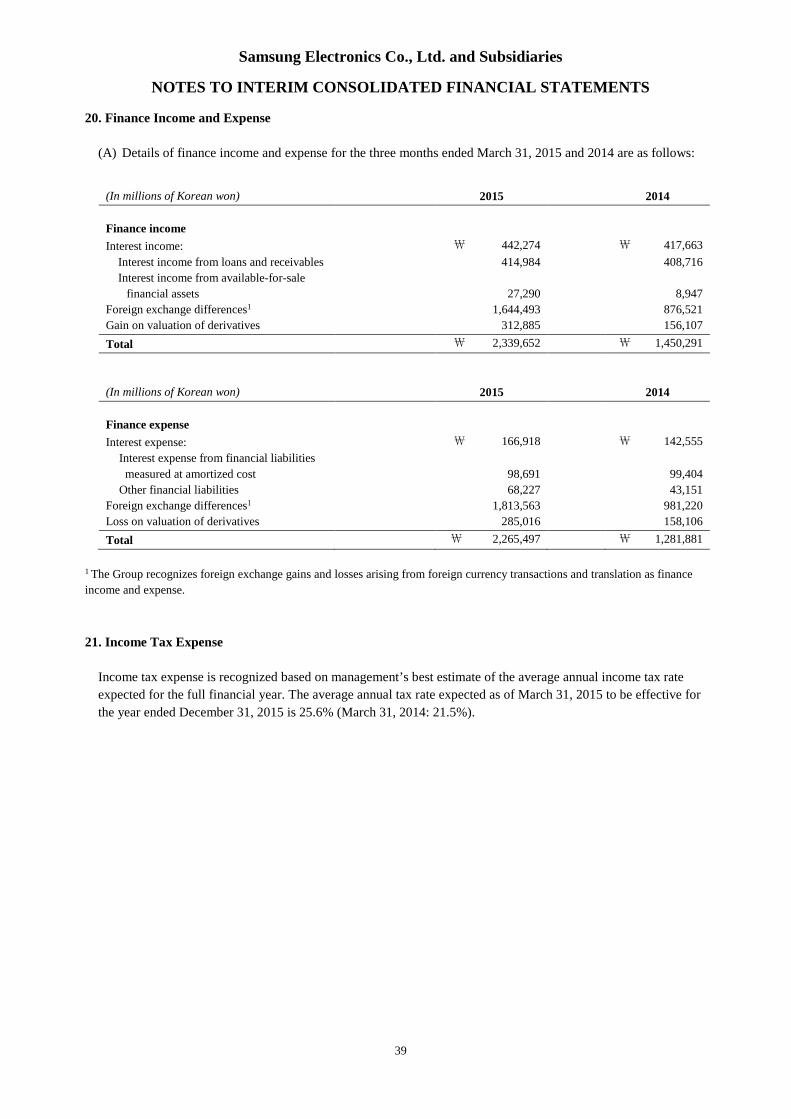
20. Finance Income and Expense
(A) Details of finance income and expense for the three months ended March 31, 2015 and 2014 are as follows:
(In millions of Korean won) 2015 2014
Finance income
Interest income: ₩ 442,274 ₩ 417,663
Interest income from loans and receivables 414,984 408,716
Interest income from available-for-sale
financial assets 27,290 8,947
Foreign exchange differences1 1,644,493 876,521
Gain on valuation of derivatives 312,885 156,107
Total ₩ 2,339,652 ₩ 1,450,291
(In millions of Korean won) 2015 2014
Finance expense
Interest expense: ₩ 166,918 ₩ 142,555
Interest expense from financial liabilities
measured at amortized cost 98,691 99,404
Other financial liabilities 68,227 43,151
Foreign exchange differences1 1,813,563 981,220
Loss on valuation of derivatives 285,016 158,106
Total ₩ 2,265,497 ₩ 1,281,881
1 The Group recognizes foreign exchange gains and losses arising from foreign currency transactions and translation as finance
income and expense.
21. Income Tax Expense
Income tax expense is recognized based on management’s best estimate of the average annual income tax rate
expected for the full financial year. The average annual tax rate expected as of March 31, 2015 to be effective for
the year ended December 31, 2015 is 25.6% (March 31, 2014: 21.5%).
Samsung Electronics Co., Ltd. and Subsidiaries
NOTES TO INTERIM CONSOLIDATED FINANCIAL STATEMENTS
40
22. Earnings per Share
(A) Basic earnings per share
Basic earnings per share for the three months ended March 31, 2015 and 2014 are calculated as follows:
(1) Common stock
(In millions of Korean won and thousands of shares,
except per share data) 2015 2014
Net income as reported on the statements of income ₩ 4,519,323 ₩ 7,484,680Net income available for common stock 3,924,175 6,499,012
Weighted-average number of common shares
outstanding 129,462 130,923
Basic earnings per share (in Korean won) ₩ 30,311 ₩ 49,640
(2) Preferred stock
(In millions of Korean won and thousands of shares,
except per share data) 2015 2014
Net income as reported on the statements of income ₩ 4,519,323 ₩ 7,484,680Net income available for preferred stock 595,148 985,668
Weighted-average number of preferred shares
outstanding 19,625 19,854
Basic earnings per preferred share (in Korean won) ₩ 30,326 ₩ 49,646
(B) Diluted earnings per share
The Group has one category of potentially dilutive ordinary shares: stock options. Dilutive earnings per share is
calculated by adjusting the weighted average number of ordinary shares outstanding to assume conversion of all
dilutive potential ordinary shares.
Diluted earnings per share for the three months ended March 31, 2015 and 2014 are calculated as follows:
(1) Common stock
(In millions of Korean won and thousands of shares,
except per share data)2015 2014
Net income available for common stock
and common stock equivalents₩ 3,924,19
5 ₩ 6,499,115Weighted-average number of shares of common stock
and common stock equivalents 129,465 130,939
Diluted earnings per share (in Korean won) ₩ 30,311 ₩ 49,635
Samsung Electronics Co., Ltd. and Subsidiaries
NOTES TO INTERIM CONSOLIDATED FINANCIAL STATEMENTS
41
(2) Preferred stock
(In millions of Korean won and thousands of shares,
except per share data)2015 2014
Net income available for preferred stock
and preferred stock equivalents₩ 595,12
8 ₩ 985,565Weighted-average number of shares of preferred stock
and preferred stock equivalents 19,625 19,854
Diluted earnings per preferred share (in Korean won) ₩ 30,325 ₩ 49,961
23. Cash Flows Generated from Operating Activities
Adjustments and changes in assets and liabilities arising from operating activities for the three months ended March
31, 2015 and 2014 are as follows:
- Adjustments
(In millions of Korean won) 2015 2014
Adjustments for:
Income tax expense ₩ 1,592,828 ₩ 2,074,529
Finance income (1,373,566) (1,053,766)
Finance costs 974,622 624,053
Pension 313,024 402,604
Depreciation 4,563,385 4,004,084
Amortization 305,944 252,337
Bad debt expense 72,064 128,305
Gain on valuation of equity method (55,208) (30,136)
Gain on disposal of property, plant and equipment (33,705) (43,367)
Loss on disposal of property, plant and equipment 33,074 53,309
Obsolescence and scrapping of inventories 153,840 116,600
Loss on disposal of assets classified as held-for-sale - 723,869
Dividend income (61,066) (1,307,086)
Other (162,990) (328,120)
Adjustments, total ₩ 6,322,246 ₩ 5,617,215
Samsung Electronics Co., Ltd. and Subsidiaries
NOTES TO INTERIM CONSOLIDATED FINANCIAL STATEMENTS
42
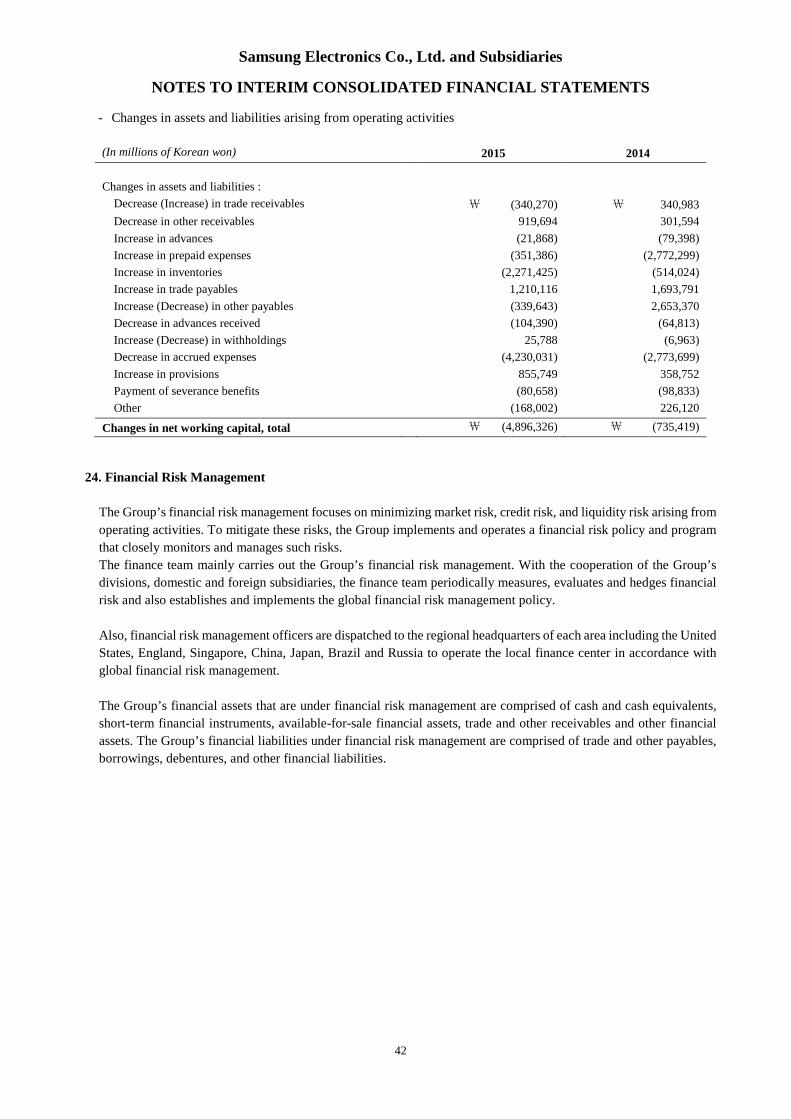
- Changes in assets and liabilities arising from operating activities
(In millions of Korean won) 2015 2014
Changes in assets and liabilities :
Decrease (Increase) in trade receivables ₩ (340,270) ₩ 340,983
Decrease in other receivables 919,694 301,594
Increase in advances (21,868) (79,398)
Increase in prepaid expenses (351,386) (2,772,299)
Increase in inventories (2,271,425) (514,024)
Increase in trade payables 1,210,116 1,693,791
Increase (Decrease) in other payables (339,643) 2,653,370
Decrease in advances received (104,390) (64,813)
Increase (Decrease) in withholdings 25,788 (6,963)
Decrease in accrued expenses (4,230,031) (2,773,699)
Increase in provisions 855,749 358,752
Payment of severance benefits (80,658) (98,833)
Other (168,002) 226,120
Changes in net working capital, total ₩ (4,896,326) ₩ (735,419)
24. Financial Risk Management
The Group’s financial risk management focuses on minimizing market risk, credit risk, and liquidity risk arising from
operating activities. To mitigate these risks, the Group implements and operates a financial risk policy and program
that closely monitors and manages such risks.
The finance team mainly carries out the Group’s financial risk management. With the cooperation of the Group’s
divisions, domestic and foreign subsidiaries, the finance team periodically measures, evaluates and hedges financial
risk and also establishes and implements the global financial risk management policy.
Also, financial risk management officers are dispatched to the regional headquarters of each area including the United
States, England, Singapore, China, Japan, Brazil and Russia to operate the local finance center in accordance with
global financial risk management.
The Group’s financial assets that are under financial risk management are comprised of cash and cash equivalents,
short-term financial instruments, available-for-sale financial assets, trade and other receivables and other financial
assets. The Group’s financial liabilities under financial risk management are comprised of trade and other payables,
borrowings, debentures, and other financial liabilities.
Samsung Electronics Co., Ltd. and Subsidiaries
NOTES TO INTERIM CONSOLIDATED FINANCIAL STATEMENTS
43
(A) Market risk
(1) Foreign exchange risk
The Group is exposed to foreign exchange risk arising from various currency exposures, primarily with respect to the
United States, European Union, South America, Japan and other Asian countries. Revenues and expenses arise from
foreign currency transactions and exchange positions, and the most widely used currencies are the US Dollar, EU’s
EURO, Japanese Yen and Chinese Yuan.
Foreign exchange risk management of the Group is carried out by both SEC and its subsidiaries. To minimize foreign
exchange risk arising from operating activities, the Group’s foreign exchange management policy requires normal
business transactions to be in local currency or for the cash-in currency to be matched up with the cash-out currency.
The Group’s foreign exchange risk management policy also defines foreign exchange risk, measuring period,
controlling responsibilities, management procedures, hedging period and hedge ratio.
The Group limits all speculative foreign exchange transactions and operates a system to manage receivables and
payables denominated in foreign currency. It evaluates, manages and reports foreign currency exposures to
receivables and payables.
(2) Price risk
The Group’s investment portfolio consists of direct and indirect investments in equity securities classified as
available-for-sale, which is in line with the Group’s strategy.
As of March 31, 2015 and December 31, 2014, a price fluctuation in relation to marketable equity securities by 1%
would result in changes in other comprehensive income (before income tax) of ₩58,183 million and ₩57,768
million, respectively.
(3) Interest rate risk
Risk of changes in interest rates for floating interest rate financial instruments is defined as the risk that the fair value
of components of the statement of financial position, and future cash flows of interest income (expenses) of a financial
instrument, will fluctuate because of changes in market interest rates. The Group is exposed to interest rate risk
mainly through interest bearing liabilities and assets. The Group’s position with regard to interest rate risk exposure
is mainly driven by its floating interest rate debt obligations and interest-bearing deposits. The Group implemented
policies and operates to minimize uncertainty arising from changes in interest rates and finance costs.
In order to avoid interest rate risk, the Group maintains minimum external borrowings by facilitating cash pooling
systems on a regional and global basis. The Group manages exposed interest rate risk via periodic monitoring and
handles risk factors on a timely basis.
Samsung Electronics Co., Ltd. and Subsidiaries
NOTES TO INTERIM CONSOLIDATED FINANCIAL STATEMENTS
44
(B) Credit risk
Credit risk arises during the normal course of transactions and investing activities where clients or other parties fail
to discharge an obligation. The Group monitors and sets the client’s and counterparty’s credit limit on a periodic
basis based on the client’s and counterparty’s financial conditions, default history and other important factors.
Credit risk can arise from transactions with financial institutions which include financial instrument transactions such
as cash and cash equivalents, savings, and derivative instruments. To minimize such risk, the Group transacts only
with banks which have strong international credit rating (S&P A and above), and all new transactions with financial
institutions with no prior transaction history are approved, managed and monitored by the Group’s finance team and
the local finance center. The Group requires separate approval for contracts with restrictions.
Most of the Group’s trade receivables are adequately insured to manage any risk, therefore, the Group estimates its
credit risk exposure to be limited. The Group estimates that its maximum exposure to credit risk is the carrying value
of its financial assets, net of impairment losses.
(C) Liquidity risk
Due to large investments made by the Group, maintaining adequate levels of liquidity risk is critical. The Group
strives to achieve this goal by periodically forecasting its capital balance, estimating required cash levels, and
managing income and expenses.
The Group manages its liquidity risk by periodically forecasting projected cash flows. If abnormal signs are identified,
the Group works with the local finance center and provides liquidity support by utilizing a globally integrated finance
structure, such as Cash Pooling. In addition, the Group maintains a liquidity management process which provides
additional financial support by the local finance center and the Group. The Cash Pooling program allows sharing of
surplus funds among entities and contributes to minimizing liquidity risk and strengthening the Group’s competitive
position by reducing capital operation expenses and financial expenses.
In addition, the Group mitigates liquidity risk by contracting with financial institutions with respect to bank overdraftsand foreign trade finance, and by providing payment guarantees to subsidiaries. For large scale facility investments,liquidity risk is minimized by utilizing internal reserves and long term borrowings according to the capital injectionschedule.
(D) Capital risk management
The purpose of capital management is to maintain a sound capital structure. The Group monitors capital on the basis
of the ratio of total liabilities to total equity. This ratio is calculated by dividing total liabilities by total equity in the
consolidated financial statements.
The Group’s capital risk management policy has not changed since the fiscal year ended December 31, 2014. As of
March 31, 2015, the Group has maintained an A+ and A1 credit rating from S&P and Moody’s, respectively, on its
long term debt.
The total liabilities to equity ratios as of March 31, 2015 and December 31, 2014 are as follows:
(In millions of Korean won) March 31, 2015 December 31, 2014
Total liabilities ₩ 59,631,070 ₩ 62,334,770
Total equity 167,619,307 168,088,188
Total liabilities to equity ratio 35.6% 37.1%
Samsung Electronics Co., Ltd. and Subsidiaries
NOTES TO INTERIM CONSOLIDATED FINANCIAL STATEMENTS
45
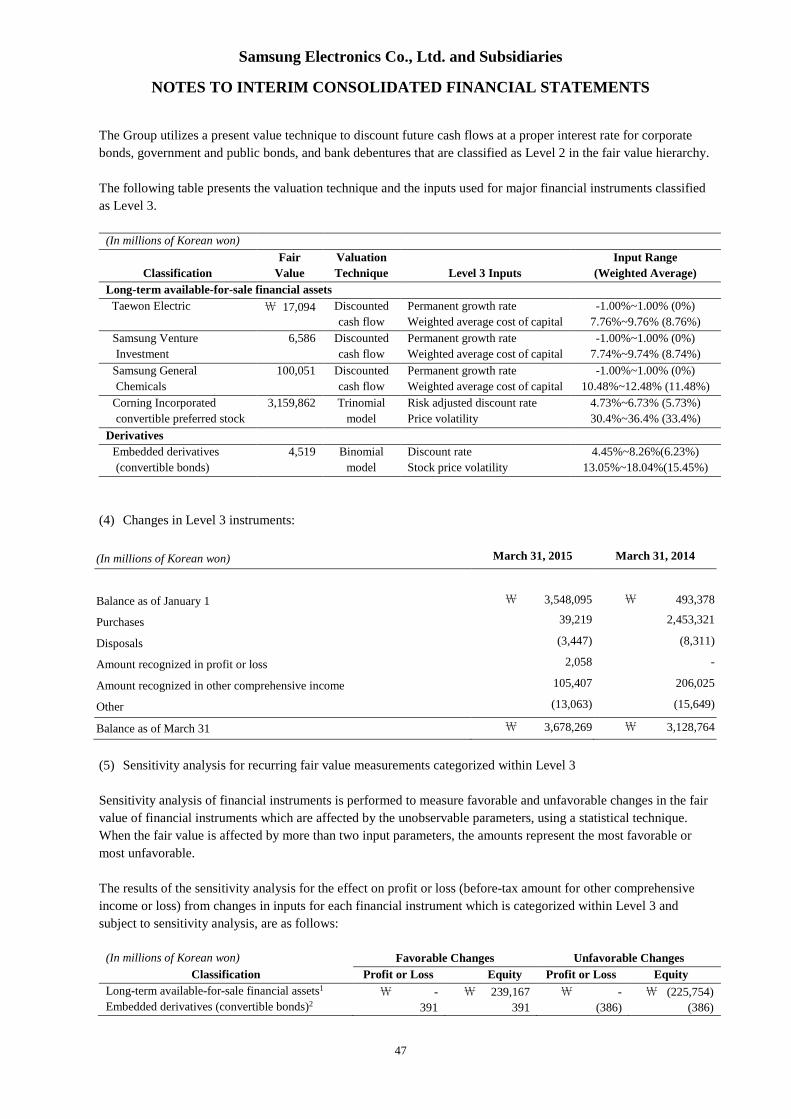
(E) Fair value estimation
(1) Carrying amounts and fair values of financial instruments by category as of March 31, 2015 and December 31,
2014 are as follows:
March 31, 2015 December 31, 2014
(In millions of Korean won) Carrying amount Fair value Carrying amount Fair value
NOTES TO INTERIM CONSOLIDATED FINANCIAL STATEMENTS
48
Total \ 391 \ 239,558 \ (386) \ (226,140)
1 Changes in fair value are calculated by increasing or decreasing the correlation between volatility (30.4~36.4%) and discount
rate for convertible preferred stock. Similarly, for other equity securities, changes in fair value are calculated with the correlation
between growth ratio (-1% to 1%) and discount rate, which are significant unobservable inputs.2 For equity derivatives, changes in their fair value are calculated by increasing or decreasing the correlation between stock
prices and volatility by 10%.
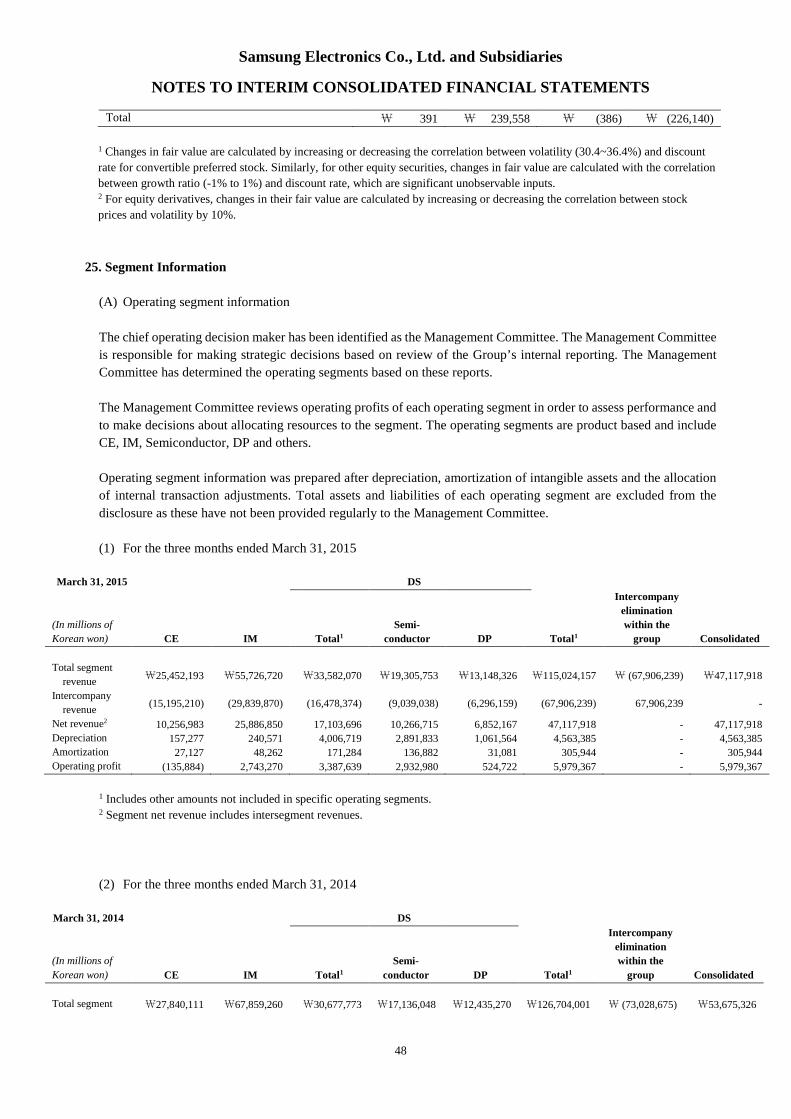
25. Segment Information
(A) Operating segment information
The chief operating decision maker has been identified as the Management Committee. The Management Committee
is responsible for making strategic decisions based on review of the Group’s internal reporting. The Management
Committee has determined the operating segments based on these reports.
The Management Committee reviews operating profits of each operating segment in order to assess performance and
to make decisions about allocating resources to the segment. The operating segments are product based and include
CE, IM, Semiconductor, DP and others.
Operating segment information was prepared after depreciation, amortization of intangible assets and the allocation
of internal transaction adjustments. Total assets and liabilities of each operating segment are excluded from the
disclosure as these have not been provided regularly to the Management Committee.
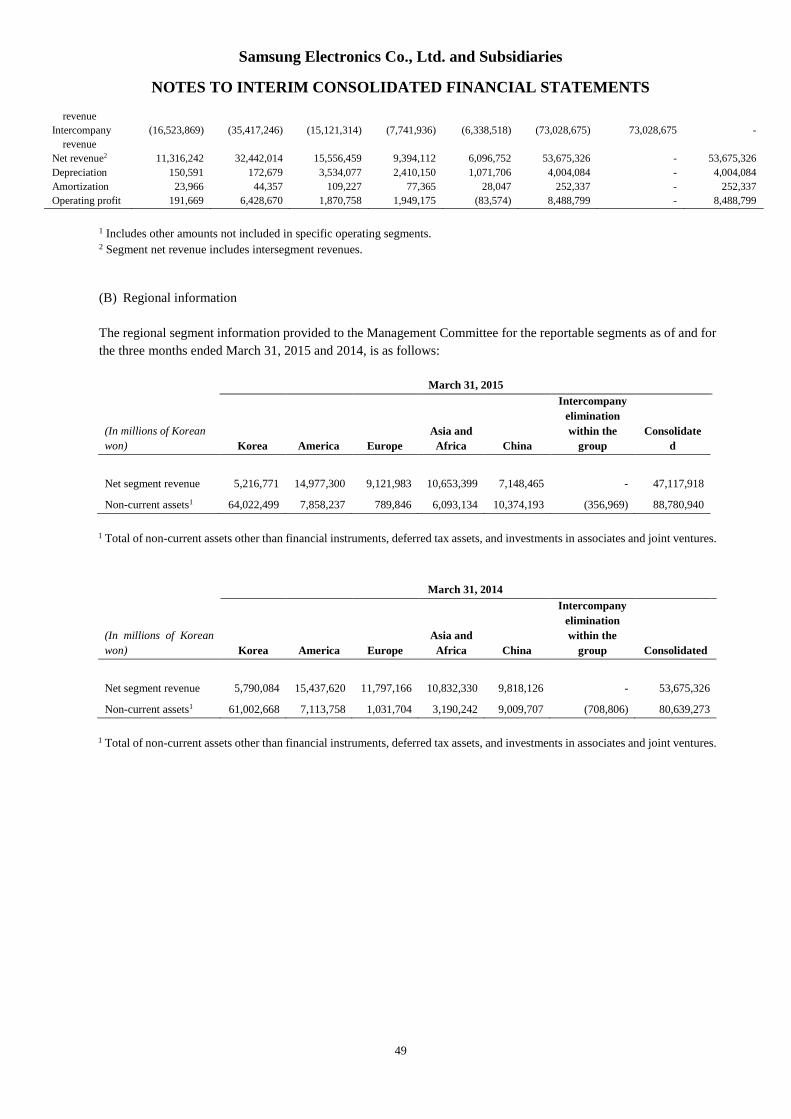
1 Total of non-current assets other than financial instruments, deferred tax assets, and investments in associates and joint ventures.
Samsung Electronics Co., Ltd. and Subsidiaries
NOTES TO INTERIM CONSOLIDATED FINANCIAL STATEMENTS
50
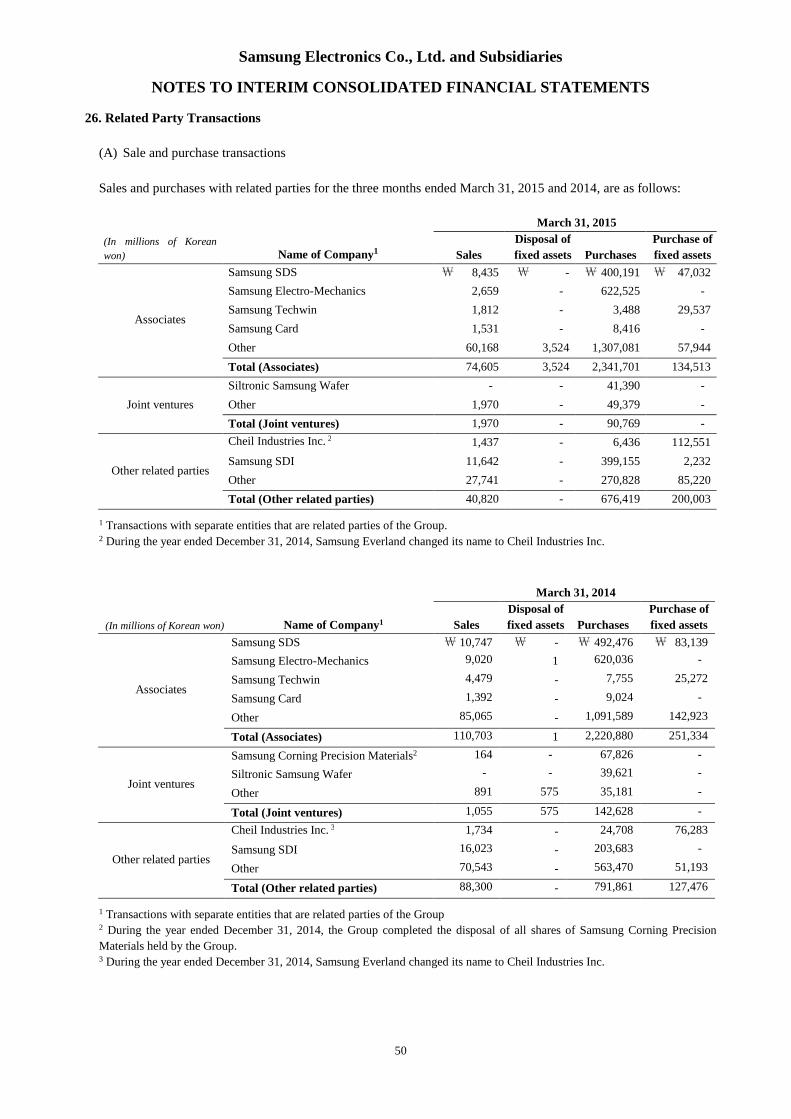
26. Related Party Transactions
(A) Sale and purchase transactions
Sales and purchases with related parties for the three months ended March 31, 2015 and 2014, are as follows:
March 31, 2015
(In millions of Korean
won) Name of Company1 Sales
Disposal of
fixed assets Purchases
Purchase of
fixed assets
Associates
Samsung SDS \ 8,435 \ - \ 400,191 \ 47,032
Samsung Electro-Mechanics 2,659 - 622,525 -
Samsung Techwin 1,812 - 3,488 29,537
Samsung Card 1,531 - 8,416 -
Other 60,168 3,524 1,307,081 57,944
Total (Associates) 74,605 3,524 2,341,701 134,513
Joint ventures
Siltronic Samsung Wafer - - 41,390 -
Other 1,970 - 49,379 -
Total (Joint ventures) 1,970 - 90,769 -
Other related parties
Cheil Industries Inc. 2 1,437 - 6,436 112,551
Samsung SDI 11,642 - 399,155 2,232
Other 27,741 - 270,828 85,220
Total (Other related parties) 40,820 - 676,419 200,003
1 Transactions with separate entities that are related parties of the Group.2 During the year ended December 31, 2014, Samsung Everland changed its name to Cheil Industries Inc.
March 31, 2014
(In millions of Korean won) Name of Company1 Sales
Total (Other related parties) 88,300 - 791,861 127,476
1 Transactions with separate entities that are related parties of the Group2 During the year ended December 31, 2014, the Group completed the disposal of all shares of Samsung Corning Precision
Materials held by the Group.3 During the year ended December 31, 2014, Samsung Everland changed its name to Cheil Industries Inc.
Samsung Electronics Co., Ltd. and Subsidiaries
NOTES TO INTERIM CONSOLIDATED FINANCIAL STATEMENTS
51
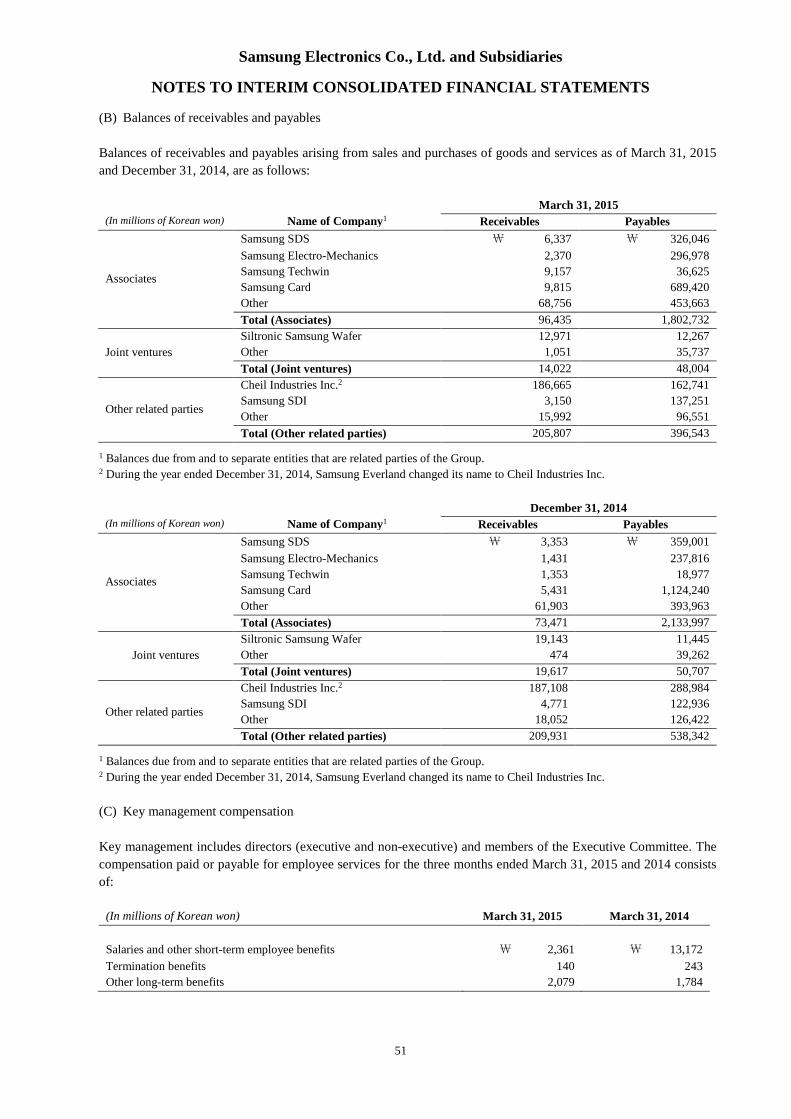
(B) Balances of receivables and payables
Balances of receivables and payables arising from sales and purchases of goods and services as of March 31, 2015
and December 31, 2014, are as follows:
March 31, 2015
(In millions of Korean won) Name of Company1 Receivables Payables
Associates
Samsung SDS \ 6,337 \ 326,046
Samsung Electro-Mechanics 2,370 296,978
Samsung Techwin 9,157 36,625
Samsung Card 9,815 689,420
Other 68,756 453,663
Total (Associates) 96,435 1,802,732
Joint ventures
Siltronic Samsung Wafer 12,971 12,267
Other 1,051 35,737
Total (Joint ventures) 14,022 48,004
Other related parties
Cheil Industries Inc.2 186,665 162,741
Samsung SDI 3,150 137,251
Other 15,992 96,551
Total (Other related parties) 205,807 396,543
1 Balances due from and to separate entities that are related parties of the Group.2 During the year ended December 31, 2014, Samsung Everland changed its name to Cheil Industries Inc.
December 31, 2014
(In millions of Korean won) Name of Company1 Receivables Payables
Associates
Samsung SDS \ 3,353 \ 359,001
Samsung Electro-Mechanics 1,431 237,816
Samsung Techwin 1,353 18,977
Samsung Card 5,431 1,124,240
Other 61,903 393,963
Total (Associates) 73,471 2,133,997
Joint ventures
Siltronic Samsung Wafer 19,143 11,445
Other 474 39,262
Total (Joint ventures) 19,617 50,707
Other related parties
Cheil Industries Inc.2 187,108 288,984
Samsung SDI 4,771 122,936
Other 18,052 126,422
Total (Other related parties) 209,931 538,342
1 Balances due from and to separate entities that are related parties of the Group.2 During the year ended December 31, 2014, Samsung Everland changed its name to Cheil Industries Inc.
(C) Key management compensation
Key management includes directors (executive and non-executive) and members of the Executive Committee. The
compensation paid or payable for employee services for the three months ended March 31, 2015 and 2014 consists
of:
(In millions of Korean won) March 31, 2015 March 31, 2014
Salaries and other short-term employee benefits \ 2,361 \ 13,172
Termination benefits 140 243
Other long-term benefits 2,079 1,784
Samsung Electronics Co., Ltd. and Subsidiaries
NOTES TO INTERIM CONSOLIDATED FINANCIAL STATEMENTS
52
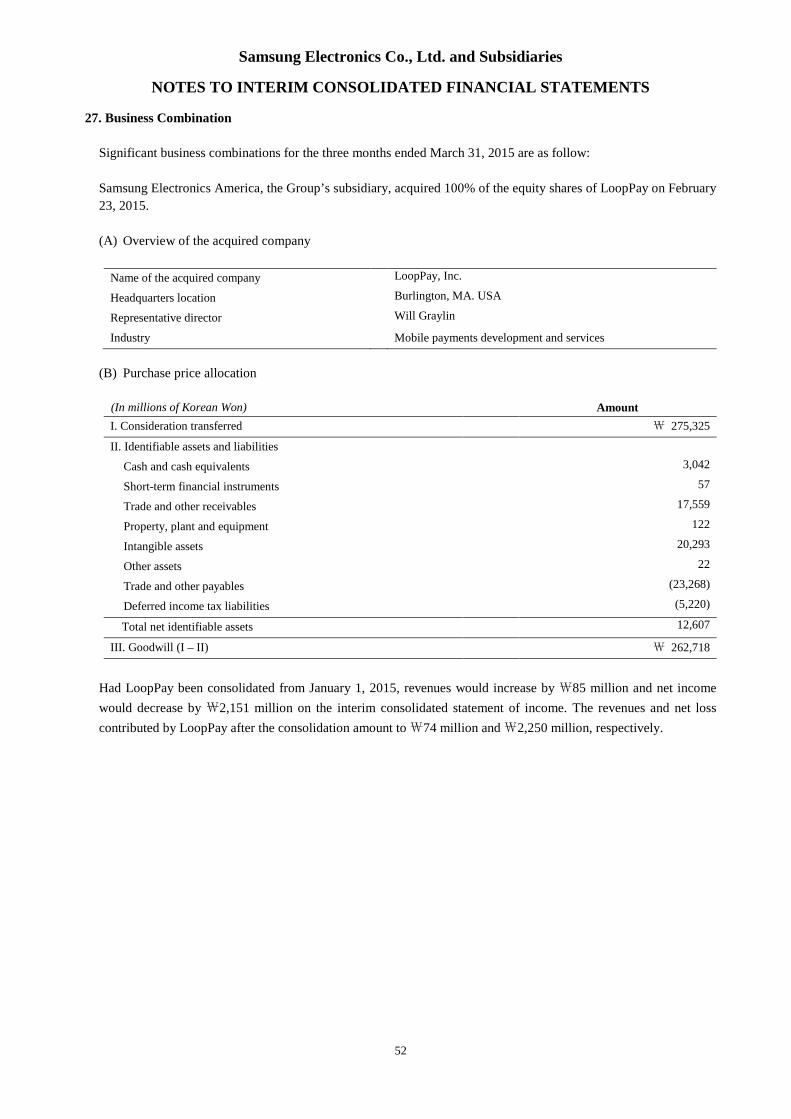
27. Business Combination
Significant business combinations for the three months ended March 31, 2015 are as follow:
Samsung Electronics America, the Group’s subsidiary, acquired 100% of the equity shares of LoopPay on February
23, 2015.
(A) Overview of the acquired company
Name of the acquired company LoopPay, Inc.
Headquarters location Burlington, MA. USA
Representative director Will Graylin
Industry Mobile payments development and services
(B) Purchase price allocation
(In millions of Korean Won) Amount
I. Consideration transferred ₩ 275,325
II. Identifiable assets and liabilities
Cash and cash equivalents 3,042
Short-term financial instruments 57
Trade and other receivables 17,559
Property, plant and equipment 122
Intangible assets 20,293
Other assets 22
Trade and other payables (23,268)
Deferred income tax liabilities (5,220)
Total net identifiable assets 12,607
III. Goodwill (I – II) ₩ 262,718
Had LoopPay been consolidated from January 1, 2015, revenues would increase by ₩85 million and net income
would decrease by ₩2,151 million on the interim consolidated statement of income. The revenues and net loss
contributed by LoopPay after the consolidation amount to₩74 million and₩2,250 million, respectively.
Samsung Electronics Co., Ltd. and Subsidiaries
NOTES TO INTERIM CONSOLIDATED FINANCIAL STATEMENTS
53
28. Non-current Assets Held-for-Sale (Assets of disposal group)
(A) Summary
(1) Sale of Samsung Techwin Co., Ltd.
During the year ended December 31, 2014, the management of the Group decided to sell all its shares of Samsung
Techwin Co., Ltd. to Hanwha Corporation. The contract was entered into on November 26, 2014, and the transaction
and associated due diligence will be completed by June 2015.
(2) Sale of Samsung General Chemicals Co., Ltd.
During the year ended December 31, 2014, the management of the Group decided to sell all its shares of Samsung
General Chemicals Co., Ltd. to Hanwha Chemical and Hanwha Energy Corporation, and the transaction was
completed in April 2015.
(3) Sale of Optical Materials business segment
During the year ended December 31, 2014, the management of the Group decided to sell the Optical Materials
business segment and accordingly, the related assets and liabilities are classified as held-for-sale. Since the business
does not represent a separate major line of the Group, related profit or loss was not presented as profit or loss of
discontinued operations. The contract was entered into on December 2, 2014, and the transaction was completed in
March 2015.
(B) Details of assets and liabilities reclassified as held-for-sale, as of March 31, 2015 and December 31, 2014 are as
follows:
(In millions of Korean Won) March 31, 2015 December 31, 2014
Assets held-for-sale
Trade receivables - ₩ 60,173
Inventories - 9,703
Other current assets - 22,523
Property, plant and equipment - 37,955
Investment 511,441 511,441
Other non-current assets - 3,696
Total 511,441 ₩ 645,491
Liabilities held-for-sale
Current liabilities - ₩ 25,939
Non-current liabilities - 2,377
Total - ₩ 28,316
Impairment loss recognized in 2014 from the reclassification of assets and liabilities held-for-sale amounts to
\ 31,219 million.
Samsung Electronics Co., Ltd. and Subsidiaries
NOTES TO INTERIM CONSOLIDATED FINANCIAL STATEMENTS
54
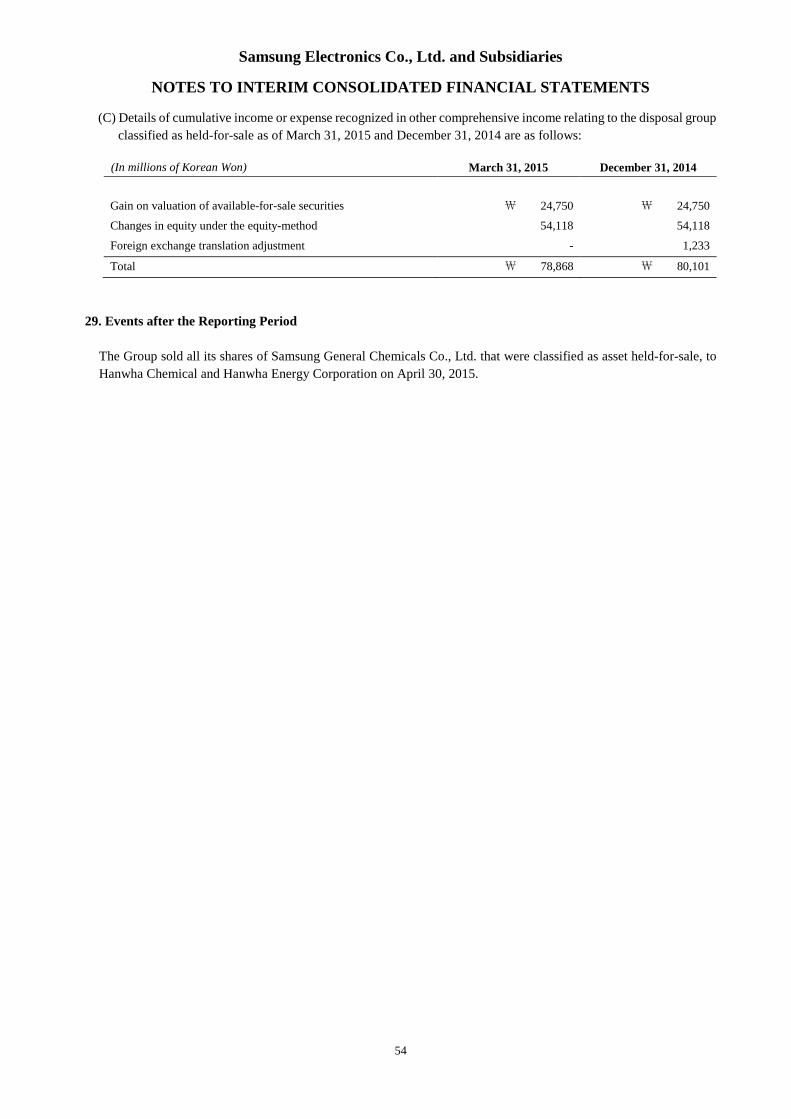
(C) Details of cumulative income or expense recognized in other comprehensive income relating to the disposal group
classified as held-for-sale as of March 31, 2015 and December 31, 2014 are as follows:
(In millions of Korean Won) March 31, 2015 December 31, 2014
Gain on valuation of available-for-sale securities ₩ 24,750 ₩ 24,750
Changes in equity under the equity-method 54,118 54,118
Foreign exchange translation adjustment - 1,233
Total ₩ 78,868 ₩ 80,101
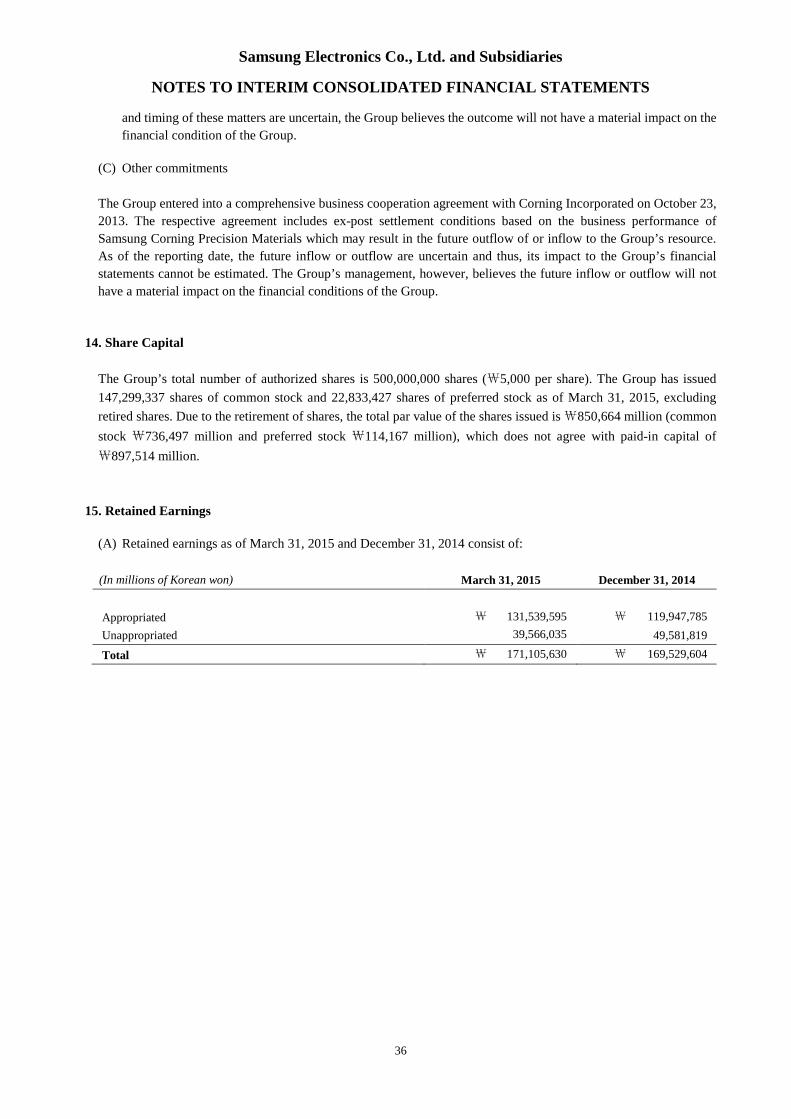
29. Events after the Reporting Period
The Group sold all its shares of Samsung General Chemicals Co., Ltd. that were classified as asset held-for-sale, to
Hanwha Chemical and Hanwha Energy Corporation on April 30, 2015.