SAMSUNG SDS CO., LTD. AND ITSSUBSIDIARIES
CONSOLIDATED FINANCIAL STATEMENTSAS OF AND FOR THE YEARS ENDEDDECEMBER 31, 2018 AND 2017
ATTACHMENT: INDEPENDENT AUDITORS’ REPORT
SAMSUNG SDS CO., LTD.
INDEPENDENT AUDITORS’ REPORT
English Translation of Independent Auditors’ Report Originally Issued in Korean on March 12, 2019.
To the Shareholders and the Board of Directors of
Samsung SDS Co., Ltd.:
Our Opinion
We have audited the accompanying consolidated financial statements of Samsung SDS Co., Ltd. (the
“Company”) and its subsidiaries (the “Group”), which comprise the consolidated statements of financial position
as of December 31, 2018 and 2017, and the consolidated statements of comprehensive income, consolidated
statements of changes in shareholders’ equity and consolidated statements of cash flows, all expressed in Korean
won, for the years then ended, and a summary of significant accounting policies and other explanatory
information.
In our opinion, the consolidated financial statements present fairly, in all material respects, the financial position
of the Company as of December 31, 2018 and 2017, and its financial performance and its cash flows for the years
then ended in accordance with Korean International Financial Reporting Standards (“K-IFRS”).
Basis for Audit Opinion
We conducted our audits in accordance with the Korean Standards on Auditing (“KSAs”). Our responsibilities
under those standards are further described in the Auditors Responsibilities for the Audit of the Financial
Statements section of our report. We are independent of the Group in accordance with the ethical requirements,
including those related to independence, that are relevant to our audit of the consolidated financial statements in
the Republic of Korea as required by prevailing audit regulations. We believe that the audit evidence we have
obtained is sufficient and appropriate to provide a basis for our opinion.
Key Audit Matters The key audit matters are those matters that, in our professional judgment, were of most significance in our audit
of the consolidated financial statements of the current period. These matters were addressed in the context of
our audit of the consolidated financial statements as a whole, and in forming our audit opinion thereon, and we
do not provide a separate opinion on these matters.
- Recognition of the gain or loss in accordance with the modification of project
1) Reasons why the matter was determined to be a key audit matter
The Group's information processing system implementation, and software development (below 'SI sales")
revenue is recognized over period. (see Note 2.(6)). For SI sales, changes in scope, period and contract amount
may occur upon request from the customer to change the project. The Group's management maintains that in
the event of a modification in the project, changes in the estimated total contract cost involved and gain or loss
are properly recognized. The Group recognized ₩556,881 million SI revenue (10% of IT service revenue, see
Note 23) in which the project modification occurred during the current period.
SI sales amounts in which the project modification occurred is material to the consolidated financial statements.
For these reasons, we determined recognition of the gain or loss in accordance with the modification of project as
key audit matter.
Deloitte Anjin LLC9F., One IFC,10, Gukjegeumyung-ro,Youngdeungpo-gu, Seoul07326, Korea
Tel: +82 (2) 6676 1000Fax: +82 (2) 6674 2114www.deloitteanjin.co.kr
2) How we addressed the Key Audit Matter in our audit procedures
Our audit procedures performed on recognition of the gain or loss in accordance with the modification of
project are as below.
When changing the terms of the contract, including the amount of the contract. Understand and evaluate the
internal control design associated with the recognition of the revenue, and question and review on the
documentation for which the process is reviewed by the rightful approver
Review redetermined contract amount with the supporting documentation, when the modification of project
occurred
Questions and Analytical Reviews on the Reasons when the changes of contract amounts are material
Review the redetermined estimated total contract cost related to modified project with the supporting
documentation and calculation of related gain and loss
A retrospective review of contracts with the estimated total contract cost significant changes related to the
modified project at the end of the period and after
Responsibilities of Management and Those Charged with Governance for the Consolidated Financial
Statements
Management is responsible for the preparation of the accompanying consolidated financial statements in
accordance with K-IFRS, and for such internal control as they determine is necessary to enable the preparation of
consolidated financial statements that are free from material misstatement, whether due to fraud or error.
In preparing the consolidated financial statements, management of the Group is responsible for assessing the
Group’s ability to continue as a going concern, disclosing, as applicable, matters related to going concern and
using the going-concern basis of accounting unless management either intends to liquidate the Group or to cease
operations, or has no realistic alternative but to do so.
Those charged with governance’ responsibilities include overseeing the Group’s financial reporting process.
Auditor’s Responsibilities for the Audit of the Consolidated Financial Statements
Our objectives are to obtain reasonable assurance about whether the consolidated financial statements as a whole
are free from material misstatement, whether due to fraud or error, and to issue an auditors’ report that includes
our opinion. Reasonable assurance is a high level of assurance, but is not a guarantee that an audit conducted in
accordance with KSAs will always detect a material misstatement when it exists. Misstatements can arise from
fraud or error and are considered material if, individually or in the aggregate, they could reasonably be expected
to influence the economic decisions of users taken on the basis of these consolidated financial statements.
As part of an audit in accordance with KSAs, we exercise professional judgment and maintain professional
skepticism throughout the audit. We also:
Identify and assess the risks of material misstatement of the consolidated financial statements, design and
perform audit procedures responsive to those risks and obtain audit evidence that is sufficient and appropriate
to provide a basis for our opinion. The risk of not detecting a material misstatement resulting from fraud is
higher than for one resulting from error, as fraud may involve collusion, forgery, intentional omissions,
misrepresentations or the override of internal control.
Obtain an understanding of internal control relevant to the audit in order to design audit procedures that are
appropriate in the circumstances, but not for the purpose of expressing an opinion on the effectiveness of the
Group’s internal control.
Evaluate the appropriateness of accounting policies used and the reasonableness of accounting estimates and
related disclosures made by management.
Conclude on the appropriateness of the management’s use of the going-concern basis of accounting and,
based on the audit evidence obtained, whether a material uncertainty exists related to events or conditions that
may cast significant doubt on the Group’s ability to continue as a going concern. If we conclude that a
material uncertainty exists, we are required to draw attention in our auditors’ report to the related disclosures
in the consolidated financial statements or, if such disclosures are inadequate, to modify our opinion. Our
conclusions are based on the audit evidence obtained up to the date of our auditors’ report. However, future
events or conditions may cause the Group to cease to continue as a going concern.
Evaluate the overall presentation, structure and content of the consolidated financial statements, including the
disclosures, and whether the consolidated financial statements represent the underlying transactions and
events in a manner that achieves fair presentation.
Obtain sufficient appropriate audit evidence regarding the financial information of the entities or business
activities within the Group to express an opinion on the consolidated financial statements. We are
responsible for the direction, supervision and performance of the group audit. We are solely responsible for
our audit opinion.
We communicate with those charged with governance of the Group regarding, among other matters, the planned
scope and timing of the audits and significant audit findings, including any significant deficiencies in internal
control that we identify during our audits.
We also provide those charged with governance of the Group with a statement that we have complied with
relevant ethical requirements, including those related to independence, and to communicate with them all matters
that may reasonably be thought to bear on our independence, and where applicable, related safeguards.
From the matters communicated with those charged with governance, we determine those matters that were of
most significance in the audit of the consolidated financial statements of the current period and are therefore the
key audit matters. We describe these matters in our auditors’ report unless law or regulation precludes public
disclosure about the matter.
The engagement partner on the audit resulting in this independent auditors’ report is Son, Jaeho.
March 12, 2019
Notice to Readers
This report is effective as of March 12, 2019, the auditors’ report date. Certain subsequent events or
circumstances may have occurred between the auditors’ report date and the time the auditors’ report is read.
Such events or circumstances could significantly affect the consolidated financial statements and may result in
modifications to the auditors’ report.
SAMSUNG SDS CO., LTD. AND ITS SUBSIDIARIES (the “Group”)
CONSOLIDATED FINANCIAL STATEMENTS AS OF AND FOR THE YEARS ENDED DECEMBER 31, 2018 AND 2017
“The accompanying consolidated financial statements, including all footnote disclosures, were
prepared by, and are the responsibility of, the Group.”
Hong, Won Pyo
President and Chief Executive Officer
SAMSUNG SDS CO., LTD.
SAMSUNG SDS CO., LTD. AND ITS SUBSIDIARIES
CONSOLIDATED STATEMENTS OF FINANCIAL POSITION
AS OF DECEMBER 31, 2018 AND 2017
Korean won
Notes December 31, 2018 December 31, 2017
ASSETS:
CURRENT ASSETS:
Cash and cash equivalents 5 and 7 ₩ 1,161,683,996,643 ₩ 931,461,393,278
Short-term financial instruments 6 and 7 2,510,284,469,888 1,993,797,925,148
Trade receivables 7 and 9 1,291,751,923,940 1,209,629,541,269
Other receivables 7, 9 and 23 705,745,458,041 752,347,002,331
Prepayments 44,176,075,255 50,929,792,621
Prepaid expenses 67,265,138,198 60,612,034,305
Inventories 10 18,774,414,708 24,760,255,484
Other current assets 7 and 9 82,094,810,348 93,960,630,430
Total current assets 5,881,776,287,021 5,117,498,574,866
NON-CURRENT ASSETS:
Available-for-sale financial assets 7, 8, 11 and 30 - 12,651,779,719
Fair value through profit or loss (FVPL) 7, 8, 11 and 30 3,643,123,202 -
Fair value through
other comprehensive income (FVOCI)
7, 8, 11 and 30
22,934,357,054
-
Investments in associates 13 43,993,605,770 40,540,078,417
Property and equipment 4 and 14 1,068,725,507,567 1,028,557,824,366
Intangible assets 4 and 15 844,969,106,310 934,859,502,433
Deposits 7 69,754,328,207 66,995,507,157
Long-term prepaid expenses 239,673,339 357,450,549
Deferred tax assets 28 34,928,672,689 32,572,487,036
Net defined benefit assets 18 - 18,475,464,964
Other non-current assets 6, 7 and 9 42,884,729,555 25,252,210,300
Total non-current assets 2,132,073,103,693 2,160,262,304,941
Total assets ₩ 8,013,849,390,714 ₩ 7,277,760,879,807
LIABILITIES:
CURRENT LIABILITIES:
Trade payables 7 and 30 ₩ 553,320,727,257 ₩ 443,247,815,452
Other payables 7 and 30 86,246,212,056 67,797,699,978
Short-term borrowings 7, 16, 19 and 30 774,724,000 820,296,000
Current portion of corporate bond 7,16 and 30 - 10,000,000
Advances received 23 136,026,841,259 156,455,270,861
Withholdings 13,638,047,892 13,695,212,967
Accrued expenses 7 and 30 530,638,197,561 423,284,546,673
Income tax payable 144,206,747,497
97,148,199,186
Current portion of provisions 17 18,630,738,697 15,899,051,770
Other current liabilities 7 and 30 91,314,141,348 106,504,445,697
Total current liabilities 1,574,796,377,567 1,324,862,538,584
NON-CURRENT LIABILITIES:
Net defined benefit liabilities 18 40,822,200,125 10,926,995,813
Deferred tax liabilities 28 175,950,146,216 164,663,348,882
Corporate bond 7, 16 and 30 10,000,000 -
Long-term accrued expenses 7 and 30 51,418,608,045 38,608,592,197
Provisions 17 17,195,182,991 14,847,659,688
Other non-current liabilities 7 5,104,691,400 4,422,308,000
Total non-current liabilities 290,500,828,777 233,468,904,580
Total liabilities 1,865,297,206,344 1,558,331,443,164
(Continued)
SAMSUNG SDS CO., LTD. AND ITS SUBSIDIARIES
CONSOLIDATED STATEMENTS OF FINANCIAL POSITION (CONTINUED)
AS OF DECEMBER 31, 2018 AND 2017
Korean won
Notes December 31, 2018 December 31, 2017
SHAREHOLDERS’ EQUITY:
Common stock 20 ₩ 38,688,900,000 ₩ 38,688,900,000
Share premium 1,297,466,852,618 1,297,466,852,618
Retained earnings 21 4,821,746,821,634 4,347,047,622,867
Other component of equity 22 (175,447,564,604) (124,924,831,837)
Non-controlling interests 166,097,174,722 161,150,892,995
Total shareholders’ equity 6,148,552,184,370 5,719,429,436,643
Total liabilities and shareholders’ equity ₩ 8,013,849,390,714 ₩ 7,277,760,879,807
(Concluded)
See notes.
SAMSUNG SDS CO., LTD. AND ITS SUBSIDIARIES
CONSOLIDATED STATEMENTS OF COMPREHENSIVE INCOME
FOR THE YEARS ENDED DECEMBER 31, 2018 AND 2017
Korean won
Notes 2018 2017
REVENUES 4, 23 and 31 ₩10,034,218,901,478 ₩ 9,299,206,129,920
COST OF REVENUES
24 and 31 8,369,829,634,622 7,804,602,140,616
GROSS PROFIT
1,664,389,266,856 1,494,603,989,304
SELLING AND ADMINISTRATIVE EXPENSES
24 and 25 787,033,453,660 763,044,840,695
OPERATING PROFIT
4 877,355,813,196 731,559,148,609 NON-OPERATING ITEMS:
Other non-operating income
26 and 31
29,243,729,251
41,215,803,934
Other non-operating expenses 26 and 31 28,111,462,915 37,251,002,915
Finance income 27 135,575,773,191 90,197,224,346
Finance expenses 27 60,559,477,429 76,086,747,335
Gain (loss) on valuation/disposal of
investments in associates, net
13 3,026,371,038 2,461,278,648
79,174,933,136 20,536,556,678
PROFIT BEFORE INCOME TAX EXPENSE 956,530,746,332 752,095,705,287
INCOME TAX EXPENSE
28 317,738,487,919 210,323,428,014
NET INCOME
638,792,258,413 541,772,277,273
OTHER COMPREHENSIVE INCOME (LOSS):
Item not subsequently reclassified to net income:
Remeasurement of net defined benefit liabilities 18 (67,590,731,350) 24,783,402,057
Valuation gain (loss) on fair value through
other comprehensive income 11 7,534,531,931 -
(60,056,199,419) 24,783,402,057
Items subsequently reclassified to net income:
Valuation gain (loss) on AFS financial
assets
11 - 2,177,512,468
Capital change in equity method 13 590,356,315 (2,723,317,587)
Cumulative effect of foreign currency translation 6,692,905,152 (88,031,612,812)
7,283,261,467 (88,577,417,931)
(52,772,937,952) (63,794,015,874)
TOTAL COMPREHENSIVE INCOME ₩ 586,019,320,461 ₩ 477,978,261,399
(Continued)
SAMSUNG SDS CO., LTD. AND ITS SUBSIDIARIES
CONSOLIDATED STATEMENTS OF COMPREHENSIVE INCOME (CONTINUED)
FOR THE YEARS ENDED DECEMBER 31, 2018 AND 2017
Korean won Notes 2018 2017
NET INCOME ATTRIBUTABLE TO:
Owners of the Group ₩ 629,399,570,767 ₩ 530,347,610,989 Non-controlling interests 9,392,687,646 11,424,666,284
COMPREHENSIVE INCOME ATTRIBUTABLE TO:
Owners of the Group 579,565,395,281 466,762,850,365
Non-controlling interests 6,453,925,180 11,215,411,034
EARNINGS PER SHARE:
Basic earnings per share 32 ₩ 8,137 ₩ 6,856
Diluted earnings per share 32 ₩ 8,137 ₩ 6,856
(Concluded)
See notes.
SA
MS
UN
G S
DS
CO
., L
TD
. A
ND
IT
S S
UB
SID
IAR
IES
CO
NS
OL
IDA
TE
D S
TA
TE
ME
NT
S O
F C
HA
NG
ES
IN
SH
AR
EH
OL
DE
RS
’ E
QU
ITY
FO
R T
HE
YE
AR
S E
ND
ED
DE
CE
MB
ER
31
, 2
01
8 A
ND
20
17
Ko
rean
won
Com
mon s
tock
S
har
e pre
miu
m
Ret
ained
ear
nin
gs
Oth
er c
om
ponen
t
of
equit
y
Subto
tal
N
on-c
ontr
ollin
g
in
tere
sts
Tota
l
Bala
nce a
s of
Ja
nu
ary
1, 201
7
₩
38,6
88
,900
,00
0 ₩
1
,297
,46
6,8
52
,618
₩
3
,874
,71
2,6
51
,378 ₩
(7
0,1
73,9
02
,172
) ₩
5
,140
,69
4,5
01
,824 ₩
1
50
,42
9,5
92
,757 ₩
5
,291
,12
4,0
94
,581
Co
mp
reh
en
sive i
nco
me
- -
530
,34
7,6
10
,989
(63
,58
4,7
60
,624
) 4
66
,76
2,8
50
,365
11,2
15
,411
,03
4
477
,97
8,2
61
,399
Net
inco
me
- -
530
,34
7,6
10
,989
- 5
30
,34
7,6
10
,989
11,4
24
,666
,28
4
541
,77
2,2
77
,273
Val
uat
ion
gai
n (
loss
) on
AF
S f
inan
cial
asse
ts
- -
- 2
,153
,46
5,5
80
2,1
53
,46
5,5
80
24,0
46
,888
2,1
77
,51
2,4
68
Cap
ital
ch
ange
in e
qu
ity m
eth
od
- -
- (2
,723
,317
,58
7)
(2,7
23
,317
,58
7)
- (2
,723
,317
,58
7)
Rem
easu
rem
ent
of
the
net
def
ined
ben
efit
liab
ilit
ies
-
-
-
24,9
51
,126
,35
8
24,9
51
,126
,35
8
(167
,724
,30
1)
24,7
83
,402
,05
7
Cu
mu
lati
ve
effe
ct o
f fo
reig
n c
urr
ency
tran
slat
ion
-
-
-
(87
,96
6,0
34
,975
)
(87
,96
6,0
34
,975
)
(65
,57
7,8
37
)
(88
,03
1,6
12
,812
)
Tra
nsa
cti
on
s w
ith
sh
are
hold
ers
- -
(58
,01
2,6
39
,500
) 8
,833
,83
0,9
59
(49
,17
8,8
08
,541
) (4
94
,110
,79
6)
(49
,67
2,9
19
,337
) D
ivid
end
s -
- (5
8,0
12,6
39
,500
) -
(58
,01
2,6
39
,500
) (1
,522
,447
,25
0)
(59
,53
5,0
86
,750
)
Chan
ges
in
ow
ner
ship
in
tere
sts
in
sub
sid
iari
es
-
-
-
8
,833
,83
0,9
59
8
,833
,83
0,9
59
1
,028
,33
6,4
54
9
,862
,16
7,4
13
Bala
nce a
s of
Decem
ber 3
1, 2
017
₩
3
8,6
88
,900
,00
0 ₩
1
,297
,46
6,8
52
,618
₩
4
,347
,04
7,6
22
,867 ₩
(1
24
,924
,83
1,8
37
) ₩
5
,558
,27
8,5
43
,648 ₩
1
61
,15
0,8
92
,995 ₩
5
,719
,42
9,4
36
,643
Bala
nce a
s of
Ja
nu
ary
1, 201
8
₩
38,6
88
,900
,00
0 ₩
1
,297
,46
6,8
52
,618
₩
4
,347
,04
7,6
22
,867 ₩
(1
24
,924
,83
1,8
37
) ₩
5
,558
,27
8,5
43
,648 ₩
1
61
,15
0,8
92
,995 ₩
5
,719
,42
9,4
36
,643
Co
mp
reh
en
sive i
nco
me
-
- 6
29
,39
9,5
70
,767
(49
,83
4,1
75
,126
) 5
79
,56
5,3
95
,641
6,4
53
,92
5,1
80
586
,01
9,3
20
,821
Net
inco
me
- -
629
,39
9,5
70
,767
- 6
29
,39
9,5
70
,767
9,3
92
,68
7,6
46
638
,79
2,2
58
,413
Val
uat
ion
gai
n (
loss
) on
FV
OC
I
- -
- 7
,437
,21
2,8
91
7,4
37
,21
2,8
91
97,3
19
,040
7,5
34
,53
1,9
31
Cap
ital
ch
ange
in e
qu
ity m
eth
od
-
- -
590
,35
6,3
15
590
,35
6,3
15
- 5
90
,35
6,3
15
Rem
easu
rem
ent
of
the
net
def
ined
ben
efit
liab
ilit
ies
-
-
-
(6
4,2
55,2
24
,105
)
(64
,25
5,2
24
,105
)
(3,3
35
,507
,24
5)
(6
7,5
90,7
31
,350
) C
um
ula
tive
effe
ct o
f fo
reig
n c
urr
ency
tran
slat
ion
-
-
-
6
,393
,47
9,7
73
6
,393
,47
9,7
73
2
99
,42
5,7
39
6
,692
,90
5,5
12
Tra
nsa
cti
on
s w
ith
sh
are
hold
ers
-
-
(154
,700
,37
2,0
00
)
(688
,557
,64
1)
(1
55
,388
,92
9,6
41
)
(1,5
07
,643
,45
3)
(1
56
,896
,57
3,0
94
) D
ivid
end
s -
- (1
54
,700
,37
2,0
00
) -
(154
,700
,37
2,0
00
) (2
,294
,963
,50
0)
(156
,995
,33
5,5
00
)
Chan
ges
in
ow
ner
ship
in
tere
sts
in
sub
sid
iari
es
-
-
-
(6
88
,557
,64
1)
(6
88
,557
,64
1)
7
87
,32
0,0
47
9
8,7
62
,406
Bala
nce a
s of
Decem
ber 3
1, 2
018
₩
3
8,6
88
,900
,00
0 ₩
1
,297
,46
6,8
52
,618
₩
4
,821
,74
6,8
21
,634 ₩
(1
75
,447
,56
4,6
04
) ₩
5
,982
,45
5,0
09
,648 ₩
1
66
,09
7,1
74
,722 ₩
6
,148
,55
2,1
84
,370
See
no
tes.
SAMSUNG SDS CO., LTD. AND ITS SUBSIDIARIES
CONSOLIDATED STATEMENTS OF CASH FLOWS
FOR THE YEARS ENDED DECEMBER 31, 2018 AND 2017
Korean won
Note 2018 2017
CASH FLOWS FROM OPERATING ACTIVITIES:
Cash generated from operating activities 29 ₩ 1,330,749,415,211 ₩ 968,922,950,760
Interest received 61,863,057,751 30,259,865,840
Interest paid (38,569,693) (614,144,156)
Dividends received 15,900,000 18,175,000
Income taxes paid (196,058,249,099) (163,739,656,158)
1,196,531,554,170 834,847,191,286
CASH FLOWS FROM INVESTING ACTIVITIES:
Net increase in short-term financial instruments (516,486,544,740) (761,199,121,276)
Decrease (increase) in other current asset (7,004,809,295) 621,650,641
Decrease (increase) in long-term financial instruments (18,097,027,818) 4,500,000
Disposal of property and equipment 1,509,595,861 1,561,431,367
Disposal of intangible assets 5,888,893 106,430,563
Disposal of AFS financial assets - 2,882,572
Decrease in deposits 8,174,848,980 519,211,000
Acquisition of property and equipment (251,434,878,395) (192,068,771,788)
Acquisition of intangible assets (26,121,127,847) (30,684,845,524)
Increase in deposits (8,187,779,534) (419,987,625)
Acquisition of FVOCI (2,139,000,000) (2,313,599,745)
Decrease (increase) in other non-current assets 1,224,556,867 13,447,596,518
(818,556,277,028) (970,422,623,297)
CASH FLOWS FROM FINANCING ACTIVITIES:
Proceed (repayments) from short-term borrowings - (1,788,187,040)
Repayment of current portion of long-term borrowings - (4,079,731,662)
Issues of corporate bond 10,000,000 -
Repayment of corporate bond (10,000,000) -
Dividends (156,995,335,500) (59,535,086,750)
Decrease (increase) in other non-current liabilities - (3,016,809,889)
Payment of non-controlling interests 787,320,047 774,385,884
(156,208,015,453) (67,645,429,457) NET INCREASE (DECREASE) IN CASH AND
CASH EQUIVALENTS 221,767,261,689 (203,220,861,468)
CASH AND CASH EQUIVALENTS,
BEGINNING OF YEAR 931,461,393,278 1,190,227,458,620
EFFECT OF EXCHANGE RATE CHANGE ON
CASH AND CASH EQUIVALENTS 8,455,341,676 (55,545,203,874)
CASH AND CASH EQUIVALENTS,
END OF YEAR ₩ 1,161,683,996,643 ₩ 931,461,393,278
See notes.
SAMSUNG SDS CO., LTD. AND ITS SUBSIDIARIES
NOTES TO CONSOLIDATED FINANCIAL STATEMENTS
AS OF DECEMBER 31, 2018 AND 2017,
AND FOR THE YEARS ENDED DECEMBER 31, 2018 AND 2017
1. GENERAL:
Samsung SDS Co., Ltd. (the “Company”) and its subsidiaries (collectively, the “Group”) have prepared the
consolidated financial statements in accordance with Korean International Financial Reporting Standards (“K-
IFRS”) 1110, Consolidated Financial Statements. The Company was incorporated in 1985 to engage in the
information processing system implementation, software development and professional service related to
information processing technology. The Company has provided Information Technology (“IT”) services,
including cloud and IT Outsourcing (“ITO”) with a majority of companies and Samsung Group. In addition, the
Company offers global logistics BPO based on business solutions, and Supply Chain Management (“SCM”)
consulting.
The Company is located at 125 Olympic-ro 35-gil, Songpa-gu, Seoul, Republic of Korea. The Company's
common shares were listed on the Stock Market of Korea Exchange in 2014. As of December 31, 2018, the
capital stock of the Company is ₩38,689 million, and the shareholders are as follows:
Number of shares Ownership (%)
Samsung Electronics Co., Ltd. 17,472,110 22.58%
Samsung C&T Corporation 13,215,822 17.08%
Lee, Jae-yong 7,116,555 9.20%
Lee, Bu-jin 3,018,859 3.90%
Lee, Suh-hyeon 3,018,859 3.90%
Others 33,535,595 43.34%
77,377,800 100.00%
2. SUMMARY OF SIGNIFICANT ACCOUNTING POLICIES:
The Group has prepared the consolidated financial statements in accordance with the Korean International Financial
Reporting Standards (“K-IFRSs. The principal accounting policies are set out below. Except for the effect of the
amendments to K-IFRSs and new interpretations set out below, the principal accounting policies used to prepare the
consolidated financial statements as of and for the year ended December 31, 2018, are consistent with the
accounting policies used to prepare the consolidated financial statements as of and for the year ended December 31,
2017.
The accompanying consolidated financial statements have been prepared on a historical cost basis, except for
certain non-current assets and financial instruments that are measured at fair values, as explained in the accounting
policies below. Historical cost is based on the fair values of the consideration given.
Fair value is the price that would be received to sell an asset or paid to transfer a liability in an orderly transaction
between market participants at the measurement date, regardless of whether that price is directly observable or
estimated using another valuation technique. In estimating the fair value of an asset or a liability, the Group takes
into account the characteristics of the asset or liability if market participants would take those characteristics into
account when pricing the asset or liability at the measurement date. Fair value for measurement and/or disclosure
purposes in these consolidated financial statements is determined on such a basis, except for share-based payment
transactions that are within the scope of K-IFRS 1102 Share-based payment, leasing transactions that are within the
scope of K-IFRS 1017 Leases, and measurements that have some similarities to fair value but are not fair value,
such as net realizable value in K-IFRS 1002 Inventories or value in use in K-IFRS 1036 Impairment of Assets.
- 2 -
(1) Amendments to K-IFRSs and new interpretations that are mandatorily effective for the current year
In the current year, the Group has applied a number of amendments to K-IFRSs and new interpretations issued that
are mandatorily effective accounting periods beginning on or after January 1, 2018.
K-IFRS 1109, Financial Instruments (Enactment)
The Group has applied K-IFRS 1109 Financial Instruments and the related consequential amendments to other
IFRS standards that are effective for an annual period that begins on or after January 1, 2018. K-IFRS 1109
introduced new requirements for:
1) The classification and measurement of financial assets and financial liabilities,
2) Impairment of financial assets, and
3) General hedge accounting.
Additionally, the Group adopted consequential amendments to K-IFRS 1107 Financial Instruments: Disclosures
that were applied to the disclosures for 2018.
IFRS 9 provides transition requirements that do not restate prior periods when the IFRS is first applied; therefore,
the Group elected not to restate comparative information for the prior period when applying this enactment for the
first time.
Details of these new requirements as well as their impact on the Group’s consolidated financial statements are
described below.
(a) Classification and measurement of financial assets
All recognized financial assets that are within the scope of K-IFRS 1109 are required to be measured subsequently at
amortized cost or fair value on the basis of the entity’s business model for managing the financial assets and the
contractual cash flow characteristics of the financial assets.
debt instruments that are held within a business model whose objective is to collect the contractual cash flows,
and that have contractual cash flows that are solely payments of principal and interest on the principal amount
outstanding, are measured subsequently at amortized cost;
debt instruments that are held within a business model whose objective is both to collect the contractual cash
flows and to sell the debt instruments, and that have contractual cash flows that are solely payments of
principal and interest on the principal amount outstanding, are measured subsequently at fair value through
other comprehensive income (FVOCI);
all other debt investments and equity investments are measured subsequently at fair value through profit or loss
(FVPL).
Despite the foregoing, the Group may make the following irrevocable election / designation at initial recognition of
a financial asset:
the Group may irrevocably elect to present subsequent changes in fair value of an equity investment that is
neither held for trading nor contingent consideration recognized by an acquirer in a business combination in
other comprehensive income; and
the Group may irrevocably designate a debt investment that meets the amortized cost or FVOCI criteria as
measured at FVPL if doing so eliminates or significantly reduces an accounting mismatch.
In the current year, the Group has not designated any debt investments that meet the amortized cost or FVOCI
criteria as measured at FVPL.
When a debt investment measured at FVOCI is derecognized, the cumulative gain or loss previously recognized in
other comprehensive income is reclassified from equity to profit or loss as a reclassification adjustment. When an
equity investment designated as measured at FVOCI is derecognized, the cumulative gain or loss previously
recognized in other comprehensive income is subsequently transferred to retained earnings.
Debt instruments that are measured subsequently at amortized cost or at FVOCI are subject to impairment. See
(b) below.
- 3 -
The directors of the Group reviewed and assessed the Group’s existing financial assets as at January 1, 2018, based
on the facts and circumstances that existed at that date and concluded that the initial application of K-IFRS 1109
has had the following impact on the Group’s financial assets as regards their classification and measurement:
The Group’s investments in redeemable notes were classified as available-for-sale (“AFS”) financial assets
under K-IFRS 1039 Financial Instruments: Recognition and Measurement. The notes have been reclassified
as financial assets at amortized cost because they are held within a business model whose objective is to collect
the contractual cash flows and they have contractual cash flows that are solely payments of principal and
interest on the principal amount outstanding;
The Group’s investment in corporate bonds that were classified as AFS financial assets under K-IFRS 1039
have been classified as financial assets at FVOCI because they are held within a business model whose
objective is both to collect contractual cash flows and to sell the bonds, and they have contractual cash flows
that are solely payments of principal and interest on principal outstanding. The change in the fair value on
these redeemable notes continues to accumulate in the investment revaluation reserve until they are
derecognized or reclassified;
The Group’s investments in equity instruments (neither held for trading nor a contingent consideration arising
from a business combination) that were previously classified as AFS financial assets and were measured at fair
value at each reporting date under K-IFRS 1109 have been designated as at FVOCI. The change in fair value
on these equity instruments continues to be accumulated in the investment revaluation reserve;
There is no change in the measurement of the Group’s investments in equity instruments that are held for
trading; those instruments were and continue to be measured at FVPL;
Financial assets classified as held-to-maturity and loans and receivables under K-IFRS 1039 that were
measured at amortized cost continue to be measured at amortized cost under K-IFRS 1109 as they are held
within a business model to collect contractual cash flows and these cash flows consist solely of payments of
principal and interest on the principal amount outstanding.
Note (e) below tabulates the change in classification of the Group’s financial assets upon application of K-IFRS
1109. Due to options for classifying equity investment, the valuation gain on AFS financial assets of ₩2,412,620
thousand which recognized as in other comprehensive income and subsequently reclassified to net income has been
classified to the designated valuation gain of ₩2,412,620 thousand on FVOCI that are not subsequently
reclassified to net income.
None of the other reclassifications of financial assets have had any impact on the Group’s financial position, profit
or loss, other comprehensive income or total comprehensive income in the current year.
(b) Impairment of financial assets
In relation to the impairment of financial assets, K-IFRS 1109 requires an expected credit loss (“ECL”) model as
opposed to an incurred credit loss model under K-IFRS 1039. The ECL model requires the Group to account for
ECL and changes in those ECL at each reporting date to reflect changes in credit risk since initial recognition of the
financial assets. In other words, it is no longer necessary for a credit event to have occurred before credit losses
are recognized.
Specifically, K-IFRS 1109 requires the Group to recognize a loss allowance for ECL on:
(1) Debt investments measured subsequently at amortized cost or at FVOCI,
(2) Lease receivables,
(3) Trade receivables and contract assets, and
(4) Financial guarantee contracts to which the impairment requirements of K-IFRS 1109 apply.
In particular, K-IFRS 1109 requires the Group to measure the loss allowance for a financial instrument at an
amount equal to the lifetime ECL if the credit risk on that financial instrument has increased significantly since
initial recognition, or if the financial instrument is a purchased or originated credit-impaired financial asset.
However, if the credit risk on a financial instrument has not increased significantly since initial recognition (except
for a purchased or originated credit-impaired financial asset), the Group is required to measure the loss allowance
for that financial instrument at an amount equal to 12-month ECL. K-IFRS 1109 also requires a simplified
approach for measuring the loss allowance at an amount equal to lifetime ECL for trade receivables, contract assets
and lease receivables in certain circumstances.
- 4 -
The Group has assessed whether there has been a significant increase in credit risk since initial recognition of
financial instruments that remain recognized on the date of initial application of K-IFRS 1109 (i.e., January 1,
2018), the directors have assessed the credit risk of the respective financial instruments on the date of their initial
recognition. There were no additional loss allowance determined in accordance with K-IFRS 1109.
Korean won (in thousands)
Items existing as at January 1,
2018, that are subject to the
impairment provisions of
K-IFRS 1109 Credit risk attributes at January 1, 2018
Cumulative additional loss
allowance recognized on
January 1, 2018
Trade and other payables The Group applies the simplified approach and
recognizes lifetime ECL for these assets -
Contract assets
Loans, deposits provided
Debtors’ significant credit risk is assessed to be low at
each reporting date -
Long-term and short-term
financial instruments
All long-term and short-term financial instruments are
assessed to have low credit risk at each reporting date
as they are held with reputable international banking
institutions
-
Financial guarantee
agreement
Debtors’ significant credit risk is assessed to have low
at each reporting date -
The consequential amendments to K-IFRS 1107 have also resulted in more extensive disclosures about the Group’s
exposure to credit risk in the consolidated financial statements.
(c) Classification and measurement of financial liabilities
A significant change introduced by K-IFRS 1109 in the classification and measurement of financial liabilities
relates to the accounting for changes in the fair value of a financial liability designated as at FVPL attributable to
changes in the credit risk of the issuer.
Specifically, K-IFRS 1109 requires that the changes in the fair value of the financial liability that is attributable to
changes in the credit risk of that liability be presented in other comprehensive income, unless the recognition of the
effects of changes in the liability’s credit risk in other comprehensive income would create or enlarge an accounting
mismatch in profit or loss. Changes in fair value attributable to a financial liability’s credit risk are not
subsequently reclassified to profit or loss, but are instead transferred to retained earnings when the financial liability
is derecognized.
The application of K-IFRS 1109 has had no impact on the classification and measurement of the Group’s financial
liabilities.
Please refer to Note (e) below for further details regarding the change in classification upon the application of K-
IFRS 1109.
(d) General hedge accounting
The new general hedge accounting requirements retain the three types of hedge accounting. However, greater
flexibility has been introduced to the types of transactions eligible for hedge accounting, specifically broadening the
types of instruments that qualify for hedging instruments and the types of risk components of non-financial items
that are eligible for hedge accounting. In addition, the effectiveness test has been replaced with the principle of an
‘economic relationship.’ Retrospective assessment of hedge effectiveness is also no longer required. Enhanced
disclosure requirements about the Group’s risk management activities have also been introduced.
The application of the K-IFRS 1109 hedge accounting requirements has had no impact on the results and financial
position of the Group for the current year.
- 5 -
(e) The table below shows information relating to financial assets and financial liabilities that have been reclassified
as a result of transition to K-IFRS 1109 and K-IFRS 1039:
Korean won (in thousands)
Category Carrying amount
K-IFRS 1039 K-IFRS 1109 K-IFRS 1039 Remeasurements K-IFRS 1109
Financial assets measured at fair value
(see Notes 7,8 and 11)
AFS financial
assets FVPL \ 2,320,327 \ - \ 2,320,327 Financial assets measured at fair value
(see Notes 7,8 and 11) (*1)
AFS financial
assets FVOCI 10,331,453 - 10,331,453
Short-term financial instruments
(see note 7)
Loans and
receivables
Financial assets measured at
amortized cost 1,993,797,925 - 1,993,797,925
Trade receivables, other receivables and
others(see Notes 7 and 9) (*2)
Loans and
receivables
Financial assets measured at
amortized cost 1,399,634,175 - 1,399,634,175
Other financial assets
(see note 7) (*3)
Loans and
receivables
Financial assets measured at
amortized cost 109,548,960 - 109,548,960
Trade and other payables(see note 7)
Financial liabilities measured at
amortized cost
Financial liabilities measured at
amortized cost 511,045,515 - 511,045,515
Accrued expense(see note 7)
Financial liabilities measured at
amortized cost
Financial liabilities measured at
amortized cost 461,893,139 - 461,893,139
Borrowings and corporate bonds
(see Notes 7 and 16)
Financial liabilities measured at
amortized cost
Financial liabilities measured at
amortized cost 830,296 -
830,296
Other financial liabilities
(see Note 7) (*4)
Financial liabilities measured at
amortized cost
Financial liabilities measured at
amortized cost 5,828,950 -
5,828,950
(*1) The Group makes an irrevocable election to present in other comprehensive income subsequent changes in the fair value of
an investment in an equity instrument that is not held for trading at the date of initial application. (*2) Others, such as short-term loans receivable, long-term trade receivables and long-term loans receivable are included.
(*3) Other financial assets, such as accrued income, deposits provided for guarantees, long-term financial instruments and
deposits provided are included.
(*4) Other financial liabilities, such as accrued dividends, short-term deposits received and long-term deposits received are
included.
Details of the impact on the equity of these new requirements are described below.
Korean won (in thousands)
Equity attributable to owners of the parent
Retained earnings
Other component of
equity
Non-controlling
interests Total Balance as at January 1, 2018 K-IFRS 1039 \ - \ 2,412,620 \ 24,047 \ 2,436,667
The impact of the reclassification of financial instruments
Valuation gain (loss) on AFS financial assets - (2,412,620) (24,047) (2,436,667) Valuation gain (loss) on FVOCI - 2,412,620 24,047 2,436,667
Balance as at January 1, 2018, K-IFRS 1109 \ - \ 2,412,620 \ 24,047 \ 2,436,667
There were no additional loss allowances determined in accordance with K-IFRS 1109.
- 6 -
K-IFRS 1115 – Revenue from Contracts with Customers (Enactment)
In the current year, the Group has applied K-IFRS 1115 Revenue from Contracts with Customers which is effective
for an annual period that begins on or after January 1, 2018. K-IFRS 1115 introduced a five-step approach to
revenue recognition. Far more prescriptive guidance has been added in K-IFRS 1115 to deal with specific
scenarios. The content of the requirements of IFRS 15 and the accounting policies applied by the Group are listed
in '(6) Revenue Recognition' below; details of the new requirements as well as their impact on the Group’s
consolidated financial statements are described below.
The Group has applied K-IFRS 1115 in accordance with the fully retrospective transitional approach using the
expedient in K-IFRS 1115 allowing both non-disclosure of the amount of the transaction price allocated to the
remaining performance obligations, and an explanation of when it expects to recognize that amount as revenue for
all reporting periods presented before the date of initial application, i.e., January 1, 2018.
K-IFRS 1102—Share-based Payment (Amendment)
The amendments include: 1) when measuring the fair value of share-based payment, the effects of vesting and non-
vesting conditions on the measurement of cash-settled share-based payment should be consistent with the
measurement of equity-settled share-based payment, 2) share-based payment transaction in which the Group settles
the share-based payment arrangement net by withholding a specified portion of the equity instruments per statutory
tax withholding requirements would be classified as equity settled in its entirety, if otherwise would be classified as
equity-settled without the net settlement feature, and 3) when a cash-settled share-based payment changes to an
equity-settled share-based payment because of modifications of the terms and conditions, the original liability
recognized is derecognized and the equity-settled share-based payment is recognized at the modification date fair
value. Any difference between the carrying amount of the liability at the modification date and the amount
recognized in equity at the same date would be recognized in profit and loss immediately. The application of K-
IFRS 1102 has not had a significant impact on the consolidated financial statements of the Group.
K-IFRS 1040—Transfers of Investment Property (Amendment)
The amendments clarify that a transfer to, or from, investment property necessitates an assessment of whether a
property meets, or has ceased to meet, the definition of investment property, supported by observable evidence that
a change in use has occurred. The amendments further clarify that situations other than the ones listed in K-IFRS
1040 may evidence a change in use, and that a change in use is possible for properties under construction (i.e., a
change in use is not limited to completed properties). The application of K-IFRS 1040 has not had a significant
impact on the consolidated financial statements of the Group.
Annual Improvements to K-IFRS Standards 2014-2016 Cycle
The annual improvements include amendments to K-IFRS 1101 First-time Adoption and K-IFRS 1028 Investment
in Associates and Joint Ventures. The amendments to K-IFRS 1028 clarify that the option for a venture capital
organization and other similar entities to measure investments in associates and joint ventures at FVPL is available
separately for each associate or joint venture, and that election should be made at initial recognition of the associate
or joint venture. In respect of the option for an entity that is not an investment entity (IE) to retain the fair value
measurement applied by its associates and joint ventures that are IEs when applying the equity method, the
amendments make a similar clarification that this choice is available for each IE associate or IE joint venture.
The Group does not anticipate that the application of the amendments in the future will have any impact on the
Group’s consolidated financial statements as the Group is neither a first-time adopter of IFRS nor a venture capital
organization. Furthermore, the Group does not have any associate or joint venture that is an IE.
- 7 -
K-IFRS 2122—Foreign Currency Transactions and Advance Consideration (Enactment)
The interpretation addresses how to determine the ‘date of transaction’ for the purpose of determining the exchange
rate to use on initial recognition of an asset, expense or income, when consideration for that item has been paid or
received in advance in a foreign currency which resulted in the recognition of a non-monetary asset or non-
monetary liability (e.g., a non-refundable deposit or deferred revenue).
The interpretation specifies that the date of transaction is the date on which the entity initially recognizes the non-
monetary asset on non-monetary liability arising from the payment or receipt of advance consideration. If there
are multiple payments or receipts in advance, the interpretation requires an entity to determine the date of
transaction for each payment or receipt of advance consideration.
The Group does not anticipate that the application of the enactment in the future will have an impact on the Group’s
consolidated financial statements because the Group already accounts for transactions involving the payment or
receipt of advance consideration in a foreign currency in a way that is consistent with the enactment.
The application of these amendments and new interpretations has not had a significant impact on the financial
statements of the Group.
ㅡ New and revised K-IFRSs in issue, but not yet effective
K-IFRS 1116—Leases (Enactment)
1. General impact of application of K-IFRS 1116 Leases
K-IFRS 1116 provides a comprehensive model for the identification of lease arrangements and their treatments in
the financial statements for both lessors and lessees. K-IFRS 1116 will supersede the current lease guidance
including K-IFRS 1017 Leases and the related interpretations when it becomes effective for accounting periods
beginning on or after January 1, 2019. The date of initial application of K-IFRS 1116 for the Group will be
January 1, 2019.
The lessees have an option to choose between the full retrospective application for each reporting date and modified
retrospective application at the initial application date.
In preparation for the adoption of K-IFRS 1116, the Group conducted consultations with related departments from
June 2018 to September 2018, and as of December 31, 2018, the Task Force ("TF") team composed of external
accounting firms and accounting staff. The TF team analyzed the impact for the Group, if necessary, with the help
of sales and IT staff. Through these processes, the Group improved its internal management processes and
changed some accounting systems and implemented training.
The Group plans to apply modified retrospective approach as of January 1, 2019, in accordance with K-IFRS 1116.
Therefore, the cumulative effect of applying K-IFRS 1116 will be adjusted in the retained earnings (or, where
appropriate, other components of equity) at the date of initial application, and the comparative financial statements
will not be restated.
The lessee and lessor must account for each lease element of the lease, separate from the non-lease element ("non-
lease element") in a lease contract. The lessee is required to recognize lease assets and liabilities that represents
the right to use the underlying assets and the obligation to pay the lease payments. However, in the case of short-
term lease and small-value-based lease, the exemption provisions of the standard may be selected. In addition, the
lessee is not required to separate the lease component from the non-lease component in accordance with the
simplified approach, and can account for each lease component and related non-lease component as one lease
component.
In contrast to lessee accounting, K-IFRS 1116 substantially carries forward the lessor accounting requirements in
K-IFRS 1017.
- 8 -
2. Impact of the new definition of a lease
The Group will make use of the practical expedient available on transition to K-IFRS 1116 not to reassess whether
a contract is or contains a lease. Accordingly, the definition of a lease in accordance with K-IFRS 1017 will
continue to apply to those leases entered or modified before January 1, 2019.
The change in definition of a lease mainly relates to the concept of control. K-IFRS 1116 distinguishes between
leases and service contracts on the basis of whether the use of an identified asset is controlled by the customer.
Control is considered to exist if the customer has:
- The right to obtain substantially all of the economic benefits from the use of an identified asset
- The right to direct the use of that asset.
The new definition in K-IFRS 1116 is under consideration on the impact of the scope of contracts that meet the
definition of a lease for the Group.
3. Impact on Lessee Accounting
Operating leases
K-IFRS 1116 will change how the Group accounts for leases previously classified as operating leases under
K-IFRS 1017, which were off balance sheet. On initial application of K-IFRS 1116, for all leases (except as noted
below), the Group will:
a) Recognize right-of-use assets and lease liabilities in the consolidated statement of financial position, initially
measured at the present value of the future lease payments;
b) Recognize depreciation of right-of-use assets and interest on lease liabilities in the consolidated statement of
profit or loss;
c) Separate the total amount of cash paid into a principal portion (presented within financing activities) and
interest (presented within operating activities) in the consolidated cash flow statement.
Under K-IFRS 1116, right-of-use assets will be tested for impairment in accordance with K-IFRS 1036 Impairment
of Assets. This will replace the previous requirement to recognize a provision for onerous lease contracts.
For short-term leases (lease term of 12 months or less) and leases of low-value assets (such as personal computers
and office furniture), the Group will opt to recognize a lease expense on a straight-line basis as permitted by K-
IFRS 1116.
Finance leases
The main differences between K-IFRS 1116 and K-IFRS 1017 with respect to assets formerly held under a finance
lease is the measurement of the residual value guarantees provided by the lessee to the lessor. K-IFRS 1116
requires that the Group recognizes as part of its lease liability only the amount expected to be payable under a
residual value guarantee, rather than the maximum amount guaranteed as required by K-IFRS 1017. On initial
application, the Group will present equipment previously included in property, plant and equipment within the line
item for right-of-use assets and the lease liability, previously presented within borrowing, will be presented in a
separate line for lease liabilities.
The application of these enactments is under consideration on the impact of the disclosure of the Group’s
consolidated financial statements.
- 9 -
4. Impact on Lessor Accounting
Under K-IFRS 1116, a lessor continues to classify leases as either finance leases or operating leases and account for
those two types of leases differently. However, K-IFRS 1116 has changed and expanded the disclosures required,
in particular regarding how a lessor manages the risks arising from its residual interest in leased assets.
Under K-IFRS 1116, an intermediate lessor accounts for the head lease and the sublease as two separate contracts.
The intermediate lessor is required to classify the sublease as a finance or operating lease by reference to the right-
of-use asset arising from the head lease (and not by reference to the underlying asset as was the case under K-IFRS
1017).
Because of this change, the Group will reclassify certain of its sublease agreements as finance leases. As required
by K-IFRS 1109, an allowance for ECL will be recognized on the finance lease receivables. The leased assets will
be derecognized and finance lease asset receivables recognized. This change in accounting will change the timing
of recognition of the related revenue (recognized in finance income).
K-IFRS 1109—Prepayment Features with Negative Compensation (Amendment)
The amendments to K-IFRS 1109 clarify that for the purpose of assessing whether a prepayment feature meets the
Solely payment of principal and interest ("SPPI") condition, the party exercising the option may pay or receive
reasonable compensation for the prepayment irrespective of the reason for prepayment. In other words,
prepayment features with negative compensation do not automatically fail SPPI. The amendment applies to
annual periods beginning on or after January 1, 2019, with earlier application permitted.
K-IFRS 1028—Long-term Interests in Associates and Joint Ventures (Amendment)
The amendment clarifies that K-IFRS 1109, including its impairment requirements, applies to long-term interests.
Furthermore, in applying K-IFRS 1109 to long-term interests, an entity does not take into account adjustments to
their carrying amount required by K-IFRS 1028 (i.e., adjustments to the carrying amount of long-term interests
arising from the allocation of losses of the investee or assessment of impairment in accordance with K-IFRS 1028).
The amendments apply retrospectively to annual reporting periods beginning on or after January 1, 2019. Earlier
application is permitted.
Annual Improvements to K-IFRS Standards 2015–2017 Cycle
The annual improvements include amendments to four standards such as K-IFRS 1012 Income Taxes, K-IFRS 1023
Borrowing Costs, K-IFRS 1103 Business Combinations, and K-IFRS 1111 Joint Arrangements.
1. K-IFRS 1012 Income Taxes
The amendments clarify that an entity should recognize the income tax consequences of dividends in profit or loss,
other comprehensive income or equity according to where the entity originally recognized the transactions that
generated the distributable profits. This is the case irrespective of whether different tax rates apply to distributed
and undistributed profits.
2. K-IFRS 1023 Borrowing Costs
The amendments clarify that if any specific borrowing remains outstanding after the related asset is ready for its
intended use or sale, that borrowing becomes part of the funds that an entity borrows generally when calculating the
capitalization rate on general borrowings.
3. K-IFRS 1103 Business Combinations
The amendments to K-IFRS 1103 clarify that when an entity obtains control of a business that is a joint operation,
the entity applies the requirements for a business combination achieved in stages, including remeasuring its
previously held interest (PHI) in the joint operation at fair value. The PHI to be remeasured includes any
unrecognized assets, liabilities and goodwill relating to the joint operation.
4. K-IFRS 1111 Joint Arrangements
The amendments to K-IFRS 1111 clarify that when a party that participates in, but does not have joint control of, a
joint operation that is a business obtains joint control of such a joint operation, the entity does not remeasure its PHI
in the joint operation.
All the amendments are effective for annual periods beginning on or after January 1, 2019, and generally require
prospective application. Earlier application is permitted.
- 10 -
K-IFRS 1019—Employee Benefits Plan Amendment, Curtailment or Settlement (Amendment)
The amendments clarify that the past service cost (or of the gain or loss on settlement) is calculated by measuring
the defined benefit liability (asset) using updated assumptions and comparing benefits offered and plan assets
before and after the plan amendment (or curtailment or settlement) but ignoring the effect of the asset ceiling (that
may arise when the defined benefit plan is in a surplus position). K-IFRS 1019 is now clear that the change in the
effect of the asset ceiling that may result from the plan amendment (or curtailment or settlement) is determined in a
second step and is recognized in the normal manner in other comprehensive income.
The paragraphs that relate to measuring the current service cost and the net interest on the net defined benefit
liability (asset) have also been amended. An entity will now be required to use the updated assumptions from this
remeasurement to determine current service cost and net interest for the remainder of the reporting period after the
change to the plan. In the case of the net interest, the amendments make it clear that for the period post plan
amendment, the net interest is calculated by multiplying the net defined benefit liability (asset) as remeasured under
paragraph 99 with the discount rate used in the remeasurement (also taking into account the effect of contributions
and benefit payments on the net defined benefit liability (asset)).
The amendments are applied prospectively. They apply only to plan amendments, curtailments or settlements that
occur on or after the beginning of the annual period in which the amendments to K-IFRS 1019 are first applied.
The amendments to K-IFRS 1019 must be applied to annual periods beginning on or after January 1, 2019, but they
can be applied earlier if an entity elects to do so.
K-IFRS 1115—Revenue from Contracts with Customers (Amendment)
This amendment relates to prevent the revision of meaning 'contract' referred in K-IFRS 1115 paragraph 129.1 to
'individual contract' in relation to 'additional disclosure of contracts based on contract costs incurred to date', so that
even if application of K-IFRS 1115 is adopted, the range of disclosure has not been reduced. In addition, K-IFRS
1115 does not distinguish the types of contracts that the service contracts that did not qualify for the application of
K-IFRS 1011 in paragraph 45.1 can be qualified in K-IFRS 1115 paragraph 129.1 and it is to clarify that the range
of the contracts subject to make disclosure in accordance with paragraph 129.1 can be expanded compared to the
previous standard. This amendment is effective for annual periods beginning on or after January 1, 2019, and
earlier application is permitted.
K-IFRS 2123—Interpretation Uncertainty over Income Tax Treatments (Amendment)
K-IFRS 2123 Interpretation sets out how to determine the accounting tax position when there is uncertainty over
income tax treatments. The interpretation requires an entity to:
Determine whether uncertain tax positions are assessed separately or as a group; and
Assess whether it is probable that a tax authority will accept an uncertain tax treatment used, or proposed to be
used, by an entity in its income tax filings:
o If yes, the entity should determine its accounting tax position consistently with the tax treatment used or
planned to be used in its income tax filings.
o If no, the entity should reflect the effect of uncertainty in determining its accounting tax position.
The interpretation is effective for annual periods beginning on or after January 1, 2019. Entities can apply the
interpretation with either full retrospective application or modified retrospective application without restatement of
comparatives retrospectively or prospectively.
The application of these amendments is under consideration on the impact of the disclosure of the Group’s
consolidated financial statements.
- 11 -
(2) Basis of consolidation
The consolidated financial statements incorporate the financial statements of the Company and entities (including
structured entities) controlled by the Company (and its subsidiaries). Control is achieved where the Company:
1) Has the power over the investee; 2) is exposed or has rights to variable returns from its involvement with the
investee; and 3) has the ability to use its power to affect its returns. The Group reassesses whether or not it
controls an investee if facts and circumstances indicate that there are changes to one or more of the three elements
of control listed above.
When the Group has less than a majority of the voting rights of an investee, it has power over the investee when the
voting rights are sufficient to give it the practical ability to direct the activities of the investee unilaterally. The
Group considers all relevant facts and circumstances in assessing whether or not the Group’s voting rights in an
investee are sufficient to give it power, including:
The size of the Group’s holding of voting rights relative to the size and dispersion of holdings of other vote
holders;
Potential voting rights held by the Group, other vote holders or other parties;
Rights arising from other contractual arrangements; and
Any additional facts and circumstances that indicate that the Group has, or does not have, the current ability to
direct the relevant activities at the time that decisions need to be made, including voting patterns at previous
shareholders’ meetings.
Consolidation of a subsidiary begins when the Company obtains control over the subsidiary and ceases when the
Company loses control of the subsidiary. Specifically, the results of subsidiaries acquired or disposed of during
the year are included in profit or loss from the date the Company gains control until the date when the Company
ceases to control the subsidiary. Profit or loss and each component of other comprehensive income are attributed
to the owners of the Company and to the non-controlling interests. Total comprehensive income of the
subsidiaries is attributed to the owners of the Company and to the non-controlling interests even if this results in the
non-controlling interests having a deficit balance.
When necessary, adjustments are made to the financial statements of subsidiaries to bring their accounting policies
in line with the Group’s accounting policies.
All intragroup transactions and related assets, liabilities, income and expenses are eliminated in full on
consolidation.
Non-controlling interests in subsidiaries are identified separately from the Group’s equity therein. Those interests
of non-controlling shareholders that are present ownership interests entitling their holders to a proportionate share
of net assets upon liquidation may initially be measured at 1) fair value or 2) at the non-controlling interests’
proportionate share of the fair value of the acquiree’s identifiable net assets. The choice of measurement is made
on an acquisition-by-acquisition basis. Other non-controlling interests are initially measured at fair value.
Subsequent to acquisition, the carrying amount of non-controlling interests is the amount of those interests at initial
recognition plus the non-controlling interests’ share of subsequent changes in equity. Total comprehensive
income is attributed to non-controlling interests even if this results in the non-controlling interests having a deficit
balance.
Changes in the Group’s ownership interests in subsidiaries that do not result in the Group losing control over the
subsidiaries are accounted for as equity transactions. The carrying amounts of the Group’s interests and the non-
controlling interests are adjusted to reflect the changes in their relative interests in the subsidiaries. Any difference
between the amount by which the non-controlling interests are adjusted and the fair value of the consideration paid
or received is recognized directly in equity and attributed to the owners of The Group.
When the Group loses control over a subsidiary, a gain or loss on disposal is calculated as the difference between
(i) the aggregate of the fair value of the consideration received and the fair value of any retained interest and (ii) the
previous carrying amount of the assets (including goodwill) and liabilities of the subsidiary and any non-controlling
interests. When assets of the subsidiary are carried at revalued amounts or fair values and the related cumulative
gain or loss has been recognized in other comprehensive income and accumulated in equity, the amounts previously
recognized in other comprehensive income and accumulated in equity are accounted for as if the Group had directly
disposed of the relevant assets (i.e., reclassified to profit or loss or transferred directly to retained earnings). The
fair value of any investment retained in the former subsidiary at the date when control is lost is recognized as the
fair value on initial recognition for subsequent accounting under K-IFRS 1109 Financial Instruments or, when
applicable, the cost on initial recognition of an investment in an associate or a joint venture.
- 12 -
(3) Business combination
Acquisitions of businesses are accounted for using the acquisition method. The consideration transferred in a
business combination is measured at fair value, which is calculated as the sum of the acquisition-date fair values of
the assets transferred by the Group, liabilities incurred by the Group to the former owners of the acquiree and the
equity interests issued by the Group in exchange for control of the acquiree. Acquisition-related costs are
recognized in profit or loss as incurred.
At the acquisition date, the identifiable assets acquired and the liabilities assumed are recognized at their fair value
at the acquisition date, except that:
Deferred tax assets or liabilities and liabilities or assets related to employee benefit arrangements are
recognized and measured in accordance with K-IFRS 1012, Income Taxes, and K-IFRS 1019, Employee
Benefits, respectively;
Liabilities or equity instruments related to share-based payment arrangements of the acquiree or share-based
payment arrangements of the Group entered into to replace share-based payment arrangements of the acquiree
are measured in accordance with K-IFRS 1102, Share-based Payment, at the acquisition date; and
Assets (or disposal groups) that are classified as held for sale in accordance with K-IFRS 1105, Non-current
Assets Held for Sale and Discontinued Operations, are measured in accordance with that standard.
Goodwill is measured as the excess of the sum of a) the consideration transferred, b) the amount of any non-
controlling interests in the acquiree and c) the fair value of the acquirer’s previously held equity interest in the
acquiree (if any) over the net of the acquisition-date amounts of the identifiable assets acquired and the liabilities
assumed.
If, after reassessment, the net of the acquisition-date amounts of the identifiable assets acquired and liabilities
assumed exceeds the sum of a) the consideration transferred, b) the amount of any non-controlling interests in the
acquiree and c) the fair value of the acquirer’s PHI in the acquiree (if any), the excess is recognized immediately in
profit or loss as a bargain purchase gain.
When the consideration transferred by the Group in a business combination includes assets or liabilities resulting
from a contingent consideration arrangement, the contingent consideration is measured at its acquisition-date fair
value and included as part of the consideration transferred in a business combination. Changes in the fair value of
the contingent consideration that qualify as measurement-period adjustments are adjusted retrospectively, with
corresponding adjustments against goodwill. Measurement-period adjustments are adjustments that arise from
additional information obtained during the ‘measurement period’ (which cannot exceed one year from the
acquisition date) about facts and circumstances that existed at the acquisition date.
The subsequent accounting for changes in the fair value of the contingent consideration that do not qualify as
measurement-period adjustments depends on how the contingent consideration is classified. Contingent
consideration that is classified as equity is not remeasured at subsequent reporting dates and its subsequent
settlement is accounted for within equity. Other contingent consideration is remeasured to fair value at subsequent
reporting dates with changes in fair value recognized in profit or loss.
When a business combination is achieved in stages, the Group’s PHIs in the acquired entity are remeasured to its
acquisition-date fair value and the resulting gain or loss, if any, is recognized in profit or loss. Amounts arising
from interests in the acquiree prior to the acquisition date that have previously been recognized in other
comprehensive income are reclassified to profit or loss, where such treatment would be appropriate if that interest
were disposed of.
If the initial accounting for a business combination is incomplete by the end of the reporting period in which the
combination occurs, the Group reports provisional amounts for the items for which the accounting is incomplete.
Those provisional amounts are adjusted during the measurement period (see above), or additional assets or
liabilities are recognized, to reflect new information obtained about facts and circumstances that existed at the
acquisition date that, if known, would have affected the amounts recognized at that date.
- 13 -
(4) Investments in associates and joint ventures
An associate is an entity over which the Group has significant influence and that is neither a subsidiary nor an
interest in a joint venture. Significant influence is the power to participate in the financial and operating policy
decisions of the investee but is not control or joint control over those policies.
A joint venture is a joint arrangement whereby the parties that have joint control of the arrangement have rights to
the net assets of the joint arrangement. Joint control is the contractually agreed sharing of control of an
arrangement, which exists only when decisions about the relevant activities require unanimous consent of the
parties sharing control.
The results of operations and assets and liabilities of associates or joint ventures are incorporated in these
consolidated financial statements using the equity method of accounting, except when the investment is classified
as held for sale, in which case it is accounted for in accordance with K-IFRS 1105, Non-current Assets Held for
Sale and Discontinued Operations. Under the equity method, an investment in an associate or a joint venture is
initially recognized in the consolidated statements of financial position at cost and adjusted thereafter to recognize
the Group’s share of the profit or loss and other comprehensive income of the associate or joint venture. When the
Group’s share of losses of an associate or a joint venture exceeds the Group’s interest in that associate or joint
venture (which includes any long-term interests that, in substance, form part of the Group’s net investment in the
associate or joint venture), the Group discontinues recognizing its share of further losses. Additional losses are
recognized only to the extent that the Group has incurred legal or constructive obligations or made payments on
behalf of the associate or joint venture.
An investment in an associate or a joint venture is accounted for using the equity method from the date on which
the investee becomes an associate or a joint venture. On acquisition of the investment in an associate or a joint
venture, any excess of the cost of the investment over the Group’s share of the net fair value of the identifiable
assets and liabilities of the investee is recognized as goodwill, which is included within the carrying amount of the
investment. Any excess of the Group’s share of the net fair value of the identifiable assets and liabilities over the
cost of the investment, after reassessment, is recognized immediately in profit or loss in the period in which the
investment is acquired.
The requirements of K-IFRS 1028 are applied to determine whether it is necessary to recognize any impairment
loss with respect to the Group’s investment in an associate or a joint venture. When necessary, the entire carrying
amount of the investment (including goodwill) is tested for impairment in accordance with K-IFRS 1036 as a single
asset by comparing its recoverable amount (higher of value in use and fair value less costs of disposal) with its
carrying amount. Any impairment loss recognized is not allocated to any asset, including goodwill that forms part
of the carrying amount of the investment. Any reversal of that impairment loss is recognized in accordance with
K-IFRS 1036 to the extent that the recoverable amount of the investment subsequently increases.
The Group discontinues the use of the equity method from the date when the investment ceases to be an associate or
a joint venture. When the Group retains an interest in the former associate or a joint venture and the retained
interest is a financial asset, the Group measures the retained interest at fair value at that date and the fair value is
regarded as its fair value on initial recognition in accordance with K-IFRS 1109. The difference between the
carrying amount of the associate or a joint venture at the date the equity method was discontinued, and the fair
value of any retained interest and any proceeds from disposing of a part interest in the associate or a joint venture is
included in the determination of the gain or loss on disposal of the associate or joint venture. In addition, the
Group accounts for all amounts previously recognized in other comprehensive income in relation to that associate
on the same basis as would be required if that associate had directly disposed of the related assets or liabilities.
Therefore, if a gain or loss previously recognized in other comprehensive income by that associate or joint venture
would be reclassified to profit or loss on the disposal of the related assets or liabilities, the Group reclassifies the
gain or loss from equity to profit or loss (as a reclassification adjustment) when the associate or joint venture is
disposed of.
When the Group reduces its ownership interest in an associate or a joint venture but the Group continues to use the
equity method, the Group reclassifies to profit or loss the proportion of the gain or loss that had previously been
recognized in other comprehensive income relating to that reduction in ownership interest if that gain or loss would
be reclassified to profit or loss on the disposal of the related assets or liabilities.
When a group entity transacts with an associate or a joint venture of the Group, profits and losses resulting from the
transactions with the associate or joint venture are recognized in the Group’s consolidated financial statements only
to the extent of interests in the associate or joint venture that are not related to the Group.
- 14 -
(5) Goodwill
Goodwill resulting from an acquisition of a business is carried at cost as established at the date of acquisition of the
business, less accumulated impairment losses, if any.
For the purpose of impairment testing, goodwill is allocated to each of the Group’s cash-generating units (“CGUs”)
(or groups of CGUs) that are expected to benefit from the synergies of the combination.
A CGU to which goodwill has been allocated is tested for impairment annually, or more frequently when there is
indication that the unit may be impaired. If the recoverable amount of the CGU is less than its carrying amount,
the impairment loss is allocated first to reduce the carrying amount of any goodwill allocated to the unit and then to
the other assets of the unit on a pro rata basis based on the carrying amount of each asset in the unit. Any
impairment loss for goodwill is recognized directly in profit or loss. An impairment loss recognized for goodwill
is not reversed in subsequent periods.
On disposal of the relevant CGU, the attributable amount of goodwill is included in the determination of the profit
or loss on disposal.
(6) Revenue recognition
The Group recognizes revenue from the following major sources:
IT service
Logistics BPO
Revenue is measured based on the consideration to which the Group expects to be entitled in a contract with a
customer and excludes amounts collected on behalf of third parties. The Group recognizes revenue when it
transfers control of a product or service to a customer.
1) IT service
Application of K-IFRS 1115 (1) supply of hardware, (2) supply of software, (3) provision of software and
professional services (supply of custom software), (4) provision of hardware, software and professional services
(system integration), (5) provision of professional services, (6) provision of software and update services (if the
update is essential to the functioning of the software) and (7) provision of maintenance services.
The Group recognizes revenues by cost-to-cost method for basis of percentage of total costs incurred when
supplying customized software and system.
According to K-IFRS 1115, the Group’s custom-built software and custom-built systems are performance
improvements, which create or enhance an asset that the customer controls as the asset is created or enhanced,
therefore the control over assets and service is transferred over period to customer. As the Group satisfies the
performance obligation over period, revenue is recognized over period.
Revenue recognized before being billed to the customer is included in contract assets in accordance with K-IFRS
1115.
There are cases that when the Group provides hardware, software and maintenance services with the Group’s
products or implements other parties to provide service for the customers.
Provisions for project losses were adjusted from unbilled or over claimed construction, as K-IFRS 1011 requires
recognized losses to added or subtracted on unbilled or over claimed construction. In contrast, K-IFRS 1115 does
not require the adjustment for contract assets or contract liabilities; instead, losses are shown as the separate
account, as a provision, in accordance with K-IFRS 1037.
2) Logistics BPO
The Group is engaged in a logistics BPO business that provides SCM consulting services to the customers through
its own logistics execution solution.
Applying K-IFRS 1115 identifies separate performance obligations, such as transportation and warehouse
operations.
- 15 -
(7) Lease
Leases are classified as finance leases whenever the terms of the lease transfer substantially all the risks and
rewards of ownership to the lessee. All other leases are classified as operating leases.
1) The Group as lessor
Amounts due from lessees under finance leases are recognized as receivables at the amount of the Group’s net
investment in the leases. Finance lease income is allocated to accounting periods so as to reflect a constant
periodic rate of return on the Group’s net investment outstanding in respect of the leases.
Rental income from operating leases is recognized on a straight-line basis over the term of the relevant lease.
Initial direct costs incurred in negotiating and arranging an operating lease are added to the carrying amount of the
leased asset and recognized on a straight-line basis over the lease term.
2) The Group as lessee
Assets held under finance leases are initially recognized as assets of the Group at their fair value at the inception of
the lease or, if lower, at the present value of the minimum lease payments. The corresponding liability to the
lessor is included in the statement of financial position as a finance lease obligation. Lease payments are
apportioned between finance expenses and reduction of the lease obligation so as to achieve a constant rate of
interest on the remaining balance of the liability. Finance expenses are recognized immediately in profit or loss,
unless they are directly attributable to qualifying assets, in which case they are capitalized in accordance with the
Group’s general policy on borrowing costs. Contingent rentals are recognized as expenses in the periods in which
they are incurred.
Operating lease payments are recognized as an expense on a straight-line basis over the lease term, except where
another systematic basis is more representative of the time pattern in which economic benefits from the leased asset
are consumed. Contingent rentals arising under operating leases are recognized as an expense in the period in
which they are incurred.
In the event that lease incentives are received to enter into operating leases, such incentives are recognized as a
liability. The aggregate benefit of incentives is recognized as a reduction of rental expense on a straight-line basis,
except where another systematic basis is more representative of the time pattern in which economic benefits from
the leased asset are consumed.
(8) Foreign currencies
The individual financial statements of each group entity are presented in the currency of the primary economic
environment in which the entity operates (its functional currency). For the purpose of the consolidated financial
statements, the results of operations and financial position of each Group entity are expressed in Korean won,
which are the functional currency of the entity and the presentation currency for the consolidated financial
statements.
In preparing the financial statements of the individual entities, transactions in currencies other than the entity’s
functional currency (foreign currencies) are recognized at the rates of exchange prevailing at the dates of the
transactions. At the end of each reporting period, monetary items denominated in foreign currencies are
retranslated at the rates prevailing at that date. Non-monetary items carried at fair value that are denominated in
foreign currencies are retranslated at the rates prevailing at the date when the fair value was determined. Non-
monetary items that are measured in terms of historical cost in a foreign currency are not retranslated.
- 16 -
Exchange differences are recognized in profit or loss in the period in which they arise except for:
Exchange differences on foreign currency borrowings related to assets under construction for future productive
use, which are included in the cost of those assets when they are regarded as an adjustment to interest costs on
those foreign currency borrowings;
Exchange differences on transactions entered into in order to hedge certain foreign currency risks; and
Exchange differences on monetary items receivable from or payable to a foreign operation for which settlement
is neither planned nor likely to occur (therefore forming part of the net investment in the foreign operation),
which are recognized initially in other comprehensive income and reclassified from equity to profit or loss on
disposal or partial disposal of the net investment.
For the purpose of presenting the consolidated financial statements, the assets and liabilities of the Group’s foreign
operations are expressed in Korean won using exchange rates prevailing at the end of the reporting period.
Income and expense items are translated at the average exchange rates for the period, unless exchange rates
fluctuated significantly during that period, in which case the exchange rates at the dates of the transactions are used.
Exchange differences arising, if any, are recognized in other comprehensive income and accumulated in equity
(attributed to non-controlling interests as appropriate).
On the disposal of a foreign operation (i.e., a disposal of the Group’s entire interest in a foreign operation, a
disposal involving loss of control over a subsidiary that includes a foreign operation or a partial disposal of an
interest in a joint arrangement or an associate that includes a foreign operation of which the retained interest
becomes a financial asset), all of the accumulated exchange differences in respect of that operation attributable to
the owners of the Group are reclassified to profit or loss. Any exchange differences that have previously been
attributed to non-controlling interests are derecognized, but they are not reclassified to profit or loss.
In case of a partial disposal (i.e., no loss of control) of a subsidiary that includes a foreign operation, the
proportionate share of accumulated exchange differences is reattributed to non-controlling interests in equity and is
not recognized in profit or loss. For all other partial disposals (i.e., partial disposals of associates or joint
arrangements that do not result in the Group’s losing significant influence or joint control), the proportionate share
of the accumulated exchange differences is reclassified to profit or loss.
Goodwill and fair value adjustments arising on the acquisition of a foreign operation are treated as assets and
liabilities of the foreign operation and translated at the closing rate. Exchange differences arising are recognized
in other comprehensive income.
(9) Government grants
Government grants are not recognized until there is a reasonable assurance that the Group will comply with the
conditions attached to them and that the grants will be received.
The benefit of a government loan at a below-market rate of interest is treated as a government grant, measured as
the difference between proceeds received and the fair value of the loan based on prevailing market interest rates.
Government grants related to assets are presented in the consolidated statement of financial position by deducting
the grant from the carrying amount of the asset. The related grant is recognized in profit or loss over the life of a
depreciable asset as a reduced depreciation expense.
Government grants related to income are recognized in profit or loss on a systematic basis over the periods in which
the Group recognizes as expenses the related costs for which the grants are intended to compensate. Government
grants that are receivable as compensation for expenses or losses already incurred or for the purpose of giving
immediate financial support to the Group with no future related costs are recognized in profit or loss in the period in
which they become receivable.
- 17 -
(10) Retirement benefit costs and termination benefit
The Group concurrently operates defined contribution retirement benefit plans and defined benefit retirement
benefit plans.
Contributions to defined contribution retirement benefit plans are recognized as an expense when employees have
rendered service entitling them to the contributions.
For defined benefit retirement benefit plans, the cost of providing benefits is determined using the Projected Unit
Credit Method, with actuarial valuations being carried out at the end of each annual reporting period.
Remeasurements comprising actuarial gains and losses, the effect of the asset ceiling (if applicable) and the return
on plan assets (excluding interest) are recognized immediately in the statement of financial position with a charge
or credit to the statement of comprehensive income in the period in which they occur. Remeasurements
recognized in the statement of comprehensive income are not reclassified. Past service cost is recognized in profit
or loss in the period of a plan amendment. Net interest is calculated by applying a discount rate to the net defined
benefit liability or asset. Defined benefit costs are composed of service cost (including current service cost, past
service cost, as well as gains and losses on curtailments and settlements), net interest expense (income) and
remeasurement.
The Group presents the service cost and net interest expense (income) components in profit or loss, and the
remeasurement component in OCI. Curtailment gains and losses are accounted for as past service costs.
The retirement benefit obligation recognized in the consolidated statement of financial position represents the actual
deficit or surplus in the Group’s defined benefit plans. Any surplus resulting from this calculation is limited to the
present value of any economic benefits available in the form of refunds from the plans or reductions in future
contributions to the plans. Discretionary contributions made by employees or third parties reduce service cost
upon payment of these contributions to the plan. When the formal terms of the plans specify that there will be
contributions from employees or third parties, the accounting depends on whether the contributions are linked to
service, as follows:
If the contributions are not linked to services (e.g., contributions are required to reduce a deficit arising from losses
on plan assets or from actuarial losses), they are reflected in the remeasurement of the net defined benefit liability
(asset). If contributions are linked to services, they reduce service costs. For the amount of contribution that is
dependent on the number of years of service, the entity reduces service cost by attributing the contributions to
periods of service using the attribution method required by K-IFRS 1019 paragraph 70 for the gross benefits. For
the amount of contribution that is independent of the number of years of service, the entity reduces service cost in
the period in which the related service is rendered.
(11) Taxation
Income tax expense represents the sum of the tax currently payable and deferred tax.
1) Current tax
The tax currently payable is based on taxable profit for the year. Taxable profit differs from profit as reported in
the consolidated statement of comprehensive income because of items of income or expense that are taxable or
deductible in other years and items that are never taxable or deductible. The Group’s liability for current tax is
calculated using tax rates that have been enacted or substantively enacted by the end of the reporting period.
- 18 -
2) Deferred tax
Deferred tax is the tax expected to be payable or recoverable on differences between the carrying amounts of assets
and liabilities in the financial statements and the corresponding tax bases used in the computation of taxable profit,
and is accounted for using the liability method. Deferred tax liabilities are generally recognized for all taxable
temporary differences. Deferred tax assets are generally recognized for all deductible temporary differences to the
extent it is probable that taxable profits will be available against which those deductible temporary differences can
be utilized. Such deferred tax assets and liabilities are not recognized if the temporary difference arises from
goodwill or from the initial recognition (other than in a business combination) of other assets and liabilities in a
transaction that affects neither the taxable profit nor the accounting profit.
Deferred tax liabilities are recognized for taxable temporary differences associated with investments in subsidiaries
and associates, and interests in joint ventures, except where the Group is able to control the reversal of the
temporary difference and it is probable that the temporary difference will not reverse in the foreseeable future.
Deferred tax assets arising from deductible temporary differences associated with such investments and interests are
only recognized to the extent it is probable that there will be sufficient taxable profits against which the benefits of
the temporary differences can be utilized, and they are expected to reverse in the foreseeable future.
The carrying amount of deferred tax assets is reviewed at the end of each reporting period and reduced to the extent
it is no longer probable that sufficient taxable profits will be available to allow all or part of the asset to be
recovered. Deferred tax assets and liabilities are measured at the tax rates that are expected to apply in the period
in which the liability is settled or the asset is realized, based on tax rates (and tax laws) that have been enacted or
substantively enacted by the end of the reporting period. The measurement of deferred tax liabilities and assets
reflects the tax consequences that would follow from the manner in which the Group expects, at the end of the
reporting period, to recover or settle the carrying amount of its assets and liabilities.
Deferred tax assets and liabilities are offset if, and only if, the Group has a legally enforceable right to set off
current tax assets against current tax liabilities and the deferred tax assets and liabilities relate to income taxes
levied by the same taxation authority on either the same taxable entity or different taxable entities that intend either
to settle current tax liabilities and assets on a net basis or to realize the assets and settle the liabilities simultaneously
in each future period in which significant amounts of deferred tax liabilities or assets are expected to be settled or
recovered.
For the purpose of measuring deferred tax liabilities and deferred tax assets for investment properties that are
measured using the fair value model, the carrying amounts of such properties are presumed to be recovered entirely
through sale, unless the presumption is rebutted. The presumption is rebutted when the investment property is
depreciable and is held within a business model whose objective is to consume substantially all of the economic
benefits embodied in the investment properties over time, rather than through sale.
3) Current and deferred taxes for the year
Current and deferred taxes are recognized in profit or loss, except when they relate to items that are recognized in
other comprehensive income or directly in equity, in which case the current and deferred taxes are also recognized
in other comprehensive income or directly in equity, respectively. Where current tax or deferred tax arises from
the initial accounting for a business combination, the tax effect is included in the accounting for the business
combination.
- 19 -
(12) Property and equipment
Property and equipment are stated at cost, less subsequent accumulated depreciation and accumulated impairment
losses. The cost of an item of property and equipment is directly attributable to their purchase or construction,
which includes any costs directly attributable to bringing the asset to the location and condition necessary for it to
be capable of operating in the manner intended by management. It also includes the initial estimate of the costs of
dismantling and removing the item and restoring the site on which it is located.
Subsequent costs are recognized in the carrying amount of an asset or as a separate asset if it is probable that future
economic benefits associated with the assets will flow into the Group and the cost of an asset can be measured
reliably. Routine maintenance and repairs are expensed as incurred.
The Group does not depreciate land. Depreciation expense is computed using the straight-line method based on
the estimated useful lives of the assets as follows:
Useful lives
(Years)
Buildings 20–40
Machinery and equipment 4–6
Others 4
If each part of an item of property and equipment has a cost that is significant in relation to the total cost of the
item, it is depreciated separately.
The Group reviews the depreciation method, the estimated useful lives and residual values of property and
equipment at the end of each reporting period. If expectations differ from previous estimates, the changes are
accounted for as a change in an accounting estimate.
An item of property and equipment is derecognized upon disposal or when no future economic benefits are
expected to arise from the continued use of the asset. Any gain or loss arising on derecognition of the property
and equipment (calculated as the difference between the net disposal proceeds and the carrying amount of the asset)
is included in profit or loss in the period in which the property and equipment is derecognized.
(13) Intangible assets
1) Intangible assets acquired separately
Intangible assets with finite useful lives that are acquired separately are carried at cost, less accumulated
amortization and accumulated impairment losses. Amortization is recognized on a straight-line basis over their
estimated useful lives. The estimated useful life and amortization method are reviewed at the end of each
reporting period, with the effect of any changes in estimate being accounted for on a prospective basis. Intangible
assets with indefinite useful lives that are acquired separately are carried at cost, less accumulated impairment
losses.
2) Internally generated intangible assets - research and development expenditure
Expenditure on research activities is recognized as an expense in the period in which it is incurred.
Expenditure arising from development (or from the development phase of an internal project) is recognized as an
intangible asset only if the development project is designed to produce new or substantially improved products and
the Group can demonstrate the technical and economic feasibility and measure reliably the resources attributable to
the intangible asset during its development.
The amount initially recognized for internally generated intangible assets is the sum of the expenditure incurred
from the date when the intangible asset first meets the recognition criteria. Where no internally generated
intangible asset can be recognized, development expenditure is recognized in profit or loss in the period in which it
is incurred. Subsequent to initial recognition, internally generated intangible assets are reported at cost, less
accumulated amortization and accumulated impairment losses, on the same basis as intangible assets that are
acquired separately.
- 20 -
3) Intangible assets acquired in a business combination
Intangible assets that are acquired in a business combination are recognized separately from goodwill, and are
initially recognized at their fair value at the acquisition date (which is regarded as their cost). Subsequent to initial
recognition, intangible assets acquired in a business combination are reported at cost, less accumulated amortization
and accumulated impairment losses, on the same basis as intangible assets that are acquired separately.
4) Derecognition of intangible assets
An intangible asset is derecognized on disposal, or when no future economic benefits are expected from its use.
Gains or losses arising from derecognition of an intangible asset, measured as the difference between the net
disposal proceeds and the carrying amount of the asset, are recognized in profit or loss when the asset is
derecognized.
5) Patents and trademarks
Patents and trademarks are measured initially at purchase cost and are amortized on a straight-line basis over their
estimated useful lives.
(14) Impairment of property and equipment and intangible assets other than goodwill
At the end of each reporting period, the Group reviews the carrying amounts of its property and equipment and
intangible assets to determine whether there is any indication that those assets have suffered an impairment loss.
If any such indication exists, the recoverable amount of the asset is estimated in order to determine the extent of the
impairment loss (if any). When it is not possible to estimate the recoverable amount of an individual asset, the
Group estimates the recoverable amount of the CGU to which the asset belongs. Where a reasonable and
consistent basis of allocation can be identified, corporate assets are also allocated to individual CGUs, or otherwise,
they are allocated to the smallest group of CGUs for which a reasonable and consistent allocation basis can be
identified.
Intangible assets with indefinite useful lives and intangible assets not yet available for use are tested for impairment
at least annually, and whenever there is an indication that the asset may be impaired.
Recoverable amount is the higher of fair value, less costs to sell, or value in use. If the recoverable amount of an
asset (or a CGU) is estimated to be less than its carrying amount, the carrying amount of the asset (or the CGU) is
reduced to its recoverable amount and the reduced amount is recognized in profit or loss.
Where an impairment loss subsequently reverses, the carrying amount of the asset (or a CGU) is increased to the
revised estimate of its recoverable amount, so that the increased carrying amount does not exceed the carrying
amount that would have been determined had no impairment loss been recognized for the asset (or the CGU) in
prior years. A reversal of an impairment loss is recognized immediately in profit or loss.
(15) Inventories
Inventories are stated at the lower of cost or net realizable value. Cost of inventories, except for those in transit,
are measured using the average method and consists of the purchase price, cost of conversion and other costs
incurred in bringing the inventories to their present location and condition. Net realizable value represents the
estimated selling price for inventories, less all estimated costs of completion and costs necessary to make the sale.
When inventories are sold, the carrying amount of those inventories is recognized as an expense (cost of sales) in
the period in which the related revenue is recognized. The amount of any write-down of inventories to net
realizable value and all losses of inventories is recognized as an expense in the period the write-down or loss
occurs. The amount of any reversal of any write-down of inventories, arising from an increase in net realizable
value, is recognized as a reduction in the amount of inventories recognized as an expense in the period in which the
reversal occurs.
- 21 -
(16) Provisions
Provisions are recognized when the Group has a present obligation (legal or constructive) as a result of a past event,
it is probable that the Group will be required to settle the obligation and a reliable estimate can be made of the
amount of the obligation.
The amount recognized as a provision is the best estimate of the consideration required to settle the present
obligation at the end of the reporting period, taking the risks and uncertainties surrounding the obligation into
account. When a provision is measured using the cash flows estimated to settle the present obligation, its carrying
amount is the present value of those cash flows (where the effect of the time value of money is material). The
discount rate used is a pretax rate that reflects current market assessments of the time value of money and the risks
specific to the liability. Where discounting is used, the increase in the provision due to the passage is recognized
in profit or loss as borrowing cost.
When some or all of the economic benefits required to settle a provision are expected to be recovered from a third
party, a receivable is recognized as an asset if it is virtually certain that reimbursement will be received and the
amount of the receivable can be measured reliably.
At the end of each reporting period, the remaining provision balance is reviewed and assessed to determine if the
current best estimate is being recognized. If the existence of an obligation to transfer economic benefit is no
longer probable, the related provision is reversed during the period.
(17) Financial instruments
Financial assets and financial liabilities are recognized in the Group’s statement of financial position when the
Group becomes a party to the contractual provisions of the instrument. Financial assets and financial liabilities are
initially measured at fair value. Transaction costs that are directly attributable to the acquisition or issue of
financial assets and financial liabilities (other than financial assets and financial liabilities at FVPL) are added to or
deducted from the fair value of the financial assets or financial liabilities, as appropriate, on initial recognition.
Transaction costs directly attributable to the acquisition of financial assets or financial liabilities at FVPL are
recognized immediately in profit or loss.
(18) Financial assets
All regular way purchases or sales of financial assets are recognized and derecognized on a trade-date basis.
Regular way purchases or sales are purchases or sales of financial assets that require delivery of assets within the
time frame established by regulation or convention in the marketplace.
All recognized financial assets are measured subsequently in their entirety at either amortized cost or fair value,
depending on the classification of the financial assets.
1) Classification of financial assets
Debt instruments that meet the following conditions are measured subsequently at amortized cost:
The financial asset is held within a business model whose objective is to hold financial assets in order to collect
contractual cash flows; and
The contractual terms of the financial asset give rise on specified dates to cash flows that are solely payments
of principal and interest on the principal amount outstanding.
Debt instruments that meet the following conditions are measured subsequently at FVOCI:
The financial asset is held within a business model whose objective is achieved by both collecting contractual
cash flows and selling the financial assets; and
The contractual terms of the financial asset give rise on specified dates to cash flows that are solely payments
of principal and interest on the principal amount outstanding.
- 22 -
By default, all other financial assets are measured subsequently at FVPL.
Despite the foregoing, the Group may make the following irrevocable election / designation at initial recognition of
a financial asset:
The Group may irrevocably elect to present subsequent changes in fair value of an equity investment in other
comprehensive income if certain criteria are met (see (1-3) below); and
The Group may irrevocably designate a debt investment that meets the amortized cost or FVOCI criteria as
measured at FVPL if doing so eliminates or significantly reduces an accounting mismatch (see (1-4) below).
1-1) Amortized cost and effective interest method
The effective interest method is a method of calculating the amortized cost of a debt instrument and of allocating
interest income over the relevant period. For financial assets other than purchased or originated credit-impaired
financial assets (i.e., assets that are credit impaired on initial recognition), the effective interest rate is the rate that
exactly discounts estimated future cash receipts (including all fees and points paid or received that form an integral
part of the effective interest rate, transaction costs and other premiums or discounts) excluding ECL, through the
expected life of the debt instrument, or, where appropriate, a shorter period, to the gross carrying amount of the
debt instrument on initial recognition. For purchased or originated credit-impaired financial assets, a credit-
adjusted effective interest rate is calculated by discounting the estimated future cash flows, including ECL, to the
amortized cost of the debt instrument on initial recognition.
The amortized cost of a financial asset is the amount at which the financial asset is measured at initial recognition
minus the principal repayments, plus the cumulative amortization using the effective interest method of any
difference between that initial amount and the maturity amount, adjusted for any loss allowance. The gross
carrying amount of a financial asset is the amortized cost of a financial asset before adjusting for any loss
allowance.
Interest income is recognized using the effective interest method for debt instruments measured subsequently at
amortized cost and at FVOCI. For financial assets other than purchased or originated credit-impaired financial
assets, interest income is calculated by applying the effective interest rate to the gross carrying amount of a
financial asset, except for financial assets that have subsequently become credit impaired (see below). For
financial assets that have subsequently become credit-impaired, interest income is recognized by applying the
effective interest rate to the amortized cost of the financial asset. If, in subsequent reporting periods, the credit
risk on the credit-impaired financial instrument improves so that the financial asset is no longer credit impaired,
interest income is recognized by applying the effective interest rate to the gross carrying amount of the financial
asset.
For purchased or originated credit-impaired financial assets, the Group recognizes interest income by applying the
credit-adjusted effective interest rate to the amortized cost of the financial asset from initial recognition. The
calculation does not revert to the gross basis even if the credit risk of the financial asset subsequently improves so
that the financial asset is no longer credit impaired.
Interest income is recognized in profit or loss and is included in the "finance income - interest income" line item
(see Note 27).
1-2) Debt instruments classified as at FVOCI
The corporate bonds held by the Group are classified as at FVOCI. Fair value is determined in the manner
described in Note 8. The corporate bonds are initially measured at fair value plus transaction costs.
Subsequently, changes in the carrying amount of these corporate bonds as a result of foreign exchange gains and
losses, impairment gains or losses, and interest income calculated using the effective interest method are recognized
in profit or loss. The amounts that are recognized in profit or loss are the same as the amounts that would have
been recognized in profit or loss if these corporate bonds had been measured at amortized cost. All other changes
in the carrying amount of these corporate bonds are recognized in other comprehensive income and accumulated
under the heading of investments revaluation reserve. When these corporate bonds are derecognized, the
cumulative gains or losses previously recognized in other comprehensive income are reclassified to profit or loss.
- 23 -
1-3) Equity instruments designated as at FVOCI
On initial recognition, the Group may make an irrevocable election (on an instrument-by-instrument basis) to
designate investments in equity instruments as at FVOCI. Designation at FVOCI is not permitted if the equity
investment is held for trading or if it is contingent consideration recognized by an acquirer in a business
combination.
A financial asset is held for trading if:
It has been acquired principally for the purpose of selling it in the near term; or
On initial recognition, it is part of a portfolio of identified financial instruments that the Group manages
together and has evidence of a recent actual pattern of short-term profit-taking; or
It is a derivative (except for a derivative that is a financial guarantee contract or a designated and effective
hedging instrument).
Investments in equity instruments at FVOCI are initially measured at fair value plus transaction costs.
Subsequently, they are measured at fair value with gains and losses arising from changes in fair value recognized in
other comprehensive income and accumulated in the investments’ revaluation reserve. The cumulative gain or
loss is not be reclassified to profit or loss on disposal of the equity investments; instead, it is transferred to retained
earnings.
Dividends on these investments in equity instruments are recognized in profit or loss in accordance with K-IFRS
1109, unless the dividends clearly represent a recovery of part of the cost of the investment. Dividends are
included in the ‘finance income’ line item in profit or loss.
1-4) Financial assets at FVPL
Financial assets that do not meet the criteria for being measured at amortized cost or FVOCI are measured at FVPL.
Specifically:
Investments in equity instruments are classified as at FVPL, unless the Group designates an equity investment
that is neither held for trading nor a contingent consideration arising from a business combination as at FVOCI
on initial recognition (see (1-3) above).
Debt instruments that do not meet the amortized cost criteria or the FVOCI criteria (see (1-1) and (1-2) above)
are classified as at FVPL. In addition, debt instruments that meet either the amortized cost criteria or the
FVOCI criteria may be designated as at FVPL upon initial recognition if such designation eliminates or
significantly reduces a measurement or recognition inconsistency (so called ‘accounting mismatch’) that would
arise from measuring assets or liabilities or recognizing the gains and losses on them on different bases. The
Group has not designated any debt instruments as at FVPL.
Financial assets at FVPL are measured at fair value at the end of each reporting period, with any fair value gains or
losses recognized in profit or loss to the extent they are not part of a designated hedging relationship (see hedge
accounting policy). The net gain or loss recognized in profit or loss includes any dividend or interest earned on
the financial asset and is included in the ‘other operating income and expenses’ line item (see Note 26). Fair value
is determined in the manner described in Note 8.
2) Foreign exchange gains and losses
The carrying amount of financial assets that are denominated in a foreign currency is determined in that foreign
currency and translated at the spot rate at the end of each reporting period. Specifically;
For financial assets measured at amortized cost that are not part of a designated hedging relationship, exchange
differences are recognized in profit or loss in the ‘other operating income and expenses’ line item (see
Note 26);
For debt instruments measured at FVOCI that are not part of a designated hedging relationship, exchange
differences on the amortized cost of the debt instrument are recognized in profit or loss in the ‘other operating
income and expenses’ line item (see Note 26). Other exchange differences are recognized in other
comprehensive income in the investments revaluation reserve;
For financial assets measured at FVPL that are not part of a designated hedging relationship, exchange
differences are recognized in profit or loss in the ‘finance income and expenses’ line item (see Note 27); and
For equity instruments measured at FVOCI, exchange differences are recognized in other comprehensive
income in the investments revaluation reserve.
- 24 -
3) Impairment of financial assets
The Group recognizes a loss allowance for ECL on investments in debt instruments that are measured at amortized
cost or at FVOCI, lease receivables, trade receivables and contract assets, as well as on financial guarantee
contracts. The amount of ECL is updated at each reporting date to reflect changes in credit risk since initial
recognition of the respective financial instrument.
The Group always recognizes lifetime ECL for trade receivables, contract assets and lease receivables. The ECL
on these financial assets are estimated using a provision matrix based on the Group’s historical credit loss
experience, adjusted for factors that are specific to the debtors, general economic conditions and an assessment of
both the current as well as the forecast direction of conditions at the reporting date, including time value of money
where appropriate.
For all other financial instruments, the Group recognizes lifetime ECL when there has been a significant increase in
credit risk since initial recognition. However, if the credit risk on the financial instrument has not increased
significantly since initial recognition, the Group measures the loss allowance for that financial instrument at an
amount equal to 12-month ECL.
Lifetime ECL represents the ECL that will result from all possible default events over the expected life of a
financial instrument. In contrast, 12-month ECL represents the portion of lifetime ECL that is expected to result
from default events on a financial instrument that are possible within 12 months after the reporting date.
3-1) Significant increase in credit risk
In assessing whether the credit risk on a financial instrument has increased significantly since initial recognition,
the Group compares the risk of a default occurring on the financial instrument at the reporting date with the risk of
a default occurring on the financial instrument at the date of initial recognition. In making this assessment, the
Group considers both quantitative and qualitative information that is reasonable and supportable, including
historical experience and forward-looking information that is available without undue cost or effort. Forward-
looking information considered includes the future prospects of the industries in which the Group’s debtors operate,
obtained from economic expert reports, financial analysts, governmental bodies, relevant think-tanks and other
similar organizations, as well as consideration of various external sources of actual and forecast economic
information that relate to the Group’s core operations.
In particular, the following information is taken into account when assessing whether credit risk has increased
significantly since initial recognition:
An actual or expected significant deterioration in the financial instrument’s external (if available) or internal
credit rating;
Significant deterioration in external market indicators of credit risk for a particular financial instrument, for
example, a significant increase in the credit spread, the credit default swap prices for the debtor or the length of
time or the extent to which the fair value of a financial asset has been less than its amortized cost;
An actual or expected significant deterioration in the operating results of the debtor;
Significant increases in credit risk on other financial instruments of the same debtor;
An actual or expected significant adverse change in the regulatory, economic or technological environment of
the debtor that results in a significant decrease in the debtor’s ability to meet its debt obligations.
Irrespective of the outcome of the above assessment, the Group presumes that the credit risk on a financial asset has
increased significantly since initial recognition when contractual payments are more than 30 days past due, unless
the Group has reasonable and supportable information that demonstrates otherwise.
- 25 -
Despite the foregoing, the Group assumes that the credit risk on a financial instrument has not increased
significantly since initial recognition if the financial instrument is determined to have low credit risk at the
reporting date. A financial instrument is determined to have low credit risk if:
(1) The financial instrument has a low risk of default,
(2) The debtor has a strong capacity to meet its contractual cash flow obligations in the near term, and
(3) Adverse changes in economic and business conditions in the longer term may, but will not necessarily, reduce
the ability of the borrower to fulfil its contractual cash flow obligations.
The Group considers a financial asset to have low credit risk when the asset has external credit rating of
‘investment grade’ in accordance with the globally understood definition or if an external rating is not available, the
asset has an internal rating of ‘performing.’ Performing means that the counterparty has a strong financial position
and there are no past due amounts.
For financial guarantee contracts, the date that the Group becomes a party to the irrevocable commitment is
considered to be the date of initial recognition for the purposes of assessing the financial instrument for impairment.
In assessing whether there has been a significant increase in the credit risk since initial recognition of a financial
guarantee contracts, the Group considers the changes in the risk that the specified debtor will default on the
contract.
The Group regularly monitors the effectiveness of the criteria used to identify whether there has been a significant
increase in credit risk and revises them as appropriate to ensure that the criteria are capable of identifying
significant increase in credit risk before the amount becomes past due.
3-2) Definition of default
The Group considers the following as constituting an event of default for internal credit risk management purposes
as historical experience indicates that financial assets that meet either of the following criteria are generally not
recoverable:
When there is a breach of financial covenants by the debtor;
Irrespective of the above analysis, the Group considers that default has occurred when a financial asset is more than
90 days past due unless the Group has reasonable and supportable information to demonstrate that a more lagging
default criterion is more appropriate.
3-3) Credit-impaired financial assets
A financial asset is credit impaired when one or more events that have a detrimental impact on the estimated future
cash flows of that financial asset have occurred. Evidence that a financial asset is credit impaired includes
observable data about the following events:
(a) Significant financial difficulty of the issuer or the borrower;
(b) A breach of contract, such as a default or past due event (see (3-2) above);
(c) The lender(s) of the borrower, for economic or contractual reasons relating to the borrower’s financial
difficulty, having granted to the borrower a concession(s) that the lender(s) would not otherwise consider;
(d) It is becoming probable that the borrower will enter bankruptcy or other financial reorganization; or
(e) The disappearance of an active market for that financial asset because of financial difficulties.
- 26 -
3-4) Write-off policy
The Group writes off a financial asset when there is information indicating that the debtor is in severe financial
difficulty and there is no realistic prospect of recovery, for example, when the debtor has been placed under
liquidation or has entered into bankruptcy proceedings, or in the case of trade receivables, when the amounts are
more than two years past due, whichever occurs sooner. Financial assets written off may still be subject to
enforcement activities under the Group’s recovery procedures, taking into account legal advice where appropriate.
Any recoveries made are recognized in profit or loss.
3-5) Measurement and recognition of ECL
The measurement of ECL is a function of the probability of default, loss given default (i.e., the magnitude of the
loss if there is a default) and the exposure at default. The assessment of the probability of default and loss given
default is based on historical data adjusted by forward-looking information as described above. As for the
exposure at default, for financial assets, this is represented by the assets’ gross carrying amount at the reporting
date; for financial guarantee contracts, the exposure includes the amount drawn down as at the reporting date,
together with any additional amounts expected to be drawn down in the future by default date determined based on
historical trend, the Group’s understanding of the specific future financing needs of the debtors and other relevant
forward-looking information.
For financial assets, the ECL is estimated as the difference between all contractual cash flows that are due to the
Group in accordance with the contract and all the cash flows that the Group expects to receive, discounted at the
original effective interest rate. For a lease receivable, the cash flows used for determining the ECL is consistent
with the cash flows used in measuring the lease receivable in accordance with K-IFRS 1017 Leases.
For a financial guarantee contract, as the Group is required to make payments only in the event of a default by the
debtor in accordance with the terms of the instrument that is guaranteed, the expected loss allowance is the
expected payments to reimburse the holder for a credit loss that it incurs less any amounts that the Group expects to
receive from the holder, the debtor or any other party.
If the Group has measured the loss allowance for a financial instrument at an amount equal to lifetime ECL in the
previous reporting period, but determines at the current reporting date that the conditions for lifetime ECL are no
longer met, the Group measures the loss allowance at an amount equal to 12-month ECL at the current reporting
date, except for assets for which simplified approach was used.
The Group recognizes an impairment gain or loss in profit or loss for all financial instruments with a corresponding
adjustment to their carrying amount through a loss allowance account, except for investments in debt instruments
that are measured at FVOCI, for which the loss allowance is recognized in other comprehensive income and
accumulated in the investment revaluation reserve, and does not reduce the carrying amount of the financial asset in
the statement of financial position.
4) Derecognition of financial assets
The Group derecognizes a financial asset only when the contractual rights to the cash flows from the asset expire,
or when it transfers the financial asset and substantially all the risks and rewards of ownership of the asset to
another entity. If the Group neither transfers nor retains substantially all the risks and rewards of ownership and
continues to control the transferred asset, the Group recognizes its retained interest in the asset and an associated
liability for amounts it may have to pay. If the Group retains substantially all the risks and rewards of ownership
of a transferred financial asset, the Group continues to recognize the financial asset and also recognizes a
collateralized borrowing for the proceeds received.
On derecognition of a financial asset measured at amortized cost, the difference between the asset’s carrying
amount and the sum of the consideration received and receivable is recognized in profit or loss. In addition, on
derecognition of an investment in a debt instrument classified as at FVOCI, the cumulative gain or loss previously
accumulated in the investments revaluation reserve is reclassified to profit or loss. In contrast, on derecognition of
an investment in equity instrument which the Group has elected on initial recognition to measure at FVOCI, the
cumulative gain or loss previously accumulated in the investments revaluation reserve is not reclassified to profit or
loss, but is transferred to retained earnings.
- 27 -
(19) Financial liabilities and equity instruments
1) Classification as debt or equity
Debt and equity instruments are classified as either financial liabilities or as equity in accordance with the substance
of the contractual arrangement and the definitions of financial liability and an equity instrument.
2) Equity instruments
An equity instrument is any contract that evidences a residual interest in the assets of an entity after deducting all of
its liabilities. Equity instruments issued by the Group are recognized at the proceeds received, net of direct issue
costs.
Repurchase of the Group’s own equity instruments is recognized and deducted directly in equity. No gain or loss
is recognized in profit or loss on the purchase, sale, issue or cancellation of the Group’s own equity instruments.
3) Financial liabilities
All financial liabilities are measured subsequently at amortized cost using the effective interest method or at FVPL.
However, financial liabilities that arise when a transfer of a financial asset does not qualify for derecognition or
when the continuing involvement approach applies, and financial guarantee contracts issued by the Group, are
measured in accordance with the specific accounting policies set out below.
4) Financial liabilities at FVPL
Financial liabilities are classified as at FVPL when the financial liability is (i) contingent consideration of an
acquirer in a business combination, (ii) held for trading or (iii) it is designated as at FVPL.
A financial liability is classified as held for trading if:
It has been acquired principally for the purpose of repurchasing it in the near term; or
On initial recognition it is part of a portfolio of identified financial instruments that the Group manages
together and has a recent actual pattern of short-term profit taking; or
It is a derivative that is not designated and effective as a hedging instrument.
A financial liability other than a financial liability held for trading or contingent consideration of an acquirer in a
business combination may be designated as at FVPL upon initial recognition if:
Such designation eliminates or significantly reduces a measurement or recognition inconsistency that would
otherwise arise; or
The financial liability forms part of a group of financial assets or financial liabilities or both, which is
managed, and its performance is evaluated on a fair value basis, in accordance with the Group's documented
risk management or investment strategy, and information about the grouping is provided internally on that
basis; or
It forms part of a contract containing one or more embedded derivatives, and K-IFRS 1109 permits the entire
combined contract to be designated as at FVPL.
- 28 -
Financial liabilities at FVPL are measured at fair value, with any gains or losses arising on changes in fair value
recognized in profit or loss to the extent that they are not part of a designated hedging relationship (see hedge
accounting policy). The net gain or loss recognized in profit or loss incorporates any interest paid on the financial
liability and is included in the ‘other operating income and expenses’ line item (see Note 26) in profit or loss.
However, for financial liabilities that are designated as at FVPL, the amount of change in the fair value of the
financial liability that is attributable to changes in the credit risk of that liability is recognized in other
comprehensive income, unless the recognition of the effects of changes in the liability’s credit risk in other
comprehensive income would create or enlarge an accounting mismatch in profit or loss. The remaining amount
of change in the fair value of liability is recognized in profit or loss. Changes in fair value attributable to a
financial liability’s credit risk that are recognized in other comprehensive income are not subsequently reclassified
to profit or loss; instead, they are transferred to retained earnings upon derecognition of the financial liability.
Gains or losses on financial guarantee contracts issued by the Group that are designated by the Group as at FVPL
are recognized in profit or loss.
Fair value is determined in the manner described in Note 8.
5) Financial liabilities measured subsequently at amortized cost
Financial liabilities that are not (i) contingent consideration of an acquirer in a business combination, (ii) held-for-
trading or (iii) designated as at FVPL, are measured subsequently at amortized cost using the effective interest
method.
The effective interest method is a method of calculating the amortized cost of a financial liability and of allocating
interest expense over the relevant period. The effective interest rate is the rate that exactly discounts estimated
future cash payments (including all fees and points paid or received that form an integral part of the effective
interest rate, transaction costs and other premiums or discounts) through the expected life of the financial liability,
or (where appropriate) a shorter period, to the amortized cost of a financial liability.
6) Financial guarantee contracts
A financial guarantee contract is a contract that requires the issuer to make specified payments to reimburse the
holder for a loss it incurs because a specified debtor fails to make payments when due in accordance with the terms
of a debt instruments.
Financial guarantee contract liabilities are measured initially at their fair values and, if not designated as at FVPL
and do not arise from a transfer of an asset, are measured subsequently at the higher of:
The amount of the loss allowance determined in accordance with K-IFRS 1109 (see financial assets above);
and
The amount recognized initially less, where appropriate, cumulative amortization recognized in accordance
with the revenue recognition policies set out above.
- 29 -
7) Foreign exchange gains and losses
For financial liabilities that are denominated in a foreign currency and are measured at amortized cost at the end of
each reporting period, the foreign exchange gains and losses are determined based on the amortized cost of the
instruments. These foreign exchange gains and losses are recognized in the ‘other operating income and
expenses’ line item in profit or loss (see Note 26) for financial liabilities that are not part of a designated hedging
relationship. For those which are designated as a hedging instrument for a hedge of foreign currency risk foreign
exchange gains and losses are recognized in other comprehensive income and accumulated in a separate component
of equity.
The fair value of financial liabilities denominated in a foreign currency is determined in that foreign currency and
translated at the spot rate at the end of the reporting period. For financial liabilities that are measured as at FVPL,
the foreign exchange component forms part of the fair value gains or losses and is recognized in profit or loss for
financial liabilities that are not part of a designated hedging relationship.
8) Derecognition of financial liabilities
The Group derecognizes financial liabilities when, and only when, the Group’s obligations are discharged, canceled
or have expired. The difference between the carrying amount of the financial liability derecognized and the
consideration paid and payable is recognized in profit or loss.
When the Group exchanges with the existing lender one debt instrument into another one with the substantially
different terms, such exchange is accounted for as an extinguishment of the original financial liability and the
recognition of a new financial liability. Similarly, the Group accounts for substantial modification of terms of an
existing liability or part of it as an extinguishment of the original financial liability and the recognition of a new
liability. It is assumed that the terms are substantially different if the discounted present value of the cash flows
under the new terms, including any fees paid net of any fees received and discounted using the original effective
rate is at least 10 percent different from the discounted present value of the remaining cash flows of the original
financial liability. If the modification is not substantial, the difference between: (1) the carrying amount of the
liability before the modification and (2) the present value of the cash flows after modification should be recognized
in profit or loss as the modification gain or loss within other operating income and expenses.
(20) Accounting treatment related to the emission rights cap and trade scheme
The Group classifies the emission rights as intangible assets. Emission right allowances that the government
allocated free of charge are measured at ₩0, and emission right allowances purchased are measured at cost, which
the Group paid to purchase the allowances. If emission right allowances that the government allocated free of
charge are sufficient to settle the emission right allowances allotted for the vintage year, the emission liabilities are
measured at ₩0. However, for the emission liabilities that exceed the allowances allocated free of charge, the
shortfall is measured at the best estimate at the end of the reporting period.
- 30 -
3. CRITICAL ACCOUNTING JUDGMENTS AND KEY SOURCES OF ESTIMATION
UNCERTAINTY:
In the application of the Group’s accounting policies, which are described in Note 2, management is required to
make judgments, estimates and assumptions about the carrying amounts of assets and liabilities that are not readily
apparent from other sources. The estimates and associated assumptions are based on historical experience and
other factors that are considered to be relevant. Actual results may differ from these estimates.
The estimates and underlying assumptions are reviewed on an ongoing basis. Revisions to accounting estimates
are recognized in the period in which the estimate is revised if the revision affects only that period or in the period
of revision and future periods if the revision affects both current and future periods.
The following are the key assumptions concerning the future, and other key sources of estimation uncertainty at the
end of the reporting period, that have a significant risk of causing a material adjustment to the carrying amounts of
assets and liabilities within the next financial year:
(1) Revenue recognition
Revenue from project services is recognized using the percentage-of-completion method, which is recognized based
on the costs incurred to date as a percentage to the total estimated costs to be incurred.
(2) Provision for repairs
The Group estimates the related provision for repairs based on historical experience.
(3) Impairment of goodwill
Determining whether goodwill is impaired requires an estimation of the value in use of the CGUs to which
goodwill has been allocated.
(4) Provision for project losses
The Group accrues provision for project losses based on expected amount of project losses.
(5) Net defined benefit liabilities
The present value of net defined benefit liability depends on a number of factors that are determined on an actuarial
basis using a number of assumptions, including the discount rate and salary growth.
(6) Uncertainty on the Estimation of Earnings Accumulation Tax (“EAT”)
Under the EAT regime, the Group may incur increased tax burden depending on its level of investment, payroll
increase or cash dividends for the preceding three years from 2018. There is uncertainty in the estimation of the
tax impact to the Group, which is reviewed by the management per the current level of investment, payroll increase
or cash dividends.
- 31 -
4. SEGMENT REPORTING:
(1) Basis for segmentation
The Group is composed of an IT service division and Logistics Business Process Outsourcing (“BPO”) division,
which are strategic business units of the Group. These divisions offer different goods and services and are
managed separately because each division requires different technologies and marketing strategies.
The following summary describes the operations of each operating segment:
Main business
IT service
Reportable segment for IT consulting, IT system design and development
SI, clients’ information system operation and maintenance, data centers
and network service.
Logistics BPO Reportable segment for global logistics IT services, such as supply chain
and logistics consulting and solutions.
(2) Financial information for each segment
Financial information for each segment for the years ended December 31, 2018 and 2017, is as below. The
accounting policies applied to each reportable segment are the same as the significant accounting policies described
in Note 2. Management determines resources to be allocated to each division and reviews based on operating
income of each division in order to evaluate performance.
The Group evaluates segment assets based on property and equipment and intangible assets. Segment liabilities
are not reported to the Group CEO and, therefore, are not disclosed.
1) Segment information
December 31, 2018:
Korean won (in thousands)
Logistics BPO IT service Total Adjustments Adjusted amounts
Revenue ₩ 4,585,630,071 ₩ 6,702,752,115 ₩ 11,288,382,186 ₩ (1,254,163,285) ₩ 10,034,218,901
Internal revenue (208,084,671) (1,046,078,614) (1,254,163,285) 1,254,163,285 -
External revenue 4,377,545,400 5,656,673,501 10,034,218,901 - 10,034,218,901
Depreciation 6,663,174 202,943,411 209,606,585 (2,586,461) 207,020,124
Amortization 1,469,901 96,581,792 98,051,693 3,197,799 101,249,492
Operating profit 24,030,765 864,695,412 888,726,177 (11,370,364) 877,355,813
Segments assets 25,809,762 1,887,884,852 1,913,694,614 - 1,913,694,614
Acquisition of non-
current assets
6,002,196
282,110,391
288,112,587
(12,485,789)
275,626,798
December 31, 2017:
Korean won (in thousands)
Logistics BPO IT service Total Adjustments Adjusted amounts
Revenue ₩ 4,323,676,660 ₩ 6,052,418,562 ₩ 10,376,095,222 ₩ (1,076,889,092) ₩ 9,299,206,130 Internal revenue (154,096,983) (922,792,109) (1,076,889,092) 1,076,889,092 -
External revenue 4,169,579,677 5,129,626,453 9,299,206,130 - 9,299,206,130
Depreciation 4,958,406 210,523,102 215,481,508 (1,754,389) 213,727,119
Amortization 6,248,239 109,682,443 115,930,682 3,020,273 118,950,955
Operating profit 72,505,160 655,518,553 728,023,713 3,535,436 731,559,149
Segments assets 27,270,371 1,936,146,956 1,963,417,327 - 1,963,417,327
Acquisition of non-
current assets 12,555,091 239,082,543 251,637,634 (21,920,591) 229,717,043
- 32 -
2) Information on geographical areas
The Group’s revenue (based on location) by region is as follows:
Korean won (in thousands)
December 31, 2018 December 31, 2017
Revenue:
Domestic ₩ 4,810,714,593 ₩ 4,389,918,546
America 1,770,056,485 1,628,550,148
Europe 847,509,732 817,354,821
Asia and Africa (*1) 1,529,295,495 1,552,741,271
China 1,076,642,596 910,641,344
Total ₩ 10,034,218,901 ₩ 9,299,206,130
(*1) Korea and China are excluded.
Korean won (in thousands)
December 31, 2018 December 31, 2017
Non-current asset (*1):
Domestic ₩ 1,825,163,478 ₩ 1,894,777,714
America 40,940,134 41,690,089
Europe 19,028,192 10,065,777
Asia and Africa (*2) 19,356,530 8,661,761
China 9,206,280 8,221,986
Total ₩ 1,913,694,614 ₩ 1,963,417,327
(*1) Financial instruments, investments in associates, deferred tax assets and long-term prepaid expenses are not included.
(*2) Korea and China are excluded.
3) Revenues generated from external customer of Samsung Electronics Co., Ltd. and its subsidiaries account for
more than 10% of the Group’s consolidated revenue, amounting to ₩7,134,299 million and
₩6,836,142 million for the years ended December 31, 2018 and 2017, respectively.
5. CASH AND CASH EQUIVALENTS:
Cash and cash equivalents as of December 31, 2018 and 2017, are as follows:
Korean won (in thousands)
December 31, 2018 December 31, 2017
Cash ₩ 3,546 ₩ 4,737
Demand deposits 1,161,680,451 931,456,656
Total ₩ 1,161,683,997 ₩ 931,461,393
6. FINANCIAL INSTRUMENTS RESTRICTED AND PLEDGED AS COLLATERAL:
Details of restricted financial instruments and those pledged as collateral as of December 31, 2018 and 2017, are as
follows:
Korean won (in thousands)
December 31, 2018 December 31, 2017
Short-term financial instruments:
Deposit related to national project ₩ 76,388 ₩ 45,248
Long-term financial instruments:
Deposits for checking account 17,000 17,000
Deposits for subcontractors (*1) 36,400,000 18,300,000
Others (*2) 15,000 15,000
Total ₩ 36,508,388 ₩ 18,377,248
(*1) Deposits restricted in use for financially supporting the Group’s subcontractors in agreement with Industrial Bank of
Korea.
(*2) Others are subject to withdrawal restrictions in relation to guarantees provided by Seoul Guarantee Insurance Company.
- 33 -
7. CATEGORIES OF FINANCIAL INSTRUMENTS:
(1) Details of categories of financial instruments as of December 31, 2018 and 2017, are as follows:
December 31, 2018:
Korean won (in thousands)
Financial assets
measured at
amortized cost FVOCI FVPL Total Fair value
Financial assets:
Cash and cash equivalents ₩ 1,161,683,997 ₩ - ₩ - ₩ 1,161,683,997 ₩ 1,161,683,997
Short-term financial
instruments 2,510,284,470 - - 2,510,284,470 2,510,284,470
FVOCI - 22,934,357 - 22,934,357 22,934,357
FVPL - - 3,643,123 3,643,123 3,643,123
Trade receivables, other
receivables and other
assets (*1) 1,503,041,119 - - 1,503,041,119
1,503,041,119
Others (*2) 132,581,922 - - 132,581,922 132,581,922
Total ₩ 5,307,591,508 ₩ 22,934,357 ₩ 3,643,123 ₩ 5,334,168,988 ₩ 5,334,168,988
(*1) Other assets, such as short-term loans receivable, long-term trade receivable and long-term loans receivable are included.
(*2) Others, such as accrued income, deposits provided for guarantees, long-term financial instruments and deposits provided
are included.
Korean won (in thousands)
Financial liabilities
measured
at amortized cost Fair value
Financial liabilities:
Trade and other payables ₩ 639,566,939 ₩ 639,566,939
Accrued expense 582,056,806 582,056,806
Borrowings and corporate bonds 784,724 784,724
Others (*1) 5,256,149 5,256,149
Total ₩ 1,227,664,618 ₩ 1,227,664,618
(*1) Others, such as accrued dividends, deposits received and long-term deposits received, are included.
December 31, 2017:
Korean won (in thousands)
Loans and
receivables
AFS
financial assets Total Fair value
Financial assets:
Cash and cash
equivalents ₩ 931,461,393 ₩ - ₩ 931,461,393 ₩ 931,461,393
Short-term financial
instruments 1,993,797,925 - 1,993,797,925 1,993,797,925
Long-term AFS financial
assets (*1) - 12,651,780 12,651,780 12,651,780
Trade receivables, other
receivables and other
assets (*2) 1,399,634,175 - 1,399,634,175 1,399,634,175
Others (*3) 109,548,960 - 109,548,960 109,548,960
Total ₩ 4,434,442,453 ₩ 12,651,780 ₩ 4,447,094,233 ₩ 4,447,094,233
(*1) Equity instruments that do not have a quoted price in an active market and fair values cannot be measured reliably are
measured at cost and excluded from the fair value disclosures.
(*2) Other assets, such as short-term loans receivable, long-term trade receivable and long-term loans receivable are included.
(*3) Others, such as accrued income, deposits provided for guarantees, long-term financial instruments and deposits provided
are included.
- 34 -
Korean won (in thousands)
Financial liabilities
measured
at amortized cost Fair value
Financial liabilities:
Trade and other payables ₩ 511,045,515 ₩ 511,045,515
Accrued expense 461,893,139 461,893,139
Borrowings and corporate bonds 830,296 830,296
Others (*1) 5,828,950 5,828,950
Total ₩ 979,597,900 ₩ 979,597,900
(*1) Others, such as accrued dividends, deposits received and long-term deposits received are included.
(2) Gain or loss on financial instruments by category
December 31, 2018: Korean won (in thousands)
December 31, 2018
Financial assets measured at amortized cost:
Interest income (*1) ₩ 66,358,435
Reversal of bad debt expense (bad debt expense) (11,750,893)
Financial assets measured at fair value:
Valuation gain (loss) on
FVOCI
(reclassification, OCI) 10,463,904
Dividend income 15,900
Valuation gain (loss) on
FVPL 1,322,631
Financial liabilities measured at amortized cost:
Interest expense (1,667,001)
Net gains (losses) on foreign currency transaction 6,016,722
Net foreign exchange gains (losses) 4,308,140
(*1) Interest income includes interest income generated by cash and cash equivalents.
December 31, 2017:
Korean won (in thousands)
December 31, 2017
Loans and receivables:
Interest income (*1) ₩ 42,723,967
Reversal of bad debt expense (dad debt expense) (4,541,903)
AFS financial assets:
Valuation gain (loss) on AFS financial assets
(reclassification, OCI) 2,896,088
Dividend income 18,175
Gain (loss) on disposal (20,339)
Financial liabilities measured at amortized cost:
Interest expense (1,900,957)
Net gains (losses) on foreign currency transaction (3,894,511)
Net foreign exchange gains (losses) (22,818,023)
(*1) Interest income includes interest income generated by cash and cash equivalents.
- 35 -
8. FAIR VALUE OF FINANCIAL INSTRUMENTS:
There are no significant changes in the business and economic environment that would affect the fair value of
financial assets and liabilities for the year ended December 31, 2018.
(1) Fair value hierarchy
The Group classifies the financial instruments measured at fair value on the consolidated statement of financial
position into the following three levels (fair value hierarchy) based on the inputs to valuation techniques used to
measure fair value:
- Level 1: Inputs are quoted prices (unadjusted) in active markets for identical assets or liabilities that the Group can
access at the measurement date.
- Level 2: Inputs other than quoted prices included within Level 1, that are observable for the asset or liability,
either directly (for example, price) or indirectly (for example, derived from price)
- Level 3: Inputs for the asset or liability that are not based on observable market data (unobservable inputs).
Fair value hierarchy of financial instruments subsequently measured at fair value as of December 31, 2018 and
2017, is as follows:
December 31, 2018: Korean won (in thousands)
Level 1 Level 2 Level 3 Total
FVOCI ₩ - ₩ 20,524,430 ₩ 2,409,927 ₩ 22,934,357
FVPL - - 3,643,123 3,643,123
Total ₩ - ₩ 20,524,430 ₩ 6,053,050 ₩ 26,577,480
December 31, 2017: Korean won (in thousands)
Level 1 Level 2 Level 3 Total
AFS financial assets ₩ - ₩ 5,839,959 ₩ 1,462,800 ₩ 7,302,759
The above fair values are measured on a recurring basis. The fair value of financial instruments that are not traded
in an active market is determined using valuation methods. These valuation techniques maximize the use of
observable market data where they are available and rely as little as possible on entity-specific estimates.
If all significant inputs required to measure the fair value of an instrument are observable, the instrument is
included in Level 2. There was no significant movement between Level 1 and Level 2 for the year ended
December 31, 2018.
If one or more significant inputs are not based on observable market data, the financial instruments are included in
Level 3. The fair value of the financial instruments in Level 3 was estimated using the discounted cash flow
model.
- 36 -
(2) Changes in financial instruments in Level 3 for the years ended December 31, 2018 and 2017, are as follows:
Korean won (in thousands)
December 31, 2018 December 31, 2017
Beginning balance (*1) ₩ 6,811,821 ₩ 971,400
Acquisition 2,139,165 -
Change (2,897,936) 491,400
Ending balance ₩ 6,053,050 ₩ 1,462,800
(*1) The amount of \5,349 million is included, which is the effect that AFS financial assets measured by the cost method as
of December 31, 2017 are reclassified as FVOCI.
(3) The valuation process of fair value measurements for major financial instruments categorized as Level 3
The fair value of CVnet Co., Ltd., FVOCI categorized within Level 3 of the fair value hierarchy, was appropriately
estimated based on the professional judgment of independent appraisers’ reasonable valuation method.
(4) Valuation methods and inputs
Valuation methods and inputs used in the recurring fair value measurements of the long-term FVOCI categorized
within Level 3 of the fair value hierarchy as of December 31, 2018, are as follows:
Korean won (in thousands)
Fair value Level Valuation method Inputs
Range of inputs
(weighted average)
FVOCI
CVnet Co., Ltd. ₩ 2,194,800 3 Discounted cash flow
Sales growth rate 2.4%–3.0% (2.7%)
Pretax discount rate 14.0%
(5) Sensitivity analysis for recurring fair value measurements categorized in Level 3
Sensitivity analysis of financial instruments is performed to measure favorable and unfavorable changes in the fair
value of financial instruments that are affected by the unobservable input parameters, using statistical techniques.
Financial instruments categorized in Level 3 and subject to sensitivity analysis are equity securities for which
changes in the fair value are recognized in OCI.
The sensitivity analysis of OCI in accordance with the variation of the input parameters for the equity securities are
as follows:
Korean won (in thousands)
Favorable changes Unfavorable changes
FVOCI (*1) ₩ 147,000 ₩ (127,200)
(*1) Changes in their fair value are calculated as favorable changes and unfavorable changes based on the changes in discount
rate that is a significant unobservable input. Favorable changes are the changes by decreasing discount rate by 1.0%.
Unfavorable changes are the changes by increasing discount rate by 1.0%.
- 37 -
9. TRADE RECEIVABLES, OTHER RECEIVABLES AND OTHERS:
(1) Details of trade receivables, other receivables and others as of December 31, 2018 and 2017, are as follows:
Korean won (in thousands) December 31, 2018 December 31, 2017
Trade receivables
Other
receivables (*1) Others Trade receivables Other receivables Others
Receivables, gross ₩ 1,305,368,976 ₩ 211,167,342 ₩ 2,361,388 ₩ 1,214,391,408 ₩ 754,318,073 ₩ 5,578,620
Allowances for bad debts (13,616,568) (1,910,999) (139,020) (4,596,504) (1,971,071) (2,335,817)
Receivables, net ₩ 1,291,752,408 ₩ 209,256,343 ₩ 2,222,368 ₩ 1,209,794,904 ₩ 752,347,002 ₩ 3,242,803
(*1) The service receivables in contract asset, amounting to \496,489,115 thousand, is excluded (see Note 23).
(2) Changes in allowance for doubtful accounts of trade and other receivables for the years ended December 31,
2018 and 2017, are as follows:
Korean won (in thousands) December 31, 2018 December 31, 2017
Trade receivables Other receivables Others Trade receivables Other receivables Others
Beginning balance ₩ 4,596,504 ₩ 1,971,071 ₩ 2,335,817 ₩ 4,807,501 ₩ 1,974,827 ₩ 3,297,837
(Reversal of) bad debt expense 11,613,922 16,966 (69,996) 3,833,684 (5,055) 106,370
Receivables written off (1,849,049) (87,116) (2,126,801) (3,356,736) - (1,068,390)
Collection of receivables written off 4,743 3,551 - 1,826 2,886 - Others (749,552) 6,527 - (689,771) (1,587) -
Ending balance ₩ 13,616,568 ₩ 1,910,999 ₩ 139,020 ₩ 4,596,504 ₩ 1,971,071 ₩ 2,335,817
The recognition of allowances for doubt accounts has been included in selling and administrative expenses and
other income in the consolidated statements of comprehensive income (see Notes 25 and 26).
(3) The aging analysis of trade receivables, other receivables and others overdue, but not individually impaired as
of December 31, 2018 and 2017, is as follows:
Korean won (in thousands)
December 31, 2018 December 31, 2017
Up to 1 month ₩ 248,620,879 ₩ 130,363,271
1 month to 6 months 41,173,955 68,133,897
7 months to 12 months 5,496,030 26,058,574
Over 12 months 8,948,098 5,970,249
Total ₩ 304,238,962 ₩ 230,525,991
(4) Details of the Group’s individually impaired receivables as of December 31, 2018 and 2017, are as follows:
Korean won (in thousands)
December 31, 2018 December 31, 2017
Individually impaired receivables ₩ 15,573,587 ₩ 8,380,348
The individually impaired receivables are generally aged more than one year and the debtors are experiencing
significant financial difficulty. The Group recorded an additional allowance of ₩93 million and ₩523 million
as of December 31, 2018 and 2017, respectively, using historical experience rates based on aging analysis of
receivables.
(5) The maximum exposure to credit risk as of December 31, 2018, is the carrying value of each class of
receivables.
- 38 -
10. INVENTORIES:
(1) Details of the Group’s inventories as of December 31, 2018 and 2017, are as follows:
Korean won (in thousands)
December 31, 2018 December 31, 2017
Raw materials ₩ 1,440,066 ₩ 7,488,650
Merchandise 15,070,250 15,225,336
Goods in transit 762,687 187,677
Supplies 1,488,973 1,855,044
Consigned goods 12,439 3,548
Total ₩ 18,774,415 ₩ 24,760,255
(2) The amount of inventories recognized as expense (cost of sales) and valuation losses on inventories reflected in
cost of sales for the years ended December 31, 2018 and 2017, are as follows:
Korean won (in thousands)
December 31, 2018 December 31, 2017
Inventories recognized as expenses (cost of sales) ₩ 576,593,064 ₩ 552,502,943
Inventory write-downs 2,837,045 713,107
Reversals of inventory write-downs (1,234,550) (928,790)
11. FINANCIAL ASSETS MEASURED AT FAIR VALUE AND LONG-TERM AFS FINANCIAL
ASSETS:
(1) Changes in long-term AFS financial assets (excluding investments in associates) for the years ended
December 31, 2018 and 2017, are as follows:
Korean won (in thousands)
December 31, 2018 December 31, 2017
Fair value through
other comprehensive
income
Fair value
through
profit or loss Total
Long-term AFS
financial assets
Beginning balance ₩ 10,331,453 ₩ 2,320,327 ₩ 12,651,780 7,465,313
Increase 2,139,000 165 2,139,165 2,313,600
Disposal - - - (23,221)
Valuation profit (loss) 10,463,904 1,322,631 11,786,535 2,896,088
Ending balance ₩ 22,934,357 ₩ 3,643,123 ₩ 26,577,480 ₩ 12,651,780
(2) Details of FVPL as of December 31, 2018 is as follows:
Korean won (in thousands)
Book value
Capital investment of partnership ₩ 3,642,223
Unlisted securities 900
Total ₩ 3,643,123
- 39 -
(3) Details of FVOCI as of December 31, 2018 is as follows:
Korean won (in thousands)
Book value
Unlisted securities(*1) ₩ 22,934,357
(*1) The Group makes an irrevocable election to present in other comprehensive income subsequent changes in the fair value
of an investment in an equity instrument that is not held for trading at the date of initial application.
1) Listed securities (excluding investments in associates)
The Group does not have listed securities (excluding investments in associates) as of December 31, 2018 and 2017.
2) Unlisted securities (excluding investments in associates)
Details of unlisted securities (excluding investments in associates) as of December 31, 2018 and 2017, are as
follows:
Korean won (in thousands)
December 31, 2018 December 31, 2017
Number of
shares owned
Percentage of
ownership (%) Book value Book value
CVnet Co., Ltd. (*1) 600,000 9.38 ₩ 2,194,800 ₩ 1,462,800
Others - - 20,739,557 8,884,206
Total ₩ 22,934,357 ₩ 10,347,006
(*1) The fair value of CVnet Co., Ltd. was appropriately estimated based on the professional judgment of independent
appraisers’ reasonable valuation method. The fair value was estimated using the discounted cash flow method by the
independent appraisers. In estimating future cash flows, economic indicators and conditions were taken into
consideration and it was presumed that there were no significant changes in the business structure of the investee.
(4) Details of long-term AFS financial assets as of December 31, 2017, is as follows:
Korean won (in thousands)
Book value
Unlisted securities ₩ 10,347,006
Capital investment of partnership 2,304,774
Total ₩ 12,651,780
(5) Changes in valuation gain (loss) in the above FVPL and long-term AFS financial assets in accordance with fair
value assessment for the years ended December 31, 2018 and 2017, are as follows:
Korean won (in thousands)
December 31, 2018 December 31, 2017
Beginning balance ₩ 3,180,282 ₩ 308,240
Measurement of fair value 10,366,585 2,872,042
Included in profit or loss - -
Ending balance 13,546,867 3,180,282
Income tax effect (3,697,034) (767,662)
Total ₩ 9,849,833 ₩ 2,412,620
12
.S
UB
SID
IAR
IES
:
(1)
Sub
sid
iari
es a
s o
f D
ecem
ber
31
, 2
01
8,
are
as f
oll
ow
s:N
um
ber
of
stock
s ow
ned
by
Ow
ner
ship
(%)
Coun
try
Sh
ares
hel
d b
y
subsi
dia
ries
(%)
Reg
ion
Nam
e of
sub
sid
iari
es
Typ
e of
bu
sin
ess
Con
troll
ing
Com
pan
y
Sub
sid
iary
T
ota
l K
ore
a S
-Core
Co.,
Ltd
. O
per
atin
g s
yst
em s
oft
war
e d
evel
op
men
t 2
1,3
47
,538
1
40,9
12
21,4
88
,450
82.2
2
Kore
a 0
.54
Op
en H
and
s C
o., L
td.
Soft
war
e dev
elop
men
t 2
0,0
00
-2
0,0
00
100.0
0
Kore
a -
Mir
acom
In
c.
Syst
em i
nte
gra
tion
ser
vic
e 5
,01
0,2
97
-5
,01
0,2
97
83.6
2
Kore
a -
Mu
ltiC
ampu
s C
o., L
td. (*
1)
Pro
vid
ing r
emote
ed
uca
tion
syst
em a
nd
con
tents
2
,80
0,0
00
-2
,80
0,0
00
47.2
4
Kore
a -
SV
IC #
31 I
nves
tmen
t P
artn
ersh
ip
Ven
ture
cap
ital
-
- -
99.0
0
Kore
a -
SV
IC #
39 I
nves
tmen
t P
artn
ersh
ip
Ven
ture
cap
ital
-
- -
99.0
0
Kore
a -
SE
CU
i C
orp
. S
yst
em s
oft
war
e d
evel
op
men
t an
d s
upp
ly
6,5
00,0
00
-6
,50
0,0
00
56.5
2
Kore
a -
Am
eric
a S
amsu
ng S
DS
Glo
bal
SC
L A
mer
ica,
Inc.
Lo
gis
tics
5
,50
0,0
00
-5
,50
0,0
00
100.0
0
Am
eric
a -
Sam
sun
g S
DS
Lat
in A
mer
icas
Solu
coes
Em
Tec
nolo
gia
Ltd
a S
yst
em i
nte
gra
tion
ser
vic
e 2
24,2
18
,20
0
607,6
37
224,8
25
,83
7
100.0
0
Bra
zil
0.2
7
Sam
sun
g S
DS
Mex
ico, S
.A. d
e C
.V.
Syst
em i
nte
gra
tion
ser
vic
e an
d l
ogis
tics
-
99
99
99.0
0
Mex
ico
99.0
0
Lan
gu
age
Tes
tin
g I
nte
rnat
ion
al,
Inc.
(*1
) O
ral
pro
fici
ency
inte
rvie
w c
om
pute
r as
sess
men
t se
rvic
e -
115,9
80
115,9
80
38.9
1
Am
eric
a 8
2.3
6
Sam
sun
g S
DS
Glo
bal
SC
L P
anam
a S
.A.
Lo
gis
tics
-
9,9
99
9,9
99
99.9
9
Pan
ama
99.9
9
Sam
sun
g S
DS
Glo
bal
SC
L C
hil
e L
imit
ada
Lo
gis
tics
-
--
99.9
9
Chil
e 9
9.9
9
Sam
sun
g S
DS
Glo
bal
SC
L C
olo
mb
ia S
.A.S
. L
ogis
tics
-
10,0
00
10,0
00
100.0
0
Colo
mb
ia
100.0
0
Sam
sun
g S
DS
Glo
bal
SC
L P
eru S
.A.C
. L
ogis
tics
-
9,9
99
9,9
99
99.9
9
Per
u
99.9
9
Sam
sun
g S
DS
GS
CL
Can
ada.
, L
td.
Lo
gis
tics
1
0,0
00
-1
0,0
00
100.0
0
Can
ada
-
Sam
sun
g S
DS
Glo
bal
SC
L L
atin
Am
eric
a L
ogis
tica
Ltd
a L
ogis
tics
5
,88
7,2
66
,647
15,9
54
,652
5,9
03,2
21
,299
100.0
0
Bra
zil
0.2
7
Sam
sun
g S
DS
Am
eric
a, I
nc.
Syst
em i
nte
gra
tion
ser
vic
e -
- -
100.0
0
Am
eric
a -
Neo
EX
pre
ss T
ransp
ort
atio
n (
NE
XT
), I
nc.
L
ogis
tics
4
49,3
39
-4
49,3
39
51.0
0
Am
eric
a -
INT
E-S
DS
Logis
tics
S.A
. d
e C
.V.
Lo
gis
tics
4
,31
3,5
34
-4
,31
3,5
34
51.0
0
Mex
ico
-
Eu
rope
Sam
sun
g S
DS
Euro
pe,
Ltd
. S
yst
em i
nte
gra
tion
ser
vic
e 1
,00
0,0
00
-1
,00
0,0
00
100.0
0
En
gla
nd
-
Sam
sun
g S
DS
Glo
bal
SC
L N
ether
lands
Coop
erat
ief
U.A
. L
ogis
tics
-
- -
100.0
0
Net
her
lan
ds
0.0
1
Sam
sun
g S
DS
Glo
bal
SC
L R
us
Lim
ited
Lia
bil
ity C
om
pan
y
Lo
gis
tics
-
- -
100.0
0
Russ
ia
0.0
1
Sam
sun
g S
DS
Glo
bal
SC
L H
un
gar
y K
ft.
Lo
gis
tics
-
- -
100.0
0
Hu
ngar
y
-
Sam
sun
g S
DS
Glo
bal
SC
L S
lovak
ia,
S.R
.O.
Lo
gis
tics
-
- -
100.0
0
Slo
vak
ia
-
Sam
sun
g S
DS
Glo
bal
SC
L P
ola
nd S
p.
Z.o
.o.
Lo
gis
tics
9
,99
9
1
10,0
00
100.0
0
Pola
nd
0.0
1
Sam
sun
g S
DS
Glo
bal
SC
L U
K L
imit
ed
Lo
gis
tics
1
00,0
00
-1
00,0
00
100.0
0
En
gla
nd
-
Sam
sun
g G
SC
L S
wed
en A
B
Lo
gis
tics
5
,80
0,0
00
-5
,80
0,0
00
100.0
0
Sw
eden
-
Sam
sun
g S
DS
Glo
bal
SC
L F
ran
ce S
AS
L
ogis
tics
1
50,0
00
-1
50,0
00
100.0
0
Fra
nce
-
Sam
sun
g S
DS
Glo
bal
SC
L B
alti
cs,
SIA
L
ogis
tics
1
6,0
00
-1
6,0
00
100.0
0
Lat
via
-
Sam
sun
g S
DS
Glo
bal
SC
L I
taly
S.R
.L. A
Soci
o U
nic
o
Lo
gis
tics
1
00,0
00
-1
00,0
00
100.0
0
Ital
y
-
Sam
sun
g S
DS
Glo
bal
Supp
ly C
hai
n L
ogis
tics
Sp
ain
S.L
.U.
Lo
gis
tics
5
6,0
00
-5
6,0
00
100.0
0
Sp
ain
-
Sam
sun
g G
SC
L P
ort
ugal
, S
oci
edad
e U
nip
esso
al L
DA
L
ogis
tics
1
6,0
00
-1
6,0
00
100.0
0
Port
ugal
-
Sam
sun
g S
DS
Glo
bal
SC
L G
reec
e S
oci
ete
An
on
ym
e L
ogis
tics
1
9,9
98
2
20,0
00
100.0
0
Gre
ece
0.0
1
Sam
sun
g S
DS
Glo
bal
SC
L G
erm
any G
mb
H
Lo
gis
tics
-
- -
100.0
0
Ger
man
y
-
Sam
sun
g S
DS
Glo
bal
SC
L A
ust
ria
Gm
bH
L
ogis
tics
-
- -
100.0
0
Au
stri
a -
Sam
sun
g S
DS
Glo
bal
SC
L C
zech
S.R
.O.
Lo
gis
tics
-
- -
100.0
0
Cze
ch
-
Sam
sun
g S
DS
Glo
bal
SC
L S
wit
zerl
and G
MB
H
Lo
gis
tics
2
,00
0
-2
,00
0
100.0
0
Sw
itze
rlan
d
- S
amsu
ng S
DS
GS
CL
Rom
ania
S.R
.L.
Lo
gis
tics
9
,99
9
1
10,0
00
100.0
0
Rom
ania
0
.01
Asi
a S
amsu
ng S
DS
Chin
a C
o., L
td.
Syst
em i
nte
gra
tion
ser
vic
e -
- -
100.0
0
Chin
a -
Sam
sun
g I
T S
ervic
es (
Bei
jin
g)
Co., L
td.
Syst
em i
nte
gra
tion
ser
vic
e -
- -
100.0
0
Chin
a -
Sam
sun
g S
DS
Asi
a P
acif
ic P
te.
Ltd
. S
yst
em i
nte
gra
tion
ser
vic
e 1
,00
0,0
00
-1
,00
0,0
00
100.0
0
Sin
gap
ore
-
Sam
sun
g S
DS
Glo
bal
SC
L A
sia
Pac
ific
Pte
. L
td.
Lo
gis
tics
1
,47
0,0
00
-1
,47
0,0
00
100.0
0
Sin
gap
ore
-
Sam
sun
g S
DS
Vie
tnam
Co., L
td.
Syst
em i
nte
gra
tion
ser
vic
e -
- -
100.0
0
Vie
tnam
-
Sam
sun
g S
DS
GS
CL
Vie
tnam
Co., L
td.
Lo
gis
tics
-
- -
100.0
0
Vie
tnam
-
AL
S S
DS
JO
INT
ST
OC
K C
OM
PA
NY
L
ogis
tics
7
39,5
00
-7
39,5
00
51.0
0
Vie
tnam
-
- 40 -
Nu
mb
er o
f st
ock
s ow
ned
by
Ow
ner
ship
(%)
Coun
try
Sh
ares
hel
d b
y
subsi
dia
ries
(%)
Reg
ion
Nam
e of
sub
sid
iari
es
Typ
e of
bu
sin
ess
Con
troll
ing
com
pan
y
Sub
sid
iary
T
ota
l
Asi
a S
amsu
ng S
DS
Glo
bal
SC
L P
hil
ippin
es C
o.,
Ltd
. In
c.
Lo
gis
tics
2
0,9
99
,995
-2
0,9
99
,995
99.9
9
Phil
ippin
es
-
Sam
sun
g S
DS
Glo
bal
SC
L T
hai
land
Co., L
td.
Lo
gis
tics
8
79,9
88
-8
79,9
88
99.9
9
Th
aila
nd
-
SD
S -
Acu
tech
Co., L
td. (*
1)
Lo
gis
tics
1
09,9
99
-1
09,9
99
49.9
9
Th
aila
nd
- S
amsu
ng S
DS
Glo
bal
SC
L M
alay
sia
SD
N B
HD
L
ogis
tics
2
,09
9,9
98
-2
,09
9,9
98
99.9
9
Mal
aysi
a -
PT
. S
amsu
ng S
DS
Glo
bal
SC
L I
nd
on
esia
(*2
) L
ogis
tics
2
45
-2
45
49.0
0
Ind
on
esia
-
Sam
sun
g S
DS
Glo
bal
SC
L H
on
g K
on
g C
o.,
Ltd
. L
ogis
tics
1
1,6
91
,380
-1
1,6
91
,380
100.0
0
Hon
g K
on
g
-
Sam
sun
g D
ata
Syst
ems
India
Pri
vat
e L
imit
ed
Lo
gis
tics
2
,99
9,9
99
-2
,99
9,9
99
99.9
9
Ind
ia
-
Sam
sun
g S
DS
Ind
ia P
rivat
e L
imit
ed
Syst
em i
nte
gra
tion
ser
vic
e 2
,99
9,9
99
-2
,99
9,9
99
99.9
9
Ind
ia
-
Sam
sun
g S
DS
Glo
bal
SC
L B
eiji
ng C
o.,
Ltd
. L
ogis
tics
-
- -
100.0
0
Chin
a 1
00.0
0
Mir
acom
In
c. A
sia
Pac
ific
Ltd
. S
yst
em i
nte
gra
tion
ser
vic
e -
5,8
64,1
62
5,8
64,1
62
83.6
2
Hon
g K
on
g
100.0
0
Mir
acom
In
c. C
hin
a L
td.
Syst
em i
nte
gra
tion
ser
vic
e -
--
83.6
2
Chin
a 1
00.0
0
Sam
sun
g S
DS
Glo
bal
Dev
elopm
ent
Cen
ter
Xi'a
n
Syst
em i
nte
gra
tion
ser
vic
e -
--
100.0
0
Chin
a 1
00.0
0
Sam
sun
g S
DS
Glo
bal
SC
L A
ust
rali
a P
ty.,
Ltd
. L
ogis
tics
1
,00
0
-1
,00
0
100.0
0
Au
stra
lia
-
SD
S K
erry
(S
han
gh
ai)
Supp
ly C
hai
n S
olu
tion
s L
imit
ed (
*1
) L
ogis
tics
-
- -
50.0
0
Chin
a -
VA
SC
O S
upp
ly C
hai
n S
olu
tions
Pri
vat
e L
imit
ed
Lo
gis
tics
-
- -
50.9
9
Ind
ia
-
SD
S-M
P L
ogis
tics
Join
t S
tock
Com
pan
y
Lo
gis
tics
8
16,0
00
-8
16,0
00
51.0
0
Vie
tnam
-
Afr
ica
Sam
sun
g S
DS
Glo
bal
SC
L E
gyp
t L
ogis
tics
9
,99
9
-9
,99
9
99.9
9
Eg
yp
t -
Sam
sun
g S
DS
Glo
bal
SC
L S
ou
th A
fric
a (P
TY
) L
td.
Lo
gis
tics
1
00
-1
00
100.0
0
Sou
th A
fric
a -
Mid
dle
eas
t S
amsu
ng S
DS
Glo
bal
SC
L N
akli
yat
ve
Loji
stik
An
onim
Sir
ket
i L
ogis
tics
1
,00
0
-1
,00
0
100.0
0
Tu
rkey
-
Sam
sun
g
SD
S
Glo
bal
S
UP
PL
Y
CH
AIN
L
OG
IST
ICS
M
IDD
LE
EA
ST
DW
C-L
LC
L
ogis
tics
2
,93
0,0
00
-2
,93
0,0
00
100.0
0
Du
bai
-
(*1
) A
lth
ou
gh
th
e G
rou
p h
old
s le
ss t
han
a m
ajo
rity
of
the
vo
tin
g r
igh
ts, it
mai
nta
ins
con
tro
l th
rou
gh
a c
on
trac
tual
agre
emen
t am
on
g t
he
share
ho
lder
s.
(*2
) T
he
Gro
up
mai
nta
ins
con
tro
l b
ecau
se a
ll t
he
no
n-c
on
tro
llin
g i
nte
rest
s ar
e co
mp
ose
d o
f p
refe
rred
sh
ares
wit
ho
ut
vo
tin
g r
igh
ts.
(2)
The
financi
al s
tatu
s o
f su
bsi
dia
ries
as
of
Dec
em
ber
31
, 2
01
7,
is a
s fo
llo
ws:
Kore
an w
on
(in
th
ousa
nds)
Nam
e of
sub
sid
iari
es
Tota
l as
sets
T
ota
l li
abil
itie
s T
ota
l eq
uit
y
Rev
enu
e N
et p
rofi
t (l
oss
)
S-C
ore
Co.,
Ltd
. ₩
2
7,6
43
,501 ₩
9
,15
5,1
59 ₩
1
8,4
88
,342 ₩
5
6,5
95
,290 ₩
6
,69
0,1
24
Op
en H
and
s C
o., L
td.
2,3
12,2
20
575,0
56
1,7
37,1
64
7,3
65,5
70
212,0
22
Mir
acom
In
c.
87,9
94
,322
34,8
00
,041
53,1
94
,281
273,4
23
,94
7
14,1
79
,346
Mu
ltiC
ampu
s C
o., L
td.
135,5
48
,99
4
45,4
74
,113
90,0
74
,881
228,5
43
,70
1
16,4
24
,013
SV
IC #
31 I
nves
tmen
t P
artn
ersh
ip
2
0,5
51
,773
55,8
25
20,4
95
,948
- (2
05,9
38
)
SV
IC #
38 I
nves
tmen
t P
artn
ersh
ip
838,8
31
129,3
27
709,5
04
- (2
90,4
96
)
SE
CU
i C
orp
. 1
39,0
52
,25
6
27,0
13
,118
112,0
39
,13
8
107,8
07
,48
5
7,3
00,2
40
Sam
sun
g S
DS
Glo
bal
SC
L A
mer
ica,
Inc.
258,6
48
,19
2
70,0
09
,835
188,6
38
,35
7
881,1
19
,84
5
(13
,19
5,2
92
)
Sam
sun
g S
DS
Lat
in A
mer
icas
Solu
coes
Em
Tec
nolo
gia
Ltd
a 4
3,3
83
,527
11,1
91
,336
32,1
92
,191
62,4
70
,873
13,5
00
,101
Sam
sun
g S
DS
Mex
ico, S
.A. d
e C
.V.
52,1
92
,978
42,9
72
,768
9,2
20,2
10
265,8
36
,41
4
(5,4
99
,221
)
Lan
gu
age
Tes
tin
g I
nte
rnat
ion
al,
Inc.
1
3,7
33
,625
2,0
89,6
50
11,6
43
,975
19,5
64
,672
1,3
52,7
75
Sam
sun
g S
DS
Glo
bal
SC
L P
anam
a S
.A.
4,4
95,1
77
2,9
73,4
78
1,5
21,6
99
14,3
59
,461
499,3
01
Sam
sun
g S
DS
Glo
bal
SC
L C
hil
e L
imit
ada
3,1
19,6
77
1,5
36,7
23
1,5
82,9
54
15,2
10
,640
(2,9
93
)
Sam
sun
g S
DS
Glo
bal
SC
L C
olo
mb
ia S
.A.S
. 3
,15
4,9
08
3,5
62,3
83
(40
7,4
75
) 1
9,0
83
,245
(27
5,9
72
)
Sam
sun
g S
DS
Glo
bal
SC
L P
eru S
.A.C
5
,99
8,3
04
5,0
22,2
09
976,0
95
26,5
63
,384
154,0
91
Sam
sun
g S
DS
GS
CL
Can
ada.
, L
td.
6,5
11,6
52
5,7
16,2
35
795,4
17
48,6
39
,483
18,4
15
Sam
sun
g S
DS
Glo
bal
SC
L L
atin
Am
eric
a L
ogis
tica
Ltd
a 4
7,2
28
,259
1
2,6
48
,542
3
4,5
79
,717
1
28,1
96
,64
2
6,2
20,2
32
Sam
sun
g S
DS
Am
eric
a, I
nc.
1
45,0
36
,74
4
64,3
11
,668
8
0,7
25
,076
3
73,5
94
,15
9
18,2
19
,900
Neo
EX
pre
ss T
ransp
ort
atio
n (
NE
XT
) In
c.
705,8
48
267,5
25
438,3
23
3,6
88,4
37
(53
8,0
84
)
- 41 -
-4
2 -
Kore
an w
on
(in
th
ousa
nds)
Nam
e of
sub
sid
iari
es
Tota
l as
sets
T
ota
l li
abil
itie
s T
ota
l eq
uit
y
Rev
enu
e N
et p
rofi
t (l
oss
)
INT
E-S
DS
Logis
tics
S.A
. d
e C
.V.
376,4
51
14,0
70
362,3
81
15,5
29
(11
9,6
69
)
Sam
sun
g S
DS
Euro
pe,
Ltd
. 1
72,2
98
,60
0
38,7
34
,362
1
33,5
64
,23
8
202,1
51
,11
0
21,0
76
,625
Sam
sun
g S
DS
Glo
bal
SC
L N
ether
lands
Coop
erat
ief
U.A
. 3
5,3
40
,453
3
0,2
46
,752
5
,09
3,7
01
129,6
26
,44
7
682,7
68
Sam
sun
g S
DS
Glo
bal
SC
L R
us
Lim
ited
Lia
bil
ity C
om
pan
y
13,7
39
,524
6
,57
6,0
35
7,1
63,4
89
80,4
29
,144
2
,51
3,9
02
Sam
sun
g S
DS
Glo
bal
SC
L H
un
gar
y K
ft.
22,5
75
,550
1
3,8
93
,258
8
,68
2,2
92
63,4
43
,625
1
,08
8,5
66
Sam
sun
g S
DS
Glo
bal
SC
L S
lovak
ia,
S.R
.O.
53,9
66
,509
2
7,6
29
,194
2
6,3
37
,315
1
45,7
81
,81
4
805,9
01
Sam
sun
g S
DS
Glo
bal
SC
L P
ola
nd S
p.
Z.o
.o.
30,1
01
,935
2
5,4
95
,324
4
,60
6,6
11
113,6
39
,08
0
473,8
98
Sam
sun
g S
DS
Glo
bal
SC
L U
K L
imit
ed
7,7
86,8
19
7,5
33,5
81
253,2
38
39,4
05
,697
(9
79,6
35
)
Sam
sun
g G
SC
L S
wed
en A
B
3,1
87,0
93
2,8
49,7
34
337,3
59
12,2
17
,330
(2
27,7
28
)
Sam
sun
g S
DS
Glo
bal
SC
L F
ran
ce S
AS
1
,94
9,4
01
338,5
39
1,6
10,8
62
- (3
11,3
52
)
Sam
sun
g S
DS
Glo
bal
SC
L B
alti
cs,
SIA
5
51,2
57
501,7
72
49,4
85
2,2
36,4
22
(14
9,5
23
)
Sam
sun
g S
DS
Glo
bal
SC
L I
taly
S.R
.L. A
Soci
o U
nic
o
12,5
72
,378
1
1,0
15
,745
1
,55
6,6
33
37,1
98
,532
1
3,2
70
Sam
sun
g S
DS
Glo
bal
Supp
ly C
hai
n L
ogis
tics
Sp
ain
S.L
.U.
662,8
97
169,1
32
493,7
65
- (2
16,5
06
)
Sam
sun
g G
SC
L P
ort
ugal
, S
oci
edad
e U
nip
esso
al L
DA
1
75,1
18
115,3
27
59,7
91
- (1
46,4
34
)
Sam
sun
g S
DS
Glo
bal
SC
L G
reec
e S
oci
ete
An
on
ym
e 5
53,2
96
503,8
81
49,4
15
2,2
87,3
72
(16
1,6
03
)
Sam
sun
g S
DS
Glo
bal
SC
L G
erm
any G
mb
H
10,9
41
,783
1
1,5
80
,364
(6
38,5
81
) 4
5,6
63
,343
2
28,4
37
Sam
sun
g S
DS
Glo
bal
SC
L A
ust
ria
Gm
bH
9
4,6
45
197,3
80
(10
2,7
35
) 2
20,0
70
(17
2,0
58
)
Sam
sun
g S
DS
Glo
bal
SC
L C
zech
S.R
.O.
54,8
26
116,4
22
(61
,59
6)
- (1
22,9
18
)
Sam
sun
g S
DS
Glo
bal
SC
L S
wit
zerl
and G
MB
H
282,8
59
117,1
87
165,6
72
- (1
38,4
87
)
Sam
sun
g S
DS
GS
CL
Rom
ania
S.R
.L.
719,2
75
723,7
05
(4,4
30
) 2
,07
0,4
29
(15
4,5
71
) S
amsu
ng S
DS
Chin
a C
o., L
td.
110,2
59
,20
3
11,3
88
,985
9
8,8
70
,218
3
3,2
62
,472
3
47,0
71
Sam
sun
g I
T S
ervic
es (
Bei
jin
g)
Co., L
td.
191,0
17
,16
1
154,0
99
,69
3
36,9
17
,468
3
13,2
74
,99
5
25,1
27
,322
Sam
sun
g S
DS
Asi
a P
acif
ic P
te,
Ltd
. 9
4,1
08
,728
4
5,8
52
,983
4
8,2
55
,745
8
6,3
54
,721
2
,51
4,5
13
Sam
sun
g S
DS
Glo
bal
SC
L A
sia
Pac
ific
Pte
. L
td.
5,7
10,9
46
3,4
62,3
05
2,2
48,6
41
15,6
13
,794
7
3,0
25
Sam
sun
g S
DS
Vie
tnam
Co., L
td.
37,0
74
,961
2
9,6
15
,658
7
,45
9,3
03
74,3
75
,855
3
,26
2,6
12
Sam
sun
g S
DS
GS
CL
Vie
tnam
Co., L
td.
365,9
18
,14
3
94,7
44
,416
2
71,1
73
,72
7
623,5
64
,72
9
41,2
74
,047
AL
S S
DS
Join
t S
tock
Com
pan
y
3,7
35,8
14
2,2
70,9
17
1,4
64,8
97
29,0
27
,428
8
07,5
65
Sam
sun
g S
DS
Glo
bal
SC
L P
hil
ippin
es C
o.,
Ltd
. In
c.
17,8
78
,474
2
0,9
83
,747
(3
,105
,273
) 4
4,7
00
,894
(5
,445
,250
) S
amsu
ng S
DS
Glo
bal
SC
L T
hai
land
Co., L
td.
60,8
16
,653
2
4,5
16
,291
3
6,3
00
,362
1
97,6
51
,99
1
3,5
97,3
88
SD
S -
Acu
tech
Co., L
td.
1,6
10,4
41
627,8
79
982,5
62
5,5
20,4
34
224,1
33
Sam
sun
g S
DS
Glo
bal
SC
L M
alay
sia
SD
N.
BH
D
15,8
10
,994
7
,91
4,9
70
7,8
96,0
24
71,9
64
,344
1
,64
4,4
24
PT
. S
amsu
ng S
DS
Glo
bal
SC
L I
nd
on
esia
1
1,2
66
,880
9
,44
6,9
41
1,8
19,9
39
55,9
13
,354
(8
,425
,573
)
Sam
sun
g S
DS
Glo
bal
SC
L H
on
g K
on
g C
o.,
Ltd
. 1
7,5
22
,552
6
,96
6,1
85
10,5
56
,367
5
9,9
74
,791
1
,74
7,3
99
Sam
sun
g D
ata
Syst
ems
India
Pri
vat
e L
imit
ed
42,6
80
,534
3
5,1
68
,071
7
,51
2,4
63
102,0
71
,70
1
1,6
28,9
03
Sam
sun
g S
DS
Ind
ia P
rivat
e L
imit
ed
66,9
11
,968
4
2,8
28
,141
2
4,0
83
,827
8
2,2
21
,780
2
,83
0,1
28
Sam
sun
g S
DS
Glo
bal
SC
L B
eiji
ng C
o.,
Ltd
. 2
57,0
49
,05
9
117,9
06
,29
8
139,1
42
,76
1
760,7
22
,77
1
19,7
19
,349
Mir
acom
, In
c. A
sia
Pac
ific
Ltd
. 8
36,2
18
56,4
54
779,7
64
- (6
,933
)
Mir
acom
, In
c. C
hin
a L
td.
597,5
10
3,4
80,2
96
(2,8
82
,786
) 9
,94
8
(1,1
38
,919
)
Sam
sun
g S
DS
Glo
bal
Dev
elopm
ent
Cen
ter
Xi'a
n
9,5
43,2
70
1,1
05,2
19
8,4
38,0
51
20,2
11
,510
862,4
17
Sam
sun
g S
DS
Glo
bal
SC
L A
ust
rali
a P
ty.,
Ltd
. 1
1,4
64
,145
14,3
71
,571
(2,9
07
,426
) 6
3,4
41
,418
(2,4
18
,300
)
SD
S K
erry
(S
han
gh
ai)
Supp
ly C
hai
n S
olu
tion
s L
imit
ed
9,5
55,5
21
8,2
22,8
53
1,3
32,6
68
23,7
15
,843
3
12,9
25
VA
SC
O S
upp
ly C
hai
n S
olu
tions
Pri
vat
e L
imit
ed
329,6
38
73,0
39
256,5
99
352,4
47
(47
,57
1)
SD
S-M
P L
ogis
tics
Join
t S
tock
Com
pan
y
1,8
43,1
40
975,2
10
867,9
30
4,0
84,0
55
108,5
19
Sam
sun
g S
DS
Glo
bal
SC
L E
gyp
t 1
7,1
17
,165
5
,66
0,2
16
11,4
56
,949
2
9,1
59
,837
1
,45
3,9
85
Sam
sun
g S
DS
Glo
bal
SC
L S
ou
th A
fric
a (P
TY
) L
td.
4,7
15,7
21
4,0
74,9
59
640,7
62
35,2
21
,292
9
7,2
98
Sam
sun
g S
DS
Glo
bal
SC
L N
akli
yat
ve
Loji
stik
An
onim
Sir
ket
i 5
,06
9,0
54
4,1
43,3
85
925,6
69
24,9
52
,339
1
9,4
43
Sam
sun
g S
DS
Glo
bal
Supp
ly C
hai
n L
ogis
tics
Mid
dle
Eas
t D
WC
LL
C
6,7
88,6
96
4,9
98,7
22
1,7
89,9
74
38,8
49
,802
(2
83,2
70
)
- 42 -
- 43 -
(3) The status of subsidiaries newly included in the preparation of the consolidated financial statements for the
year ended December 31, 2018, is as follows:
Location Name of subsidiaries Reason
India VASCO Supply Chain Solutions Private Limited Newly established
Vietnam SDS-MP Logistics Joint Stock Company Newly established
Mexica INTE-SDS Logistics S.A. de C.V. Newly established
Republic of Korea SVIC #39 Investment Partnership Newly established
13. INVESTMENTS IN ASSOCIATES:
(1) Details of the Group’s investments in associates as of December 31, 2018 and 2017, are as follows:
Korean won (in thousands)
Location Main business
December 31, 2018 December 31, 2017
Ownership
(%)
Acquisition
cost Book value Book value
KOREA INFORMATION
CERTIFICATE
AUTHORITY, INC. (*1) Korea
Certification services
based for E-
commerce 6.42 ₩ 1,128,139 ₩ 5,113,828 ₩ 4,619,156
DongA.com Co., Ltd. (*1)
Korea
Internet Media
Business 18.97 1,306,377
3,209,014 2,895,857
Dunet, Inc. (*1)
Korea
E-learning and
knowledge content
service 18.01 971,068
80,877 71,447
SERI Technologies, Inc.
Korea
Financial
Information System
integration 29.00 4,190,500
4,469,959 4,402,038
iMarket Asia Co., Ltd.
China
Global industrial
goods e-commerce 40.56 18,799,534 31,119,927 28,551,580
Total ₩ 26,395,618 ₩ 43,993,605 ₩ 40,540,078
(*1) Although the Group’s each ownership of Korea Information Certificate Authority Inc., DongA.Com Co., Ltd. and Dunet
Inc. is less than 20%, these investments are classified as investments in associates because the Group can participate in
decision making on the financial and operating policies of the investees.
(2) Market price information of the marketable investment in associates owned by the Group as of December 31,
2018, is as follows:
Korean won (in thousands, except for market value per share) Number of shares Market value per share Market price Book value
KOREA INFORMATION
CERTIFICATE
AUTHORITY, INC. 2,000,000 shares ₩ 3,775 ₩ 7,550,000 ₩ 5,113,828
- 44 -
(3) Details of changes in investments in associates accounted for using the equity method for the years ended
December 31, 2018 and 2017, are as follows:
December 31, 2018:
Korean won (in thousands)
Beginning
balance
Share of profit of
associates
Change in
associates’ equity Others(*1)
Ending
balance
KOREA INFORMATION
CERTIFICATE
AUTHORITY, INC. ₩ 4,619,156 ₩ 594,309 ₩ 363 ₩ (100,000) ₩ 5,113,828
DongA.com Co., Ltd. 2,895,857 376,435 (78) (63,200) 3,209,014
Dunet, Inc. 71,447 9,430 - - 80,877
SERI Technologies, Inc. 4,402,038 67,921 - - 4,469,959
iMarket Asia Co., Ltd. 28,551,580 1,978,276 590,071 - 31,119,927
Total ₩40,540,078 ₩ 3,026,371 ₩ 590,356 ₩ (163,200) ₩ 43,993,605
(*1) Amount changes of investments in associates, due to the change in the dividend.
December 31, 2017:
Korean won (in thousands)
Beginning
balance
Share of profit of
Associates
Change in
associates’ equity Others(*1)
Ending
balance
KOREA INFORMATION
CERTIFICATE
AUTHORITY, INC. ₩ 3,883,642 ₩ 293,823 ₩ 34,885 ₩ 406,806 ₩ 4,619,156
DongA.com Co., Ltd. 2,561,714 397,230 113 (63,200) 2,895,857
Dunet, Inc. 65,209 6,238 - - 71,447
SERI Technologies, Inc. 4,244,769 157,269 - - 4,402,038
iMarket Asia Co., Ltd. 30,209,984 1,099,912 (2,758,316) - 28,551,580
Total ₩ 40,965,318 ₩ 1,954,472 ₩ (2,723,318) ₩ 343,606 ₩ 40,540,078
(*1) Amount changes of investments in associates, due to the change in the dividend and ownerships.
(4) Summary of financial information of associates as of and for the years ended December 31, 2018 and 2017, is
as follows:
December 31, 2018: Korean won (in thousands)
Total assets Total liabilities Total equity Revenues
Net
income (loss)
KOREA INFORMATION
CERTIFICATE
AUTHORITY, INC. ₩ 99,279,326 ₩ 19,593,105 ₩ 79,686,221 ₩ 38,342,344 ₩ 9,186,853
DongA.com Co., Ltd. 19,838,875 2,920,465 16,918,410 19,863,732 2,391,331
Dunet, Inc. 11,379,304 10,930,238 449,066 11,348,685 46,603
SERI Technologies, Inc. 8,837,641 3,978,860 4,858,781 16,386,890 192,738
iMarket Asia Co., Ltd. 129,733,369 69,703,832 60,029,537 508,509,747 6,192,827
December 31, 2017: Korean won (in thousands)
Total assets Total liabilities Total equity Revenues
Net
income (loss)
KOREA INFORMATION
CERTIFICATE
AUTHORITY, INC. ₩ 91,120,503 ₩ 19,142,502 ₩ 71,978,001 ₩ 35,694,616 ₩ 4,480,821
DongA.com Co., Ltd. 17,824,003 2,556,609 15,267,394 19,003,763 2,258,682
Dunet, Inc. 10,758,176 10,361,467 396,709 10,103,396 22,729
SERI Technologies, Inc. 9,234,003 4,609,434 4,624,569 17,928,792 545,982
iMarket Asia Co., Ltd. 128,392,144 74,750,695 53,641,449 575,816,174 3,406,491
- 45 -
(5) Reconciliation of the above summarized financial information to the carrying amount of the interest in the
associates recognized in the consolidated financial statements:
December 31, 2018:
Korean won (in thousands)
Korea
Information
Certificate
Authority Inc.
DongA.com Co.,
Ltd. Dunet, Inc.
SERI
Technologies,
Inc.
iMarket Asia Co.,
Ltd.
Net assets of associate ₩ 79,686,221 ₩ 16,918,410 ₩ 449,066 ₩ 4,858,781 ₩ 60,029,537
Proportion of the Group’s
ownership interest in the
associate (%) 6.42 18.97 18.01 29.00 40.56
Amount of the Group’s
ownership interest in the
associate ₩ 5,113,828 ₩ 3,209,014 ₩ 80,877 ₩ 1,409,046 ₩ 20,754,535
Goodwill - - - 3,060,913 10,365,392
Carrying amount of the Group’s
interest in the associate ₩ 5,113,828 ₩ 3,209,014 ₩ 80,877 ₩ 4,469,959 ₩ 31,119,927
December 31, 2017:
Korean won (in thousands)
Korea
Information
Certificate
Authority Inc.
DongA.com Co.,
Ltd. Dunet, Inc.
SERI
Technologies,
Inc.
iMarket Asia Co.,
Ltd.
Net assets of associate ₩ 71,978,001 ₩ 15,267,394 ₩ 396,709 ₩ 4,624,569 ₩ 53,641,449
Proportion of the Group’s
ownership interest in the
associate (%) 6.42 18.97 18.01 29.00 40.56
Amount of the Group’s
ownership interest in the
associate ₩ 4,619,156 ₩ 2,895,857 ₩ 71,447 ₩ 1,341,125 ₩ 18,619,122
Goodwill - - - 3,060,913 9,932,458
Carrying amount of the Group’s
interest in the associate ₩ 4,619,156 ₩ 2,895,857 ₩ 71,447 ₩ 4,402,038 ₩ 28,551,580
14. PROPERTY AND EQUIPMENT:
(1) Details of carrying amounts of property and equipment as of December 31, 2018 and 2017, are as follows:
December 31, 2018:
Korean won (in thousands)
Land Buildings
Machinery and
equipment Others
Construction
in progress Total
Acquisition
costs ₩ 118,735,985 ₩ 582,144,622 ₩1,593,978,388 ₩ 166,835,880 ₩ 63,125,596 ₩2,524,820,471
Accumulated
depreciation
-
(105,562,974)
(1,245,423,646)
(102,564,950)
-
(1,453,551,570)
Accumulated
impairment
-
-
(2,543,393)
-
-
(2,543,393)
Net book
value ₩ 118,735,985 ₩ 476,581,648 ₩ 346,011,349 ₩ 64,270,930 ₩ 63,125,596 ₩1,068,725,508
December 31, 2017:
Korean won (in thousands)
Land Buildings
Machinery and
equipment Others
Construction
in progress Total
Acquisition
costs ₩ 118,735,985 ₩ 581,102,586 ₩ 1,552,343,608 ₩ 151,850,237 ₩ 5,628,297 ₩2,409,660,713
Accumulated
depreciation - (88,746,643) (1,209,895,901) (82,460,345) - (1,381,102,889)
Net book
value ₩ 118,735,985 ₩ 492,355,943 ₩ 342,447,707 ₩ 69,389,892 ₩ 5,628,297 ₩1,028,557,824
- 46 -
(2) Changes in property and equipment for the years ended December 31, 2018 and 2017, are as follows:
December 31, 2018:
Korean won (in thousands)
Land Buildings
Machinery and
equipment Others
Construction
in progress Total
Beginning
balance ₩ 118,735,985 ₩ 492,355,943 ₩ 342,447,707 ₩ 69,389,892 ₩ 5,628,297 ₩ 1,028,557,824
Acquisition - 29,414 176,029,180 13,956,255 58,786,570 248,801,419
Transfer - 1,093,619 1,182,302 841,806 (1,337,000) 1,780,727
Disposal - - (809,144) (113,913) - (923,057)
Depreciation - (16,897,328) (170,626,084) (19,496,712) - (207,020,124)
Impairment - - (2,543,393) - - (2,543,393)
Others - - 330,781 (306,398) 47,729 72,112
Ending balance ₩ 118,735,985 ₩ 476,581,648 ₩ 346,011,349 ₩ 64,270,930 ₩ 63,125,596 ₩ 1,068,725,508
December 31, 2017:
Korean won (in thousands)
Land Buildings
Machinery and
equipment Others
Construction
in progress Total
Beginning
balance ₩ 106,967,216 ₩ 507,348,638 ₩ 358,092,853 ₩ 76,429,857 ₩ 3,122,599 ₩ 1,051,961,163
Acquisition - - 168,899,741 8,590,445 21,205,233 198,695,419
Transfer 11,768,769 1,882,203 1,821,657 3,391,840 (18,699,535) 164,934
Disposal - - (736,178) (220,016) - (956,194)
Depreciation - (16,874,898) (178,631,935) (18,220,286) - (213,727,119)
Others - - (6,998,431) (581,948) - (7,580,379)
Ending balance ₩ 118,735,985 ₩ 492,355,943 ₩ 342,447,707 ₩ 69,389,892 ₩ 5,628,297 ₩ 1,028,557,824
(3) The Group has machinery insurance and comprehensive property insurance for the damage of building,
machinery and vehicles up to the loss of ₩1,746,032 million with Samsung Fire & Marine Insurance Co., Ltd.
as of December 31, 2018. The Group is also insured with QBE Insurance (International) Ltd. for up to SGD
11.4 million, Sompo for up to BRL 17 million, Iffco Tokio General Insurance Co., Ltd. for up to INR 145
million and Generali a.s. for up to EUR 1 million.
- 47 -
15. INTANGIBLE ASSETS:
(1) Details of the carrying amounts of intangible assets as of December 31, 2018 and 2017, are as follows:
December 31, 2018:
Korean won (in thousands)
Goodwill
Development
costs Others (*1) Software Total
Acquisition
cost ₩ 624,328,667 ₩ 229,255,133 ₩ 381,411,281 ₩ 363,286,690 ₩ 1,598,281,771
Accumulated
amortization
-
(157,889,910)
(247,725,029)
(309,349,755)
(714,964,694)
Accumulated
impairment (33,631,803) - (3,679,910) (1,036,258) (38,347,971)
Net book
value ₩ 590,696,864 ₩ 71,365,223 ₩ 130,006,342 ₩ 52,900,677 ₩ 844,969,106
(*1) Others are composed of identifiable intangible assets, such as customer relationships, customer value and technology value
obtained upon business mergers, memberships and industrial property rights.
December 31, 2017:
Korean won (in thousands)
Goodwill
Development
costs Others (*1) Software Total
Acquisition
cost ₩ 624,136,978 ₩ 282,929,805 ₩ 379,951,589 ₩ 398,750,794 ₩ 1,685,769,166
Accumulated
amortization - (152,606,618) (212,426,318) (325,068,094) (690,101,030)
Accumulated
impairment (33,631,803) (25,249,457) (1,920,874) (6,501) (60,808,635)
Net book
value ₩ 590,505,175 ₩ 105,073,730 ₩ 165,604,397 ₩ 73,676,199 ₩ 934,859,501
(*1) Others are composed of identifiable intangible assets, such as customer relationships, customer value and technology value
obtained upon business mergers, memberships and industrial property rights.
(2) Changes in intangible assets for the years ended December 31, 2018 and 2017, are as follows:
December 31, 2018:
Korean won (in thousands)
Goodwill
Development
costs Others Software Total
Beginning balance ₩ 590,505,175 ₩ 105,073,730 ₩ 165,604,397 ₩ 73,676,199 ₩ 934,859,501
Acquisition - 7,867,727 2,073,192 16,884,460 26,825,379
Transfer - - - (1,653,671) (1,653,671)
Disposal - - (712) (3,026) (3,738)
Amortization - (32,669,271) (33,837,532) (34,742,689) (101,249,492)
Impairment - (8,907,596) (3,679,910) (1,036,258) (13,623,764)
Others 191,689 633 (153,093) (224,338) (185,109)
Ending balance ₩ 590,696,864 ₩ 71,365,223 ₩ 130,006,342 ₩ 52,900,677 ₩ 844,969,106
December 31, 2017:
Korean won (in thousands)
Goodwill
Development
costs Others Software Total
Beginning balance ₩ 591,942,866 ₩ 152,897,405 ₩ 198,658,009 ₩ 97,889,466 ₩ 1,041,387,746
Acquisition - 6,634,724 2,697,814 21,689,087 31,021,625
Transfer - 98,345 60,806 (73,362) 85,789
Disposal - - (195,613) (36,579) (232,192)
Amortization - (40,512,016) (34,855,376) (43,583,562) (118,950,954)
Others (1,437,691) (14,044,728) (761,243) (2,208,851) (18,452,513)
Ending balance ₩ 590,505,175 ₩ 105,073,730 ₩ 165,604,397 ₩ 73,676,199 ₩ 934,859,501
- 48 -
(3) The amortization expenses of intangible assets for the years ended December 31, 2018 and 2017, are presented
in the following accounts:
Korean won (in thousands) December 31, 2018 December 31, 2017
Cost of sales ₩ 52,031,782 ₩ 68,565,553
Selling and administrative expenses (*1) 49,217,710 50,385,401
Total ₩ 101,249,492 ₩ 118,950,954
(*1) Research and development expenses of ₩1,437 million and ₩1,446 million are included in selling and administrative expenses
for the years ended December 31, 2018 and 2017, respectively.
(4) The Group recognized research and development expenses amounting to ₩127,394 million and
₩127,072 million for the years ended December 31, 2018 and 2017, respectively.
(5) Goodwill
Goodwill was allocated to the Group’s CGUs (groups) as of December 31, 2018, as follows:
CGU Korean won (in thousands)
Samsung Networks, Inc. ₩ 417,495,744
MultiCampus Co., Ltd. 43,313,410
Samsung SNS Co., Ltd. 37,428,837
S-CORE CO., Ltd. 19,967,668
Miracom Inc. 8,125,514
EXE C&T Co., Ltd. 7,283,816
SERICEO 6,458,968
Language Testing
International, Inc. 4,589,447
SECUi Corp. 43,633,460
Others 2,400,000
Total ₩ 590,696,864
The Group performed impairment test on goodwill as of December 31, 2018, considering the changes in CGUs for the
year ended December 31, 2018. The recoverable amounts of CGUs (groups) have been determined based on its fair
value, less costs to sell, or value in use. Recoverable amount of MultiCampus Co., Ltd. (formerly Credu Co., Ltd.) was
determined based on fair value, less cost to sell, which was calculated by deducting the per unit disposal cost as of the
impairment test date. For CGUs, other than MultiCampus Co., Ltd. (formerly Credu Co., Ltd.), the recoverable
amounts were determined based on value in use. Value in use is calculated using cash flow projections based on
financial budgets approved by management covering a one-year period. Cash flows beyond the one-year period are
extrapolated using the estimated growth rates stated below. Based on the impairment test, no goodwill impairment is
recorded as the recoverable amount of each CGU exceeded the carrying amount.
- 49 -
The key assumptions used for value-in-use estimation as of December 31, 2018, are as follows:
Samsung Networks, Inc. Samsung SNS Co., Ltd. EXE C&T Co., Ltd. SECUi Corp. MultiCampus
Sales growth rate (*1) 1.6%-2.0% 3.5%-3.8% 4.6%-26.1% 4.0%-4.8% 4.0%-4.8%
Long-term sustainable
growth rate (*2) 0.0% 0.0% 0.0% 0.0% 0.0%
Discount rate (*3) 7.5% 10.5% 11.4% 11.5% 8.5%
(*1) Weighted-average sales growth rate used to extrapolate cash flows after the budget period was calculated based on
experience.
(*2) Weighted-average growth rate after five years.
(*3) Discount rate applied to the cash flow projections.
Management determined the gross margin based on historical performance and its expectations of market development.
The weighted-average growth rates used are consistent with the industry reports. The discount rates used reflect
specific risks relating to the relevant CGU.
(6) Details of impairment on development costs for the year ended December 31, 2018, are as follows:
Korean won (in thousands)
Recoverable amount
Book value Impairment Loss assessment methods
Project A (*1) ₩ - ₩ (8,907,596) Fair value
(*1) The Group determined to suspend projects and recognized impairment loss on related book values.
(7) Details of development costs as of December 31, 2018 and 2017, are as follows:
Korean won (in thousands)
December 31, 2018 December 31, 2017 Residual amortization period
Project A ₩ - ₩ 13,018,794 -
Project B 34,812,414 44,527,506 4 years
Project C 25,500,590 36,834,185 3 years
Project D 3,187,728 4,019,002 1 year–4 years
Project E 698,808 1,048,213 2 years
Others 7,165,683 5,626,030 1 year–6 years
Total ₩ 71,365,223 ₩ 105,073,730
16. BORROWINGS AND CORPORATE BOND:
Details of borrowings and corporate bond as of December 31, 2018 and 2017, are as follows:
Korean won (in thousands)
Financial
institutions
Annual interest
rates (%) December 31, 2018 December 31, 2017
Short-term borrowings:
Borrowings CITIBANK 7.7–8.2 ₩ 774,724 ₩ 820,296
Corporate bond:
Private placed bond
MG Community
Credit Cooperatives 2.6 ₩ 10,000 ₩ 10,000
Total ₩ 784,724 ₩ 830,296
- 50 -
17. PROVISIONS:
(1) Details of provisions as of December 31, 2018 and 2017, are as follows:
December 31, 2018:
Korean won (in thousands) Current Non-current Total
Provision for repairs ₩ 259,670 ₩ 832,883 ₩ 1,092,553
Provision for project losses 1,656,559 1,078,967 2,735,526
Provision for warranties 1,516,368 - 1,516,368
Asset retirement obligation 172,664 15,283,333 15,455,997
Provision for business
compensation
690,484
-
690,484
Others 14,334,993 - 14,334,993
Total ₩ 18,630,738 ₩ 17,195,183 ₩ 35,825,921
December 31, 2017: Korean won (in thousands)
Current Non-current Other (*1) Total
Provision for repairs ₩ 342,416 ₩ 854,010 ₩ - ₩ 1,196,426
Provision for project losses - - 6,921,082 6,921,082
Provision for warranties 1,098,515 - - 1,098,515
Asset retirement obligation 172,664 13,993,650 - 14,166,314
Provision for business
compensation 690,484 - - 690,484
Others 13,594,973 - - 13,594,973
Total ₩ 15,899,052 ₩ 14,847,660 ₩ 6,921,082 ₩ 37,667,794
(*1) The Group makes provisions for estimated losses of unfinished projects by adding to advances received or deducting
from non-trade receivables.
(2) The changes in provisions for the years ended December 31, 2018 and 2017, are as follows:
December 31, 2018:
Korean won (in thousands)
Beginning
balance Increase Utilization Reversal
Ending
balance
Provision for repairs (*1) ₩ 1,196,426 ₩ 92,389 ₩ - ₩ (196,262) ₩ 1,092,553
Provision for project losses 6,921,082 1,110,213 (721,445) (4,574,324) 2,735,526
Provision for warranties (*2) 1,098,515 899,147 - (481,294) 1,516,368
Asset retirement obligation (*3) 14,166,314 1,438,674 - (148,991) 15,455,997
Provision for business
compensation 690,484 - - - 690,484
Others 13,594,973 758,784 - (18,764) 14,334,993
Total ₩ 37,667,794 ₩ 4,299,207 ₩ (721,445) ₩ (5,419,635) ₩ 35,825,921
December 31, 2017:
Korean won (in thousands)
Beginning
Balance Increase Utilization Reversal
Ending
balance
Provision for repairs (*1) ₩ 1,531,172 ₩ 153,564 ₩ - ₩ (488,310) ₩ 1,196,426
Provision for project losses 24,286,943 598,364 (16,256,001) (1,708,224) 6,921,082
Provision for warranties (*2) 438,703 60,612 - (47,877) 451,438
Asset retirement obligation (*3) 12,328,836 1,294,141 (1,422,005) - 12,200,972
Provision for business
compensation 690,484 - - - 690,484
Others 6,636,532 7,720,440 (980,000) - 13,376,972
Total ₩ 45,912,670 ₩ 9,827,121 ₩ (18,658,006) ₩ (2,244,411) ₩ 34,837,374
(*1) The Group makes provisions for estimated costs of project repairs based on historical experience and terms of guarantees.
(*2) The Group makes provisions for estimated costs of future services arising from warranties, exchanges and refunds and
repairs based on warranty period (1 year–4 years) and historical rate.
(*3) The Group makes provisions for expected expense to be paid for restoration of leasehold assets to their original condition
in the future.
- 51 -
18. RETIREMENT BENEFIT PLANS:
The Group concurrently operates defined contribution retirement benefit plans and defined retirement benefit plans.
(1) Defined contribution retirement benefit plans
Defined contribution retirement benefit plans of ₩5,922 million and ₩4,320 million were recognized as expense
in the consolidated statements of comprehensive income for the years ended December 31, 2018 and 2017,
respectively. The Group has unpaid contributions of ₩455 million as of December 31, 2018, and has unpaid
contributions of ₩176 million as of December 31, 2017.
(2) Defined benefit retirement benefit plans
1) Net defined benefit liabilities (assets) recognized in the consolidated statements of financial position as of
December 31, 2018 and 2017, are as follows:
Korean won (in thousands)
December 31, 2018 December 31, 2017
Present value of funded defined benefit obligation ₩ 1,024,900,756 ₩ 872,125,290
Present value of unfunded defined benefit obligation 21,735,966 19,174,162
1,046,636,722 891,299,452
Less: fair value of plan assets (1,005,814,522) (898,847,921)
Net defined benefit liabilities (assets) ₩ 40,822,200 ₩ (7,548,469)
2) Changes in net defined benefit liabilities (assets) for the years ended December 31, 2018 and 2017, are as
follows:
December 31, 2018: Korean won (in thousands)
Defined
benefit obligation
Fair value of
plan assets
Net defined
benefit liabilities
(assets) Beginning balance ₩ 891,299,452 ₩ (898,847,921) ₩ (7,548,469)
Included in profit or loss:
Current service cost 97,536,441 - 97,536,441
Past service cost 7,704 - 7,704
Interest cost (income) 31,608,641 (30,927,727) 680,914
Others (5,292) - (5,292)
129,147,494 (30,927,727) 98,219,767
Included in OCI:
Remeasurement elements:
Actuarial loss (gain) arising from:
Effect of change in discount rate 54,417,454 - 54,417,454
Financial assumptions 6,556,297 - 3,702,826
Demographic assumptions 3,702,826 - 6,556,297
Experience adjustment 15,119,860 - 15,119,860
Return on plan assets - 18,611,474 18,611,474
79,796,437 18,611,474 98,407,911
Others:
Contributions paid by the employer - (139,743,813) (139,743,813)
Benefits paid (53,561,176) 45,023,141 (8,538,035)
Transfer from affiliates - (53,825) (53,825)
Business combinations - - -
Others (45,485) 124,149 78,664
(53,606,661) (94,650,348) (148,257,009)
Ending balance ₩ 1,046,636,722 ₩ (1,005,814,522) ₩ 40,822,200
- 52 -
December 31, 2017: Korean won (in thousands)
Defined
benefit obligation
Fair value of
plan assets
Net defined
benefit liabilities
(assets)
Beginning balance ₩ 843,079,123 ₩ (867,198,264) ₩ (24,119,141)
Included in profit or loss:
Current service cost 103,513,708 - 103,513,708
Past service cost 7,624,356 - 7,624,356
Interest cost (income) 28,035,302 (27,634,180) 401,122
Others - (5,125,633) (5,125,633)
139,173,366 (32,759,813) 106,413,553
Included in OCI:
Remeasurement elements:
Actuarial loss (gain) arising from:
Effect of change in discount rate (22,345,889) - (22,345,889)
Financial assumptions (32,473,360) - (32,473,360)
Demographic assumptions (248,987) - (248,987)
Experience adjustment 8,313,072 - 8,313,072
Return on plan assets - 13,303,968 13,303,968
(46,755,164) 13,303,968 (33,451,196)
Others:
Contributions paid by the employer - (77,674,874) (77,674,874)
Benefits paid (56,040,815) 69,539,091 13,498,276
Transfer from affiliates 8,984,223 (4,199,662) 4,784,561
Business combinations 1,690,856 - 1,690,856
Others 1,167,863 141,633 1,309,496
(44,197,873) (12,193,812) (56,391,685)
Ending balance ₩ 891,299,452 ₩ (898,847,921) ₩ (7,548,469)
3) The principal actuarial assumptions used as of December 31, 2018 and 2017, are as follows:
Percentage (%)
December 31, 2018 December 31, 2017
Discount rate 2.3–3.1 2.0–3.8
Future salary increases (including inflation rate) 3.8–6.2 3.8–5.5
Assumptions regarding the future mortality rate are based on average life expectancy and published statistics.
4) Details of fair value of plan assets as of December 31, 2018 and 2017, are as follows:
Korean won (in thousands)
December 31, 2018 December 31, 2017
Carrying Composition Carrying Composition
amounts (%) amounts (%)
Cash and cash equivalents ₩ 1,002,980,713 99.7 ₩ 895,986,245 99.7
Others 2,833,809 0.3 2,861,676 0.3
Total ₩ 1,005,814,522 100.0 ₩ 898,847,921 100.0
- 53 -
5) The sensitivity analysis of the overall defined benefit liability in accordance with changes to the principal
assumptions as of December 31, 2018 and 2017, is as follows:
Korean won (in thousands)
December 31, 2018
Changes in principal
assumption
Effect due to increase in
principal assumption
Effect due to decrease in
principal assumption
Discount rate 1.0% point ₩ (68,646,256) ₩ 77,935,658
Salary growth rate 1.0% point 76,271,217 (68,597,214)
Korean won (in thousands)
December 31, 2017
Changes in principal
assumption
Effect due to increase in
principal assumption
Effect due to decrease in
principal assumption
Discount rate 1.0% point ₩ (63,238,007) ₩ 72,187,058
Salary growth rate 1.0% point 71,116,841 (71,524,845)
Decreases in corporate bond yields will increase define benefit liabilities, although this will be partially offset by an
increase in the value of the plan assets. The most significant risk will be exposed through an increase in defined
benefit liabilities.
The above sensitivity analyses are based on a change in an assumption, while holding all other assumptions
constant. In practice, this is unlikely to occur, and changes in some of the assumptions may be correlated. The
sensitivity of the defined benefit liabilities to changes in principal actuarial assumptions is calculated using the
projected unit credit method, the same method applied when calculating the defined benefit obligations recognized
in the consolidated statement of financial position.
The methods and types of assumptions used in preparing the sensitivity analysis have not been changed compared
to the previous year.
6) Expected contributions to defined benefit plans for the year ending December 31, 2019, amount to
₩121,443 million.
7) The weighted-average duration of the defined benefit obligations as of December 31, 2018, is 4.67–7.83 years.
- 54 -
19. COMMITMENTS AND CONTINGENCIES:
(1) Guarantees
Details of guarantees provided for employees by the Group as of December 31, 2018, are as follows:
Financial institutions Korean won (in thousand)
Guarantee of employees' debt Woori Bank (*1) ₩ 10,000,000
(*1) Guarantees are provided for the employee’s housing loan owed to the financial institutions.
(2) Guarantees provided and major commitments
Details of guarantees provided by the Group and major commitments with financial institutions as of December 31,
2018, are as follows:
Korean won (in thousands),USD,CNY,VND,BDT,KWD,EUR,INR,AUD,MYR,EGP,PEN,BRL,AED
Financial institutions Detail Limits Executed amounts KEB Hana Bank Payment guarantee USD 16,000,000 -
CNY 50,000,000 -
Shinhan Bank Import letter of credit USD 27,000,000 - Bills bought USD 5,000,000 -
Payment guarantee USD 34,299,000 USD 1,786,710
USD 4,000,000 VND 51,142,900,000 VND 42,275,000,000 VND 14,573,250,000
USD 1,000,000
Woori Bank Payment guarantee USD 27,000,000 USD 776,000 Payment guarantee CNY 6,710,657 CNY 6,710,657
Kookmin Bank Payment guarantee &
USD 20,000,000
-
Import letter of credit USD 1,396,275 Local letter of credit KRW 5,000,000 -
HSBC Payment guarantee USD 10,000,000 - Payment guarantee KWD 1,050,673 KWD 1,050,673
Overseas financing guarantee
USD 5,100,000 USD 550,000
EUR 2,450,000 - INR 620,000,000 INR 168,920,317
AUD 29,000 AUD 29,000
Bank of China Payment guarantee USD 18,000,000 - CITIBANK KWD 1,661,200 KWD 1,661,200
Payment guarantee BDT 145,422,500 BDT 145,422,500
Overseas financing guarantee USD 60,000,000 EUR 2,527,757 MYR 240,000
EGP 25,000
USD 145,237 PEN 50,000
China Merchants Bank Payment guarantee CNY 270,000,000 CNY 35,728,480
Overseas financing guarantee CNY 30,000,000 - Banco Bradesco S.A Payment guarantee BRL 13,925,522 BRL 13,925,522
Commerzbank AG Payment guarantee EUR 17,850 EUR 17,850
Emirates NBD Payment guarantee AED 3,885 AED 3,885
- 55 -
(3) Other commitments
1) The Company entered into general-term loan agreements with an aggregate credit limit of ₩20,000 million
with Shinhan Bank as of December 31, 2018. In addition, a domestic subsidiary, S-Core Co., Ltd., entered
into a general-term loan agreement with an aggregate credit limit of ₩3,000 million with Shinhan Bank as of
December 31, 2018.
2) The Company has bank overdraft facilities with Woori Bank and three other banks amounting to
₩70,500 million in aggregate, and a domestic subsidiary, Miracom Inc., has bank overdraft facilities with
Woori Bank and one other bank amounting to ₩5,200 million in aggregate as of December 31, 2018.
3) The Company has a contractual agreement of business-to-business electronic payment system with KEB Hana
Bank and three other banks amounting to ₩84,835 million, with a credit limit of ₩340,000 million, as of
December 31, 2018.
4) The Company has a comprehensive credit limits with KEB Hana Bank to ₩19,300 million as of December
31, 2018.
5) The Company has been provided a payment guarantee amounting to ₩456,043 million by Korea Software
Financial Cooperative and Seoul Guarantee Insurance Company, and in relation to the guarantee, an equity
investment of ₩2,560 million is provided to Korea Software Financial Cooperative as collateral as of
December 31, 2018. Domestic subsidiaries of Miracom Inc. and MultiCampus Co., Ltd. are provided with
payment guarantees by Korea Software Financial Cooperative amounting to ₩9,492 million and
₩5,120 million, respectively, and each of the subsidiaries has provided equity investment of ₩387 million
and ₩206 million, respectively, to Korea Software Financial Cooperative as collateral. In addition,
MultiCampus Co., Ltd., SECUi. Corp. and S-Core Co., Ltd. are provided with payment guarantees by Seoul
Guarantee Insurance Company amounting to ₩1,734 million, ₩1,009 million and ₩25 million as of
December 31, 2018, respectively.
(4) Leases
1) Finance lease
The Group has no lease payments under the finance lease agreements as of December 31, 2018 and 2017.
2) Operating lease
The Group leases vehicles under operating lease arrangements with Samsung Card Co., Ltd., Ethoz, Emozin Sdn.
Bhd. and other lessors. The future lease payments under operating leases as of December 31, 2018, are as follows:
Korean won (in thousands)
Within 1 year ₩ 2,637,919
More than 1 year 632,076
The recognized expenses for the above operating lease arrangements amount to ₩6,381 million and
₩4,738 million for the years ended December 31, 2018 and 2017, respectively.
20. SHARE CAPITAL AND PREMIUM:
Under its articles of incorporation, the Group is authorized to issue 200,000,000 common shares with a par value of
₩500 per share, and 50,000,000 shares of participating preferred share, which are non-voting and are entitled to
receive a minimum cash dividend of more than 1% of par value by resolution of the board of directors. In
addition, the Group is authorized to issue to investors, other than current shareholders, convertible debentures and
debentures with warrants with face values of up to ₩67,000 million, where ₩50,000 million of such debentures
is for common shares and the remaining ₩17,000 million is for preferred shares. As of December 31, 2018,
77,377,800 shares are issued and share capital amounts to ₩38,689 million. As of December 31, 2018, there are
no issued convertible debentures, debentures with warrants and participating preferred share, which are non-voting.
- 56 -
21. RETAINED EARNINGS:
(1) Retained earnings as of December 31, 2018 and 2017, are as follows:
Korean won (in thousands)
December 31, 2018 December 31, 2017
Legal reserve ₩ 40,344,450 ₩ 40,344,450
Earned surplus reserve (*1) 19,344,450 19,344,450
Reserve for business development (*2) 21,000,000 21,000,000
Discretionary reserve 10,098,807 10,098,807
Reserve for business rationalization (*3) 10,098,807 10,098,807
Unappropriated retained earnings 4,771,303,565 4,296,604,366
Total ₩ 4,821,746,822 ₩ 4,347,047,623
(*1) The Commercial Code of the Republic of Korea requires the Group to appropriate, as a legal reserve, an amount equal to
a minimum of 10% of cash dividends paid, until such reserve equals 50% of its issued capital stock. This reserve is not
available for the payment of cash dividends, but may be transferred to capital stock or used to reduce accumulated deficit,
if any, with the ratification of the Group’s majority shareholders.
(*2) In accordance with the former corporate income tax law, the Group has accumulated reserves for business development
by the amount of retained earnings in excess of accumulated earnings. This amount may be transferred to capital stock
or used to reduce accumulated deficit, if any, with the ratification of the Group’s majority shareholders.
(*3) Pursuant to the Special Tax Treatment Control Law, the Group is required to appropriate, as a reserve for business
rationalization, a portion of retained earnings equal to tax reductions arising from investment and other tax credits. Due
to revision made to Korean tax laws during 2002, such reserves are no longer required.
(2) Changes in retained earnings for the years ended December 31, 2018 and 2017, are as follows:
Korean won (in thousands)
December 31, 2018 December 31, 2017
Beginning balance ₩ 4,347,047,623 ₩ 3,874,712,651
Net income attributable to the owners of the Group 629,399,571 530,347,611
Dividends (154,700,372) (58,012,639)
Ending balance ₩ 4,821,746,822 ₩ 4,347,047,623
(3) Details of dividends declared for the years ended December 31, 2018 and 2017, are as follows:
Korean won (in thousands)
December 31, 2018 December 31, 2017
Number of common shares outstanding 77,350,186 shares 77,350,186 shares
Dividend ratio 400% 400%
Dividends ₩ 154,700,372 ₩ 154,700,372
- 57 -
22. OTHER COMPONENTS OF EQUITY:
(1) Details of other components of equity as of December 31, 2018 and 2017, are as follows:
Korean won (in thousands)
December 31, 2018 December 31, 2017
Valuation gain (loss) on fair value
through other comprehensive income ₩ 9,849,833 ₩ -
Valuation gain on AFS
financial assets - 2,412,620
Changes in associates’ accumulated
other comprehensive income 175,980 175,695
Changes in associates’ accumulated
other comprehensive losses (268,785) (858,857)
Foreign currency translation differences (105,941,898) (112,335,377)
Treasury stock (1,592,531) (1,592,531)
Other capital adjustment 81,019,032 81,707,590
Remeasurement of defined benefit
liability (158,689,196) (94,433,972)
Total ₩ (175,447,565) ₩ (124,924,832)
(2) Changes in treasury stock for the years ended December 31, 2018 and 2017, are as follows:
Korean won (in thousands)
December 31, 2018 December 31, 2017
Number of shares Acquisition cost Number of shares Acquisition cost
Beginning balance 27,614 shares ₩ 1,592,531 27,614 shares ₩ 1,592,531
Acquisition - - - -
Ending balance 27,614 shares ₩ 1,592,531 27,614 shares ₩ 1,592,531
The Group acquired 13,515 shares (at ₩56,406 per share) of treasury stocks from shareholders who exercised the
appraisal right against the merger of Samsung Networks Co., Ltd., in accordance with the Commercial Code of the
Republic of Korea. The Group holds 9,005 common shares due to transfer of treasury shares owned by Samsung
Networks Co., Ltd. and 4,197 common shares due to acquisition of fractional shares.
In addition, the Group holds 346 common shares due to transfer of treasury shares owned by Samsung SNS Co.,
Ltd. and 551 common shares due to acquisition of fractional shares for the year ended December 31, 2013.
The Group intends to dispose of its treasury shares depending on the market conditions.
- 58 -
23. REVENUE:
(1) Breakdown of revenue for the years ended December 31, 2018 and 2017, is as follows:
Korean won (in thousands)
December 31, 2018 December 31, 2017
Sales of goods ₩ 250,120,482 ₩ 223,492,601
IT services (*1) 5,406,553,019 4,906,133,852
Logistics BPO 4,377,545,400 4,169,579,677
Total ₩ 10,034,218,901 ₩ 9,299,206,130
(*1) Revenue from fixed-price contracts is included.
(2) Details of contract assets and unbilled construction as of December 31, 2018 and 2017, are as follows:
Korean won (in thousands)
December 31, 2018 December 31, 2017
Installation of software services and etc. ₩ 496,679,115 ₩ 30,592,655
Less: allowance for doubtful accounts (190,000) -
Total ₩ 496,489,115 ₩ 30,592,655
Current ₩ 496,489,115 ₩ 30,592,655
Non-current - -
Total ₩ 496,489,115 ₩ 30,592,655
(3) Impaired receivables of \190 million are recognized for Vietnam Ho Chi Minh ITS project among the contract
assets as of December 31, 2018. Considering past default experience and prospects for the industry to which
the customer belongs, management determines that none of other receivables are impaired other than the
contract assets.
(4) Details of contract liabilities and advanced construction billing as of December 31, 2018 and 2017, are as
follows:
Korean won (in thousands)
December 31, 2018 December 31, 2017
Installation of software services and etc. (*1) ₩ 108,499,381 ₩ 27,376,703
Total ₩ 108,499,381 ₩ 27,376,703
Current ₩ 108,499,381 ₩ 27,376,703
Non-current - -
Total ₩ 108,499,381 ₩ 27,376,703
(*1) Contract liabilities relating to software installation services are balances due to customers under contracts. These arise if
a particular milestone payment exceeds the revenue recognized to date under the cost-to-cost method.
- 59 -
(5) There are no contract assets or trade receivables in relation to the major contract more than 5% of the Group's
revenue in the prior period that is recognized in the current period by the cost-to-cost method for basis of the
percentage of total costs incurred to date bear to the estimated total contract costs instruments for the year
ended December 31, 2018.
(6) Changes in estimated total contract costs
Applying the cost-to-cost method which is basis of the total contract amount and total contract cost associated with
a contract that recognize revenue over time as of January 1, 2018, the date of initial application of K-IFRS 1115,
the effect of changes in estimates and changes in those for current and future periods on gains and losses, contract
assets and contract liabilities changes are as follows:
Korean won (in thousands)
Change in
Change in
estimated total Effect on Effect on Change in
contract amount contract cost net income future income Contract assets
Installation of
software services
and etc. ₩ 10,491,872 ₩ (7,112,179) ₩ 11,059,876 ₩ 6,544,175 ₩ 11,059,876
The impact on current and future periods is calculated based on total estimated contract costs considering events
that occurred until December 31, 2018, after the commencement of the contract and the current estimate of total
contract revenue as of December 31, 2018. Estimates of total contract revenue and total contract costs may
change in future periods.
24. EXPENSES BY NATURE:
Details of expenses by nature for the years ended December 31, 2018 and 2017, are as follows:
Korean won (in thousands)
December 31, 2018 December 31, 2017
Changes in inventories and purchase of
inventories ₩ 576,593,064 ₩ 552,502,943
Wages and salaries 1,888,760,280 1,763,032,720
Employee welfare 341,767,843 315,959,374
Depreciation and amortization 308,269,617 332,678,074
Advertising 3,197,817 2,566,415
Transportation 2,324,739 2,059,625
Travel 52,013,308 57,111,664
Training 65,694,054 62,468,244
Commission and service charges 519,387,765 407,236,507
Rent 148,973,594 147,879,714
Outsourcing 890,203,631 788,424,450
Communication 193,381,228 205,733,726
Taxes and dues 31,214,370 24,407,160
Logistics 3,969,263,775 3,758,694,517
Others 165,818,003 146,891,848
Total ₩ 9,156,863,088 ₩ 8,567,646,981
- 60 -
25. SELLING AND ADMINISTRATIVE EXPENSES:
Details of selling and administrative expenses for the years ended December 31, 2018 and 2017, are as follows:
Korean won (in thousands)
December 31, 2018 December 31, 2017
Wages and salaries ₩ 354,554,985 ₩ 336,087,394
Provision for severance indemnities 20,170,390 23,317,076
Employee welfare 76,134,361 73,447,100
Depreciation 19,336,706 22,475,234
Amortization 47,780,421 48,939,392
Repairs and maintenance 2,634,759 6,100,973
Supplies 1,956,450 2,384,081
Utility 1,221,019 1,397,923
Outsourcing 34,965,550 34,868,060
Travel 11,926,881 11,819,779
Communication 1,910,971 1,873,889
Insurance premium 2,363,845 2,127,933
Commission and service charges 33,022,196 28,517,568
Rental 60,102,834 60,592,388
Publication 597,970 531,067
Entertainment 3,492,319 3,301,762
Conference 1,378,932 1,226,783
Training 9,086,570 9,022,545
Recreation 1,505,214 1,324,705
Broadcasting 24,714 204,763
Bad debt 10,314,176 3,833,684
Warranty 1,841,469 1,762,811
Research and development 72,727,094 74,215,051
Miscellaneous expenses 369,734 460,727
Others 17,613,894 13,212,153
Total ₩ 787,033,454 ₩ 763,044,841
26. OTHER OPERATING INCOME AND EXPENSES:
(1) Details of other operating income for the years ended December 31, 2018 and 2017, are as follows:
Korean won (in thousands)
December 31, 2018 December 31, 2017
Commission income ₩ 10,679,999 ₩ 9,942,305
Dividend income 15,900 18,175
Gains on disposal of property and equipment 742,049 886,997
Valuation gain on FVPL 1,340,449 -
Gains on disposal of intangible assets 2,863 65,017
Reversal of allowance for doubtful accounts 209,683 9,308
Gain on disposal of valuation of AFS financial
assets - 2,883
Others 16,252,786 30,291,119
Total ₩ 29,243,729 ₩ 41,215,804
- 61 -
(2) Details of other operating expenses for the years ended December 31, 2018 and 2017, are as follows:
Korean won (in thousands)
December 31, 2018 December 31, 2017
Valuation loss on FVPL ₩ 17,817 ₩ -
Loss on disposal of valuation of AFS financial
assets - 23,221
Loss on disposal of property and equipment 155,509 281,759
Impairment loss on property and equipment 2,543,393 -
Impairment loss on intangible assets 13,621,577 14,934,093
Loss on disposal of intangible assets 712 190,778
Other bad debt expense 214,995 110,623
Donations 1,972,789 3,242,246
Others 9,584,671 18,468,283
Total ₩ 28,111,463 ₩ 37,251,003
27. FINANCE INCOME AND EXPENSE:
(1) Details of finance income and expenses for the years ended December 31, 2018 and 2017, are as follows:
Korean won (in thousands)
December 31, 2018 December 31, 2017
Finance income:
Interest income
Amortized cost ₩ 66,358,435 ₩ 42,723,967
Gains on foreign currency transaction 57,595,347 37,722,406
Foreign exchange gains 11,621,991 9,750,851
Total ₩ 135,575,773 ₩ 90,197,224
Finance expense:
Interest expense
Amortized cost ₩ 1,667,001 ₩ 1,900,957
Losses on foreign currency transaction 51,578,625 41,616,916
Foreign exchange losses 7,313,851 32,568,874
Total ₩ 60,559,477 ₩ 76,086,747
(2) The Group recognizes the gains and losses from foreign exchange differences as finance income and expenses.
- 62 -
28. INCOME TAX EXPENSE:
(1) The components of income tax expense for the years ended December 31, 2018 and 2017, are as follows:
Korean won (in thousands)
December 31, 2018 December 31, 2017
Current income taxes ₩ 280,221,815 ₩ 190,806,432
Additional income taxes for prior years and other 458,600 (2,804,362)
Deferred income tax arising from temporary
differences and other differences 37,058,073 22,321,358
Income tax expense ₩ 317,738,488 ₩ 210,323,428
(2) The actual income tax expense on the Group’s profit before tax differs from the amount that is computed
using the tax calculated at the weighted-average rate applied to profits for the years ended December 31, 2018
and 2017, as follows:
Korean won (in thousands)
December 31, 2018 December 31, 2017
Profit before income tax ₩ 956,530,746 ₩ 752,095,705
Income tax based on statutory tax rate 245,872,803 161,250,431
Effective tax rate (*1) 25.70% 21.44%
Adjustments: Permanent differences 9,295,182 2,097,406
Tax credit (13,476,211) (18,840,768)
Tax credit for which no deferred tax asset was recognized 14,983,294 23,202,132
Adjustment related to investments in subsidiaries 26,418,531 26,154,125
Others (*2) 34,644,889 16,460,102
Income tax expense ₩ 317,738,488 ₩ 210,323,428
Effective tax rate 33.22% 27.96%
(*1) The Group’s statutory tax rate is applied differently according to the tax authorities as of December 31, 2018 and 2017.
(*2) Other adjustments consist of additional income taxes for prior years and tax effect from tax rate change, etc.
- 63 -
(3) Changes in deferred income tax assets and liabilities resulting from the tax effect of temporary differences and
others for the years ended December 31, 2018 and 2017, are as follows: December 31, 2018:
Korean won (in thousands)
Temporary differences Deferred tax assets (liabilities)
Beginning Changes End Beginning Changes End
Deferred income tax arising from
temporary differences:
Net defined benefit liabilities ₩ (210,600,596) ₩ (27,876,273) ₩ (238,476,869) ₩ (57,915,164) ₩ (7,665,975) ₩ (65,581,139)
Investment in associates (40,491,205) (1,029,934) (41,521,139) (11,135,081) (283,232) (11,418,313)
Reserve for research and human
resource development (4,666,667) 4,666,667 - (1,283,333) 1,283,333 -
Property and equipment (63,079,481) 15,719,728 (47,359,753) (11,392,897) 2,953,550 (8,439,347)
Employee welfare fund (5,054,200) 97,315 (4,956,885) (1,389,905) 26,762 (1,363,143)
Prepaid rent expenses (6,706,172) 1,089,819 (5,616,353) (1,844,197) 299,700 (1,544,497)
Investment in subsidiaries (542,732,888) (118,697,270) (661,430,158) (149,251,544) (32,641,749) (181,893,293)
Accrued expenses 65,116,280 6,105,159 71,221,439 17,906,977 1,678,919 19,585,896
Long-term accrued expense 29,836,044 10,228,154 40,064,198 8,204,912 2,812,742 11,017,654
Provision 20,769,917 (4,403,328) 16,366,589 5,711,727 (1,210,915) 4,500,812
Deposit 7,145,026 (1,057,860) 6,087,166 1,964,882 (290,911) 1,673,971
Foreign exchange gains and losses 11,981,544 (11,842,962) 138,582 3,294,925 (3,256,815) 38,110
Taxes and dues 383,244 - 383,244 105,392 - 105,392
Others 132,092,571 (411,354,709) (279,262,138) 30,853,315 (12,078,568) 18,774,747
Subtotal (606,006,583) (538,355,494) (1,144,362,077) (166,169,991) (48,373,159) (214,543,150) Deferred income tax charged directly
to shareholders’ equity:
Loss on valuation of long-term AFS and
others 145,337,517 160,741,970 306,079,487 34,079,129 39,442,548 73,521,677
Deferred tax assets 34,928,673
Deferred tax liabilities (175,950,146)
Net deferred tax assets (liabilities) ₩ (141,021,473)
<December 31, 2017>
Korean won (in thousands)
Temporary differences Deferred tax assets (liabilities)
Beginning Changes End Beginning Changes End
Deferred income tax arising from
temporary differences:
Net defined benefit liabilities ₩ (226,048,326) ₩ 15,447,730 ₩ (210,600,596) ₩ (54,703,695) ₩ (3,211,469) ₩ (57,915,164)
Investment in associates (45,536,914) 5,045,709 (40,491,205) (11,019,933) (115,148) (11,135,081)
Reserve for research and human
resource development
(16,833,333) 12,166,666 (4,666,667) (4,073,667) 2,790,334 (1,283,333)
Property and equipment (61,355,151) (1,724,330) (63,079,481) (14,847,947) 3,455,050 (11,392,897)
Employee welfare fund (5,204,875) 150,675 (5,054,200) (1,259,580) (130,325) (1,389,905)
Prepaid rent expenses (7,796,417) 1,090,245 (6,706,172) (1,886,733) 42,536 (1,844,197)
Investment in subsidiaries (540,333,472) (2,399,416) (542,732,888) (130,760,700) (18,490,844) (149,251,544)
Accrued expenses 82,328,415 (17,212,135) 65,116,280 19,923,476 (2,016,499) 17,906,977
Long-term accrued expense 40,521,841 (10,685,797) 29,836,044 9,806,285 (1,601,373) 8,204,912
Provision 38,585,653 (17,815,736) 20,769,917 9,337,728 (3,626,001) 5,711,727
Deposit 8,172,872 (1,027,846) 7,145,026 1,977,835 (12,953) 1,964,882
Foreign exchange gains and losses (3,284,739) 15,266,283 11,981,544 (794,907) 4,089,832 3,294,925
Taxes and dues 365,638 17,606 383,244 88,484 16,908 105,392
Others 82,626,390 49,466,181 132,092,571 15,058,439 15,794,876 30,853,315
Subtotal (653,792,418) 47,785,835 (606,006,583) (163,154,915) (3,015,076) (166,169,991)
Deferred income tax charged directly
to shareholders’ equity:
Loss on valuation of long-term AFS
and others 176,365,370 (31,027,853) 145,337,517 37,850,295 (3,771,166) 34,079,129
Deferred tax assets 32,572,487
Deferred tax liabilities (164,663,349)
Net deferred tax assets (liabilities) ₩ (132,090,862)
Realization of the future tax benefits related to the deferred tax assets is dependent on many factors, including the
Group’s ability to generate sufficient taxable income within the period during which the temporary differences
reverse, the outlook of the global economic environment and the overall future industry outlook. The Group’s
management periodically considers these factors in reaching its conclusion.
(4) Deferred income tax assets and liabilities credited (charged) directly to equity as of December 31, 2018 and
2017, are as follows:
Korean won (in thousands)
Temporary differences: December 31, 2018 December 31, 2017
Valuation gain (loss) on FVOCI ₩ (541,552) ₩ -
Gain on valuation of long-term AFS financial assets - 190,448
Other capital adjustment 50,992,107 18,869,085
Remeasurement of loss on retirement benefits 255,628,932 143,592,506
₩ 306,079,487 ₩ 162,652,039
Deferred tax assets ₩ 73,521,677 ₩ 34,079,129
- 64 -
29. CASH FLOWS FROM OPERATING ACTIVITIES:
(1) Adjustment items to net income for cash flows from operating activities and changes in operating assets and
liabilities for the years ended December 31, 2018 and 2017, are as follows:
Korean won (in thousands)
December 31, 2018 December 31, 2017
Net income ₩ 638,792,258 ₩ 541,772,277
Adjustment items:
Foreign exchange losses 7,313,851 32,568,874
Depreciation 207,020,124 213,727,119
Amortization 101,249,492 118,950,954
Provision for severance indemnities 98,219,767 106,413,553
Foreign exchange gains (11,621,991) (9,750,851)
Reversal of provision for project loss (4,574,324) (1,708,224)
Impairment loss on property and equipment 2,543,393 -
Income tax expense 317,738,488 210,323,428
Others (21,818,342) (48,118,298) 696,070,458 622,406,555
Korean won (in thousands)
December 31, 2018 December 31, 2017
Changes in operating assets and liabilities:
Increase in trade receivables ₩ (176,682,671) ₩ (148,847,147)
Decrease in other receivables 75,442,385 26,960,793
Increase in prepaid expenses (2,791,984) (5,703,716)
Increase in trade payables 128,524,246 66,764,319
Decrease in other payables (36,618,933) (33,715,162)
Increase in accrued expenses 136,833,118 6,763,623
Changes in net defined benefit liabilities (148,257,009) (56,391,685)
Decrease in advances received (10,305,910) (4,412,662)
Increase(decrease) in withholdings 902,690 (2,810,123)
Others 28,840,767 (43,864,121)
(4,113,301) (195,255,881)
Cash flows from operating activities ₩ 1,330,749,415 ₩ 968,922,951
(2) Significant transactions not affecting cash flows for the years ended December 31, 2018 and 2017, are as
follows:
Korean won (in thousands) December 31, 2018 December 31, 2017
Write-off of accounts receivables and long-term and short-
term other receivables by offset of allowance for doubtful
accounts. ₩ 4,062,966 ₩ 4,425,126
Changes in gain and loss on valuation of FVOCI 10,463,904 -
Changes in gain and loss on valuation of AFS financial assets - 2,896,088
Transfer of construction in progress 1,337,000 18,699,535
Changes in other payables in connection with acquisition of
property and equipment (2,633,460) 6,626,647
Changes in other payables in connection with acquisition of
intangible assets 704,251 336,779
- 65 -
(3) Adjustments of liabilities from financing activities for the year ended December 31, 2018 and 2017, are as
follows:
December 31, 2018
Korean won (in thousands)
Beginning
balance
Transfer
Cash flows
Ending
balance
Short-term borrowings ₩ 820,296 ₩ (45,572) ₩ - ₩ 774,724
Current portion of
corporate bond 10,000 - (10,000) -
Corporate bond - - 10,000 10,000
Total ₩ 830,296 ₩ (45,572) ₩ - ₩ 784,724
December 31, 2017
Korean won (in thousands)
Beginning
balance
Transfer
Cash flows
Ending
balance
Short-term borrowings ₩ 2,608,483 ₩ - ₩ (1,788,187) ₩ 820,296
Current portion of
long-term borrowings
2,464,461
1,615,271
(4,079,732)
-
Long-term borrowings
1,615,271
(1,615,271)
-
-
Current portion of
corporate bond - 10,000 - 10,000
Corporate bond 10,000 (10,000) - -
Total ₩ 6,698,215 ₩ - ₩ (5,867,919) ₩ 830,296
30. FINANCIAL RISK MANAGEMENT:
The Group is exposed to credit risk, liquidity risk and market risk. Market risk arises from currency risk, interest rate
risk and fair value risk associated with investments. The Group has a risk management program in place to monitor
and actively manage such risks.
The Group's management team is responsible for financial risk management. Also, the financial risk management
officers develop, evaluate and estimate the financial risk, and hedge the risk exposures in cooperation with the business
units of the Group and domestic and overseas subsidiaries.
The Group’s financial assets that are under financial risk management are composed of cash and cash equivalents, short-
term financial instruments, financial assets measured at fair value, trade and other receivables and other financial assets.
The Group’s financial liabilities under financial risk management are composed of trade and other payables and others.
- 66 -
(1) Market risk
1) Foreign exchange risk
The Group is exposed to foreign exchange risk due to revenues and expenses arising from foreign currency
transactions through global business activities. These transactions are mainly conducted in USD, EUR, JPY and
other foreign currencies.
To minimize foreign exchange risk arising from operating activities, the Group’s foreign exchange management
policy requires all normal business transactions, such as import-export, to be in functional currency or cash inflows
in foreign currencies to match up with cash outflows in foreign currencies. Foreign exchange risk for inevitably
occurring foreign exchange positions is managed in accordance with procedures and regulations prescribed in
advance.
The Group’s foreign currency risk management policy also defines foreign exchange risk, measurement period,
controlling responsibilities and management procedures. The Group restricts all speculative foreign exchange
transactions and operates a system to manage receivables and payables denominated in foreign currency. The
Group’s global foreign currency management system monitors, evaluates, manages and reports the Group’s foreign
exchange risk (Net assets in foreign currencies = Assets in foreign currencies – Liability in foreign currencies).
The carrying amounts of financial assets and liabilities denominated in foreign currency held by the Group as of
December 31, 2018 and 2017, is as follows:
Korean won (in thousands)
Assets Liabilities
December 31, 2018 December 31, 2017 December 31, 2018 December 31, 2017
USD 617,705,670 457,153,559 209,175,292 214,596,600
EUR 68,053,970 52,713,955 24,318,904 7,491,329
JPY 1,542,136 2,938,838 16,952 330,998
In addition to the major currencies, the Group has other financial assets and liabilities denominated in foreign
currency amounting to ₩23,845 million and ₩6,964 million as of December 31, 2018, respectively, and
amounting to ₩89,568 million and ₩27,702 million as of December 31, 2017, respectively.
Foreign currency exposure to financial assets and liabilities of a 5% currency rate change against the Korean won as
of December 31, 2018 and 2017, is presented below. The 5% represents reasonably possible changes in exchange
rates by applying sensitivity when foreign exchange rate risk is internally reported to key management personnel.
Sensitivity analysis includes only monetary items to be paid denominated in foreign currencies. Foreign currency
translations are adjusted by assuming a 5% change in foreign exchange rates at the end of the reporting period.
Korean won (in thousands)
USD effect EUR effect
December 31, 2018 December 31, 2017 December 31, 2018 December 31, 2017
Net income for the year ₩ 20,426,519 ₩ 12,127,848 ₩ 2,186,753 ₩ 2,261,131
Net assets 20,426,519 12,127,848 2,186,753 2,261,131
2) Stock price risk
The Group’s investment portfolio consists of investments in listed and unlisted securities using direct and indirect
investment vehicles for strategic purposes. The Group has no listed securities except for investments in
subsidiaries and investments in associates as of December 31, 2018 and 2017 (see note 11).
- 67 -
3) Interest rate risk
The Group is exposed to fair value risk of statements of financial position items due to changes in market price
rates, and is exposed to interest rate risk, such as changes in cash flows of interest income and expense arising from
investing and financing activities, including investment risk. The Group’s position with regard to interest rate risk
exposure is mainly driven by interest-bearing deposits and variable-rate borrowings. The Group establishes the
policy to manage the uncertainty related to interest rate fluctuations and minimize interest expenses.
In order to avoid interest rate risk, the Group maintains minimum external borrowings by facilitating cash pooling
systems on regional and global basis. The Group manages exposed interest rate risk via periodic monitoring and
planning.
If the interest rates were 1% higher or 1% lower than the current interest rates, the Group’s net income would
decrease/increase by ₩7,847 thousand, primarily due the interest rate risk of variable-rate borrowings. This
analysis assumes that all other variables remain constant.
(2) Credit risk
Credit risk arises during the normal course of transactions and investing activities, where clients or other party fails
to discharge an obligation. The Group monitors and sets the customer’s and counterparty’s credit limit on a
periodic basis based on the counterparty’s financial conditions, default history and other important factors.
Credit risk also arises from cash and cash equivalents, savings and derivative instrument transactions with financial
institutions. To minimize such risk, the Group transacts only with banks that have strong international credit
rating, and all new transactions with financial institutions with no prior transaction history are approved, managed
and monitored by the Group’s finance team.
Book value of financial assets represents the maximum exposure to credit risk. The Group’s maximum exposure
to credit risk as of December 31, 2018 and 2017, is as follows:
Korean won (in thousands)
December 31, 2018 December 31, 2017
Financial guarantee agreement (*1) ₩ 10,000,000 ₩ 10,000,000
(*1) The Group’s maximum exposure in relation to financial guarantee contracts is the maximum amount to be paid by the
Group if warranties are claimed.
Financial assets exposed to credit risk, excluding financial guarantee contracts, are excluded from disclosure
because the carrying amounts best represent maximum exposure to credit risk.
(3) Liquidity risk
It is important for the Group to maintain adequate level of liquidity considering the Group’s large-scale
investments. The Group manages its liquidity risk to maintain adequate liquidity by constantly managing periodic
projected cash flows through estimated required cash levels and cash flow management.
Accordingly, the Group estimates and manages required working capital, including required cash and cash
equivalents. Funding is deposited and procured in banks at an amount greater than a predetermined level.
Meanwhile, the Group mitigates liquidity risk by contracting with financial institutions with respect to bank
overdrafts or banking facility agreement.
Also, in the event of large investments in facilities, the Group manages liquidity risk using available cash reserves
or long-term borrowings.
- 68 -
The following table shows in detail the contractual maturities of non-derivative financial liabilities. This table was
prepared on the basis of earliest maturity date based on undiscounted cash flows of financial liabilities and includes
all cash flows of principal and interest. Contractual maturity is based on the earliest date the Group could be
required to make payment.
Korean won (in thousands)
December 31, 2018 December 31, 2017
Less than
1 year
1 year–
5 years
Less than
1 year
1 year–
5 years
Financial liabilities:
Trade and other payables ₩ 639,566,939 ₩ - ₩ 511,045,515 ₩ -
Accrued expenses 530,638,198 51,418,608 423,284,547 38,608,592
Borrowings and corporate bond 774,724 10,000 830,296 -
Other financial liabilities 5,256,149 - 5,828,950 -
1,176,236,010 51,428,608 940,989,308 38,608,592
Financial guarantee agreement 10,000,000 - 10,000,000 -
Total ₩1,186,236,010 ₩ 51,428,608 ₩ 950,989,308 ₩ 38,608,592
(4) Capital risk management
The Group’s capital management objective is to maintain a sound capital structure. The Group uses the debt-to-
equity ratio as an indicator to manage capital. This ratio is calculated by dividing total liabilities with total equity.
There was no change in the Group’s capital risk management policy in comparison with the year ended
December 31, 2017.
The debt-to-equity ratio of the Group as of December 31, 2018 and 2017, is as follows:
Korean won (in thousands)
December 31, 2018 December 31, 2017
Total debt ₩ 1,865,297,206 ₩ 1,558,331,443
Total equity 6,148,552,184 5,719,429,437
Debt-to-equity ratio 30.34% 27.25%
31. RELATED-PARTY TRANSACTIONS:
(1) The Group’s related parties as of December 31, 2018 and 2017, are as follows:
Ownership (%)
December 31, 2018 December 31, 2017 Entity with significant influence over the Group:
Samsung Electronics Co., Ltd. and its subsidiaries - -
Associates:
DongA.com Co., Ltd. 18.97 18.97
Dunet, Inc. 18.01 18.01
Korea Information Certificate Authority, Inc. 6.42 6.42
SERI Technologies, Inc. 29.00 29.00
iMarket Asia Co., Ltd. 40.56 40.56
Other related parties (*1) :
Samsung SDI Co., Ltd. and etc. - -
(*1) A large-scale business group affiliation (other related parties) does not correspond to the related parties defined in
paragraph 9 of K-IFRS 1024. However, a large-scale business group affiliation designated by the Fair Trade
Commission is a company classified as related party and in accordance with the resolution of the Securities and Futures
Commission, is classified as a related party in accordance with the substantive relationship stipulated in paragraph 10 of
K-IFRS 1024.
- 69 -
(2) Revenues and purchase transactions with related parties for the years ended December 31, 2018 and 2017, are
as follows:
December 31, 2018:
Korean won (in thousands)
Revenues Purchase (*1)
Entities with significant influence over the Group:
Samsung Electronics Co., Ltd. ₩ 2,479,627,255 ₩ 32,044,971
Samsung Display Co., Ltd. 171,013,708 17,514
Samsung Electronics America, Inc. 547,691,885 7,134,152
Samsung Electronic Digital appliance S.A. de
C.V. 189,788,040 47,604
Samsung Electronics Ltd. (UK) 69,057,413 249,373
Samsung Electronics Europe Logistics 234,423,200 794,254
Samsung Electronics Slovakia s.r.o 55,070,290 163,322
Samsung India Electronics Private Ltd. 152,894,967 13,308
Thai Samsung Electronics Co., Ltd. 200,980,108 891,574
Samsung Electronics Vietnam 175,790,217 31,233
Samsung Electronics Huizhou Co., Ltd. 156,493,870 28,604
Samsung(China) Semiconductor Co. Ltd 176,439,217 -
Samsung Electronica da Amazonia Ltda. 323,918,416 2,438,426
Others(*2) 2,201,110,393 43,121,537
Associates:
iMarket Asia Co., Ltd. 224,049 79,574
DongA.com Co., Ltd. 101,348 - Korea Information Certificate
Authority, Inc. 129,848 300,966
SERI Technologies, Inc. 3,250 959,785
Total ₩ 7,134,757,474 ₩ 88,316,197
(*1) The Group purchased machinery and other equipment of ₩5,730 million from Samsung Electronics Co., Ltd. for the
year ended December 31, 2018.
(*2) Others consist of the subsidiaries of Samsung Electronics Co., Ltd.
December 31, 2017:
Korean won (in thousands)
Revenues Purchase (*1)
Entities with significant influence over the Group:
Samsung Electronics Co., Ltd. ₩ 2,160,504,724 ₩ 40,396,945
Samsung Display Co., Ltd. 195,563,773 10,765
Samsung Electronics America, Inc. 554,674,128 2,222,856
Samsung Electronic Digital appliance S.A. de
C.V.
191,160,842 672,100
Samsung Electronics Ltd. (UK) 53,923,995 723,815
Samsung Electronics Europe Logistics 246,077,079 1,601,680
Samsung Electronics Slovakia s.r.o 71,691,564 54,268
Samsung India Electronics Private Ltd. 135,516,657 63,544
Thai Samsung Electronics Co., Ltd. 242,384,050 773,773
Samsung Electronics Vietnam 182,088,689 2,499
Samsung Electronics Huizhou Co., Ltd. 146,171,494 9,086
Samsung(China) Semiconductor Co. Ltd 95,101,093 -
Samsung Electronica da Amazonia Ltda. 300,150,388 1,557,277
Others(*2) 2,261,133,635 47,082,185
Associates:
iMarket Asia Co., Ltd. 227,639 113,011
KOREA INFORMATION CERTIFICATE
AUTHORITY, INC.
119,548
326,002
Dunet, Inc. - 18,276
SERI Technologies, Inc. 1,122 1,704,834
Total ₩ 6,836,490,420 ₩ 97,332,916
(*1) The Group purchased machinery and other equipment of ₩9,451 million from Samsung Electronics Co., Ltd. for the
year ended December 31, 2017.
(*2) Others consist of the subsidiaries of Samsung Electronics Co., Ltd.
- 70 -
Revenues and purchase transactions with other related parties for the years ended December 31, 2018 and 2017, are
as follows:
December 31, 2018:
Korean won (in thousands)
Revenues Purchase
Other related parties:
Samsung SDI Co., Ltd. ₩ 184,871,206 ₩ 424,697
Samsung Fire & Marine Insurance Co., Ltd. 197,874,849 11,941,838
Samsung Life Insurance Co., Ltd. 188,704,750 21,861,420
Others 851,051,610 106,063,083
Total ₩ 1,422,502,415 ₩ 140,291,038
December 31, 2017:
Korean won (in thousands)
Revenues Purchase
Other related parties:
Samsung SDI Co., Ltd. ₩ 141,772,373 ₩ 185,486
Samsung Fire & Marine Insurance Co., Ltd. 191,331,546 12,775,163
Samsung Life Insurance Co., Ltd. 214,604,219 25,283,555
Others 837,294,533 88,178,478
Total ₩ 1,385,002,671 ₩ 126,422,682
(3) Receivables from and payables to related parties as of December 31, 2018 and 2017, are as follows:
December 31, 2018:
Korean won (in thousands)
Receivables Payables
Entities with significant influence over
the Group:
Samsung Electronics Co., Ltd. ₩ 617,746,989 ₩ 28,027,575
Samsung Display Co., Ltd. 21,551,417 547,140
Samsung Electronics America, Inc. 75,724,416 1,367,707
Samsung Electronic Digital appliance S.A. de C.V. 18,674,492 77,302
Samsung Electronics Ltd. (UK) 9,303,017 2,375,504
Samsung Electronics Europe Logistics 31,456,940 830,076
Samsung Electronics Slovakia s.r.o 5,418,631 1,303
Samsung India Electronics Private Ltd. 34,319,297 878,319
Thai Samsung Electronics Co., Ltd. 12,855,202 496,159
Samsung Electronics Vietnam 10,826,620 73,492
Samsung Electronics HCMC CE Complex Co. Ltd. 16,415,880 222,327
Samsung Electronics Huizhou Co., Ltd. 9,376,389 7,444
Samsung(China) Semiconductor Co. Ltd. 80,609,749 5,496,903
Others (*1) 252,975,643 8,488,900
Associates:
iMarket Asia Co., Ltd. 17,440 19,427
DongA.com Co., Ltd. 7,128 13,692
SERI Technologies, Inc. - 1,237
Total ₩ 1,197,279,250 ₩ 48,924,507
(*1) Others consist of the subsidiaries of Samsung Electronics Co., Ltd.
- 71 -
December 31, 2017: Korean won (in thousands)
Receivables Payables
Entities with significant influence over
the Group:
Samsung Electronics Co., Ltd. ₩ 483,784,259 ₩ 45,599,123
Samsung Display Co., Ltd. 48,518,919 1,685,980
Samsung Electronics America, Inc. 21,019,639 645,585
Samsung Electronic Digital appliance S.A. de C.V. 18,504,179 292,339
Samsung Electronics Ltd. (UK) 6,254,078 356,656
Samsung Electronics Europe Logistics 27,955,751 473,443
Samsung Electronics Slovakia s.r.o 4,684,701 56,143
Samsung India Electronics Private Ltd. 22,756,350 397,627
Thai Samsung Electronics Co., Ltd. 15,666,883 1,476,457
Samsung Electronics Vietnam 10,624,407 1,690,058
Samsung Electronics HCMC CE Complex Co. Ltd. 13,010,364 786,457
Samsung Electronics Huizhou Co., Ltd. 8,033,457 342,657
Samsung(China) Semiconductor Co. Ltd. 31,337,715 3,967,647
Others (*1) 426,535,069 29,693,817
Associates:
iMarket Asia Co., Ltd. 16,937 15,041
Korea Information Certificate
Authority, Inc.
8,291
825
Dunet, Inc. - 280
SERI Technologies, Inc. - 500,513
Total ₩ 1,138,710,999 ₩ 87,980,648
(*1) Others consist of the subsidiaries of Samsung Electronics Co., Ltd. Receivables from and payables to other related parties as of December 31, 2018 and 2017, are as follows:
December 31, 2018:
Korean won (in thousands)
Receivables Payables
Other related parties:
Samsung SDI Co., Ltd. ₩ 32,031,049 ₩ 2,514,068
Samsung Fire & Marine Insurance Co., Ltd. 28,043,130 291,162
Samsung Life Insurance Co., Ltd. 16,317,070 18,818
Others 177,365,144 38,706,614
Total ₩ 253,756,393 ₩ 41,530,662
December 31, 2017
Korean won (in thousands)
Receivables Payables
Other related parties:
Samsung SDI Co., Ltd. ₩ 22,309,449 ₩ 4,564,221
Samsung Fire & Marine Insurance Co., Ltd. 106,230,327 107,940
Samsung Life Insurance Co., Ltd. 150,586,396 75,989
Others 176,600,713 30,457,646
Total ₩ 455,726,885 ₩ 35,205,796
- 72 -
(4) Key management compensation
Key management compensation for the Group’s registered executives recognized as expenses for the years ended
December 31, 2018 and 2017, is as follows:
Korean won (in thousands)
2018 2017
Short-term benefits ₩ 3,391,282 ₩ 3,131,735
Other long-term benefits 3,567,614 1,878,402
Provision for severance indemnities 487,022 514,221 ₩ 7,445,918 ₩ 5,524,358
Key management refers to the registered directors who have significant control and responsibilities over the
Group’s planning, operating and control activities.
(5) The Group recognized allowance for doubtful accounts of ₩375 thousand and ₩718 thousand with respect to
receivables from related parties as of December 31, 2018 and 2017, respectively. And the Group
reversed ₩343 thousand and ₩14,502 thousand of allowance for doubtful accounts recognized for the years
ended December 31, 2018 and 2017, respectively.
32. EARNINGS PER SHARE:
(1) Basic earnings per share for the years ended December 31, 2018 and 2017, are as follows:
Korean won
December 31, 2018 December 31, 2017
Basic earnings per share ₩ 8,137 ₩ 6,856
(2) Basic earnings per share
Net income attributable to the owners of the Group and the weighted-average number of shares outstanding used in
calculating basic earnings per share are as follows:
Korean won (in thousands)
December 31, 2018 December 31, 2017
Net income attributable to the owners
of the Group ₩ 629,399,571 ₩ 530,347,611
Number of shares
December 31, 2018 December 31, 2017
Weighted-average number of
common shares outstanding (shares) 77,350,186 shares 77,350,186 shares
(3) Diluted earnings per share
Diluted earnings per share are the same as basic earnings per share, as diluted securities are not held on
December 31, 2018 and 2017.
33. APPROVAL OF CONSOLIDATED FINANCIAL STATEMENTS:
The consolidated financial statements of the Group as of and for the year ended December 31, 2018, to be
submitted to the ordinary shareholders’ meeting on March 20, 2019, were finally authorized at the board of
directors’ meeting on January 24, 2019.
- 73 -
34. EMISSION RIGHTS AND LIABILITIES:
(1) The quantity of the emission allowances allocated free of charge for the three-year plan period from 2016 to
2018 is as follows:
Quantity of emission allowances
allocated free of charge
2016 KAU 46,756
2017 43,514
2018 44,428
Total KAU 134,698
(2) The changes in the quantity of allowances and carrying value for the years ended December 31, 2018 and
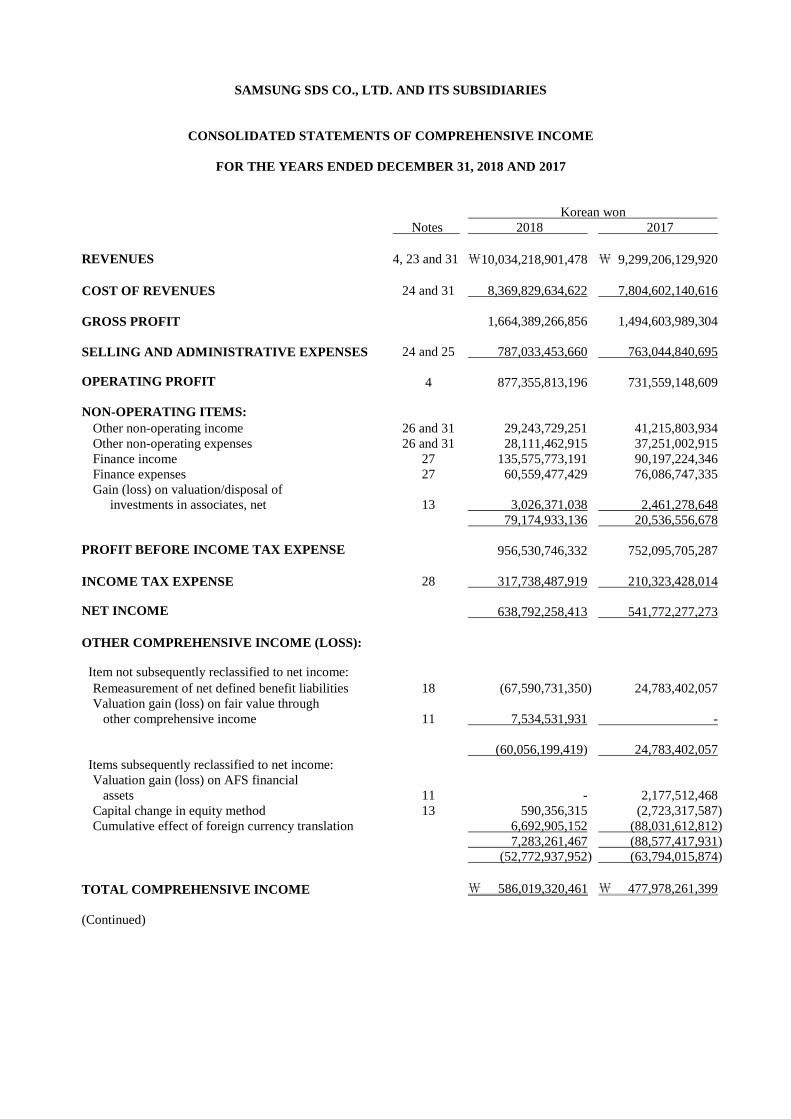
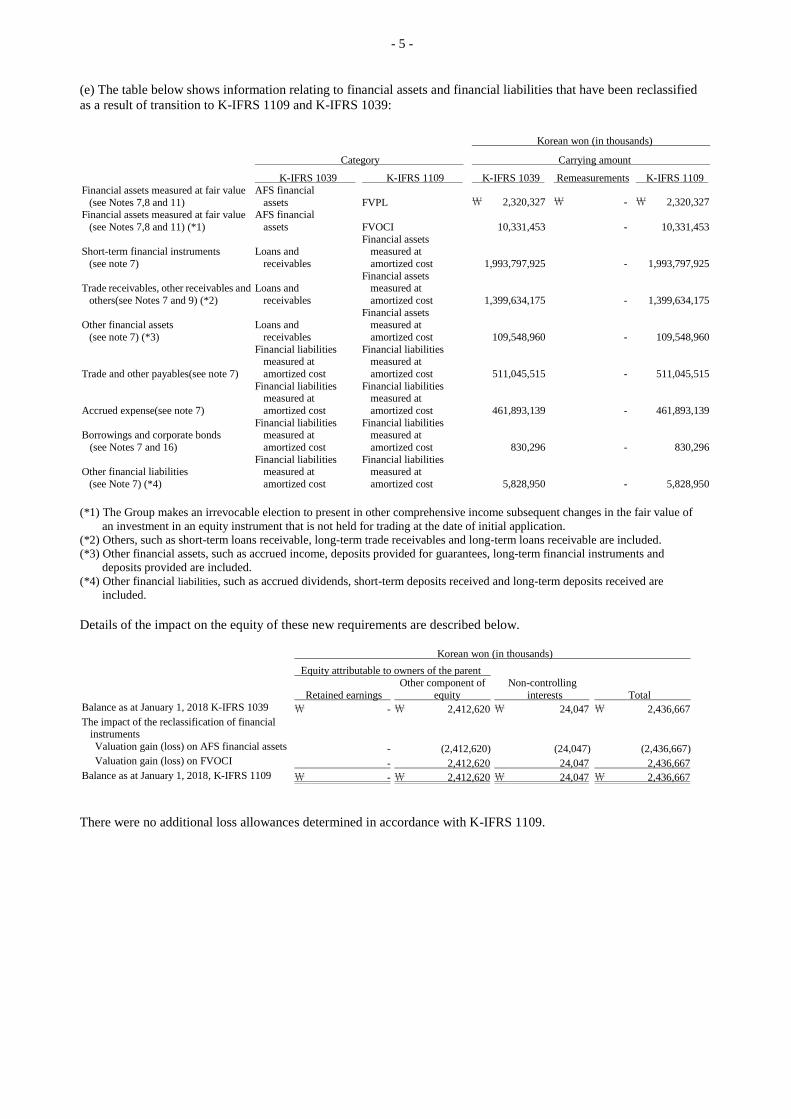
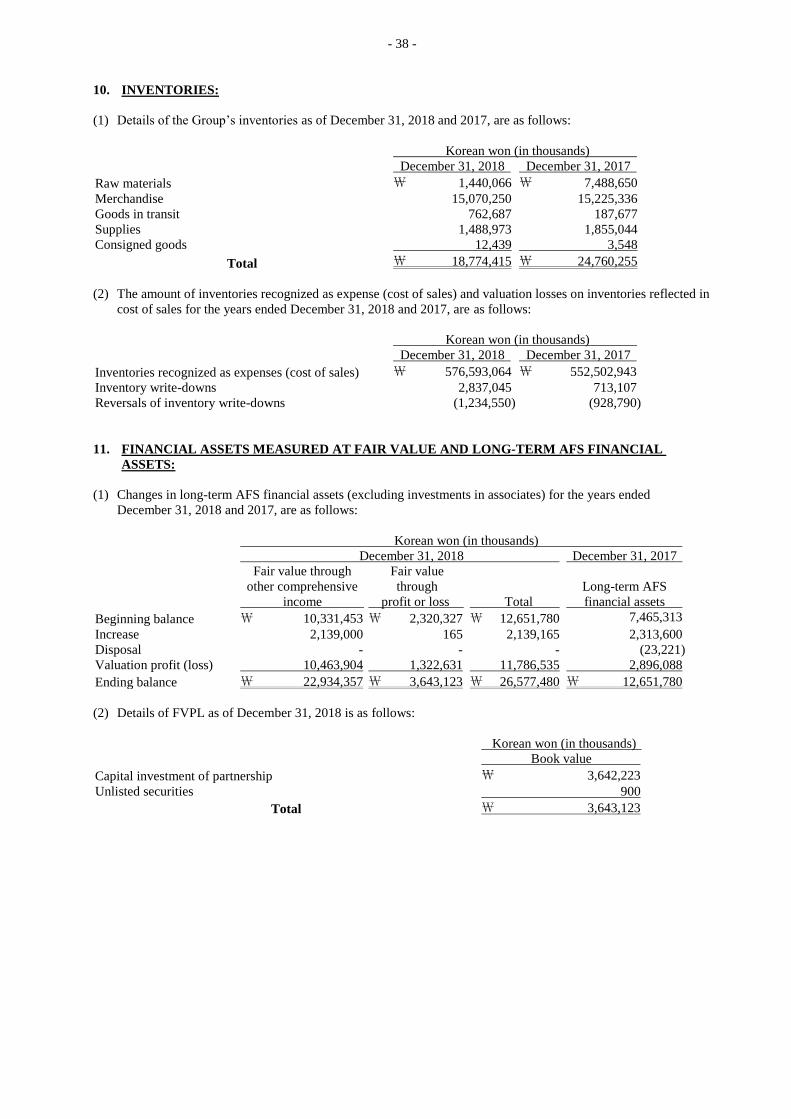
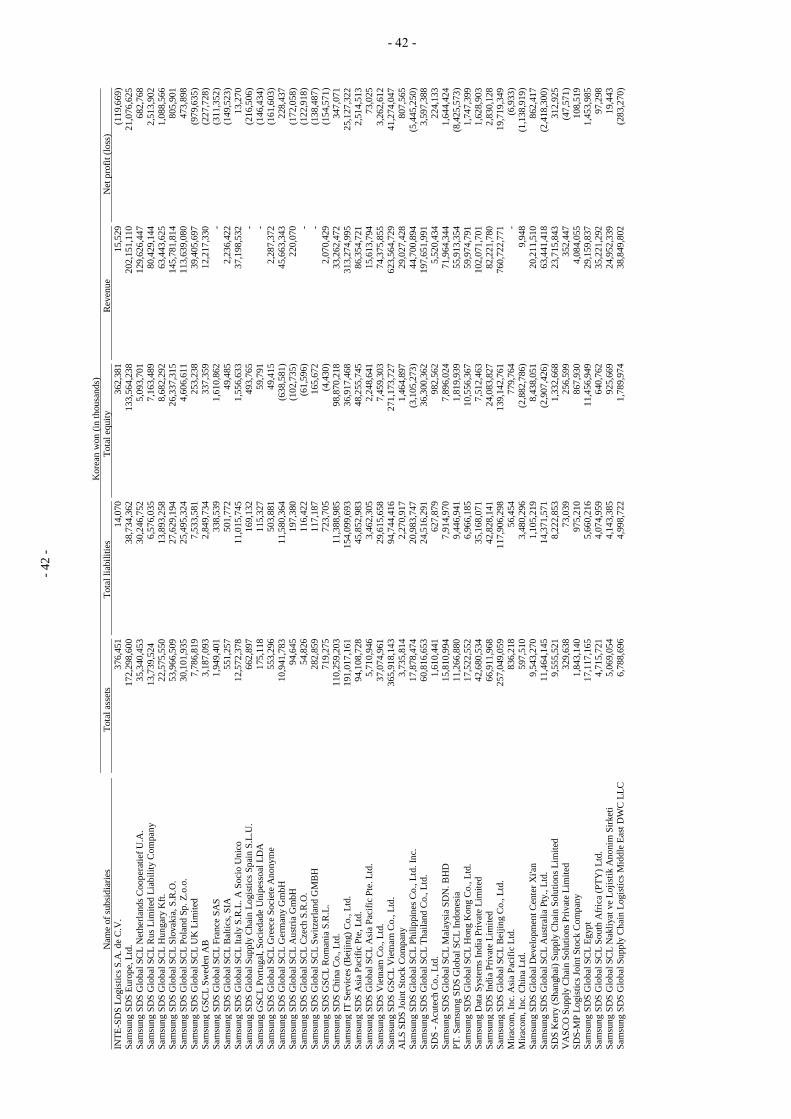
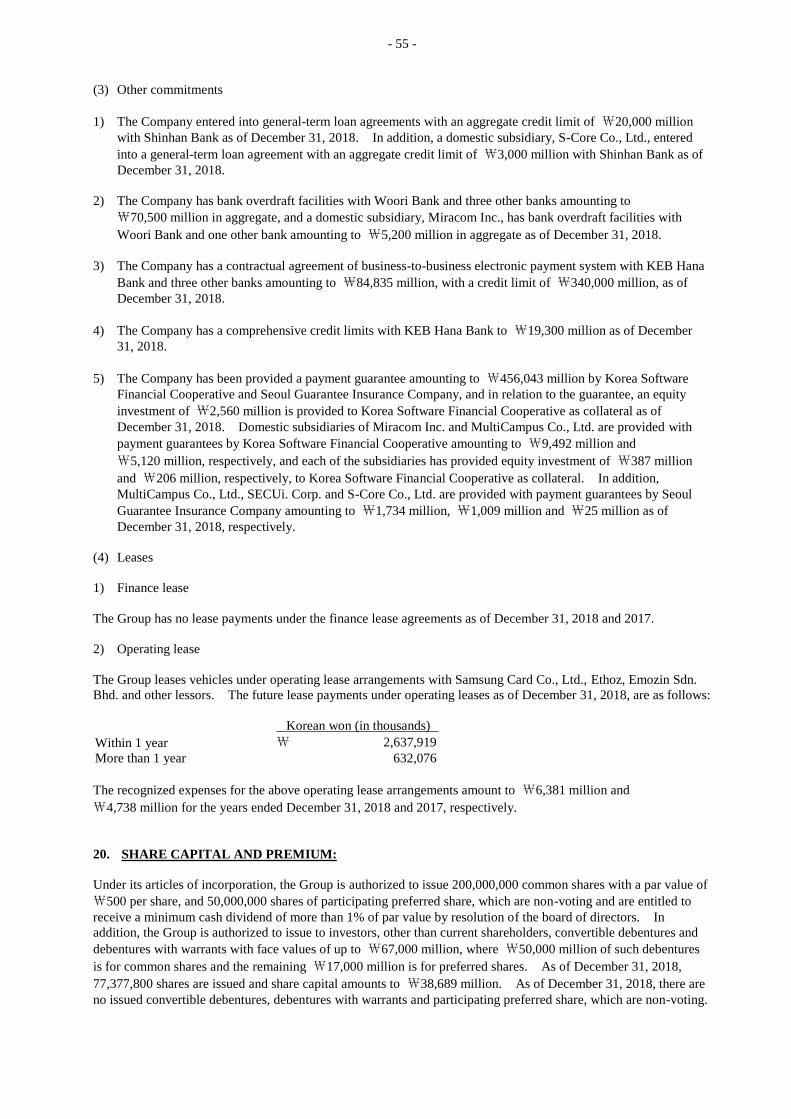
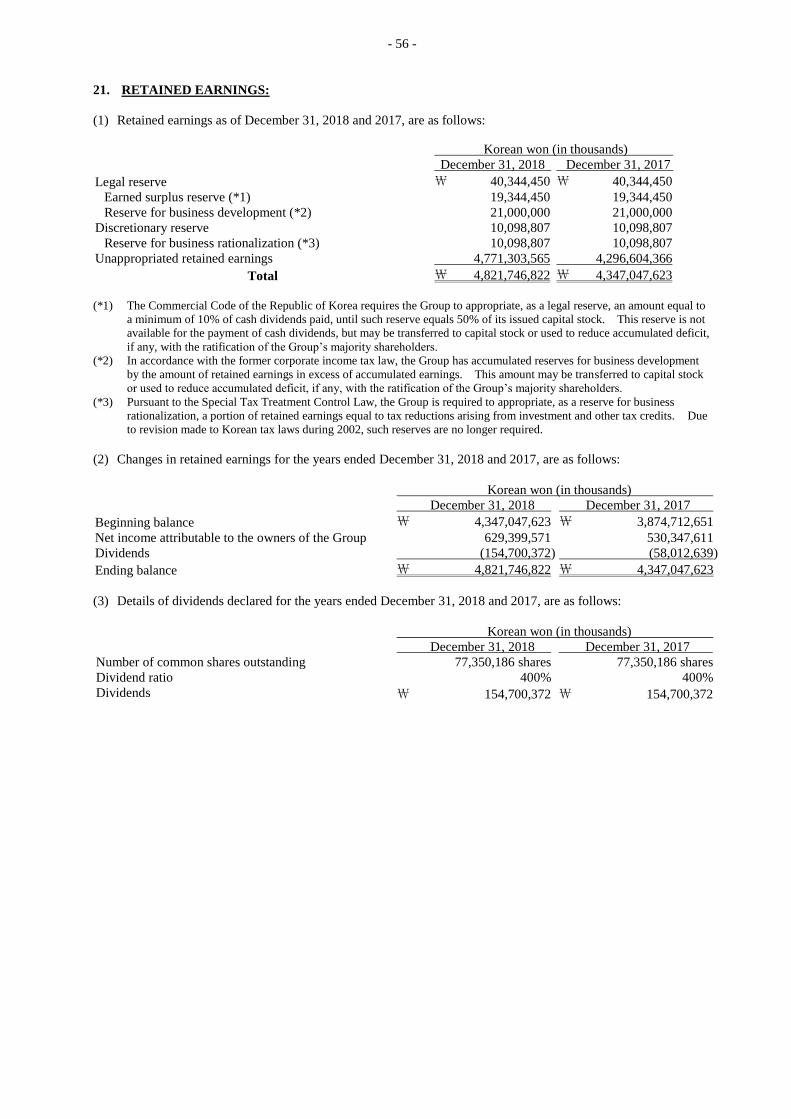
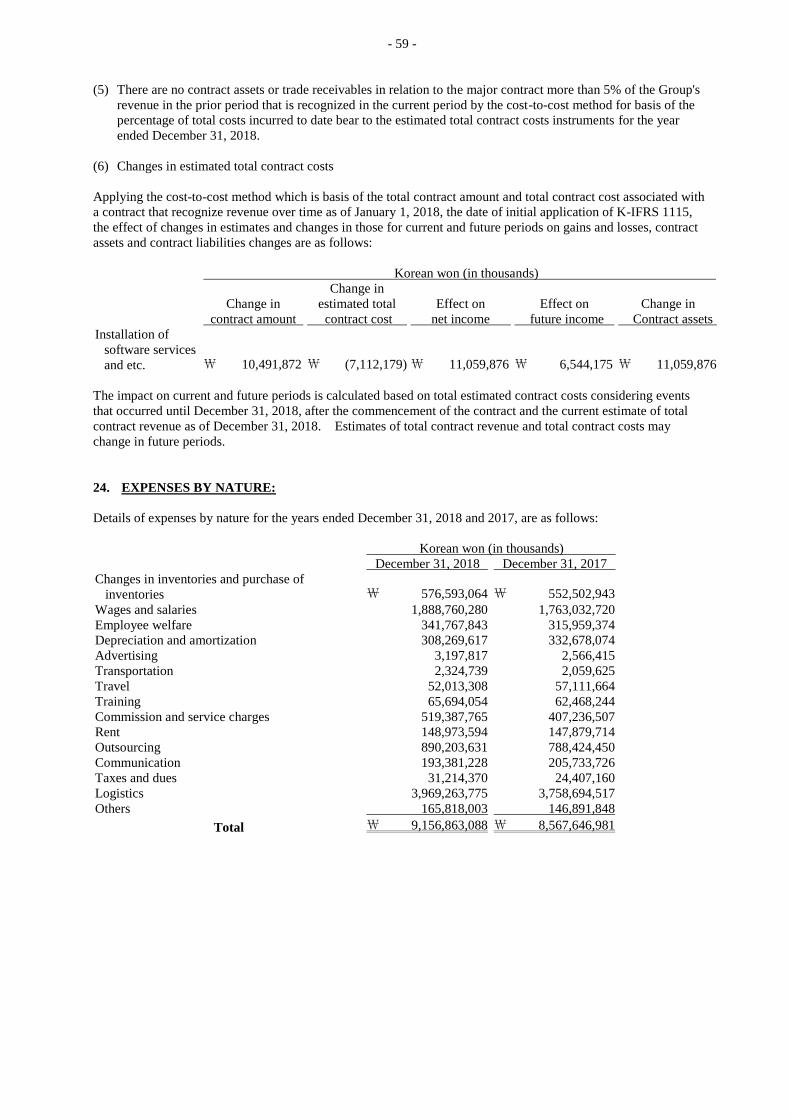
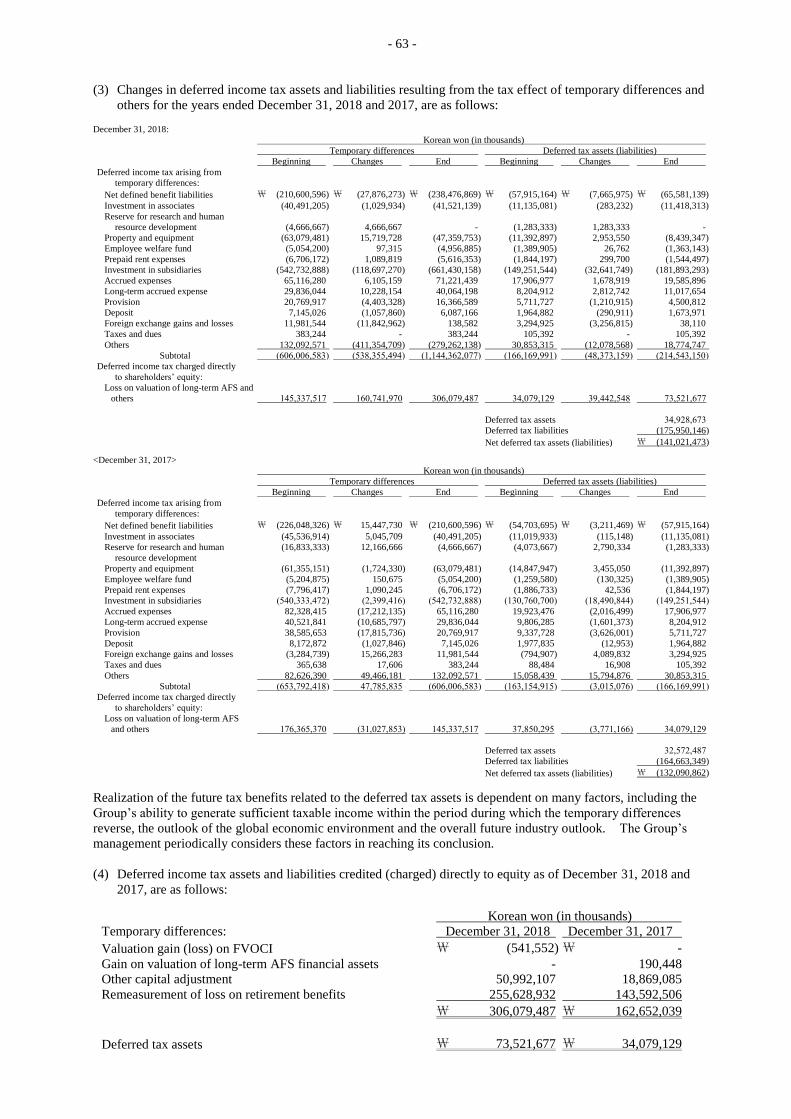
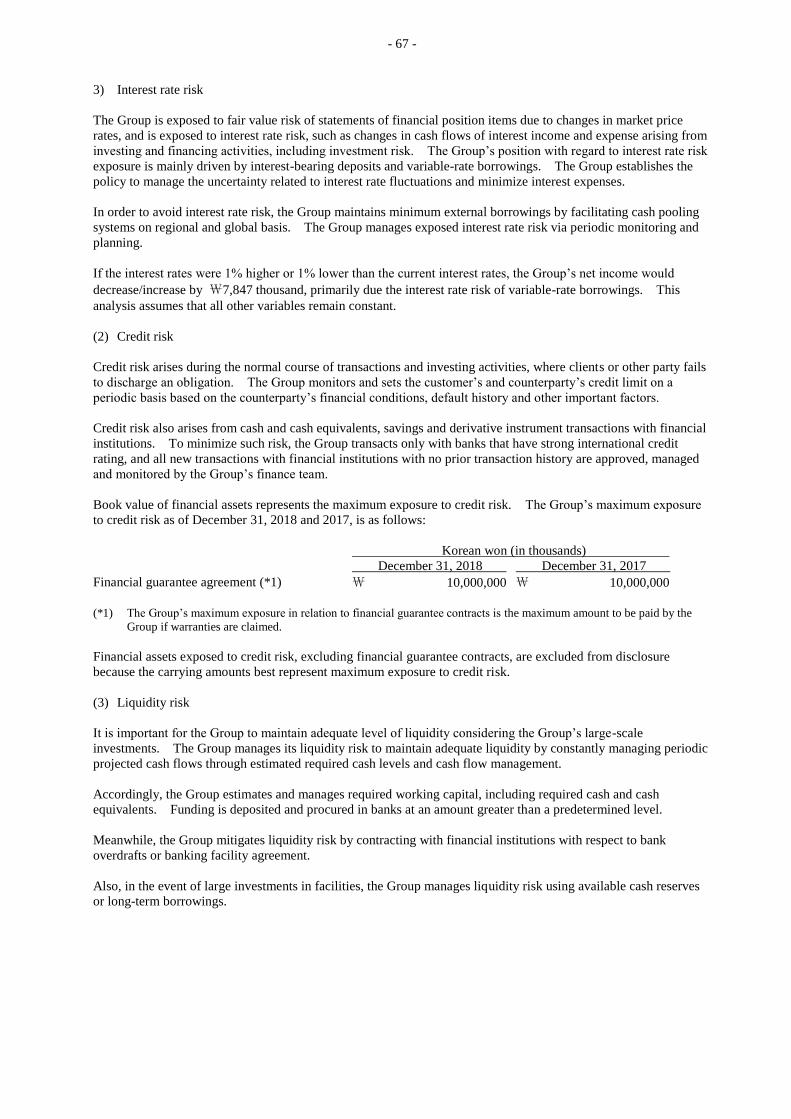
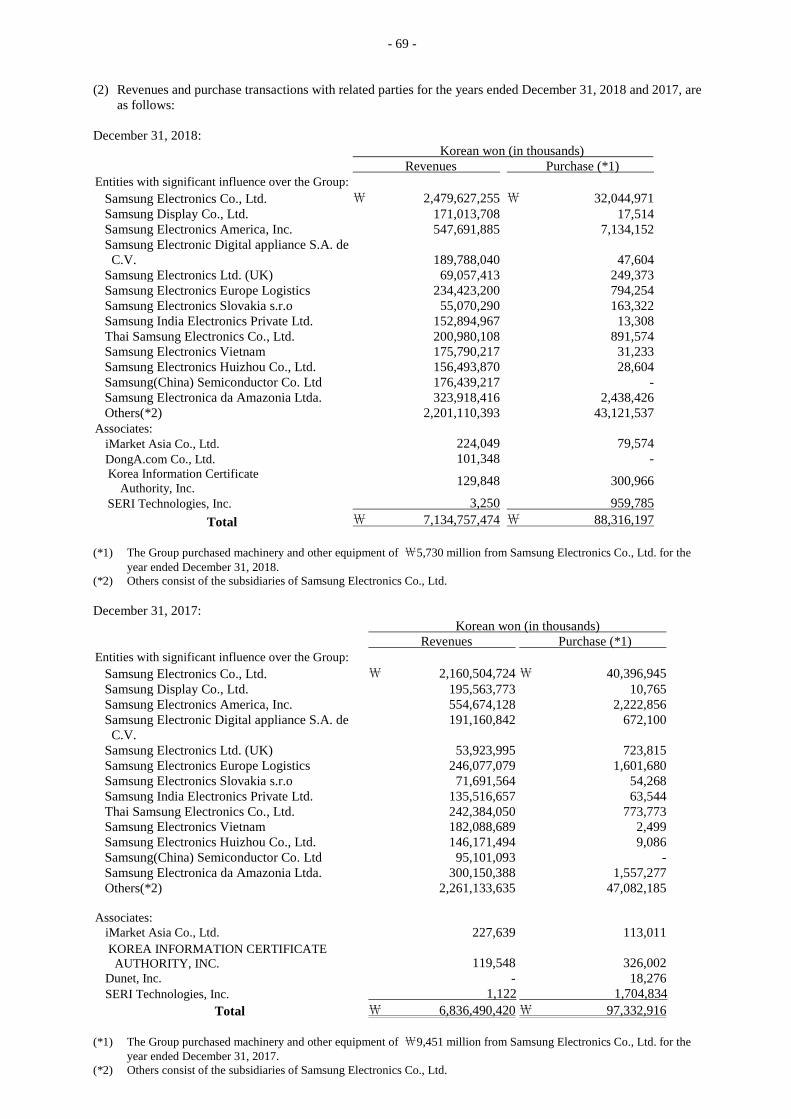
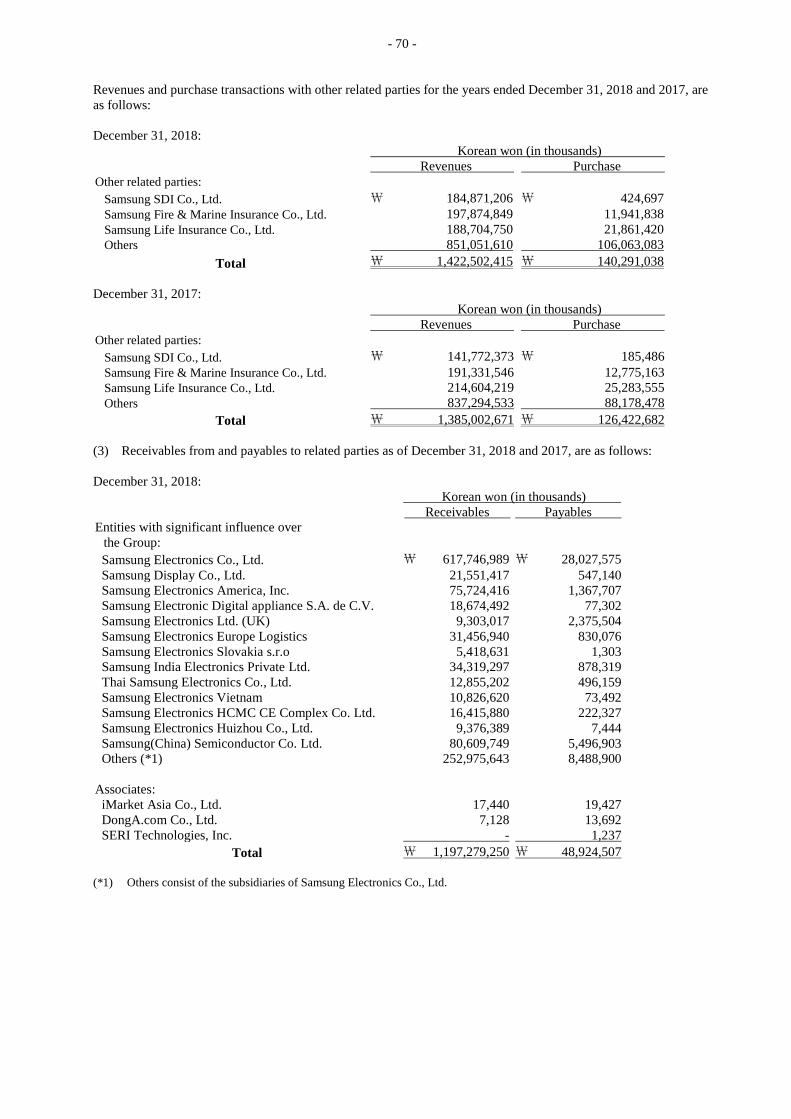
2017, are as follows:
KAU Korean won (in thousands) Quantity Book value
2018 2017 2018 2017
Beginning KAU 27,729 KAU 20,378 ₩ 359,915 ₩ 364,766
Allocated 44,428 49,772 - -
Purchase - - - -
Applied (39,461) (42,421) - (4,851)
Ending KAU 32,696 KAU 27,729 ₩ 359,915 ₩ 359,915
No emission allowances are provided as collateral for the year ended December 31, 2018. The estimated quantity
of emission produced for the year ended December 31, 2018, is 44,428 KAU.