University of Plymouth PEARL https://pearl.plymouth.ac.uk 04 University of Plymouth Research Theses 01 Research Theses Main Collection 2017 The impacts of wheat gluten products and short-chain fructooligosaccharides on the health and production of juvenile rainbow trout (Oncorhynchus mykiss) Voller, Samuel W. http://hdl.handle.net/10026.1/9826 University of Plymouth All content in PEARL is protected by copyright law. Author manuscripts are made available in accordance with publisher policies. Please cite only the published version using the details provided on the item record or document. In the absence of an open licence (e.g. Creative Commons), permissions for further reuse of content should be sought from the publisher or author.
Transcript
University of Plymouth
PEARL https://pearl.plymouth.ac.uk
04 University of Plymouth Research Theses 01 Research Theses Main Collection
2017
The impacts of wheat gluten products
and short-chain fructooligosaccharides
on the health and production of juvenile
rainbow trout (Oncorhynchus mykiss)
Voller, Samuel W.
http://hdl.handle.net/10026.1/9826
University of Plymouth
All content in PEARL is protected by copyright law. Author manuscripts are made available in accordance with
publisher policies. Please cite only the published version using the details provided on the item record or
document. In the absence of an open licence (e.g. Creative Commons), permissions for further reuse of content
should be sought from the publisher or author.
I
The impacts of wheat gluten products and short-chain
fructooligosaccharides on the health and production of
juvenile rainbow trout (Oncorhynchus mykiss)
by
Samuel W. Voller
A thesis submitted to Plymouth University in partial fulfilment for the degree of
Doctor of Philosophy
(September 2016)
This work was supported by Tereos Syral, Marckolsheim, France and Plymouth University.
II | P a g e
Copyright statement
This thesis copy has been supplied on the condition that anyone who consults it is understood to recognise that its copyright rests with its author and that no quotation from the thesis and no information derived from it may be published without the author’s prior consent.
III | P a g e
Abstract: The impacts of wheat gluten products and short-chain fructooligosaccharides on the
health and production of juvenile rainbow trout (Oncorhynchus mykiss) Samuel W. Voller
Through the implementation of in vivo feeding trials, the efficacy of three wheat gluten (WG) products, vital (Amytex®), hydrolysed (Merripro®) and soluble hydrolysed (Solpro®) wheat gluten as replacement of soy protein concentrate, and scFOS prebiotic (Profeed®) supplementation were analysed to assess their impacts on intestinal health and production of juvenile rainbow trout. Microbial community analysis in experiment one revealed a degree of diet based modulation with 7.5% and 15% inclusions of wheat gluten (WG) products. Bacterial species diversity was significantly reduced with 15% hydrolysed wheat gluten (HWG) inclusion compared to the plant protein control and 15% vital wheat gluten (VWG) treatments, with sequenced OTUs dominated by the phylum Firmicutes and possible promotion of probiotic species. No detrimental effects were observed on intestinal morphology. These findings led onto a longer duration feed trial with a more holistic, higher resolution approach. Experiment two revealed modulation of the allochthonous intestinal microbiota, with increased proportions of Enterococcus and Weissella in the 10% and 20% VWG treatments. Bacillus and Leuconostoc relative abundances were significantly increased with 10% HWG and soluble hydrolysed (Sol) wheat gluten inclusions. HSP 70 transcripts were significantly down-regulated in all WG treatments compared to the basal soy protein concentrate treatment (SPC) and increased intraepithelial leukocyte counts were observed with 10% VWG inclusion. Growth performance was unaffected by 10% dietary inclusions of WG, however, FCR’s were significantly improved in the 20% VWG treatment compared to the 10% HWG and Soluble treatments. This led to the investigation of increased inclusion levels of WG products in experiment three. All WG treatments in experiment three yielded significantly improved growth performance. Somatic indices were significantly increased with 30% blended WG inclusion compared to the SPC treatment. Modulation of allochthonous intestinal microbiota was observed to a lower degree than the previous experiments, with a dose response observed with increasing blended WG inclusion. In the final experiment two basal diets (SPC and 20% Blended) and two scFOS supplemented diets (SPC + FOS and 20% Blended + FOS) were investigated for the effect on growth performance, gut health and allochthonous microbial population. Growth performance was unaffected, however, modulation of the allochthonous microbial population was observed with an apparent synergistic effect of scFOS supplementation in WG diets. This synergistic trend was also observed in the transcription level expression of immune relevant genes. 20% WG inclusion with additional scFOS supplementation observed significant down regulation of the pro-inflammatory cytokine TNF-α, as well as HSP 70, CASP 3 and Glute ST compared to the 20% Blend treatment. The present research demonstrates dietary inclusions of WG products, solely or blended, at the expense of soy protein concentrate to modulate the allochthonous microbial population, potentially promoting probiotic species, whilst reducing the levels of intestinal stress in juvenile rainbow trout. Supplementation of the prebiotic scFOS modulated the microbial populations, enhancing the proportion of potential probiotic species, and combined with WG inclusions, reduce intestinal and oxidative stress and inflammation biomarkers, with no observed deleterious effects.
IV | P a g e
Home Office statement
All experimental work involving animals complied with the 1986 Animals Scientific
Procedures Act, operating under Home Office project license PPL 30/2644 and personal
license PIL 30/10401.
All experimental work involving animals further complied with the Plymouth University
Animal Welfare and Ethical Review Committee.
V | P a g e
Contents
Copyright statement ................................................................... Error! Bookmark not defined.
Abstract ....................................................................................... Error! Bookmark not defined.
Home Office statement ............................................................. IError! Bookmark not defined.
2.8.2. Crude protein .......................................................................................................... 50
2.8.3. Crude lipid ................................................................ Error! Bookmark not defined.2
2.8.4. Ash ........................................................................... Error! Bookmark not defined.2
2.8.5. Gross energy ............................................................ Error! Bookmark not defined.3
2.9. Haematological and serological analysis ...................... Error! Bookmark not defined.3
2.9.1. Haematocrit ............................................................. Error! Bookmark not defined.4
2.9.2. Haemoglobin ........................................................... Error! Bookmark not defined.4
2.9.3 Serum lysozyme analysis .......................................... Error! Bookmark not defined.4
2.10. Molecular microbial analysis ...................................... Error! Bookmark not defined.5
2.10.1. DNA Extraction ...................................................... Error! Bookmark not defined.5
2.10.2. PCR-denaturing gradient gel electrophoresis (PCR-DGGE) .... Error! Bookmark not
defined.7
2.10.3. Sanger sequencing ................................................. Error! Bookmark not defined.8
2.10.4. High throughput sequencing ................................. Error! Bookmark not defined.8
2.10.5. Gel electrophoresis ................................................ Error! Bookmark not defined.9
2.10.5. RNA extraction and cDNA synthesis ..................................................................... 60
VII | P a g e
2.10.6. Quantitative real time PCR (gene expression analysis) .......... Error! Bookmark not
defined.
2.11. Light microscopy .......................................................... Error! Bookmark not defined.2
2.12. Statistical analysis ....................................................... Error! Bookmark not defined.3
2.12.1. PCR-DGGE .............................................................. Error! Bookmark not defined.4
2.12.2. High throughput sequencing ................................. Error! Bookmark not defined.6
CHAPTER 3a. The short term impacts of wheat gluten products on the intestinal microbiota and gross intestinal structure of juvenile rainbow trout (Oncorhynchus mykiss): A preliminary investigation. .................................................... Error! Bookmark not defined.7
3.1a. Introduction ................................................................. Error! Bookmark not defined.7
3.2a. Materials and methods ................................................. Error! Bookmark not defined.
3.2.1a. Experimental design .............................................. Error! Bookmark not defined.9
3.2.2a. Experimental diets ................................................... Error! Bookmark not defined.
3.2.3a. Sampling ................................................................ Error! Bookmark not defined.2
3.2.5a. Scanning electron microscopy ................................. Error! Bookmark not defined.
3.3a. Results .......................................................................... Error! Bookmark not defined.3
3.3.1a. Gross observations ................................................ Error! Bookmark not defined.3
3.3.2a. Intestinal microbiology .......................................... Error! Bookmark not defined.3
3.3.2.1a. PCR-DGGE ........................................................... Error! Bookmark not defined.3
3.3.2.2a. DGGE sequence analysis ..................................... Error! Bookmark not defined.5
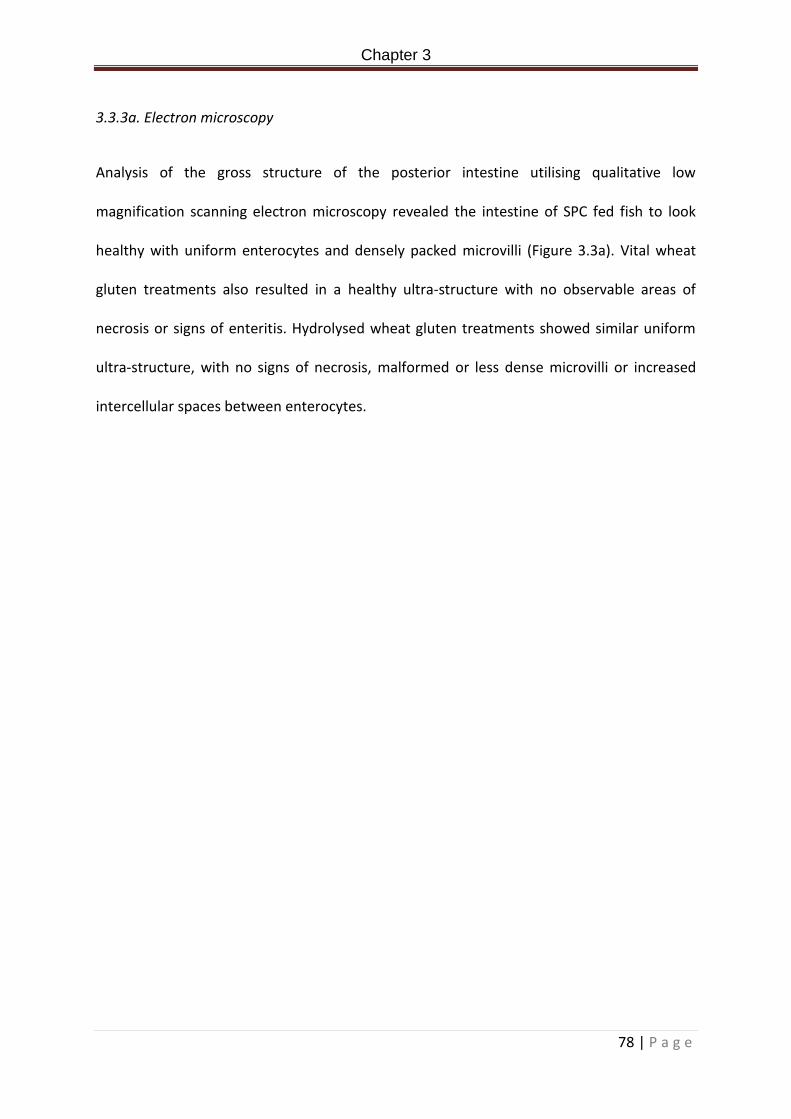
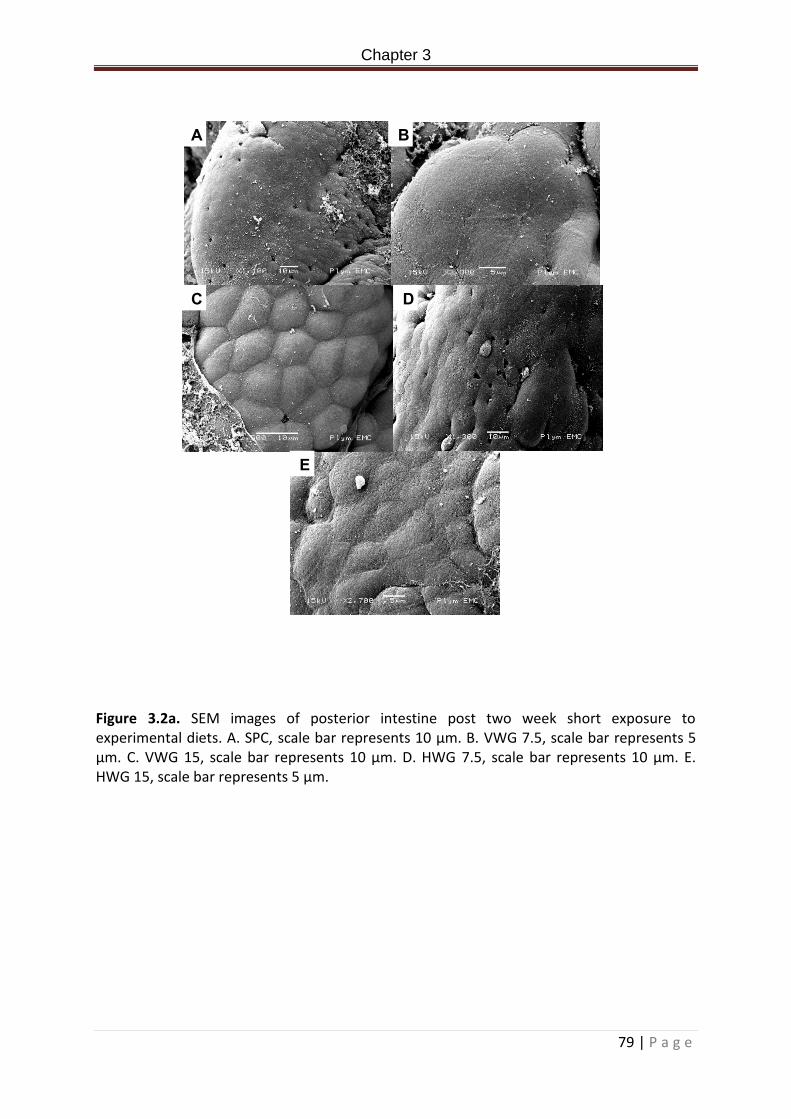
3.3.3a. Electron microscopy ............................................... Error! Bookmark not defined.9
3.4a. Discussion .................................................................... Error! Bookmark not defined.1
3.5a. Conclusion .................................................................... Error! Bookmark not defined.4
Chapter 3b: The effect of dietary wheat gluten products on gut health, allochthonous intestinal microbial population and growth performance of juvenile rainbow trout (Oncorhynchus mykiss). ............................................................. Error! Bookmark not defined.
3.1b. Introduction ................................................................. Error! Bookmark not defined.6
3.2b. Materials and methods ............................................... Error! Bookmark not defined.8
3.2.2b. Experimental diets ................................................. Error! Bookmark not defined.9
3.2.3b. Sampling ................................................................ Error! Bookmark not defined.1
3.2.4b. Proximate composition .......................................... Error! Bookmark not defined.1
3.2.5b. Haematological and serological analysis .............. Error! Bookmark not defined.2
3.2.6b. High throughput sequencing ................................. Error! Bookmark not defined.2
3.2.7.b Scanning electron microscopy ............................... Error! Bookmark not defined.2
VIII | P a g e
3.2.8b. Light microscopy .................................................... Error! Bookmark not defined.3
3.2.9b. Gene expression ..................................................... Error! Bookmark not defined.3
3.2.10b. Statistical analysis ............................................... Error! Bookmark not defined.4
3.3b. Results .......................................................................... Error! Bookmark not defined.5
3.3.1b. Gross observations ................................................ Error! Bookmark not defined.5
3.3.2b. Growth performance and carcass composition..... Error! Bookmark not defined.5
3.3.3b. Haematology ......................................................... Error! Bookmark not defined.6
3.3.2b. High-throughput sequencing ................................. Error! Bookmark not defined.6
3.3.3b. Gene expression ..................................................... Error! Bookmark not defined.6
3.3.4b. Intestinal histology ................................................ Error! Bookmark not defined.8
3.4b. Discussion .................................................................... Error! Bookmark not defined.3
3.5b. Conclusion.................................................................... Error! Bookmark not defined.5
Chapter 4: The effect of commercially relevant blended wheat gluten on growth performance, condition and intestinal microbiota in juvenile rainbow trout (Oncorhynchus mykiss). ..................................................................................... Error! Bookmark not defined.8
4.1 Introduction .................................................................... Error! Bookmark not defined.8
4.2 Materials and methods ................................................ Error! Bookmark not defined.30
4.2.1 Experimental design ................................................... Error! Bookmark not defined.
2.2.2. Experimental diets ................................................... Error! Bookmark not defined.1
4.2.3. Sampling .................................................................. Error! Bookmark not defined.3
4.2.4. Proximate composition ............................................ Error! Bookmark not defined.3
4.2.5. Haematological and serological analysis ................ Error! Bookmark not defined.4
4.2.6. Somatic indices ........................................................ Error! Bookmark not defined.4
4.2.7. Microbiological analysis / PCR-DGGE and sequencing ............. Error! Bookmark not
defined.4
4.3 Results ............................................................................. Error! Bookmark not defined.4
4.3.1. Gross observations................................................... Error! Bookmark not defined.4
4.3.2. Growth performance and carcass composition ....... Error! Bookmark not defined.5
4.3.3. Somatic indices and haematological parameters ... Error! Bookmark not defined.6
4.3.4. Intestinal microbiology ............................................ Error! Bookmark not defined.9
4.3.4.1. PCR-DGGE ............................................................. Error! Bookmark not defined.9
4.3.4.2. DGGE sequence analysis ....................................... Error! Bookmark not defined.9
4.4. Discussion ...................................................................... Error! Bookmark not defined.3
IX | P a g e
4.5. Conclusions .................................................................... Error! Bookmark not defined.2
Chapter 5: The effect of blended dietary wheat gluten and scFOS on gut health, allochthonous intestinal microbial populations and growth performance of juvenile rainbow trout (Oncorhynchus mykiss). ................................... Error! Bookmark not defined.3
5.1. Introduction ................................................................... Error! Bookmark not defined.3
5.2. Materials and methods ................................................. Error! Bookmark not defined.6
5.2.1 Experimental design ................................................. Error! Bookmark not defined.6
5.2.2 Experimental diets .................................................... Error! Bookmark not defined.7
5.2.2. Sampling .................................................................. Error! Bookmark not defined.9
5.2.3. Proximate composition ............................................ Error! Bookmark not defined.9
5.2.4. High –throughput intestinal microbiology ............ Error! Bookmark not defined.60
5.2.5. Gene expression ......................................................... Error! Bookmark not defined.
5.2.3. SCFA analysis ........................................................... Error! Bookmark not defined.2
5.3. Results ............................................................................ Error! Bookmark not defined.3
5.3.1. Gross observations................................................... Error! Bookmark not defined.3
5.3.5. SCFA analysis of luminal contents ........................... Error! Bookmark not defined.2
5.3.6. Gene expression. ...................................................... Error! Bookmark not defined.2
5.4 Discussion ....................................................................... Error! Bookmark not defined.5
5.5 Conclusions ..................................................................... Error! Bookmark not defined.9
Chapter 6. General discussion. ................................................ Error! Bookmark not defined.2
References ................................................................................ Error! Bookmark not defined.8
X | P a g e
List of Tables
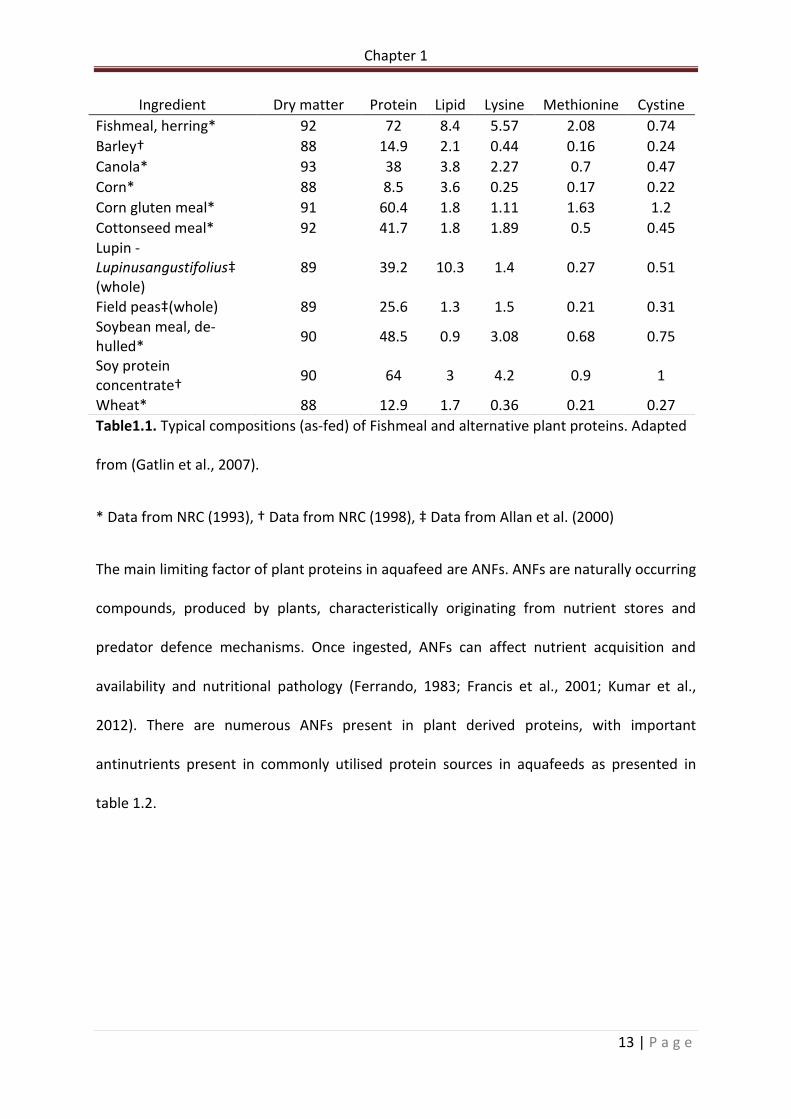
Table 1.1. Typical compositions (as-fed) of Fishmeal and alternative plant proteins. Adapted from (Gatlin et al., 2007)…………………………………………………………………………………………………….13
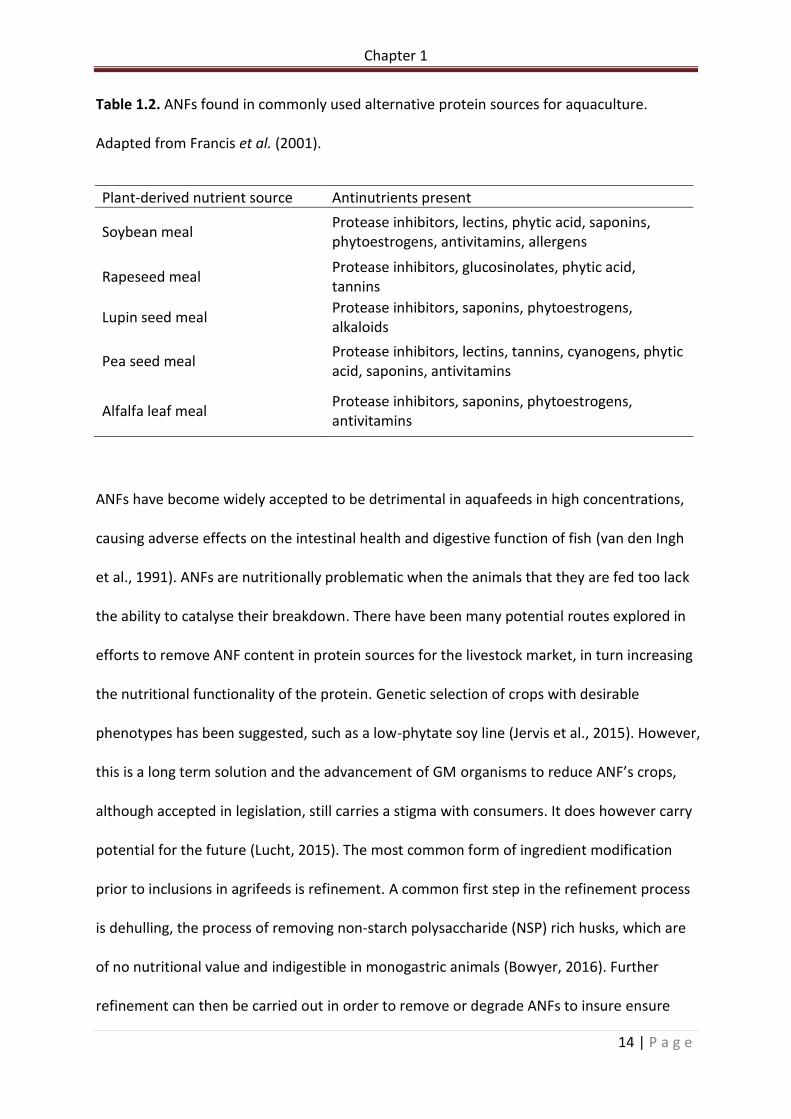
Table 1.2. ANFs found in commonly used alternative protein sources for aquaculture. Adapted from Francis et al. (2001)………………………………………………………………………………….....14
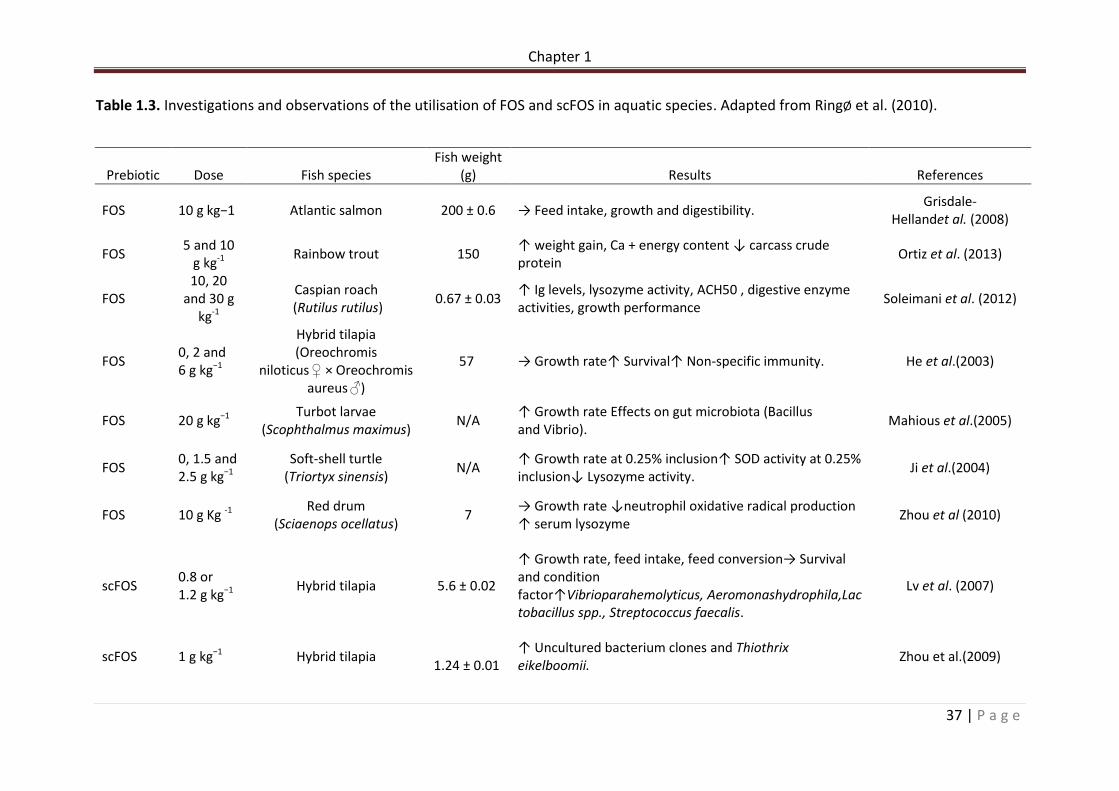
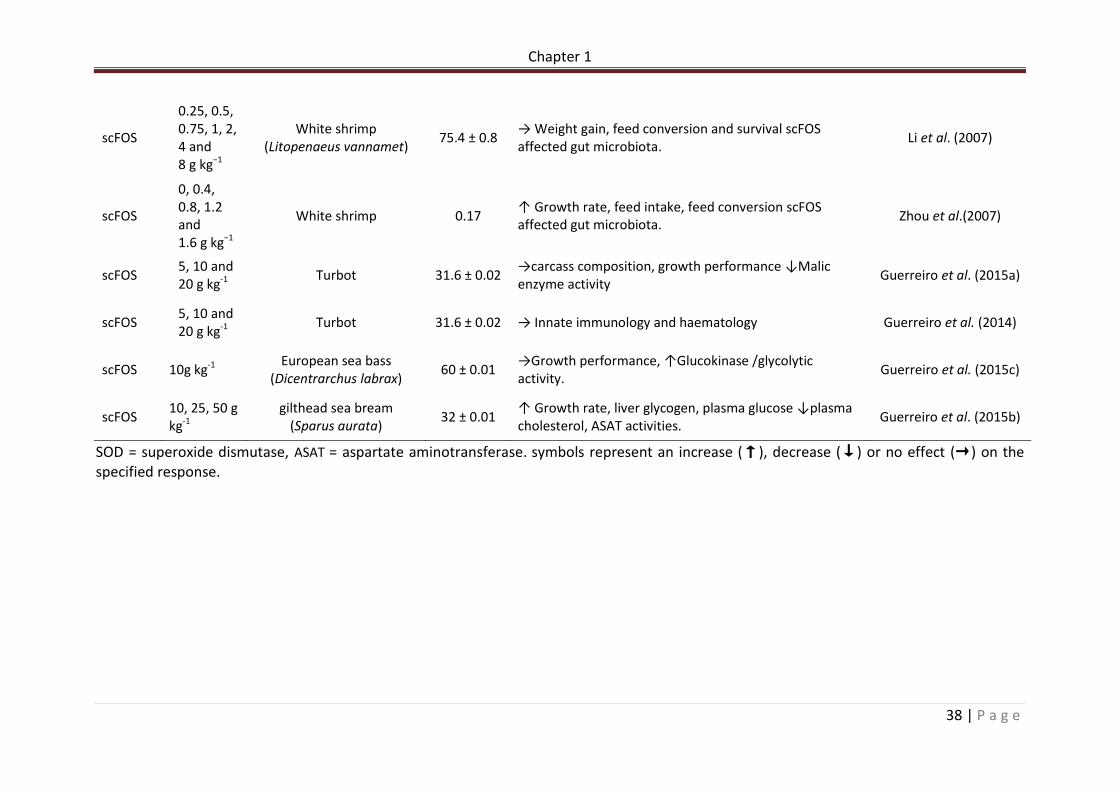
Table 1.3. Investigations and observations of the utilisation of FOS and scFOS in aquatic species. Adapted from RingØ et al. (2010)………………………………………………………………………….37
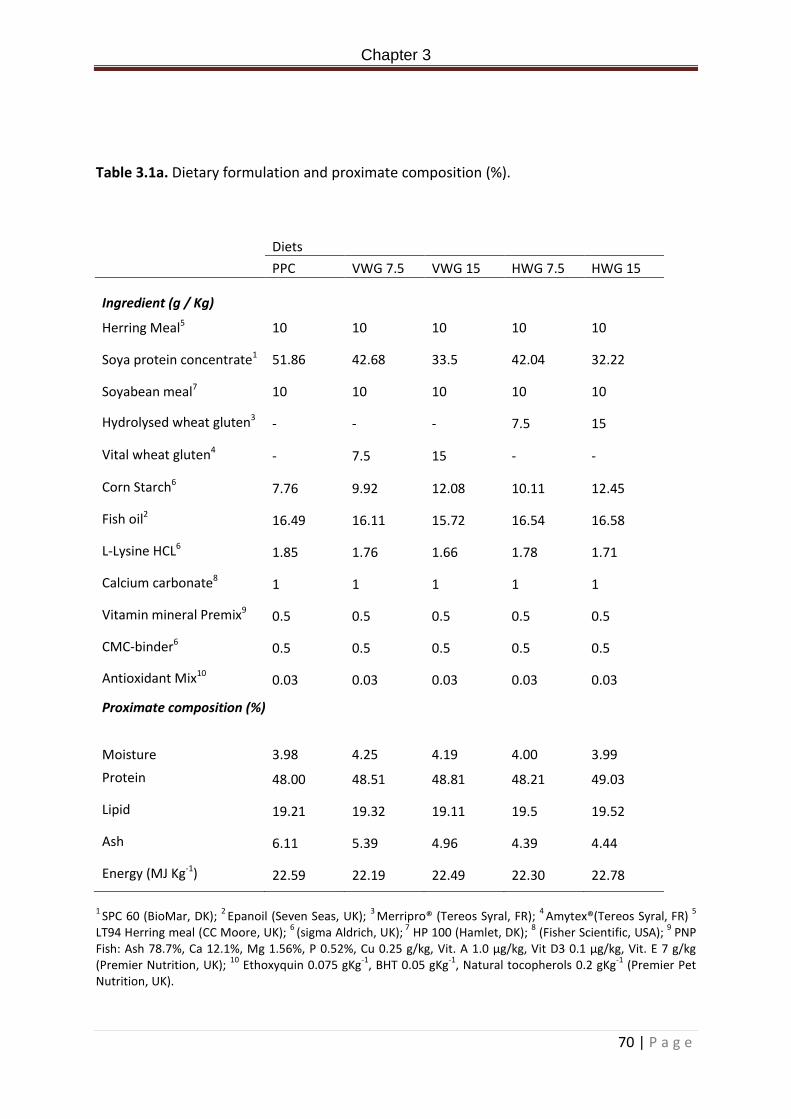
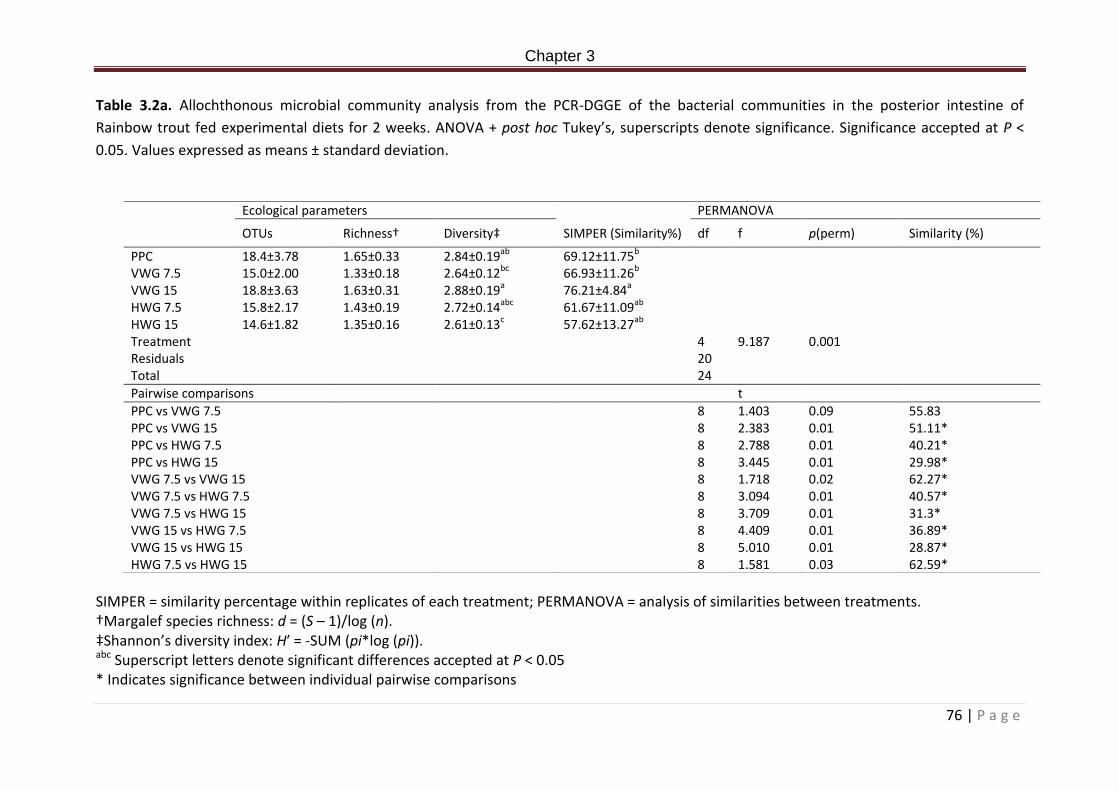
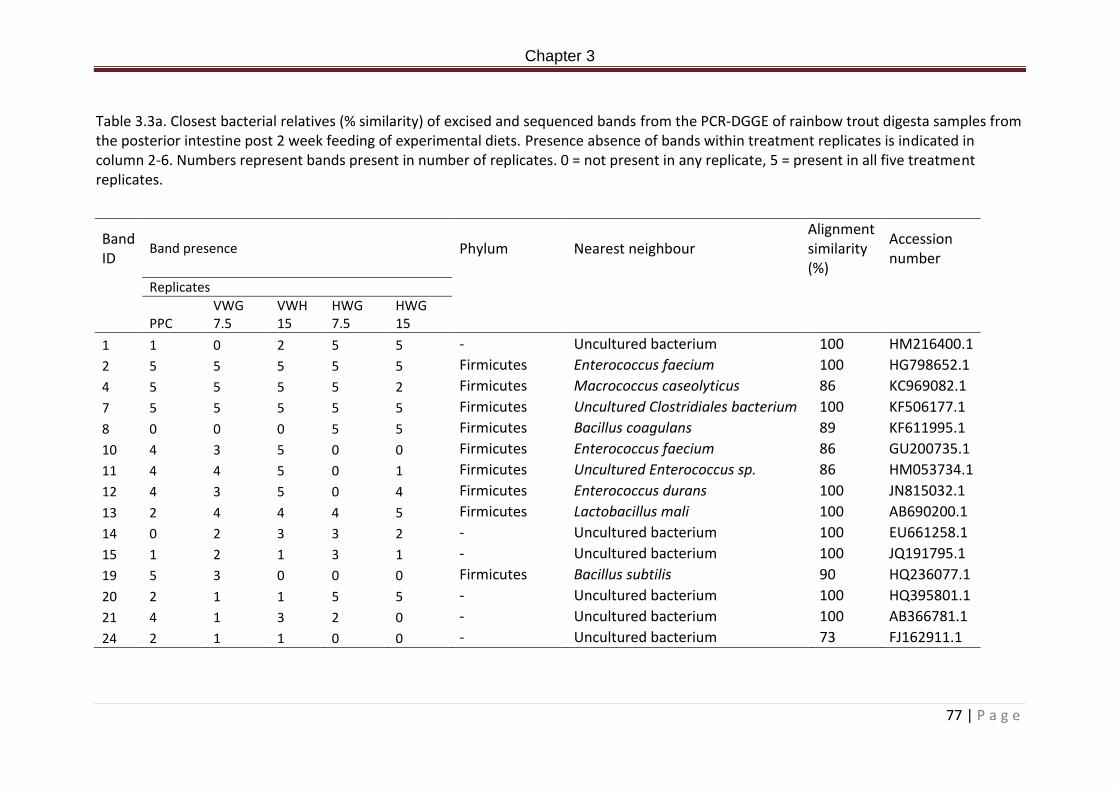
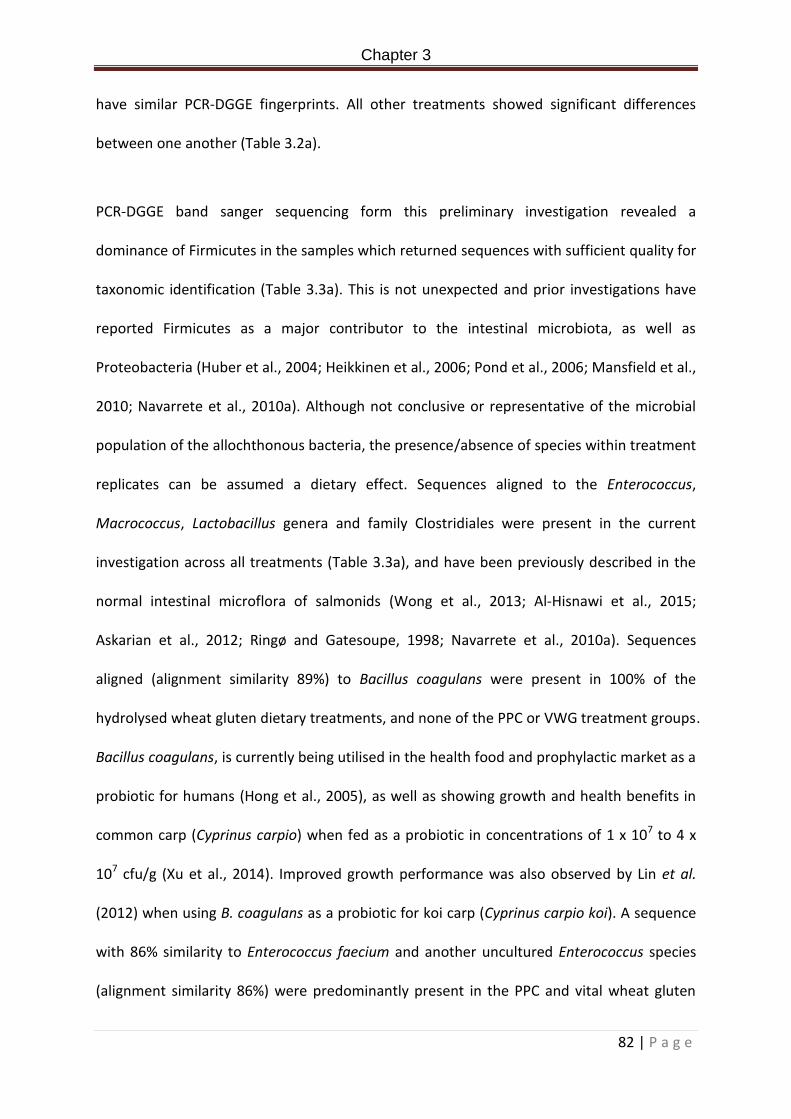
Table 3.1a. Dietary formulation and proximate composition (%)……………………………………….71 Table 3.2a. Allochthonous microbial community analysis from the PCR-DGGE of the bacterial communities in the posterior intestine of Rainbow trout fed experimental diets for 2 weeks. ANOVA + post hoc Tukey’s, superscripts denote significance. Significance accepted at P < 0.05. Values expressed as means ± standard deviation………………………………………………………77 Table 3.3a. Closest bacterial relatives (% similarity) of excised and sequenced bands from the PCR-DGGE of rainbow trout digesta samples from the posterior intestine post 2 week feeding of experimental diets. Presence absence of bands within treatment replicates is indicated in column 2-6. Numbers represent bands present in number of replicates. 0 = not present in any replicate, 5 = present in all five treatment replicates…………………………………..78
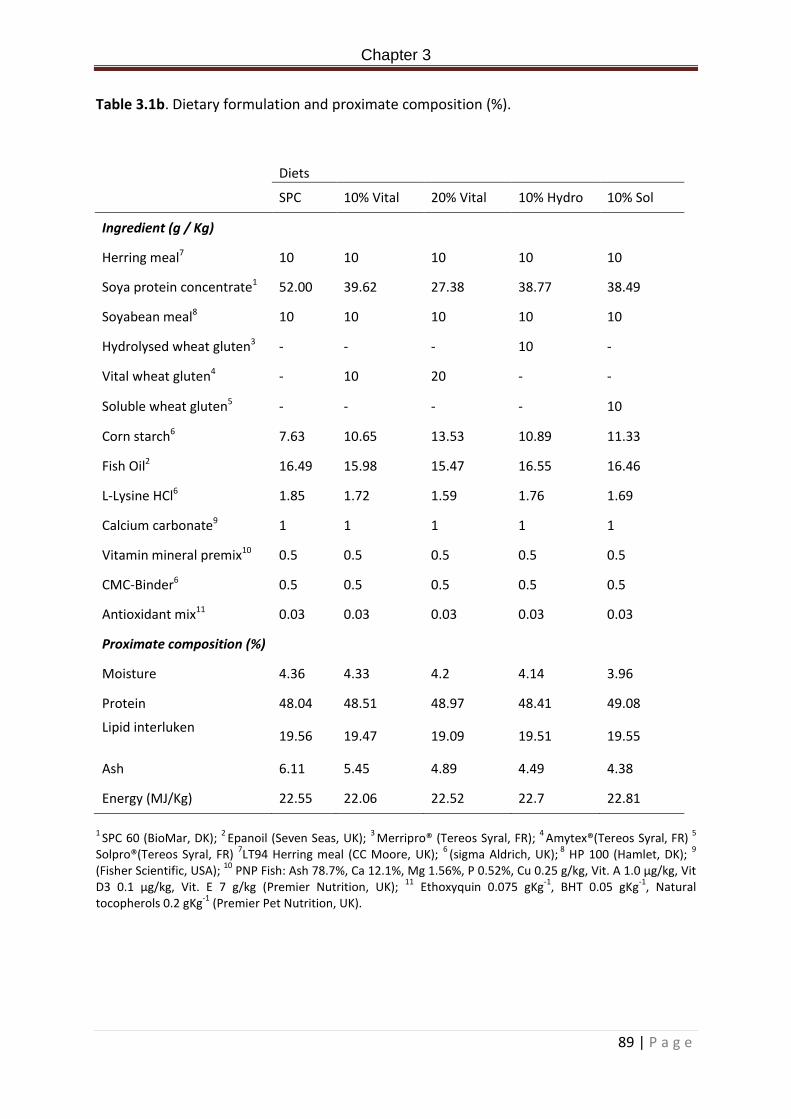
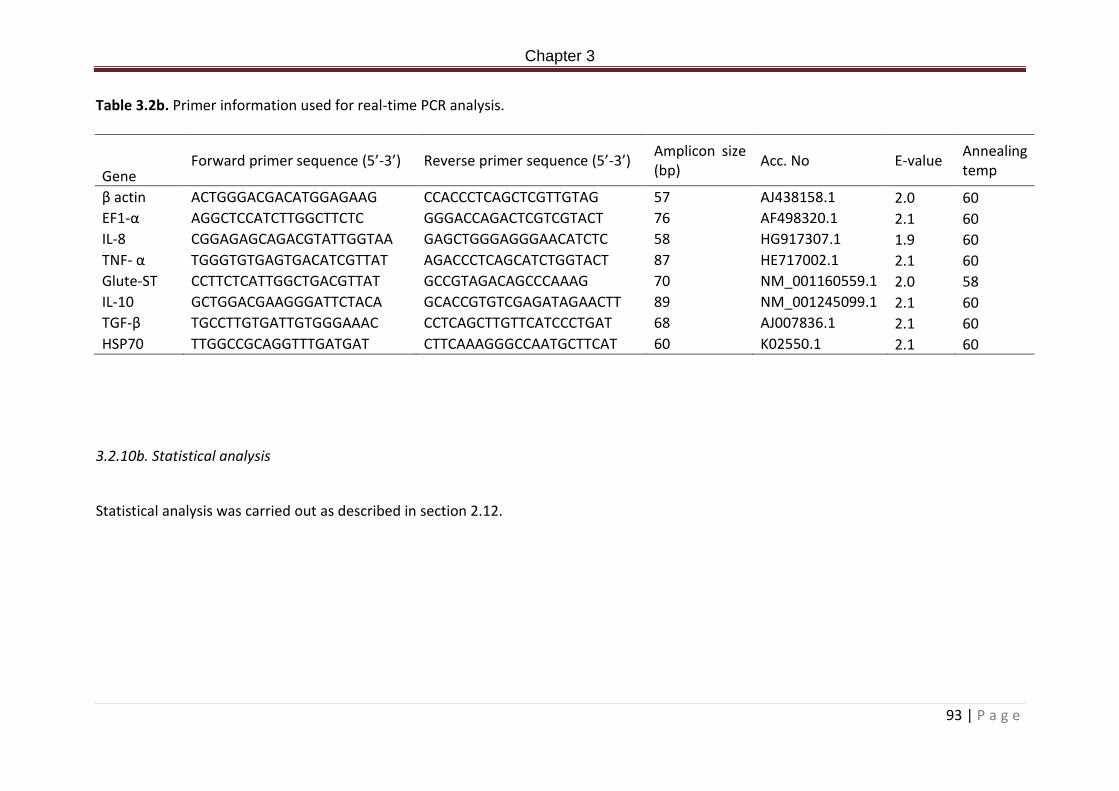
Table 3.1b. Dietary formulation and proximate composition (%)……………………………………….90 Table 3.2b. Primer information used for real-time PCR analysis…………………………………………94
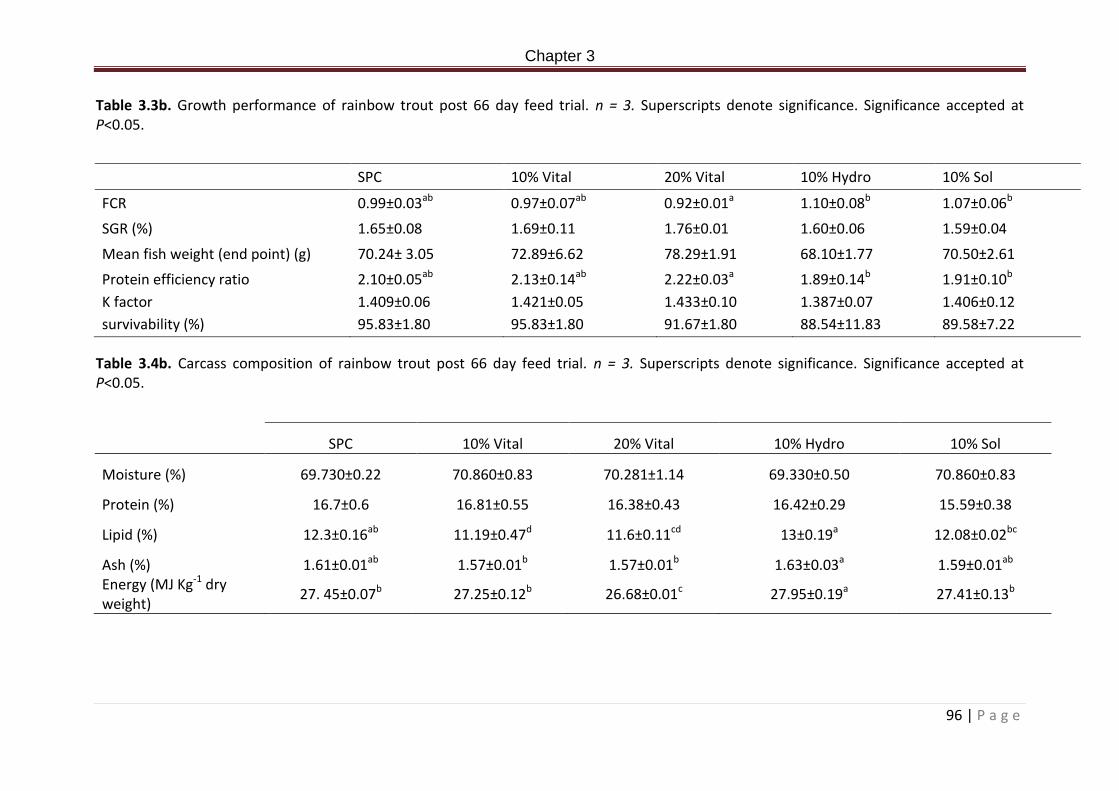
Table 3.3b. Growth performance of rainbow trout post 66 day feed trial. n = 3…………………97
Table 3.4b. Carcass composition of rainbow trout post 66 day feed trial. n = 3………………….97
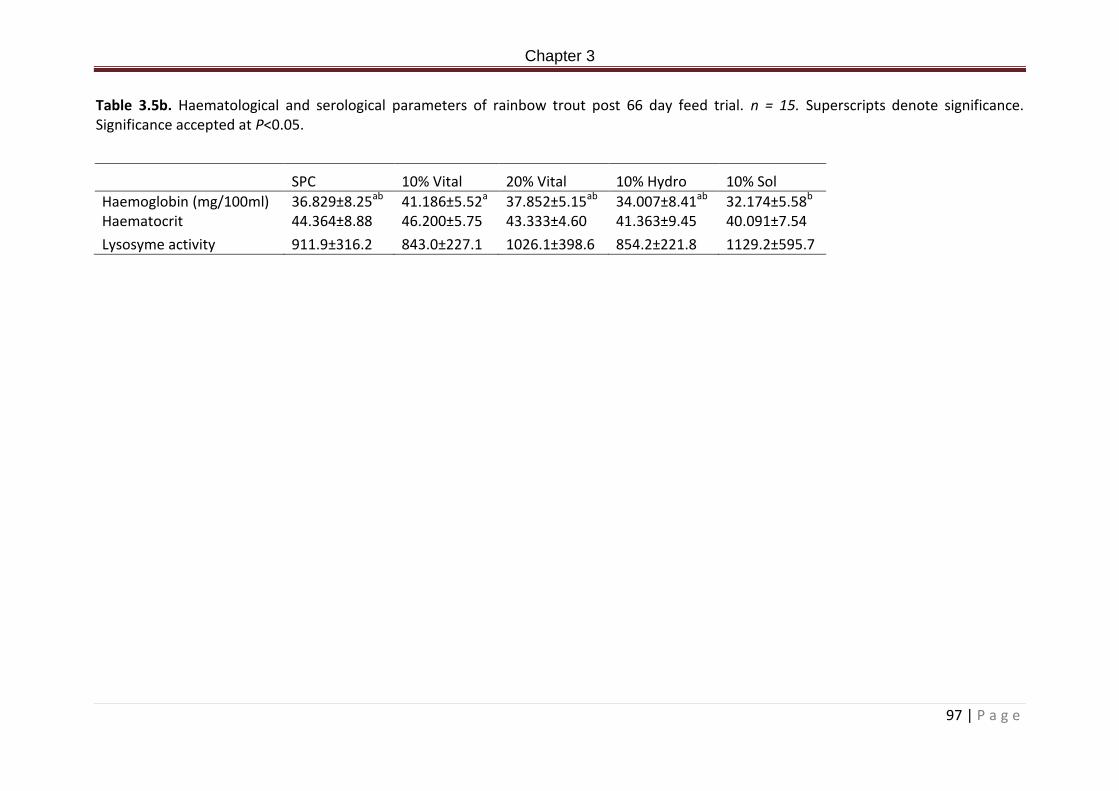
Table 3.5b. Haematological and serological parameters of rainbow trout post 66 day feed trial. n = 15…………………………………………………………………………………………………………………………98 Table 3.6b. High throughput sequencing alpha diversity parameters, goods coverage estimations by treatment and phylogenetic distance of the allochthonous bacterial communities in the posterior intestine of rainbow trout post 66 day feeding trial……………100
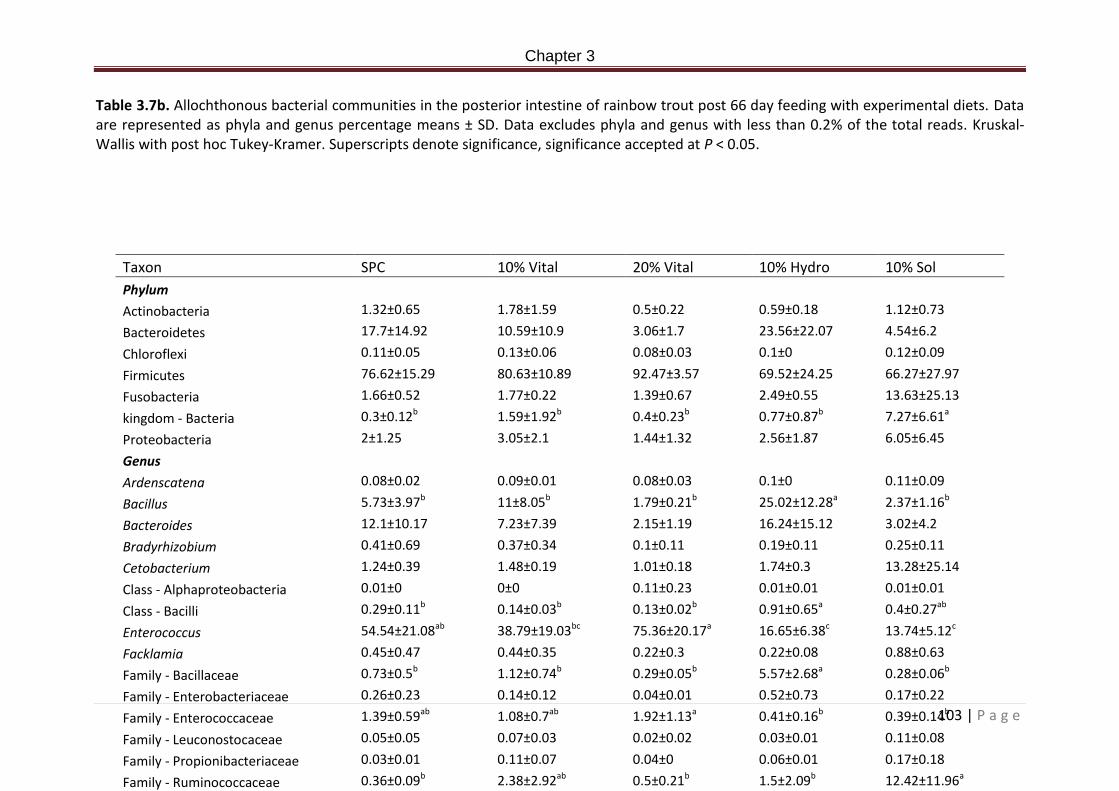
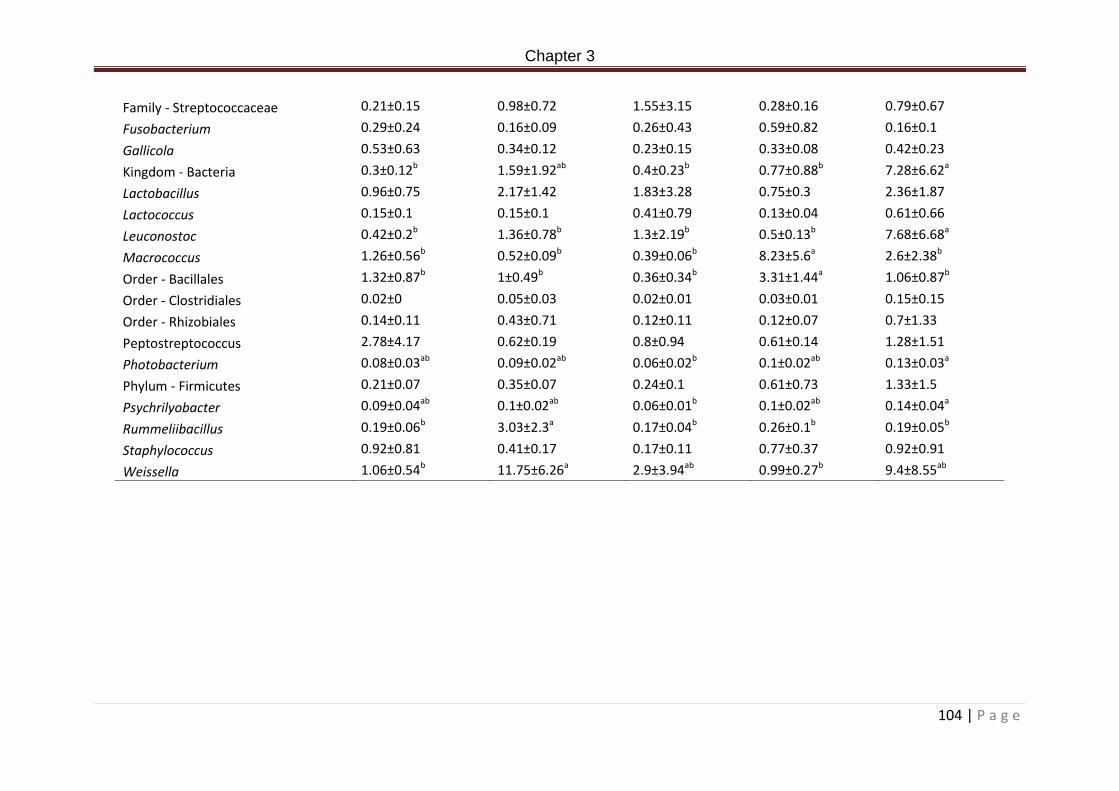
Table 3.7b. Allochthonous bacterial communities in the posterior intestine of rainbow trout post 66 day feeding with experimental diets. Data are represented as phyla and genus percentage means ± SD. Data excludes phyla and genus with less than 0.2% of the total reads. Kruskal-Wallis with post hoc Tukey-Kramer. Superscripts denote significance, significance accepted at P < 0.05………………………………………………………………………………………144
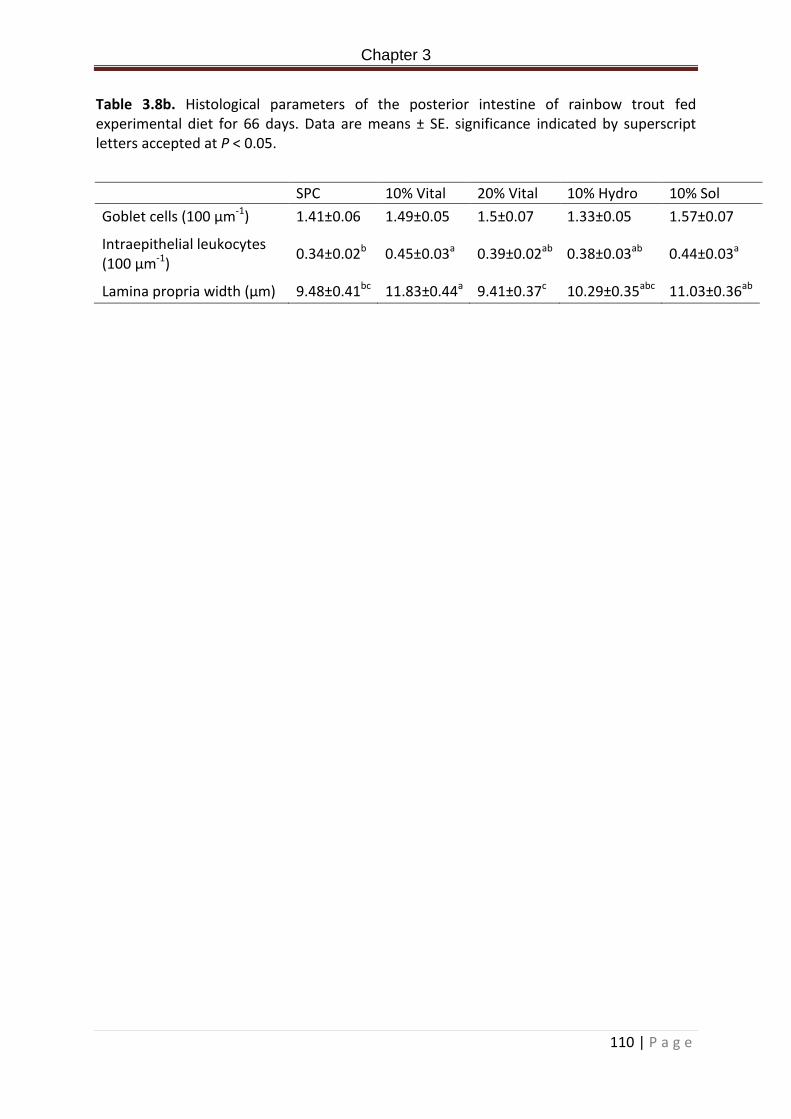
Table 3.8b. Histological parameters of the posterior intestine of rainbow trout fed experimental diet for 66 days. Data are means ± SE. significance indicated by superscript letters accepted at P < 0.05………………………………………………………………………………………………111
XI | P a g e
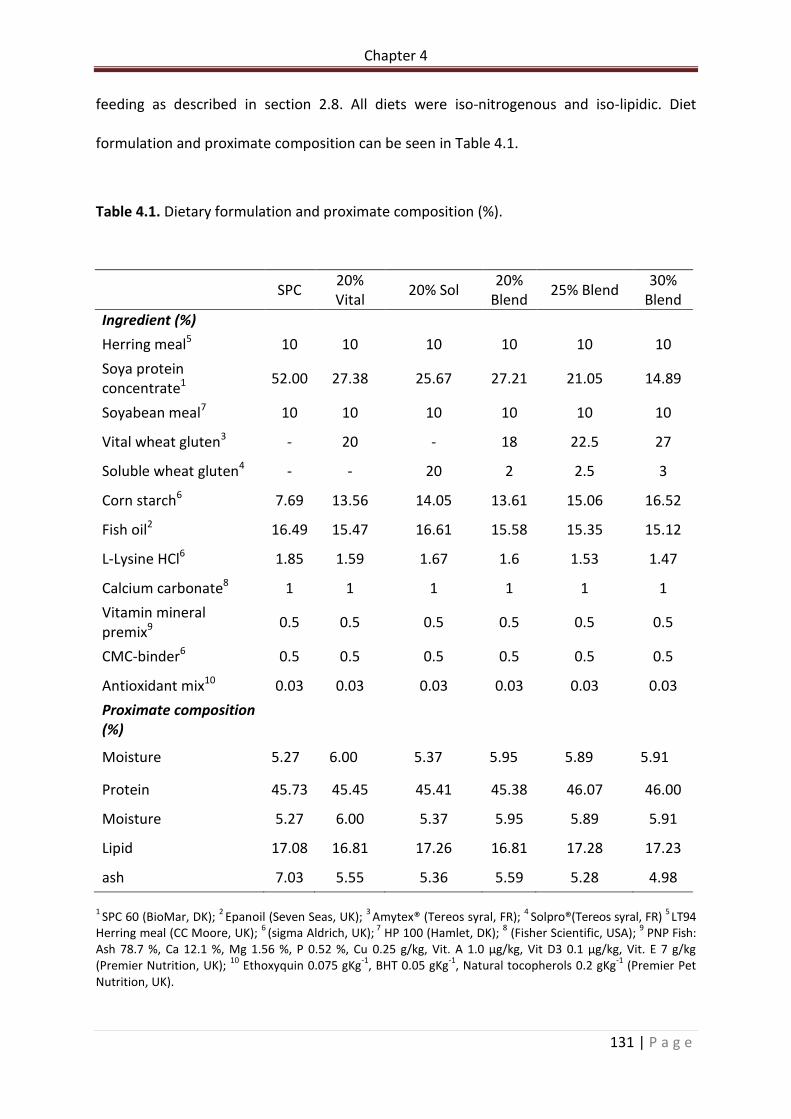
Table 4.1. Dietary formulation and proximate composition (%)……………………………………….132
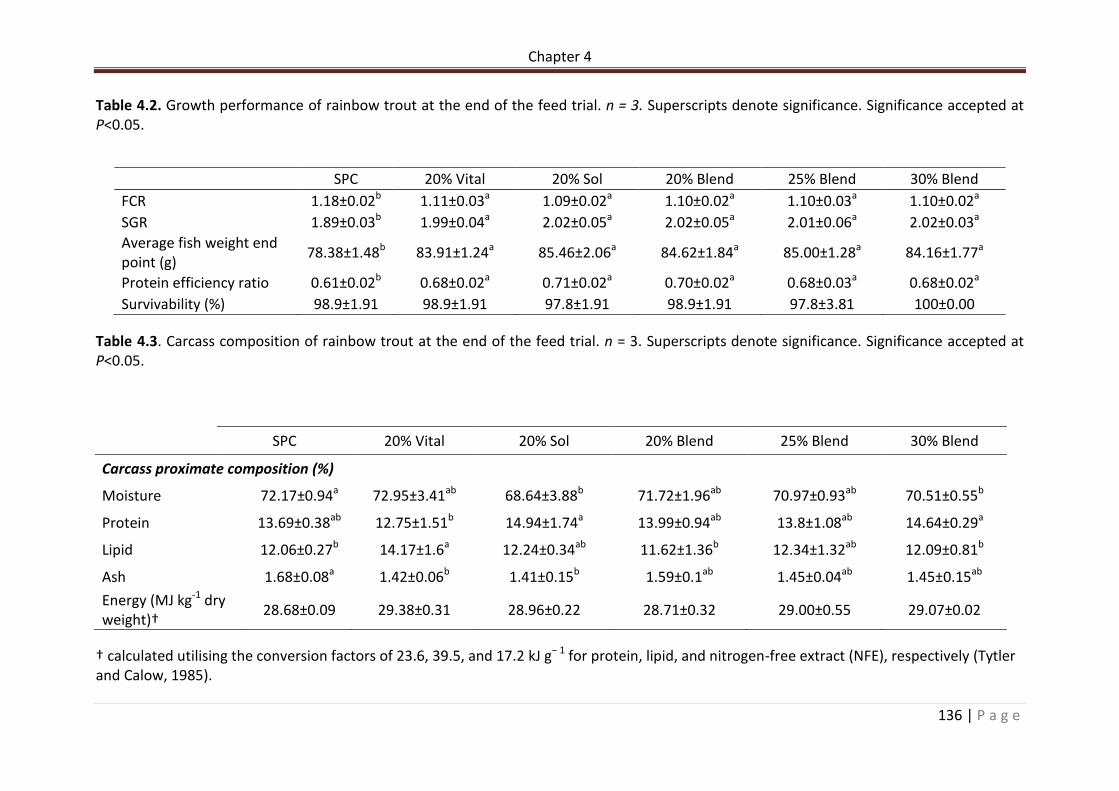
Table 4.2. Growth performance of rainbow trout at the end of the feed trial. n = 3. Superscripts denote significance. Significance accepted at P<0.05……………………………………137
Table 4.3. Carcass composition of rainbow trout at the end of the feed trial. n = 3 Superscripts denote significance. Significance accepted at P<0.05……………………………………137
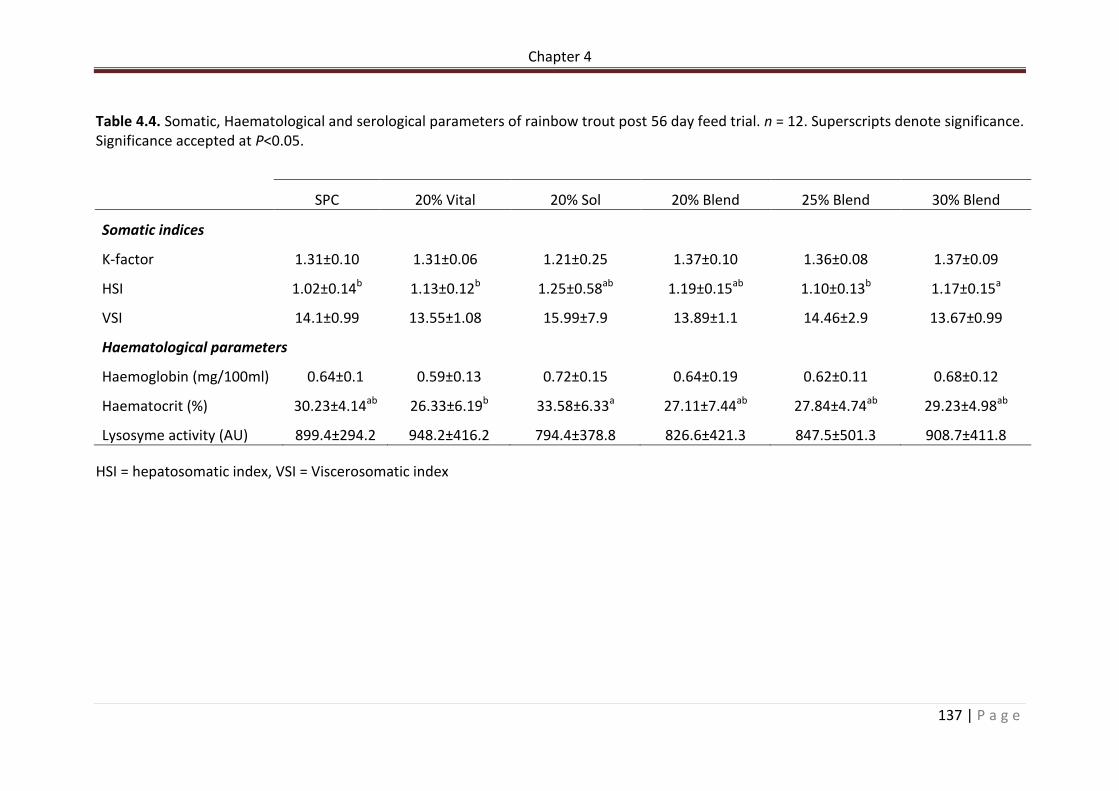
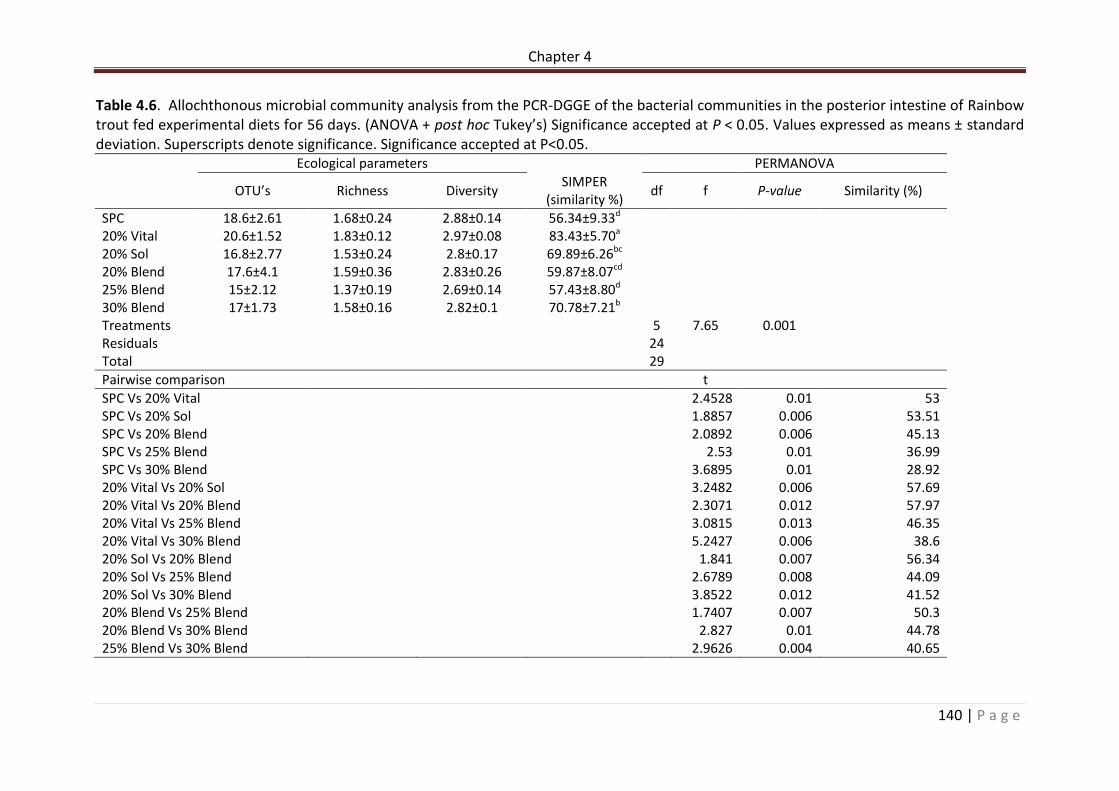
Table 4.4. Somatic, Haematological and serological parameters of rainbow trout post 56 day feed trial. n = 12. Superscripts denote significance. Significance accepted at P<0.05.………………………………………………………………….………………………………………………………….138 Table 4.6. Allochthonous microbial community analysis from the PCR-DGGE of the bacterial communities in the posterior intestine of Rainbow trout fed experimental diets for 56 days. (ANOVA + post hoc Tukey’s) Significance accepted at P < 0.05. Values expressed as means ± standard deviation. Superscripts denote significance. Significance accepted at P<0.05………………………………………………………………………………………………………..…………………….141
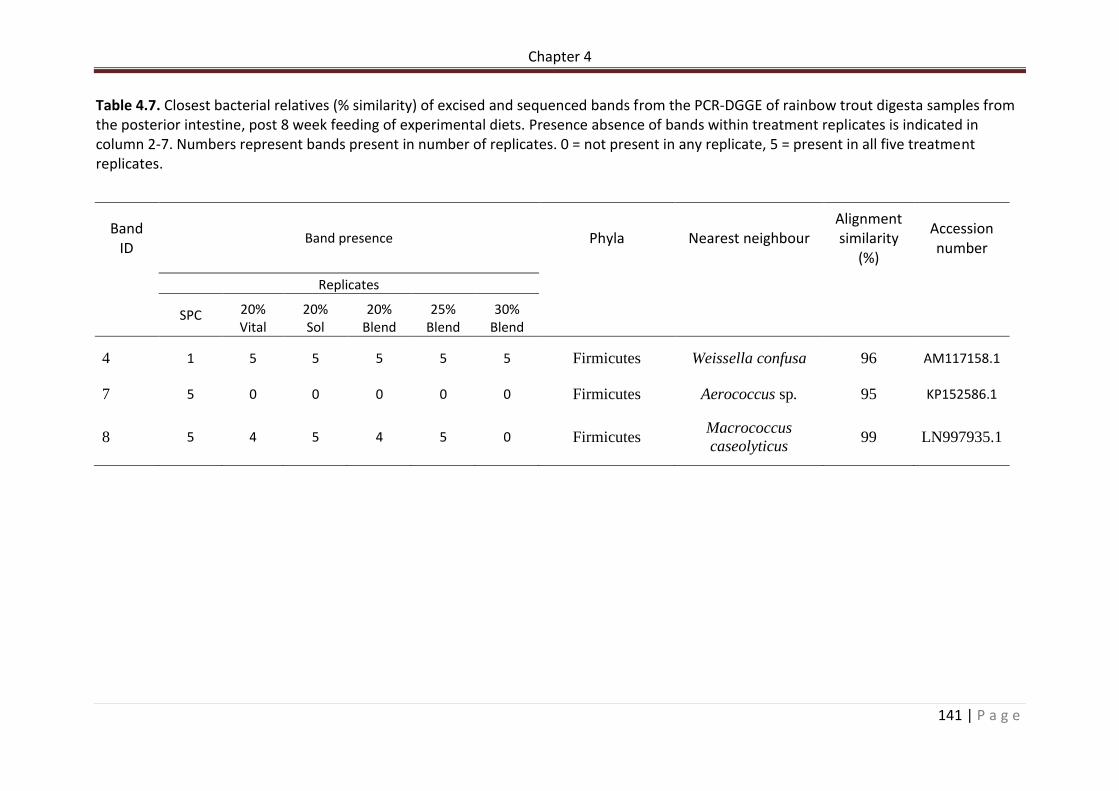
Table 4.7. Closest bacterial relatives (% similarity) of excised and sequenced bands from the PCR-DGGE of rainbow trout digesta samples from the posterior intestine, post 8 week feeding of experimental diets. Presence absence of bands within treatment replicates is indicated in column 2-7. Numbers represent bands present in number of replicates. 0 = not present in any replicate, 5 = present in all five treatment replicates…………………………………142
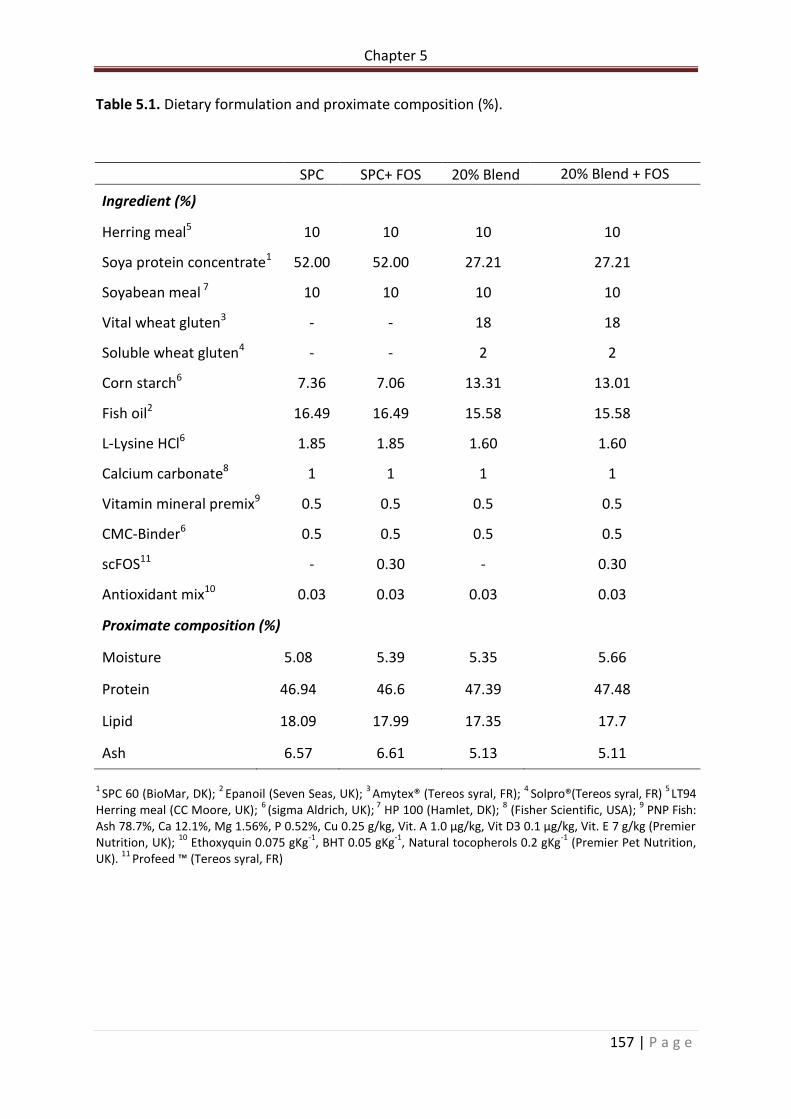
Table 5.1. Dietary formulation and proximate composition (%)……………………………………….158
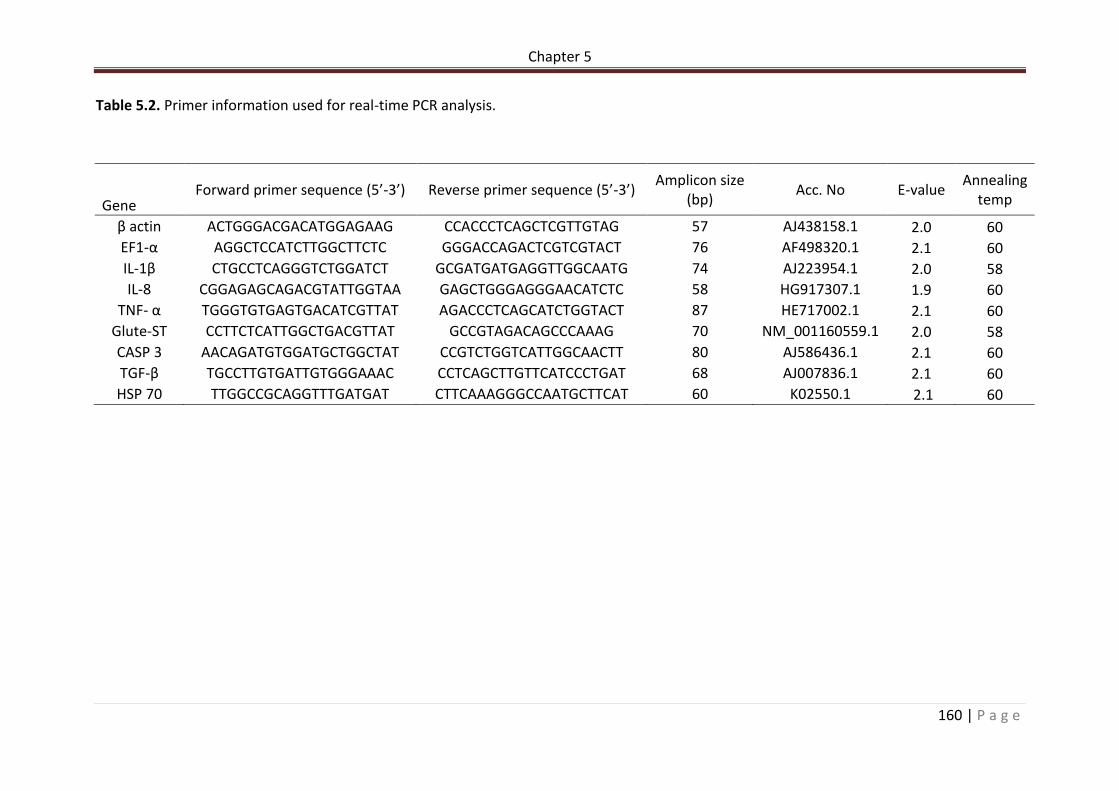
Table 5.2. Primer information used for real-time PCR analysis…………………………………………161
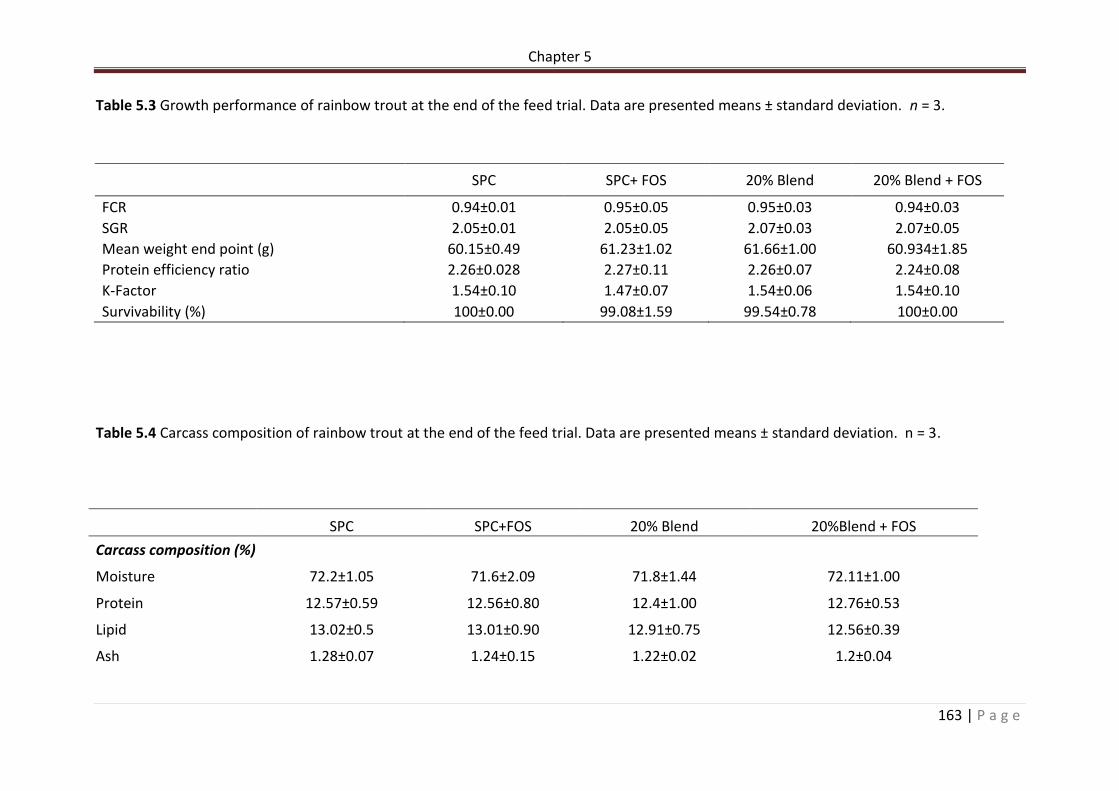
Table 5.3 Growth performance of rainbow trout at the end of the feed trial. Data are presented means ± standard deviation. n = 3………………………………………………………………….164
Table 5.4 Carcass composition of rainbow trout at the end of the feed trial. Data are presented means ± standard deviation. n = 3…………………………………………………………………164
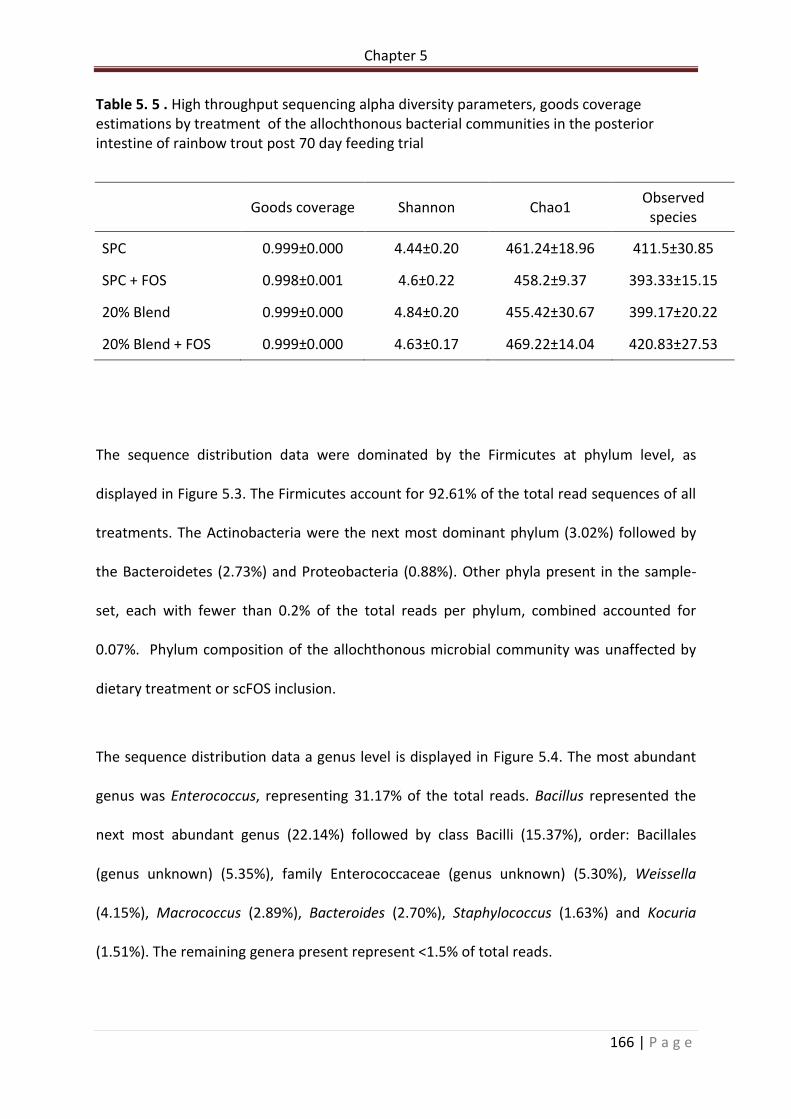
Table 5.5 . High throughput sequencing alpha diversity parameters, goods coverage estimations by treatment of the allochthonous bacterial communities in the posterior intestine of rainbow trout post 70 day feeding trial…………………………………………………………167
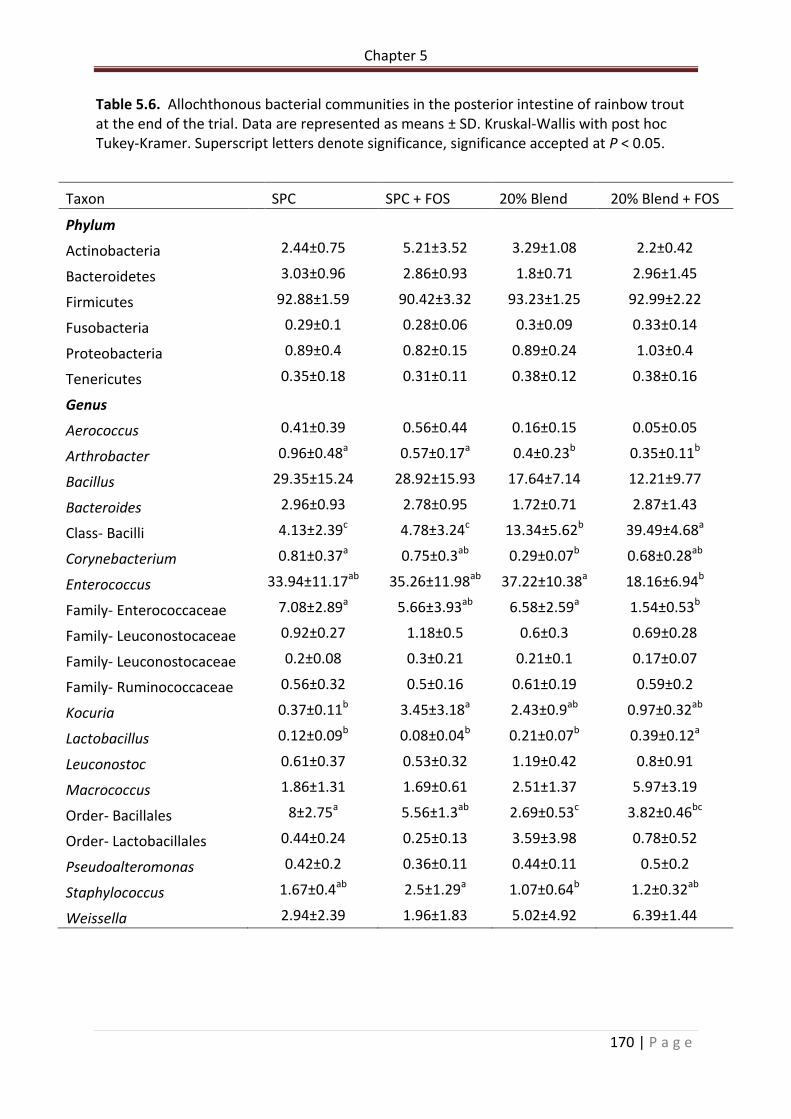
Table 5.6. Allochthonous bacterial communities in the posterior intestine of rainbow trout at the end of the trial. Data are represented as means ± SD. Kruskal-Wallis with post hoc Tukey-Kramer. Superscript letters denote significance, significance accepted at P < 0.05…………………………………………………………………..……………………………………………………………..171
XII | P a g e
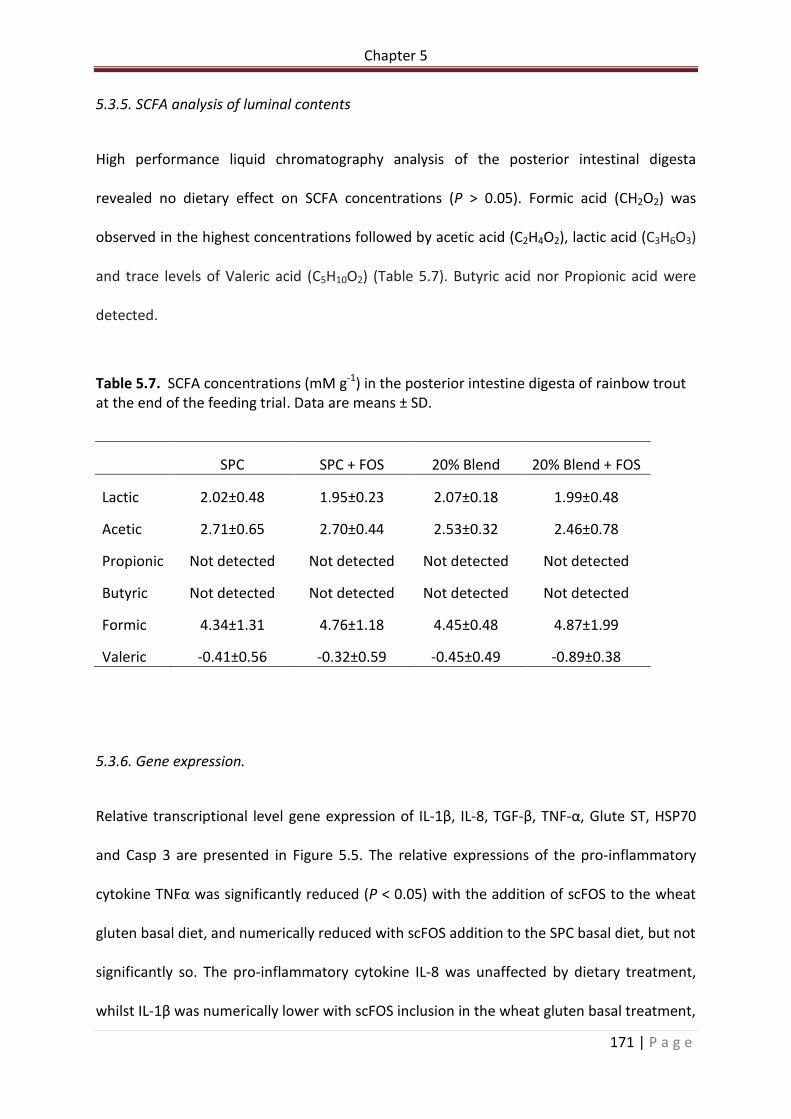
Table 5.7. SCFA concentrations (mM g-1) in the posterior intestine digesta of rainbow trout at the end of the feeding trial. Data are means ± SD………………………………………………………...172
List of figures
Figure 1.1. Aquaculture and capture fisheries contribution to global fish production. Source: FAO (2014)……………………………………………………………………………...............……………………………………….2
Figure 1.2.Percentage nutrient sources utilised in Norwegian aquaculture 1990 – 2013. Taken from Ytrestøyl et al. (2015)…………………………………………………………………………………………8
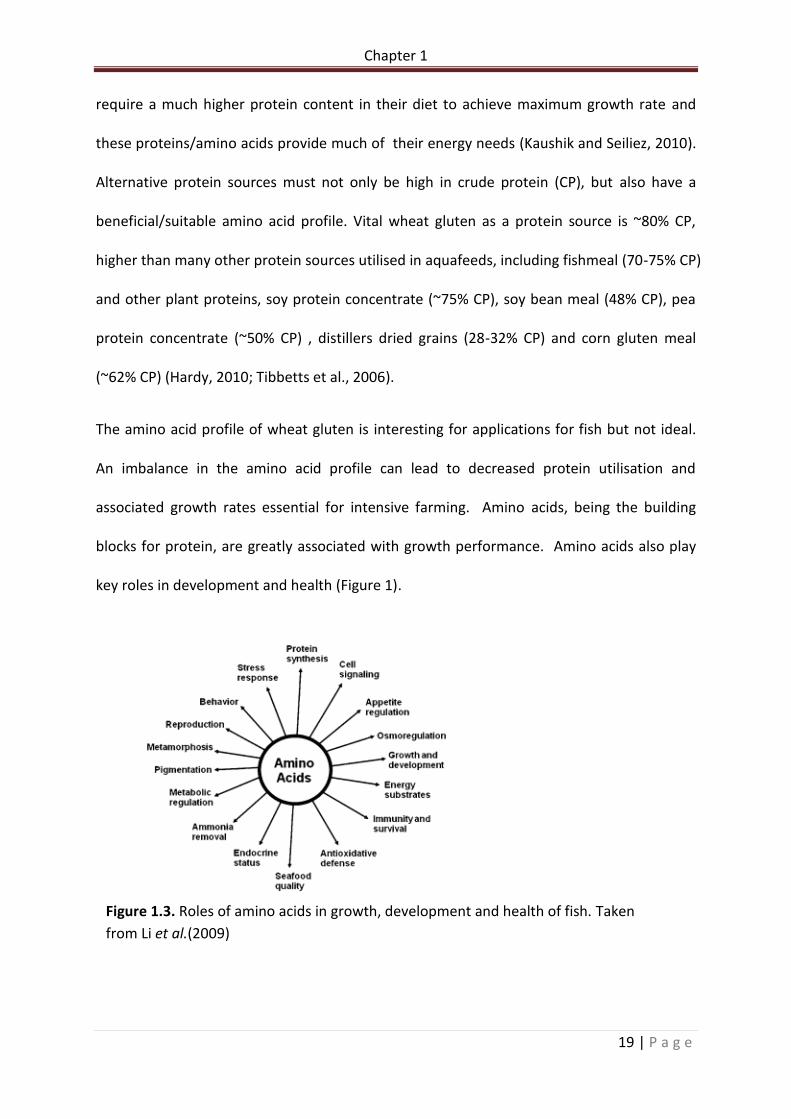
Figure 1.3. Roles of amino acids in growth, development and health of fish. Taken from Li et al.(2009)……………………………………………………………………………………………………………………………..19
Figure 2.1. System design highlighting UV water treatment and mechanical swirl-filters. Red arrows indicate direction of water travel utilised for the mixing of the 2 otherwise independent systems………………………………………………………………………………………………………….44
Figure 2.2. Illustration of sampling processes. A) Removal of the intestinal tract from sampled animal. a; Pyloric ceca. b; Thickening of intestinal tract identifying change from anterior to posterior regions. c; Anterior intestinal region. d; Posterior intestinal region. B) Excised sample locations. e; Area discarded. f; Light microscopy. g; Scanning electron microscopy. h; Gene expression………………………………………………………………………………………...48
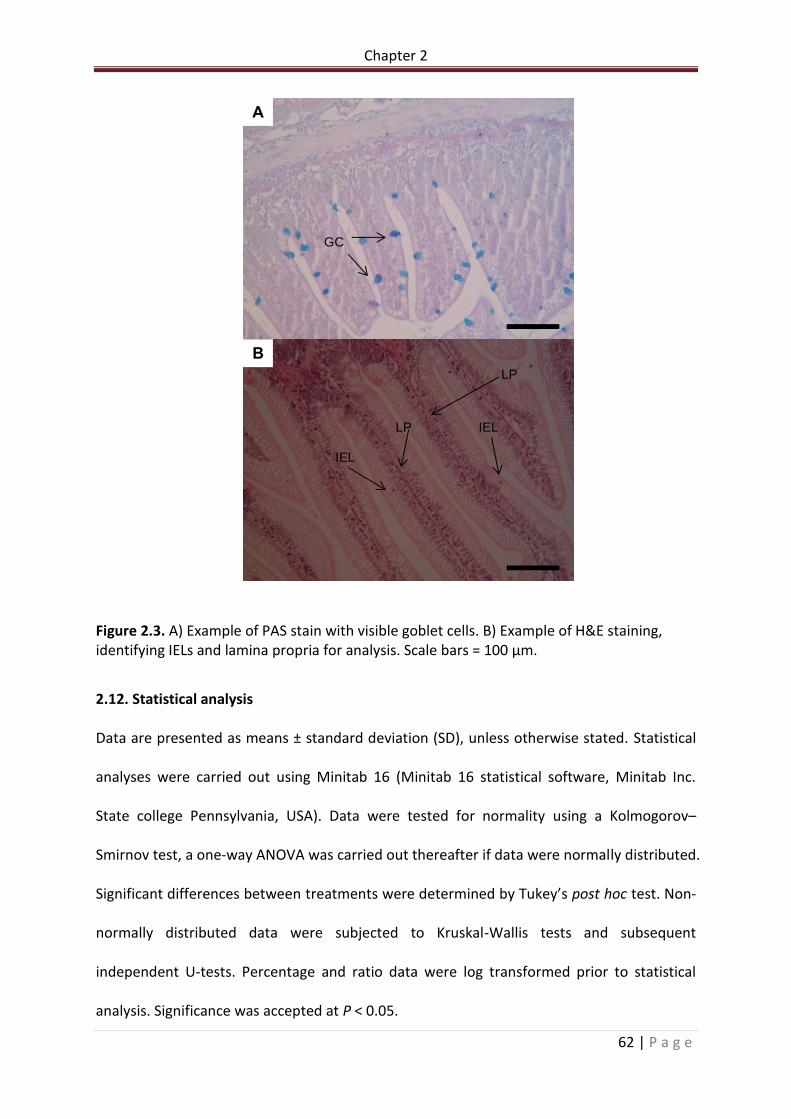
Figure 2.3. A) Example of PAS stain with visible goblet cells. B) Example of H&E staining, identifying IELs and lamina propria for analysis. Scale bars = 100 µm…………………………………63
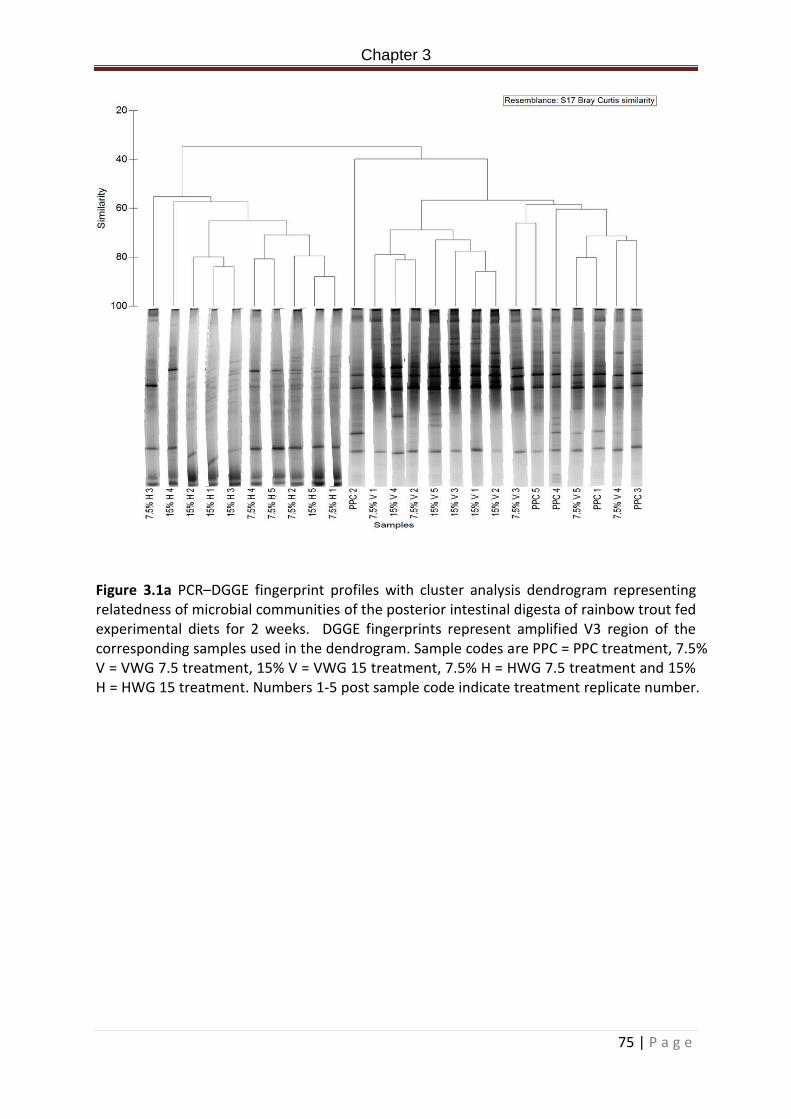
Figure 3.1a PCR–DGGE fingerprint profiles with cluster analysis dendrogram representing relatedness of microbial communities of the posterior intestinal digesta of rainbow trout fed experimental diets for 2 weeks. DGGE fingerprints represent amplified V3 region of the corresponding samples used in the dendrogram. Sample codes are PPC = PPC treatment, 7.5 % V = VWG 7.5 treatment, 15% V = VWG 15 treatment, 7.5% H = HWG 7.5 treatment and 15% H = HWG 15 treatment. Numbers 1-5 post sample code indicate treatment replicate number………………………………………………………………………………………………………………………………76
Figure 3.2a. SEM images of posterior intestine post two week short exposure to experimental diets. A. SPC, scale bar represents 10 µm. B. VWG 7.5, scale bar represents 5 µm. C. VWG 15, scale bar represents 10 µm. D. HWG 7.5, scale bar represents 10 µm. E. HWG 15, scale bar represents 5 µm……………………………………………………………………………………80
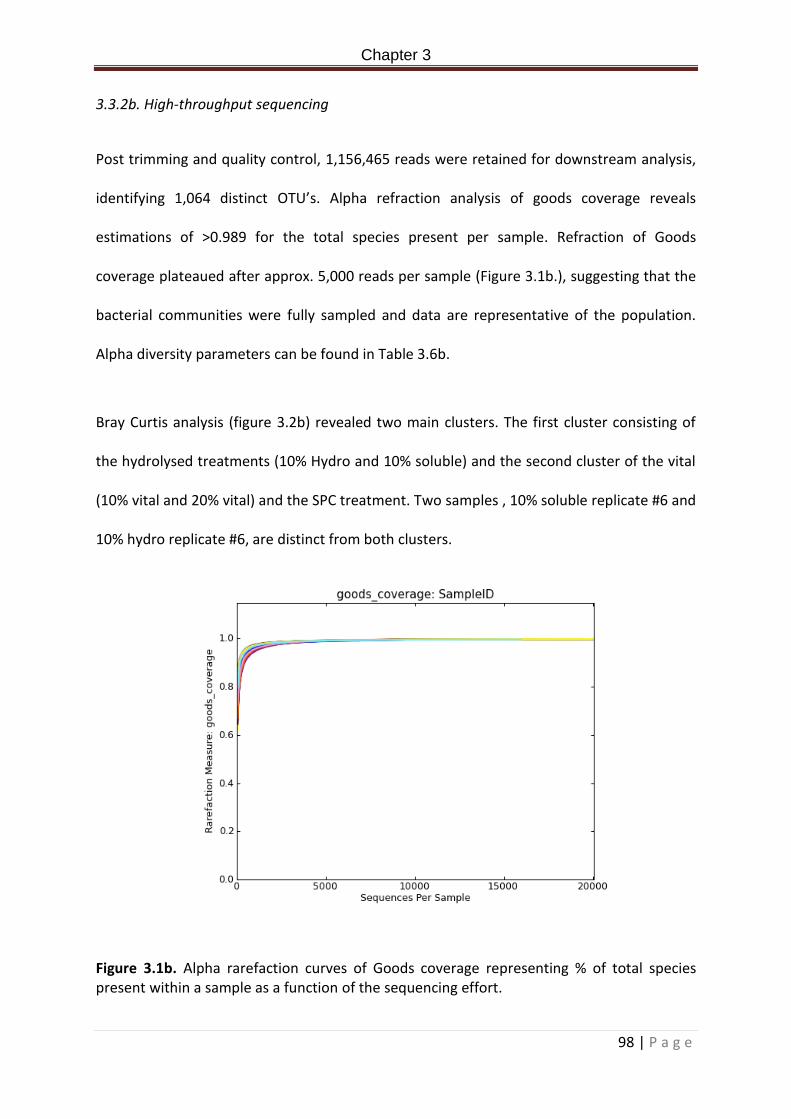
Figure 3.1b. Alpha refraction curves of Goods coverage representing % of total species present within a sample as a function of the sequencing effort……………………………………….…99
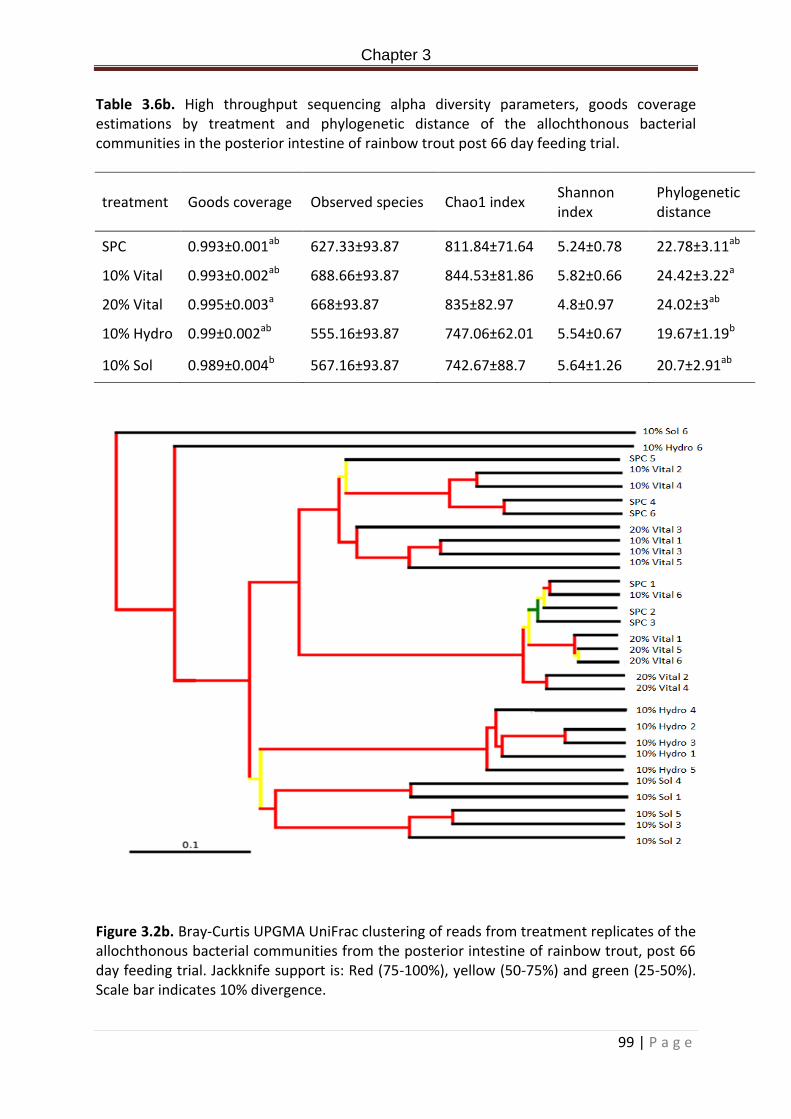
Figure 3.2b. Bray-Curtis UPGMA UniFrac clustering of reads from treatment replicates of the allochthonous bacterial communities from the posterior intestine of rainbow trout, post 66
XIII | P a g e
day feeding trial. Jackknife support is: Red (75-100%), yellow (50-75%) and green (25-50%). Scale bar indicates 10% divergence………………………………………………………………………………….100
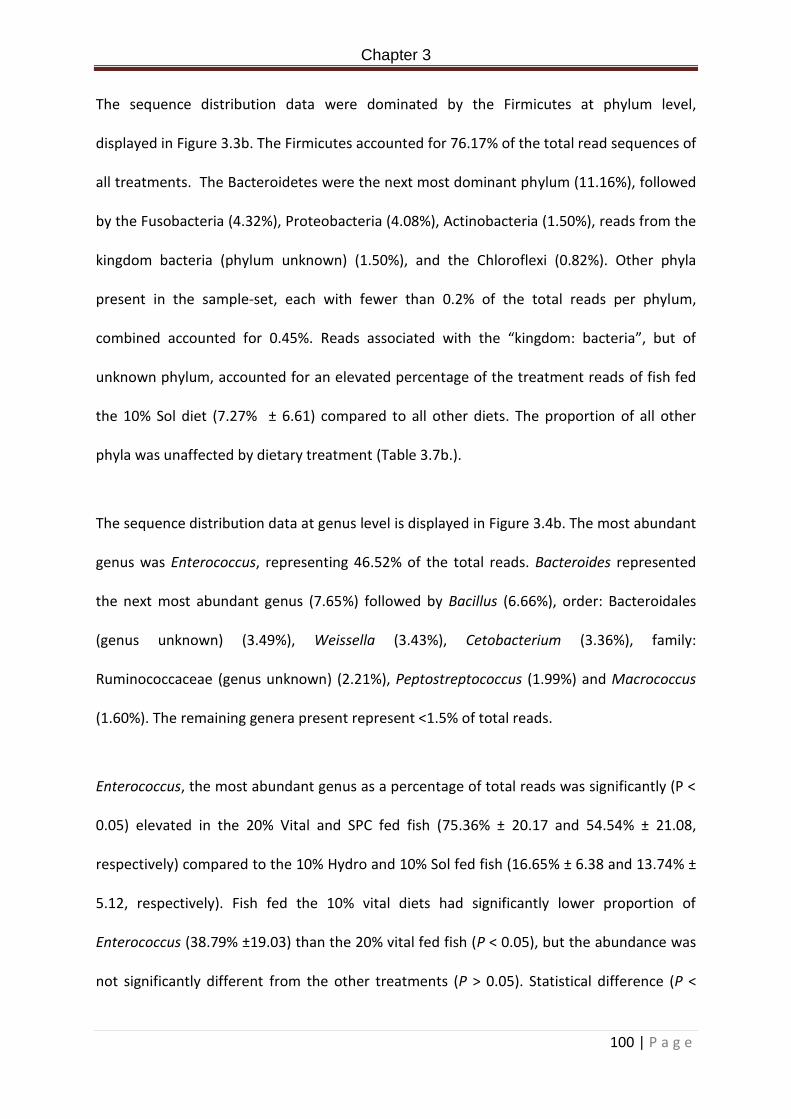
Figure 3.3b. Allochthonous bacterial communities in the posterior intestine of rainbow trout post 66 day feeding with experimental diets. Data are represented as bacterial phyla percentage. Data excludes phyla with less than 0.2% of the total reads ……………………..…..102
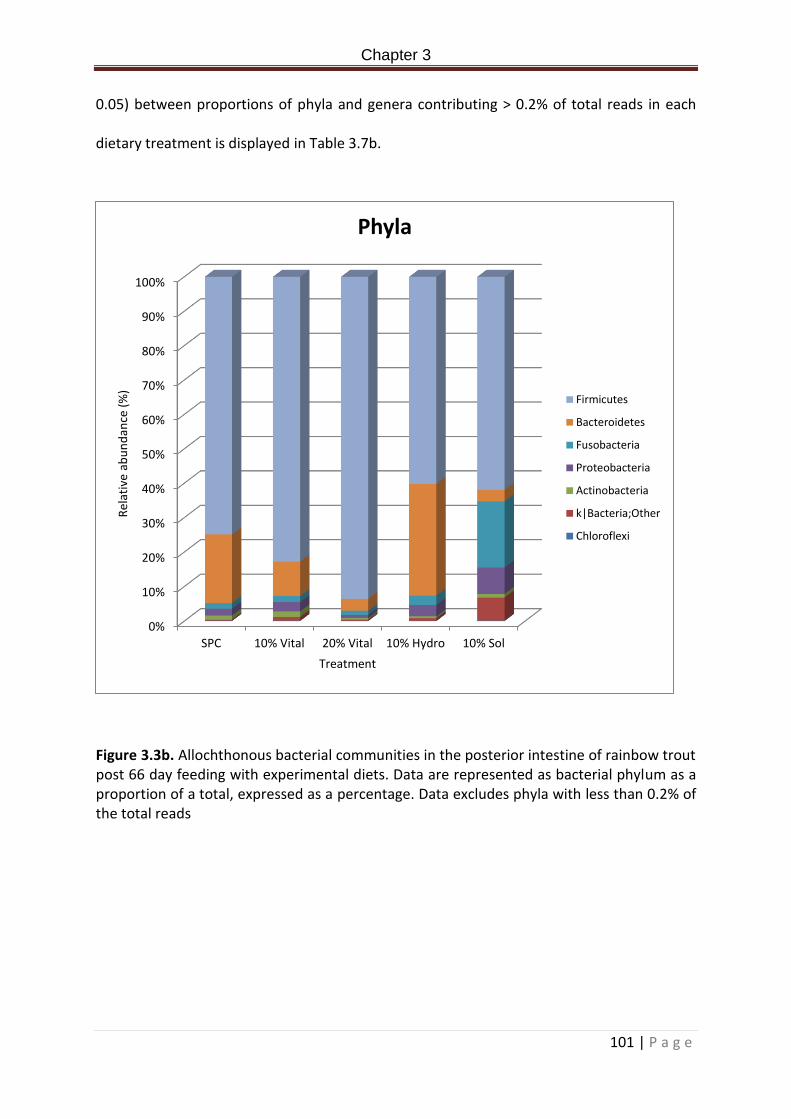
Figure 3.4b. Allochthonous bacterial communities in the posterior intestine of rainbow trout post 66 day feeding with experimental diets. Data are represented as bacterial Genus percentage. Data excludes genera with fewer than 0.2% of the total reads……………………..103
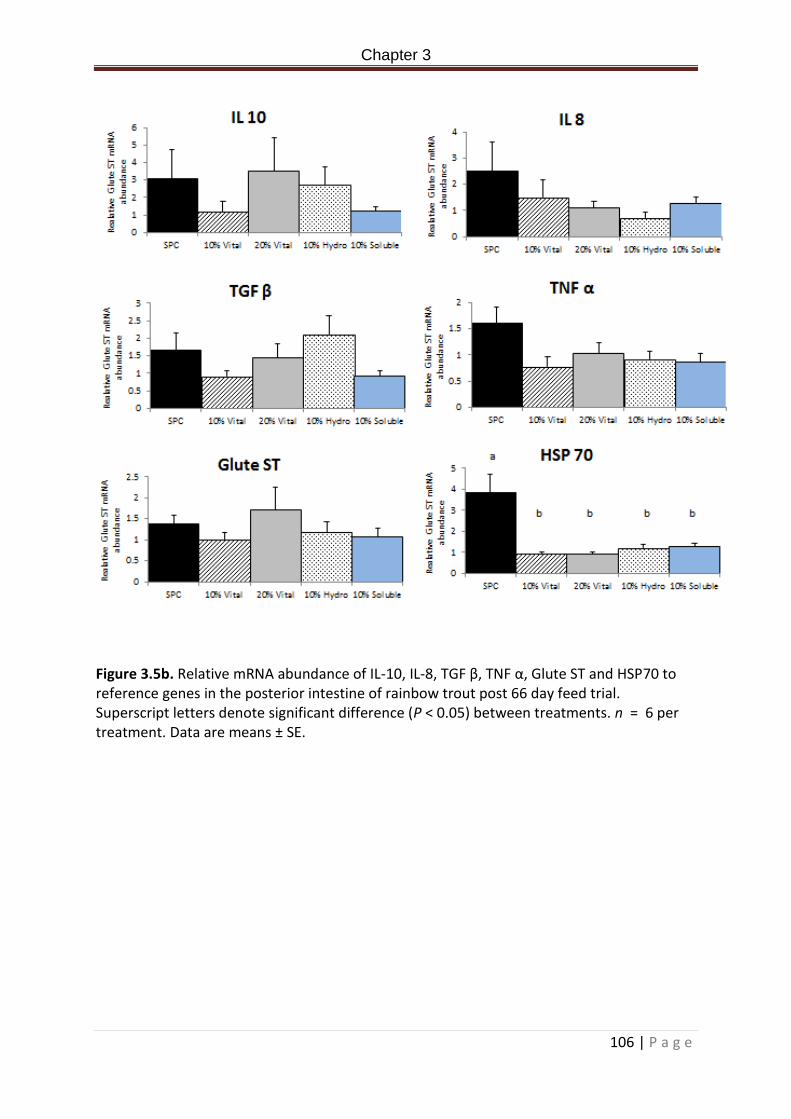
Figure 3.5b. Relative mRNA abundance of IL-10, IL-8, TGF β, TNF α, Glute ST and HSP70 in the posterior intestine of rainbow trout post 66 day feed trial. Superscript letters denote significant difference (P < 0.05) between treatments. n = 6 per treatment. Data are means ± SE…………………………………………………………………………………………………………………………………..107
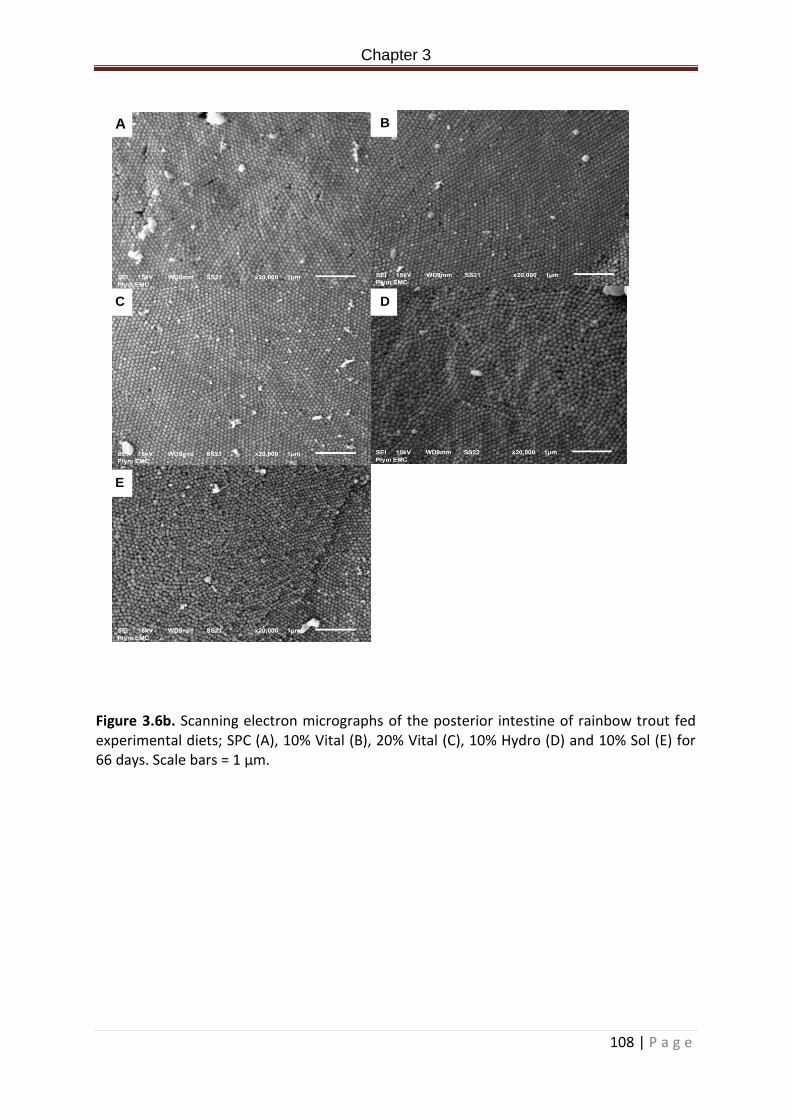
Figure 3.6b. Scanning electron micrographs of the posterior intestine of rainbow trout fed experimental diets; SPC (A), 10% Vital (B), 20% Vital (C), 10% Hydro (D) and 10% Sol (E) for 66 days. Scale bars = 1 µm………………………………………………………………………………………..………109
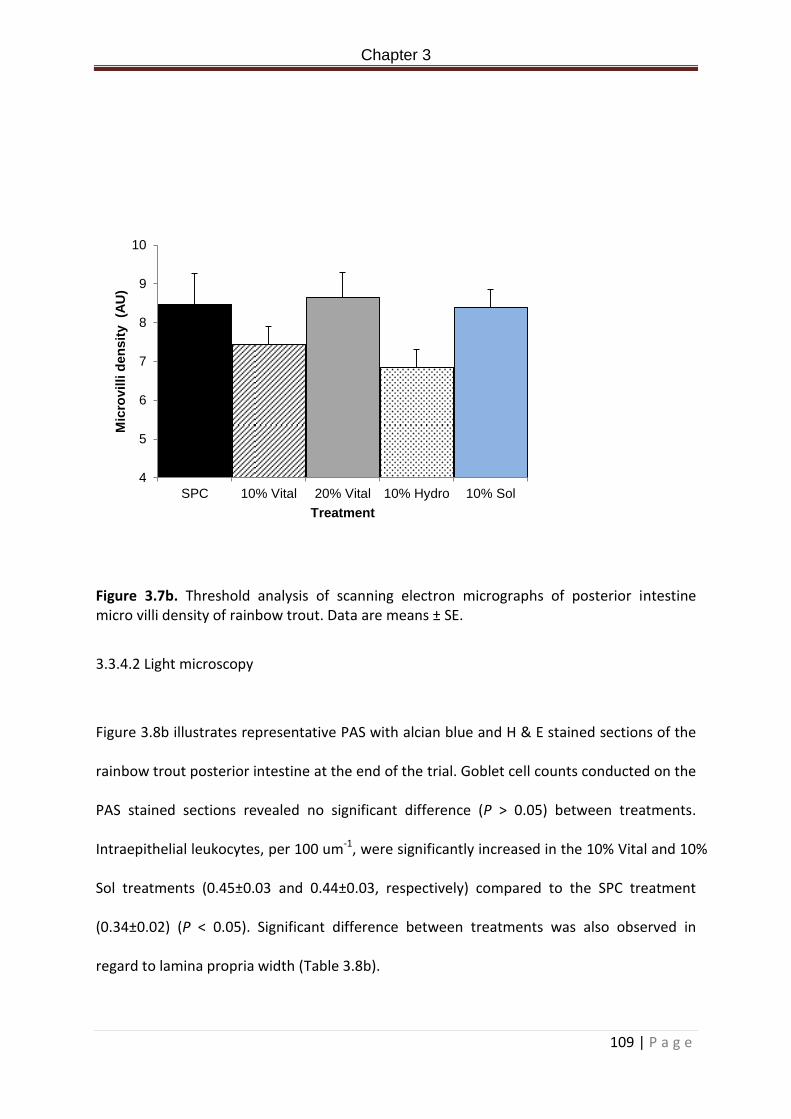
Figure 3.7b. Threshold analysis of scanning electron micrographs of posterior intestine micro villi density of rainbow trout. Data are means ± SE………………………………………………...110
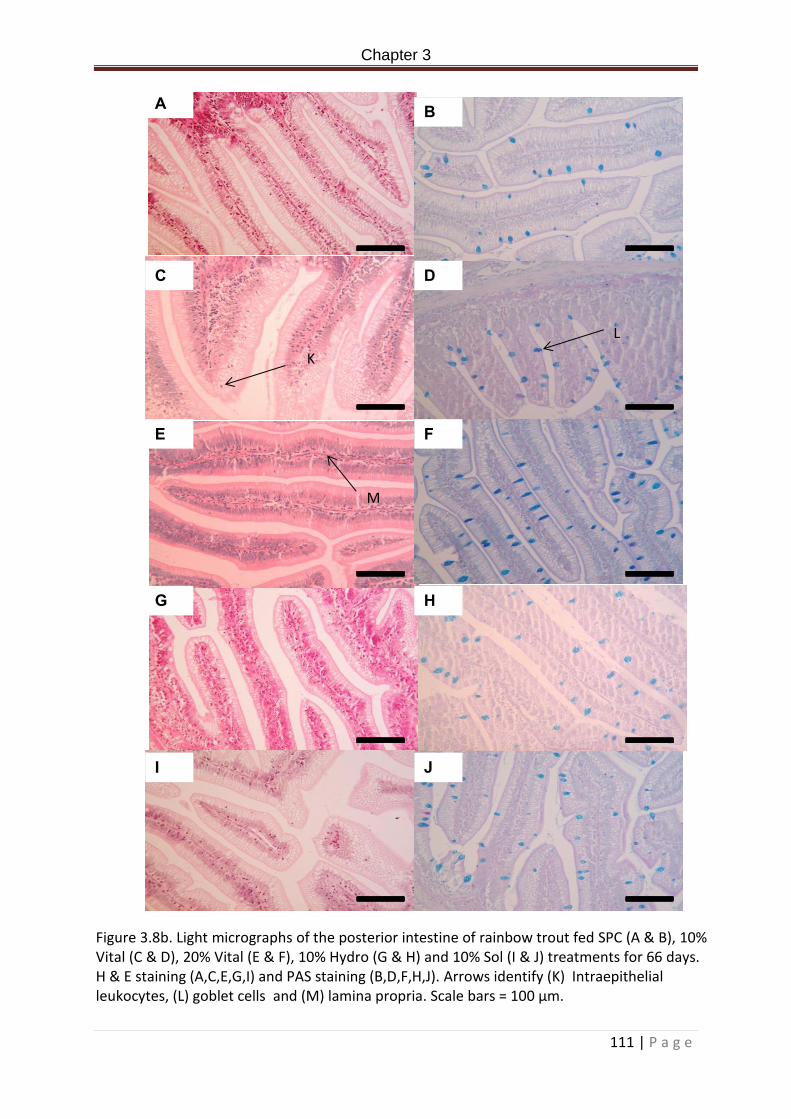
Figure 3.8b. Light micrographs of the posterior intestine of rainbow trout fed SPC (A & B), 10 % Vital (C & D), 20% Vital (E & F), 10% Hydro (G & H) and 10% Sol (I & J) treatments for 66 days. H & E staining (A,C,E,G,I) and PAS staining (B,D,F,H,J). Scale bars = 100 µm……………………………………………………………………………………………………………………………….…..112
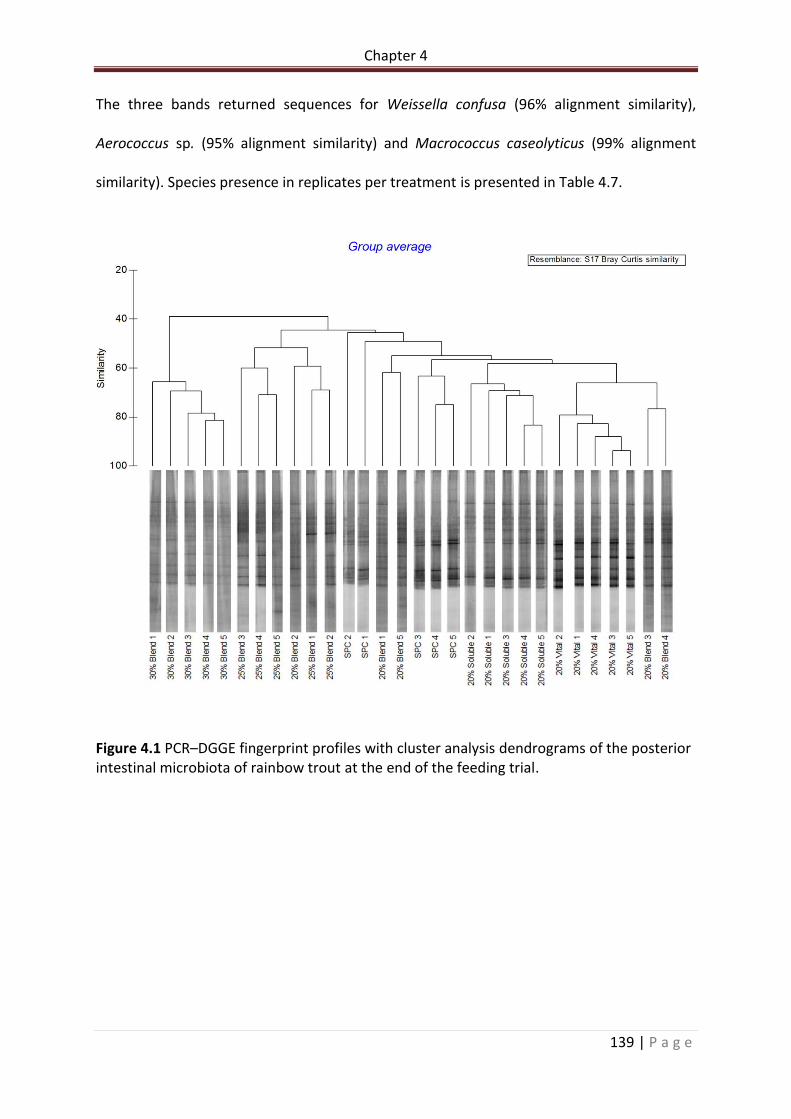
Figure 4.1 PCR–DGGE fingerprint profiles with cluster analysis dendrograms of the posterior intestinal microbiota of rainbow trout at the end of the feeding trial……………………………….140
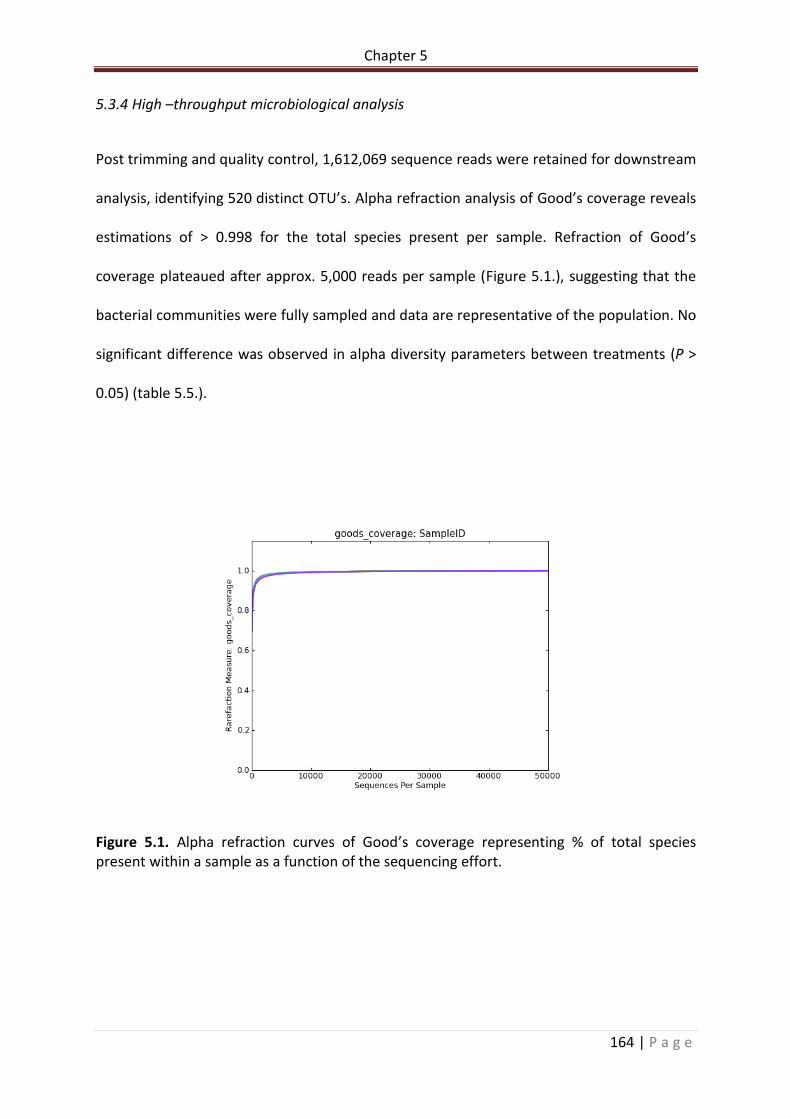
Figure 5.1. Alpha refraction curves of Good’s coverage representing % of total species present within a sample as a function of the sequencing effort………………………………………..165
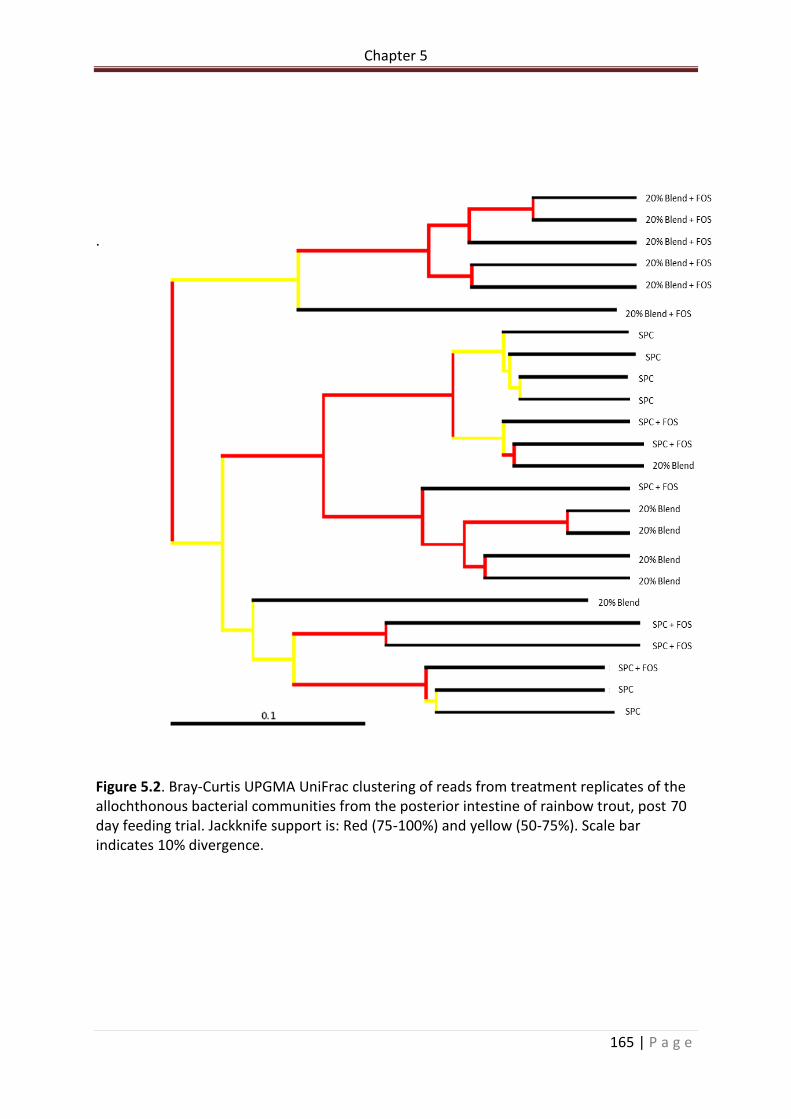
Figure 5.2. Bray-Curtis UPGMA UniFrac clustering of reads from treatment replicates of the allochthonous bacterial communities from the posterior intestine of rainbow trout, post 70 day feeding trial. Jackknife support is: Red (75-100%) and yellow (50-75%). Scale bar indicates 10% divergence………………………………………………………………………………………………….166
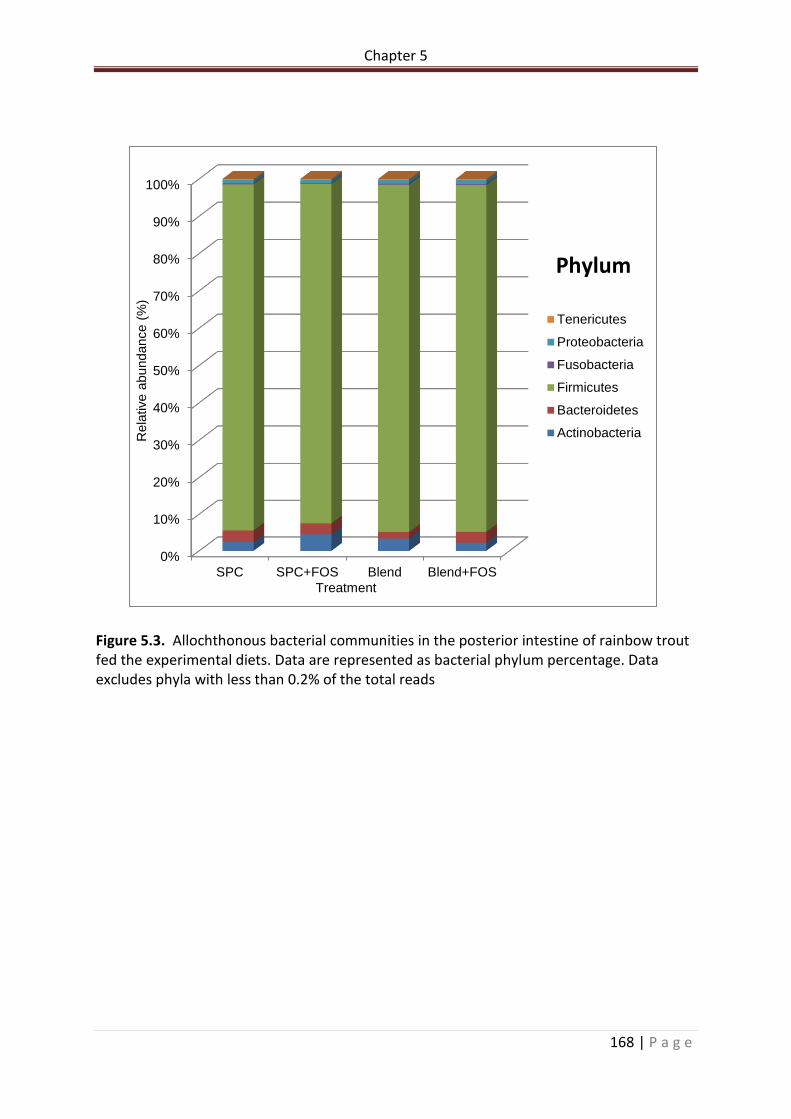
Figure 5.3. Allochthonous bacterial communities in the posterior intestine of rainbow trout fed the experimental diets. Data are represented as bacterial phyla percentage. Data excludes phyla with less than 0.2% of the total reads……………………………………………………….169
XIV | P a g e
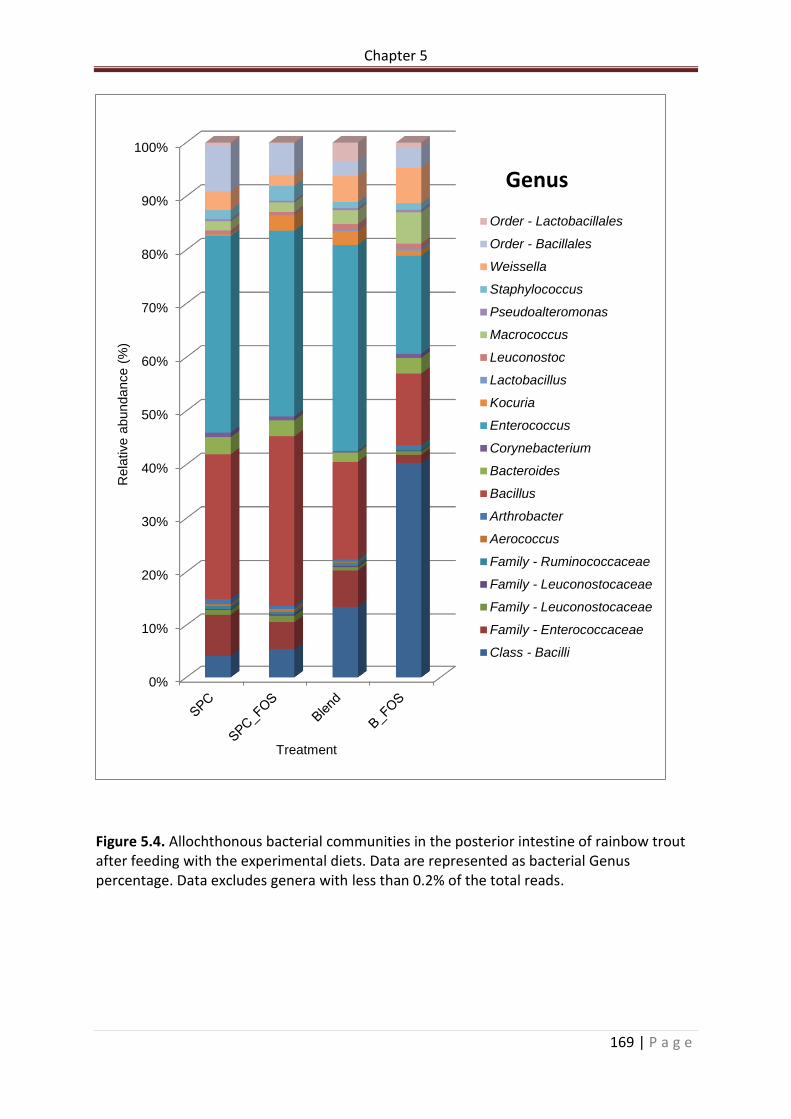
Figure 5.4. Allochthonous bacterial communities in the posterior intestine of rainbow trout after feeding with the experimental diets. Data are represented as bacterial Genus percentage. Data excludes genera with less than 0.2% of the total reads…………………………170
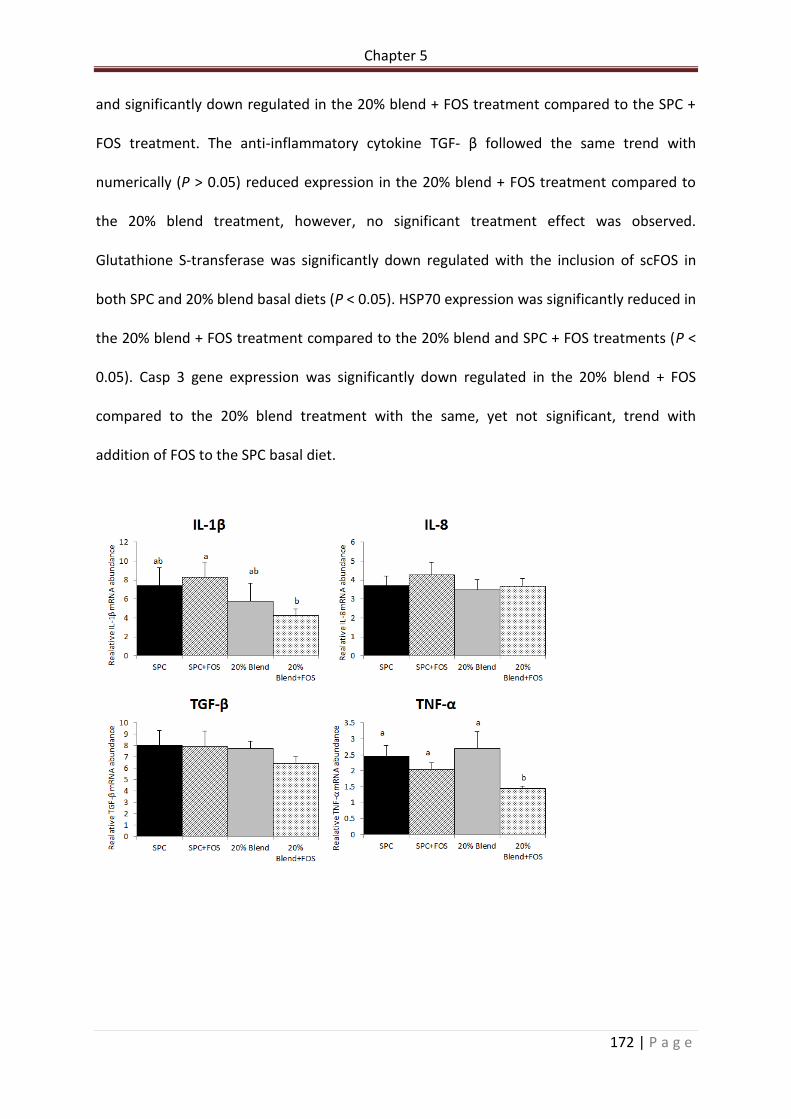
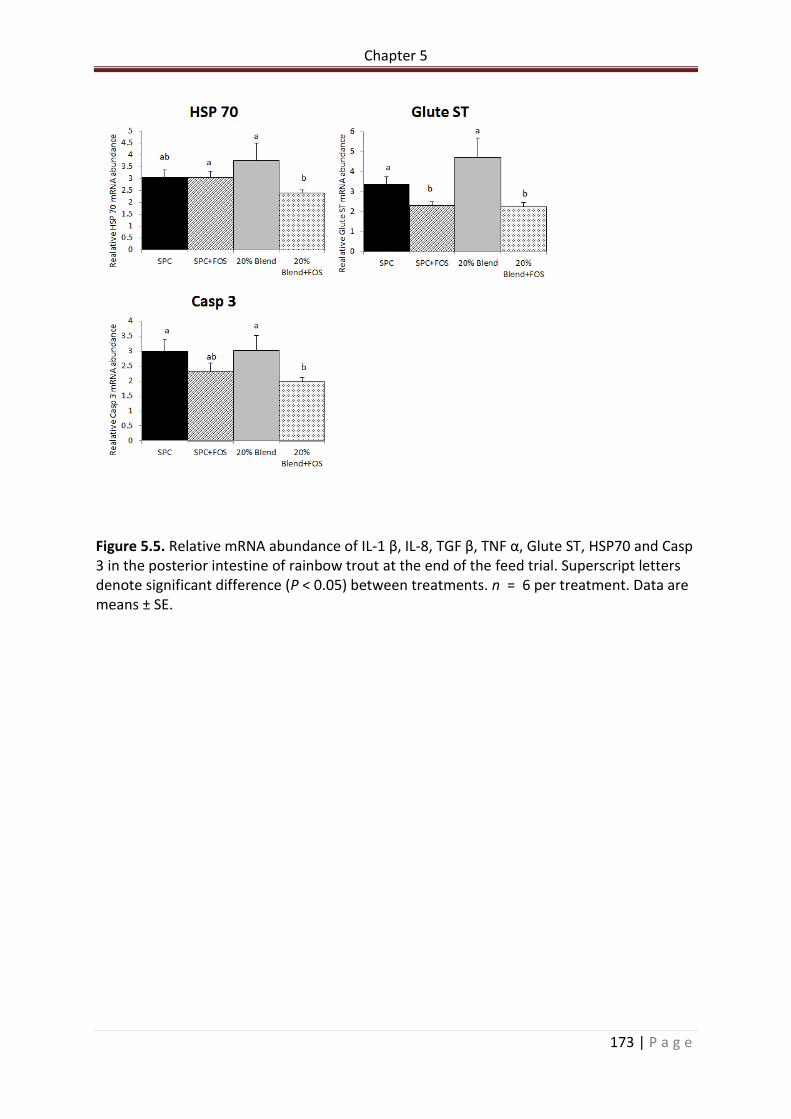
Figure 5.5. Relative mRNA abundance of IL-1 β, IL-8, TGF β, TNF α, Glute ST, HSP70 and Casp 3 in the posterior intestine of rainbow trout at the end of the feed trial. Superscript letters denote significant difference (P < 0.05) between treatments. n = 6 per treatment. Data are means ± SE………………………………………………………………………………………………………………..……..173
XV | P a g e
Acknowledgements
There are many people I would like to extend my sincere gratitude and thanks to for the help, support and advice which have enabled me to reach this point in my PhD programme.
Firstly, Dr Daniel Merrifield, for not only providing me with the opportunity to undertake this PhD, but to also for imparting knowledge, guidance and advice over the course of the programme, and the ability to extract optimism and the best from every situation. I also would like to extend my gratitude for the excellent Christmas parties and friendship throughout the completion of this work.
Secondly, Prof. Simon Davies for the inspiration from his undergraduate “Marine living resources” module to engulf myself in the world of aquaculture, as well as the knowledge, expertise and guidance provided over the years.
I would like to extend my gratitude to Dr Emmanuelle Apper and Tereos Syral for the financial support and expertise provided throughout this programme.
I would like to thank all my colleagues and friends, which without would have made my time completing this PhD not only more difficult, but a much duller experience. Much gratitude is extended to Benjamin, Peter, Gareth and Waldi for the friendship, ribbing, coffees and help through the good and the bad. Thank you to the university technical staff, Matt Emery (my microbiology sensei), Liz Preston, Natalie Sweet, Dr Will Vevers, Mike Hocking, Glen Harper, Dr Mark Rawling and Dr Ana Rodiles. Your combined effort has been integral to this research. I must also thank Dr David Peggs, Dr Ben Standen, Gabriella Do Vale Pereira and Alex Jaramillo for their help during sampling days.
Special thanks must go to Dave Fuller and Dan Young at Exmoor Fisheries. Your support, generosity, understanding and commitment to enable the completion of my experimental trials was unwavering, and I am extremely grateful for the opportunity you provided.
To my parents, I am eternally grateful for your unconditional love and support over the course of my extended university career. Your acceptance of my path in life with support, backing and encouragement has enabled me to achieve more than I could have imagined back in the Ditching days. I must also thank my brother Tom for the support and belief in my ability to persevere through the difficult times.
To my friends from The Colosseum days, thank you for keeping me sane. I’ve kept the Plymouth dream alive, but I believe it is time to move on. Lastly and importantly, thank you to Emilie, your love and endless support, and that of your family, has made the course of this programme a less stressful and a more enjoyable experience.
XVI | P a g e
Author’s declaration
At no time during the registration for the degree of Doctor of Philosophy has the author been registered for any other University award.
The study was jointly funded by Tereos Syral and Plymouth University.
Word count: 47,522
Signed: ………………………………………
Date: ………………………………………….
XVII | P a g e
Presented Work
Evaluation of dietary wheat gluten products and scFOS on gut health and growth performance of rainbow trout, Oncorhynchus mykiss Voller S W., Rodiles A., Davies S J., Apper E., Merrifield D L. Oral presentation European Federation of Animal Science. Annual Meeting. Belfast, Ireland September 2016 Evaluation of dietary wheat gluten products on gut health and growth performance of rainbow trout, Oncorhynchus mykiss Voller S W., Rodiles A., Davies S J., Apper E., Merrifield D L. Oral Presentation World Aquaculture Society: Aquaculture America 2015. New Orleans, LA, U.S.A. February 2015 The impact of wheat gluten as an alternative protein source and the prebiotic effects of short-chain fructooligosaccharides on health and production of salmonids. Voller S W., Davies S J., Apper E., Merrifield D L Oral presentation Tereos Syral. Aalst, Belgium January 2015 Feed additives in salmonid aquaculture Voller S W. Oral presentation Interaction between GI tract microbe and piscine host Workshop. Chinese Academy of Agricultural Sciences. Beijing, China. April 201
XVIII | P a g e
Abbreviations
ABPs Animal by-products
ADC Apparent digestibility coefficients
ANFs Anti-nutritional factors
ASAT Aspartate aminotransferase
AU Arbitrary units
Bp base pairs
Casp 3 Caspase 3
CL Crude lipid
CP Crude protein
CT Controlled temperature
DNA Deoxyribonucleic acid
EF1-α Elongation factor 1-alpha
FCR Feed conversion ratio
FM Fish meal
FO Fish oil
FOS Fructooligosaccharide
GALT Gut associated lymphoid tissue
GF Germ-free
GI Gastro intestinal
Glute ST Glutathione S-transferase
HIS Hepatosomatic index
Hp Horse power
HSP 70 Heat shock protein 70
HWG Hydrolysed wheat gluten
XIX | P a g e
IL -10 Interleukin 10
IL-1β Interleukin 1-beta
IL-8 Interleukin 8
IP Intraperitoneal
MOS Mannan-oligosaccharide
NFE Nitrogen-free extract
NSP Non-starch polysaccharides
OTU Operational taxonomic unit
PBS Phosphate buffered saline
PCR Polymerase chain reaction
PER Protein efficiency ratio
PPC Plant protein control
RNA Ribonucleic acid
SCFA Short chain fatty acids
scFOS Short chain fructooligosaccharides
SEM Scanning electron microscopy
SGR Specific growth rate
SOD Superoxide dismutase
Sol Soluble hydrolysed wheat gluten
SPC Soy protein control
SWG Soluble wheat gluten
TAE Tris-acetate-EDTA
TBE Trisborate EDTA
TE Tris and EDTA
TGF-β Transforming growth factor-beta
TNF- α Tumour necrosis factor-alpha
XX | P a g e
Tris Tris (hydroxymethyl) amino-methane
VWG Vital wheat gluten
WG Weight gain
XG Times gravity
β-Actin Beta-actin
Chapter 1
1 | P a g e
CHAPTER 1. Introduction
1.1. Aquaculture; an overview
Aquaculture, “the farming of aquatic organisms including fish, molluscs, crustaceans and
aquatic plants where some sort of intervention is made to enhance production” (FAO, 1995)
is experiencing the fastest growth of any food producing sector. Annual global fish
production averaged an 8.8% increase in the period from 1980 to 2010, and in 2013
expanded by 5.8% (FAO, 2012; FAO, 2014). Aquaculture production (excluding aquatic
plants and algae) topped 73.78 million tonnes in 2014, estimated in value at US$160.15
billion (FAO, 2016b). This increase in production has been seen at the same time as massive
global population increase. The current global population is approx. 7.3 billion (2016), an
increase in around one billion since 2003 (Nations, 2015). If current predictions are realised,
the global population will reach 9.7 billion by 2050 and in turn will lead to an inevitable
increase in the need and demand for high quality protein food sources over the coming
years. This extra demand for protein will be compounded by the socio-economic rise in
developing countries. As wealth increases the availability of new and more diverse food
sources will bring an extra burden on agri-business to supply the demand. Fish forms an
important source of animal protein and nutrients for a large proportion of the world's
population, accounting for 16.9% of the world's animal protein intake or 6.5% of all protein
consumed (FAO, 2012). The intensified farming of many aquaculture species will contribute
to allowing currently seen levels of protein intake to be maintained through population
growth and global demand.
Aquaculture provides jobs and income to millions of people worldwide, and with dwindling
fish stocks in capture fisheries around the globe caused by years of over exploitation,
Chapter 1
2 | P a g e
aquaculture has the scope to support the world’s fish requirements, providing an alternative
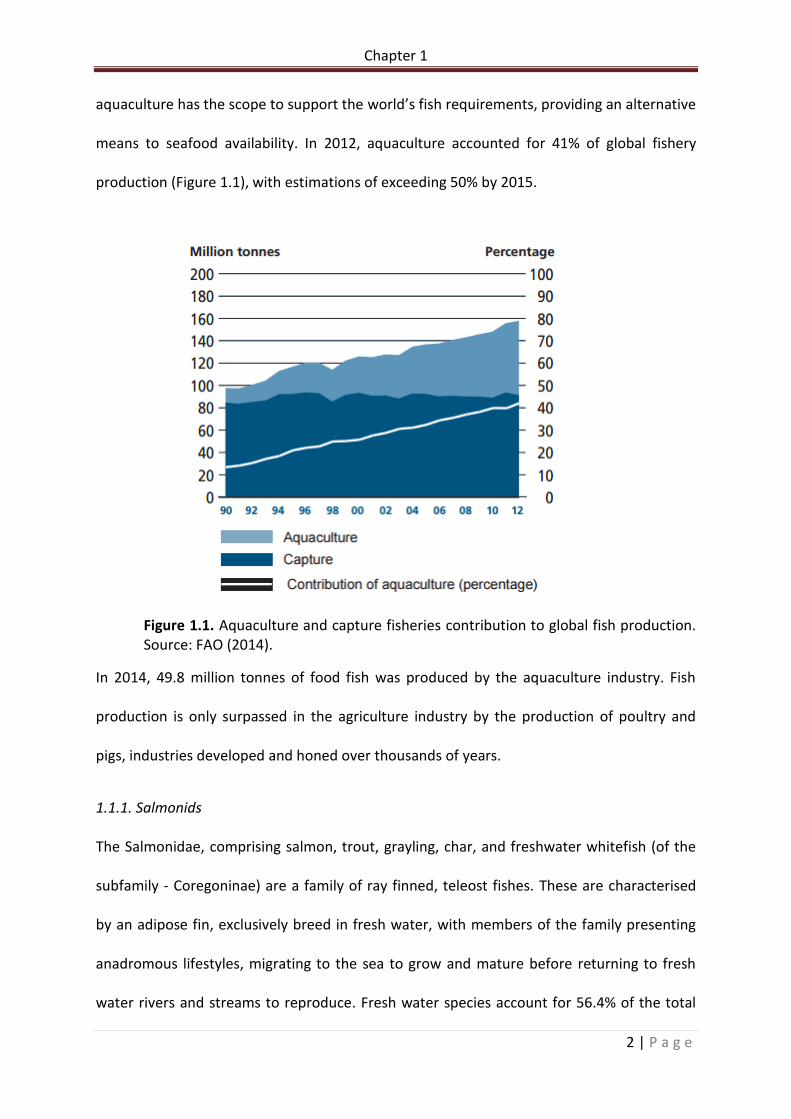
means to seafood availability. In 2012, aquaculture accounted for 41% of global fishery
production (Figure 1.1), with estimations of exceeding 50% by 2015.
Figure 1.1. Aquaculture and capture fisheries contribution to global fish production. Source: FAO (2014).
In 2014, 49.8 million tonnes of food fish was produced by the aquaculture industry. Fish
production is only surpassed in the agriculture industry by the production of poultry and
pigs, industries developed and honed over thousands of years.
1.1.1. Salmonids
The Salmonidae, comprising salmon, trout, grayling, char, and freshwater whitefish (of the
subfamily - Coregoninae) are a family of ray finned, teleost fishes. These are characterised
by an adipose fin, exclusively breed in fresh water, with members of the family presenting
anadromous lifestyles, migrating to the sea to grow and mature before returning to fresh
water rivers and streams to reproduce. Fresh water species account for 56.4% of the total
Chapter 1
3 | P a g e
fin fish production, with diadromous fish species accounting for 6% of the industry. Despite
the apparent small scale of salmonid production, the comparative high price of the end
product gives salmonid aquaculture a disproportionately large share of the economic value
of the industry. Finfish production from mariculture, which includes the salmon and trouts,
represent only 12.6 percent of the total farmed finfish production by volume, whilst their
value (US$23.5 billion) represents 26.9% of the total value of all farmed finfish species (FAO,
2014).
Atlantic salmon (Salmo salar) constitute in excess of 90 percent of the global salmon culture
market. Enjoyed throughout the major consumer markets of Europe, North America and
Japan, production in 2014 reached 2.3 million tonnes (FAO, 2016a). Other farmed salmonid
species produced (chinook salmon, Oncorhynchus tshawytscha, coho salmon,
Oncorhynchus kisutch, rainbow trout/steelhead salmon, Oncorhynchus mykiss, brown
trout/sea trout, Salmo trutta and Arctic char, Salvelinus alpinus) account for a further
approx. 1 million tonnes, the majority of which is accounted for by the rainbow trout
(812,939 tonnes in 2014) (FAO, 2016a; FAO, 2014).
The Atlantic salmon has long been a highly valued sport fish. The evolution of Atlantic
salmon farming from the Victorian era of cultivation of eggs and juveniles for the restocking
and enhancement or rivers for increased wild returns for anglers in the face of declining
populations, to the full life cycle intensive aquaculture systems we see today, salmon
farming is one of the greatest developments in the aquaculture industry. The production
from1 tonne in 1964 to 2.3 million tonnes in 2014 has seen the growth and progression of
many economies(FAO, 2016a). Atlantic salmon are farmed around the globe, with the major
producers situated in Norway, Chile and Scotland (Smaller production occurs in USA, Canada,
Chapter 1
4 | P a g e
Ireland, Iceland, Tasmania and the Faroe islands). The farming of Atlantic salmon is without
doubt one of the most technologically advanced aquaculture sectors. Driven by the high
commodity price of the animal, not only has the physical engineering side of production
advanced with intensification of production, countless scientific studies have been carried
out into all areas of salmon production. This sustained progression and level of research
resulted in a genetically modified (transgenic) strain (AquAdvantage Salmon, AquaBounty,
MA, USA) which has been approved by the United States Food and Drug Administration
(FDA) in 2015 for human consumption (FDA, 2015), closely followed by Health Canada. A
world first for farmed animals and a precedent for global livestock producers.
Rainbow trout (Oncorhynchus mykiss), an excellent sport fish in its own right, has never
commanded the same economic value or production levels of Atlantic salmon. Originally
from North America, rainbow trout have been distributed to waters on every continent (bar
Antarctica) for recreational angling and aquaculture purposes since 1987 (FAO, 2016a).
Although productions levels are much lower than Atlantic salmon, the rainbow trout
industry has also enjoyed the boom seen in the last half of the 1900’s. From meagre
production of 4,400 tonnes in 1950, global production peaked in 2012 to in excess of
882,000 tonnes. Rainbow trout, although a nutritious and palatable fish with similar
nutritional characteristic to salmon, has been burdened with a public perception of an
inferior product to salmon. This has resulted in limiting sales and demand in the retail
setting. Although the market for table fish could be stronger, rainbow trout are amongst
the most popular sport fish for recreational anglers. More accessible than wild salmon,
rainbow trout are stocked in many fresh water bodies around the world for the sole purpose
of angling. This market demands enough fish to maintain many hatcheries and farms solely
Chapter 1
5 | P a g e
for the purpose of restocking. The restocking market poses differing requirements on
producers, striving for “fin perfect” palatable fish. The quality of the animal is of high
importance with blemishes, shortened opercula, fin erosion or skeletal deformities rejected
by paying anglers. As well as a sport and food fish, rainbow trout have played a key role in
the scientific understanding and development of the salmonid industry, being utilised as a
general salmonid model. Their comparatively simple life cycle, without the need for
smoltification, allows animals to be kept in research environments more easily than salmon.
Although production levels are significantly lower than Atlantic salmon, it can be seen that
rainbow trout play an important role in the aquaculture and research industry.
1.1.2. Sustainability and aquafeed
The aquaculture industry has long been under scrutiny over the sustainability of intensive
production, be it disease, parasites, environmental impacts or fishmeal and fish oil
inclusions in aquafeeds. Increasing the sustainability of aquafeeds is and will continue to be
paramount in improving the long term sustainability and productivity of the aquaculture
industry. The innately carnivorous nature of salmonids must be reflected in their feed.
Salmon and trouts require energy rich diets containing high quality protein and lipid to
preform optimally. This is reflected in the cost of aquafeeds for salmonids, where prices of
1000 to 1250 GBP per tonne are not uncommon for commercial grow-out diets, and can
constitute 50% of operating expenses for farms (Shipton, 2013). The high quality protein
and lipid components have historically been sourced from fishmeal and fish oil. Aquafeed
producers have utilised fishmeal as the protein source of choice for marine fish and
salmonids, due to its high protein content and exceptional amino acid profile. Fishmeal is
also favourable due to its high nutrient digestibility, low antinutrient content, source of
Chapter 1
6 | P a g e
essential fatty acids (EPA & DHA) and its previous availability and low cost (Gatlin et al.,
2007; Tacon and Metian, 2008). Produced predominantly in Chile and Peru, fishmeal is
produced from small bony pelagic fish species, with a lower economic value in their own
right (FAO, 2015b). Typically species such anchovy (Engraulidae sp.), sardines (Clupeidae sp.)
and jack mackerel (Trachurus symmetricus) are rendered by a process of steam cooking,
pressing and milling to produce a meal. During the pressing stage the liquid fraction is
removed, and further processing separates the Fish oil from the water. The fishmeal market
is notoriously variable due to many external factors affecting production. Climate change,
the cyclic phenomenon of El Niño, fishing quotas and natural disasters can all have a major
impact on fishmeal and fish oil (FO) production (Oki and Kanae, 2006; FAO, 2015b; Tveterås
and Tveterås, 2010). These variations in the market have seen prices vary greatly. In 2014
prices per tonne peaked at USD 2380, more than quadruple the price seen in April 2000
(USD 423)(Indexmundi, 2014). This huge increase in price and associated economic burden
has also contributed to the effort of fishmeal and Fish oil replacement in formulations, as
traditional high fishmeal based formulations are economically unsustainable. It is also
becoming increasingly apparent how inherently unsustainable the fishmeal industry is in
from an environmental standpoint. In the light of ever decreasing wild stocks, the removal
of millions of tonnes (21.7 million tonnes in 2012 (FAO, 2014)) of small pelagic species,
essentially the bottom of the food chain for many other marine species, is environmentally
illogical. The industry is however improving, and the utilisation of fish remains and by-
products constituted an estimated 35% of fishmeal production in 2012 (FAO, 2014; Olsen et
al., 2014).
The replacement of fishmeal with alternative protein sources has enabled the expansions of
aquaculture production despite the stagnated levels of fishmeal availability and elevations
Chapter 1
7 | P a g e
in fishmeal cost. Annually approx. 6 million tonnes of fishmeal and 1 million tonnes of fish
oil are produced globally. This finite resource is utilised in a vast number of applications, not
just aquafeeds.
The replacement of fishmeal and fish oil in feeds for carnivorous species poses a significant
challenge. To maintain growth and health parameters diets must have similar amino acid
and essential fatty acid (EFA) profiles as fishmeal and fish oil. The possible use of
carbohydrates in diets for salmonids is highly restricted and their over inclusion can result in
the increased utilisation of fat as an energy source (Skiba-Cassy et al., 2013).The inclusion
levels of fishmeal and fish oil have been steadily decreasing with the progression and
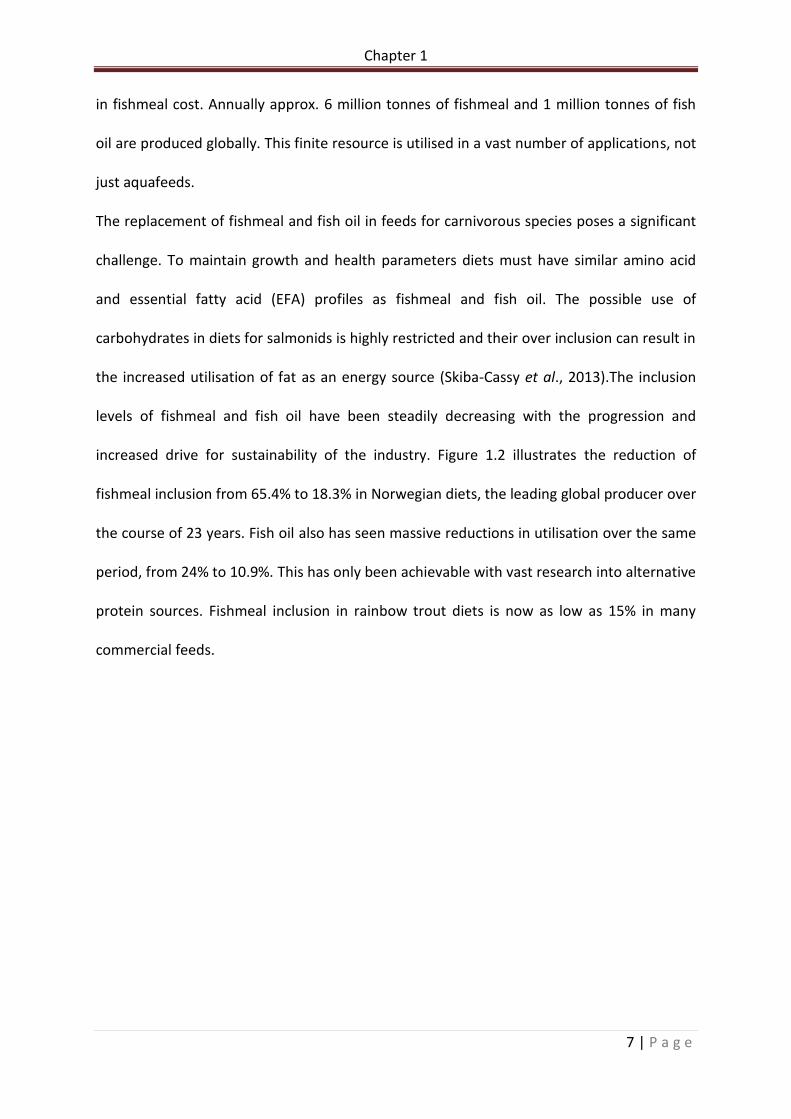
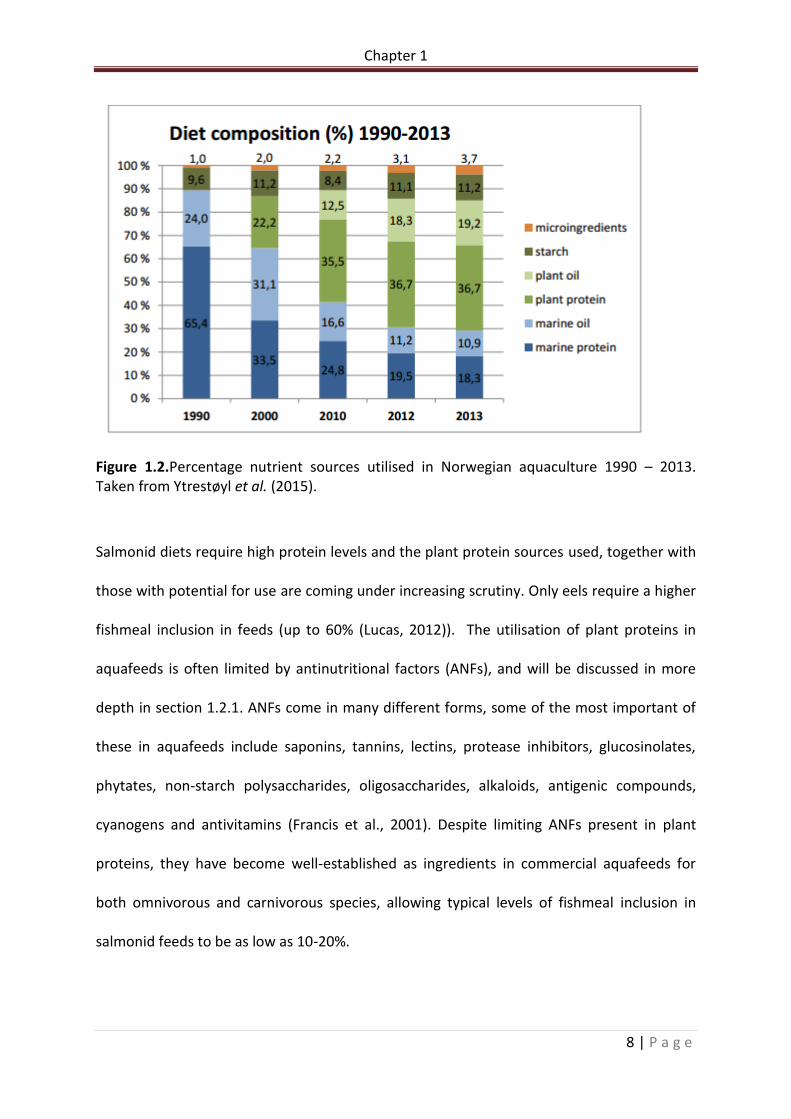
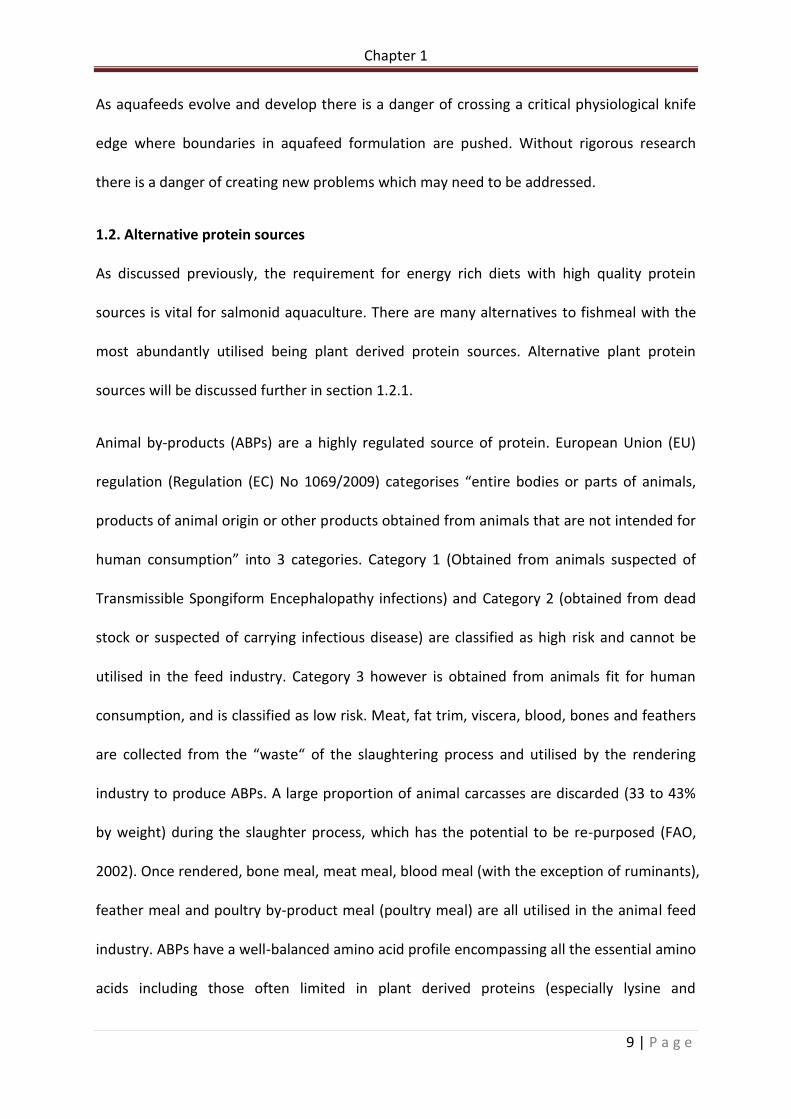
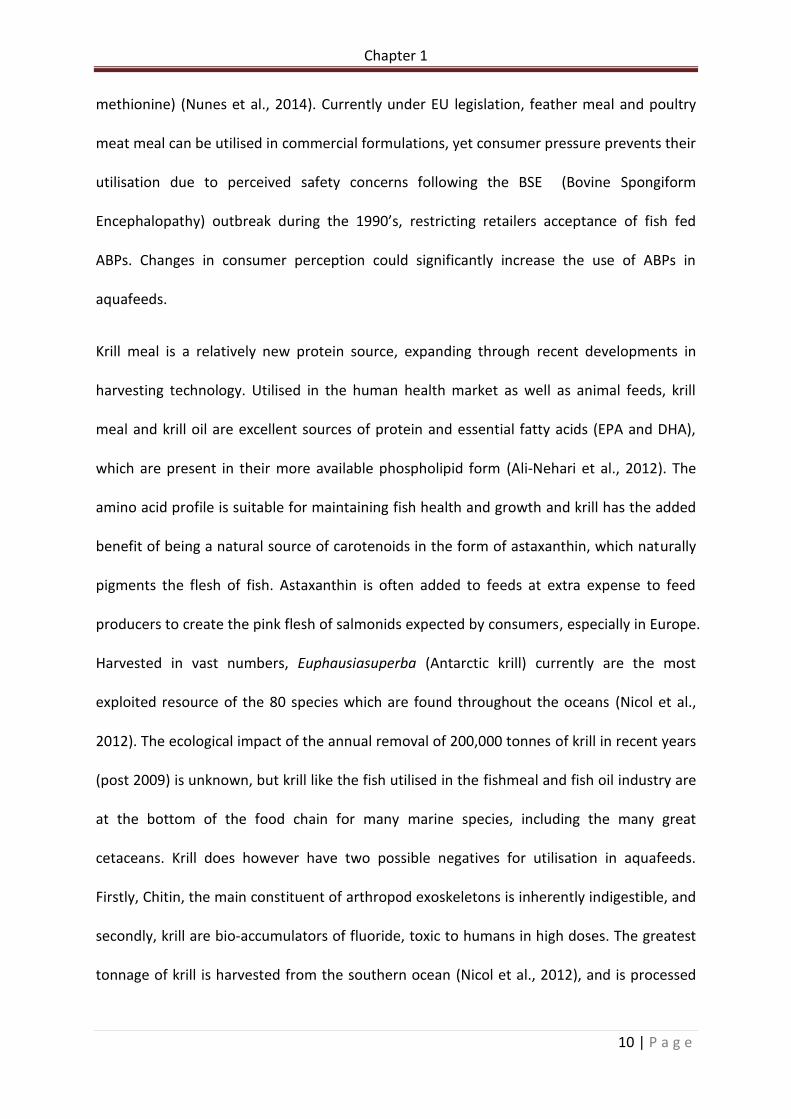
increased drive for sustainability of the industry. Figure 1.2 illustrates the reduction of
fishmeal inclusion from 65.4% to 18.3% in Norwegian diets, the leading global producer over
the course of 23 years. Fish oil also has seen massive reductions in utilisation over the same
period, from 24% to 10.9%. This has only been achievable with vast research into alternative
protein sources. Fishmeal inclusion in rainbow trout diets is now as low as 15% in many
commercial feeds.
Chapter 1
8 | P a g e
Figure 1.2.Percentage nutrient sources utilised in Norwegian aquaculture 1990 – 2013. Taken from Ytrestøyl et al. (2015).
Salmonid diets require high protein levels and the plant protein sources used, together with
those with potential for use are coming under increasing scrutiny. Only eels require a higher
fishmeal inclusion in feeds (up to 60% (Lucas, 2012)). The utilisation of plant proteins in
aquafeeds is often limited by antinutritional factors (ANFs), and will be discussed in more
depth in section 1.2.1. ANFs come in many different forms, some of the most important of
these in aquafeeds include saponins, tannins, lectins, protease inhibitors, glucosinolates,
SOD = superoxide dismutase, ASAT = aspartate aminotransferase. symbols represent an increase (↑), decrease (↓) or no effect (→) on the specified response.
Chapter 1
39 | P a g e
1.6.1. Growth performance
The only literature for the use of FOS as a prebiotic in salmonids reported no beneficial
effect on feed intake, survivability, digestibility or growth performance in on-growing
Atlantic salmon, post 16 week feed trial (Grisdale-Helland et al., 2008). Feed efficiency
however was improved in the diets containing FOS (1%), yet carcass proximate composition
analysis and apparent nutrient digestibility were unaffected. Promising results have been
seen regarding growth performance in turbot larvae (2% FOS) (Mahious et al., 2006), and
the modulation of the autochthonous bacterial microflora, specific growth rate (SGR), feed
conversion ratio (FCR) and daily feed intake of hybrid tilapia post 8 week feeding trial of
diets containing 1% scFOS. Hepatopancreasomatic index was also reduced (Zhou et al., 2009;
Lv et al., 2007). The stimulated bacterial growth however were not the traditional bacteria
associated with beneficial effects such as Bacillus sp. and Lactobacillus sp., but non-
traditional soil and water associated bacteria and uncultured species. Little information is
available on the effects of scFOS on the growth performance of salmonids.
1.6.3. Health and immunology
Relatively few studies have investigated prebiotic effects on the modulation of the immune
system in salmonids (Sealey et al., 2007; Staykov et al., 2007; Rodriguez-Estrada et al., 2013).
The only immunological parameters Grisdale-Helland et al. (2008) investigated post 16 week
trial was neutrophil oxidative radical production and serum lysozyme activity. Both
parameters were unaffected by FOS inclusion. Similar results have been seen in red drum
production, utilised in the respiratory burst process by neutrophils and monocytes was
reduced, a key aspect of the non-specific immune system. Lysozyme serum activity however
Chapter 1
40 | P a g e
significantly increased. Lysozyme which acts on peptidoglycans in the cell wall of gram
positive bacteria is another key component of the innate immune system. As well as these
effects, increased microvilli height was observed in the pyloric caeca and the proximal and
mid intestine post FOS supplementation, showing FOS’s ability to modulate the intestinal
morphology in certain instances (Zhou et al., 2010). Guerreiro et al. (2015c) observed
increased nutrient utilisation. Increased enzyme activity and glucose and lipid metabolism
was seen with 1% scFOS inclusions in juvenile European sea bass. The available information
on the use of scFOS as a prebiotic in salmonids is lacking, the investigations in this thesis will
hopefully add a body of work to the effects of scFOS on the health and performance of
rainbow trout.
1.7.Conclusions
As the aquaculture industry grows annually, research must continue into alternatives
enabling the volume of aquafeed produced to increase, with the finite fishmeal available
and without the dependence on a sole alternative protein source. Identification of plant
protein products offering additional health benefits and fewer antinutritional factors is of
high priority for the continued drive for sustainability in aquafeeds. Producing feeds that
grow fish rapidly with low feed conversion ratios is no longer sufficient. It is vital we are
aware of how nutrition integrates with disease status of fish, stress physiology, and the
potential challenge of fish from pathogens from the external environment. Insuring
inclusion levels shown to be detrimental to species are not exceed, and protein sources with
functional characteristics beneficial to the health and physiology of fish are incorporated will
allow aquafeed to achieve the needs of the industry. It is vital research continues in this
field, and novel ingredients and additives be explored fully for a variety of species. The
Chapter 1
41 | P a g e
modulation of the innate immune response and intestinal microbiota whilst improving the
gut morphology, antioxidant state and reducing the inclusion levels of other detrimental
plant proteins is a real possibility for wheat glutens and scFOS in aquafeeds.
1.8 Thesis objectives and aims
The aim of this research is to assess the potential role of wheat glutens and scFOS in
aquafeeds for the salmonid industry via the analysis of gut health and growth performance.
Inclusion rates, mechanisms of action, and novel insights into effects on the intestinal
microbiota and health status of the intestine will be assessed through a series of three
feeding trials.
Preliminary trial. Initial assessment of the impact of wheat glutens on the intestinal
microbiota and gross intestinal structure of juvenile rainbow trout.
Trial 1. Assessing the effects of three wheat gluten sources, as replacement of soy protein
concentrate, on the intestinal microbiota, health and localised immune and stress response
of juvenile rainbow trout.
Trial 2. Assessing commercially relevant blended wheat glutens and inclusion levels on the
growth performance, condition, and intestinal health of juvenile rainbow trout, when
included at the expense of soy protein concentrate.
Trial 3. Assessing the effect of scFOS supplementation on the intestinal microbiota, localised
immune and stress response and SCFA production in soya based and wheat gluten inclusion
diets.
Chapter 2
41 | P a g e
CHAPTER 2. General methodologies
2.1. Overview
Methods specific to individual trials, including feed formulations, can be found in their
relevant experimental chapters. Unless otherwise indicated, all methodologies were carried
out at the University of Plymouth, UK, under the approval of the institutional Animal Ethics
Committee.
2.2. Experimental animals and housing
Over the course of the experimental trials rainbow trout (Oncorhynchus mykiss) were
utilised as a model for the salmonid aquaculture industry. For investigations carried out at
the University of Plymouth, XXX triploid rainbow trout were sourced and delivered from a
commercial fish farm (Exmoor fisheries, Somerset, UK) utilising their standard procedure.
On arrival at the University of Plymouth, fish were acclimated for 2 hours with the addition
of quarantine system water to a holding vessel (Rubbermaid tilt truck) before being
introduced to a flow through quarantine system. All fish entering the aquaria underwent a
ten day prophylactic treatment with a proprietary solution (FMC mixture, NT Labs,
Wateringbury, Kent) before being graded by size into tanks of experimental systems 1 and 2.
After a further 2 weeks acclimation and feeding between 1% and 2% body weight daily to
obtain a uniform stock size, experimental animals were distributed evenly into the 110 litre
system tanks for the start of feeding trials (average tank biomass ± 1.5% overall mean). Over
the course of the quarantine and conditioning period, fish were fed a commercially available
trout diet (BioMar Efico Enviro, BioMar; DK) at approximately 2% body weight (BW) per day.
Chapter 2
42 | P a g e
Further information on numbers of fish per tank and stocking densities can be found in
specific experimental chapters.
Two parallel systems (each with 9 tanks) had water exchanged between the two for
minimum of 2 hours per day utilising a Sicce 14000 pump (Pozzoleone, VI – Italy) in a sump
in each system to exchange water between the two, maintaining experimental conditions
across both (Image 2.1). Water chemistry was maintained at appropriate levels for rainbow
trout: total free ammonia was maintained below 0.1 mg L-1, nitrite below 1.0 mg L-1 and
nitrate below 50 mg L-1. Water temperature was maintained at 15.5 ± 1oC through ambient
air temperature of the controlled temperature (CT) system room, cooled by air-conditioning
units. Mechanical filtration was achieved through bespoke swirl filters, with course nylon
filter media. Biological filtration was achieved through fluidised beds of plastic extruded
biomedia (K1 Kladness media) in each system. UV treatment of water was achieved through
a P8-Twin 880W UV steriliser (Tropical Marine Centre, Bristol, UK) supplied by an Argonaut-
AV100-2DN-S 0.75Hp pump (Hydroair International, Varde, Denmark) on each system.
System water was supplied to the tanks by a Sicce 14000 pump circulating approximately
1,440 litres per tank per hour. Biomedia movement was achieved through water circulation
powered by an Argonaut-AV100-2DN-S. Aeration to the system, air stones in tanks and
perforated pipework ladders in biomedia sumps, was supplied via side channel air blowers
(Rietschle Ltd.; Hampshire, UK). Photo period was set to 12 hours light and 12 hours dark
throughout housing, and daily dissolved 02, temperature and pH was monitored daily using
a Hach HQ 40d probe (Hach Lange GmbH, Düsseldorf, Germany). Nitrogenous waste water
chemistry was monitored weekly using a Hach Lange DR 2800 spectrophotometer utilising
Chapter 2
43 | P a g e
cuvette tests for ammonia (LCK304), nitrite (LCK341) and nitrate (LCK340) (Hach Lange
GmbH, Düsseldorf, Germany).
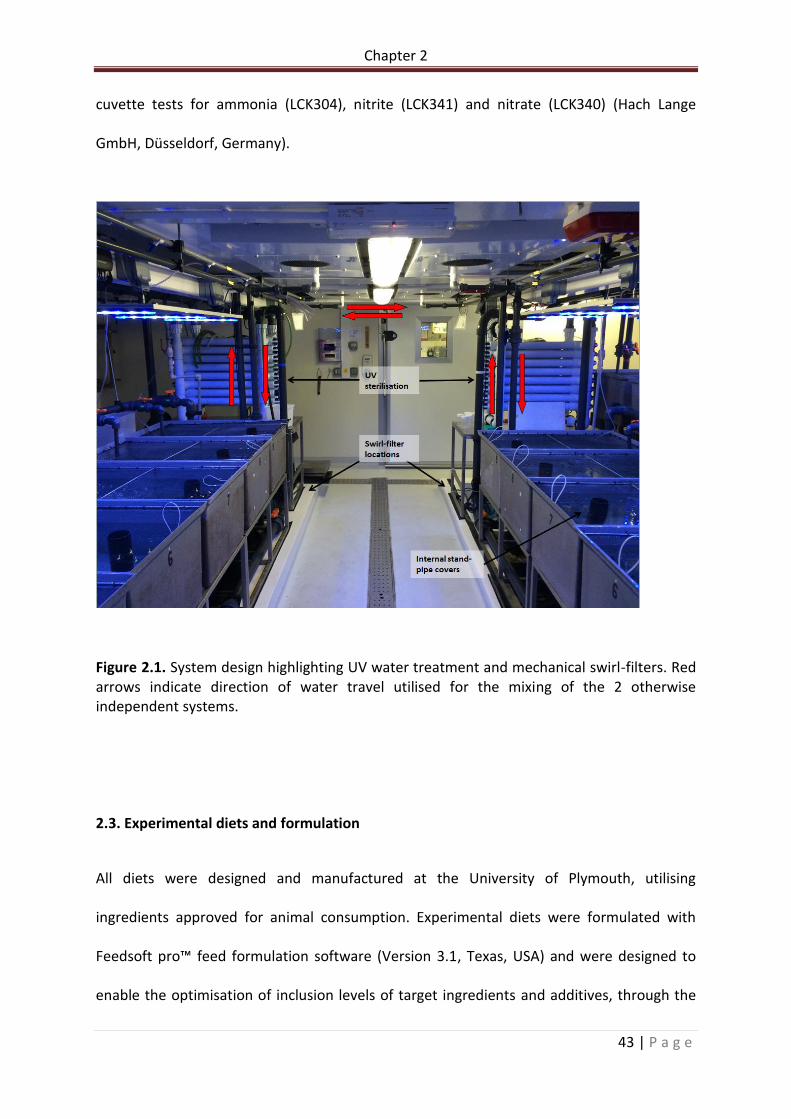
Figure 2.1. System design highlighting UV water treatment and mechanical swirl-filters. Red arrows indicate direction of water travel utilised for the mixing of the 2 otherwise independent systems.
2.3. Experimental diets and formulation
All diets were designed and manufactured at the University of Plymouth, utilising
ingredients approved for animal consumption. Experimental diets were formulated with
Feedsoft pro™ feed formulation software (Version 3.1, Texas, USA) and were designed to
enable the optimisation of inclusion levels of target ingredients and additives, through the
Chapter 2
44 | P a g e
ability to influence health and performance. Feed formulations were designed to achieve
the minimum known nutritional requirements of rainbow trout (NRC 2011). Feed
ingredients were mixed using a Hobart food mixer (Hobart Food Equipment, Sydney,
Australia, model no: HL1400–10STDA). Warm water and oil were then added before cold
press extrusion (PTM P6 extruder, Plymouth, UK) through an appropriate size die to produce
a pellet of the correct diameter. Diets were air dried (air convection oven) at 45oC before
being broken up by hand to achieve the required size.
2.4. Experimental feeding
Each tank of fish was randomly allocated an experimental dietary formulation. Fish were fed
1.5-2.4% of tank biomass over the course of three feeds daily (09:00, 13:00 and 17:00). Feed
ration was calculated from weekly or bi-weekly weighing and increased daily based on an
assumed FCR of 1, unless otherwise stated.
2.5. Growth performance and feed utilisation
Growth performance parameters were based on net biomass (weight) gain (WG).
Experimental animals were weighed in bulk, by tank. Tared tubs of system water received
aeration or a constant follow of system water during the weighing procedure to minimise
the risk of oxygen deprivation whilst in the tubs. Biomass was sampled on a weekly or bi-
weekly basis to the accuracy of 1 gram. Further details can be found within respective
experimental chapters.
Chapter 2
45 | P a g e
Utilising the recorded tank biomass and animal numbers, calculations could be carried out
to assess feed conversion ratio (FCR), specific growth rate (SGR) and protein efficiency ratio
(PER). Calculations were made as follows:
WG (g/fish) = Final wt. (g) – Initial wt. (g)
FCR = Feed intake (g) / Weight gain (g)
SGR = 100 x ((Ln final wt. (g) – Ln Initial wt. (g)) / (days fed)
PER = Weight gain (g) / Protein intake (g)
2.6. Sampling protocol and fish dissection
A minimum of two fish per tank were sampled during the sampling process, ensuring an n ≥
6 was achieved for all samples per dietary treatment. Euthanasia was achieved in
accordance with the schedule one procedure of the Animals (Scientific Procedures) Act 1986.
Aseptic conditions were used for microbiological sampling. Dissection occurred to remove
specific organs/tissues for analysis. Once an incision into the Intraperitoneal (IP) cavity had
been made from the anal vent to the pectoral fins, the intestine was cut just inside the anal
vent. The intestine was then gently removed from the fish, removing visceral fat attached in
the process. Once the intestine was cleared of fat and extended form the fish, the anterior
end of the intestine was cut just below the pyloric caeca enabling the intestine to be excised
from the fish. The intestine of trout can easily be identified into anterior and posterior
regions, at the thickening of the gut (Figure 2.2a). All samples were taken from the posterior
intestine. Once removed from the fish, the posterior portion (5 mm) was discarded to avoid
Chapter 2
46 | P a g e
artefacts from the dissection process. The next 10 mm was removed for light microscopy.
This was fixed in a 10% formalin saline solution for 48 hours at 4 oC before being transferred
to 70% ethanol and stored at 4 oC. The next 3 mm of posterior intestine was removed and
cut longitudinally into two pieces, to be utilised for scanning electron microscopy (SEM).
Immediately after extraction, SEM samples were washed in 1 % S-methyl-L-cysteine,
phosphate buffered saline (PBS) solution for a minimum of 20 seconds to remove mucus,
before fixation in 2.5 % glutaraldehyde in pH 7.2, 0.1 M sodium cacodylate buffer. Samples
were then stored at 4 oC. The next 5mm were excised for gene expression analysis and
stored in RNA later® (ThermoFisher Scientific) at -20 oC. Figure 2.2b shows sampling regions
and sections. Digesta samples for microbiological analysis were taken from the posterior
intestine. Once the intestine had been excised, digesta was gently eased out with the aid of
forceps into sterile 1.5 ml micro centrifuge tubes. Intestine that had digesta removed were
not sampled for any other analysis to prevent the identification of artefacts from the digesta
removal process in subsequent analysis.
Chapter 2
47 | P a g e
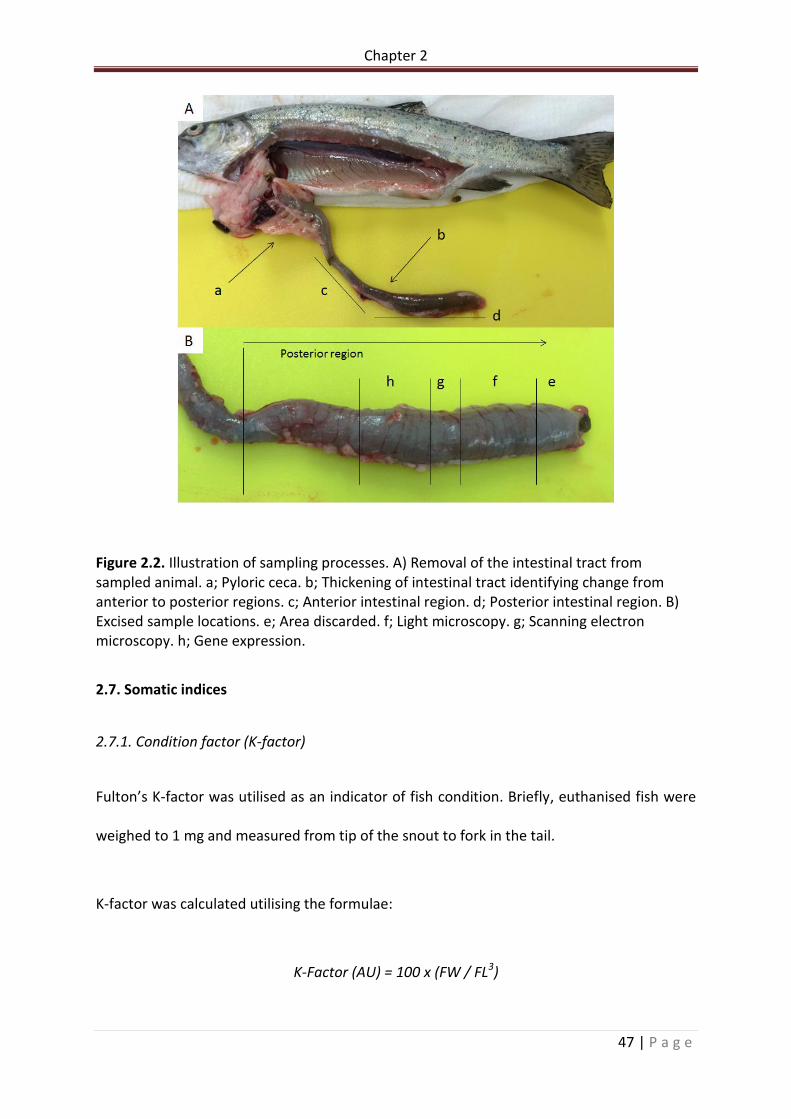
Figure 2.2. Illustration of sampling processes. A) Removal of the intestinal tract from sampled animal. a; Pyloric ceca. b; Thickening of intestinal tract identifying change from anterior to posterior regions. c; Anterior intestinal region. d; Posterior intestinal region. B) Excised sample locations. e; Area discarded. f; Light microscopy. g; Scanning electron microscopy. h; Gene expression.
2.7. Somatic indices
2.7.1. Condition factor (K-factor)
Fulton’s K-factor was utilised as an indicator of fish condition. Briefly, euthanised fish were
weighed to 1 mg and measured from tip of the snout to fork in the tail.
K-factor was calculated utilising the formulae:
K-Factor (AU) = 100 x (FW / FL3)
Chapter 2
48 | P a g e
Where; FW = Fish weight (g) and FL = fork length (cm)
2.7.2. Hepatosomatic index
The hepatosomatic index (HSI) was calculated as in index of health. Briefly, post
euthanisation, fish weight (to 1 mg) was taken before dissection occurred. Whole livers
were removed and weighed (to 0.1mg) and HIS was calculated as follows:
Hepatosomatic index (AU) = 100 x (LW / FW)
Where; LW = liver weight (g) and FW = pre-dissected fish weight (g)
2.7.3 Viscerosomatic index
The viscerosomatic index (VSI) was calculated as in index of health. Briefly, post
euthanisation, fish weight (to 1 mg) was taken before dissection occurred. Intier viscera,
from oesophagus to anus with visceral fat attached as well as associated organs, were
removed and weighed (to 0.1mg) VSI was calculated as follows:
Viscerosomatic index (AU) = 100 x (VW / FW)
Where; VW = Viscera weight (g) and FW = pre-dissected fish weight (g)
Chapter 2
49 | P a g e
2.8. Proximate analysis
Diet, carcass and feed ingredient moisture, crude protein, lipid, ash and gross energy levels
were analysed in duplicate or triplicate in accordance with the protocols of the AOAC (2016)
as described below. Prior to analysis all samples were milled into a homogenous
powder/substance. Diets were analysed on an as fed basis. Carcass composition data were
analysed on a dry weight basis, as milling of carcasses occurred post drying.
2.8.1. Moisture content
Percentage moisture was calculated by the drying of a known weight of sample for a period
of time until a constant weight was achieved. Drying occurred at 105oC in a fan assisted
oven (Genlab ltd, UK). Percentage moisture was calculated following the formulae:
Moisture (%) = ((wet wt.(g)- dry wt(g))/(wet wt.(g))) x 100
2.8.2. Crude protein
The kjeldahl method was utilised to assess crude protein (CP) in diet, carcass and faeces
through the determination of nitrogen content and a subsequent conversion factor. The
resulting total nitrogen content is multiplied by 5.95 for plant derived proteins (6.25 for
animal derived proteins) to calculate crude protein. Milled homogenous sample was
weighed (100 – 150 mg) into micro Kjeldahl tubes with the addition of a catalyst tablet (3 g
K2SO4, 105 mg CuSO4 and 105 mg TiO2) (DBH Chemicals Ltd, Dorset, UK). To the tubes, 10 ml
was suspended in 0.05 M Na2HPO4 (pH 6.2) at a concentration of 200 mg/ml, and utilised as
the substrate. 25 μl of serum was added to microplate wells, followed by 175 μl of substrate
solution, using a multi-channel pipette. Mechanical agitation started immediately and
absorbance read at 530 nm every 30 seconds for 5 minutes (OPTImax microplate reader,
Molecular Devices LLC; CA, USA). Samples were run in quadruplet. Lysozyme units were
calculated as follows:
1 U of Lysozyme = Δ 0.001 Abs/min
2.10. Molecular microbial analysis
2.10.1. DNA Extraction
DNA extraction occurred utilising the PowerFecal™ DNA isolation kit (Cambio, Cambridge,
UK) with the addition of a lysis step prior to the manufacturers protocol. Briefly, 500 µl of
lysozyme (50 mg / ml in TE buffer) was added to 100mg of sample weighed into PCR clean
(RNAse, DNAse free) micro centrifuge tubes. Samples were then homogenised in a vortex
mixer, and incubated for 30 minutes at 37 oC. Post incubation, samples were centrifuged at
13,000 XG for 2minutes and the supernatant discarded. The remaining sample was re-
Chapter 2
55 | P a g e
suspended in 750 µl bead solution and added to a bead tube with 60 µl Solution C1 and
vortexed briefly before incubation at 60 oC for 10 minutes. Post incubation, samples were
placed into clips on a flat-bed vortex pad and vortexed at maximum speed for ten minutes.
Samples were then centrifuged at 13,000 XG for 1 minute and 400-500 µl of supernatant
added to new PCR clean micro centrifuge tubes. To the new tube, 250 µl solution C2 was
added, vortexed briefly and incubated at 4 oC for 5 minutes. Post incubation, samples were
centrifuged at 13,000 XG for 1 minute and 600 µl supernatant transferred to another new
PCR clean micro centrifuge tube prior to the addition of 200 µl solution C3. The supernatant
and C3 solution were briefly vortexed and incubated at 4 oC for 5 minutes. Post incubation,
centrifugation at 13,000 XG occurred again and 750 µl of supernatant was removed to a
new PCR clean micro centrifuge tube and 1200 µl solution C4 added. Six hundred and fifty µl
of this supernatant was then added to a spin filter column and centrifuged at 13,000 XG for
1 minute. The flow through was discarded, and this step repeated for all the supernatant.
Five hundred µl of solution C5 was then added to the column and spun at 13,000XG for one
minute, flow through was discarded and the column spun again to dry the filter membrane.
The filter column was then removed from its collection tube and placed into a new PCR
clean micro centrifuge tube. To the filter, 40 µl solution C6 was added to elute the DNA. The
column in the micro centrifuge tube was then spun at 13,000 XG for one minute, the filter
was discarded, leaving the extracted DNA in the micro centrifuge tube. The whole extraction
procedure was carried out under aseptic technique to minimise the risk of sample
contamination.
Chapter 2
56 | P a g e
2.10.2. PCR-denaturing gradient gel electrophoresis (PCR-DGGE)
PCR amplification of the V3 region of 16S rRNA gene was carried out using the reverse
primer P2 (5’- ATT ACC GCG GCT GCT GG -3’) and the forward primer P3 (5’- CC TAC GGG
AGG CAG CAG -3’), with a GC clamp added at the 5’ end (5’- CGC CCG CCG CGC GCG GCG
GGC GGG GCG GGG GCA CGG GGG G -3’) after Muyzer et al. (1993). Thirty µl PCR reactions
were carried out with the following reagents utilising 0.5 µl P1 and 0.5 µ P2 primers (50
pmol µl-1), 15 µl RedTaq™ (Bioline, London, UK), 12 µl molecular grade water and 2 µl DNA
template. Thermal cycling was conducted using a Techne TC-512 (Thermal Cycler;
Staffordshire, UK) set to 95 oC for 5 minutes, followed by two cycles of 1 minute at 95 oC, 2
minutes at 65 oC and 3 minutes at 72 oC. This cycle was repeated with a 1 oC decrease in
annealing temperature every second cycle until a final temperature of 55 oC. Once 55 oC
annealing temperature is reached, a further 10 cycles were run. Post PCR, PCR amplicon size
and quality was analysed by running the samples through a 1.5% at 80 volts for 45 minutes
as described in section 2.10.5.
Denaturing gradient gel electrophoresis (DGGE) was performed using a DCode mutation
system (Bio-Rad, CA, USA). PCR products were run on an 8% polyacrylamide gel (160 mm x
161 mm) containing 40%–60% denaturing gradient (where 100% denaturant is 7 M urea and
40% formamide). The gel was run at 65 V for 17 h at 65oC in Tris-acetate-EDTA (TAE) buffer
and stained for 30 min in 100 ml 1xTAE buffer containing 10 ml of SYBR Gold nucleic acid gel
stain (Molecular Probes, UK). Visualization was carried out in a Bio-Rad universal hood II
(BioRad laboratories, Italy). The resulting gel was transformed into operational taxonomic
units (OTUs) presence/absence and band intensities using Quantity One ™ software (BioRad
laboratories, CA, USA).
Chapter 2
57 | P a g e
2.10.3. Sanger sequencing
DGGE band selected for sequencing were isolated from the gel utilising a pipette tip and re-
suspended in molecular grade water before a further PCR using P2 and P1 (5’ – CCT ACG
GGA GGC AGG AG- 3’). A further 1.5% agarose gel was run under the same conditions as
previously described to assess amplicon size and quality. The PCR product was then cleaned
using a QIAquick PCR Purification Kit (Qiagen, Germany), and sent for sequencing at GATC
laboratories, Germany. Received sequences were subsequently BLAST searched in GenBank
(http://blast.ncbi.nlm.nih.gov/Blast.cgi) to achieve a level of identification. Genus and
species were accepted at 95% and 97% respectively.
2.10.4. High throughput sequencing
High throughput analysis focused on the 16S rRNA V1-V2 region. PCR amplification was
achieved utilising the reverse 338R (5’ - GCW GCC WCC CGT AGG WGT – 3’) and forward 27F
(5’ - AGA GTT TGA TCM TGG CTC AG – 3’) primers, diluted to 50 pmol µl-1 (Eurofins MWG,
Ebersberg, Germany). Thirty µl reactions were carried out utilising the following reagents.
15 µl MyTaq™ (Bioline, London, UK), 1 µl 338R and 1 µl 27F primer, 9 µl molecular grade
water and 4 µl DNA template. The PCR conditions comprised an initial denaturing period of
7 minutes at 94oC, followed by 10 touchdown cycles of 30 s at 94 oC, 30 s at 62 oC (reducing
by 1 oC per cycle) and 30 s at 72 oC. This was then followed by a further 25 cycles o 94 oC for
30 s, 53 oC for 30 s, 72 oC for 30s and a final extension of 72 oC for 7 minutes.
PCR products were purified using Agencourt AMPure XP (Beckman Coulter, Ca, USA) using
the manufacturer’s standard protocol and quantified with a Qubit® 2.0 Fluorometer
(Invitrogen, Ca, USA). Amplicons fragment concentrations were then assessed using an Ion
Chapter 2
58 | P a g e
Library Quantitation Kit (Life Technologies™, USA) and then adjusted to 26 pM. Amplicons
were attached to Ion Sphere Particles using Ion PGM Template OT2 200 kits (Life
Technologies™, USA) according to the manufacturer’s standard protocol. Multiplex
sequencing was carried out with Ion Xpress Barcode Adapters (1-16 Kit; Life Technologies™)
on a 316™ chip (Life Technologies™) on an Ion Torrent Personal Genome Machine (Life
Technologies™). Sequences were binned by sample and filtered to remove low quality reads
within the PGM software. Data were exported as FastQ files.
Taxonomic analysis of sequence reads was conducted with FASTX-Toolkit (Hannon Lab, USA)
after the removal of low quality scores (Q score < 20). De-noising and analysis of sequences
was conducted with QIIME (Caporaso et al., 2010a). OTU mapping was performed utilising
the default pipeline of QIIME with USEARH (Edgar, 2010) removing chimeras (putative
erroneous reads). Greengenes database (DeSantis et al., 2006) was used for the assignment
of taxonomic classification of OTUs utilising the RDP classifier (Wang et al., 2007), which
clustered the sequences at 97% similarity with a 0.80 confidence threshold. Multiple
alignment of the representative sequences for each OTU was created using PyNAST
(Caporaso et al., 2010b) with a minimum sequence length of 150 base pairs (bp) and 97%
identification. Utilising the 16S microbial Nucleotide BLAST-NCBI database, highest
homologous species or genera were identified (>98% similarity at 150 bp).
2.10.5. Gel electrophoresis
Agarose gel electrophoresis was carried out in a pharmacia electrophoresis tank with 1 x
Trisborate EDTA (TBE) buffer. Gels were formed from 1.5% agarose with additional GelRed™
nucleic acid dye (Biotium Inc, Fremont, CA, USA). Wells were created with a combe allowing
Chapter 2
59 | P a g e
the loading of 6-8 µl of sample and loading buffer (Bioline). Five μl of Hyper ladder IV
(Bioline) as well as positive and negative controls were included in each gel run.
2.10.5. RNA extraction and cDNA synthesis
Total RNA extraction from the posterior intestine was conducted using TRIzol (Invitrogen,
Carlsbad, CA, USA) as carried out by (Pérez-Sánchez et al. 2011). RNA purity and
concentration was assessed using a NanoDrop™ spectrophotometer (NanoDrop
Technologies, Wilmigton, USA) and stored at -20 oC prior to use. Total RNA was treated with
TURBO DNA-free™ (Thermon Fisher Scientific, Ma, USA) to remove any DNA contamination.
cDNA synthesis was carried out utilising iScript cDNA Synthesis Kit (Bio-Rad CA, USA), with 1
mg RNA template in a 20 µl reaction. cDNA was stored at -20 oC until usage.
2.10.6. Quantitative real time PCR (gene expression analysis)
PCRs were performed in an iQ5 iCycler thermal cycler (Bio-Rad) following the SYBR green
methodologies. Two µl of each samples cDNA was pooled to create a standard for primer
efficiency determination. This was carried out on 1/10 dilutions of the pooled cDNA and the
resulting plots of Ct values versus the logarithmic cDNA input, using the equation;
E = 10(-1/slope)
QPCR reactions were carried out on either 96 or 384 well plates (Thermo Scientific; MA, USA)
utilising 7.5 µl reactions. The reagents used in triplicate reactions per dilution were as
follows: 2 μl of diluted (1/10) cDNA, 3.75 μl 2x concentrated iQ™ SYBR Green Supermix (Bio-
Rad), (SYBR Green was the fluorescent intercalating agent), 0.225 μl of forward and reverse
Chapter 2
60 | P a g e
primers (0.45 μl total at 0.3 μM concentration) and 1.3 μl of DEPC treated H20 (Thermo
fisher scientific). Thermal cycling conditions were as follows: 10 min at 95 °C, 40 cycles of 15
s at 95 °C, 60 s at 60 °C (58oC for primers with 58oC annealing temperatures) with
fluorescence recorded at the end of each cycle. Reactions and quality control measures
were carried out in accordance with the MIQE guidelines (Bustin et al. 2009). Additional
melt curve (dissociation curve) analysis was carried out to ensure single peaks in all cases.
Reaction volumes and conditions were the same for sample analysis, and carried out in
duplicate per sample. β actin and elongation factor 1α were utilised as housekeeping genes.
Primers for genes were designed utilising Primer3web v.4.0.0 (www.Primer3.ut.ee) and
ordered from Eurofins MWG Operon’s oligo synthesis service (Ebersberg, Germany). Specific
genes of interest and primers utilised can be found in respective experimental chapters.
Data were analysed utilising the iQ5 optical system software version 2.0 (Bio- Rad)
containing Genex Macro iQ5 Conversion and genex Macro iQ5 files. The spreadsheet
calculations are based on the algorithms of Vandesompele et al. (2002) and the GeNorm
manual (http://medgen.ugent.be/ ~jvdesomp/genorm/). Delta CT levels were normalised
with a normalisation factor (NF), generated from the two housekeeping genes in GeNorm,
to produce a normalised expression level (NEL) per gene. Formulae utilised were as follows.
ΔCT = primer efficiency^(CT value – minimum CT value observed in gene or interest)
NEL = ΔCT / NF
Descriptive statistics and NELs per treatment per gene were then analysed utilising RStudio
(available at https://www.rstudio.com/products/rstudio/download2/), and pairwise
Chapter 2
61 | P a g e
comparisons were carried out utilising permutation tests. Significance was accepted as P <
0.05.
2.11. Light microscopy
One centimetre sections of the posterior intestine were sampled, fixed and stored as
described in section 2.8. After fixing and storing in 70%, samples were dehydrated through a
graded ethanol series. Once dehydrated, samples were embedded in paraffin wax utilising a
Leica EG1150H tissue processor, in plastic cassettes. Sectioning of samples was carried out
utilising a microtome (Leica RM2235) and subsequently, ultrathin sections (5 μm) were
mounted onto microscope slides. Once mounted onto slides, wax sections were dried for a
minimum of 24hrs at 30 oC prior to staining. Multiple slides per sample were stained with
both haematoxylin and eosin (H&E) (Figure 2.3b) and periodic acid-Schiff with Alcian Blue
(PAS) (Figure 2.3a) with the aid of a Leica 371 Autostainer XL (Leica; Bucks, UK). Post staining,
slides were cover slipped with DPX and left to dry again for minimum of 24 hrs at 30 oC. A
Leica DMIRB microscope mounted with an Olympus E410 digital SLR camera was used to
capture micrographs at varying magnifications. Image analysis was carried out with the aid
of Image J 1.45 (National Institutes of Health, USA). Lamina propria widths were analysed as
an average of 3 measurements per fold (top middle and bottom), in ten folds per sample.
Goblet cells and intraepithelial leukocytes (IELs) were counted along measured entire
intestinal folds (Figure 2.3b), and calculated as cells per 100 μm. Analysis of internal
perimeter ratio was unachievable due to the high degree of folding present in the intestine
or rainbow trout, often resulting in large sections of irregular 2D section morphology.
Chapter 2
62 | P a g e
Figure 2.3. A) Example of PAS stain with visible goblet cells. B) Example of H&E staining, identifying IELs and lamina propria for analysis. Scale bars = 100 µm.
2.12. Statistical analysis
Data are presented as means ± standard deviation (SD), unless otherwise stated. Statistical
analyses were carried out using Minitab 16 (Minitab 16 statistical software, Minitab Inc.
State college Pennsylvania, USA). Data were tested for normality using a Kolmogorov–
Smirnov test, a one-way ANOVA was carried out thereafter if data were normally distributed.
Significant differences between treatments were determined by Tukey’s post hoc test. Non-
normally distributed data were subjected to Kruskal-Wallis tests and subsequent
independent U-tests. Percentage and ratio data were log transformed prior to statistical
analysis. Significance was accepted at P < 0.05.
A
B
GC
IEL
LP
LP
IEL
Chapter 2
63 | P a g e
2.12.1. PCR-DGGE
PCR-DGGE banding patterns were transformed into intensity matrices using Quantity One
software, version 4.6.3 (Bio-Rad Laboratories), after Schauer et al. (2000), in order to
evaluate similarities between treatments. Primer V6 software (Clarke & Gorley 2006) was
utilised to determine similarity percentages (SIMPER) and ANOSIM (one-way analysis of
similarity) which was used to determine pairwise comparisons between PCR-DGGE
fingerprint profiles (Abell and Bowman, 2005).
Primer V6 software was also utilised for ecological calculations. The total number of
operational taxonomical units (OTU’s) (S) was calculated from the sum of distinct PCR-DGGE
bands per sample. Margalef species richness was calculated utilising the formula:
(d = (S - 1)/ln (N))
Where; S = number of species, N = total number of individuals (unit = total intensity units).
Shannon diversity index was calculated using the formula:
(H´ = 9 Σ (pi (ln pi))
Where; pi = proportion of the total number of individuals in the ith species.
Chapter 2
64 | P a g e
After calculation per sample, data were subjected to a one-way ANOVA.
High-throughput sequencing data analysis was carried out utilising QIIME, Good’s estimator
of coverage was calculated using the formula:
(1−(singletons/individuals)) × 100.
Chao 1 index was calculated using the formula:
Schao1 = S + (n1-1)/ (n2+1)
Where; Schao1 = estimated richness, S = number of observed species, n1 = number of OTU’s
singletons, n2 = number of OTU’s doubletons.
Bray-Curtis was calculated using the formula:
Cn = 2jn/ (na + nb)
Where; na = the total number of individuals in treatment A, nb =the total number of
individuals in treatment B, 2jn = sum of the lower of the two abundances for species found
in both sites.
The phylogenetic distance metric (PD) analyses minimum total branch length covering all
taxa within a sample on the phylogenetic tree.
Chapter 2
65 | P a g e
2.12.2. High throughput sequencing
Alpha diversity matrices, Chao1 and Shannon’s diversity index for high throughput
sequencing results were calculated through QIIME, and rarefied OTU tables to calculate
with 89% similarity to B. coagulans) were predominantly detected in the hydrolysed wheat
gluten treatments. The presence / absence of the sequenced OTU’s in each replicate of each
of the dietary treatment is presented in Table 3.3a.
Chapter 3
75 | P a g e
Figure 3.1a PCR–DGGE fingerprint profiles with cluster analysis dendrogram representing relatedness of microbial communities of the posterior intestinal digesta of rainbow trout fed experimental diets for 2 weeks. DGGE fingerprints represent amplified V3 region of the corresponding samples used in the dendrogram. Sample codes are PPC = PPC treatment, 7.5% V = VWG 7.5 treatment, 15% V = VWG 15 treatment, 7.5% H = HWG 7.5 treatment and 15% H = HWG 15 treatment. Numbers 1-5 post sample code indicate treatment replicate number.
Chapter 3
76 | P a g e
Table 3.2a. Allochthonous microbial community analysis from the PCR-DGGE of the bacterial communities in the posterior intestine of
Rainbow trout fed experimental diets for 2 weeks. ANOVA + post hoc Tukey’s, superscripts denote significance. Significance accepted at P <
0.05. Values expressed as means ± standard deviation.
SIMPER = similarity percentage within replicates of each treatment; PERMANOVA = analysis of similarities between treatments. †Margalef species richness: d = (S – 1)/log (n). ‡Shannon’s diversity index: H′ = -SUM (pi*log (pi)). abc Superscript letters denote significant differences accepted at P < 0.05 * Indicates significance between individual pairwise comparisons
Ecological parameters PERMANOVA
OTUs Richness† Diversity‡ SIMPER (Similarity%) df f p(perm) Similarity (%)
Table 3.3a. Closest bacterial relatives (% similarity) of excised and sequenced bands from the PCR-DGGE of rainbow trout digesta samples from the posterior intestine post 2 week feeding of experimental diets. Presence absence of bands within treatment replicates is indicated in column 2-6. Numbers represent bands present in number of replicates. 0 = not present in any replicate, 5 = present in all five treatment replicates.
Band ID
Band presence Phylum Nearest neighbour Alignment similarity (%)
Analysis of the gross structure of the posterior intestine utilising qualitative low
magnification scanning electron microscopy revealed the intestine of SPC fed fish to look
healthy with uniform enterocytes and densely packed microvilli (Figure 3.3a). Vital wheat
gluten treatments also resulted in a healthy ultra-structure with no observable areas of
necrosis or signs of enteritis. Hydrolysed wheat gluten treatments showed similar uniform
ultra-structure, with no signs of necrosis, malformed or less dense microvilli or increased
intercellular spaces between enterocytes.
Chapter 3
79 | P a g e
Figure 3.2a. SEM images of posterior intestine post two week short exposure to experimental diets. A. SPC, scale bar represents 10 µm. B. VWG 7.5, scale bar represents 5 µm. C. VWG 15, scale bar represents 10 µm. D. HWG 7.5, scale bar represents 10 µm. E. HWG 15, scale bar represents 5 µm.
B
E
D C
A
Chapter 3
80 | P a g e
3.4a. Discussion
The present study utilised microbiological and scanning electron microscopy to assess the
initial impacts of vital and hydrolysed wheat gluten on the gross structure and intestinal
microbiota of juvenile rainbow trout fed experimental diets for two weeks.
It has long been established that the addition of ingredients into aquafeeds has the ability to
modulate the gut microbiota. Soya based proteins have been utilised heavily as alternative
proteins for fishmeal replacement and the decreased reliance of the aquaculture industry
on wild caught fishmeal. As such, soy proteins and protein concentrates have been the focus
of many previous investigations into their effect and modulation of the intestinal microbiota
of salmonids (Heikkinen et al., 2006; Merrifield et al., 2009; Green et al., 2013; Reveco et al.,
2014). The current literature on the effects of wheat gluten inclusion on the gut microbiota
is very limited, with no investigations into the effects on rainbow trout. The quantification of
the change in intestinal microbiota caused by dietary treatments is complicated by
individual animal variation. Despite genetically similar animals being reared in production
environments, with the same external environments and dietary regime, considerable
variation is observed on an animal-to-animal basis in both aquatic and terrestrial species
(Hill et al., 2005; Heikkinen et al., 2006; Mansfield et al., 2010). The increased use of culture
independent analysis methods and individual fish as sample replicates, instead of historical
pooling of samples, is creating a more robust picture of the intestinal microbiology.
The PCR-DGGE analysis of the allochthonous bacterial community of the posterior intestine
reveal that the inclusion of both vital and hydrolysed wheat glutens have a modulatory
effect in juvenile rainbow trout, when compared to the plant protein control treatment.
Chapter 3
81 | P a g e
Two distinct clusters can be observed from the cluster analysis (Figure 3.1a), Firstly a cluster
of sample replicates from fish fed 7.5% and 15% hydrolysed wheat gluten diets. The second
cluster contained the sample replicates from the 7.5% and 15% vital wheat gluten diets and
the PPC. The clustering of replicates from similarly formulated dietary treatments indicates
a dietary effect on the microbiota. The clustering of similar dietary regimes is not
uncommon in fish fed plant based diets and has been reported by Desai et al. (2012), Green
et al. (2013) and Apper et al. (2016). The ecological parameters revealed the number of
OTU’s present and the richness in the allochthonous bacteria was not affected by dietary
treatment. Species diversity was, however, elevated in the 15% vital wheat gluten
treatment compared to the 7.5% vital and 15% hydrolysed wheat gluten treatments. The 15%
hydrolysed treatment community diversity was also significantly reduced compared to the
plant protein control. This elevation in species diversity is contradictory to ecological
parameters seen in Asian sea bass fed a 6% HWG diet compared to a plant protein control
(Apper et al., 2016). However, the increase in bacterial diversity could be considered
advantageous, providing more competition and resistance to opportunistic or invading
pathogens entering the GI tract through feed or the environmental water (Apper et al.,
2016).
Replicate similarity within treatments (SIMPER) was also significantly elevated in the 15%
vital wheat gluten treatment compared to the 7.5% vital and PPC treatments, and
numerically higher than the hydrolysed wheat gluten treatments, suggesting reduced intra-
individual dietary based variation. The pairwise comparisons of the banding profiles and
intensities of treatments reveal only the 7.5% vital what gluten and the PPC treatments to
Chapter 3
82 | P a g e
have similar PCR-DGGE fingerprints. All other treatments showed significant differences
between one another (Table 3.2a).
PCR-DGGE band sanger sequencing form this preliminary investigation revealed a
dominance of Firmicutes in the samples which returned sequences with sufficient quality for
taxonomic identification (Table 3.3a). This is not unexpected and prior investigations have
reported Firmicutes as a major contributor to the intestinal microbiota, as well as
Proteobacteria (Huber et al., 2004; Heikkinen et al., 2006; Pond et al., 2006; Mansfield et al.,
2010; Navarrete et al., 2010a). Although not conclusive or representative of the microbial
population of the allochthonous bacteria, the presence/absence of species within treatment
replicates can be assumed a dietary effect. Sequences aligned to the Enterococcus,
Macrococcus, Lactobacillus genera and family Clostridiales were present in the current
investigation across all treatments (Table 3.3a), and have been previously described in the
normal intestinal microflora of salmonids (Wong et al., 2013; Al-Hisnawi et al., 2015;
Askarian et al., 2012; Ringø and Gatesoupe, 1998; Navarrete et al., 2010a). Sequences
aligned (alignment similarity 89%) to Bacillus coagulans were present in 100% of the
hydrolysed wheat gluten dietary treatments, and none of the PPC or VWG treatment groups.
Bacillus coagulans, is currently being utilised in the health food and prophylactic market as a
probiotic for humans (Hong et al., 2005), as well as showing growth and health benefits in
common carp (Cyprinus carpio) when fed as a probiotic in concentrations of 1 x 10⁷ to 4 x
107 cfu/g (Xu et al., 2014). Improved growth performance was also observed by Lin et al.
(2012) when using B. coagulans as a probiotic for koi carp (Cyprinus carpio koi). A sequence
with 86% similarity to Enterococcus faecium and another uncultured Enterococcus species
(alignment similarity 86%) were predominantly present in the PPC and vital wheat gluten
Chapter 3
83 | P a g e
treatments (Table 3.3a). Enterococcus spp., Gram positive lactic acid bacteria, have been
well established as part of the commensal intestinal bacteria of rainbow trout, and
members of Enterococcus genera are considered potential probiotics in a range of fish
species (Del'Duca et al., 2013; Swain et al., 2009; Wong et al., 2013; Merrifield, 2014; Ringø
and Gatesoupe, 1998; Mansfield et al., 2010).
The inclusion of wheat gluten into experimental diets in this study revealed no detrimental
effects on the intestinal morphology at a qualitative level. These findings are not surprising
due to the low ANF content compared to soy proteins which it is replacing (Apper-Bossard
et al., 2013). The high glutamine content of wheat gluten may also contribute to this effect.
Glutamine, used as a major substrate by highly proliferating enterocytes of the intestine
(Trichet, 2010), has been shown to improve the intestinal morphology of hybrid striped bass
(Morone chrysops × Morone saxatilis) and channel catfish (Ictalurus punctatus) (Pohlenz et
al., 2012; Cheng et al., 2012). This effect has also been observed in broilers fed hydrolysed
wheat gluten as a partial soy protein replacement (van Leeuwen et al., 2004).
3.5a. Conclusion
The inclusion of wheat gluten in aquafeeds at the expense of soy protein for rainbow trout
had no obvious adverse effects on qualitative observations of the intestinal morphology at
the end of a two week feeding period, likely due to high levels of glutamine and low levels of
ANFs. Further quantitative analysis of the intestinal histology and morphology is required to
assess the effects of dietary wheat gluten inclusions.
Chapter 3
84 | P a g e
The allochthonous microbial community OTU numbers or richness were unaffected by
dietary inclusions of wheat gluten. Microbial diversity was only significantly decreased in the
15% hydrolysed treatment compared to the PPC diet. Observations of species differences
between experimental treatments, and the clustering of the hydrolysed treatments apart
from the PPC and VWG treatments would suggest a degree of diet caused modulation. All
treatments maintained an approximately 35% similarity to one another, and with the
relatively low resolution of the intestinal microbiota analysis achievable with PCR-DGGE
compared with high throughput sequencing, it cannot be disregarded that the overall
allochthonous community are resistant to diet based variation as observed by Wong et al.
(2013). Indeed, all sequenced OTUs were members of the Firmicutes, regardless of
treatment abundances. Further work utilising higher resolution microbial analysis
techniques must be carried out to give a more in depth view of the effect of wheat gluten
on the allochthonous bacterial community of rainbow trout.
From the results observed in this preliminary experiment, further, longer term trials utilising
a multi-disciplinary and higher resolution approach will enable further insight into the
potential role of wheat glutens in the replacement of fishmeal and soy proteins in
aquafeeds.
Chapter 3
85 | P a g e
Chapter 3b: The effect of dietary wheat gluten products on gut health,
allochthonous intestinal microbial population and growth performance of
juvenile rainbow trout (Oncorhynchus mykiss).
3.1b. Introduction
As discussed in section 3.5a, diets containing wheat gluten up to inclusion levels of 15%
caused significant, but non detrimental, modifications in the intestinal microflora of rainbow
trout. There were no observed detrimental impacts on the gross structure or morphology of
the intestinal enterocytes at a qualitative level, and palatability of the diets was good. It is
not however, clear if the microbial modulations persist for longer periods, nor is it clear of
the lack of detrimental impacts on intestinal health continue after longer exposure, or if
inflammatory responses are manifested at the molecular level. Therefore, a second, full
scale, feed trial was conducted to investigate the gastrointestinal tract health and growth
performance utilising a multidisciplinary approach.
The expression of genes in the intestine can be utilised as an indicator of gut health and
immunological status (Mulder et al., 2007). To the authors knowledge, the effect of wheat
gluten on the expression of inflammatory cytokines, stress biomarkers and cell proliferation
associated genes have not yet been reported for juvenile rainbow trout fed dietary wheat
glutens. These analyses have the capability to reveal the effect of wheat gluten, and their
metabolites, on intestinal health. Specific beneficial amino acids and their metabolites have
considerable potential for health benefits via a number of mechanisms (Li et al., 2009). High
throughput sequence analysis will build on the PCR-DGGE observations in Chapter 3a,
Chapter 3
86 | P a g e
providing a higher resolution and thus further insight into the effects of wheat glutens on
the gut microbiota of rainbow trout.
The effect of the type of wheat gluten will also be more intensively analysed. As observed in
chapter 3a, hydrolysed and vital wheat glutens can have differing effects on the intestinal
microbiota. Building on this, the current chapter will include the analysis of three types of
wheat gluten: an un-processed (vital) wheat gluten and two variations of hydrolysed wheat
gluten. A hydrolysed wheat gluten with the soluble portion of the protein removed
(hydrolysed) and a soluble hydrolysed wheat gluten, where the soluble portion of the
protein remains (soluble). The use of proteolytic enzymes is a well known and efficient
method of protein modification (Adler-Nissen, 1986). Through controlling reaction
conditions during the hydrolysis process, specific hydrolysate characteristics can be
achieved. Vital wheat gluten, insoluble at neutral pH, can be hydrolysed to enhance foaming
and emulsifying properties and importantly its solubility at varying pH’s (pH 2 to pH 12)
(Kong et al., 2007; Popineau et al., 2002; Mimouni et al., 1994). The hydrolysation process
will not only alter the properties of the wheat gluten as a pellet binder, it is hypothesised
that the resulting low molecular weight peptides produced are more readily absorbed in the
intestine, without the need for digestion in the stomach, in turn making the protein more
available to the fish (Tello et al., 1994).
The objectives of this investigation are to assess the impacts of varying types of wheat
gluten on the growth performance and intestinal health of juvenile rainbow trout. A
multidisciplinary approach will achieve a holistic view of the promising alternative protein
sources. High throughput sequence analysis will enable high resolution observations of the
Chapter 3
87 | P a g e
potential impacts of wheat gluten on the allochthonous bacterial population. This study also
aims to assess the impact of dietary wheat gluten on the intestinal immune status through
the analysis of the relative gene expression of the anti-inflammatory cytokines interleukin
10 (IL 10) and transforming growth factor beta (TGF β) and the pro-inflammatory cytokines
interleukin 8 (IL 8) and tumour necrosis factor alpha (TNF α). As a measure of antioxidant
status and cellular stress level, the gene expression of Glutathione S-transferase (Glute ST)
and heat shock protein 70 (HSP 70) were also assessed. Microscopic and histological
techniques were utilised to assess potential impacts on intestinal morphology.
3.2b. Materials and methods
All experimental work involving fish was conducted under the UK Home Office project
licence PPL 30/2644 and was in accordance with the UK Animals (Scientific Procedures) Act
1986 and the Plymouth University Ethical Committee.
3.2.1b. Experimental design
Four hundred and sixty five rainbow trout (XXX triploid genotype and wild phenotype) were
obtained from Exmoor Fisheries (Somerset, UK). After a two week acclimation period, at the
Aquatic Animal Nutrition and Health Research Facility at the university of Plymouth, the fish
were graded and randomly distribute into 15, 120L fibreglass tanks (31 fish per tank;
average weight = 24.80 ± 0.31g) in a 7,000 litre closed recirculation system. Over the course
of a 66 day nutritional feed trial, varying levels of vital (comprising 10% and 20% of the diet),
hydrolysed (10%) and soluble (10%) wheat gluten meals were fed to rainbow trout at the
expense of soy protein concentrate, along with a soy protein control. Dietary treatments
Chapter 3
88 | P a g e
were randomly attributed to triplicate tanks, and fed at a rate of 1.5 - 2.5% of biomass per
day in equal rations at 09:00, 13:00 and 17:00 daily. Feed was adjusted daily on a predicted
FCR of 1.2, based on initial biomass weights, and subsequent bi-weekly tank biomass
weighing data. Rainbow trout were maintained at 15 ± 1oC with a 12:12 light dark
photoperiod. pH was maintained at 7.0 ± 0.5 and >85% dissolved oxygen. Temperature, pH
and dissolved oxygen were monitored daily. Water ammonia, nitrite and nitrate were
monitored weekly and maintained within the acceptable range for the species, and
managed with water changes to negate any detrimental build-up of compounds. At the trial
end point, samples were taken for carcass composition, haemato-immunology, histology,
molecular gene expression and microbiological analysis.
3.2.2b. Experimental diets
Five experimental diets were formulated and manufactured at the University of Plymouth as
described in section 2.3. The experimental wheat gluten products, vital wheat gluten
(Amytex®), hydrolysed wheat gluten (Merripro®) and hydrolysed soluble wheat gluten
(Solpro®) were supplied by Tereos Syral (Marckolsheim, France). Two inclusion levels of vital
wheat gluten, 10% and 20% (diet 10% Vital and 20% Vital, respectively) and two inclusion
levels of hydrolysed wheat glutens at 10% (diets 10% Hydro and 10% Sol, respectively) were
formulated with wheat gluten incorporated at the expense of soy protein concentrate, in
the same formulation as a soya protein control diet (diet SPC). Proximate composition of all
diets was carried out prior to the start of experimental feeding as described in section 2.8.
All diets were iso-nitrogenous and iso-lipidic. Diet formulation and proximate composition
can be seen in Table 3.1b.
Chapter 3
89 | P a g e
Table 3.1b. Dietary formulation and proximate composition (%).
Diets
SPC 10% Vital 20% Vital 10% Hydro 10% Sol
Ingredient (g / Kg)
Herring meal7 10 10 10 10 10
Soya protein concentrate1 52.00 39.62 27.38 38.77 38.49
Table 3.5b. Haematological and serological parameters of rainbow trout post 66 day feed trial. n = 15. Superscripts denote significance. Significance accepted at P<0.05.
estimations of >0.989 for the total species present per sample. Refraction of Goods
coverage plateaued after approx. 5,000 reads per sample (Figure 3.1b.), suggesting that the
bacterial communities were fully sampled and data are representative of the population.
Alpha diversity parameters can be found in Table 3.6b.
Bray Curtis analysis (figure 3.2b) revealed two main clusters. The first cluster consisting of
the hydrolysed treatments (10% Hydro and 10% soluble) and the second cluster of the vital
(10% vital and 20% vital) and the SPC treatment. Two samples , 10% soluble replicate #6 and
10% hydro replicate #6, are distinct from both clusters.
Figure 3.1b. Alpha rarefaction curves of Goods coverage representing % of total species present within a sample as a function of the sequencing effort.
Chapter 3
99 | P a g e
Table 3.6b. High throughput sequencing alpha diversity parameters, goods coverage estimations by treatment and phylogenetic distance of the allochthonous bacterial communities in the posterior intestine of rainbow trout post 66 day feeding trial.
treatment Goods coverage Observed species Chao1 index Shannon index
10% Sol 0.989±0.004b 567.16±93.87 742.67±88.7 5.64±1.26 20.7±2.91ab
Figure 3.2b. Bray-Curtis UPGMA UniFrac clustering of reads from treatment replicates of the allochthonous bacterial communities from the posterior intestine of rainbow trout, post 66 day feeding trial. Jackknife support is: Red (75-100%), yellow (50-75%) and green (25-50%). Scale bar indicates 10% divergence.
Chapter 3
100 | P a g e
The sequence distribution data were dominated by the Firmicutes at phylum level,
displayed in Figure 3.3b. The Firmicutes accounted for 76.17% of the total read sequences of
all treatments. The Bacteroidetes were the next most dominant phylum (11.16%), followed
by the Fusobacteria (4.32%), Proteobacteria (4.08%), Actinobacteria (1.50%), reads from the
kingdom bacteria (phylum unknown) (1.50%), and the Chloroflexi (0.82%). Other phyla
present in the sample-set, each with fewer than 0.2% of the total reads per phylum,
combined accounted for 0.45%. Reads associated with the “kingdom: bacteria”, but of
unknown phylum, accounted for an elevated percentage of the treatment reads of fish fed
the 10% Sol diet (7.27% ± 6.61) compared to all other diets. The proportion of all other
phyla was unaffected by dietary treatment (Table 3.7b.).
The sequence distribution data at genus level is displayed in Figure 3.4b. The most abundant
genus was Enterococcus, representing 46.52% of the total reads. Bacteroides represented
the next most abundant genus (7.65%) followed by Bacillus (6.66%), order: Bacteroidales
Ruminococcaceae (genus unknown) (2.21%), Peptostreptococcus (1.99%) and Macrococcus
(1.60%). The remaining genera present represent <1.5% of total reads.
Enterococcus, the most abundant genus as a percentage of total reads was significantly (P <
0.05) elevated in the 20% Vital and SPC fed fish (75.36% ± 20.17 and 54.54% ± 21.08,
respectively) compared to the 10% Hydro and 10% Sol fed fish (16.65% ± 6.38 and 13.74% ±
5.12, respectively). Fish fed the 10% vital diets had significantly lower proportion of
Enterococcus (38.79% ±19.03) than the 20% vital fed fish (P < 0.05), but the abundance was
not significantly different from the other treatments (P > 0.05). Statistical difference (P <
Chapter 3
101 | P a g e
0.05) between proportions of phyla and genera contributing > 0.2% of total reads in each
dietary treatment is displayed in Table 3.7b.
Figure 3.3b. Allochthonous bacterial communities in the posterior intestine of rainbow trout post 66 day feeding with experimental diets. Data are represented as bacterial phylum as a proportion of a total, expressed as a percentage. Data excludes phyla with less than 0.2% of the total reads
0%
10%
20%
30%
40%
50%
60%
70%
80%
90%
100%
SPC 10% Vital 20% Vital 10% Hydro 10% Sol
Rel
ativ
e ab
un
dan
ce (
%)
Treatment
Phyla
Firmicutes
Bacteroidetes
Fusobacteria
Proteobacteria
Actinobacteria
k|Bacteria;Other
Chloroflexi
Chapter 3
102 | P a g e
Figure 3.4b. Allochthonous bacterial communities in the posterior intestine of rainbow trout post 66 day feeding with experimental diets. Data are represented as bacterial Genus as a proportion of a total, expressed as a percentage. Data excludes genera with fewer than 0.2% of the total reads
0%
10%
20%
30%
40%
50%
60%
70%
80%
90%
100%
SPC 10% Vital 20% Vital 10%Hydro
10% Sol
Rel
ativ
e ab
un
dan
ce (
%)
Treatment
Family - Ruminococcaceae
Phylum - Firmicutes
Order - Rhizobiales
Order - Clostridiales
Order - Bacteroidalesr
Order - Bacillales
Kingdom - Bacteria
Weissella
Staphylococcus
Rummeliibacillus
Psychrilyobacter
Photobacterium
Peptostreptococcus
Macrococcus
Leuconostoc
Lactococcus
Lactobacillus
Gallicola
Fusobacterium
Facklamia
Enterococcus
Cetobacterium
Bradyrhizobium
Bacteroides
Bacillus
Ardenscatena
Family - Streptococcaceae
Family - Propionibacteriaceae
Family - Leuconostocaceae
Family - Enterococcaceae
Family - Enterobacteriaceae
Family - Bacillaceae
Class - Bacilli
Class - Alphaproteobacteria
Chapter 3
103 | P a g e
Table 3.7b. Allochthonous bacterial communities in the posterior intestine of rainbow trout post 66 day feeding with experimental diets. Data are represented as phyla and genus percentage means ± SD. Data excludes phyla and genus with less than 0.2% of the total reads. Kruskal-Wallis with post hoc Tukey-Kramer. Superscripts denote significance, significance accepted at P < 0.05.
Relative gene expression of IL-10, IL-8, TGF-β, TNF-α, Glute ST and HSP70 to reference genes
are presented in Figure 3.5b. The relative expressions of the pro-inflammatory cytokines
TNFα and IL-8 were unaffected by dietary treatment. The anti-inflammatory cytokine IL-10,
the immune-regulatory cytokine TGF- β and glutathione utilisation and antioxidant status
gene Glute ST were all also unaffected by dietary treatment. However, HSP70 expression,
which is up-regulated in response to a variety of stressful conditions, was significantly down-
regulated in all wheat gluten treatments compared to the SPC diet (P < 0.05).
Chapter 3
106 | P a g e
Figure 3.5b. Relative mRNA abundance of IL-10, IL-8, TGF β, TNF α, Glute ST and HSP70 to reference genes in the posterior intestine of rainbow trout post 66 day feed trial. Superscript letters denote significant difference (P < 0.05) between treatments. n = 6 per treatment. Data are means ± SE.
Chapter 3
107 | P a g e
3.3.4b. Intestinal histology
3.3.4.1b. Scanning electron microscopy
Scanning electron micrographs of the posterior intestine of the rainbow trout revealed no
qualitative effects induced by the inclusion of wheat gluten in the experimental diets
compared to the SPC treatment. Gross structure qualitative analysis showed evenly shaped
and distributed enterocytes with no signs of necrosis or gross damage. Quantitative analysis
of microvilli density (arbitrary units) was also unaffected by the dietary regimes fed to
experimental fish, despite numerical trends (Figure 3.7b.). Microvilli form and distribution
looked uniform across treatments with densely packed microvilli, with no sign of patchy or
damaged areas (Figure 3.6b.).
Chapter 3
108 | P a g e
Figure 3.6b. Scanning electron micrographs of the posterior intestine of rainbow trout fed experimental diets; SPC (A), 10% Vital (B), 20% Vital (C), 10% Hydro (D) and 10% Sol (E) for 66 days. Scale bars = 1 µm.
C
B
E
D
A
Chapter 3
109 | P a g e
Figure 3.7b. Threshold analysis of scanning electron micrographs of posterior intestine micro villi density of rainbow trout. Data are means ± SE.
3.3.4.2 Light microscopy
Figure 3.8b illustrates representative PAS with alcian blue and H & E stained sections of the
rainbow trout posterior intestine at the end of the trial. Goblet cell counts conducted on the
PAS stained sections revealed no significant difference (P > 0.05) between treatments.
Intraepithelial leukocytes, per 100 um-1, were significantly increased in the 10% Vital and 10%
Sol treatments (0.45±0.03 and 0.44±0.03, respectively) compared to the SPC treatment
(0.34±0.02) (P < 0.05). Significant difference between treatments was also observed in
regard to lamina propria width (Table 3.8b).
4
5
6
7
8
9
10
SPC 10% Vital 20% Vital 10% Hydro 10% Sol
Mic
rov
illi d
en
sit
y
(AU
)
Treatment
Chapter 3
110 | P a g e
Table 3.8b. Histological parameters of the posterior intestine of rainbow trout fed experimental diet for 66 days. Data are means ± SE. significance indicated by superscript letters accepted at P < 0.05.
Lamina propria width (µm) 9.48±0.41bc 11.83±0.44a 9.41±0.37c 10.29±0.35abc 11.03±0.36ab
Chapter 3
111 | P a g e
Figure 3.8b. Light micrographs of the posterior intestine of rainbow trout fed SPC (A & B), 10% Vital (C & D), 20% Vital (E & F), 10% Hydro (G & H) and 10% Sol (I & J) treatments for 66 days. H & E staining (A,C,E,G,I) and PAS staining (B,D,F,H,J). Arrows identify (K) Intraepithelial leukocytes, (L) goblet cells and (M) lamina propria. Scale bars = 100 µm.
D C
E F
G H
J I
A B
K
M
L
Chapter 3
112 | P a g e
3.4b. Discussion
The objective of the current investigation was to evaluate the effect of vital, hydrolysed and
soluble wheat gluten inclusions in soya based diets on rainbow trout growth performance,
gut microbiology, histology and immunological status of the posterior intestine.
Microbiological, molecular, and microscopy techniques were utilised to achieve these
objectives at the end of the feed trial.
Throughout the trial fish performed well, with FCR’s values lower than 1. Wheat gluten
inclusions had no significant effect on FCR’s compared to the soy protein control diet, yet
the 20% vital treatment performed significantly better than the two hydrolysed wheat
gluten treatments. The same trend was observed for protein efficiency ratios, yet no effect
on SGR or mean end point fish weight was observed across all treatments (mean fish weight
P = 0.052). Comparable growth performance has been observed when utilising wheat gluten
as a replacement of both fishmeal in Atlantic salmon (Salmo salar) (Storebakken et al., 2000)
and plant based proteins in rainbow trout (Tusche et al., 2012). Storebakken et al. (2000)
also observed improved protein apparent digestibility coefficients, as did Storebakken et al.
(2015), in line with the numerical trend observed for protein efficiency ratios in vital wheat
gluten fed fish. Improved growth performance (weight gain) has been reported in rainbow
trout with wheat gluten replacement of fishmeal and soy protein with additional amino acid
supplementation (Davies et al., 1997), and decreased FCR’s have been observed in hybrid
tilapia (Acipenser schrenckii × Huso dauricus ) (Qiyou et al., 2011). Despite no
significant difference in mean fish weight at the end of the trial, significance was very nearly
achieved between the SPC and 20% vital wheat gluten treatment (P = 0.052), significance
could well have been achieved if the trial had continued longer with the numerical trends in
Chapter 3
113 | P a g e
FCR and SGR. Observations of the performance of different wheat gluten types, hydrolysed
vs vital have never been analysed before, let alone in rainbow trout. Comparable 10%
inclusions of vital and hydrolysed wheat gluten had no significant difference in growth
performance. The positive performance of all treatments including the SPC treatment, with
an FCR lower than 1 may have masked a possible beneficial effect of wheat gluten inclusions,
unable to improve on very good growth performances observed in the basal treatment.
Wheat gluten inclusions had no effect on haematological and serological parameters
compared to the SPC control. Ten % vital wheat gluten however had significantly higher
In the present study goblet cell abundance in the posterior intestine was not affected by
dietary treatment. Producing mucus utilised for lubrication, digestive function, barrier
protection and pathogen translocation, goblet cells play a pivotal role in the intestine for
both nutrition and health. Intraepithelial leukocyte (IEL) numbers in the posterior intestine
were significantly elevated in the 10% vital and 10% soluble treatments compared to the
SPC treatment. The lack of lymphoid structures in teleost intestinal folds enhances the
importance of leukocytes in the epithelium and lamina propria as protection against
pathogenic insult. Comprised of diffuse populations of phagocytes, natural cytotoxic cells
Chapter 3
123 | P a g e
and lymphocytes, changes in IEL’s populations can be interpreted in two manners. Firstly, as
an increase in immune readiness for potential pathogen encounters, or secondly, an
increase could be due to pathogen identification and an active immune response. The
elevated IEL numbers observed in the present study combined with the survivability data
and gene expression analysis of inflammatory cytokines IL-8 and TGF-β, associated with
leukocyte chemotaxis, would suggest there is no underlying pathogenic insult. Therefore, it
could be concluded that the 10% inclusion of vital or soluble wheat gluten enhances the
immune potential of the posterior intestine. Twenty % vital and 10% hydrolysed wheat
gluten inclusions also numerically increased IEL counts, but not significantly so. Lamina
propria width was significantly increased in the 10% vital treatment compared to the SPC
and 20% vital treatments. Morphological changes in the posterior intestine have been well
observed in salmonids in response to full-fat and solvent extracted soy bean meal, including
the widening of the lamina propria (Rumsey et al., 1994; Bureau et al., 1998; Refstie et al.,
2000; Ostaszewska et al., 2005) which has been associated with inflammation and
chemotaxis of mixed leukocytes into the lamina propria and submucosa. The widening
observed in the present study is again inconsistent with gene expression analysis regarding
inflammation and level of leukocyte migration to the posterior intestine. There was no
observed effect on lamina propria width with a higher inclusion of vital wheat gluten (20%
vital wheat gluten treatment), or with 10% inclusion levels of hydrolysed type wheat gluten
protein sources. In addition, Storebakken et al. (2000) observed little change to intestinal
morphology with 50% of total protein in the diet supplied by wheat gluten (29.12%
ingredient inclusion) for Atlantic salmon, with only one sampled fish exhibiting moderate,
non-specific change. Apper et al. (2016) observed no effect on lamina propria width with 6%
hydrolysed wheat gluten inclusion, consistent with the findings of the current study. The
Chapter 3
124 | P a g e
reason for the increased lamina propria width as observed in the present study is therefore
not clear.
3.5b. Conclusion
Over the course of the current 66 day feed trial the incorporation of wheat gluten,
regardless of processing level, as a substitute for soy protein concentrate in aquafeed for
rainbow trout, had no effect on growth parameters compared to the soy protein control.
The increased inclusion level of 20% vital wheat gluten out preformed 10% inclusion levels
of hydrolysed products (10% hydrolysed and 10% Solpro) in terms of feed conversion ratio
and protein efficiency ratio.
Wheat gluten inclusions and types had a modulatory effect on the allochthonous microbial
population of rainbow trout. Overall population constituents at phylum level were
unaffected by dietary inclusions of wheat gluten and dominated by Firmicutes, as observed
by Desai et al. (2012) as a result of increasing plant protein inclusions. However,
observations at genera level revealed significant differences between wheat gluten inclusion
types and varying inclusion levels. Cluster analysis revealed that the bacterial communities
from fish fed hydrolysed products had a higher level of similarity to one another than to the
vital wheat gluten and SPC treatments, which clustered together. This would suggest the
hydrolysed wheat gluten has a larger impact on the intestinal population than the vital
wheat gluten, yet significant intra-treatment variation was observed in line with the
observations of Mansfield et al. (2010) and Desai et al. (2012). Significant modulation of
genera was observed across all dietary treatments. Vital wheat gluten enhanced the
proportion of Enterococcus and Weissella in the 20% and 10% vital wheat gluten treatments,
Chapter 3
125 | P a g e
respectively, compared to the SPC or other wheat gluten treatments. Bacillus and
Leuconostoc relative abundance was significantly increased in the 10% hydrolysed wheat
gluten and 10% soluble wheat gluten fed fish, respectively, compared to the SPC diet. These
genera have all been shown to contain probiotic species, with the potential to aid the
intestine in health and/or nutritional function when present in the microflora. This would
indicate that the addition of wheat gluten products in aquafeed formulations has the ability
to enhance probiotic genera within the allochthonous microbial population, without
affecting the overall structure of the intestinal microbiota, as also noted by Wong et al.
(2013).
The gene expression analysis revealed little effect on the localised immune response, with
dietary inclusions of wheat gluten showing no effect on the pro-inflammatory cytokines IL 8
and TNF α and the anti-inflammatory cytokines IL 10 and TGF β. Antioxidant status was also
unaffected. The expression of HSP 70 however showed a significant down-regulation,
indicating a reduced level of stress with wheat gluten inclusion compared to the SPC
treatment, likely caused by a reduction in the abundance of dietary ANF’s and the high
levels of glutamine within wheat gluten providing the substrate and energy for highly
proliferating intestinal cells. In addition, increased intestinal intraepithelial leukocyte
numbers were observed in the wheat gluten fed fish, leading to a potentially enhanced non-
specific immune response, highly important to teleosts.
In conclusion, wheat gluten products are a promising alternative plant protein source
providing adequate growth performance with the added benefits of enhancing beneficial
Chapter 3
126 | P a g e
bacterial genera in the posterior intestine, reducing intestinal stress and potentially
enhancing the non-specific innate immune system of rainbow trout.
Further investigations into the utilisation of blended wheat gluten proteins in aquafeeds are
needed, enabling increased levels of wheat gluten to be incorporated in aquafeeds,
overcoming limitations of extruding processes. Additional evaluations of inclusion levels for
optimal growth performance should also be investigated.
Chapter 4
127 | P a g e
Chapter 4: The effect of commercially relevant blended wheat gluten on
growth performance, condition and intestinal microbiota in juvenile rainbow
trout (Oncorhynchus mykiss).
4.1 Introduction
As a result of previous feed trials and associated microbiological, molecular and microscopic
analysis, wheat gluten products have been observed to be an appropriate alternative plant
protein source for juvenile rainbow trout (chapter 3). Inclusions levels of up to 20% had no
detrimental effect on growth performance, promoted beneficial bacterial species and
reduced intestinal stress compared to a soy protein control. The structural characteristics of
wheat glutens, which promote its pellet binding effects, raise commercial concerns over
pelleting high vital wheat gluten inclusion diets, and can require blending hydrolysed and
vital wheat glutens to enable extrusion and optimal pellet characteristics.
Starches have traditionally been utilised as pellet binders, despite limited digestibility in
salmonids and the associated detrimental effect starches can have on blood glucose
regulation with high carbohydrate levels (Krogdahl et al., 2004; Hemre et al., 1995;
Storebakken et al., 2000; Bergot, 1979). Hydrocolloid binders, utilised mainly in moist feeds
for ground dwelling grazing crustaceans and echinoderms (Tacon, 1987), produce water
Table feeds, yet have been reported to reduce lipid and protein digestibility in salmonids
(Storebakken, 1985; Storebakken and Austreng, 1987). The monomeric gliadins (30 to 100
kDa) which constitute half of the protein fractions of vital wheat glutens produce
matrix viscosity and extensibility, whilst polymeric glutenin (100 kDa to >10,000 kDa),
Chapter 4
128 | P a g e
comprising the other half of the protein fraction, generate cohesiveness and elasticity
(Apper-Bossard et al., 2013). Through the feed preparation and extruding process, hydration,
mixing, shearing and heating, wheat gluten form a variety of natural bonds (hydrogen, ionic,
hydrophobic and covalent disulphide) binding and entrapping other ingredients in a
cohesive network (Wieser, 2007; Apper-Bossard et al., 2013).
The addition of vital wheat gluten in extruded aquafeeds has been shown to increase pellet
hardness and durability, with increasing vital wheat gluten inclusion from 10 to 20% (Apper-
Bossard et al., 2013). Draganovic et al. (2011) also reported increased radial expansion of
extruded wheat gluten pellets compared to a fishmeal based diet, and increased breaking
strength. Increased pellet breakdown time was also observed in the wheat gluten inclusion
pellets, attributed to vital wheat glutens water insolubility, a positive attribute for diets
requiring high water stability. The addition of hydrolysed wheat gluten (HWG) has been
reported to reduce die pressure, specific mechanical energy (SME) and torque required for
extruding with increasing HWG inclusion from 0 to 13.46% of the diet (Storebakken et al.,
2015). Radial expansion was also increased with up to 13.46% inclusion, however water
stability decreased. The highest inclusion level of 26.94% was prevented from being
extruded due to the visco-elastic nature of wheat gluten, and required significant reduction
in water content (19-20% reduced to 11%) to enable the diet to be extruded, die pressure
was reduced with increased SME. Water stability and durability were also reduced with the
highest HWG inclusion level (Storebakken et al., 2015). A blend of the two wheat gluten
products has enabled a patented extrusion process enabling high inclusion levels of wheat
gluten to be incorporated into aquafeed.
Chapter 4
129 | P a g e
Growth performance of rainbow trout fed varying levels of vital and hydrolysed wheat
gluten in chapter 3 showed no dietary effect on growth performance. To this author’s
knowledge, there is currently no information on the application of blended vital and
hydrolysed wheat gluten products in aquafeeds. Previous literature has observed
comparable or significant improvements on growth parameters in various commercially
relevant species when replacing fishmeal of soya proteins as discussed in section 1.3.2.
Chapter 3 identified the 20% vital wheat gluten diet to be numerically advantageous over
the other treatments, and was the basis of this investigations design.
The aim of the present investigation was to assess the effects of 20% vital, 20% hydrolysed
(soluble) and three inclusion levels of a blend of the two wheat glutens (20%, 25% and 30%)
on the growth performance, somatic indices and allochthonous microbiota of juvenile
rainbow trout.
4.2 Materials and methods
All experimental work involving fish was conducted under the UK Home Office project
licence PPL 30/2644 and was in accordance with the UK Animals (Scientific Procedures) Act
1986 and the Plymouth University Ethical Committee.
4.2.1 Experimental design
Five hundred and forty rainbow trout were obtained from Exmoor Fisheries (Somerset, UK).
After a two week acclimation period, at the Aquatic Animal Nutrition and Health Research
Facility at the university of Plymouth, the fish were graded and randomly distributed into 18,
120L fibreglass tanks (30 fish per tank; average weight = 26.70 ± 0.12g) in a 7,000 litre closed
Chapter 4
130 | P a g e
recirculation system. Over the course of an 56 day feeding trial, two inclusions of wheat
gluten products at 20% (20% vital wheat gluten and 20% soluble wheat gluten) and three
inclusions of a blend of soluble and vital wheat gluten (20%, 25% and 30% inclusion levels)
were fed to rainbow trout at the expense of soy protein concentrate, along with a plant
protein control. Dietary treatments were randomly attributed to triplicate tanks, and fed at
a rate of 1.5 - 2.5 % of biomass per day in equal rations at 09:00, 13:00 and 17:00 daily. Feed
was adjusted daily on a predicted FCR of 1, based on initial biomass weights. Rainbow trout
were maintained at 15 ± 1oC with a 12:12 light dark photoperiod. pH was maintained at 7.0
± 0.5 and >85% dissolved oxygen. Temperature, pH and dissolved oxygen were monitored
daily. Water ammonia, nitrite and nitrate were monitored weekly and maintained within the
acceptable range for the species, and managed with water changes to negate any
detrimental build-up of compounds.
2.2.2. Experimental diets
Six experimental diets were formulated and manufactured at the University of Plymouth as
described in section 2.3. Vital wheat gluten (Amytex®), and hydrolysed, soluble wheat
gluten (Solpro®) were supplied by Tereos Syral (Marckolsheim, France). Each wheat gluten
product was included in its own diet at an inclusion level of 20% (20% Vital and 20% Sol
treatments), and a further three diets were manufactured with wheat gluten blended in a
ratio of 18:2, vital to soluble wheat gluten at inclusion levels of 20%, 25% and 30% (20%
Blend, 25% Blend and 30% Blend treatments), incorporated at the expense of soy protein
concentrate, in the same formulation as a soya protein control diet (diet SPC). Additional L-
Lysine was added to all diets to exceed the minimum nutritional requirements of rainbow
trout. Proximate composition of all diets was carried out prior to the start of experimental
Chapter 4
131 | P a g e
feeding as described in section 2.8. All diets were iso-nitrogenous and iso-lipidic. Diet
formulation and proximate composition can be seen in Table 4.1.
Table 4.1. Dietary formulation and proximate composition (%).
SPC
20% Vital
20% Sol 20%
Blend 25% Blend
30% Blend
Ingredient (%) Herring meal5 10 10 10 10 10 10
Soya protein concentrate1
52.00 27.38 25.67 27.21 21.05 14.89
Soyabean meal7 10 10 10 10 10 10
Vital wheat gluten3 - 20 - 18 22.5 27
Soluble wheat gluten4 - - 20 2 2.5 3
Corn starch6 7.69 13.56 14.05 13.61 15.06 16.52
Fish oil2 16.49 15.47 16.61 15.58 15.35 15.12
L-Lysine HCl6 1.85 1.59 1.67 1.6 1.53 1.47
Calcium carbonate8 1 1 1 1 1 1
Vitamin mineral premix9
0.5 0.5 0.5 0.5 0.5 0.5
CMC-binder6 0.5 0.5 0.5 0.5 0.5 0.5
Antioxidant mix10 0.03 0.03 0.03 0.03 0.03 0.03
Proximate composition (%)
Moisture 5.27 6.00 5.37 5.95 5.89 5.91
Protein 45.73 45.45 45.41 45.38 46.07 46.00
Moisture 5.27 6.00 5.37 5.95 5.89 5.91
Lipid 17.08 16.81 17.26 16.81 17.28 17.23
ash 7.03 5.55 5.36 5.59 5.28 4.98
1 SPC 60 (BioMar, DK);
2 Epanoil (Seven Seas, UK);
3 Amytex® (Tereos syral, FR);
4 Solpro®(Tereos syral, FR)
5 LT94
Herring meal (CC Moore, UK); 6
(sigma Aldrich, UK); 7
HP 100 (Hamlet, DK); 8 (Fisher Scientific, USA);
9 PNP Fish:
Ash 78.7 %, Ca 12.1 %, Mg 1.56 %, P 0.52 %, Cu 0.25 g/kg, Vit. A 1.0 μg/kg, Vit D3 0.1 μg/kg, Vit. E 7 g/kg (Premier Nutrition, UK);
10 Ethoxyquin 0.075 gKg
-1, BHT 0.05 gKg
-1, Natural tocopherols 0.2 gKg
-1 (Premier Pet
Nutrition, UK).
Chapter 4
132 | P a g e
4.2.3. Sampling
Throughout the course of the feeding trial, tank biomass was bulk weighed bi-weekly, and
prior to end point sampling to allow the calculation of growth performance as described in
section 2.5.
Two fish per tank were sampled at the end point of the 56 day trial for microbiology (n = 6
per treatment). A further two fish per tank were euthanised and samples taken for
microscopy (n = 6 per treatment) and two fish per tank were also euthanised for analysis of
carcass composition. Fish were euthanised via concussion followed by destruction of the
brain, in accordance with the schedule one procedure of the Animals (Scientific Procedures)
Act 1986. Fish for microbiological analysis were dissected and samples obtained under
aseptic conditions. The intestine of the fish were excised post pyloric caeca to the anal vent,
visceral fat removed and samples taken from identical areas of the posterior region as
described in section 2.6. Digesta for microbiological analysis of allochthonous bacterial
community was collected from the entire posterior intestine under aseptic conditions
utilising sterile forceps and collected in PCR clean / sterile microcentrifuge tubes, before
storage at -20oC.
4.2.4. Proximate composition
Proximate composition of diets and carcasses was carried out as described in section 2.8.
Chapter 4
133 | P a g e
4.2.5. Haematological and serological analysis
Blood was taken from the caudal vein of four fish per tank at the conclusion of the feed trial,
achieving an n = 12 per treatment. Hematological and serological analysis was carried out as
described in section 2.9.
4.2.6. Somatic indices
Post euthanasia, specific weights and lengths of experimental animals were taken for
Fulton’s K-factor, hepatosomatic and viscerosomatic incises as described in section 2.7.
4.2.7. Microbiological analysis / PCR-DGGE and sequencing
For PCR-DGGE analysis, digesta was sampled from two fish per tank, providing n = 6 per
treatment. DNA extraction and Denaturing gel gradient electrophoresis was carried out as
described in sections 2.10.1. and 2.10.2., respectively, on five of the six samples taken per
treatment. The sample omitted was selected at random providing a final n = 5 per treatment,
allowing all samples to be run on a single gel, allowing cross treatment comparison.
4.3 Results
4.3.1. Gross observations
Over the course of the 56 day feed trial fish accepted the experimental diets well and grew
consistently throughout the trial. Survivability was unaffected by dietary treatment.
Chapter 4
134 | P a g e
4.3.2. Growth performance and carcass composition
Growth performance was assessed at the end point of the 56 day feed trial, based on the
final tank biomass weights. Assessment of growth performance was achieved through FCR,
SGR, mean fish weight, PER, K factor and survivability (Table 3.3b). Rainbow trout in all
treatments performed well throughout the trial with good appetites, achieving good growth
performance with FCR’s ranging from 1.18 ± 0.02 in the SPC treatment to 1.09 ± 0.02 in the
20% Sol diet. FCR was significantly improved (P < 0.05) in all wheat gluten treatments
compared to the SPC control. SGR, PER, and mean fish weight at the end point of the trial all
showed the same significant improvements in all wheat gluten treatments compared to the
SPC treatment (P < 0.05). There were no significant differences observed between wheat
gluten treatments for any growth performance parameters (Table 4.2)
Carcass protein post 56 day feed trial was unaffected by wheat gluten inclusions compared
to the SPC treatment. The 20% Sol and 30% Blend treatments (14.94 ± 1.74% and 14.64 ±
0.29% respectively) were however significantly elevated (P < 0.05) compared to the 20%
Vital treatment (12.75 ± 1.51%). Carcass lipid was significantly increased (P < 0.05) in the 20%
Vital treatment (14.17 ± 1.60%) compared to the SPC, 20% Blend and 30% Blend treatments
(12.06 ± 0.27%, 11.62 ± 1.36% and 12.09 ± 0.81% respectively), all other treatments showed
no significant difference in lipid composition (table 4.3). Moisture was significantly
decreased (P < 0.05) in the 20% Sol and 30% Blend treatments (68.64 ± 3.88% and 70.51 ±
0.55% respectively) compared to the SPC diet (72.17 ± 0.94%), all other treatments showed
no significant difference. Ash was significantly decreased in the 20% Vital (1.42 ± 0.06%) and
20% Sol (1.41 ± 0.15%) treatments compared to the SPC treatment (1.68 ± 0.08). Blended
Chapter 4
135 | P a g e
wheat gluten inclusions were not significantly different from any other treatment (P>0.05).
Data is presented in Table 4.3.
4.3.3. Somatic indices and haematological parameters
Condition factor (K-factor) and VSI were unaffected by dietary treatment post 56 day feed
trial. Hepatosomatic index was significantly increased in the 30% blended wheat gluten
treatment (1.17 ± 0.09) compared to the SPC, 20% Vital and 25% Blend treatments (Table
4.4).
Most haematological parameters, haemoglobin level and serum lysozyme activity were
unaffected by dietary inclusion of wheat gluten at the conclusion of the feed trial. Packed
cell volume (haematocrit) was significantly increased in the 20% Sol treatment (33.58 ±
6.33 %) compared to the 20% Vital treatment (26.33 ± 6.19 %).
Chapter 4
136 | P a g e
Table 4.2. Growth performance of rainbow trout at the end of the feed trial. n = 3. Superscripts denote significance. Significance accepted at P<0.05.
Table 4.3. Carcass composition of rainbow trout at the end of the feed trial. n = 3. Superscripts denote significance. Significance accepted at P<0.05.
† calculated utilising the conversion factors of 23.6, 39.5, and 17.2 kJ g− 1 for protein, lipid, and nitrogen-free extract (NFE), respectively (Tytler and Calow, 1985).
Table 4.4. Somatic, Haematological and serological parameters of rainbow trout post 56 day feed trial. n = 12. Superscripts denote significance. Significance accepted at P<0.05.
HSI = hepatosomatic index, VSI = Viscerosomatic index
Chapter 4
138 | P a g e
4.3.4. Intestinal microbiology
4.3.4.1. PCR-DGGE
V3 16S rRNA PCR-DGGE fingerprints and associated dendrogram, showing a degree of
clustering, form the allochthonous microbiota extracted from the posterior intestine at the
end of the feeding are presented in Figure 4.1. Ecological parameters and pairwise
comparisons are presented in Table 4.4.
The denaturing gradient gel revealed a total of 71 distinct OTU’s within the digesta of
sampled fish. Comparison of the experimental diets with the plant protein control revealed
a relatively low level of similarity in bacterial communities (28.92 – 53.51 %) (Permanova),
decreasing with increasing blended wheat gluten inclusion. 45.13% similarity was observed
between the SPC and 20% Blend treatments, reducing to 28.92% similarity between the SPC
and 30% Blend treatments (Table 4.4). All treatments were significantly different from one
another (P < 0.05). Intra-treatment similarity (SIMPER) significant differences (P < 0.05) are
presented in Table 4.4. OTU’s per treatment and ecological parameters, diversity and
richness, were unaffected by dietary treatment.
4.3.4.2. DGGE sequence analysis
Twelve prominent OTU’s were excised from the PCR-DGGE gel for sequence analysis. Only
three of the excised bands yielded sequences of sufficient quality for taxonomic
identification, despite numerous PCR enzymes and protocols tested.
Chapter 4
139 | P a g e
The three bands returned sequences for Weissella confusa (96% alignment similarity),
Aerococcus sp. (95% alignment similarity) and Macrococcus caseolyticus (99% alignment
similarity). Species presence in replicates per treatment is presented in Table 4.7.
Figure 4.1 PCR–DGGE fingerprint profiles with cluster analysis dendrograms of the posterior intestinal microbiota of rainbow trout at the end of the feeding trial.
Chapter 4
140 | P a g e
Table 4.6. Allochthonous microbial community analysis from the PCR-DGGE of the bacterial communities in the posterior intestine of Rainbow trout fed experimental diets for 56 days. (ANOVA + post hoc Tukey’s) Significance accepted at P < 0.05. Values expressed as means ± standard deviation. Superscripts denote significance. Significance accepted at P<0.05. Ecological parameters PERMANOVA
Table 4.7. Closest bacterial relatives (% similarity) of excised and sequenced bands from the PCR-DGGE of rainbow trout digesta samples from the posterior intestine, post 8 week feeding of experimental diets. Presence absence of bands within treatment replicates is indicated in column 2-7. Numbers represent bands present in number of replicates. 0 = not present in any replicate, 5 = present in all five treatment replicates.
Band ID
Band presence Phyla Nearest neighbour Alignment similarity
estimations of > 0.998 for the total species present per sample. Refraction of Good’s
coverage plateaued after approx. 5,000 reads per sample (Figure 5.1.), suggesting that the
bacterial communities were fully sampled and data are representative of the population. No
significant difference was observed in alpha diversity parameters between treatments (P >
0.05) (table 5.5.).
Figure 5.1. Alpha refraction curves of Good’s coverage representing % of total species present within a sample as a function of the sequencing effort.
Chapter 5
165 | P a g e
.
Figure 5.2. Bray-Curtis UPGMA UniFrac clustering of reads from treatment replicates of the allochthonous bacterial communities from the posterior intestine of rainbow trout, post 70 day feeding trial. Jackknife support is: Red (75-100%) and yellow (50-75%). Scale bar indicates 10% divergence.
Chapter 5
166 | P a g e
Table 5. 5 . High throughput sequencing alpha diversity parameters, goods coverage estimations by treatment of the allochthonous bacterial communities in the posterior intestine of rainbow trout post 70 day feeding trial
The sequence distribution data were dominated by the Firmicutes at phylum level, as
displayed in Figure 5.3. The Firmicutes account for 92.61% of the total read sequences of all
treatments. The Actinobacteria were the next most dominant phylum (3.02%) followed by
the Bacteroidetes (2.73%) and Proteobacteria (0.88%). Other phyla present in the sample-
set, each with fewer than 0.2% of the total reads per phylum, combined accounted for
0.07%. Phylum composition of the allochthonous microbial community was unaffected by
dietary treatment or scFOS inclusion.
The sequence distribution data a genus level is displayed in Figure 5.4. The most abundant
genus was Enterococcus, representing 31.17% of the total reads. Bacillus represented the
next most abundant genus (22.14%) followed by class Bacilli (15.37%), order: Bacillales
(genus unknown) (5.35%), family Enterococcaceae (genus unknown) (5.30%), Weissella
(4.15%), Macrococcus (2.89%), Bacteroides (2.70%), Staphylococcus (1.63%) and Kocuria
(1.51%). The remaining genera present represent <1.5% of total reads.
Chapter 5
167 | P a g e
Enterococcus, the most abundant genus in terms of sequence distribution and as a
percentage of total reads per treatment was significantly (P < 0.05) reduced in the 20%
blend + FOS treatment (18.16 ± 6.94%) compared to the 20% blend treatment (37.22 ±
10.38). The proportion of reads for the genus Enterococcus was unaffected by dietary
inclusion of wheat gluten or scFOS supplementation compared to the basal SPC diet, yet
significantly reduced in the 20% blend + FOS treatment compared to that of the 20% blend.
The percentage of reads associated with Family Enterococcaceae were unaffected in the
SPC + FOS and 20% blend treatments compared to the SPC treatment, however, 20% blend
+ FOS had significantly fewer reads associated to family Enterococcaceae than the SPC
treatment.
Reads associated with the class Bacilli were significantly elevated in the 20% blend + FOS
treatment (39.49 ± 4.68%) compared to the 20% Blend treatment (13.34 ± 5.62%). Class
Bacilli reads were also significantly elevated in both wheat gluten treatment compared to
the SPC treatments (P < 0.05). Reads associated with the genus Kocuria was statistically
elevated in the SPC + FOS treatment (3.45 ± 3.18%) compared to the SPC treatment (0.37 ±
0.11%), however, neither SPC treatment was significantly different from the wheat gluten
treatments. Statistical difference (P < 0.05) between proportions of genera contributing >
0.2% of total reads in each dietary treatment is displayed in Table 5.6.
Chapter 5
168 | P a g e
Figure 5.3. Allochthonous bacterial communities in the posterior intestine of rainbow trout fed the experimental diets. Data are represented as bacterial phylum percentage. Data excludes phyla with less than 0.2% of the total reads
0%
10%
20%
30%
40%
50%
60%
70%
80%
90%
100%
SPC SPC+FOS Blend Blend+FOS
Rela
tive a
bundance (
%)
Treatment
Tenericutes
Proteobacteria
Fusobacteria
Firmicutes
Bacteroidetes
Actinobacteria
Phylum
Chapter 5
169 | P a g e
Figure 5.4. Allochthonous bacterial communities in the posterior intestine of rainbow trout after feeding with the experimental diets. Data are represented as bacterial Genus percentage. Data excludes genera with less than 0.2% of the total reads.
0%
10%
20%
30%
40%
50%
60%
70%
80%
90%
100%
Re
lative
ab
un
da
nce
(%
)
Treatment
Order - Lactobacillales
Order - Bacillales
Weissella
Staphylococcus
Pseudoalteromonas
Macrococcus
Leuconostoc
Lactobacillus
Kocuria
Enterococcus
Corynebacterium
Bacteroides
Bacillus
Arthrobacter
Aerococcus
Family - Ruminococcaceae
Family - Leuconostocaceae
Family - Leuconostocaceae
Family - Enterococcaceae
Class - Bacilli
Genus
Chapter 5
170 | P a g e
Table 5.6. Allochthonous bacterial communities in the posterior intestine of rainbow trout at the end of the trial. Data are represented as means ± SD. Kruskal-Wallis with post hoc Tukey-Kramer. Superscript letters denote significance, significance accepted at P < 0.05.
and Casp 3 are presented in Figure 5.5. The relative expressions of the pro-inflammatory
cytokine TNFα was significantly reduced (P < 0.05) with the addition of scFOS to the wheat
gluten basal diet, and numerically reduced with scFOS addition to the SPC basal diet, but not
significantly so. The pro-inflammatory cytokine IL-8 was unaffected by dietary treatment,
whilst IL-1β was numerically lower with scFOS inclusion in the wheat gluten basal treatment,
Chapter 5
172 | P a g e
and significantly down regulated in the 20% blend + FOS treatment compared to the SPC +
FOS treatment. The anti-inflammatory cytokine TGF- β followed the same trend with
numerically (P > 0.05) reduced expression in the 20% blend + FOS treatment compared to
the 20% blend treatment, however, no significant treatment effect was observed.
Glutathione S-transferase was significantly down regulated with the inclusion of scFOS in
both SPC and 20% blend basal diets (P < 0.05). HSP70 expression was significantly reduced in
the 20% blend + FOS treatment compared to the 20% blend and SPC + FOS treatments (P <
0.05). Casp 3 gene expression was significantly down regulated in the 20% blend + FOS
compared to the 20% blend treatment with the same, yet not significant, trend with
addition of FOS to the SPC basal diet.
Chapter 5
173 | P a g e
Figure 5.5. Relative mRNA abundance of IL-1 β, IL-8, TGF β, TNF α, Glute ST, HSP70 and Casp 3 in the posterior intestine of rainbow trout at the end of the feed trial. Superscript letters denote significant difference (P < 0.05) between treatments. n = 6 per treatment. Data are means ± SE.
Chapter 5
174 | P a g e
5.4 Discussion
The objective of the current investigation was to evaluate the effect of wheat gluten and
scFOS inclusions in soya based diets on the growth performance, gut microbiology,
immunological status and SCFA production in the posterior intestine of rainbow trout.
Microbiological, molecular and column chromatography techniques were utilised to achieve
these objectives at the end of the 70 day feed trial, as well as growth performance and
carcass composition analysis.
Throughout the trial fish performed well, with FCR’s lower than 1 observed. Wheat gluten
inclusion or scFOS supplementation had no significant effect on FCR’s compared between
the two basal treatments and scFOS supplementation in each. The same non-significant
differences were observed for SGR, protein efficiency ratio and mean fish weight at the
conclusion of the 70 day feed trial. (P > 0.05). Comparable growth performance has been
observed when utilising wheat gluten as a replacement of both fish meal in Atlantic salmon
(Storebakken et al., 2000), plant based proteins in rainbow trout (Tusche et al., 2012) and
was observed and discussed chapter 3b. The supplementation of scFOS has been previously
observed to result in comparable growth performance in European sea bass (Guerreiro et al.,
2015c), turbot (Scophthalmus maximus) (Guerreiro et al., 2014) and pacific white shrimp (Li
et al., 2007), yet contradictory results observing improved growth performance have been
reported in Pacific white shrimp, gilthead sea bream (Sparus aurata) and hybrid tilapia (Lv et
al., 2007; Zhou et al., 2009; Zhou et al., 2007; Guerreiro et al., 2015b). The only
investigations utilising prebiotics in salmonids observed increased weight gain in rainbow
trout, and comparable growth performance to the basal control diet in Atlantic salmon with
FOS supplementation (Ortiz et al., 2013; Grisdale-Helland et al., 2008). As discussed in
Chapter 5
175 | P a g e
section 3.4b, the excellent growth performance observed by the soy protein basal control
may have not left enough scope for nutritional improvement, with fish preforming optimally
on the cold extruded/pressed diets in a flow-through, virgin water experimental system.
Survivability and condition factor (K-factor) were unaffected by the dietary inclusion of
scFOS to basal diets or wheat gluten inclusion. Carcass lipid, protein ash and moisture
content was unaffected by dietary treatments, as was observed in chapter 3b with 20% vital
wheat gluten inclusions and chapter 4 with 20% blended wheat gluten inclusion compared
to the same basal soy protein control. No effect on carcass composition was observed with
scFOS supplementation in the mainly carnivorous gilthead sea bream and turbot (Guerreiro
et al., 2015b; Guerreiro et al., 2015a). Decreased crude protein in rainbow trout fillets have
been observed with FOS supplementation, however, with a non-significant trend for
increased lipid (Ortiz et al., 2013).
The effect of scFOS on the intestinal microbiota has been previously evaluated in Pacific
white shrimp and hybrid tilapia utilising selective agar or PCR-DGGE (Lv et al., 2007; Zhou et
al., 2009; Zhou et al., 2007). To the author’s knowledge, as yet, there is no previous
literature on the effect of scFOS supplementation on the allochthonous microbial
populations of rainbow trout, or analysis conducted utilising high throughput techniques.
Chapter 3 and 4 investigated and discussed the effects of wheat gluten products and
inclusion levels on the allochthonous microbial community.
Alpha refraction analysis of Good’s coverage reveals estimations of > 99.8%, indicative of a
fully sampled microbiome. Bray Curtis reveals two main clusters. The first cluster consisting
of the 20% blend + FOS treatment replicates and the second cluster of the SPC, SPC + FOS
Chapter 5
176 | P a g e
and the 20% blend treatment replicates, indicating greater similarity within these
treatments than with sample replicates from other clusters. Ecological parameters of the
sample replicates to have a higher level of similarity to one another than to the vital wheat
gluten and SPC treatments, which themselves clustered together. This would suggest the
hydrolysed wheat gluten has a larger impact on the intestinal population than the vital
wheat gluten, yet significant intra-treatment variation was observed in line with the
observations of Mansfield et al. (2010) and Desai et al. (2012). Significant modulation of
genera was observed across all dietary treatments. The relative abundance of Enterococcus
was highest, representing 46.52% of the total reads. Vital wheat gluten enhanced the
proportion of the lactic acid bacteria Enterococcus and Weissella in the 20% and 10% vital
wheat gluten treatments, respectively, compared to the SPC or other wheat gluten
treatments. The relative abundance of Bacillus and Leuconostoc was significantly increased
Chapter 6
195 | P a g e
in the 10% hydrolysed wheat gluten (Merripro®) and 10% soluble (Solpro®) wheat gluten
treatments, respectively, compared to the SPC diet. These genera have been shown to
contain probiotic species, with the potential to aid intestinal health and/or nutrition of fish
when present in the microflora. This would indicate that the addition of wheat gluten
products in aquafeed formulations has the ability to enhance probiotic genera within the
allochthonous microbial population, without affecting the overall structure of the intestinal
microbiota, as also noted by Wong et al. (2013) in rainbow trout and Reveco et al. (2014) in
Atlantic salmon with the addition of plant proteins.
The gene expression analysis focused on the immune relevant genes: IL-10, TNF-α, TGF-β
and IL-8, as well as intestinal and oxidative stress biomarkers: HSP 70 and Glute ST. Results
revealed little effect on the localised immune response, with dietary inclusions of wheat
gluten showing no effect on the pro-inflammatory cytokines IL-8 and TNF-α and the anti-
inflammatory cytokines IL-10 and TGF-β. Antioxidant status was also unaffected. The
expression of HSP 70 however showed a significant down regulation, indicating a reduced
level of stress with wheat gluten inclusion compared to the SPC treatment, likely caused by
the high levels of glutamine within wheat gluten providing the substrate and energy for
highly proliferating intestinal cells, and reduced ANF content in wheat gluten diets.
Histological assessment revealed an increase in the intraepithelial leukocyte numbers,
significantly so in the 10% vital and 10% soluble treatments compared to the SPC treatment,
leading to a potentially enhanced non-specific immune response, highly important to
teleosts exposed to a range of water borne pathogens, with the GI tract being a first line of
defence against pathogenic assault. No effect on epithelial cell condition, areas of damage
Chapter 6
196 | P a g e
or necrosis, were observed with scanning electron microscopy, nor was microvilli density
affected by wheat gluten inclusion.
The results from chapter 3 demonstrate beneficial effects of wheat gluten inclusions across
all inclusion types compared to the SPC treatment. The 20% vital wheat gluten inclusion
revealed the most promising growth performance, with no observed detriment with an
increased inclusion level compared to the other wheat gluten treatments. Including 20%
vital wheat gluten in commercial aquafeeds however presents further complication due to
the cohesive and visco-elastic nature of the protein source. These attributes negate the
need for pellet binders, an additional source of indigestible carbohydrate in salmonids, yet
prevent extrusion at high inclusion levels with commercial extruders. To achieve higher
inclusion levels wheat gluten must be blended, vital (Amytex®) with soluble (Solpro®) wheat
gluten which, as a result of the hydrolysation process it undergoes, has different pellet
binding characteristics compared to vital wheat gluten. As such, chapter 4 focused on the
growth performance, condition and effect on allochthonous microbiota of 20% inclusions of
vital (Amytex®) and hydrolysed-soluble (Solpro®) wheat gluten alone, as well as 20, 25 and
30% inclusions of the two blended.
The application of ≥20% wheat gluten products in the feed for juvenile rainbow trout
resulted in significantly improved growth performance and significantly heavier fish at the
conclusion of the 56 day feed trial. Improved growth performance in all wheat gluten
inclusion treatments is assumed to be as a result of improved amino acid digestibility as
identified by Davies et al. (1997) and Storebakken et al. (2015). Growth performance overall
was generally worse than observed in chapter 3b between comparable diets, however, the
Chapter 6
197 | P a g e
sub-optimal performance of the basal SPC treatment allowed improvements in growth
performance in wheat gluten treatments to be observed. The blend treatments of Amytex®
(vital) and Solpro® (soluble-hydrolysed) wheat gluten had no effect on carcass lipid or
protein content compared to the basal diet, although increased lipid was observed in the 20%
vital wheat gluten treatment compared to the SPC, 20% and 30% Blend and treatments,
contradictory to the results from chapter 3b. Protein was also significantly decreased in the
20% vital treatment compared to the 20% soluble and 30% blend treatments.
Somatic indices indicated that all fish were in good condition with Fulton’s K-factor ranging
from 1.21 ± 0.25 to 1.37 ± 0.10. K-factor was numerically superior in the blended wheat
gluten treatments, however, not significantly so. Viscerosomatic indices were also
unaffected by dietary treatment, indicating observations of increased carcass lipid was
probably not as a result of visceral fat deposition. Hepatosomatic indices were significantly
elevated in the 30% blended treatment compared to the SPC, 20% Vital and 25% Blend
treatments. Associated with dietary carbohydrate levels and phosphorous availability,
inclusions of wheat glutens would be assumed to have no impact on liver size, as observed
in previous studies utilising wheat glutens in rainbow trout (Tusche et al., 2012) and pacific
white shrimp (Molina-Poveda and Morales, 2004). Haematological parameter analysis
showed no detrimental effect in the wheat gluten inclusions, haemoglobin levels and
lysozyme activity was unaffected. Increased packed cell volume (haematocrit) was observed
in the 20% Soluble treatment compared to 20% Vital treatment, enhancing oxygen carrying
capacity of blood, yet with an associated increase in viscosity and the associated stress on
the circulatory system.
Chapter 6
198 | P a g e
Microbiological analysis was consistent with previous trials, observing no obvious overall
change to the allochthonous microflora composition. Genus level modulation was observed
with increased Weissella confusa levels, a potential probiotic in other fish species
(Rengpipat et al., 2008), in the wheat gluten treatments compared to the SPC treatment,
and reduction of Aerococcus sp., a potential fish pathogen. Macrococcus caseolyticus was
observed in all but the highest inclusion level of blended wheat gluten. Microbiological
analysis was hampered by poor returns of PCR products sent for Sanger sequencing, most
likely as a result of more than one OTU being present in a single PCR-DGGE band excised for
sequencing.
Chapter 4 revealed the application of wheat gluten inclusions; as either single products or
blended together, had no obvious detrimental effects for juvenile rainbow trout. Increased
growth performance with inclusion levels up to 30% support the other positive results
observed in chapter 4 as well as chapter 3. Blended wheat glutens, that allow higher
percentage of wheat gluten inclusion in commercially extruded aquafeeds, provided
improved rainbow trout growth performance compared to the control diet whilst
maintaining healthy somatic indices, with no large scale impact on the intestinal microflora.
These results led on to an investigation into the effects of scFOS, a prebiotic feed additive,
with and without wheat gluten inclusions in soya based diets.
Feed additives in recent years have become a major area of research for potential health
promoting effects in aquatic species (RingØ et al., 2010; Merrifield, 2014; Ringø et al., 2014).
The uses of prebiotics, focusing on modulating the intestinal microbiota through
fermentation of indigestible dietary fibre, often oligosaccharides, are one such feed additive
Chapter 6
199 | P a g e
receiving great attention. FOS and scFOS are among a plethora of prebiotics investigated as
discussed in section 1.5. Chapter 5 was designed to assess the potential of scFOS individually
and in combination with 20% blended wheat gluten inclusion on the health and
performance of juvenile rainbow trout. A 20% blend inclusion of wheat gluten was utilised
in the investigation on the basis of results of chapters 3 and 4. Twenty % inclusions are
achievable with blended formulation, improved growth performance with no observed
detrimental health effects to the intestine or allochthonous microflora were observed, and
the economic cost of higher inclusions would likely be unachievable in the commercial
sector.
Chapter 5 investigated the allochthonous microbial population and the expression of the
genes: IL-1 β, IL-8, TNF-α, TGF- β associated with inflammatory responses and the genes:
Casp3, HSP 70 and Glute ST associated with intestinal stress and oxidative stress in the
posterior intestine of juvenile rainbow trout post 10 week feed trial. SCFA analysis of the
posterior digesta was also undertaken to observe potential effects of scFOS
supplementation on intestinal microbial SCFA production.
The results revealed supplementation with the prebiotic scFOS in soy protein, or in diets
containing 20% blended vital and hydrolysed wheat gluten, to have no effect on growth
performance, condition factor, survival or carcass composition compared to the basal diets
(SPC or 20% Blend). No significant difference in growth performance or other performance
parameters was observed with 20% blended wheat gluten inclusion alone. Chapter 4
identified the ability of wheat gluten products at inclusion levels from 20 to 30%, to increase
growth performance. However, in chapter 5, as was also observed in chapter 3b, trout
Chapter 6
200 | P a g e
displayed very good FCR’s and SGR’s in the basal soy protein diet treatment, reducing the
scope for improved growth performance with feed additives or alternative protein sources.
As observed with microbiological analysis in chapters 3 and 4, experimental diets again were
observed to modulate the intestinal microbiota of juvenile rainbow trout. With scFOS
supplementation to the basal diets or with wheat gluten inclusion alone, the structure of
the allochthonous microbiota remained unchanged at phylum level, as also observed in
chapter 3, with dominance maintained by Firmicutes. Modulation of the intestinal
microbiota was observed at genus level. Enterococcus was again the most abundant genus
as was the case in chapter 3b, representing 31.17% of the sequence total reads. Twenty %
blended wheat gluten inclusion enhanced the proportion of OTUs of Arthrobacter,
Staphylococcus pasteuri and reduced order Bacillales. scFOS supplementation of the soy
protein basal treatments resulted in enhanced Kocuria reads, whist scFOS supplementation
of wheat gluten treatments increased Staphylococcus pasteuri and genus Lactobacillus
populations compared to all other treatments, an apparent symbiotic effect.
An apparent symbiotic effect was also observed in immuno-relevant and stress related gene
expression in the posterior intestine. scFOS supplementation in 20% wheat gluten diets
resulted in significant downregulation of the pro-inflammatory cytokine TNF-α, and
numerical, yet not significant, down regulation of IL-1β. The combined scFOS and wheat
gluten also resulted in significant down regulation of HSP 70, Casp 3 and Glute ST. Glute ST
expression saw significant down regulation with scFOS supplementation to both basal diets.
HSP 70, observed in chapter 3b to be down regulated with wheat gluten inclusions, was
unaffected with 20% blended wheat gluten inclusion in chapter 5.
Chapter 6
201 | P a g e
Despite the observations of the modulation of intestinal microflora, SCFA
production/concentrations in the posterior intestine were unaffected by dietary treatment,
with formic acid in the highest concentrations, followed by acetic and lactic acid. Butyric and
propionic acids were not detected. Observations of SCFAs in the digesta could however be
under reporting the true levels produced, due to the high rate of absorption in the posterior
intestine. This has been observed with higher concentrations reported in in vitro compared
to in vivo studies on the same species (Mahious, 2006; Kihara and Sakata, 2002).
This body of research adds a wealth of information in regards to the health, allochthonous
microflora, and growth performance of juvenile rainbow trout in response to wheat gluten
inclusions and scFOS supplementation. Throughout the three experimental chapters
limitations in methodologies and practices must be noted, as they have the potential to
affect the results observed. Firstly, molecular techniques rely on the efficient and complete
DNA/RNA extraction and amplification through polymerase chain reactions (PCR). Variation
in extractions and un-intentional PCR bias may be introduced prior to further down-stream
analysis and sequencing. A PCR-DGGE notable limitation, with possible relevance to
chapters 3a and 5, is the ability of more than one sequence migrating to the same point on
the gradient gel, forming a band identified as a single OTU. This phenomenon can result in
lower observed OTU’s per sample and can prevent successful identification with Sanger
sequencing. High-throughput analysis also has limitations associated with the analysis of
short reads, and often multiple 16S rRNA copy numbers per bacterium. The 16S rRNA gene
has been heavily relied upon for bacterial sequencing due to its universal phylogenetic
distribution, but copy numbers are inconsistent between species (Wintzingerode et al.,
Chapter 6
202 | P a g e
1997). These variations can lead to over or under estimates of taxa abundance. Further
information, for readers with interests in molecular technique strengths and weaknesses,
can be found in Jackson et al. (2000), Kuczynski et al. (2012) and Větrovský and Baldrian
(2013). Limitations were also observed with light microscopy. The high extent of intestinal
folding prevented consistent measurements of intestinal fold lengths, and perimeter ratio
calculations that have high relevance to observing changes in absorptive surface area of the
intestine.
The utilisation of microbial and molecular techniques, high throughput sequencing and gene
expression analysis, utilised through this body of research have improved the understanding
of rainbow trout intestinal health and microbiota. High throughput sequencing enables an
overview of the taxonomic profile of the microbiota, highlighting changes at varying
taxonomic levels between samples. These observable changes, however, cannot fully reveal
the extent to which modulation affects the entire intestinal system. The utilisation of
metagenomic analysis enables investigators to assess effects on the genetic potential of the
microflora (Ghanbari et al., 2015). Further research in the intestinal microbiota field,
especially in fish, should focus on the functional roles played by the microbiota by applying
metabolomics, metaproteomics and metatranscriptomics (Ghanbari et al., 2015).
Metatranscriptomics identifies active species through their gene expression in complex
communities, whilst metabolomics and metaproteomics have the ability to identify roles
microbes play in the intestine through the analysis of proteins and metabolites (Franzosa et
al., 2015). It should be noted, however, that extraction of bacterial RNA from fish digesta
samples is extremely challenging and likely to be an impediment to progress in this field.
Chapter 6
203 | P a g e
Furthermore, the analysis of cytokines and immune relevant genes provide only a snapshot
of large, complex molecular pathways associated with inflammatory responses in the
intestine. The use of proteomic approaches, potentially on intestinal mucus as a first step,
would improve our understanding of these pathways and their end functions (Rodrigues et
al., 2012; Almeida et al., 2015).
The utilisation of wheat glutens in aquafeeds was evaluated throughout this body of
research. Encouraging results have been observed in growth performance, microbiota
modulation and gene expression, with no signs of detrimental impacts to the intestine. The
promising amino acid profile, high in glutamine, and its low ANF content play into strengths
of wheat glutens as an alternative protein source for the replacement of fishmeal and soya
products for juvenile rainbow trout. The limitations of the extrapolation of results from
short feeding trials utilising juvenile fish (fingerling to sub-adult) must also be acknowledged.
The present research focused solely on juvenile fish, with the maximum average weight
achieved in the investigations reaching 85.46±2.06g. Throughout the production cycle
varying nutritional requirements are apparent. Further investigation into the potential role
of wheat glutens for aquafeeds for first feeders and fry, where there are more stringent
nutritional requirements for amino acids and energy, would be of great interest. Likewise,
more attention could be applied to fish at later stages such as harvest size fish (300-400g)
where economic cost of feed is of more significance. There would also be merit in applying
these studies to brood-stock fish, quantifying the effects on ova production, fecundity and
quality as well as milt production in male fish.
Chapter 6
204 | P a g e
It must also be noted the requirement for free crystalline lysine supplementation
throughout this programme of investigations. The low lysine content of wheat gluten makes
this essential amino acid the limiting factor, especially in higher wheat gluten inclusions in
trout, as it is with cereal grains in pigs (Adeola et al., 2001). The addition of free amino acids
incurs an additional cost to wheat gluten inclusion; although with increased production,
prices are lower than historically noted. Wheat gluten alone is itself more expensive than
other alternative plant protein sources such as soya products, potentially resulting in high
inclusions being economically unviable. This could ultimately lead to lower inclusion levels
and wheat gluten products being utilised as functional ingredients for its physical
characteristics as well as biological impacts. Indeed, 6% inclusion levels of Solpro® have
been observed to modulate the intestinal microbiota of Asian seabass (Apper-Bossard et al.,
2013), as did 7.5% inclusions of Amytex® and Merripro® for rainbow trout in chapter 3a.
Abiotic factors such as temperature variation may play an important role when one
considers the potential use of wheat gluten and prebiotics in salmonid aquaculture.
Observed alterations, especially in the microbiota, may be significantly affected by seasonal
variation. Winter water temperatures, which can regularly fall below 10oC, will have
consequences on the gut microbiota and the general intestinal activity. The physical
characteristics of the digesta may also be affected, and warrant further investigation.
Viscosity, hydration rates and intestinal transit/evacuation rates may all be affected by
wheat gluten inclusions and a range of abiotic factors. These variances may also lead to
alterations in digestibility that would form basis of another interesting area for investigation,
along with palatability and satiation response. The effect of wheat gluten inclusions on
Chapter 6
205 | P a g e
enzyme excretion in the mid intestine and pyloric caeca would also be of interest for further
investigation. Direct enzyme assays for the activity of pepsin, trypsin, chymotrypsin, amylase,
lipase and various specific carbohydrase enzymes, such as maltase, may result in interesting
findings as a result of wheat gluten inclusions at the expense of soya products. Soybean
meal especially is high in trypsin inhibitors as well as many other ANFs.
Another area of noted is that the present studies are confined to rainbow trout as a model
salmonid species. However, production of Atlantic salmon is a major industry in Scotland,
Norway, Chile, Tasmania and Canada, combined producing 2,188,391 Tonnes in 2014 (FAO,
2016). Given the fish in – fish out ratio concerns in the relation to fishmeal use in intensive
salmon production, there is considerable effort in seeking reliable and effective alternative
plant proteins for formulations of diets for salmon. The findings in these studies for rainbow
trout have indicated that it would be feasible and of benefit to undertake similar research
for various stages of Atlantic salmon production.
In conclusion, through intensive research in the aquaculture sector over the past two
decades, it has become established that to achieve a more sustainable and productive
industry, the combination of nutrition, health status and genetics must be optimised. The
genetic selection of brood stock fish is conducted by farms themselves if hatcheries are on
site, or by multinational company’s producing millions of eggs for intensive rearing. This in
its self is a whole other area of research, and the fastest growing, largest fish may not be the
genetically fittest and best animal for production systems. The new approval of genetically
modified fish in the USA and Canada has also opened up a vast area for discussion for the
future of genetics in aquaculture. Indeed, Dupont-Nivet et al. (2009) observed the
Chapter 6
206 | P a g e
occurrence of genotype × diet interactions when feeding juvenile rainbow trout an all plant-
protein diet. The findings from the present investigations, however, have the ability to
improve knowledge for best practices and formulations to improve the nutrition and the
health status of intensively reared salmonids. Indeed, results observed in aspects of this
body of work have identified the ability of wheat gluten products, solely or combined, and
scFOS to modulate the intestinal microbiota, improve growth performance and reduce
intestinal stress and inflammation biomarkers when included at the expense of soy protein
concentrate in aquafeeds for juvenile rainbow trout.
References
207 | P a g e
References
Abdhul, K., Ganesh, M., Shanmughapriya, S., Vanithamani, S., Kanagavel, M., Anbarasu, K. & Natarajaseenivasan, K. 2015. Bacteriocinogenic potential of a probiotic strain Bacillus coagulans [BDU3] from Ngari. Int J Biol Macromol, 79, 800-6.
Abell, G. C. & Bowman, J. P. 2005. Ecological and biogeographic relationships of class Flavobacteria in the Southern Ocean. FEMS Microbiol Ecol, 51, 265-77.
Abid, A., Davies, S. J., Waines, P., Emery, M., Castex, M., Gioacchini, G., Carnevali, O., Bickerdike, R., Romero, J. & Merrifield, D. L. 2013. Dietary synbiotic application modulates Atlantic salmon (Salmo salar) intestinal microbial communities and intestinal immunity. Fish Shellfish Immunol, 35, 1948-1956.
Adler-Nissen, J. 1986. Enzymic hydrolysis of food proteins. Elsevier Applied Science Publisher, New York.
Akoy, R. a. M. 2015. The effects of probiotics, prebiotics and synbiotics on gut flora, immune function and blood characteristics of broilers. Thesis.
Alejo, A. & Tafalla, C. 2011. Chemokines in teleost fish species. Dev Comp Immunol, 35, 1215-22.
Alexis, M. N. 1997. Fish meal and fish oil replacers in Mediterranean marine fish diets. In : Tacon A.G.J. (ed.), Basurco B. (ed.). Feeding tomorrow's fish, Zaragoza : CIHEAM,, p. 183-204
Al-Hisnawi, A., Ringø, E., Davies, S. J., Waines, P., Bradley, G. & Merrifield, D. L. 2015. First report on the autochthonous gut microbiota of brown trout (Salmo trutta Linnaeus). Aquaculture Research, 46, 2962-2971.
Ali-Nehari, A., Kim, S.-B., Lee, Y.-B., Lee, H.-Y. & Chun, B.-S. 2012. Characterization of oil including astaxanthin extracted from krill (Euphausia superba) using supercritical carbon dioxide and organic solvent as comparative method. Korean Journal of Chemical Engineering, 29, 329-336.
Allan, G. L., Parkinson, S., Booth, M. A., Stone, D. a. J., Rowland, S. J., Frances, J. & Warner-Smith, R. 2000. Replacement of fish meal in diets for Australian silver perch, Bidyanus bidyanus: I. Digestibility of alternative ingredients. Aquaculture, 186, 293-310.
References
208 | P a g e
Almeida, A., Bassols, A., Bendixen, E., Bhide, M., Ceciliani, F., Cristobal, S., Eckersall, P., Hollung, K., Lisacek, F. & Mazzucchelli, G. 2015. Animal board invited review: advances in proteomics for animal and food sciences. animal, 9, 1-17.
Aly, S. M., Abdel-Galil Ahmed, Y., Abdel-Aziz Ghareeb, A. & Mohamed, M. F. 2008. Studies on Bacillus subtilis and Lactobacillus acidophilus, as potential probiotics, on the immune response and resistance of Tilapia nilotica (Oreochromis niloticus) to challenge infections. Fish Shellfish Immunol, 25, 128-136.
Anderson, J. S., Lall, S. P., Anderson, D. M. & Chandrasoma, J. 1992. Apparent and true availability of amino acids from common feed ingredients for Atlantic salmon (Salmo salar) reared in sea water. Aquaculture, 108, 111-124.
Andlid, T., Juárez, R.-V. & Gustafsson, L. 1995. Yeast colonizing the intestine of rainbow trout (Salmo gairdneri) and turbot (Scophtalmus maximus). Microbial Ecology, 30, 321-334.
Anupama & Ravindra, P. 2000. Value-added food:: Single cell protein. Biotechnology Advances, 18, 459-479.
AOAC (2016). Official methods of analysis (20th 60 edition). Washington DC, USA: AOAC 61 International.
Apper, E., Weissman, D., Respondek, F., Guyonvarch, A., Baron, F., Boisot, P., Rodiles, A. & Merrifield, D. L. 2016. Hydrolysed wheat gluten as part of a diet based on animal and plant proteins supports good growth performance of Asian seabass (Lates calcarifer), without impairing intestinal morphology or microbiota. Aquaculture, 453, 40-48.
Apper-Bossard, E., Feneuil, A., Wagner, A. & Respondek, F. 2013. Use of vital wheat gluten in aquaculture feeds. Aquatic Biosystems, 9, 21.
Askarian, F., Zhou, Z., Olsen, R. E., Sperstad, S. & Ringø, E. 2012. Culturable autochthonous gut bacteria in Atlantic salmon (Salmo salar L.) fed diets with or without chitin. Characterization by 16S rRNA gene sequencing, ability to produce enzymes and in vitro growth inhibition of four fish pathogens. Aquaculture, 326–329, 1-8.
Avella, M. A., Olivotto, I., Silvi, S., Place, A. R. & Carnevali, O. 2010. Effect of dietary probiotics on clownfish: a molecular approach to define how lactic acid bacteria modulate development in a marine fish. Am J Physiol Regul Integr Comp Physiol, 298, R359-71.
Bailey, J. S., Blankenship, L. C. & Cox, N. A. 1991. Effect of fructooligosaccharide on Salmonella colonization of the chicken intestine. Poult Sci, 70, 2433-8.
References
209 | P a g e
Bakke-Mckellep, A. M., Penn, M. H., Salas, P. M., Refstie, S., Sperstad, S., Landsverk, T., Ringo, E. & Krogdahl, A. 2007. Effects of dietary soyabean meal, inulin and oxytetracycline on intestinal microbiota and epithelial cell stress, apoptosis and proliferation in the teleost Atlantic salmon (Salmo salar L.). Br J Nutr, 97, 699-713.
Balcazar, J. L., De Blas, I., Ruiz-Zarzuela, I., Vendrell, D., Calvo, A. C., Marquez, I., Girones, O. & Muzquiz, J. L. 2007a. Changes in intestinal microbiota and humoral immune response following probiotic administration in brown trout (Salmo trutta). Br J Nutr, 97, 522-7.
Balcazar, J. L., De Blas, I., Ruiz-Zarzuela, I., Vendrell, D., Girones, O. & Muzquiz, J. L. 2007b. Enhancement of the immune response and protection induced by probiotic lactic acid bacteria against furunculosis in rainbow trout (Oncorhynchus mykiss). FEMS Immunol Med Microbiol, 51, 185-93.
Balcazar, J. L., Vendrell, D., De Blas, I., Ruiz-Zarzuela, I., Girones, O. & Muzquiz, J. L. 2007c. In vitro competitive adhesion and production of antagonistic compounds by lactic acid bacteria against fish pathogens. Vet Microbiol, 122, 373-80.
Barnes, M. E., Brown, M. L., Rosentrater, K. A. & Sewell, J. R. 2012. An initial investigation replacing fish meal with a commercial fermented soybean meal product in the diets of juvenile rainbow trout. Open Journal of Animal Sciences, Vol.02No.04, 4.
Basu, N., Todgham, A. E., Ackerman, P. A., Bibeau, M. R., Nakano, K., Schulte, P. M. & Iwama, G. K. 2002. Heat shock protein genes and their functional significance in fish. Gene, 295, 173-183.
Bates, J. M., Mittge, E., Kuhlman, J., Baden, K. N., Cheesman, S. E. & Guillemin, K. 2006. Distinct signals from the microbiota promote different aspects of zebrafish gut differentiation. Dev Biol, 297, 374-86.
Berge, G. E., Sveier, H. & Lied, E. 1998. Nutrition of Atlantic salmon (Salmo salar); the requirement and metabolic effect of lysine. Comparative Biochemistry and Physiology Part A: Molecular & Integrative Physiology, 120, 477-485.
Bergot, F. 1979. Effects of dietary carbohydrates and of their mode of distribution on glycaemia in rainbow trout (Salmo gairdneri richardson). Comparative Biochemistry and Physiology Part A: Physiology, 64, 543-547.
Blasco, M., Fondevila, M. & Guada, J. A. 2005. Inclusion of wheat gluten as a protein source in diets for weaned pigs. Anim. Res., 54, 297-306.
References
210 | P a g e
Bornet, F. R. J., Brouns, F., Tashiro, Y. & Duvillier, V. 2002. Nutritional aspects of short-chain fructooligosaccharides: natural occurrence, chemistry, physiology and health implications. Digestive and Liver Disease, 34, Supplement 2, S111-S120.
Bourouni, O. C., El Bour, M., Calo-Mata, P., Mraouna, R., Abedellatif, B. & Barros-Velàzquez, J. 2012. Phylogenetic analysis of antimicrobial lactic acid bacteria from farmed seabass Dicentrarchus labrax. Can J Microbiol, 58, 463-474.
Bowyer, P. H. 2016. The application of solid-state fermentation technology to commercial finfish diets for improving animal health and performance. Plymouth University, PhD Thesis.
Brown, B. A. (ed.) (1988). Routine hematology procedures. Philadelphia, PA, USA: Leo and Febiger, pp. 7-122.
Bugaut, M. 1987. Occurrence, absorption and metabolism of short chain fatty acids in the digestive tract of mammals. Comparative Biochemistry and Physiology Part B: Comparative Biochemistry, 86, 439-472.
Bureau, D. P., Harris, A. M. & Young Cho, C. 1998. The effects of purified alcohol extracts from soy products on feed intake and growth of chinook salmon (Oncorhynchus tshawytscha) and rainbow trout (Oncorhynchus mykiss). Aquaculture, 161, 27-43.
Burr, G. S., Wolters, W. R., Barrows, F. T. & Hardy, R. W. 2012. Replacing fishmeal with blends of alternative proteins on growth performance of rainbow trout (Oncorhynchus mykiss), and early or late stage juvenile Atlantic salmon (Salmo salar). Aquaculture, 334–337, 110-116.
Burr, G., Gatlin, D. & Ricke, S. 2005. Microbial Ecology of the Gastrointestinal Tract of Fish and the Potential Application of Prebiotics and Probiotics in Finfish Aquaculture. Journal of the World Aquaculture Society, 36, 425-436.
Burrells, C., Williams, P. D., Southgate, P. J. & Crampton, V. O. 1999. Immunological, physiological and pathological responses of rainbow trout (Oncorhynchus mykiss) to increasing dietary concentrations of soybean proteins. Veterinary Immunology and Immunopathology, 72, 277-288.
Bustin, S.A., Benes, V., Garson, J.A., Hellemans, J., Huggett, J., Kubista, M., Mueller, R., Nolan, T., Pfaffl, M.W. & Shipley, G.L. (2009) The MIQE guidelines: minimum information for publication of quantitative real-time PCR experiments. Clinical chemistry, 55, 611-622.
Caporaso, J. G., Kuczynski, J., Stombaugh, J., Bittinger, K., Bushman, F. D., Costello, E. K., Fierer, N., Pena, A. G., Goodrich, J. K., Gordon, J. I., Huttley, G. A., Kelley, S. T., Knights, D.,
References
211 | P a g e
Koenig, J. E., Ley, R. E., Lozupone, C. A., McDonald, D., Muegge, B. D., Pirrung, M., Reeder, J., Sevinsky, J. R., Turnbaugh, P. J., Walters, W. A., Widmann, J., Yatsunenko, T., Zaneveld, J. and Knight, R. (2010a). QIIME allows analysis of high throughput community sequencing data. Nature Methods, 7 (5), pp. 335-336.
Carter, C. G. & Hauler, R. C. 2000. Fish meal replacement by plant meals in extruded feeds for Atlantic salmon, Salmo salar L. Aquaculture, 185, 299-311.
Carvour, M., Song, C., Kaul, S., Anantharam, V., Kanthasamy, A. & Kanthasamy, A. 2008. Chronic low-dose oxidative stress induces caspase-3-dependent PKCdelta proteolytic activation and apoptosis in a cell culture model of dopaminergic neurodegeneration. Ann N Y Acad Sci, 1139, 197-205.
Castillo, S. & Gatlin Iii, D. M. 2015. Dietary supplementation of exogenous carbohydrase enzymes in fish nutrition: A review. Aquaculture, 435, 286-292.
Cerezuela, R., Meseguer, J. & Esteban, M. A. 2013. Effects of dietary inulin, Bacillus subtilis and microalgae on intestinal gene expression in gilthead seabream (Sparus aurata L.). Fish Shellfish Immunol, 34, 843-8.
Chaiyapechara, S., Casten, M. T., Hardy, R. W. & Dong, F. M. 2003. Fish performance, fillet characteristics, and health assessment index of rainbow trout (Oncorhynchus mykiss) fed diets containing adequate and high concentrations of lipid and vitamin E. Aquaculture, 219, 715-738.
Chang, C. I. & Liu, W. Y. 2002. An evaluation of two probiotic bacterial strains, Enterococcus faecium SF68 and Bacillus toyoi, for reducing edwardsiellosis in cultured European eel, Anguilla anguilla L. Journal of Fish Diseases, 25, 311-315.
Cheng, Z., Gatlin Iii, D. M. & Buentello, A. 2012. Dietary supplementation of arginine and/or glutamine influences growth performance, immune responses and intestinal morphology of hybrid striped bass (Morone chrysops x Morone saxatilis). Aquaculture, 362–363, 39-43.
Clements, K. D., Gleeson, V. P. & Slaytor, M. 1994. Short-chain fatty acid metabolism in temperate marine herbivorous fish. Journal of Comparative Physiology B, 164, 372-377.
Clements, K. D., Pasch, I. B. Y., Moran, D. & Turner, S. J. 2007. Clostridia dominate 16S rRNA gene libraries prepared from the hindgut of temperate marine herbivorous fishes. Marine Biology, 150, 1431-1440.
Coates, M. E. 1975. Gnotobiotic animals in research: their uses and limitations. Lab Anim, 9, 275-82.
References
212 | P a g e
Congleton, J. & Wagner, T. 2006. Blood‐chemistry indicators of nutritional status in
juvenile salmonids. Journal of Fish Biology, 69, 473-490.
Dallaire, V., Lessard, P., Vandenberg, G. & De La Noüe, J. 2007. Effect of algal incorporation on growth, survival and carcass composition of rainbow trout (Oncorhynchus mykiss) fry. Bioresource Technology, 98, 1433-1439.
Daniels, W. H. & Robinson, E. H. 1986. Protein and energy requirements of juvenile red drum (Sciaenops ocellatus). Aquaculture, 53, 243-252.
Davies, S. J., Morris, P. C. & Baker, R. T. M. 1997. Partial substitution of fish meal and full-fat soya bean meal with wheat gluten and influence of lysine supplementation in diets for rainbow trout, Oncorhynchus mykiss (Walbaum). Aquaculture Research, 28, 317-328.
Day, L., Augustin, M. A., Batey, I. L. & Wrigley, C. W. 2006. Wheat-gluten uses and industry needs. Trends in Food Science & Technology, 17, 82-90.
De Francesco, M., Parisi, G., Médale, F., Lupi, P., Kaushik, S. J. & Poli, B. M. 2004. Effect of long-term feeding with a plant protein mixture based diet on growth and body/fillet quality traits of large rainbow trout (Oncorhynchus mykiss). Aquaculture, 236, 413-429.
Dehler, C. E., Secombes, C. J. & Martin, S. a. M. 2016. Environmental and physiological factors shape the gut microbiota of Atlantic salmon parr (Salmo salar L.). Aquaculture.
Del'duca, A., Evangelista Cesar, D., Galuppo Diniz, C. & Abreu, P. C. 2013. Evaluation of the presence and efficiency of potential probiotic bacteria in the gut of tilapia (Oreochromis niloticus) using the fluorescent in situ hybridization technique. Aquaculture, 388–391, 115-121.
Delzenne, N. M., Daubioul, C., Neyrinck, A., Lasa, M. & Taper, H. S. 2002. Inulin and oligofructose modulate lipid metabolism in animals: review of biochemical events and future prospects. Br J Nutr, 87 Suppl 2, S255-9.
Demers, N. E. & Bayne, C. J. 1997. The immediate effects of stress on hormones and plasma lysozyme in rainbow trout. Dev Comp Immunol, 21, 363-73.
Denstadli, V., Skrede, A., Krogdahl, Å., Sahlstrøm, S. & Storebakken, T. 2006. Feed intake, growth, feed conversion, digestibility, enzyme activities and intestinal structure in Atlantic salmon (Salmo salar L.) fed graded levels of phytic acid. Aquaculture, 256, 365-376.
Deplancke, B. & Gaskins, H. R. 2001. Microbial modulation of innate defense: goblet cells and the intestinal mucus layer. The American Journal of Clinical Nutrition, 73, 1131S-1141S.
References
213 | P a g e
Desai, A. R., Links, M. G., Collins, S. A., Mansfield, G. S., Drew, M. D., Van Kessel, A. G. & Hill, J. E. 2012. Effects of plant-based diets on the distal gut microbiome of rainbow trout (Oncorhynchus mykiss). Aquaculture, 350–353, 134-142.
DeSantis TZ, Hugenholtz P, Larsen N, Rojas M, Brodie EL, Keller K. 2006. Greengenes, a
Desantis, T. Z., Hugenholtz, P., Larsen, N., Rojas, M., Brodie, E. L., Keller, K., Huber, T., Dalevi, D., Hu, P. & Andersen, G. L. 2006. Greengenes, a Chimera-Checked 16S rRNA Gene Database and Workbench Compatible with ARB. Appl Environ Microbiol, 72, 5069-5072. Clements, K. D., Gleeson, V. P. & Slaytor, M. 1994. Short-chain fatty acid metabolism in temperate marine herbivorous fish. Journal of Comparative Physiology B, 164, 372-377.
Dimitroglou, A., Merrifield, D. L., Moate, R., Davies, S. J., Spring, P., Sweetman, J. & Bradley, G. 2009. Dietary mannan oligosaccharide supplementation modulates intestinal microbial ecology and improves gut morphology of rainbow trout, Oncorhynchus mykiss (Walbaum). J Anim Sci, 87, 3226-34.
Dimitroglou, A., Merrifield, D. L., Spring, P., Sweetman, J., Moate, R. & Davies, S. J. 2010. Effects of mannan oligosaccharide (MOS) supplementation on growth performance, feed utilisation, intestinal histology and gut microbiota of gilthead sea bream (Sparus aurata). Aquaculture, 300, 182-188.
Donohoe, Dallas r., Garge, N., Zhang, X., Sun, W., O'connell, Thomas m., Bunger, Maureen k. & Bultman, Scott j. 2011. The Microbiome and Butyrate Regulate Energy Metabolism and Autophagy in the Mammalian Colon. Cell Metabolism, 13, 517-526.
Draganovic, V., Van Der Goot, A. J., Boom, R. & Jonkers, J. 2011. Assessment of the effects of fish meal, wheat gluten, soy protein concentrate and feed moisture on extruder system parameters and the technical quality of fish feed. Animal Feed Science and Technology, 165, 238-250.
Dupont-Nivet, M., Médale, F., Leonard, J., Le Guillou, S., Tiquet, F., Quillet, E. & Geurden, I. 2009. Evidence of genotype–diet interactions in the response of rainbow trout (Oncorhynchus mykiss) clones to a diet with or without fishmeal at early growth. Aquaculture, 295, 15-21.
Edgar RC (2010). Search and clustering orders of magnitude faster than BLAST. Bioinformatics 26: 2460-2461.
Ellis, A. E. 2001. Innate host defense mechanisms of fish against viruses and bacteria. Dev Comp Immunol, 25, 827-39.
References
214 | P a g e
El-Sayed, A.-F. M. 1999. Alternative dietary protein sources for farmed tilapia, Oreochromis spp. Aquaculture, 179, 149-168.
Espe, M., Lemme, A., Petri, A. & El-Mowafi, A. 2006. Can Atlantic salmon (Salmo salar) grow on diets devoid of fish meal? Aquaculture, 255, 255-262.
Esteve, C. & Garay, E. 1991. Heterotrophic bacterial flora associated with European eel
Anguilla anguilla reared in freshwater. 日本水産学会誌, 57, 1369-1375.
Fao 1995. Code of Conduct for Responsible Fisheries. . Food and Agriculture Organization of the United Nations. Rome, Italy.
Fao 2002. Protein sources for the animal feed industry. Food and Agriculture Organization of the United Nations. Rome, Italy.
Fao 2004. Protein sources for the animal feed industry. Food and Agriculture Organization of the United Nations. Rome, Italy.
Fao 2012. The State of World Fisheries and Aquaculture 2012. Food and Agriculture Organization of the United Nations. Rome, Italy.
Fao 2014. The State of World Fisheries and Aquaculture. Food and Agriculture Organization of the United Nations. Rome, Italy.
Fao 2016b. Fisheries Global Information System (FAO-FIGIS) - Web site. FAO Fisheries and Aquaculture Department [online]. Rome.
Fast, M. D., Johnson, S. C. & Jones, S. R. M. 2007. Differential expression of the pro-inflammatory cytokines IL-1β-1, TNFα-1 and IL-8 in vaccinated pink (Oncorhynchus
References
215 | P a g e
gorbuscha) and chum (Oncorhynchus keta) salmon juveniles. Fish Shellfish Immunol, 22, 403-407.
Fda 2015. AquAdvantage Salmon. Online. Avaliable at; http://www.fda.gov/AnimalVeterinary/DevelopmentApprovalProcess/GeneticEngineering/GeneticallyEngineeredAnimals/ucm280853.htm.
Ferrando, R. 1983. Natural antinutritional factors present in European plant proteins. Plant Foods for Human Nutrition, 32, 455-467.
Francis, G., Makkar, H. P. S. & Becker, K. 2001. Antinutritional factors present in plant-derived alternate fish feed ingredients and their effects in fish. Aquaculture, 199, 197-227.
Franzosa, E. A., Hsu, T., Sirota-Madi, A., Shafquat, A., Abu-Ali, G., Morgan, X. C. & Huttenhower, C. 2015. Sequencing and beyond: integrating molecular'omics' for microbial community profiling. Nature Reviews Microbiology, 13, 360-372.
Fredlund, K., Isaksson, M., Rossander-Hulthén, L., Almgren, A. & Sandberg, A.-S. 2006. Absorption of zinc and retention of calcium: Dose-dependent inhibition by phytate. Journal of Trace Elements in Medicine and Biology, 20, 49-57.
Furrie, E., Macfarlane, S., Kennedy, A., Cummings, J. H., Walsh, S. V., O'neil D, A. & Macfarlane, G. T. 2005. Synbiotic therapy (Bifidobacterium longum/Synergy 1) initiates resolution of inflammation in patients with active ulcerative colitis: a randomised controlled pilot trial. Gut, 54, 242-9.
Gajardo, K., Rodiles, A., Kortner, T. M., Krogdahl, Å., Bakke, A. M., Merrifield, D. L. & Sørum, H. 2016. A high-resolution map of the gut microbiota in Atlantic salmon (Salmo salar): A basis for comparative gut microbial research. Scientific Reports, 6, 30893.
Gatlin, D. M., Barrows, F. T., Brown, P., Dabrowski, K., Gaylord, T. G., Hardy, R. W., Herman, E., Hu, G., Krogdahl, Å., Nelson, R., Overturf, K., Rust, M., Sealey, W., Skonberg, D., J Souza, E., Stone, D., Wilson, R. & Wurtele, E. 2007. Expanding the utilization of sustainable plant products in aquafeeds: a review. Aquaculture research, 38, 551-579.
Gaylord, T. G., Teague, A. M. & Barrows, F. T. 2006. Taurine Supplementation of All-plant Protein Diets for Rainbow Trout (Oncorhynchus mykiss). Journal of the World Aquaculture Society, 37, 509-517.
Geraylou, Z., Souffreau, C., Rurangwa, E., D'hondt, S., Callewaert, L., Courtin, C. M., Delcour, J. A., Buyse, J. & Ollevier, F. 2012. Effects of arabinoxylan-oligosaccharides (AXOS) on
References
216 | P a g e
juvenile Siberian sturgeon (Acipenser baerii) performance, immune responses and gastrointestinal microbial community. Fish Shellfish Immunol, 33, 718-724.
Ghanbari, M., Kneifel, W. & Domig, K. J. 2015. A new view of the fish gut microbiome: Advances from next-generation sequencing. Aquaculture, 448, 464-475.
Gomes, E. F., Rema, P. & Kaushik, S. J. 1995. Replacement of fish meal by plant proteins in the diet of rainbow trout (Oncorhynchus mykiss): digestibility and growth performance. Aquaculture, 130, 177-186.
Gómez, G. D. & Balcázar, J. L. 2008. A review on the interactions between gut microbiota and innate immunity of fish. FEMS Immunology & Medical Microbiology, 52, 145-154.
Gornati, R., Papis, E., Rimoldi, S., Terova, G., Saroglia, M. & Bernardini, G. 2004. Rearing density influences the expression of stress-related genes in sea bass (Dicentrarchus labrax, L.). Gene, 341, 111-8.
Greathead, H. 2003. Plants and plant extracts for improving animal productivity. Proc Nutr Soc, 62, 279-90.
Green, T. J., Smullen, R. & Barnes, A. C. 2013. Dietary soybean protein concentrate-induced intestinal disorder in marine farmed Atlantic salmon, Salmo salar is associated with alterations in gut microbiota. Vet Microbiol, 166, 286-292.
Grisdale-Helland, B., Helland, S. J. & Gatlin Iii, D. M. 2008. The effects of dietary supplementation with mannanoligosaccharide, fructooligosaccharide or alactooligosaccharide on the growth and feed utilization of Atlantic salmon (Salmo salar). Aquaculture, 283, 163-167.
Guerreiro, I., Enes, P. & Oliva-Teles, A. 2015b. Effects of short-chain fructooligosaccharides (scFOS) and rearing temperature on growth performance and hepatic intermediary metabolism in gilthead sea bream (Sparus aurata) juveniles. Fish Physiology and Biochemistry, 41, 1333-1344.
Guerreiro, I., Oliva-Teles, A. & Enes, P. 2015c. Improved glucose and lipid metabolism in European sea bass (Dicentrarchus labrax) fed short-chain fructooligosaccharides and xylooligosaccharides. Aquaculture, 441, 57-63.
Guerreiro, I., Pérez-Jiménez, A., Costas, B. & Oliva-Teles, A. 2014. Effect of temperature and short chain fructooligosaccharides supplementation on the hepatic oxidative status and immune response of turbot (Scophthalmus maximus). Fish Shellfish Immunol, 40, 570-576.
References
217 | P a g e
Haddad, G., Hanington, P. C., Wilson, E. C., Grayfer, L. & Belosevic, M. 2008. Molecular and functional characterization of goldfish (Carassius auratus L.) transforming growth factor beta. Developmental & comparative immunology, 32, 654-663.
Haller, D., Serrant, P., Granato, D., Schiffrin, E. J. & Blum, S. 2002. Activation of human NK cells by staphylococci and lactobacilli requires cell contact-dependent costimulation by autologous monocytes. Clin Diagn Lab Immunol, 9, 649-57.
Hansen, A.-C., Rosenlund, G., Karlsen, Ø., Olsvik, P. A. & Hemre, G.-I. 2006. The inclusion of plant protein in cod diets, its effects on macronutrient digestibility, gut and liver histology and heat shock protein transcription. Aquaculture Research, 37, 773-784.
Hardy, R. W. 2010. Utilization of plant proteins in fish diets: effects of global demand and supplies of fishmeal. Aquaculture Research, 41, 770-776.
He, S., Xu, G., Wu, Y., Weng, H. & Xie, H. 2003. Effects of IMO and FOS on the growth performance and non-specific immunity in hybrid tilapia. Chinese Feed, 23, 14-15.
Heikkinen, J., Vielma, J., Kemiläinen, O., Tiirola, M., Eskelinen, P., Kiuru, T., Navia-Paldanius, D. & Von Wright, A. 2006. Effects of soybean meal based diet on growth performance, gut histopathology and intestinal microbiota of juvenile rainbow trout (Oncorhynchus mykiss). Aquaculture, 261, 259-268.
Helland, S. J. & Grisdale-Helland, B. 2006. Replacement of fish meal with wheat gluten in diets for Atlantic halibut (Hippoglossus hippoglossus): Effect on whole-body amino acid concentrations. Aquaculture, 261, 1363-1370.
Hemme, D. & Foucaud-Scheunemann, C. 2004. Leuconostoc, characteristics, use in dairy technology and prospects in functional foods. International Dairy Journal, 14, 467-494.
Hemre, G. I., Sanden, M., Bakke-Mckellep, A. M., Sagstad, A. & Krogdahl, Å. 2005. Growth, feed utilization and health of Atlantic salmon Salmo salar L. fed genetically modified compared to non-modified commercial hybrid soybeans. Aquaculture Nutrition, 11, 157-167.
Hemre, G. I., Sandnes, K., Lie, Ø., Torrissen, O. & Waagbø, R. 1995. Carbohydrate nutrition in Atlantic salmon, Salmo salar L.: growth and feed utilization. Aquaculture research, 26, 149-154.
Hemre, G.-I., Deng, D.-F., Wilson, R. P. & Berntssen, M. H. G. 2004. Vitamin A metabolism and early biological responses in juvenile sunshine bass (Morone chrysops×M. saxatilis) fed graded levels of vitamin A. Aquaculture, 235, 645-658.
References
218 | P a g e
Hill, J. E., Hemmingsen, S. M., Goldade, B. G., Dumonceaux, T. J., Klassen, J., Zijlstra, R. T., Goh, S. H. & Van Kessel, A. G. 2005. Comparison of ileum microflora of pigs fed corn-, wheat-, or barley-based diets by chaperonin-60 sequencing and quantitative PCR. Appl Environ Microbiol, 71, 867-75.
Hong, H. A., Duc, L. H. & Cutting, S. M. 2005. The use of bacterial spore formers as probiotics. FEMS Microbiology Reviews, 29, 813-835.
Hossain, M. A., Focken, U. & Becker, K. 2001. Evaluation of an unconventional legume seed, Sesbania aculeata, as a dietary protein source for common carp, Cyprinus carpio L. Aquaculture, 198, 129-140.
Hovda, M. B., Fontanillas, R., Mcgurk, C., Obach, A. & Rosnes, J. T. 2012. Seasonal variations in the intestinal microbiota of farmed Atlantic salmon (Salmo salar L.). Aquaculture Research, 43, 154-159.
Huber, I., Spanggaard, B., Appel, K. F., Rossen, L., Nielsen, T. & Gram, L. 2004. Phylogenetic analysis and in situ identification of the intestinal microbial community of rainbow trout (Oncorhynchus mykiss, Walbaum). J Appl Microbiol, 96, 117-32.
Husebye, E., Hellstrom, P. M. & Midtvedt, T. 1994. Intestinal microflora stimulates myoelectric activity of rat small intestine by promoting cyclic initiation and aboral propagation of migrating myoelectric complex. Dig Dis Sci, 39, 946-56.
Iffo.Com 2015. online article.
Iffo.Com 2015. online article.
Indexmundi 2014. Fishmeal Monthly Price - US Dollars per Metric Ton. Online. http://www.indexmundi.com/commodities/?commodity=fish-meal.
Ingerslev, H. C., Von Gersdorff Jørgensen, L., Lenz Strube, M., Larsen, N., Dalsgaard, I., Boye, M. & Madsen, L. 2014a. The development of the gut microbiota in rainbow trout (Oncorhynchus mykiss) is affected by first feeding and diet type. Aquaculture, 424–425, 24-34.
Iwama, G. K., Afonso, L. O. B., Todgham, A., Ackerman, P. & Nakano, K. 2004. Are hsps suitable for indicating stressed states in fish? Journal of Experimental Biology, 207, 15-19.
J. W. Hilton, J. L. A., S. J. Slinger 1983. Effect of Increased Dietary Fiber on the Growth of Rainbow Trout (Salmo gairdneri). Canadian Journal of Fisheries and Aquatic Sciences, 40(1), 81-85.
References
219 | P a g e
Jackson, C. R., Roden, E. E. & Churchill, P. F. 2000. Denaturing gradient gel electrophoresis can fail to separate 16S rDNA fragments with multiple base differences. Mol Biol Today, 1, 49-51.
Jacobs, L. R. & Lupton, J. R. 1986. Relationship between Colonic Luminal pH, Cell Proliferation, and Colon Carcinogenesis in 1,2-Dimethylhydrazine Treated Rats Fed High Fiber Diets. Cancer Research, 46, 1727-1734.
Jeon, S. G., Kayama, H., Ueda, Y., Takahashi, T., Asahara, T., Tsuji, H., Tsuji, N. M., Kiyono, H., Ma, J. S., Kusu, T., Okumura, R., Hara, H., Yoshida, H., Yamamoto, M., Nomoto, K. & Takeda, K. 2012. Probiotic Bifidobacterium breve induces IL-10-producing Tr1 cells in the colon. PLoS Pathog, 8, e1002714.
Jervis, J., Kastl, C., Hildreth, S. B., Biyashev, R., Grabau, E. A., Saghai-Maroof, M. A. & Helm, R. F. 2015. Metabolite Profiling of Soybean Seed Extracts from Near-Isogenic Low and Normal Phytate Lines Using Orthogonal Separation Strategies. J Agric Food Chem, 63, 9879-87.
Ji, G.-H. & Liu, Z.-Z. 2004. LENG Xiang-jun ated by the Ministry of Agriculture, Shanghai Fisheries University, Shanghai200090, China); Effects of dietary betaglucan and fructooligosaccharides on the growth and activities of superoxide dismutase and lysozyme of Trionyx sinensis [J]. Journal of Shanghai Fisheries University, 1.
Kadowaki, T., Yasui, Y., Takahashi, Y., Kohchi, C., Soma, G. & Inagawa, H. 2009. Comparative immunological analysis of innate immunity activation after oral administration of wheat fermented extract to teleost fish. Anticancer Res, 29, 4871-7.
Katevas, D. S. 2014. Krill Meal and Krill Oil: How price and tonnage competitive are they with other fishmeals and oils? Aquafeed.com Staff. Online. , Avaliable at: http://www.aquafeed.com/news/reports-articles-article/5597/Krill-Meal-and-Krill-Oil-How-price-and-tonnage-competitive-are-they-with-other-fishmeals-and-oils/.
Kaushik, S. J. & Seiliez, I. 2010. Protein and amino acid nutrition and metabolism in fish: current knowledge and future needs. Aquaculture research, 41, 322-332.
Kaushik, S. J., Covès, D., Dutto, G. & Blanc, D. 2004. Almost total replacement of fish meal by plant protein sources in the diet of a marine teleost, the European seabass, Dicentrarchus labrax. Aquaculture, 230, 391-404.
Kaushik, S. J., Cravedi, J. P., Lalles, J. P., Sumpter, J., Fauconneau, B. & Laroche, M. 1995. Partial or total replacement of fish meal by soybean protein on growth, protein utilization, potential estrogenic or antigenic effects, cholesterolemia and flesh quality in rainbow trout, Oncorhynchus mykiss. Aquaculture, 133, 257-274.
References
220 | P a g e
Ke, X., Lu, M., Ye, X., Gao, F., Zhu, H. & Huang, Z. 2012. Recovery and pathogenicity analysis of Aerococcus viridans isolated from tilapia (Orecohromis niloticus) cultured in southwest of China. Aquaculture, 342–343, 18-23.
Kiang, J. G. & Tsokos, G. C. 1998. Heat shock protein 70 kDa: molecular biology, biochemistry, and physiology. Pharmacol Ther, 80, 183-201.
Kihara, M. & Sakata, T. 1997. Fermentation of dietary carbohydrates to short-chain fatty acids by gut microbes and its influence on intestinal morphology of a detritivorous teleost tilapia (Oreochromis niloticus). Comparative Biochemistry and Physiology Part A: Physiology, 118, 1201-1207.
Kihara, M. & Sakata, T. 2002. Production of short-chain fatty acids and gas from various oligosaccharides by gut microbes of carp (Cyprinus carpio L.) in micro-scale batch culture. Comparative Biochemistry and Physiology Part A: Molecular & Integrative Physiology, 132, 333-340.
Kihara, M. 2008. Production of Short-chain Fatty Acids from Dietary Lactosucrose in the Hindgut and Its Effects on Digestive Organs of a Marine Teleost, Red Sea Bream <I>Pagrus major</I>. Aquaculture Science, 56, 327-333.
Kim, D. H. & Austin, B. 2006. Cytokine expression in leucocytes and gut cells of rainbow trout, Oncorhynchus mykiss Walbaum, induced by probiotics. Vet Immunol Immunopathol, 114, 297-304.
Kim, D. H., Brunt, J. & Austin, B. 2007. Microbial diversity of intestinal contents and mucus in rainbow trout (Oncorhynchus mykiss). J Appl Microbiol, 102, 1654-64.
Kim, J. D. & Kaushik, S. J. 1992. Contribution of digestible energy from carbohydrates and estimation of protein/energy requirements for growth of rainbow trout (Oncorhynchus mykiss). Aquaculture, 106, 161-169.
Kissil, G. W. & Lupatsch, I. 2004. Successful replacement of fishmeal by plant proteins in diets for the gilthead seabream, Sparus aurata L.
Kong, X., Zhou, H. & Qian, H. 2007. Enzymatic hydrolysis of wheat gluten by proteases and properties of the resulting hydrolysates. Food Chemistry, 102, 759-763.
Koumi, A., Atsé, B., Otchoumou, K. & Kouamé, P. 2008. Effects of partial and complete replacement of fish meal protein with a soya protein on growth performance of black-chinned tilapia Sarotherondon melanotheron (Rüppell, 1852) in tank culture. Livestock Res. Rural Dev, 20, 10.
References
221 | P a g e
Krogdahl, Å., Sundby, A. & Olli, J. J. 2004. Atlantic salmon (Salmo salar) and rainbow trout (Oncorhynchus mykiss) digest and metabolize nutrients differently. Effects of water salinity and dietary starch level. Aquaculture, 229, 335-360.
Krumschnabel, G., Ebner, H. L., Hess, M. W. & Villunger, A. 2010. Apoptosis and necroptosis are induced in rainbow trout cell lines exposed to cadmium. Aquatic Toxicology, 99, 73-85.
Kuczynski, J., Lauber, C. L., Walters, W. A., Parfrey, L. W., Clemente, J. C., Gevers, D. & Knight, R. 2012. Experimental and analytical tools for studying the human microbiome. Nature Reviews Genetics, 13, 47-58.
Kumar, V., Sinha, A. K., Makkar, H. P., De Boeck, G. & Becker, K. 2012. Phytate and phytase in fish nutrition. J Anim Physiol Anim Nutr (Berl), 96, 335-64.
Lansard, M., Panserat, S., Seiliez, I., Polakof, S., Plagnes-Juan, E., Geurden, I., Médale, F., Kaushik, S., Corraze, G. & Skiba-Cassy, S. 2009. Hepatic protein kinase B (Akt)–target of rapamycin (TOR)-signalling pathways and intermediary metabolism in rainbow trout ( Oncorhynchus mykiss) are not significantly affected by feeding plant-based diets. British Journal of Nutrition, 102, 1564-1573.
Lauzon, H. L., Gudmundsdottir, S., Steinarsson, A., Oddgeirsson, M., Petursdottir, S. K., Reynisson, E., Bjornsdottir, R. & Gudmundsdottir, B. K. 2010a. Effects of bacterial treatment at early stages of Atlantic cod (Gadus morhua L.) on larval survival and development. J Appl Microbiol, 108, 624-32.
Lauzon, H. L., Magnadottir, B., Gudmundsdottir, B. K., Steinarsson, A., Arnason, I. O. & Gudmundsdottir, S. 2010b. Application of prospective probionts at early stages of Atlantic cod (Gadus morhua L.) rearing. Aquaculture Research, 41, e576-e586.
Le Cren, E. D. 1951. The Length-Weight Relationship and Seasonal Cycle in Gonad Weight and Condition in the Perch (Perca fluviatilis). Journal of Animal Ecology, 20, 201-219.
Le Luyer, J., Deschamps, M. H., Proulx, E., Poirier Stewart, N., Robert, C. & Vandenberg, G. 2014. Responses of different body compartments to acute dietary phosphorus deficiency in juvenile triploid rainbow trout (Oncorhynchus mykiss, Walbaum). Journal of Applied Ichthyology, 30, 825-832.
Li, P., Burr, G. S., Gatlin, D. M., Hume, M. E., Patnaik, S., Castille, F. L. & Lawrence, A. L. 2007. Dietary supplementation of short-chain fructooligosaccharides influences gastrointestinal microbiota composition and immunity characteristics of Pacific white shrimp, Litopenaeus vannamei, cultured in a recirculating system. The Journal of Nutrition, 137, 2763-2768.
References
222 | P a g e
Li, P., Mai, K., Trushenski, J. & Wu, G. 2009. New developments in fish amino acid nutrition: towards functional and environmentally oriented aquafeeds. Amino Acids, 37, 43-53.
Li, X. 2009. Glutathione and Glutathione-S-Transferase in Detoxification Mechanisms. General, Applied and Systems Toxicology. John Wiley & Sons, Ltd.
Lin, S., Mao, S., Guan, Y., Luo, L., Luo, L. & Pan, Y. 2012. Effects of dietary chitosan oligosaccharides and Bacillus coagulans on the growth, innate immunity and resistance of koi (Cyprinus carpio koi). Aquaculture, 342–343, 36-41.
Lokesh, J., Fernandes, J. M. O., Korsnes, K., Bergh, Ø., Brinchmann, M. F. & Kiron, V. 2012. Transcriptional regulation of cytokines in the intestine of Atlantic cod fed yeast derived mannan oligosaccharide or β-Glucan and challenged with Vibrio anguillarum. Fish Shellfish Immunol, 33, 626-631.
Lucas, J. S. S., Paul C. 2012. Aquaculture: Farming Aquatic Animals and Plants, 2nd Edition. January 2012, Wiley-Blackwell, Oxford, UK.
Lucht, J. M. 2015. Public Acceptance of Plant Biotechnology and GM Crops. Viruses, 7, 4254-81.
Lupton, J. R. 2004. Microbial degradation products influence colon cancer risk: the butyrate controversy. J Nutr, 134, 479-82.
Lv, H., Zhou, Z., Rudeaux, F. & Respondek, F. 2007. Effects of dietary short chain fructo-oligosaccharides on intestinal microflora, mortality and growth performance of Oreochromis
aureus× O. niloticus. Chinese Journal of Animal Nutrition, 19, 691-697.
Mahious, A. S., Gatesoupe, F. J., Hervi, M., Metailler, R. & Ollevier, F. 2005. Effect of dietary inulin and oligosaccharides as prebiotics for weaning turbot, Psetta maxima (Linnaeus, C. 1758). Aquaculture International, 14, 219-229.
Mahious, A. S., Van Loo, J. & Ollevier, F. 2006. Impact of the Prebiotics, Inulin and Oligofructose on Microbial Fermentation in the Spiral Valve of Siberian Sturgeon (Acipenser baerii). Aqua 2006, World Aquaculture Society, Florence, Italy, May 9–13, 2006., pp. 564–565.
Mansfield, G. S., Desai, A. R., Nilson, S. A., Van Kessel, A. G., Drew, M. D. & Hill, J. E. 2010. Characterization of rainbow trout (Oncorhynchus mykiss) intestinal microbiota and inflammatory marker gene expression in a recirculating aquaculture system. Aquaculture, 307, 95-104.
References
223 | P a g e
Marcil, V., Delvin, E., Seidman, E., Poitras, L., Zoltowska, M., Garofalo, C. & Levy, E. 2002. Modulation of lipid synthesis, apolipoprotein biogenesis, and lipoprotein assembly by butyrate. Am J Physiol Gastrointest Liver Physiol, 283, G340-6.
Martin, S. A., Vilhelmsson, O., Medale, F., Watt, P., Kaushik, S. & Houlihan, D. F. 2003. Proteomic sensitivity to dietary manipulations in rainbow trout. Biochim Biophys Acta, 1651, 17-29.
Maslowski, K. M. & Mackay, C. R. 2011. Diet, gut microbiota and immune responses. Nat Immunol, 12, 5-9.
Mcdaniel, N. K., Sugiura, S. H., Kehler, T., Fletcher, J. W., Coloso, R. M., Weis, P. & Ferraris, R. P. 2005. Dissolved oxygen and dietary phosphorus modulate utilization and effluent partitioning of phosphorus in rainbow trout (Oncorhynchus mykiss) aquaculture. Environmental Pollution, 138, 350-357.
Merrifield, D. L., Bradley, G., Baker, R. T. M. & Davies, S. J. 2010. Probiotic applications for rainbow trout (Oncorhynchus mykiss Walbaum) II. Effects on growth performance, feed utilization, intestinal microbiota and related health criteria postantibiotic treatment. Aquaculture Nutrition, 16, 496-503.
Merrifield, D. L., Bradley, G., Harper, G. M., Baker, R. T. M., Munn, C. B. & Davies, S. J. 2011. Assessment of the effects of vegetative and lyophilized Pediococcus acidilactici on growth, feed utilization, intestinal colonization and health parameters of rainbow trout (Oncorhynchus mykiss Walbaum). Aquaculture Nutrition, 17, 73-79.
Merrifield, D. L., Dimitroglou, A., Bradley, G., Baker, R. T. & Davies, S. J. 2009. Soybean meal alters autochthonous microbial populations, microvilli morphology and compromises intestinal enterocyte integrity of rainbow trout, Oncorhynchus mykiss (Walbaum). J Fish Dis, 32, 755-66.
Merrifield, D. L., Dimitroglou, A., Foey, A., Davies, S. J., Baker, R. T. M., Bøgwald, J., Castex, M. & Ringø, E. 2010. The current status and future focus of probiotic and prebiotic applications for salmonids. Aquaculture, 302, 1-18.
Merrifield, D. L., Ringo, E 2014. Aquaculture Nutrition: Gut Health, Probiotics and Prebiotics.
Messina, M., Piccolo, G., Tulli, F., Messina, C. M., Cardinaletti, G. & Tibaldi, E. 2013. Lipid composition and metabolism of European sea bass (Dicentrarchus labrax L.) fed diets containing wheat gluten and legume meals as substitutes for fish meal. Aquaculture, 376–379, 6-14.
References
224 | P a g e
Michel, C., Pelletier, C., Boussaha, M., Douet, D.-G., Lautraite, A. & Tailliez, P. 2007. Diversity of lactic acid bacteria associated with fish and the fish farm environment, established by amplified rRNA gene restriction analysis. Appl Environ Microbiol, 73, 2947-2955.
Mimouni, B., Raymond, J., Merle-Desnoyers, A. M., Azanza, J. L. & Ducastaing, A. 1994. Combined Acid Deamidation and Enzymic Hydrolysis for Improvement of the functional Properties of Wheat Gluten. Journal of Cereal Science, 20, 153-165.
Moffitt, C. M. & Mobin, S. M. A. 2006. Profile of Microflora of the Posterior Intestine of Chinook Salmon before, during, and after Administration of Rations with and without Erythromycin. North American Journal of Aquaculture, 68, 176-185.
Mohapatra, S., Chakraborty, T., Prusty, A. K., Paniprasad, K. & Mohanta, K. N. 2014. Beneficial Effects of Dietary Probiotics Mixture on Hemato-Immunology and Cell Apoptosis of Labeo rohita Fingerlings Reared at Higher Water Temperatures. PLoS ONE, 9, e100929.
Molina-Poveda, C. & Morales, M. E. 2004. Use of a mixture of barley-based fermented grains and wheat gluten as an alternative protein source in practical diets for Litopenaeus vannamei (Boone). Aquaculture Research, 35, 1158-1165.
Montagne, L., Pluske, J. R. & Hampson, D. J. 2003. A review of interactions between dietary fibre and the intestinal mucosa, and their consequences on digestive health in young non-ruminant animals. Animal Feed Science and Technology, 108, 95-117.
Moriarty, D. J. W. 1998. Control of luminous Vibrio species in penaeid aquaculture ponds. Aquaculture, 164, 351-358.
Moriñigo, M. A. 2011. Modulation of the intestinal microbiota and immune system of farmed Sparus aurata by the administration of the yeast Debaryomyces hansenii L2 in conjunction with inulin. Journal of Aquaculture Research & Development.
Mountfort, D. O., Campbell, J. & Clements, K. D. 2002. Hindgut Fermentation in Three Species of Marine Herbivorous Fish. Appl Environ Microbiol, 68, 1374-1380.
Mukherjee, A. & Ghosh, K. 2016. Antagonism against fish pathogens by cellular components and verification of probiotic properties in autochthonous bacteria isolated from the gut of an Indian major carp, Catla catla (Hamilton). Aquaculture Research, 47, 2243-2255.
Mulder, I. E., Wadsworth, S. & Secombes, C. J. 2007. Cytokine expression in the intestine of rainbow trout (Oncorhynchus mykiss) during infection with Aeromonas salmonicida. Fish Shellfish Immunol, 23, 747-59.
References
225 | P a g e
Muyzer, G., Dewaal, E.C. & Uitterlinden, A.G. (1993) Profiling of complex microbial populations by denaturing gradient gel electrophoresis analysis of polymerase chain reaction amplified genes coding for 16S ribosomal RNA. Applied and Environmental Microbiology 59, 695-700.
Nations, U. 2015. World population prospects – The 2015 revision. Online.
Navarrete, P., Magne, F., Mardones, P., Riveros, M., Opazo, R., Suau, A., Pochart, P. & Romero, J. 2010. Molecular analysis of intestinal microbiota of rainbow trout (Oncorhynchus mykiss). FEMS Microbiol Ecol, 71, 148-56.
Navarrete, P., Toledo, I., Mardones, P., Opazo, R., Espejo, R. & Romero, J. 2010b. Effect of Thymus vulgaris essential oil on intestinal bacterial microbiota of rainbow trout, Oncorhynchus mykiss (Walbaum) and bacterial isolates. Aquaculture Research, 41, e667-e678.
Nayak, S. K. 2010. Probiotics and immunity: A fish perspective. Fish Shellfish Immunol, 29, 2-14.
Nayak, S. K. 2010b. Role of gastrointestinal microbiota in fish. Aquaculture Research, 41, 1553-1573.
Nicholson, J. K., Holmes, E., Kinross, J., Burcelin, R., Gibson, G., Jia, W. & Pettersson, S. 2012. Host-gut microbiota metabolic interactions. Science, 336, 1262-7.
Nicklin, P., Bergman, P., Zhang, B., Triantafellow, E., Wang, H., Nyfeler, B., Yang, H., Hild, M., Kung, C., Wilson, C., Myer, V. E., Mackeigan, J. P., Porter, J. A., Wang, Y. K., Cantley, L. C., Finan, P. M. & Murphy, L. O. Bidirectional Transport of Amino Acids Regulates mTOR and Autophagy. Cell, 136, 521-534.
Nicol, S., Foster, J. & Kawaguchi, S. 2012. The fishery for Antarctic krill – recent developments. Fish and Fisheries, 13, 30-40.
Niven, S. J., Beal, J. D. & Brooks, P. H. 2004. The simultaneous determination of short chain fatty acid, monosaccharides and ethanol in fermented liquid pig diets. Animal Feed Science and Technology, 117, 339-345.
Noaa, U. 2011. The Future of Aquafeeds. NOAA Technical Memorandum NMFS F/SPO-124.
NRC (2011) Nutrient Requirements of Fish and Shrimp. Washington: The National Academies Press, 376.
References
226 | P a g e
Nrc 1993. Nutrient Requirements of Fish.Natioal Research Council. National Academy Press, Washington, DC, USA,, 114pp.
Nrc 1998. Nutrient Requirements of Swine. National Research Council, National Academy Press, Washington, DC, USA., 189pp.
Nugroho, R. A. & Fotedar, R. 2014. Comparing the effects of dietary selenium and mannan oligosaccharide supplementation on the growth, immune function, and antioxidant enzyme activity in the cultured marron Cherax cainii (Austin, 2002). Aquaculture International, 22, 585-596.
Nunes, A. J. P., Sá, M. V. C., Browdy, C. L. & Vazquez-Anon, M. 2014. Practical supplementation of shrimp and fish feeds with crystalline amino acids. Aquaculture, 431, 20-27.
Ohwada, K., Tabor, P. S. & Colwell, R. R. 1980. Species Composition and Barotolerance of Gut Microflora of Deep-Sea Benthic Macrofauna Collected at Various Depths in the Atlantic Ocean. Appl Environ Microbiol, 40, 746-55.
Oki, T. & Kanae, S. 2006. Global Hydrological Cycles and World Water Resources. Science, 313, 1068-1072.
Olafsen, J. A. 2001. Interactions between fish larvae and bacteria in marine aquaculture. Aquaculture, 200, 223-247.
Olli, J. J. & Krogdahl, Å. 1995. Alcohol soluble components of soybeans seem to reduce fat digestibility in fish-meal-based diets for Atlantic salmon, Salmo salar L. Aquaculture Research, 26, 831-835.
Olli, J. J., Krogdahl, Å. & Våbenø, A. 1995. Dehulled solvent-extracted soybean meal as a protein source in diets for Atlantic salmon, Salmo salar L. Aquaculture Research, 26, 167-174.
Olsen, R. L., Toppe, J. & Karunasagar, I. 2014. Challenges and realistic opportunities in the use of by-products from processing of fish and shellfish. Trends in Food Science & Technology, 36, 144-151.
Olsvik, P. A., Torstensen, B. E., Hemre, G. I., Sanden, M. & Waagbø, R. 2011. Hepatic oxidative stress in Atlantic salmon (Salmo salar L.) transferred from a diet based on marine feed ingredients to a diet based on plant ingredients. Aquaculture Nutrition, 17, e424-e436.
Ortiz, L. T., Rebolé, A., Velasco, S., Rodríguez, M. L., Treviño, J., Tejedor, J. L. & Alzueta, C. 2013. Effects of inulin and fructooligosaccharides on growth performance, body chemical
References
227 | P a g e
composition and intestinal microbiota of farmed rainbow trout (Oncorhynchus mykiss). Aquaculture Nutrition, 19, 475-482.
Ostaszewska, T., Dabrowski, K., Palacios, M. E., Olejniczak, M. & Wieczorek, M. 2005. Growth and morphological changes in the digestive tract of rainbow trout (Oncorhynchus mykiss) and pacu (Piaractus mesopotamicus) due to casein replacement with soybean proteins. Aquaculture, 245, 273-286.
Özer, S., Bulduklu, P. S. & Dönmez, E. 2008. Streptococcocis occurence at rainbow trout (Oncorhynchus mykiss, Walbaum) cultivated in province Mersin-Turkey. Journal of FisheriesSciences.com, 2, 272-283.
Panigrahi, A., Kiron, V., Satoh, S., Hirono, I., Kobayashi, T., Sugita, H., Puangkaew, J. & Aoki, T. 2007. Immune modulation and expression of cytokine genes in rainbow trout Oncorhynchus mykiss upon probiotic feeding. Dev Comp Immunol, 31, 372-82.
Panigrahi, A., Viswanath, K. & Satoh, S. 2011. Real-time quantification of the immune gene expression in rainbow trout fed different forms of probiotic bacteria Lactobacillus rhamnosus. Aquaculture Research, 42, 906-917.
Panigrahi, A., Viswanath, K. & Satoh, S. 2011. Real-time quantification of the immune gene expression in rainbow trout fed different forms of probiotic bacteria Lactobacillus rhamnosus. Aquaculture Research, 42, 906-917.
Panserat, S., Hortopan, G. A., Plagnes-Juan, E., Kolditz, C., Lansard, M., Skiba-Cassy, S., Esquerré, D., Geurden, I., Médale, F., Kaushik, S. & Corraze, G. 2009. Differential gene expression after total replacement of dietary fish meal and fish oil by plant products in rainbow trout (Oncorhynchus mykiss) liver. Aquaculture, 294, 123-131.
Pérez-Sánchez, T., Balcázar, J.L., Merrifield, D.L., Carnevali, O., Gioacchini, G., de Blas, I. & Ruiz-Zarzuela, I. (2011) Expression of immune-related genes in rainbow trout (Oncorhynchus mykiss) induced by probiotic bacteria during Lactococcus garvieae infection. Fish & shellfish immunology, 31, 196-201.
Pfeffer, E. & Henrichfreise, B. 1994. Evaluation of potential sources of proteins in diets for rainbow trout (Oncorhynchus mykiss). Arch Tierernahr, 45, 371-7.
Pfeffer, E., Al-Sabty, H. & Haverkamp, R. 1992. Studies on lysine requirements of rainbow trout (Oncorhynchus mykiss) fed wheat gluten as only source of dietary protein. Journal of Animal Physiology and Animal Nutrition, 67, 74-82.
References
228 | P a g e
Pohlenz, C., Buentello, A., Bakke, A. M. & Gatlin Iii, D. M. 2012. Free dietary glutamine improves intestinal morphology and increases enterocyte migration rates, but has limited effects on plasma amino acid profile and growth performance of channel catfish Ictalurus punctatus. Aquaculture, 370–371, 32-39.
Pond, M. J., Stone, D. M. & Alderman, D. J. 2006. Comparison of conventional and molecular techniques to investigate the intestinal microflora of rainbow trout (Oncorhynchus mykiss). Aquaculture, 261, 194-203.
Popineau, Y., Huchet, B., Larré, C. & Bérot, S. 2002. Foaming and Emulsifying Properties of Fractions of Gluten Peptides Obtained by Limited Enzymatic Hydrolysis and Ultrafiltration. Journal of Cereal Science, 35, 327-335.
Potter, S. M., Jimenez-Flores, R., Pollack, J., Lone, T. A. & Berber-Jimenez, M. D. 1993. Protein-saponin interaction and its influence on blood lipids. J Agric Food Chem, 41, 1287-1291.
PyNAST: a flexible tool for aligning sequences to a template alignment. Bioinformatics 26:266-267.
Qin, C., Zhang, Y., Liu, W., Xu, L., Yang, Y. & Zhou, Z. 2014. Effects of chito-oligosaccharides supplementation on growth performance, intestinal cytokine expression, autochthonous gut
bacteria and disease resistance in hybrid tilapia Oreochromis niloticus × Oreochromis
aureus . Fish Shellfish Immunol, 40, 267-274.
Qiyou, X., Qing, Z., Hong, X., Chang`An, W. & Dajiang, S. 2011. Dietary glutamine supplementation improves growth performance and intestinal digestion/absorption ability
in young hybrid sturgeon (Acipenser schrenckii × Huso dauricus). Journal of Applied Ichthyology, 27, 721-726.
Ran C, H. L., Liu Z, Xu L, Yang Y, Tacon P, Et Al. 2015. A Comparison of the Beneficial Effects of Live and Heat-Inactivated Baker’s Yeast on Nile Tilapia: Suggestions on the Role and Function of the Secretory Metabolites Released from the Yeast. PLoS ONE 10(12).
Rawling, M. D., Merrifield, D. L., Snellgrove, D. L., Kuehlwein, H., Adams, A. and Davies, S. J, (2012). Haemato-immunological and growth response of mirror carp (Cyprinus carpio) fed a tropical earthworm meal in experimental diets. Fish and Shellfish Immunology, 32 (6), pp. 1002-1007.
Rawls, J. F., Mahowald, M. A., Ley, R. E. & Gordon, J. I. 2006. Reciprocal gut microbiota transplants from zebrafish and mice to germ-free recipients reveal host habitat selection. Cell, 127, 423-33.
References
229 | P a g e
Ray, A. K., Ghosh, K. & Ringø, E. 2012. Enzyme-producing bacteria isolated from fish gut: a review. Aquaculture Nutrition, 18, 465-492.
Refstie, S., Korsøen, Ø. J., Storebakken, T., Baeverfjord, G., Lein, I. & Roem, A. J. 2000. Differing nutritional responses to dietary soybean meal in rainbow trout (Oncorhynchus mykiss) and Atlantic salmon (Salmo salar). Aquaculture, 190, 49-63.
Refstie, S., Svihus, B., Shearer, K. D. & Storebakken, T. 1999. Nutrient digestibility in Atlantic salmon and broiler chickens related to viscosity and non-starch polysaccharide content in different soyabean products. Animal Feed Science and Technology, 79, 331-345.
Reitan, K. I., Natvik, C. M. & Vadstein, O. 1998. Drinking rate, uptake of bacteria and microalgae in turbot larvae. Journal of Fish Biology, 53, 1145-1154.
Rengpipat, S., Rueangruklikhit, T. & Piyatiratitivorakul, S. 2008. Evaluations of lactic acid bacteria as probiotics for juvenile seabass Lates calcarifer. Aquaculture Research, 39, 134-143.
Reveco, F. E., Øverland, M., Romarheim, O. H. & Mydland, L. T. 2014. Intestinal bacterial community structure differs between healthy and inflamed intestines in Atlantic salmon (Salmo salar L.). Aquaculture, 420–421, 262-269.
Reyes-Cerpa, S., Maisey, K., Reyes-López, F., Toro-Ascuy, D., Sandino, A. M. & Imarai, M. 2013. Fish cytokines and immune response. TVRKER H. New advances and contributions to fish biology. Croatia: InTech.
Ringo, E. & Birkbeck, T. H. 1999. Intestinal microflora of fish larvae and fry. Aquaculture research, 30, 73-93.
Ringø, E. & Gatesoupe, F.-J. 1998. Lactic acid bacteria in fish: a review. Aquaculture, 160, 177-203.
Ringo, E., Bendiksen, H. R., Gausen, S. J., Sundsfjord, A. & Olsen, R. E. 1998. The effect of dietary fatty acids on lactic acid bacteria associated with the epithelial mucosa and from faecalia of Arctic charr, Salvelinus alpinus (L.). J Appl Microbiol, 85, 855-64.
Ringø, E., Dimitroglou, A., Hoseinifar, S. H. & Davies, S. J. 2014. Prebiotics in Finfish: An Update. Aquaculture Nutrition. John Wiley & Sons, Ltd.
Ringø, E., Myklebust, R., Mayhew, T. M. & Olsen, R. E. 2007. Bacterial translocation and pathogenesis in the digestive tract of larvae and fry. Aquaculture, 268, 251-264.
References
230 | P a g e
Ringø, E., Olsen, R. E., Gifstad, T. Ø., Dalmo, R. A., Amlund, H., Hemre, G. I. & Bakke, A. M. 2010. Prebiotics in aquaculture: a review. Aquaculture Nutrition, 16, 117-136.
Ringø, E., Sperstad, S., Myklebust, R., Mayhew, T. M. & Olsen, R. E. 2006a. The effect of dietary inulin on aerobic bacteria associated with hindgut of Arctic charr (Salvelinus alpinus L.). Aquaculture Research, 37, 891-897.
Ringø, E., Sperstad, S., Myklebust, R., Refstie, S. & Krogdahl, Å. 2006b. Characterisation of the microbiota associated with intestine of Atlantic cod (Gadus morhua L.): the effect of fish meal, standard soybean meal and a bioprocessed soybean meal. Aquaculture, 261, 829-841.
Ringø, E., Zhou, Z., Vecino, J. L. G., Wadsworth, S., Romero, J., Krogdahl, Å., Olsen, R. E., Dimitroglou, A., Foey, A., Davies, S., Owen, M., Lauzon, H. L., Martinsen, L. L., De Schryver, P., Bossier, P., Sperstad, S. & Merrifield, D. L. 2016. Effect of dietary components on the gut microbiota of aquatic animals. A never-ending story? Aquaculture Nutrition, 22, 219-282.
Robaina, L., Corraze, G., Aguirre, P., Blanc, D., Melcion, J. P. & Kaushik, S. 1999. Digestibility, postprandial ammonia excretion and selected plasma metabolites in European sea bass (Dicentrarchus labrax) fed pelleted or extruded diets with or without wheat gluten. Aquaculture, 179, 45-56.
Rodehutscord, M., Becker, A., Pack, M. & Pfeffer, E. 1997. Response of Rainbow Trout (Oncorhynchus mykiss) to Supplements of Individual Essential Amino Acids in a Semipurified Diet, Including an Estimate of the Maintenance Requirement for Essential Amino Acids. The Journal of Nutrition, 127, 1166-1175.
Rodehutscord, M., Mandel, S. & Pfeffer, E. 1994. Reduced protein content and use of wheat gluten in diets for rainbow trout: effects on water loading with N and P. Journal of Applied Ichthyology, 10, 271-273.
Rodehutscord, M., Mandel, S., Pack, M., Jacobs, S. & Pfeffer, E. 1995b. Free amino acids can replace protein-bound amino acids in test diets for studies in rainbow trout (Oncorhynchus mykiss). The Journal of Nutrition, 125, 956-63.
Rodrigues, P. M., Silva, T. S., Dias, J. & Jessen, F. 2012. Proteomics in aquaculture: applications and trends. Journal of proteomics, 75, 4325-4345.
Rodriguez-Estrada, U., Satoh, S., Haga, Y., Fushimi, H. & Sweetman, J. 2013. Effects of Inactivated Enterococcus faecalis and Mannan Oligosaccharide and Their Combination on Growth, Immunity, and Disease Protection in Rainbow Trout. North American Journal of Aquaculture, 75, 416-428.
References
231 | P a g e
Roeselers, G., Mittge, E. K., Stephens, W. Z., Parichy, D. M., Cavanaugh, C. M., Guillemin, K. & Rawls, J. F. 2011. Evidence for a core gut microbiota in the zebrafish. ISME J, 5, 1595-608.
Rojas, V., Guzmán, F., Valenzuela, C., Marshall, S. H. & Mercado, L. 2012. Development of a caspase-3 antibody as a tool for detecting apoptosis in cells from rainbow trout (Oncorhynchus mykiss). Electronic Journal of Biotechnology, 15, 12-12.
Rollo, A., Sulpizio, R., Nardi, M., Silvi, S., Orpianesi, C., Caggiano, M., Cresci, A. & Carnevali, O. 2006. Live microbial feed supplement in aquaculture for improvement of stress tolerance. Fish Physiology and Biochemistry, 32, 167-177.
Roy, C. C., Kien, C. L., Bouthillier, L. & Levy, E. 2006. Short-chain fatty acids: ready for prime time? Nutr Clin Pract, 21, 351-66.
Rumsey, G. L., Siwicki, A. K., Anderson, D. P. & Bowser, P. R. 1994. Effect of soybean protein on serological response, non-specific defense mechanisms, growth, and protein utilization in rainbow trout. Vet Immunol Immunopathol, 41, 323-39.
Sagstad, A., Sanden, M., Haugland, O., Hansen, A. C., Olsvik, P. A. & Hemre, G. I. 2007. Evaluation of stress- and immune-response biomarkers in Atlantic salmon, Salmo salar L., fed different levels of genetically modified maize (Bt maize), compared with its near-isogenic parental line and a commercial suprex maize. J Fish Dis, 30, 201-12.
Sakamoto, S. a. Y., Y. 1978. Effect of dietary phosphorus level on chemical composition of red sea bream. Japanese Society of Fisheries Science, 44, 227-229.
Salinas, I. & Parra, D. 2015. 6 - Fish mucosal immunity: intestine A2 - Beck, Benjamin H. In: PEATMAN, E. (ed.) Mucosal Health in Aquaculture. San Diego: Academic Press.
Sanden, M. & Olsvik, P. A. 2009. Intestinal cellular localization of PCNA protein and CYP1A mRNA in Atlantic salmon Salmo salar L. exposed to a model toxicant. BMC Physiology, 9, 1-11.
Santigosa, E., Sánchez, J., Médale, F., Kaushik, S., Pérez-Sánchez, J. & Gallardo, M. A. 2008. Modifications of digestive enzymes in trout (Oncorhynchus mykiss) and sea bream (Sparus aurata) in response to dietary fish meal replacement by plant protein sources. Aquaculture, 282, 68-74.
Savini, V., Catavitello, C., Bianco, A., Balbinot, A. & D'antonio, D. 2009. Epidemiology, pathogenicity and emerging resistances in Staphylococcus pasteuri: from mammals and lampreys, to man. Recent Pat Antiinfect Drug Discov, 4, 123-9.
References
232 | P a g e
Schauer, M., Massana, R. & Pedros-Alio, C. 2000. Spatial differences in bacterioplankton composition along the Catalan coast (NW Mediterranean) assessed by molecular fingerprinting. FEMS Microbiol Ecol, 33, 51-59.
Sealey, W. M., Barrows, F. T., Johansen, K. A., Overturf, K., Lapatra, S. E. & Hardy, R. W. 2007. Evaluation of the Ability of Partially Autolyzed Yeast and Grobiotic-A to Improve Disease Resistance in Rainbow Trout. North American Journal of Aquaculture, 69, 400-406.
Sharifuzzaman, S. M. & Austin, B. 2010. Kocuria SM1 controls vibriosis in rainbow trout (Oncorhynchus mykiss, Walbaum). J Appl Microbiol, 108, 2162-70.
Sharifuzzaman, S. M., Al-Harbi, A. H. & Austin, B. 2014. Characteristics of growth, digestive system functionality, and stress factors of rainbow trout fed probiotics Kocuria SM1 and Rhodococcus SM2. Aquaculture, 418–419, 55-61.
Shipton, T. a. a. H., M.R. 2013. An overview of the current status of feed management practices. In M.R. Hasan and M.B. New, eds. On-farm feeding and feed management in aquaculture., FAO Fisheries and Aquaculture Technical Paper No. 583. Rome, FAO. pp. 3–20.
Singaravel, R. V. K. R. V. & Gopalakrishnan, A. 2015. Isolation and identification of marine fish tumour (odontoma) associated bacteria. Journal of Coastal Life medicine, (9).
Sitjà-Bobadilla, A., Peña-Llopis, S., Gómez-Requeni, P., Médale, F., Kaushik, S. & Pérez-Sánchez, J. 2005. Effect of fish meal replacement by plant protein sources on non-specific defence mechanisms and oxidative stress in gilthead sea bream (Sparus aurata). Aquaculture, 249, 387-400.
Smith, T. B., Wahl, D. H. & Mackie, R. I. 1996. Volatile fatty acids and anaerobic fermentation in temperate piscivorous and omnivorous freshwater fish. Journal of Fish Biology, 48, 829-841.
Smits, H. H., Engering, A., Van Der Kleij, D., De Jong, E. C., Schipper, K., Van Capel, T. M., Zaat, B. A., Yazdanbakhsh, M., Wierenga, E. A., Van Kooyk, Y. & Kapsenberg, M. L. 2005. Selective probiotic bacteria induce IL-10-producing regulatory T cells in vitro by modulating dendritic cell function through dendritic cell-specific intercellular adhesion molecule 3-grabbing nonintegrin. J Allergy Clin Immunol, 115, 1260-7.
Smriga, S., Sandin, S. A. & Azam, F. 2010. Abundance, diversity, and activity of microbial assemblages associated with coral reef fish guts and feces. FEMS Microbiol Ecol, 73, 31-42.
Soleimani, N., Hoseinifar, S. H., Merrifield, D. L., Barati, M. & Abadi, Z. H. 2012. Dietary supplementation of fructooligosaccharide (FOS) improves the innate immune response,
References
233 | P a g e
stress resistance, digestive enzyme activities and growth performance of Caspian roach (Rutilus rutilus) fry. Fish Shellfish Immunol, 32, 316-321.
Spanggaard, B., Huber, I., Nielsen, J., Nielsen, T., Appel, K. F. & Gram, L. 2000. The microflora of rainbow trout intestine: a comparison of traditional and molecular identification. Aquaculture, 182, 1-15.
Sprague, M., Dick, J. R. & Tocher, D. R. 2016. Impact of sustainable feeds on omega-3 long-chain fatty acid levels in farmed Atlantic salmon, 2006–2015. Scientific Reports, 6, 21892.
Standen, B. T., Rawling, M. D., Davies, S. J., Castex, M., Foey, A., Gioacchini, G., Carnevali, O. & Merrifield, D. L. 2013. Probiotic Pediococcus acidilactici modulates both localised intestinal- and peripheral-immunity in tilapia (Oreochromis niloticus). Fish Shellfish Immunol, 35, 1097-104.
Stappenbeck, T. S., Hooper, L. V. & Gordon, J. I. 2002. Developmental regulation of intestinal angiogenesis by indigenous microbes via Paneth cells. Proc Natl Acad Sci U S A, 99, 15451-5.
Staykov, Y., Spring, P., Denev, S. & Sweetman, J. 2007. Effect of a mannan oligosaccharide on the growth performance and immune status of rainbow trout (Oncorhynchus mykiss). Aquaculture International, 15, 153-161.
Storebakken, T. & Austreng, E. 1987. Binders in fish feeds. Aquaculture, 60, 121-131.
Storebakken, T. 1985. Binders in fish feeds. Aquaculture, 47, 11-26.
Storebakken, T., Shearer, K. D. & Roem, A. J. 1998. Availability of protein, phosphorus and other elements in fish meal, soy-protein concentrate and phytase-treated soy-protein-concentrate-based diets to Atlantic salmon, Salmo salar. Aquaculture, 161, 365-379.
Storebakken, T., Shearer, K. D., Baeverfjord, G., Nielsen, B. G., Åsgård, T., Scott, T. & De Laporte, A. 2000. Digestibility of macronutrients, energy and amino acids, absorption of elements and absence of intestinal enteritis in Atlantic salmon, Salmo salar, fed diets with wheat gluten. Aquaculture, 184, 115-132.
Storebakken, T., Zhang, Y., Ma, J., Øverland, M., Mydland, L. T., Kraugerud, O. F., Apper, E. & Feneuil, A. 2015. Feed technological and nutritional properties of hydrolyzed wheat gluten when used as a main source of protein in extruded diets for rainbow trout (Oncorhynchus mykiss). Aquaculture, 448, 214-218.
References
234 | P a g e
Sugiura, S. H., Dong, F. M., Rathbone, C. K. & Hardy, R. W. 1998. Apparent protein digestibility and mineral availabilities in various feed ingredients for salmonid feeds. Aquaculture, 159, 177-202.
Suzer, C., Çoban, D., Kamaci, H. O., Saka, Ş., Firat, K., Otgucuoğlu, Ö. & Küçüksari, H. 2008. Lactobacillus spp. bacteria as probiotics in gilthead sea bream (Sparus aurata, L.) larvae: Effects on growth performance and digestive enzyme activities. Aquaculture, 280, 140-145.
Swain, S. M., Singh, C. & Arul, V. 2009. Inhibitory activity of probiotics Streptococcus phocae PI80 and Enterococcus faecium MC13 against Vibriosis in shrimp Penaeus monodon. World Journal of Microbiology and Biotechnology, 25, 697-703.
Tacchi, L., Secombes, C. J., Bickerdike, R., Adler, M. A., Venegas, C., Takle, H. & Martin, S. A. 2012. Transcriptomic and physiological responses to fishmeal substitution with plant proteins in formulated feed in farmed Atlantic salmon (Salmo salar). BMC Genomics, 13, 1-21.
Tacon, A. G. J. & Metian, M. 2008. Global overview on the use of fish meal and fish oil in industrially compounded aquafeeds: Trends and future prospects. Aquaculture, 285, 146-158.
Tacon, A. G. J. 1987. Nutrients sources and composition. In: Tacon G.J. (Ed.), The Nutrition and Feeding of Farmed Fish and Shrimp – A Training Manual. Food and Agriculture Organization of the United Nations, Brasilia, Brazil., http://www.fao.org/3/contents/cd1b6557-61fa-5ea8-a257-577400329634/AB468E00.htm.
Tello, P. G., Camacho, F., Jurado, E., Paez, M. P. & Guadix, E. M. 1994. Enzymatic hydrolysis of whey proteins. II. Molecular-weight range. Biotechnol Bioeng, 44, 529-32.
Tibaldi, E., Tulli, F., Piccolo, G. & Guala, S. 2003. Wheat gluten as a partial substitute for fish meal protein in sea bass (D. labrax) diets. Italian Journal of Animal Science, 2, 613-615.
Tibbetts, S. M., Milley, J. E. & Lall, S. P. 2006. Apparent protein and energy digestibility of common and alternative feed ingredients by Atlantic cod, Gadus morhua (Linnaeus, 1758). Aquaculture, 261, 1314-1327.
Torrecillas, S., Montero, D., Caballero, M. J., Robaina, L., Zamorano, M. J., Sweetman, J. & Izquierdo, M. 2015. Effects of dietary concentrated mannan oligosaccharides supplementation on growth, gut mucosal immune system and liver lipid metabolism of European sea bass (Dicentrarchus labrax) juveniles. Fish Shellfish Immunol, 42, 508-516.
Trichet, V. V. 2010. Nutrition and immunity: an update. Aquaculture Research, 41, 356-372.
References
235 | P a g e
Trust, T. J. & Sparrow, R. A. 1974. The bacterial flora in the alimentary tract of freshwater salmonid fishes. Can J Microbiol, 20, 1219-28.
Tusche, K., Arning, S., Wuertz, S., Susenbeth, A. & Schulz, C. 2012. Wheat gluten and potato protein concentrate — Promising protein sources for organic farming of rainbow trout (Oncorhynchus mykiss). Aquaculture, 344–349, 120-125.
Tveterås, S. & Tveterås, R. 2010. The Global Competition for Wild Fish Resources between Livestock and Aquaculture. Journal of Agricultural Economics, 61, 381-397.
Tytler, P. & Calow, P. 1985. Fish energetics: new perspectives, Groom Helm Ltd. London and Sydney.
Urán, P. A., Gonçalves, A. A., Taverne-Thiele, J. J., Schrama, J. W., Verreth, J. a. J. & Rombout, J. H. W. M. 2008. Soybean meal induces intestinal inflammation in common carp (Cyprinus carpio L.). Fish Shellfish Immunol, 25, 751-760.
Urán, P. A., Schrama, J. W., Rombout, J. H. W. M., Obach, A., Jensen, L., Koppe, W. & Verreth, J. a. J. 2008b. Soybean meal-induced enteritis in Atlantic salmon (Salmo salar L.) at different temperatures. Aquaculture Nutrition, 14, 324-330.
Van Den Ingh, T. S. G. a. M., Krogdahl, Å., Olli, J. J., Hendriks, H. G. C. J. M. & Koninkx, J. G. J. F. 1991. Effects of soybean-containing diets on the proximal and distal intestine in Atlantic salmon (Salmo salar): a morphological study. Aquaculture, 94, 297-305.
Van Der Oost, R., Beyer, J. & Vermeulen, N. P. 2003. Fish bioaccumulation and biomarkers in environmental risk assessment: a review. Environ Toxicol Pharmacol, 13, 57-149.
Van Leeuwen, P., Mouwen, J. M., Van Der Klis, J. D. & Verstegen, M. W. 2004. Morphology of the small intestinal mucosal surface of broilers in relation to age, diet formulation, small intestinal microflora and performance. Br Poult Sci, 45, 41-8.
Vandesompele, J., De Preter, K., Pattyn, F., Poppe, B., Van Roy, N., De Paepe, A. & Speleman, F. 2002. Accurate normalization of real-time quantitative RT-PCR data by geometric averaging of multiple internal control genes. Genome Biol, 3, RESEARCH0034.
Větrovský, T. & Baldrian, P. 2013. The variability of the 16S rRNA gene in bacterial genomes and its consequences for bacterial community analyses. PLoS ONE, 8, e57923.
Vielma, J. & Lall, S. P. 1997. Dietary formic acid enhances apparent digestibility of minerals in rainbow trout, Oncorhynchus mykiss (Walbaum). Aquaculture Nutrition, 3, 265-268.
References
236 | P a g e
Walton, M. J., Cowey, C. B., Coloso, R. M. & Adron, J. W. 1986. Dietary requirements of rainbow trout for tryptophan, lysine and arginine determined by growth and biochemical measurements. Fish Physiology and Biochemistry, 2, 161-169.
Wang Q, Garrity GM, Tiedje JM, Cole JR (2007). Naive Bayesian classifier for rapid assignment of rRNA sequences into the new bacterial taxonomy. Applied and Environmental Microbiology 73: 5261-5267.
Wang, Y. 2011. Use of probiotics Bacillus coagulans, Rhodopseudomonas palustris and Lactobacillus acidophilus as growth promoters in grass carp (Ctenopharyngodon idella) fingerlings. Aquaculture Nutrition, 17, e372-e378.
Watanabe, T., Verakunpiriya, V., Watanabe, K., Kiron, V. & Satoh, S. 1997. Feeding of Rainbow Trout with Non-Fish Meal Diets. Fisheries science, 63, 258-266.
Wells, R. & Weber, R. E. 1991. Is there an optimal haematocrit for rainbow trout, Oncorhynchm mykiss (Walbaum)? An interpretation of recent data based on blood viscosity measurements. Journal of Fish Biology, 38, 53-65.
Whyte, S. K. 2007. The innate immune response of finfish--a review of current knowledge. Fish Shellfish Immunol, 23, 1127-51.
Wieser, H. 2007. Chemistry of gluten proteins. Food Microbiology, 24, 115-119.
Wilson, R. P. & Cowey, C. B. 1985. Amino acid composition of whole body tissue of rainbow trout and Atlantic salmon. Aquaculture, 48, 373-376.
Wilson, R. P. 1994. Utilization of dietary carbohydrate by fish. Aquaculture, 124, 67-80.
Wintzingerode, F. V., Göbel, U. B. & Stackebrandt, E. 1997. Determination of microbial diversity in environmental samples: pitfalls of PCR-based rRNA analysis. FEMS Microbiology Reviews, 21, 213-229.
Wong, J. M., De Souza, R., Kendall, C. W., Emam, A. & Jenkins, D. J. 2006. Colonic health: fermentation and short chain fatty acids. J Clin Gastroenterol, 40, 235-43.
Wong, S., Waldrop, T., Summerfelt, S., Davidson, J., Barrows, F., Kenney, P. B., Welch, T., Wiens, G. D., Snekvik, K., Rawls, J. F. & Good, C. 2013. Aquacultured rainbow trout (Oncorhynchus mykiss) possess a large core intestinal microbiota that is resistant to variation in diet and rearing density. Appl Environ Microbiol, 79, 4974-84.
References
237 | P a g e
Wu, G. 1998. Intestinal Mucosal Amino Acid Catabolism. The Journal of Nutrition, 128, 1249-1252.
Wu, G., Fang, Y.-Z., Yang, S., Lupton, J. R. & Turner, N. D. 2004. Glutathione Metabolism and Its Implications for Health. The Journal of Nutrition, 134, 489-492.
Wu, S., Wang, G., Angert, E. R., Wang, W., Li, W. & Zou, H. 2012. Composition, Diversity, and Origin of the Bacterial Community in Grass Carp Intestine. PLoS ONE, 7, e30440.
Xu, Y., Wang, Y. & Lin, J. 2014. Use of Bacillus coagulans as a Dietary Probiotic for the Common Carp, Cyprinus carpio. Journal of the World Aquaculture Society, 45, 403-411.
Yang, S.-C., Lin, C.-H., Sung, C. T. & Fang, J.-Y. 2014. Antibacterial activities of bacteriocins: application in foods and pharmaceuticals. Frontiers in Microbiology, 5, 241.
Yar Ahmadi, P., Farahmand, H., Kolangi Miandare, H., Mirvaghefi, A. & Hoseinifar, S. H. 2014a. The effects of dietary Immunogen on innate immune response, immune related genes expression and disease resistance of rainbow trout (Oncorhynchus mykiss). Fish Shellfish Immunol, 37, 209-14.
Yar Ahmadi, P., Kolangi Miandare, H., Farahmand, H., Mirvaghefi, A. & Hoseinifar, S. H. 2014b. Dietary fermentable fiber upregulated immune related genes expression, increased innate immune response and resistance of rainbow trout (Oncorhynchus mykiss) against Aeromonas hydrophila. Fish Shellfish Immunol, 41, 326-31.
Ytrestøyl, T., Aas, T. S. & Åsgård, T. 2015. Utilisation of feed resources in production of Atlantic salmon (Salmo salar) in Norway. Aquaculture, 448, 365-374.
Yun, J. W. 1996. Fructooligosaccharides—Occurrence, preparation, and application. Enzyme and Microbial Technology, 19, 107-117.
Zenhom, M., Hyder, A., De Vrese, M., Heller, K. J., Roeder, T. & Schrezenmeir, J. 2011. Prebiotic oligosaccharides reduce proinflammatory cytokines in intestinal Caco-2 cells via activation of PPARgamma and peptidoglycan recognition protein 3. J Nutr, 141, 971-7.
Zhang, Q., Yu, H., Tong, T., Tong, W., Dong, L., Xu, M. & Wang, Z. 2014. Dietary supplementation of Bacillus subtilis and fructooligosaccharide enhance the growth, non-specific immunity of juvenile ovate pompano, Trachinotus ovatus and its disease resistance against Vibrio vulnificus. Fish Shellfish Immunol, 38, 7-14.
References
238 | P a g e
Zhang, W., Liu, M. & Dai, X. 2013. Biological characteristics and probiotic effect of Leuconostoc lactis strain isolated from the intestine of black porgy fish. Braz J Microbiol, 44, 685-91.
Zhou, Q.-C., Buentello, J. A. & Gatlin Iii, D. M. 2010. Effects of dietary prebiotics on growth performance, immune response and intestinal morphology of red drum (Sciaenops ocellatus). Aquaculture, 309, 253-257.
Zhou, Z., Ding, Z. & Huiyuan, L. V. 2007. Effects of Dietary Short-chain Fructooligosaccharides on Intestinal Microflora, Survival, and Growth Performance of juvenile White Shrimp, Litopenaeus vannamei. Journal of the World Aquaculture Society, 38, 296-301.
Zhou, Z.-G., He, S., Liu, Y., Shi, P., Huang, G. & Yao, B. 2009. The Effects of Dietary Yeast Culture or Short-chain Fructo-oligosaccharides on the Intestinal Autochthonous Bacterial
Communities in Juvenile Hybrid Tilapia, Oreochromis niloticus×Oreochromis aureus. Journal of the World Aquaculture Society, 40, 450-459.
Zhu, Q., Xu, Q. Y., Xu, H., Wang, C. A. & Sun, D. J. 2011. Dietary glutamine supplementation improves tissue antioxidant status and serum non-specific immunity of juvenile Hybrid
70/524/Eec., C. D. 2004. List of the authorized additives in feedingstuffs published in application of Article 9t (b) of Council Directive 70/524/EEC concerning additives in feedingstuffs. Off. J. Eur. Union, C50–C144.
70/524/Eec., C. D. 2004. List of the authorized additives in feedingstuffs published in application of Article 9t (b) of Council Directive 70/524/EEC concerning additives in feedingstuffs. Off. J. Eur. Union, C50–C144.