Samuels, R. (1999), Light, Mood and Performance at School: Final Report Department of Education and Training and Department of Public Works and Services, NSW, Australia ------------------------------------------------------------------------------------------------------------------- Executive Summary (Phase#1, 1998) An Interim Report to DET/DPWS (Feb 1999) described and evaluated the field research carried out in 1998 (before and after full spectrum lamps were installed in 8 experimental classrooms). Major findings indicated that after installation of the full spectrum lights anxiety, depression and S.A.D. syndromes (lethargy etc) improved, or occurred significantly less. Furthermore, inattention also decreased and was related to improved behaviour. There also seemed to be a strong relationship between S.A.D. and inattention. These findings seem to afford some measure of empirical evidence confirming the theoretical expectations based on the literature review of overseas studies: that full spectrum light improves mood and attentiveness in school children. Executive Summary (Phase#2, 1999) The second phase of the research emerged fortuitously, overcoming difficulties experienced during Phase#1 where interactions with the teachers were inevitable, and possibly deleterious to the validity of the results. The Phase#2 research method was able to avoid this issue completely. Results indicate a very highly significant influence of full spectrum light on virtually every aspect evaluated (in 34 of the 35 items on the assessment scale). The Psycho- Biological assessment instrument/scale itself also proved to be highly reliable, with a high measuresof internal consistency. A range of statistical procedures were applied to verify the findings - with consistently positive outcomes. It is now feasible to assert that the full spectrum lighting conditions have made a substantially positive difference to the attentiveness, mood, state of mind and behaviour of the students ie to their generic performance at school.
Transcript
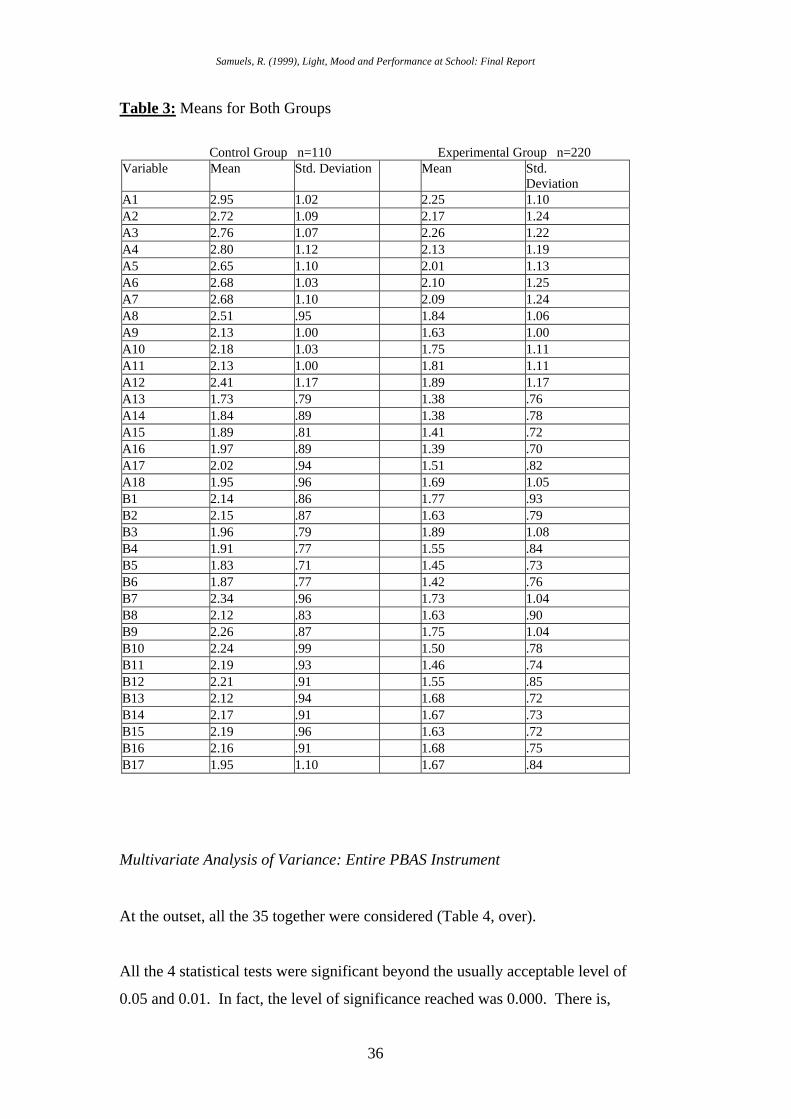
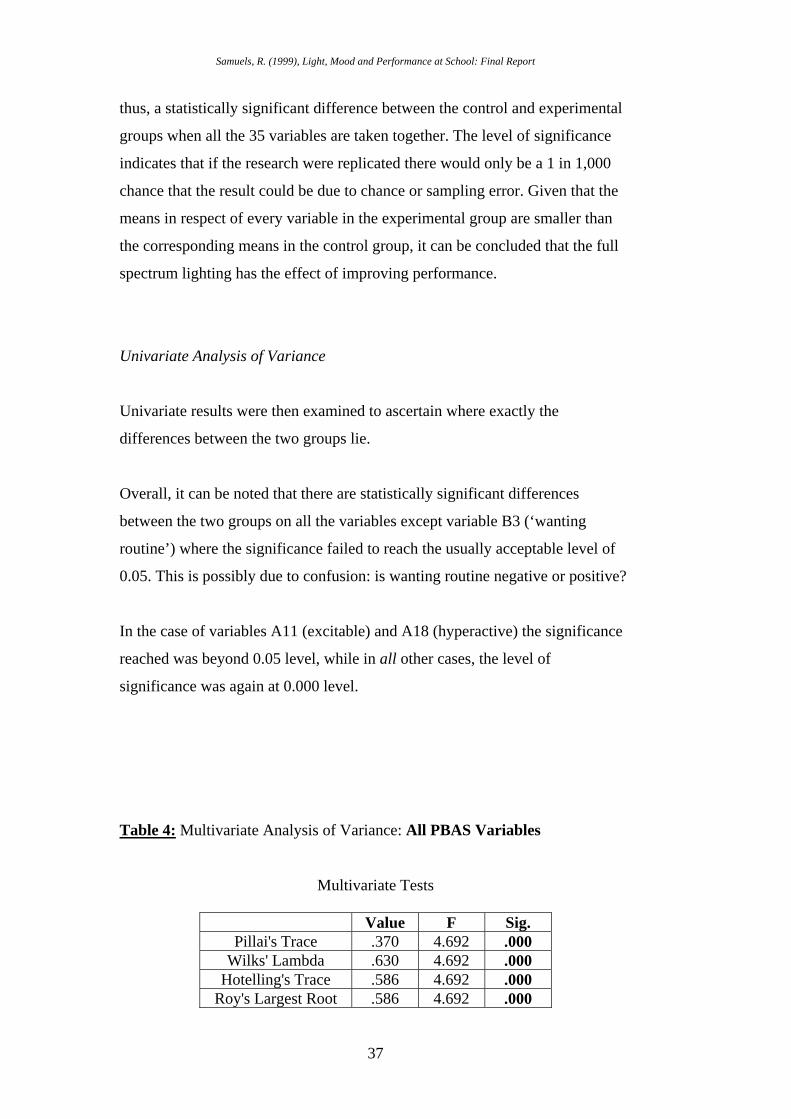
Samuels, R. (1999), Light, Mood and Performance at School: Final Report
Department of Education and Training and Department of Public Works and Services, NSW, Australia
An Interim Report to DET/DPWS (Feb 1999) described and evaluated the field
research carried out in 1998 (before and after full spectrum lamps were
installed in 8 experimental classrooms). Major findings indicated that after
installation of the full spectrum lights anxiety, depression and S.A.D.
syndromes (lethargy etc) improved, or occurred significantly less. Furthermore,
inattention also decreased and was related to improved behaviour. There also
seemed to be a strong relationship between S.A.D. and inattention.
These findings seem to afford some measure of empirical evidence confirming
the theoretical expectations based on the literature review of overseas studies:
that full spectrum light improves mood and attentiveness in school children.
Executive Summary (Phase#2, 1999)
The second phase of the research emerged fortuitously, overcoming difficulties
experienced during Phase#1 where interactions with the teachers were
inevitable, and possibly deleterious to the validity of the results. The Phase#2
research method was able to avoid this issue completely. Results indicate a very
highly significant influence of full spectrum light on virtually every aspect
evaluated (in 34 of the 35 items on the assessment scale). The Psycho-
Biological assessment instrument/scale itself also proved to be highly reliable,
with a high measuresof internal consistency. A range of statistical procedures
were applied to verify the findings - with consistently positive outcomes. It is
now feasible to assert that the full spectrum lighting conditions have made a
substantially positive difference to the attentiveness, mood, state of mind and
behaviour of the students ie to their generic performance at school.
Samuels, R. (1999), Light, Mood and Performance at School: Final Report
This research is unique in the sense that it is the first to assess full spectrum
lighting and mood and performance at school using a psycho-biological
assessment scale; and, generally, it is the first work of its kind in Australia.
Acknowledgements:
This research was funded by the New South Wales
Department of Public Works and Services
and Department of Education,
under the auspices of the Education Facilities Research Group
Many people have contributed to this research, over the past few years
I would like to take this opportunity to thank:-
Tim Hobbs, Senior Research Architect at the EFRG
for his enlightened management of the project over many years,
and his commitment to unearth the relationship of light and colour
for the well-being and performance of school children
and
Alan Smith, Performance Analyst at the EFRG, for his constant support
Bill Scott, Principal of Seven Hills West Primary School
for his understanding, tolerance, and belief in the project;
and a special note of thanks to the many teachers who participated
and without whom the research could not have been accomplished
Dr. Murti Durvasula
Director of the Australian Advanced Data Analysis and Publication House
who undertook all the statistical analyses,
and provided the interpretative foundation for the analytic sections…
…especially for his crucial contribution
to establishing the credibility of the methodology
and the veracity of the findings…
2
Samuels, R. (1999), Light, Mood and Performance at School: Final Report
1 INTRODUCTION The motivation for undertaking the research reported here is the need to know,
from the DPWS/DET point of view, whether or not a change towards a full
spectrum lighting (FSL) regime in schools in New South Wales might be
educationally justified. Copious northern hemisphere research suggests
beneficial results from FSL; albeit putting theory into practice in the real world
inevitably throws up innumerable complications and interpretations about what
is precisely happening in the photobiological interaction of humans in their
environment.
The research question posed here is whether a country like Australia, blessed
with sunlight, is comparable to northern European ‘winter-countries’ where
daylight shortens significantly, and seasonal affective disorder syndromes
(S.A.D. or 'winter blues') become more prevalent, inducing depression and
influencing performance. The aim, thus, is to evaluate the extent to which full
spectrum fluorescent lighting in schools affects student mood and performance
- in Australian conditions.
The researcher has previously reported to the EFRG concerning the theoretical
impact of light, in schools in particular, on mood, arousal/attention and
performance.1 The current empirical research relies on teacher assessment of
student performance; and a special assessment tool was developed for this
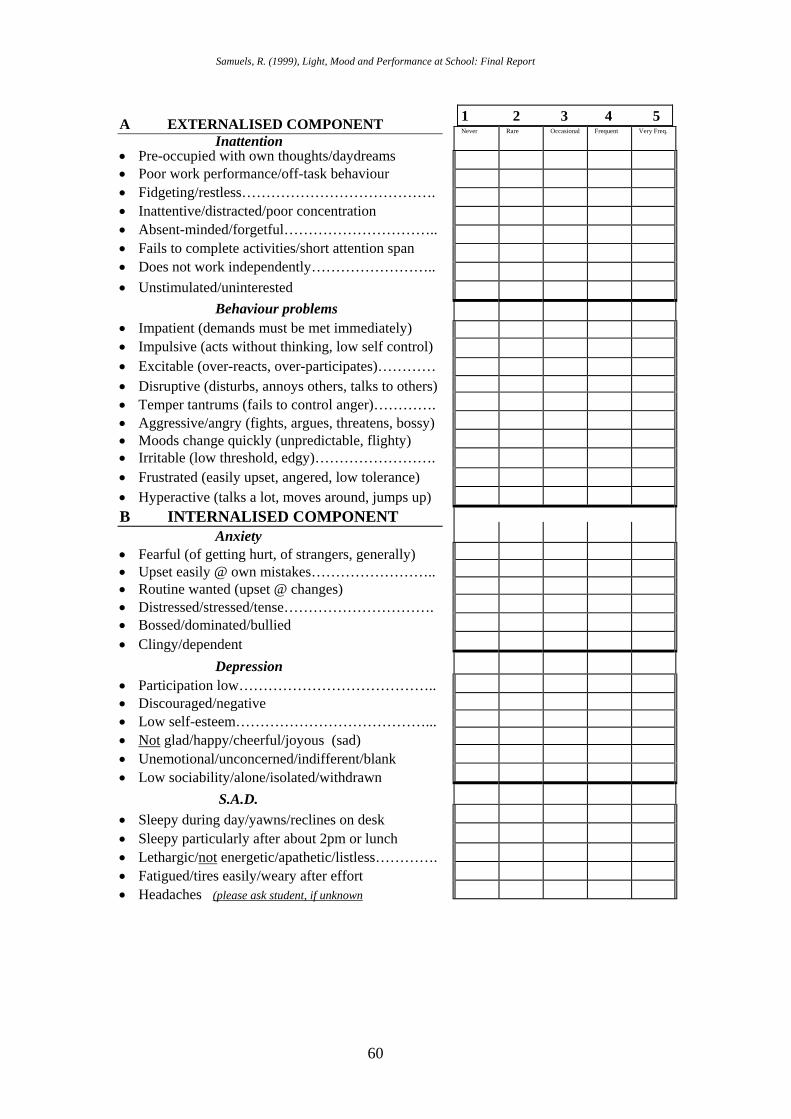
purpose, the composite Psycho-Biological Assessment Scale (PBAS) - a
schedule of 35 items relating to student mood, attentiveness and behaviour. It
appears robust since its statistical reliability is very high, and the results
reported here are thus robust in that sense (see 4.3).
Several potential constraints, borne of the reality of undertaking field research
were reported in the Interim Report; and the value of a minimalist approach
reiterated (consciously altering only one variable: the lighting).
1 see: Samuels and Stephens (1996): Colour and Light in Schools
3
Samuels, R. (1999), Light, Mood and Performance at School: Final Report
In effect, two separate studies were conducted in the same field setting, in 1998
and 1999 respectively, employing a variant experimental approach. Results
from the first study were generally positive; results from the second were
highly significant - both were in the theoretically expected direction. Together
these findings should be considered robust, and indicative of the positive affect
of full spectrum lighting - even in Sydney, Australia conditions.
Rationale for undertaking the study
Humans are photo-chemical organisms, light/dark adapted, with inbuilt bio-
chemical switches tuned to these rhythms. The master gland in this
arousal/attention and quiescence/inattention oscillation is the pineal, secreting
melatonin and responding to daylight in a complex photon-neuron
interrelationship. Humans have evolved in the presence of natural daylight and
sunlight for millennia, yet in the past half-century have come to spend the
majority of daylight hours inside buildings which are artificially lit. As society
becomes more urbanised, this is exacerbated. School students spend
considerable amounts of time indoors, in spectrally deficient fluorescent
lighting conditions – especially during the winter months, when natural light
levels are relatively low, even in Sydney. This could be deleterious to their
photobiological balance and performance. Even where daylight enters the
building this could be the case, since after transmission through glass the light
is no longer equivalent to natural daylight - it is 'attenuated'. To the degree that
glazing absorbs or reflects daylight the pineal-light response could be affected.
Although this ‘interior illumination’ spectrum is depleted in comparison to
natural light, technology now allows us to artificially simulate daylight. To this
end, daylight-simulating or full spectrum artificial lighting was installed in
eight classrooms, while in four the standard cool-white fluorescents were
retained, as the basic research methodology.
4
Samuels, R. (1999), Light, Mood and Performance at School: Final Report
2 GENERAL THEORETICAL CONSIDERATIONS
2.1 Neuro-Endocrine and ‘Photo-Somatic’ Interactions with Light
Fundamental to the research undertaken here is the recognition of the neuro-
endocrine response of humans to the environment. This is a ‘psycho-somatic’
response where any interaction with the environment – physical, social or
emotional - prompts an associated internal chemical interaction between the
brain and the neuro-endocrine glands (hypothamalus, pituitary, adrenals…),
whether the stimulus is experienced as negative or positive. Stress responses
(and their consequences, for instance: cortico-steriod and adrenalin secretions)
are well recognised (see Samuels, 1978 for review). Less well recognised is the
non-visual response to light ie where light acts as a potent form of energy,
having profound impacts on well-being both physical and psychological, and
thus potentially on mood, arousal, attention and performance. Again, the
hypothalamus is intimately involved in this ‘photon-neuron’ response. It is
connected via a separate nerve pathway to the retina, from which impulses
travel to the suprachiasmatic nuclei which serve as a vital component of the
internal biological clock, timing the 24hr (circadian) cycles of physiology,
behaviour and biochemistry.
Furthermore, the photo-sensitive neuro-endocrine pineal gland is associated
with light/dark cycles, and secretes the hormone melatonin in the dark, which
conditions arousal and sleep. Where people are exposed to light, either natural
or, if artificial, daylight-simulating/full spectrum, melatonin secretion is
properly managed. Where light levels are low or the visual spectrum is
attentuated (after passing through glazing, for example) or incomplete (as in
standard fluorescent lighting), melatonin continues to be secreted (unnaturally).
Standard levels of standard indoor lighting (400 to 500 lux) are thus said to be
equivalent to ‘biological darkness’ – Lewy et al (1980), Brainard et al (1988).
Full spectrum artificial lighting, on the other hand, includes not only the visible
spectrum in daylight proportions2 but also ‘near’ ultra-violet (UVA) and seems
2 “Vitalites (Duro-Test) contain UV radiation in approximately the same proportion to visible light as that found in natural daylight” (Hathaway, 1995, citing manufacturer information)
5
Samuels, R. (1999), Light, Mood and Performance at School: Final Report
able to simulate the effect of natural light, even at standard illumination levels,
over a period of time.
Further evidence of the salience of light to human well-being derives from the
manifest success of light-therapy in people suffering seasonal affective disorder
symptoms, particularly prevalent in the winter months, particularly in the
northern hemisphere - which mood-state is now known to be associated with
light deprivation. Positive responses to regular exposure to bright, full spectrum
light bears witness to the reality of light as bio-energy (Lewy et al, 1980,
Rosenthal et al, 1984, Brainard et al, 1990).
Lighting engineers and architects typically use as their measure levels of
lighting which are adequate for vision (or to create ‘atmosphere’) but not for
psycho-biological stimulation. Moreover, energy efficiency pursuits frequently
result in either lower levels of illumination or the use of lighting which is far
from daylight-simulating (sodium lamps, for instance). The consequence of
either or both can manifest as depression of the nervous system, low arousal,
emotional depression, lethargy and headache; and/or the so-called ‘winter-
blues’ or ‘S.A.D’ syndrome. Further important consequences are a drop in
attentiveness, or an increase in distraction or inattentiveness. [See Samuels et
al, 1996 for review]. A depressed mood-state, coupled with a state of low
arousal, an ill-balanced biological clock and disharmonious psycho-somatic
functioning, not surprisingly, is likely to result in a fall-off in performance.
2.2 Natural Daylight and Attenuated Indoor Light
Humans are biologically attuned to natural daylight. It contains all colours (all
wavelengths in the visual spectrum) in relatively uniform amounts – no sharp
peaks or discontinuities in the spectral distribution (Hathaway, 1995).
Technically, daylight is rated as having a Colour Rendering Index or CRI of
100; and lamps which simulate daylight to levels of CRI 95+ are currently
termed full spectrum. The extent to which people are deprived of FSL is the
issue at stake here. Although daylight inside buildings is preferred to artificial
lighting (Collins, 1975; inter alia) and plays a vital energy efficiency role, it is
not biologically balanced light. Indoor daylight is attenuated ie not full
6
Samuels, R. (1999), Light, Mood and Performance at School: Final Report
spectrum, since glass does not transmit the full spectrum of daylight. Even
3mm, single-pane clear glass permits only 86% visible spectrum and 78% UV
transmittance; while with low-E insulated glazing these levels drop to about
55% and 30%, respectively. 13mm bronze plate glass, frequently used on high
rise office towers, transmits only 25% of the visual spectrum (Johnson, 1984;
Germer, 1985; ASHRAE, 1989).
Clarke (1979) showed these transmittance differences occurring in the red
and particularly in the blue extremes of the spectrum, and called the result:
interior daylight, or ID65 (6500K being the ‘correlated colour temperature’
of daylight). Kok et al (1985) confirmed this by measuring the spectral
irradiance inside a room, and recording higher UV concentrations when the
windows were open. Both glass and building materials absorb UV
wavelengths. The importance of this realisation is that indoor daylight will
not have the full psycho-biological benefits of outdoor daylight. Daylight
simulating artificial lighting has a vital role to play, in this regard. It is,
nonetheless, true that whatever daylight enters a building is biologically
and psychologically beneficial for the people inside. At worst there might
be some experience of glare, particularly where the sky is visible (skylight
is very bright), yet these conditions can usually be simply neutralised by
appropriate shading or screening. And daylight is diffuse; it is not sunlight,
where thermal discomfort or reflections on white paper or computer
screens might prove dissatisfactory. Indeed, although the inevitable
variability of the daylight exposure of respondents in all research on both
daylight and daylight-simulation seems rarely to be appreciated, the fact is
that virtually all studies indicate positive affects of enhancing interior
daylight (to whatever degree attenuated).
The extent to which these affects could be enhanced by a fuller comprehension
of the role of glass and other materials in absorbing spectral energy would seem
to be research for the future. Very recent 1999 research (personal
communication with Lisa Heschong: see 3.3 Daylight and Productivity) on
daylight and performance in a huge sample of school children (over 2000
7
Samuels, R. (1999), Light, Mood and Performance at School: Final Report
classrooms) took note of ‘tints’ – the heavier the tint the less the transmission of
visible light assumed. A light tint (allowing 40-60% transmittance of visible
light) reduced their window/daylight rating by one notch on a 5 point rating
scale, and a heavy tint (10-30%) by 2 notches. Performance improvements of
over 20% were recorded in reading and maths where the internal daylight was
greater. One further and intriguingly significant finding might well be a vital
clue to the indoor daylight attenuation issue. In classrooms where windows
could be opened students were also found to progress 7-8% faster. Controlling
for this variable is unattainable during field research under normal school
conditions (how often were the windows opened, what where the atmospheric
conditions at the time, which students were closest to the window, are the
blinds drawn, in which orientations are the windows?). Although previous
research (synthesised in Samuels, 1986) indicates that having control over
environmental conditions such as lighting, heating and ventilation – thus
openable windows - is highly appreciated by personnel, and is beneficial to
performance, it is teachers who would have control over opening windows and
not students who would make these decisions, in this case. The positive affects
in student performance should thus be attributed to the penetration of an
enhanced quality of the light.
2.3 UltraViolet Radiation (UVR)
The wavelengths of daylight making up UVR span from 400nm to 100nm and
miniscule quantities are produced by all fluorescent lamps. Indeed, it is
ultraviolet radiation that activates the phosphors coating the inside of
fluorescent tubes (5 different phosphors in FSL) – and is responsible for the
fluorescence and the eventual emission of light. The very thin glass sheath of
the fluorescent lamps themselves and especially the plexiglass/plastic diffusers
absorb almost all the shorter wavelength UVR emitted, while UVA (315 to
400nm) is largely transmitted, at least through the clear glass of the lamps
(Thorington, 1967 and 1985; Ott, 1982; Ronchi & Bodmann, 1984; Cole et al,
1985).
8
Samuels, R. (1999), Light, Mood and Performance at School: Final Report
In the field of photo-biology, UVA or ‘blacklight’ is the photon range
demonstrated empirically to be beneficial, indeed considered necessary and
natural for human functioning. UVA would appear to constitute what might be
called the benign quanta of ‘actinic’ light or the ‘biologically-activating’
spectral zones. There is also an important threshold point of relevance here. As
the UV wavelengths get shorter, through UVB to UVC, the impact on humans
is more radical, from triggering the UVB/Vitamin D response in the skin (Neer,
1985) to the more bacterial, germicidal and ultimately carcinogenic affects of
UVC exposure. In this regard, as early as 1981 the Australian Commonwealth
Department of Science and Technology evaluated Artificial Light at Work and
declared UVA ‘harmless to the eyes'.
Full spectrum daylight-simulating artificial light is designed to emit ‘trace’
amounts of UVA, even micro-traces of UVB, and substantial amounts of blue-
violet light. These are its most distinguishing characteristics in comparison to
other artificial light. From studies undertaken by the following researchers:
Kuller, Erikson, Wetterberg, Kuller, Wolfarth and Hathaway…the positive
impacts of UVR exposure encompass immunological, enzymatic and anti-
bacterial resistance to disease, enhanced calcium absorption, decreased
melatonin and cortisol secretion…as well as increased academic performance
and reduced visual fatigue.
With regard to visual performance it is cogent to note, from yet another
perspective, that the spectral power distribution of daylight simulating FSL is
important where the level of light begins to fall (affecting pupil size and thus
depth of field – or the so-called scotopic sensitivity of the eyes). Scotopically-
enriched light has been associated with better performance on challenging
visual performance tasks, and while daylight simulating fluorescent light has a
scotopic/photopic ratio of 2.22 (similar to sunlight @2.28), the standard cool-
white lamp ratio is only 1.46 (Berman 1992, 1993, 1994).
9
Samuels, R. (1999), Light, Mood and Performance at School: Final Report
Hathaway’s (1995) research with school children ‘enhanced’ UV exposure by
the simple strategy of using aluminum egg-crate diffusers, thus, in fact, by
blocking less and reflecting more. In the research reported here, some debate
over this issue ensued, but the luminaires installed at the Seven Hills West
school could not be fitted with egg-crate diffusers. To avoid any potential
source of concern about exposure of school children to more UVR (in UV-
conscious Australia) it was deemed prudent to leave the plastic diffusers as they
were normally deployed, albeit disallowing any ‘enhancement’ effects.
2.4 Duration and Intensity of Light
There appears to be a fundamental dichotomy in the research undertaken on full
spectrum lighting. The great majority of researchers seem to appreciate the
reality of the ‘photon-neuron’ relationship, and design their studies to span
considerable periods of time before expecting a response to light - for instance:
Ott (1982), Hughes (1983); Erikson and Kuller (1983); Rosenthal et al (1984);
Wurtman 1985; Wohlfarth (1986), Lindsten and Kuller (1987), Samuels and
Ballinger (1992). Lindsten and Kuller’s work with school children was over a
one-year period, Wohlfarth’s over a 10-month period, Ott’s over a two-month
period; while Erikson and Kuller’s office research was conducted over a 6-
month period, and Samuels and Ballinger’s over an 8-month period. This
understanding recognises that exposure over several months, at normal
illuminance (400-500 lux), allows this ephemeral energy source the time to
modify bio-chemical and psycho-somatic functions. Even exposure to very
bright light (2500+ lux) requires several hours to get a sustained response.
Lewy et al (1980) reported that melatonin concentrations begin to diminish
after about 20 minutes of exposure @2500 lux, and reached daytime levels after
about an hour; but @500 lux exposure there were no noticeable differences in
concentration levels during those periods.
However, some more recent research seems to neglect this vital element. These
studies bring subjects into an artificial environment for brief periods of time
(Boray et al, 1989; Veitch et al, 1991; Baron et al, 1992). Boray and colleagues
10
Samuels, R. (1999), Light, Mood and Performance at School: Final Report
report, for instance, that after 35 minutes no significant differences were found
among three lighting types (warm-white, cool-white and full spectrum); Veitch
and colleagues exposed their respondents to test conditions for 45 minutes,
during which time they undertook separate tasks lasting 2, 5 and 15 minutes –
with no distinguishing response. In this study respondents were told to expect
either better or worse performance under FSL lamps, and produced better
performance in both cases. The researchers did mention the ‘short exposure
time’, but this did not affect their evaluation of the validity of their results; and
although sophisticated statistical analyses were undertaken the basic premise
remains flawed.
Baron et al (1992) found no effects of luminous conditions on mood and
performance. The exposure time for subjects was not stated, but can be inferred
from the description of the tasks set to be about 20-40 minutes. Knez (1995),
who criticises this work on this dimension himself fails to state the duration of
his own experiment – although he does reports some positive findings relating
to cognitive performance via enhanced mood.
It should not be expected that low levels of indoor light for brief periods of time
should influence diurnal patterns of melatonin secretion or suppression. This
fundamental breach in understanding and thus research procedure is both
surprising and alarming, since spurious inferences are made as a consequence
(such as recommendations to not install FSL).
In the research reported here the first cohort of students (phase#1) were
exposed to the FSL conditions from after Easter until the end of October,
some 6 months; the phase#2 cohort from the end of January to the end of
June, some 5 months.
2.5 Efficiency and FSL
Studies show that higher quality light is perceived as being equivalent to poorer
quality light at higher levels of illumination. The Westpac study (Samuels and
Ballinger, 1992 ) similarly showed that high quality full spectrum lamps were
perceived as being more satisfactory on several visual dimensions than lamps of
11
Samuels, R. (1999), Light, Mood and Performance at School: Final Report
lower quality but higher illuminance. This suggests that full spectrum lamps,
relatively inefficient as they are, can be employed efficiently by using less
lamps per area (and by supplementing the luminaires with reflectors).
Moreover, Vitalite™ the internationally best known full spectrum lamp
company, now produces a lamp which emits 25% more light than older models,
again enhancing the possibility of intelligent energy management resulting in
energy consumption savings (www#2).
2.5 Lamp Characteristics
The rationale for the choice of the experimental lamps to use in the research
reported here has been previously described (Samuels, 1998: Interim Report).
Suffice it to repeat, here, that the Vitalites and Ottlites, the world leaders in
FSL, are both very expensive imports in comparison to lamps readily available
in Australia (manufactured by Philips and Osram/Siemens, amongst others). In
the event that the research indicated a positive relationship between
performance at school and FSL, it would have been unreasonable to
recommend that the DET/DPWS consider their deployment – given the costs
associated with expensive imports. On the other hand, the seemingly
efficacious FSL Osram Lumilux de Luxe–Daylight™ lamps employed in the
preceding Westpac research are readily available, at a higher cost than standard
issue, naturally, but not prohibitively. These lamps were consequently and
eventually opted for in the research.
Their light characteristics are the following:-
* 8 Experimental Classrooms
♦ Lumilux de Luxe–Daylight L36W/12 - 950
CRI3 = 95 and CCT4 = 5400K
* 4 Control Classrooms
3CRI = Colour Rendering Index (100 = perfect daylight-simulation) 4CCT = Correlated Colour Temperature (>5000=cool)
12
Samuels, R. (1999), Light, Mood and Performance at School: Final Report
♦ Standard Education Dept. Issue ‘Cool-White’ Fluorescent lamps
CRI = 65 and CCT = ±4000K
It also proved daunting to cross compare various lamps; either information is
withheld (commercial-in-confidence?) or different measurement scales are
employed. According to documentation from Osram/Siemens, the UVA and
UVB potency in the Siemens FSL-12 series used in this research employed in
the research is 50mW/m2 (45 and 5, respectively), while in a standard example
of the cool-white type total UVR is only 0.16 (according to Sylvania Lighting
documentation).
3 FULL SPECTRUM LIGHTING STUDIES: PRECEDENTS Over 30 years of research into the relationships between mood, attention and
performance and the spectral quality of light has shown that exposure to FSL
inside buildings results in fewer vision problems, less fatigue, enhanced
alertness, improved performance, less lethargy, and diminished hyperactivity;
while in spectrally unbalanced artificial light and in the absence of daylight
lethargy and cortisol secretion (a stress hormone) increase, visual acuity drops,
dissatisfaction increases, and so on.5
Virtually all studies that have been carried out regarding the relationship of
light (whatever its source) to performance are, however, equivocal and
indeterminate to some degree - given the large number of other intervening
variables which also have an impact on performance, such as neuronal and
metabolic proclivities, past experience, or motivation, inter alia. Inevitably,
visibility is implicated – virtually all tasks in all walks of life include a visual
component which is central to their function. Yet, non-visual as well as visual
variables are also part of this same equation. This multi-dimensional aspect
makes it difficult to draw conclusions about the influence of light on
performance.
5 see Samuels et al, (1996) for a full review.
13
Samuels, R. (1999), Light, Mood and Performance at School: Final Report
3.1 School Studies In order to briefly describe the theoretical and empirical context in which
this present study has been undertaken, a chronological synopsis of studies
relating specifically to schools (and other students), as well as some other
studies with salient findings, follows:-
Harmon's 1942 research was the precursor of later studies using full
spectrum lamps. He showed that the health of school children was impaired
when they were exposed for long periods of time to artificial light with a
lack of ‘brightness’ due to its reduced spectrum.
Maas et al (1974) explored the relationship between spectral differences in
environmental illumination and both objective fatigue (a decrement in
performance, measured via the Critical Flicker Fusion test) and perceptual
fatigue (feelings of weariness for instance, as measured by bi-polar
semantic differential tests) in university students. Cool-whites and Vita-lite
(FSL) fluorescents were the test lamps used. The subjective variable:
lively-lethargic proved to be significant. Subjects under the cool-white
light tended to become less lively and more lethargic, while there appeared
to be no changes under the Vita-lites, which were also found to enhance
visual acuity (subjects could see more clearly).
Hughes (1980, 1981) researched the effects of full spectrum lights on
school children, and reported increased visual acuity, reduced overall
fatigue, improved work performance, and lower rates of illness due to
colds. Such findings apparently led to the specification of full spectrum
lighting for schools and workplaces in the ex-USSR. In such conditions,
children apparently grow faster, their work ability and grades improve and
catarrhal infections are fewer (Birren, 1972a).
14
Samuels, R. (1999), Light, Mood and Performance at School: Final Report
Wohlfarth and Sams (1981) conducted research using full spectrum lighting
and shades of blue in classrooms; and reported drops in systolic blood pressure
for both sighted and blind children. Sydoriak (1984) replicated this study and
found significant reductions in both systolic and diastolic blood pressure in blue
classrooms. Wohlfarth and Sams also reported a large drop in aggressive and
non-attentive behaviour; and that teachers felt more relaxed, reporting more
work completed.
John Ott (1982) reported on a number of studies undertaken in the mid-70's
relating to fluorescent lighting and the behaviour of children at school. He
conducted a study at a school using full spectrum, radiation shielded lamps,
during a two-month period. Hyperactive children calmed down, learning
disabilities decreased, and academic level increased in children exposed to
the daylight-simulating lamps. A photographic record shows the
progression of a distracted and hyperactive boy, initially unable to sit still,
moving closer to the teacher, and finally at the blackboard taking part in
the regular classroom activities. A time-lapse film is available from the
International Film Bureau, Chicago showing hyperactive children calming-
down in classrooms equipped with full spectrum lamps. Ott further
reported on two studies undertaken by Californian schools which
confirmed this relationship (p.130-133); and also mentions a School Board
which had voted unanimously to remove the high pressure, sodium vapour
lights that had been installed, in the interest of energy efficiency, in about a
dozen schools. This was after many complaints by teachers and students
listing such problems as headaches, eyestrain, nervous tension and nausea.
Ingraham (1983) examined the effects of electromagnetic radiation -
emitted by the ballasts of all fluorescent lamps - on ‘off-task’ or
hyperactive behaviour, using classrooms with cool white/unshielded lamps,
full spectrum/unshielded lamps and full spectrum/shielded lamps.
Significant differences occurred in the latter situation, where observers
noted decreases in inattentive, disruptive, and inappropriate behaviours.
Mayron and Ott et al (1977) had previously found similar improvements in
15
Samuels, R. (1999), Light, Mood and Performance at School: Final Report
hyperactivity in school children with full spectrum radiation shielded
lamps. Electronic ballasts improve energy efficiency remarkably, but are
expensive to purchase; shielding also incurs further costs.
In 1986 Wohlfarth extended his earlier work, undertaking the most
comprehensive school field experiment to date, testing performance in
classrooms with yellow in students’ vision and blue in teachers’ vision, together
with full spectrum lighting. This extensive study involved four elementary
schools, grades 1 to 6, over a 10 month period.
The Control school had standard lighting and so-called traditional wall colours
in off-white to brown shades, and brown carpets; one of the three experimental
classrooms was equipped with FSL-only (traditional colours); a second had
only ‘psychodynamic’ colours ie walls painted cool-blue (predominantly in
teachers’ vision) and yellow (a warm colour) in students’ vision, with blue
chalkboards and brown carpets; and the third had both FSL and blue-yellow.
Further experimental classroom situations involved altering ultraviolet and
radiation levels.
Inevitably, a range of confounding extraneous parameters influenced outcomes.
The researcher isolates the blending of cool and warm colours in the same room
as a ‘fault’ in the experimental design (because of confounding field-of-vision
effects). Further constraints would have included the amount of time spent
outdoors, window opening, extent and quality of indoor natural daylight, even
overshadowing. Such factors are extraordinarily difficult to control, and are
present as constraints on interpretation in all photo-biological research, whether
mentioned or not.
Although, overall, insights from the Wohlfarth study are inconclusive, some
significant changes were evident in mood states. Sadness, aggression,
‘surgency’ or cheerfulness, and self-mastery and self-esteem were evaluated via
the Pre-Adolescent Mood State test (PAMS).6 Scores for self-mastery/esteem
6 elements of which were included in the PBAS teacher assessment schedule used in the
16
Samuels, R. (1999), Light, Mood and Performance at School: Final Report
were significantly and consistently lower in both the Control and the
psychodynamic colour-only classrooms. The researcher considered this to be a
robust finding indicative of beneficial effects in both the FSL light-only and the
FSL/blue-yellow conditions, in which students had greater feelings of surgency
and self-esteem. Further, Control students scored significantly higher on
aggression. Noise levels were also measured in the libraries of the
architecturally identical Control and FSL/blue-yellow schools, with
significantly less noise measured in the latter (5-6 dBA quieter).
In an extension to the research, two classrooms were fitted with full
spectrum/ultraviolet supplemented lighting, permitting UV radiation in the mid
and near UV range; while two others had conventional lighting. Significantly
lower levels of dental caries were recorded over a 22-month period in the
FSL/UV classrooms. Further, in comparison to a FSL-only classroom there was
significantly less absenteeism in the FSL/UV conditions.
Zamkova and Krivitskaya (1966) had earlier noted school children reacting
positively to ultraviolet erythrine lamps in USSR school research. Wohlfarth
also cites 6 further studies where ultraviolet light had beneficial effects on
school children, the elderly, factory workers, and animals.
Lindsten and Kuller (in Kuller, 1987) studied about 100 school children,
aged 8-9, for one year. Again, experimental and Control lamps were used.
Children in the classroom which had neither natural daylight (no windows
at all) nor simulated daylight had significantly higher cortisol secretion
levels during winter.
The Alberta Dept. of Education supports work by Canadian researchers on the
effects of FSL and UV on school performance, and prominent work is emerging
from them as a result. In a recent two-year study with elementary students,
Hathaway (1995) developed Wolfarth’s earlier work; showing reading and
mathematical ability improvements (similar to Heschong’s findings on daylight
research reported here
17
Samuels, R. (1999), Light, Mood and Performance at School: Final Report
in schools cited later), as well as reduced dental caries and absenteeism, in
FSL/UV↑7 conditions. The worst results were evident in the high pressure
sodium vapour lighting conditions. Overall, in the FSL conditions there was
significantly better attendance than in the cool-white conditions; and greatest
achievement gains in language and math were in the FSL conditions, UV
supplemented or not.
As in all other photo-biological research, there is no mention of the
impossibility of controlling for the confounding influence of natural daylight
exposure of each student. Although initially attempted in the research reported
here a resolution was not found, due to the complexity of extracting this
information from students themselves. Similarly, all prior research has not
made any mention of issues relating to interior daylight, attenuated after
passing through glass.
3.2 Relevant Findings from Other Studies
Disturbances in the endocrine functioning of people as a result of exposure
to spectrally unbalanced and intense artificial light were reported by
Hollwich and Dieckhues (1968, 1972). As the intensity of the light
increased, cortisol secretions increased.
Following on this work, Hollwich et al (1975) related low spectral quality
lighting to fatigue, while Hofling (1973) had found a relationship with
headache episodes.
Greiter et al (1979) documented how natural or simulated sunlight had a
positive effect on physical working capacity, decreasing heart rate and
increasing oxygen uptake.
Hollwich and Dieckhues (1980) undertook further research regarding the
influence of two sources of strong artificial illumination (3,500lux) - one a
7 UV enhancement of 4-6 times was achieved by using aluminium egg-crate diffusers
18
Samuels, R. (1999), Light, Mood and Performance at School: Final Report
cool-white, the other a daylight-simulating lamp. They found stress-like
levels of the hormones ACTH and cortisol in the group exposed to the
cool-white lamps for a fortnight, but this effect was absent in the daylight-
simulating group. The researchers suggested that these differences
explained the agitated mental and physical behaviour and fatigue of
students under artificial illumination with a strong spectral deviation from
sunlight, as reported by Maas et al, in 1974.
Hughes and Neer (1981) reported on a large number of studies linking
Vitamin D synthesis to ultraviolet radiation and documenting its deficiency
in indoor workers working under artificial light with little or no UVR
below 315nm. Some years earlier, Neer et al (1971) had exposed a group of
veterans to cool-white lighting, and found their intestinal absorption of
calcium declined during winter periods.
Hughes (1983) reported further on a number of studies he undertook to
determine the psychological impact of simulated natural light and cool-
white light. Office workers evaluated their work environment, their work
task and their feelings as a function of lighting type. The results supported
the conclusion that the daylight-simulating light was perceived as
significantly more pleasing, natural, bright and stimulating. Observers felt
more relaxed, less fatigued and experienced greater eye comfort. They also
rated their tasks as being more distinct, easier and satisfying.
Employing the same evaluation techniques and lamps, Hughes (1983)
evaluated an indoor training facility, used by rowing crews. Significant
differences were found for pleasantness, brightness, feelings of healthiness,
and strong physical strength. He also evaluated whether such lighting
would influence high-school wrestlers training indoors. Here he employed
the Critical Flicker Fusion test too, which proved to be significantly
improved under the daylight-simulating conditions, demonstrating greater
activation and decreased fatigue. Again, a large array of survey items
19
Samuels, R. (1999), Light, Mood and Performance at School: Final Report
proved significant: pleasantness, naturalness, stimulation, and positive
effect on strength, inter alia.
Erikson & Kuller (1983) compared the effects of white and daylight-
simulating lamps on 55 office workers in Sweden over half-a-year. People
working in the daylight-simulating lighting had fewer vision problems and
reported less visual fatigue. Melatonin secretions were also reduced during
the winter, and people felt more alert and active. Scores on mood scales
indicated a significantly higher ‘social mood’ and ‘drive’.
Samuels & Ballinger (1992) evaluated socio-personal and energy-
environment consequences of the deployment of three fluorescent lighting
types, installed on different floors of an office building in Sydney (55
respondents), after an eight-month period. Light systems ranged from low
spectral quality cool-whites (CRI 63, CCT 4100K), to energy-efficient,
higher CRI Triphosphors (CRI 85, CCT 4000K) and daylight-simulating/
full spectrum lamps (CRI 95, CCT 5400K). From a self-report
questionnaire evaluating satisfaction with lighting, and the incidence of
S.A.D and SBS8 episodes, six significantly beneficial experiences were
recorded in the daylight-simulating condition. These included greater
satisfaction with lighting, generally; and with the colour, level and clarity
of the light. Crucially, less headaches were reported, and employees felt
more energetic at work.
3.2 Daylight and Performance/Productivity
Although this is not the place to evaluate daylight and productivity, generally or
specifically, it is necessary to remind ourselves that daylight is the central issue,
albeit artificial daylight in the particular case-study undertaken here. Discussion
of the preference of people for daylight has been previously presented to the
DET/DPWS. Suffice it to say here that a literature review on the issue of
Daylight and Performance/Productivity has recently been prepared for
20
Samuels, R. (1999), Light, Mood and Performance at School: Final Report
Pilkington (Samuels, 19989), where an overall, wide-spread definite
improvement with daylight enhancement was noted. Also noted was the
endemic difficulty of separating out the non-light motivational and experiential
complexities involved. The review concluded that whether the beneficial effects
can unequivocally be attributed to daylight per se or not, they are real, and there
is only advantage to be gained by adding daylight to the workplace. Workers
react positively to daylight both psychologically and biologically, but also seem
to interpret the interest shown by management as caring, and so respond
positively in any event.
Of special note are studies on supermarket chains. A fortuituous Wal-Mart
example is of interest. An atrium and central skylights provided daylight to the
building in question. Fortunately for our understanding of the daylight-
productivity factor, the decision by the company to install only half of the
skylights – as a cost-cutting measure – inadvertently revealed an impact on
productivity which has a high likelihood of being due to daylighting directly.
Sales per square foot were significantly higher for those departments located in
the daylit half of the store compared to those without the skylights. Sales were
also higher here than in the same departments in the company’s other stores
(Romm and Browning, 1994).
A further and most convincing recent study of daylight-workplace productivity
was carried out in 108 stores of a large supermarket chain, which indicated
about 40% enhanced sales where skylights had been installed compared to
almost architecturally and product identical stores without skylights. This
research was by the Heschong Mahone Group, for the California Board of
Energy Efficiency, as reported in the Sacremento Bee, June 28th 1999.
To conclude, it is appropriate to cite the findings of the Heschong study of
natural daylight and performance in school children. 21,000 elementary
students made up the huge sample. A comparison in over 2000 classrooms in
8 SAD = Seasonal Affective Disorder; SBS = Sick Building Syndromes 9 commercial-in-confidence
21
Samuels, R. (1999), Light, Mood and Performance at School: Final Report
three school districts (with different dependent variables) showed students
either ‘progressed faster’ on standardised tests as amount of daylight increased,
or did better (higher absolute test scores). These improvements averaged out at
around 20-25% in reading and 15-20% in mathematics.
The lead researcher, Lisa Heschong is cited as saying: “daylight affects us
biochemically in ways that alter alertness”. And Steve Selkowitz, renown head
of the building technologies department of the Environment Energy
Technologies Division at the Lawrence Berkeley Laboratory in California said:
“while the energy conserved by daylighting makes a big difference nationwide,
that’s not as exciting…as its effects on the people inside (buildings)”. Coming
from him, this endorsement is extremely salient.
4 METHODOLOGY
4.1 Two Field Research Empirical Approaches
The empirical research model applied here developed over the several years of
the Seven Hills West school investigation. Eventually, two methodological
approaches were tested in the field conditions, with different teacher/student
respondents: the Before/After study in 1998 (n=312) and the
Control/Experimental study in 1999 (n=328). In both, teachers evaluated
student mood states, attentiveness and overt behaviour via the scale specifically
developed for the purpose. In both approaches an experimental intervention was
involved ie 8 classrooms were fitted with full spectrum lighting, the only
variable intentionally altered. The 4 Control rooms had standard departmental
issue cool-white fluorescent lamps fitted ie new lamps, since fluorescents
degrade over time (to compare like with like). The Control and experimental
rooms were the same in both phases.
It was crucially important that teachers should not be aware of the particular
lighting conditions in their classroom (students were oblivious to the
experimental conditions). Yet, given the conflicting ethical and procedural
necessity to inform them, to some degree, of the nature of the research in which
22
Samuels, R. (1999), Light, Mood and Performance at School: Final Report
they were essential participants, some mention was made of a hypothetical
relationship between light and well-being at briefings during the ‘pilot’ phase
and Phase#1 (as previously reported). In order to overcome these conflicting
requirements it was eventually decided to mention the installation of a range of
different lighting types in different classrooms but not how many different
types would be involved nor which room would be equipped with which type.
At these briefings there was some measure of skepticism expressed by some
teachers, and also some discussion aimed at debunking notions that ‘more
intelligent’ classes would automatically score better (the PBAS is not aimed at
measuring intelligence but mood and comportment, and light, theoretically,
should impact on old and young, female and male, geniuses and idiots alike).
Phase#1 (1998) methodology involved a Before assessment (all classrooms
with standard lighting) and an After assessment (after the 8 experimental
classrooms were fitted with FSL, and the 4 Control rooms with new cool-white
lamps). Students and teachers were assigned to particular classrooms according
to the Principal’s normal requirements, and irrespective of the research being
carried out. The four Control rooms were randomly selected, in the sense that
they were the ones which were found, during the re-lamping period over Easter
in 1998, to have old light fittings which could not accommodate the slimmer
full spectrum lamps. The experimental rooms were selected by virtue of the fact
that they had suffered water damage to their ceilings and were being
refurbished in any event by the Department of Education. Indeed, this was the
rationale for the selection of the particular school for this field experimental
research in the first place. In other words, the selection of school, rooms,
teachers and students was without reference to any research agenda, and can be
considered random. In both phases only the teachers knew the identities of the
students themselves (a coding system was employed).
It later became apparent, however, that this difficult initial research situation,
which inevitably involved raising teacher consciousness, could be readily
overcome if a second study was carried out the following year, in the already
23
Samuels, R. (1999), Light, Mood and Performance at School: Final Report
equipped classrooms, without mention to anyone other than the Principal. The
advantage of this approach was discussed with the Departments and the
Principal and deemed to warrant pursuing, in the full expectation that teachers
would be satisfied with the rationale for such a strategy once de-briefed at the
conclusion of the research.
This constituted the Phase#2 methodology, where teachers in the 12 classrooms
were asked to assess their students only once, some 5 months after exposure to
the different lighting conditions, having been unaware of the continuing
research situation until that time. This latter condition is believed to have
contributed to the exceptionally significant findings of Phase#2 - since the
likelihood that ‘Hawthorne’ or uncontrollable motivational factors (positive or
negative) might influence the course of the research was substantially reduced.
Teachers and students would have experienced the situation - unselfconsciously
- and only after the fact would it be evaluated as a research setting. This now
resembles a classic post-occupancy evaluation model, where an experimental
intervention and it’s potentially huge impact is not present.
Again, the teachers and students in Phase#2 were assigned to classrooms
according to the Principal’s agenda, irrespective of any research conditions –
and were thus randomly distributed. Those who happened to be assigned to the
rooms which had the full spectrum lamps installed (the previous year) became
the experimental group (n = 219); and even the researcher was unaware of the
nature of this distribution until receipt of the completed assessment schedules at
the conclusion of the research. In the event, a full range of classes were
evaluated: one kindergarten class, two year-1s, two year-2s, two year-3s, two
year-4s and three year-5/6s. Precisely which teachers were involved in Phase#2
is still unknown at the time of writing.
Given the magnitude of the significance emerging from the analysis, scientific
skepticism is necessary, despite the multitude of tests applied to the data which
suggest that this is unwarranted. The only possible way that the data could have
been consciously manipulated by the assessors (and it is surely an affront to
24
Samuels, R. (1999), Light, Mood and Performance at School: Final Report
their integrity to even suggest such a possibility) is that they knew which lights
were in which rooms, correctly determined the difference in their spectral
parameters, comprehended the theoretical implications of the photon-neuron
response, and had the common intention to skew their responses. It is true that
the full spectrum lights are somewhat bluer than the standard cool-white issue.
Besides the fact that there are windows on both sides of every classroom
allowing diffusing daylight to enter, the plastic diffusers have been left in place
as usual, and the rooms themselves are a plethora of colours. Even if some of
the same teachers were involved in both phases ie been briefed in 1998 that a
range of lighting would be installed, they could not possibly know that the
‘range’ of lighting types mentioned was actually only two, nor where in that
continuum their particular lights would be. The likelihood that teachers would
consciously, consistently and intentionally rate low or high is too improbable to
even contemplate.
As a final verification, raw responses were manually allocated into three piles
representing low, medium and high ratings for both control and experimental
groups. There was an almost equal distribution of ratings into the three piles for
the 8 experimental groups, which indicates that these teachers did not bias their
evaluations towards the low end of the scale. There was, however, a skewed
response in the controls, with obviously more high (negative) and less low
(positives) ratings.
4.2 The Psycho-Biological Assessment Scale (PBAS) Development
Other than altering the light source, there was one other absolute requirement
for this research: a teacher rating scale by which individual students might be
assessed. Given the constraints and sensitivities involved in introducing an
experimental factor into the normal teaching day, a scale (the PBAS) eventually
emerged which could be quickly (and reliably10) completed, since each teacher
needed to evaluate between 30 and 35 pupils.
10 The high statistical reliability of the scale (alpha = .97) was determined twice, once in each
phase.
25
Samuels, R. (1999), Light, Mood and Performance at School: Final Report
Although standardised child behaviour and ‘state-of-mind’ tests exist, such as
the Conners and the Devereux scales, they have to be purchased, with a charge
for each child tested; and are not necessarily designed to be rapidly completed.
Given the purpose of the current research, some elements of these scales were
deemed appropriate to incorporate in a new composite scale, eg: measures of
attentiveness, aggression, fear, self-esteem and lethargy, inter alia. Yet other
scales also contain salient elements, eg: the Pre-Adolescent Mood Scales used
by Wohlfarth, the Kuller/Lindsten scale, and the SADS scale developed during
the Westpac study (see: 3.0 FSL Precedents).
It also became evident that many of the items used to assess children in the
Conners and Devereux scales were essentially similar, frequently with only the
precise wording differing. This allowed the PBAS to be based on a fundamental
integration using wording from both. Each item was re-defined using keywords
and synonyms, in order to clarify it’s meaning; for instance: Aggressive/angry
(fights, argues, threatens, bossy).
Ultimately, five rating scales coalesced into one, viz: the Conners Abbreviated
Teachers Rating Scale; Devereux Scales of Mental Disorder (DSMD); Pre-
Adolescent Mood Scales (PAMS); Behavioural Observations Scale; and the
Seasonal Affective Disorder Scale (SADS) (see also Appendix 2: PBAS
Dimensions and Sources).
The integrated schedule incorporates a five-point rating scale (a la Devereux)
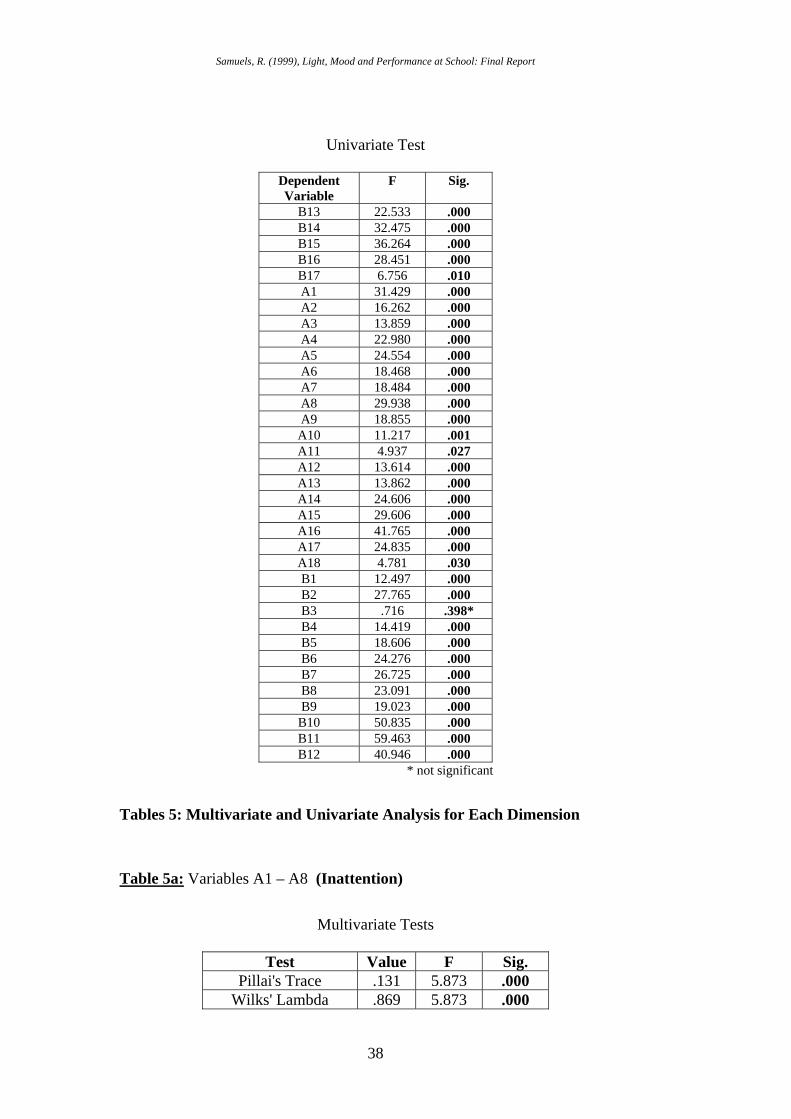
and the 35 ‘items’ (such as distraction, or over-reaction…) are grouped into five
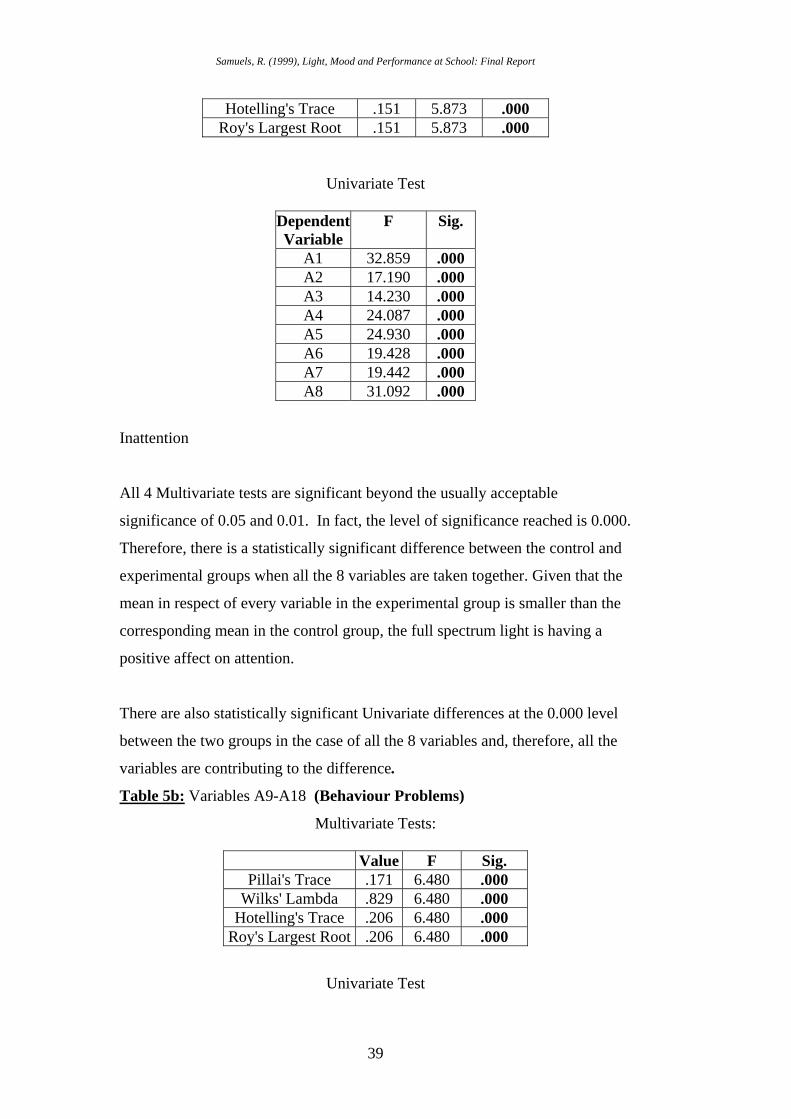
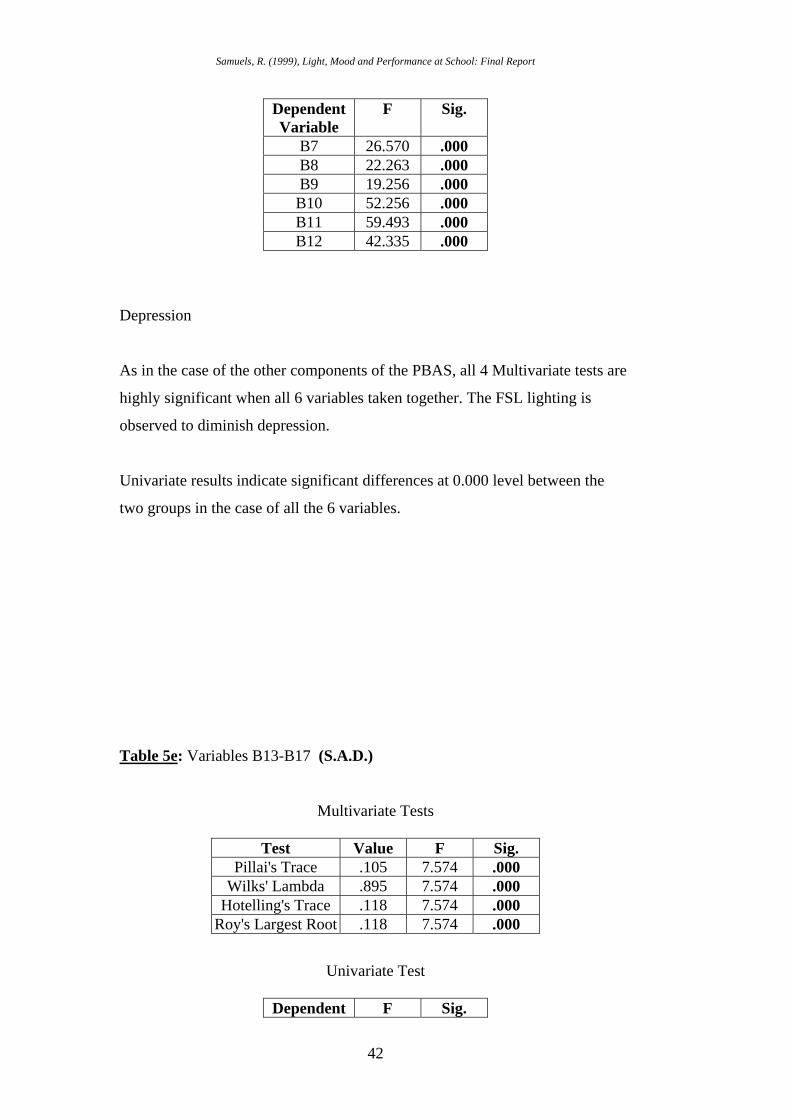
dimensions: Inattention, Anxiety, Depression, S.A.D. and Behaviour problems,
which are themselves grouped into the Devereux generic categories called the
Externalised and Internalised Components.
The issue of the independence of assessors is always problematic. Where
teachers assess students there is inevitably an element of subjectivity (as in all
psychological tests, whether assessed or self-reported). To attempt to average-
out this subjectivity factor a relatively large number of respondents (more than
26
Samuels, R. (1999), Light, Mood and Performance at School: Final Report
300 students) were assessed by 12 teachers. “The qualification of a rater is
sufficient exposure to a child over the past 4 weeks in order to accurately rate
individual behaviour according to the items” (Devereux Manual). Teachers, by
definition, have this qualification.
Teachers were requested to also complete a self-assessment mini-questionnaire,
based on the S.A.D categories employed previously by the researcher,
concerning their sense of well-being, and any experience of headaches or
lethargy ie symptoms possibly related to the light spectrum.
Statistical analysis of the composite PBAS instrument indicated both a very
high reliability and validity ie the items were measuring the characteristics they
purport to measure, and the clusters of items into the 5 dimensions were all
valid. It is considered statistically highly improbable that all items should
cluster neatly into the distinct ‘factors’ hypothetically predetermined in the
assessment instrument. The fact that this has occurred suggests that the tool is
robust and could be used in further research with confidence. The PBAS items
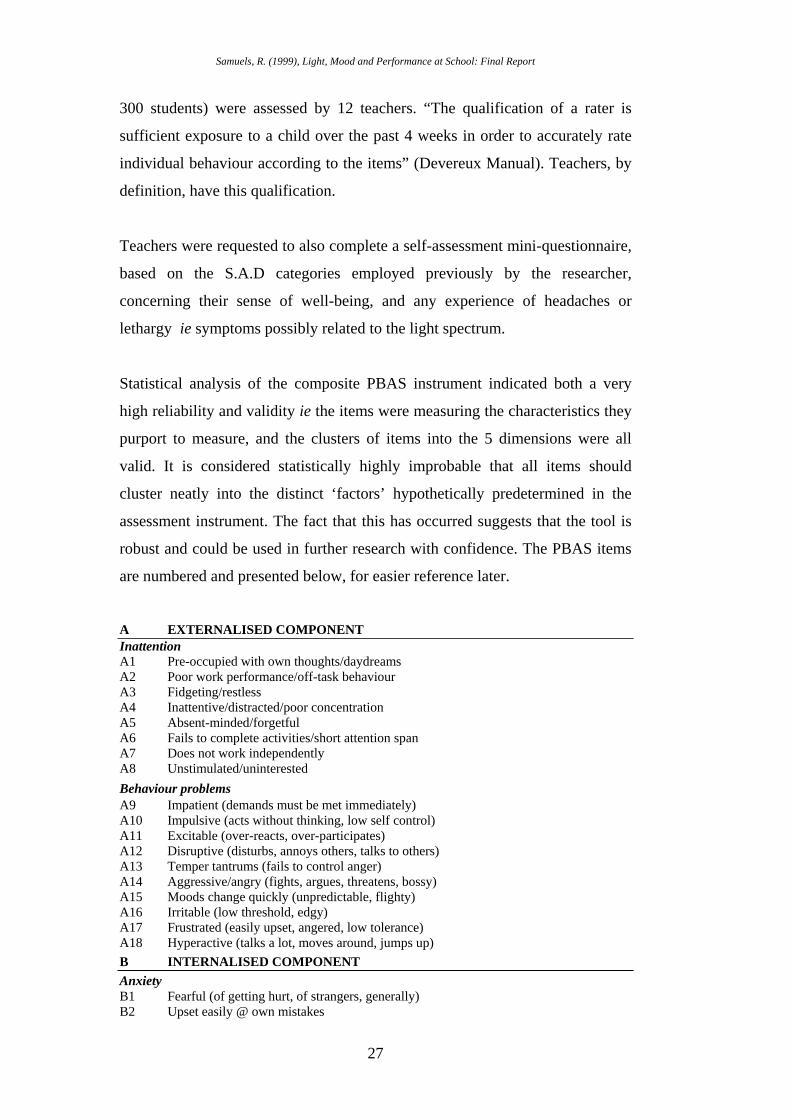
are numbered and presented below, for easier reference later.
A EXTERNALISED COMPONENT Inattention A1 Pre-occupied with own thoughts/daydreams A2 Poor work performance/off-task behaviour A3 Fidgeting/restless A4 Inattentive/distracted/poor concentration A5 Absent-minded/forgetful A6 Fails to complete activities/short attention span A7 Does not work independently A8 Unstimulated/uninterested Behaviour problems A9 Impatient (demands must be met immediately) A10 Impulsive (acts without thinking, low self control) A11 Excitable (over-reacts, over-participates) A12 Disruptive (disturbs, annoys others, talks to others) A13 Temper tantrums (fails to control anger) A14 Aggressive/angry (fights, argues, threatens, bossy) A15 Moods change quickly (unpredictable, flighty) A16 Irritable (low threshold, edgy) A17 Frustrated (easily upset, angered, low tolerance) A18 Hyperactive (talks a lot, moves around, jumps up) B INTERNALISED COMPONENT Anxiety B1 Fearful (of getting hurt, of strangers, generally) B2 Upset easily @ own mistakes
27
Samuels, R. (1999), Light, Mood and Performance at School: Final Report
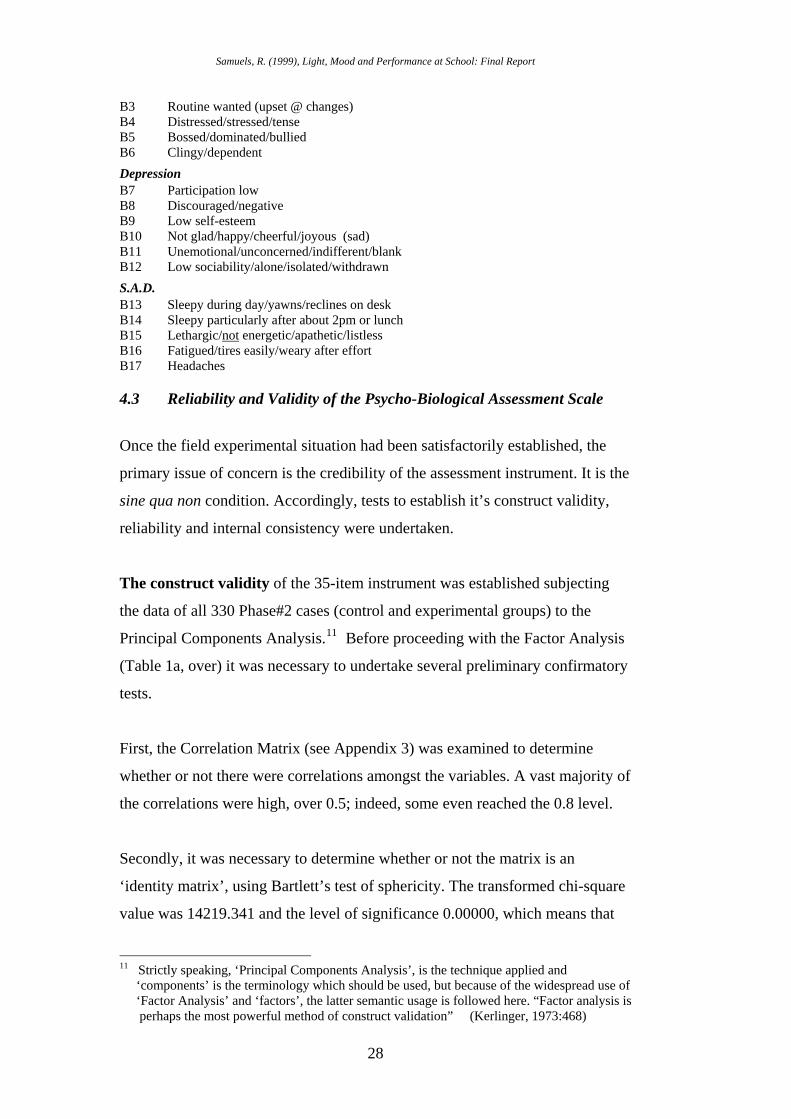
B3 Routine wanted (upset @ changes) B4 Distressed/stressed/tense B5 Bossed/dominated/bullied B6 Clingy/dependent Depression B7 Participation low B8 Discouraged/negative B9 Low self-esteem B10 Not glad/happy/cheerful/joyous (sad) B11 Unemotional/unconcerned/indifferent/blank B12 Low sociability/alone/isolated/withdrawn S.A.D. B13 Sleepy during day/yawns/reclines on desk B14 Sleepy particularly after about 2pm or lunch B15 Lethargic/not energetic/apathetic/listless B16 Fatigued/tires easily/weary after effort B17 Headaches
4.3 Reliability and Validity of the Psycho-Biological Assessment Scale
Once the field experimental situation had been satisfactorily established, the
primary issue of concern is the credibility of the assessment instrument. It is the
sine qua non condition. Accordingly, tests to establish it’s construct validity,
reliability and internal consistency were undertaken.
The construct validity of the 35-item instrument was established subjecting
the data of all 330 Phase#2 cases (control and experimental groups) to the
Principal Components Analysis.11 Before proceeding with the Factor Analysis
(Table 1a, over) it was necessary to undertake several preliminary confirmatory
tests.
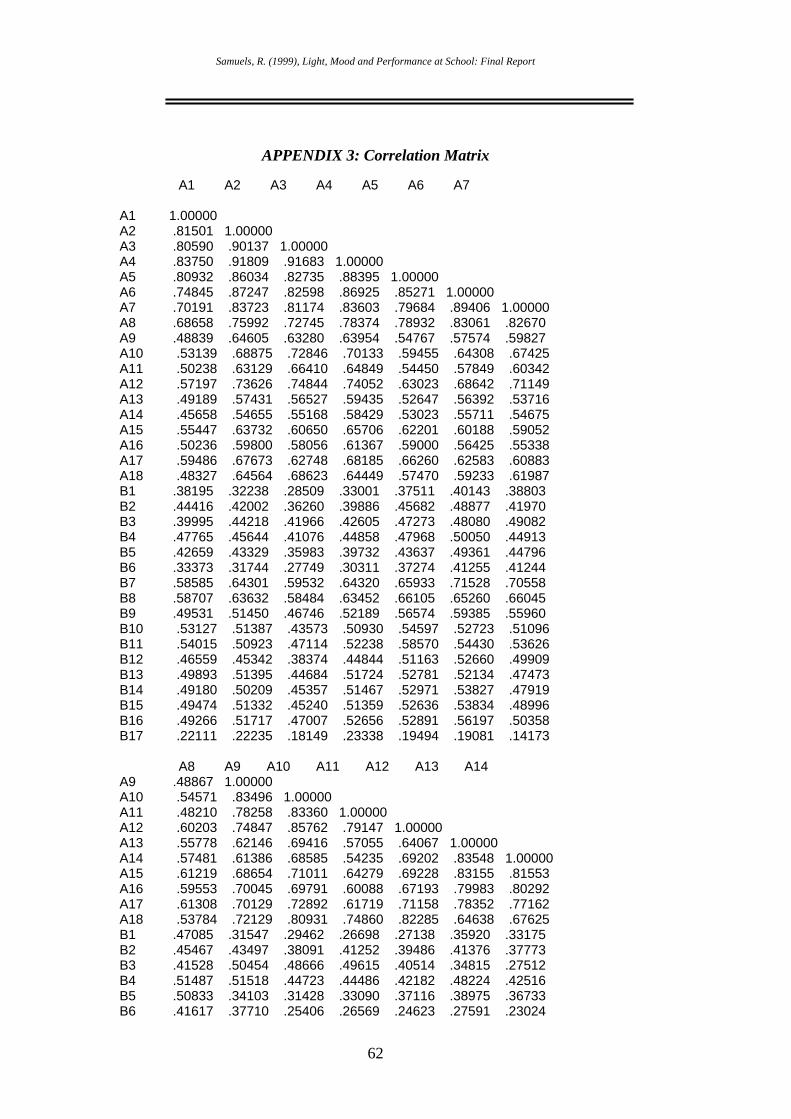
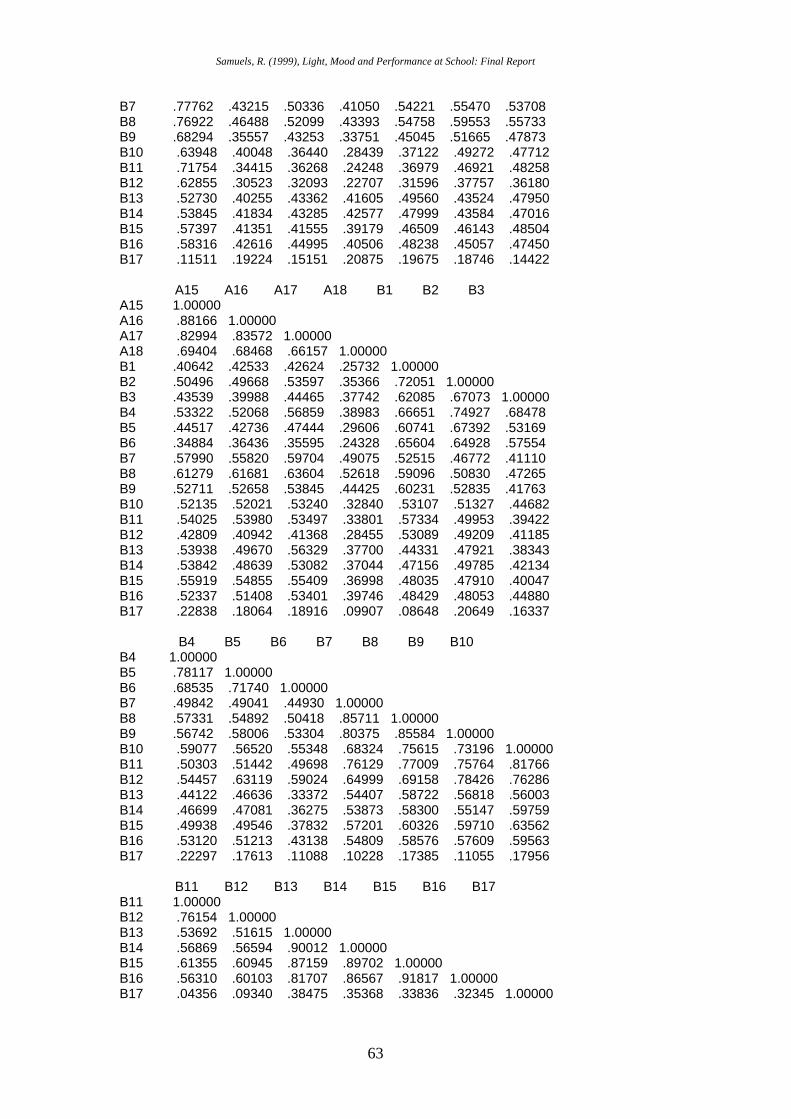
First, the Correlation Matrix (see Appendix 3) was examined to determine
whether or not there were correlations amongst the variables. A vast majority of
the correlations were high, over 0.5; indeed, some even reached the 0.8 level.
Secondly, it was necessary to determine whether or not the matrix is an
‘identity matrix’, using Bartlett’s test of sphericity. The transformed chi-square
value was 14219.341 and the level of significance 0.00000, which means that
11 Strictly speaking, ‘Principal Components Analysis’, is the technique applied and ‘components’ is the terminology which should be used, but because of the widespread use of ‘Factor Analysis’ and ‘factors’, the latter semantic usage is followed here. “Factor analysis is perhaps the most powerful method of construct validation” (Kerlinger, 1973:468)
28
Samuels, R. (1999), Light, Mood and Performance at School: Final Report
the matrix is not an identity matrix and, thus, clean and interpretable factors are
likely to emerge.12 The level of significance indicates that if the research were
replicated there would only be a 1 in 100,000 chance that the result could be
due to chance or sampling error.
Finally, the Kaiser-Meyer-Olkin (KMO) measure of sampling adequacy was
shown to be 0.95767. The maximum value of this measure is 1.13
Consequently, Factor Analysis (Principal Component) was performed on the
data.
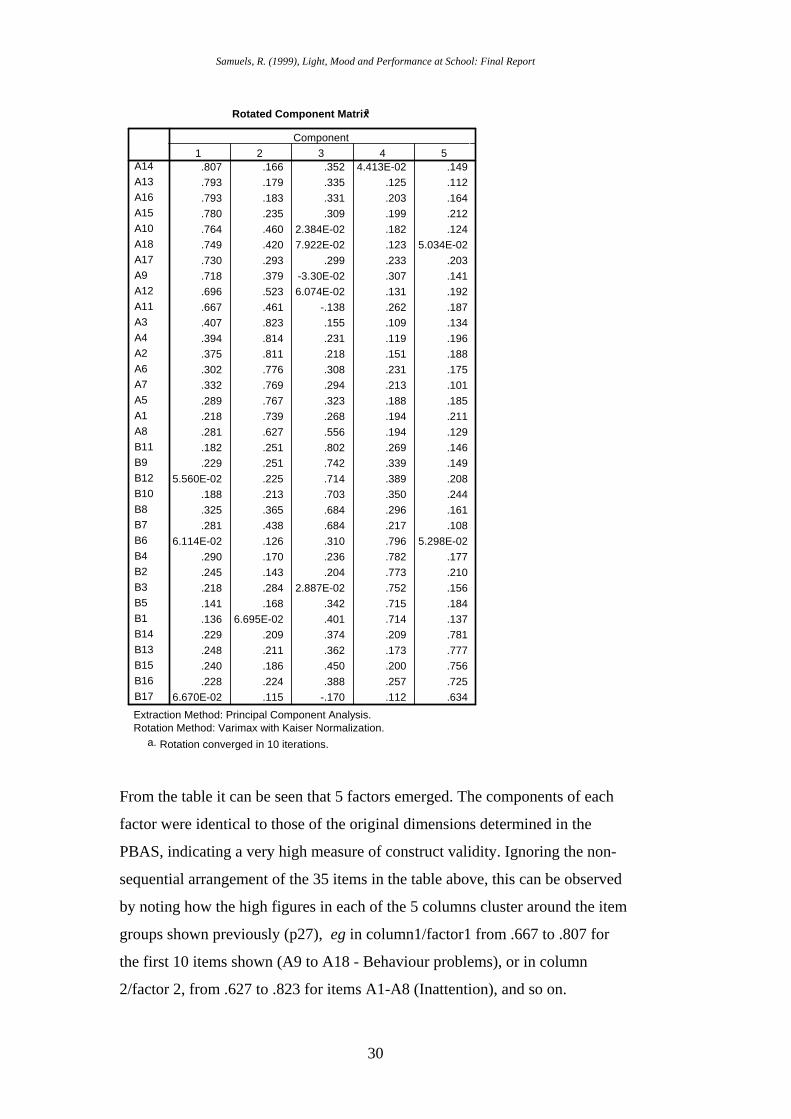
Table 1a: Factor Analysis: Orthogonal Rotation
12 If the diagonal values are 1 and off-diagonal values are 0, the correlation matrix is an identity matrix 13 Kaiser (1974) states that measures above 0.90 are meritorious and those below 0.50 are unacceptable
29
Samuels, R. (1999), Light, Mood and Performance at School: Final Report
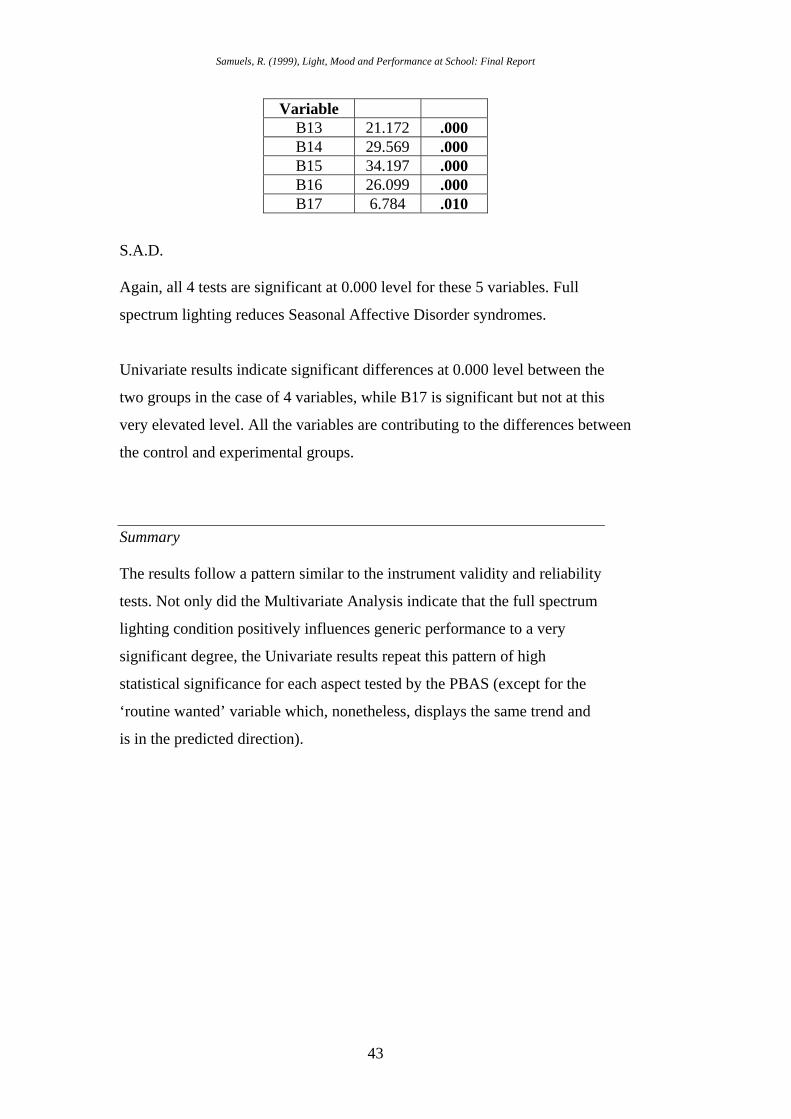
Univariate results indicate significant differences at 0.000 level between the
two groups in the case of 4 variables, while B17 is significant but not at this
very elevated level. All the variables are contributing to the differences between
the control and experimental groups.
Summary The results follow a pattern similar to the instrument validity and reliability
tests. Not only did the Multivariate Analysis indicate that the full spectrum
lighting condition positively influences generic performance to a very
significant degree, the Univariate results repeat this pattern of high
statistical significance for each aspect tested by the PBAS (except for the
‘routine wanted’ variable which, nonetheless, displays the same trend and
is in the predicted direction).
43
Samuels, R. (1999), Light, Mood and Performance at School: Final Report
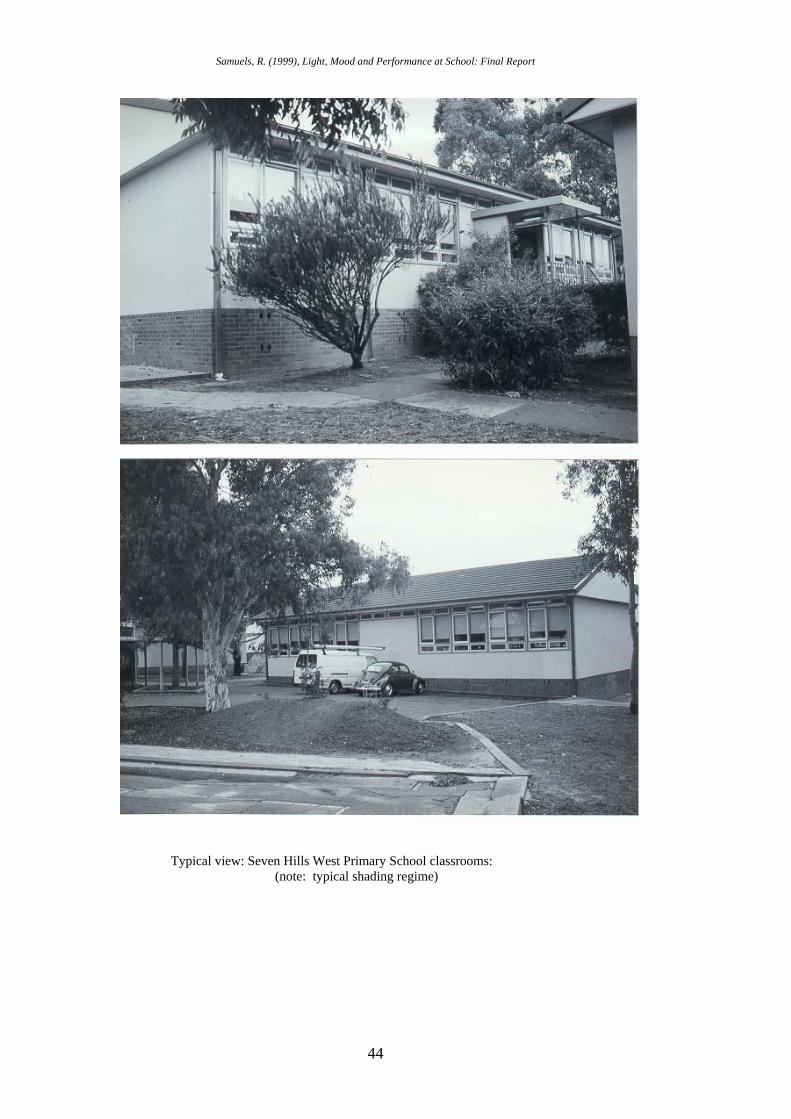
Typical view: Seven Hills West Primary School classrooms:
(note: typical shading regime)
44
Samuels, R. (1999), Light, Mood and Performance at School: Final Report
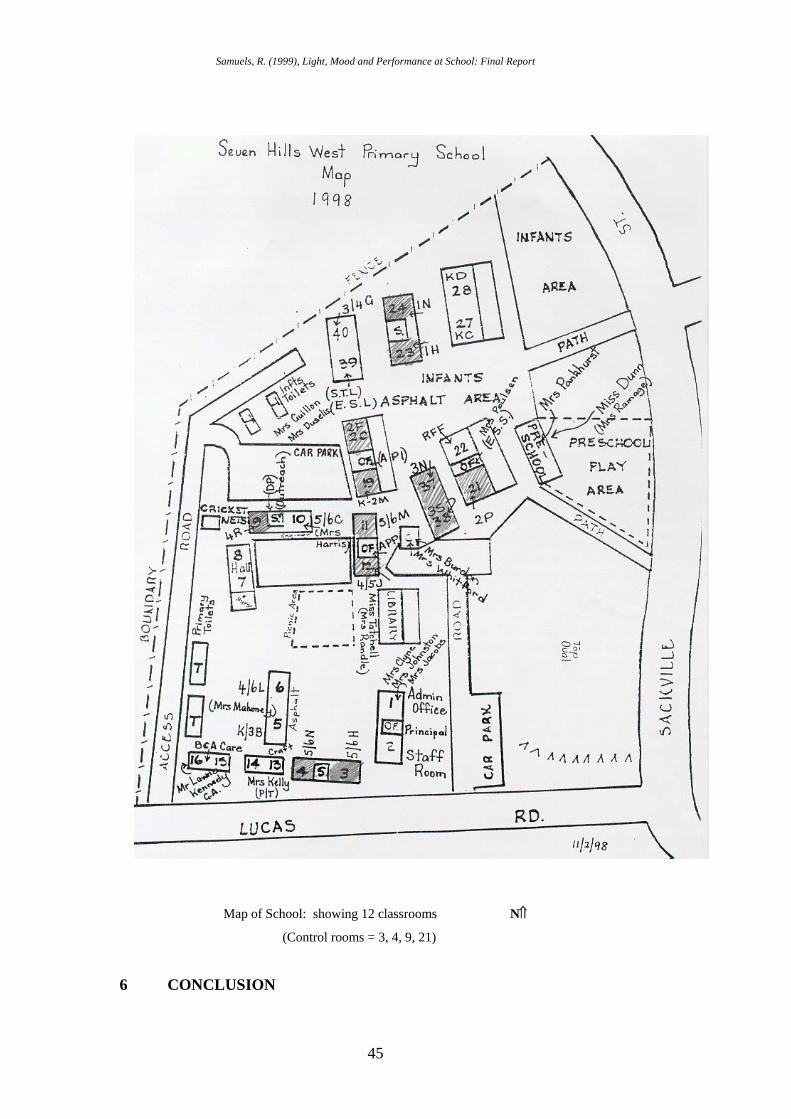
Map of School: showing 12 classrooms N⇑
(Control rooms = 3, 4, 9, 21)
6 CONCLUSION
45
Samuels, R. (1999), Light, Mood and Performance at School: Final Report
The research reported here is the culmination of a decade of investigation,
sparked by an initial interest in an apparatus called a Lumitron which is able to
assess ‘visual field colour deficiencies’ in people (Downing, 1988 and 1996,
Liberman, 1985). A deeper theoretical investigation into light and well-being
followed, unearthing research in photo-biology from its origins more than 30
years ago (Wurtman, Hollwich, Ott, Birren, Boyce, Neer, Lewy and Wohlfarth,
inter alia, in the 70s and 80s, crystallising in a special publication by the New
York Academy of Sciences in 1985). In 1992 the theory was put to test in
Australian conditions, by the researcher, in an office building in Sydney, with
encouraging results relating to diminished headaches and lethargy in the full
spectrum conditions. A theoretical report on Colour and Light in Schools was
later commissioned by the DPWS (Samuels and Stephens, 1996), which formed
the basis for the Seven Hills West research reported here. Recently, the vital
arena of research in schools seems to be centred in North America, with
Hathaway’s 1995 development of Wohlfarth’s earlier work in Canada, and
Leschong’s 1999 work on daylight in American schools.
The essential central ingredient of all this research concerns the photon-neuron
interaction, and its translation into practical applications in the built
environment – in the form of daylighting and artificial lighting in buildings – is
the ultimate objective.
Also implicated is the issue of energy efficiency. Although enhancing natural
daylighting has obvious energy consequences, the question of the extent to
which this interior daylight replicates natural full spectrum light has not been
addressed. As far as artificial lighting is concerned, it is inadequate to simply
cite the relatively lower efficiencies of full spectrum or daylight-simulating
fluorescent lighting without a deeper appreciation of the importance of the
quality of light spectra on human functioning. Energy management strategies,
in any event, can compensate here (see Recommendations).
The research reported here has integrated salient elements of the theoretical and
empirical work conducted ‘overseas’ over many years; extracted
(hypothetically) key elements from standardised child-personality assessment
46
Samuels, R. (1999), Light, Mood and Performance at School: Final Report
scales not previously used in FSL research, and integrated them with elements
from scales which have been used to assess school children in such conditions
(such as the PAMS). This resulted in a unique 35 item evaluation instrument –
here shown to be reliable and valid and, given the high levels of significance
which have emerged, apparently an appropriate method to measure whether
light spectra influence generic performance - manifested as inattention,
lethargy, self-esteem and so on. The rationale for testing in ‘sunny’ Australian
conditions rests on the fact that northern hemisphere countries have longer,
colder winters, thus more indoor-oriented lifestyles and lower daylight
exposure - with a greater incidence of light deprivation syndromes to be
expected.
Positive affects of exposure to full spectrum light emerging from overseas
studies which relate to dental caries, catarrhal infections, secretions of cortisol,
hyperactivity, visual acuity and academic performance, inter alia, have not yet
been replicated in Australian conditions.
In the research reported here, much attention has been given to the generation
of a field experimental condition that most closely represents the natural state
of affairs, in full recognition of the disruptive influence interventions have, and
the confounding consequences for the interpretation of research results. A
minimalist approach has been adopted, viz: consciously altering only one
variable, and trusting that the multitude of other variables possibly playing a
role would naturally ‘average-out’ across the sample. Thus, socio-economic,
ethnic and family dynamics, personal proclivities and states of health, and so
on, are not considered as part of the equation but left as background, neutral in
the sense that they are taken as given. Notwithstanding, the Phase#1 research
was beset by difficulties which proved unavoidable and, indeed, the Interim
Report (which should be read in conjunction with this Final report) contains
several pages of constraints which might have influenced the findings. Despite
these misgivings, definite trends did emerge, in the theoretically expected
direction, but amid some confusion. Serendipitously, however, the Phase#2
research was able to proceed unobtrusively, without any intervention in the
47
Samuels, R. (1999), Light, Mood and Performance at School: Final Report
routine conditions prevalent at the school. This undreamed of opportunity thus
converted the research from a field interventionist to a post occupancy
evaluation, where user experience continues undisturbed in the natural
conditions.
The happy co-incidence of a robust assessment instrument and an undisturbed
setting seems to have paid off, with definitive and lucid findings verifying the
positive influence of full spectrum light on ‘the human condition’. Virtually
every category of generic performance investigated here appears to have been
strongly influenced.
Nevertheless, a healthy dose of skepticism is definitely required, albeit such a
clear result has emerged (indeed, because of it). We are still in the realm of
hypothesis, since this is the first time this particular strategy has been applied;
and it is surely prudent to repeat the study in some form or other, to validate the
findings. But, simultaneously, there is nothing to lose in beginning to apply the
insights to school conditions (see Further Research); no disbenefits have ever
emerged, and recent research which claims to find no affects is here considered
spurious (discussed earlier). The Seven Hills West results only confirm, albeit
dramatically, the trends displayed in many decades of prior research.
It now seems reasonable to conclude that light and human functioning are
intimately related; and that this is an intrinsic interaction of profound
significance to environmental design. Hence, the more daylight and daylight-
simulating artificial lighting which can be provided the better attentiveness,
mood, satisfaction, behaviour and health are likely to be. Why then should full
spectrum lighting not be installed in schools, hospitals, offices and universities,
or prisons?
Ultimately the light-performance insight becomes an issue of ensuring full
spectrum daylight penetration inside buildings, and/or its provision artificially -
particularly since exponentially accelerating urbanisation means more people
spend more time indoors than ever before. Re-lamping schools with full
48
Samuels, R. (1999), Light, Mood and Performance at School: Final Report
spectrum lighting will involve an added cost; yet, not only would economies of
scale be expected, but any added expense could only be minor in comparison to
the potential benefits which would accrue. Life is adapted to light.
6.1 Recommendations, and Further Research
If conditions permit intervention at the drawing board stage, luminaires could
be hung lower, and be equipped with reflectors, to ensure that 400 to 500 lux of
full spectrum light falls at desk height. This might also allow for the removal of
a lamp from time to time, thus enhancing efficiency.
If it were possible to equip an entire primary school with full spectrum lighting,
it could be compared to others with standard issue lighting, to establish to what
degree the dominating findings from the Seven Hills West research are
repeated. In high school conditions, where students do not have one class
teacher, perhaps they could be assessed on different criteria, such as
standardised academic performance tests. Further developments could include
the painting of some classrooms blue or, indeed, an entire school; and the
influence of enhanced UVA radiation could be evaluated by the simple strategy
of ensuring that luminaires can be fitted with egg-crate diffusers, which block
less UV emission.
Notwithstanding the further development and testing of the research reported
here, it is recommended that the Department of Education and Training and the
Department of Public Works and Service give serious consideration to the
installation of full spectrum lighting in the buildings for which they are
responsible.
49
Samuels, R. (1999), Light, Mood and Performance at School: Final Report
BIBLIOGRAPHY Altman, D.H. (1977), Errors of the Standard Photometric System when Measuring the Brightness of General Illumination Light Sources, J. of the Illuminating Engineering Society 7, 1: 55-62. ASHRAE Fundamentals, (1989), Fenestration, Chapter 27. Aston. S.M. and Bellchambers, H.E. (1969), Illumination, Colour Rendering and Visual Clarity, Lighting Research and Technology, 1, 4: 259-261. Barnaby, J.F. (1980), Lighting for Productivity Gains, Lighting Design and Application, 10, 2:20-28. Baron, R.A., Rea, M.S. and Daniels, S.G. (1992), Effects of Indoor Lighting (illuminance and spectral distribution) on the Performance of Cognitive Tasks and Interpersonal Behaviours: The potential mediating role of positive affect, Motivation and Emotion, 16: 215-225. Bellchambers, H.E. and Godby, A.C. (1972), Illumination, Colour Rendering and Visual Clarity, Lighting Research and Technology, 4:104-6. Bennett, C.A., Chitlangia, A. and Pangrekar, A. (1977), Illumination Levels and Performance of Practical Visual Tasks, Human Factors Society, 21st Annual Meeting, San Francisco. Berman, S.M. (1992), Energy Efficiency Consequences of Scotopic Sensitivity, Journal of the Illuminating Engineering Society, 21: 3-14. Berman, S.M., Fein, G., Jewett, D.L. and Ashford, F. (1993), Luminance-controlled Pupil Size Affects Landolt-C Task Performance, Journal of the Illuminating Engineering Society, 22:150-165. Berman, S.M., Fein, G., Jewett, D.L. and Ashford, F. (1994), Landolt-C Recognition in Elderly Subjects is Affected by Scotopic Intensity of Surround Illuminants, Journal of the Illuminating Engineering Society, 23:123-130.. Birren, F. (1972a), “Color and Man-Made Environments: The significance of light”, AIA Journal, 15-19, August. Birren, F. (1972b), “Color and Man-Made Environments: Reactions of body and eye”, AIA Journal, 35-39, September. Birren, F. (1972c), “Color and Man-Made Environments: Reactions of mind and emotion”, AIA Journal, 37-40, October. Bitter, C. and van Ierland, J.F. (1967), Appreciation of Sunlight in the Home, Proceedings of CIE Conference, Rotterdam Boyce, P.R. (1972), Age, Illuminance, Visual Performance and Preference, Elec. Council Research Centre Report R412, Capenhurst, UK Boyce, P.R. (1977), Investigations of the Subjective Balance between Illuminance and Lamp Colour Properties, Lighting Research and Technology, 9:11-24.
50
Samuels, R. (1999), Light, Mood and Performance at School: Final Report
Boyce, P.R. (1981), Human Factors in Lighting, Applied Science Publishers, London. Boyce, P.R. and Simons, R.H. (1977), Hue Discrimination and Light Sources, Lighting Research and Technology, 9: 125-36. Brainard, C.G., Lewy, A.J., Menaker, M., Miller, L.S., Fredrickson, R.H., Weleber, R.G., Cassone, V. and Hudson, D. (1988), Dose-Response Relationship between Light Irradiance and the Suppression of Melatonin in Human Volunteers, Brain Research, 454: 212-218. Brainard, C.G., Rosenthal, N.E., Sherry, D., Skwerer, R.G., Waxler, M. and Kelly, D. (1990), Effects of Different Wavelengths in Seasonal Affective Disorder, Journal of Affective Disorders, 20: 209-216. British Standards Institution BS 950 (1967), Artificial Daylight for the Assessment of Colour. Also Amendment 1968. Butler, D.L. and Biner, P.M. (1989), Effects of Settings on Window Preferences and Factors Associated with those Preferences, Environment and Behaviour, Vol. 21, 1: 17-31. Clarke, F.J.J. (1979), Practical Standard Illuminant Representative of Interior Daylight, Proceedings of CIE 19th Session, Kyoto, 73-78. Collins, B.L. (1975), Windows and People: A literature survey, Psychological reactions to environments with and without windows”, NBS Build. Sci. Ser., 70, U.S. Dept. of Commerce, Nat. Bur. of Stands. Collins, B.L. and Worthey, J.A. (1985), Lighting for Meat and Poultry Inspection, Journal of Illuminating Engineering Society, 15: 21-8. Commonwealth Department of Productivity, Physical Working Environment Branch, (1980), “Colour at Work: Planning colour schemes”, AGPS, Canberra. Commonwealth Dept. of Science and Technology, (1981), Artificial Light at Work, Occup. Safety and Health Working Envir., Series 6. Cornu, L. and Harlay, F. (1969), ‘Modifications de la discrimination chromatique en fonction de l’eclairement’, Vision Research, 9, 1273. Cuttle, K. (1983), People and Windows in Workplaces, Proceedings of P.A.P.E.R Conference, Wellington, NZ. Downing, J. (1988), Downing Technique of Neurosensory Development, The Downing Institute, San Francisco, Calif. Erikson, C. and Kuller, R. (1983), Non-visual Effects of Office Lighting, Proceedings of the CIE 20th Session, Amsterdam. Flynn, J.E., Hendrick, C., Spencer, T.J. and Martyniuk, O. (1979), A Guide to Methodology Procedures for Measuring Subjective Impressions in Lighting, Journal of the Illuminating Engineering Society, Vol 8: 95-110.
51
Samuels, R. (1999), Light, Mood and Performance at School: Final Report
Flynn, J.E., Spencer, T.J., Martyniuk, O. and Hendrick, C. (1973), Interim Study of Procedures for Investigating the Effect of Light on Impression and Behaviour, Journal of the Illuminating Engineering Society, Vol 3, 2: 87-94. Flynn, J.E. (1977), A Study of Subjective Responses to Low Energy and Nonuniform Lighting Systems, Lighting Design and Application, 7:6-15. General Electric Co (1953), See Better-Work Better Bulletin No.1, Lamp Division, Cleveland. Germer, J. (1985), A Revolution in Glazing, Solar Age, Vol. 10, Aug. Gofford, R., Hine, D.W. and Veitch, J.A. (in press), Meta-Analysis for Environment-Behavor Research, Illuminated with a study of Lighting Levels Effects on Office Task Performance, in: G.T. Moore and R.W. Marans (eds), Advances in Environment, Behavior and Design (Vol. 4), Plenum, NY. Greiter, F. et al. (1979), The Influence of Artificial and Natural Sunlight upon Various Psychological and Physical Parameters of the Human Organism”, Annual Meeting Am. Soc. Photobiology, June 1979. Hartleb Puleo, S.B. and Leslie, R.P. (1991), Some Effects of the Sequential Experience of Windows on Human Response, Journal of Illuminating Engineering Society, 20: 91-9. Hathaway, W.E. (1995), Effects of School Lighting on Physical Development and School Performance, The Journal of Educational Research, Vol88, No.4, March/April. Heerwagemn, J.H. and Heerwagen, D.R. (1986), Lighting and Psychological Comfort, Lighting Design and Application, 16, 4: 47-51. Hollwich, F. and Dieckhues, B. (1968), Eosinopenie-reaktion und sehvermogen, Klin. Mbl. Augenheilk, 152, 11.
Hollwich, F. and Dieckhues, B. (1980), The Effect of Natural and Artificial Light via the Eye on the Hormonal and Metabolic Balance of Animals and Man, Ophthalmologia 180, 188-197. Hopkinson, R.G. (1964), Hospital Lighting, Heinemann, London. Hopkinson, R.G. (1967), The Psychophysics of Sunlighting, Proceedings of CIE Conference, Rotterdam. Hughes, P.C, and McNellis, J.F. (1978), Lighting, Productivity and the Work Environment, Lighting and Design Application, 8, 12:32-40. Hughes, P.C. (1980), The Use of Light and Color in Health, in: A.C. Hastings, J. Fadiman and J.S. Gordon (eds), Health For the Whole Person: Thew complete guide to holistic medicine, Westview Press, Boulder, Col. Hughes, P.C. (1983), An Examination of the Beneficial Action of Natural Light on the Psychobiological System of Man”, Proceedings of CIE 20th Session, Amsterdam. Illuminating Engineering Research Institute (IERI) (1975), Annual Report, IERI, NY.
52
Samuels, R. (1999), Light, Mood and Performance at School: Final Report
Johnson, T.E. (1984), Cool Windows, Solar Age, Vol. 9, July. Joint Committee on Lighting and Vision (1965), Spectral Requirements of Light Sources for Clinical Purposes, MRC Memorandum 43, HMSO, London Jones, D.M. and Smith, A.P. (eds)(1992), Handbook of Human Performance, Volume 1: The Physical Environment, Academic Press, London. Kaiser, H.F. (1974), An Index of Factorial Simplicity, Psychometrica, 39:36. Kaplan, R. and Kaplan, S. (1989), The Experience of Nature: A psychological perspective, Cambridge University press, CA. Katzev, R. (1992), The Impact of Energy-Efficient Office Lighting Strategies on Employee Satisfaction and Productivity, Environment and Behaviour, 24:759-778. Kerlinger, F.N. (1973: 2nd ed.), Foundations of Behavioral Research, Holt, Rinehart and Winston Inc., New York. Knez, I. (1995), Effects of Indoor Lighting on Mood and Cognition, Journal of Environmental Psychology, 15:39-51. Kok, C.J. and Hengstberger, F. (1991), The Effect of Indoor Environment on the Spectral and Colorimetric Characteristics of Daylight”, Proceedings CIE 22nd Session, Melbourne, 85-86. Kok, C.J., Monard, L.A.G. and Hengstberger, F. (1985), The Radiospectrometry of Actinic Radiation Indoors”, Paper prepared from CIE TC-1.7, Report presented at the 20th CIE Session, Amsterdam (1983). Kripke, D.F., Juarez, S., Cole, R,J. Ancoli-Israel, S., Hauri, P.J. Wisbey, J.A. Klauber, M.R. Mason, W.J. and Gruen, W. (1994), Adult Illumination Exposures and Some Correlations with Symptoms, in: T. Hiroshige, and K. Honma, eds., Evolution of Circadian Clock, Hokkaido University Press, Sapporo: 349-360. Laitner, S. (1995), Energy Efficiency Investments as a Productivity Strategy in the United States; An overview, Economic Research Associates, Alexandria, VA. 4-5 Lewy, A.J., Wehr, T.A., Goodwin, F.K., Newsome, D.A. and Markey, S.P. (1980), Light Suppresses Melatonin Secretion in Humans, Science, 210:1267-9. Liberman, J. (1985), Looking at Colors Widens Visual Field, Brain/Mind Bulletin, August. Lion, J.S., Richardson, E. and Browne, R.C. (1968), A Study of the Performance of Industrial Inspection under Two Levels of Lighting, Ergonomics, 11, 23. Lindsten, C. and Kuller, R. (1987), Health Impact on School Children from Lack of Natural Daylight, cited in R. Kuller,(1987), The Effects of Indoor Lighting on Well-Being and the Annual Rhythm of Hormones, CIE Proceedings 21st Session, Venice. Luckiesh, M and Moss, F.K. (1931), Seeing, The Williams and Wilkins Co, Baltimore. Lynes, T.A,. Burt, W., Jackson, G.K. and Cuttle, C. (1966), The Flow of Light into Buildings, Transactions of the Illuminating Engineering Society, London, 31, 3: 65-91.
53
Samuels, R. (1999), Light, Mood and Performance at School: Final Report
Lynes, J.A. (1973), Colour Discrimination and Heat Rejecting Window Glass, Plymouth Poly, Sch. of Arch Report No10/73, Plymouth, UK Maas, J.B., Jayson, J.K. and Kleiber, D.A., (1974a), Effects of Spectral Differences in Illumination on Fatigue”, J. of Applied Psychology, 59, 524-526. Maas, J.B. et al, (1974b), Quality of Light is Important - not just Quantity, American School and University, 46, 12, 31. Mahnke, F.H. and Mahnke, R.H. (1987), Color and Light in Man-Made Environments, Van Nostrand Reinhold, NY. Marcus, T.A. (1967), The Function of Windows: A reappraisal, Building Sci., 2:97-121. McCormick, E.J. (1970/3rd ed.), Human Factors Engineering, McGraw Hill, NY. Megaw, E.D. (1990), The Definition and Measurement of Visual Fatigue, in: J.R. Wilson and E.N. Corlett (eds), Evaluation of Human Work: A Practical Ergonomics Methodology, Taylor & Francis, London. Megaw, E. (1992), The Visual Environment, in: Jones and Smith, (eds), op cit. Milova, A. (1971), The Influence of Light of Different Spectral Composition on Visual Performance, Proc. CIE 17th Session, Barcelona. Moore, E.O. (1981), A Prison Environments Effects on Health Care Service Demands, Journal of Environmental Systems, 11, 17-34. Ne’eman, E. (1974), Visual Aspects of Sunlight in Buildings, Lighting Research and Technology, 6, 3:159-164. Ne’eman, E., Sweitzer, G and Vine, E. (1984), Office Worker Response to Lighting and Daylighting Issues in Workspace Environments: A pilot survey, Energy and Buildings, 6: 159-171. Ne’eman, E. and Selkowitz, S. (1984a), Windows, Skylights and Atria – Occupants’ Visual/Subjective Comparison, ASHRAE Transactions, Vol 90, Part 2B: 678-684. Ne’eman, E. and Selkowitz, S. (1984b), Technical and Subjective Aspects of Energy Savings in Daylighted Buildings, ASHRAE Winter Meeting, Atlanta, February. Neer, R.M., Davis, T.R., Walcott, A., Koski, S., Schapis, P., Taylor, I., Thorington, L. and Wurtman, R.J. (1971), Stimulation by artificial lighting of calcium absorption in elderly human subjects, Nature: 229. Neer, R.M. (1985), Environmental Light: Effects on Vitamin D synthesis and calcium metabolism in humans, in: R.J. Wurtman et al (op cit), 14-20. Nelson, T.M., Nilsson, T.H. and Johnson, M. (1984), Interaction of Temperature, Illuminance and Apparent Time on Sedentary Work Fatigue, Ergonomics, 27: 89-101.
54
Samuels, R. (1999), Light, Mood and Performance at School: Final Report
Demis, K. (1997), Effects of Lighting on Human Performance in Offices, IAED 501 Graduate Studio – Commentary Bibliography Series (see www#6). Office Administration and Automation (OAA) (1984), Improving the Quality of Light and Work Performance, 38-48, May. Ott, J. (1982), Light, Radiation and You: How to stay healthy, Devin-Adair. Plant, C.G.H. (1970), The Light of Day, Light and Lighting 63,:292-96 Rea, M.S. and Thompson, B.J. (1992/eds), Selected Papers on Architectural Lighting, Lighting Research Centre, Rensselear Polytechnic Institute. Rea, M.S. (ed) (1993), Lighting handbook: Reference and application (8th ed), IES of N.America, NY. Romm, J.J. & Browning, W.D. (1994), Greening the Building and the Bottom Line: Increasing productivity through energy-efficient design, Rocky Mountain Institute, Snowmass, CO. Romm, J. (1994), Lean and Clean Management: How to boost profits and productivity by reducing pollution, Kodansha America, NY. Rosenthal, N.E., Sack, D.A., Gillin, J.C., Lewy, A.J., Goodwin, F.K., Davenport, Y., Mueller, P.S., Newsome, D.A. and Wehr, T.A. (1984), Seasonal Affective Disorder: A description of the syndrome and preliminary findings with light therapy, Arch. Gen. Psychiat. 41:72-80. Rowlands, E., Waters, I., Loe D.L. and Hopkinson, R.G. (1973), Visual Performance in Illumination of Differing Spectral Quality, UCERG Report, University College, London. Samuels, R. (1986), The Role of Personal Control in Household Energy Behaviour, Unpublished MSc thesis, University of Surrey, UK. Samuels (1978), The Psychology of Stress: The Impact of the Urban Environment, Unpublished doctoral thesis, University of Reading, UK. Samuels, R. and Ballinger, J. (1992), Quality and Efficiency in Lighting: Social and environmental responsibility, Research Report for Pacific Power, NSW. Samuels R. (1994), Developments in Environmental Lighting: Energy efficiency and environmental responsibility, psychobiology and social responsibility, The Australian and New Zealand Journal of Person-Environment Studies, No. 45, 21-32. Samuels, R., Stephens, H. and Beckett, R. (1996), Colour and Light in Schools, Research Report for the Department of Public Works and Services, Schools Education Section. Samuels, R. (1997); Literature Review: Light and Performance:- Daylight and Productivity in the Workplace, for Pilkington (Australia)
55
Samuels, R. (1999), Light, Mood and Performance at School: Final Report
Smith, S.W. and Rea, M.S. (1979), Relationships between Office Task Performance and Ratings of Feelings and Task Evaluation under Different Light Sources and Levels, Proc. CIE 19th Session, Kyoto. Speed, N.E. (1979), Decisional Participation and Staff Satisfaction in Middle and Junior High Schools That Individualize Instruction (Doctoral Thesis, University of Wisconsin, Madison). Spuck, D.W. (1971), Item Analysis and Reliability of School Sentiment Index, Technical Report (Mimeograph), University of Wisconsin, Madison. Stenzel, A.G. (1962), Experience with 1000lx in a Leather Factory, Lichtechnik, 14, 16. Stenzel, A.G and Sommer, J. (1969), The Effect of Illumination on Tasks which are Largely Independent of Vision, Lichttechnik, 21, 143. Sundstrom, E. (1986), WorkPlaces, Cambridge University Press, NY. Tennessen, C.M. and Cimprich, B. (1995), Views to Nature: effects on attention, Journal of Environmental Psychology, 77-85. Ulrich, R. (1984), View Through a Window may Influence Recovery from Surgery, Science, 224:420-421. Urwick, L. and Brech, E.F.L. (1965), The Making of Scientific Management, Vol 3: The Hawthorne Investigations, Pitmans, London. USA EPA (1995), Green Lights Program. Wash DC Veitch, J.A, and Newsham, G.R. (1995), Quantifying Lighting Quality Based on Experimental Investigations of End User Performance and Preference, Proceedings of the 3rd European Conference on Energy-Efficient Lighting, Newcastle-upon-Tyne, UK, June . Veitch, J.A. and McColl, S.M. (in press), On the Modulation of Fluorescent Light: Flicker rate and spectral distribution effects on visual performance and visual comfort, National research Council of Canada, Institute for Research in Construction. Verderber, S. and Reuman, D. (1987), Windows, Views, and Health Status in Hospital Therapeutic Environments, The Journal of Architectural and Planning Research, 4:120-133. Vischer, J,C, (1989), Environmental Quality in Offices, Van Nostrand Reinhold, NY. Wells, B.W.P. (1965), Subjective Responses to the Lighting Installation in a Modern Office Building and their Design Implications, Building Sci., 1:57-68. Weston, H.C. (1922), A Study of Efficiency in Fine Linen Weaving, Industrial Fatigue Research Board Report No. 20, HMSO, London Weston, H.C. and Taylor, A.K. (1926), The Relation Between Illumination and Efficiency in Fine Work (Typesetting by Hand), Final Report of the Industrial Fatigue Research Board and the Illumination Research Committee, HMSO, London.
56
Samuels, R. (1999), Light, Mood and Performance at School: Final Report
Weston, H.C. (1938), The Effects of Conditions of Artificial Lighting on the Performance of Worsted Weavers, Medical Research Council (GB), Industrial Health Research Board, Report 81. Weston, H.C. (1945), The Relation Between Illuminance and Visual Performance, Industrial Health Research Board No.87, HMSO, London. Wilkins, A., Nimmo-Smith, I., Slater, A.I. and Bedocs, L. (1989), Fluorescent Lighting, Headaches and Eyestrain, Lighting Research and Technology 21, 1:11-18. Wineman, J.D. (1982), Office Design and Evaluation: An Overview, Environment and Behaviour, 14, 3:271-298. Wolfarth, H. (1984), The Effects of Colour-PsychodynamicEnvironmental Modification on Disciplinary Incidents in Elementary Schools, Int. Journal of BioSoc. Res., 1:44. Wohlfarth, H. (1986), Color and Light Effects on Students Achievement, Behavior and Physiology, Alberta Education, Edmonton, Canada. Wotton, E. (1986), Daylight and Windows in Hospital Wards, Lighting Design and Application, 16, 6:55-58. Wotton, E. and Barkow, B. (1983), An Investigation of the Effects of Windows and Lighting in Offices, Proceedings of the 1983 International Daylighting Conference, Phoenix, Arizona: 405-11. Wurtman, R.J., Baum, M.J. and Potts Jr., J.T. (1985) (eds), The Medical and Biological Effects of Light, Annals of the New York Academy of Sciences, Vol 453, Sept 20, 1-407. Zdepski, M.S. and McCluney, R. (1986) (eds), Proceedings of the International Daylighting Conference, Long Beach, California. World Wide Web: (http://) www#1: ef.org/reports/III/B2.html www#2: vitalight.com/ www#3: Downing, D. (1996/7), ‘Daylight Robbery: The importance of
sunlight to health’ www.ddowning.demon.co.uk/daylight.html www#4: solstice.crest.o…light/html/comfort.html (Lawrence Berkeley
Laboratory document on Daylighting) www#5: est.gov.bc.ca/facilities/publications/enviro_guidelines/sec-five.htm