1 San Antonio Talent Migration Connectivity Profile Introduction: Brain Drain San Antonio Among metropolitan statistical areas (MSAs) with over 1 million people, San AntonioNew Braunfels, Texas is ranked 13 th best out of 51 for population gains during 20002010 (U.S. Census data). Using relocation data from IRS returns over the same period, the San Antonio metro posted positive net migration of almost 180,000 people (i.e. exemptions). That was good enough for 10 th place. Without question, San Antonio is a major destination for U.S. movers. Unlike many Rust Belt MSAs, San Antonio is not struggling with demographic decline. The population is both growing robustly and relatively young. Concerning college educational attainment rates, the picture is not as rosy. Again using the 51 largest US metros as a benchmark (see Appendix A), San AntonioNew Braunfels is (in 2010) ranked 48 th with 25.4% of those aged 25 years and older holding a bachelor’s degree or higher. See map below for all MSAs (raw data in Appendix B): Relatively speaking, the picture improves a bit. However, bordering Greater San Antonio to the northeast is Austin–Round Rock–San Marcos with over 32.2% (see legend) of the 25+ population securing a bachelor’s degree or more (39.4% in 2010). Both metros are gaining population through natural increase (more births than deaths) and net migration (more inmigration than outmigration). Demographically, the glaring difference is education. Greater Austin is talent rich and renowned as a hotbed of innovation. How might San Antonio become more like its neighbor?
Transcript
1
San Antonio Talent Migration Connectivity Profile
Introduction: Brain Drain San Antonio
Among metropolitan statistical areas (MSAs) with over 1 million people, San Antonio-‐New Braunfels, Texas is ranked 13th best out of 51 for population gains during 2000-‐2010 (U.S. Census data). Using relocation data from IRS returns over the same period, the San Antonio metro posted positive net migration of almost 180,000 people (i.e. exemptions). That was good enough for 10th place. Without question, San Antonio is a major destination for U.S. movers.
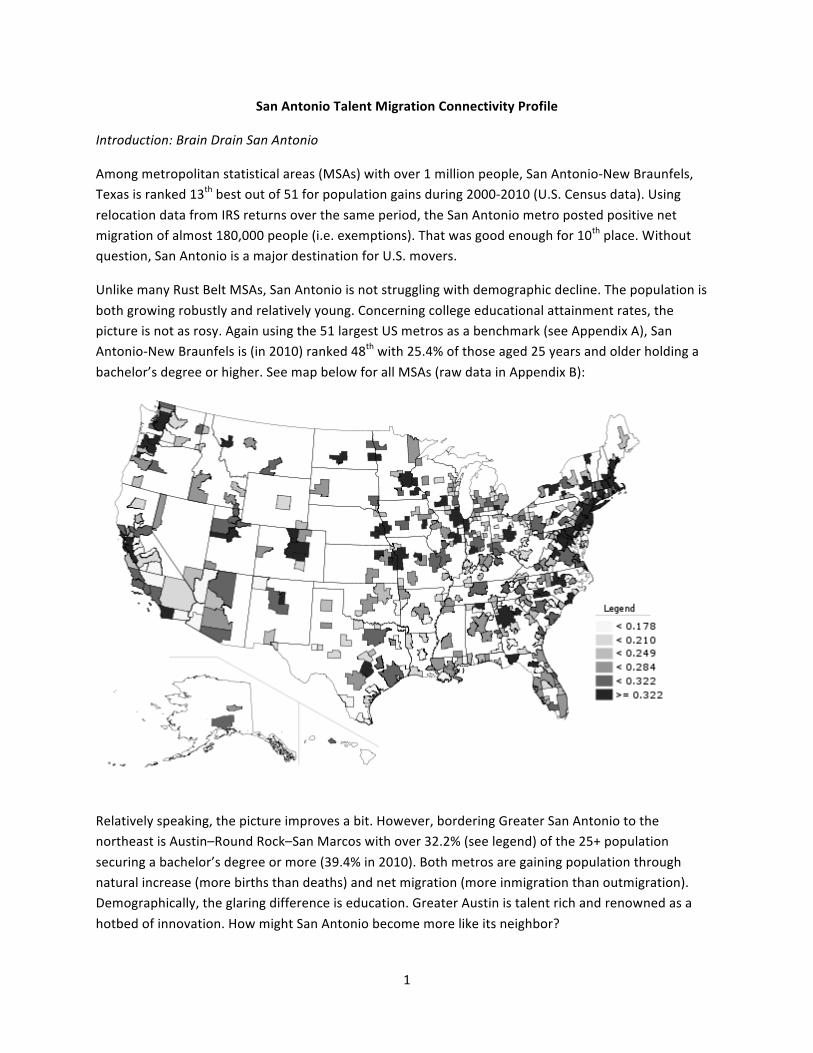
Unlike many Rust Belt MSAs, San Antonio is not struggling with demographic decline. The population is both growing robustly and relatively young. Concerning college educational attainment rates, the picture is not as rosy. Again using the 51 largest US metros as a benchmark (see Appendix A), San Antonio-‐New Braunfels is (in 2010) ranked 48th with 25.4% of those aged 25 years and older holding a bachelor’s degree or higher. See map below for all MSAs (raw data in Appendix B):
Relatively speaking, the picture improves a bit. However, bordering Greater San Antonio to the northeast is Austin–Round Rock–San Marcos with over 32.2% (see legend) of the 25+ population securing a bachelor’s degree or more (39.4% in 2010). Both metros are gaining population through natural increase (more births than deaths) and net migration (more inmigration than outmigration). Demographically, the glaring difference is education. Greater Austin is talent rich and renowned as a hotbed of innovation. How might San Antonio become more like its neighbor?
2
The purpose of this report is to lay the demographic foundation needed to answer the above question. Below is a talent migration analysis used to better understand Greater San Antonio’s assets and liabilities. Net migration will be disaggregated into inmigration and outmigration in order to highlight the talent churn informing the low college educational attainment rate. Furthermore, total migration (inmigration + outmigration) will be mapped to expose major talent links that can help Greater San Antonio achieve its economic development goals. Lastly, avenues of ironic brain gain will be suggested. The recommend line of inquiry would result in a talent migration strategy for Greater San Antonio.
Disaggregating Greater San Antonio Net Migration
Using IRS data from 1996-‐2010, below is a map of Greater San Antonio net migration (inmigration – outmigration):
With most metros, San Antonio is importing more people (i.e. exemptions) than exporting. Note the strength of net migration within Texas. On the next two pages is a data comparison of to the top-‐30 net positive MSAs with all metros versus those outside of Texas. On the first list, Texas metros are in bold.
3
Net Migration (Exemptions) for San Antonio-‐New Braunfels, TX (1996-‐2010)
MSA Total 1. Los Angeles-‐Long Beach-‐Santa Ana, CA 14866 2. Corpus Christi, TX 9280 3. Houston-‐Sugar Land-‐Baytown, TX 7825 4. El Paso, TX 7669 5. Riverside-‐San Bernardino-‐Ontario, CA 7037 6. Chicago-‐Joliet-‐Naperville, IL-‐IN-‐WI 6610 7. Laredo, TX 6080 8. Brownsville-‐Harlingen, TX 4531 9. New York-‐Northern New Jersey-‐Long Island, NY-‐
NJ-‐PA 4215 10. McAllen-‐Edinburg-‐Mission, TX 4147 11. Honolulu, HI 3716 12. San Diego-‐Carlsbad-‐San Marcos, CA 3588 13. Killeen-‐Temple-‐Fort Hood, TX 3053 14. New Orleans-‐Metairie-‐Kenner, LA 2988 15. Lubbock, TX 2633 16. San Angelo, TX 2535 17. St. Louis, MO-‐IL 1977 18. San Francisco-‐Oakland-‐Fremont, CA 1905 19. Miami-‐Fort Lauderdale-‐Pompano Beach, FL 1837 20. Wichita Falls, TX 1781 21. Salinas, CA 1624 22. Victoria, TX 1519 23. Detroit-‐Warren-‐Livonia, MI 1513 24. Virginia Beach-‐Norfolk-‐Newport News, VA-‐NC 1402 25. Sacramento-‐-‐Arden-‐Arcade-‐-‐Roseville, CA 1398 26. Beaumont-‐Port Arthur, TX 1377 27. Baltimore-‐Towson, MD 1238 28. Abilene, TX 1171 29. Philadelphia-‐Camden-‐Wilmington, PA-‐NJ-‐DE-‐
MSA Total 1. Los Angeles-‐Long Beach-‐Santa Ana, CA 14866 2. Riverside-‐San Bernardino-‐Ontario, CA 7037 3. Chicago-‐Joliet-‐Naperville, IL-‐IN-‐WI 6610 4. New York-‐Northern New Jersey-‐Long Island, NY-‐
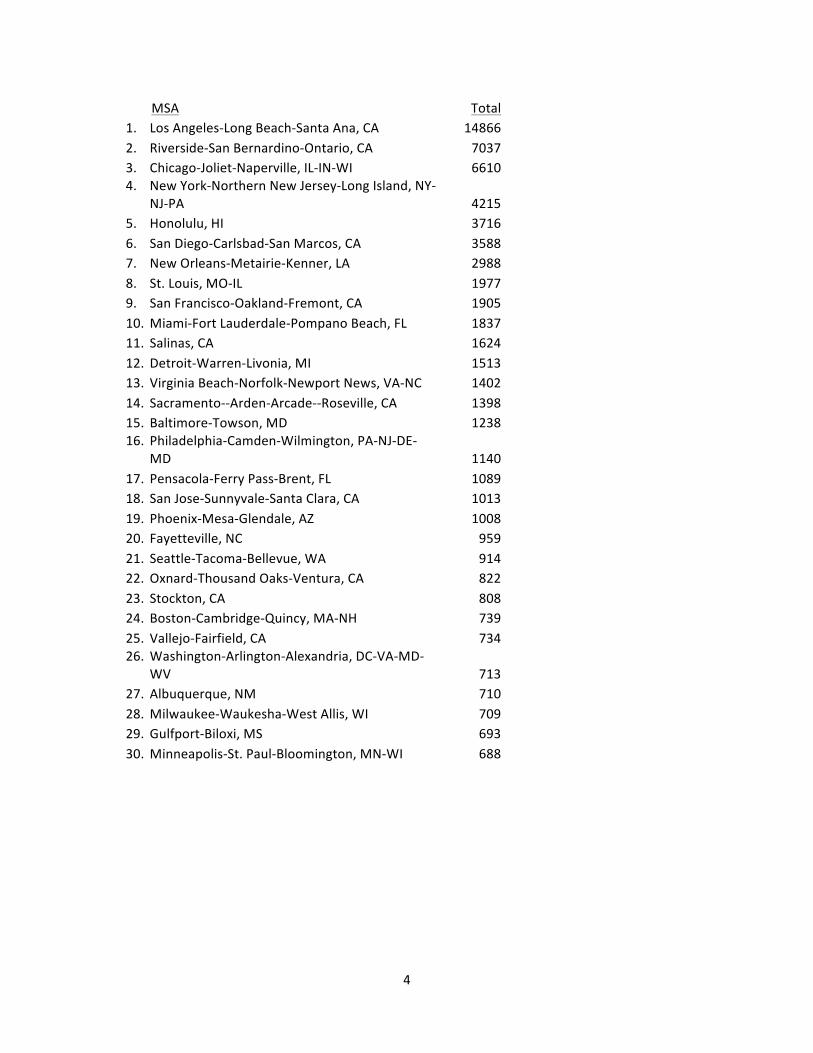
NJ-‐PA 4215 5. Honolulu, HI 3716 6. San Diego-‐Carlsbad-‐San Marcos, CA 3588 7. New Orleans-‐Metairie-‐Kenner, LA 2988 8. St. Louis, MO-‐IL 1977 9. San Francisco-‐Oakland-‐Fremont, CA 1905 10. Miami-‐Fort Lauderdale-‐Pompano Beach, FL 1837 11. Salinas, CA 1624 12. Detroit-‐Warren-‐Livonia, MI 1513 13. Virginia Beach-‐Norfolk-‐Newport News, VA-‐NC 1402 14. Sacramento-‐-‐Arden-‐Arcade-‐-‐Roseville, CA 1398 15. Baltimore-‐Towson, MD 1238 16. Philadelphia-‐Camden-‐Wilmington, PA-‐NJ-‐DE-‐
MD 1140 17. Pensacola-‐Ferry Pass-‐Brent, FL 1089 18. San Jose-‐Sunnyvale-‐Santa Clara, CA 1013 19. Phoenix-‐Mesa-‐Glendale, AZ 1008 20. Fayetteville, NC 959 21. Seattle-‐Tacoma-‐Bellevue, WA 914 22. Oxnard-‐Thousand Oaks-‐Ventura, CA 822 23. Stockton, CA 808 24. Boston-‐Cambridge-‐Quincy, MA-‐NH 739 25. Vallejo-‐Fairfield, CA 734 26. Washington-‐Arlington-‐Alexandria, DC-‐VA-‐MD-‐
WV 713 27. Albuquerque, NM 710 28. Milwaukee-‐Waukesha-‐West Allis, WI 709 29. Gulfport-‐Biloxi, MS 693 30. Minneapolis-‐St. Paul-‐Bloomington, MN-‐WI 688
5
Proximity breeds familiarity, which is why many Texas MSAs (regardless of population size) send so many people to San Antonio. The two biggest deficits are also located in Texas, Austin (-‐2965) and Dallas (-‐5914). Outside of Texas, metros with the largest populations dominate. The patterns are consistent with domestic Latino migration (outmigration from immigrant gateways such as Los Angeles and New York City)1 and military service (e.g. Honolulu and Virginia Beach). Neither flow trend is promising in terms of boosting San Antonio’s college educational attainment rate.
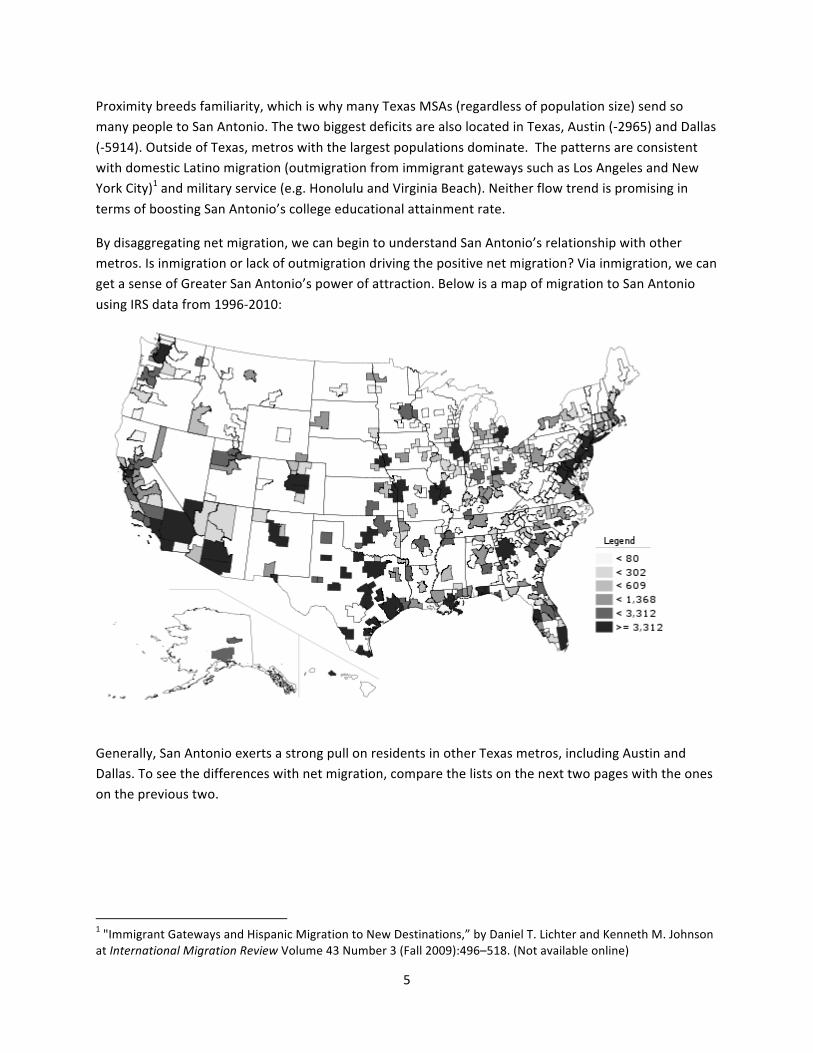
By disaggregating net migration, we can begin to understand San Antonio’s relationship with other metros. Is inmigration or lack of outmigration driving the positive net migration? Via inmigration, we can get a sense of Greater San Antonio’s power of attraction. Below is a map of migration to San Antonio using IRS data from 1996-‐2010:
Generally, San Antonio exerts a strong pull on residents in other Texas metros, including Austin and Dallas. To see the differences with net migration, compare the lists on the next two pages with the ones on the previous two.
1 "Immigrant Gateways and Hispanic Migration to New Destinations,” by Daniel T. Lichter and Kenneth M. Johnson at International Migration Review Volume 43 Number 3 (Fall 2009):496–518. (Not available online)
6
Inmigration (Exemptions) for San Antonio-‐New Braunfels, TX (1996-‐2010)
MSA Total 1. Austin-‐Round Rock-‐San Marcos, TX 65779 2. Houston-‐Sugar Land-‐Baytown, TX 63860 3. Dallas-‐Fort Worth-‐Arlington, TX 53877 4. Corpus Christi, TX 28301 5. Los Angeles-‐Long Beach-‐Santa Ana, CA 24732 6. Washington-‐Arlington-‐Alexandria, DC-‐VA-‐MD-‐WV 17836 7. El Paso, TX 16925 8. Killeen-‐Temple-‐Fort Hood, TX 15911 9. McAllen-‐Edinburg-‐Mission, TX 15169 10. Laredo, TX 14671 11. Chicago-‐Joliet-‐Naperville, IL-‐IN-‐WI 13988 12. Brownsville-‐Harlingen, TX 11921 13. Riverside-‐San Bernardino-‐Ontario, CA 11722 14. San Diego-‐Carlsbad-‐San Marcos, CA 11464 15. Phoenix-‐Mesa-‐Glendale, AZ 10390 16. Honolulu, HI 10383 17. Seattle-‐Tacoma-‐Bellevue, WA 8550 18. New York-‐Northern New Jersey-‐Long Island, NY-‐NJ-‐PA 8424 19. Colorado Springs, CO 8124 20. Virginia Beach-‐Norfolk-‐Newport News, VA-‐NC 7514 21. St. Louis, MO-‐IL 6983 22. Las Vegas-‐Paradise, NV 6361 23. Denver-‐Aurora-‐Broomfield, CO 6302 24. Lubbock, TX 6080 25. New Orleans-‐Metairie-‐Kenner, LA 6045 26. Baltimore-‐Towson, MD 5937 27. Fayetteville, NC 5716 28. Miami-‐Fort Lauderdale-‐Pompano Beach, FL 5681 29. San Angelo, TX 5652 30. Oklahoma City, OK 5365
7
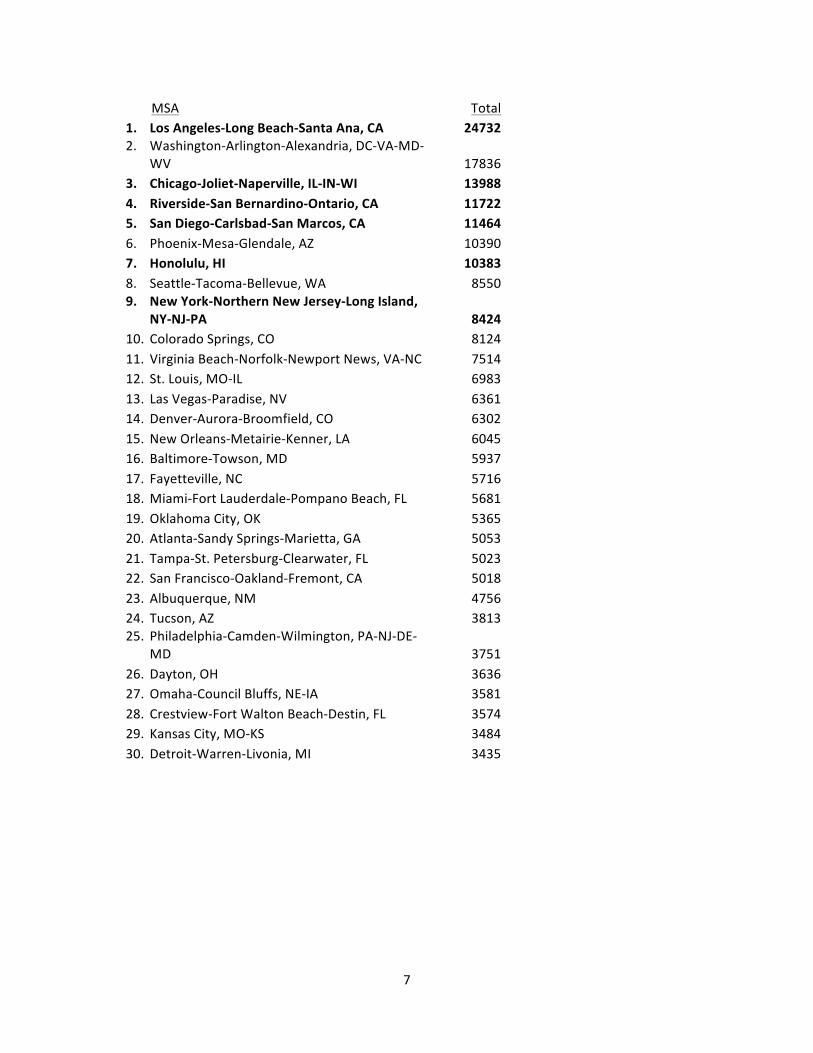
MSA Total 1. Los Angeles-‐Long Beach-‐Santa Ana, CA 24732 2. Washington-‐Arlington-‐Alexandria, DC-‐VA-‐MD-‐
WV 17836 3. Chicago-‐Joliet-‐Naperville, IL-‐IN-‐WI 13988 4. Riverside-‐San Bernardino-‐Ontario, CA 11722 5. San Diego-‐Carlsbad-‐San Marcos, CA 11464 6. Phoenix-‐Mesa-‐Glendale, AZ 10390 7. Honolulu, HI 10383 8. Seattle-‐Tacoma-‐Bellevue, WA 8550 9. New York-‐Northern New Jersey-‐Long Island,
NY-‐NJ-‐PA 8424 10. Colorado Springs, CO 8124 11. Virginia Beach-‐Norfolk-‐Newport News, VA-‐NC 7514 12. St. Louis, MO-‐IL 6983 13. Las Vegas-‐Paradise, NV 6361 14. Denver-‐Aurora-‐Broomfield, CO 6302 15. New Orleans-‐Metairie-‐Kenner, LA 6045 16. Baltimore-‐Towson, MD 5937 17. Fayetteville, NC 5716 18. Miami-‐Fort Lauderdale-‐Pompano Beach, FL 5681 19. Oklahoma City, OK 5365 20. Atlanta-‐Sandy Springs-‐Marietta, GA 5053 21. Tampa-‐St. Petersburg-‐Clearwater, FL 5023 22. San Francisco-‐Oakland-‐Fremont, CA 5018 23. Albuquerque, NM 4756 24. Tucson, AZ 3813 25. Philadelphia-‐Camden-‐Wilmington, PA-‐NJ-‐DE-‐
For inmigration, the instate orientation is even more pronounced than it is for net migration. 8 of the top-‐10 sending metros are in Texas. In Houston and Austin, 6 of the top-‐10 sending metros are in Texas. For Dallas, only 3 metros are instate. Clearly, Dallas is much more of a national talent draw. San Antonio has a lot of room for improvement on that score.
Looking outside of Texas, metros that are in both top-‐10 lists for net migration and inmigration are in bold. Greater Washington, DC moves up from 26th for net migration to 2nd for inmigration. DC has a high concentration of college graduates (#1 for metros with over 1 million people). This region is likely a strong source of talent for San Antonio. Other notable MSAs, Phoenix moves up from 19th (net migration) to 6th (inmigration). Seattle climbs from 21st to 8th. Phoenix is 42nd (out of 51 largest metros) and Seattle is 9th with percentages of adults 25 years and older with a bachelor’s degree or higher. That puts Seattle on the map for tech/innovations workers who would move to San Antonio.
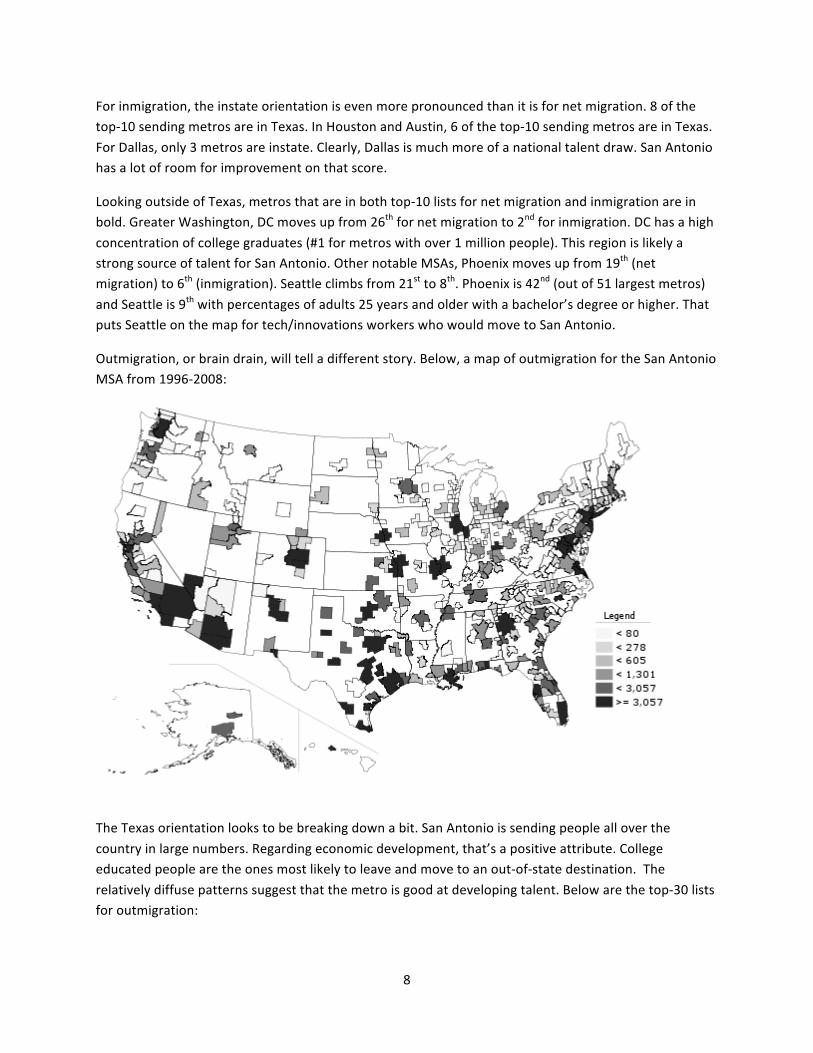
Outmigration, or brain drain, will tell a different story. Below, a map of outmigration for the San Antonio MSA from 1996-‐2008:
The Texas orientation looks to be breaking down a bit. San Antonio is sending people all over the country in large numbers. Regarding economic development, that’s a positive attribute. College educated people are the ones most likely to leave and move to an out-‐of-‐state destination. The relatively diffuse patterns suggest that the metro is good at developing talent. Below are the top-‐30 lists for outmigration:
9
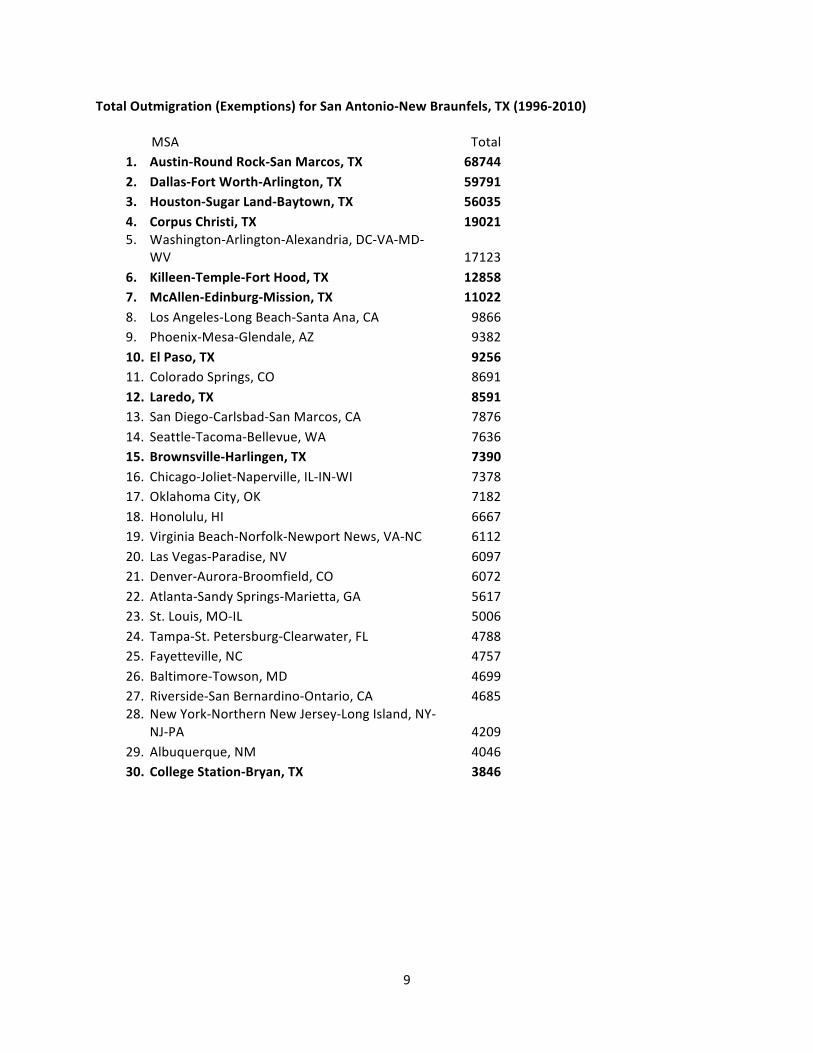
Total Outmigration (Exemptions) for San Antonio-‐New Braunfels, TX (1996-‐2010)
MSA Total 1. Washington-‐Arlington-‐Alexandria, DC-‐VA-‐MD-‐
WV 17123 2. Los Angeles-‐Long Beach-‐Santa Ana, CA 9866 3. Phoenix-‐Mesa-‐Glendale, AZ 9382 4. Colorado Springs, CO 8691 5. San Diego-‐Carlsbad-‐San Marcos, CA 7876 6. Seattle-‐Tacoma-‐Bellevue, WA 7636 7. Chicago-‐Joliet-‐Naperville, IL-‐IN-‐WI 7378 8. Oklahoma City, OK 7182 9. Honolulu, HI 6667 10. Virginia Beach-‐Norfolk-‐Newport News, VA-‐NC 6112 11. Las Vegas-‐Paradise, NV 6097 12. Denver-‐Aurora-‐Broomfield, CO 6072 13. Atlanta-‐Sandy Springs-‐Marietta, GA 5617 14. St. Louis, MO-‐IL 5006 15. Tampa-‐St. Petersburg-‐Clearwater, FL 4788 16. Fayetteville, NC 4757 17. Baltimore-‐Towson, MD 4699 18. Riverside-‐San Bernardino-‐Ontario, CA 4685 19. New York-‐Northern New Jersey-‐Long Island, NY-‐
NJ-‐PA 4209 20. Albuquerque, NM 4046 21. Miami-‐Fort Lauderdale-‐Pompano Beach, FL 3844 22. Crestview-‐Fort Walton Beach-‐Destin, FL 3472 23. Dayton, OH 3432 24. Omaha-‐Council Bluffs, NE-‐IA 3390 25. Tucson, AZ 3250 26. San Francisco-‐Oakland-‐Fremont, CA 3113 27. Kansas City, MO-‐KS 3096 28. New Orleans-‐Metairie-‐Kenner, LA 3057 29. Clarksville, TN-‐KY 2914 30. Anchorage, AK 2708
11
7 of the 10 outmigration destinations are within Texas. Austin, Dallas, and Houston dominate in sheer numbers. With this data, the Texas talent urban hierarchy is evident. San Antonio is a first-‐tier peer. There is tremendous churn within the Texas Triangle, with people elsewhere in the state trying to move into the megaregion. Outmigration variance within the Triangle includes 6 out-‐of-‐state destinations for Dallas, with Houston and Austin claiming 4. Dallas is clearly the best Triangle metro at developing talent. Again, San Antonio has considerable room to improve.
Beyond Texas, the top-‐10 outmigrant destinations are similar to the major sending metros. Washington, DC leaps to the top, displacing Los Angeles. The gap between #1 and #2 is quite large. DC attracts almost 60% more people (exemptions) than LA from San Antonio. DC is a logical choice for the talent attraction strategy primary market, something an analysis of only net migration numbers would overlook. In the next section, total migration is investigated to provide a more complete picture of San Antonio’s migration connectivity profile.
Total Migration: San Antonio’s Talent Connectivity Profile
Net migration numbers hide more than they reveal. For all MSAs (including those in Texas), Washington, DC does not show up in the top-‐30. For metros outside of Texas, DC chimes in as the 26th most important source of population gain via migration for Greater San Antonio. Only upon disaggregating the numbers does Washington’s tremendous impact rise to the surface. The differences between inmigration and outmigration are not dramatic. A better measure of talent migration is to assess the total flow (inmigration + outmigration). The term for this is “total migration” or “gross migration”. Total migration is amount of migrant “trade” between two regions.
From well-‐established migration theory, we know that outflows generate return flows.2 The size of the churn between two MSAs is indicative of potential inmigration. Financial capital, ideas, knowledge, and trust all move easily along established pathways. Through relocation, metros develop a deeper economic connection.
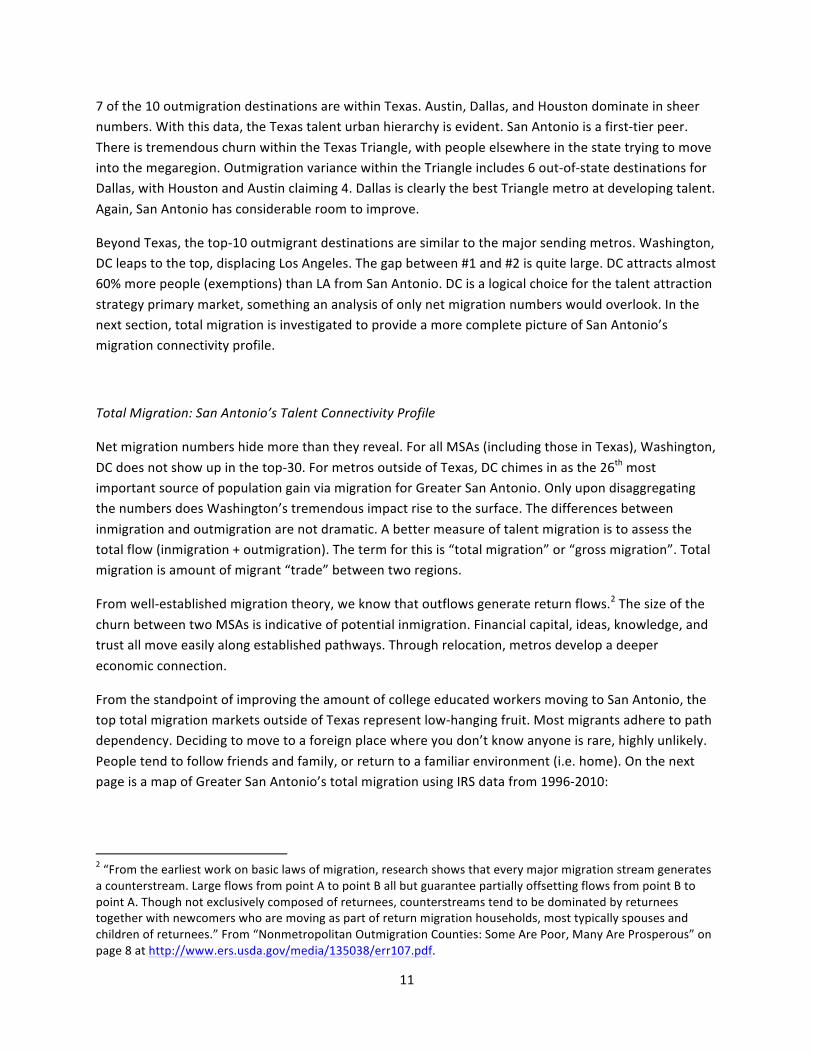
From the standpoint of improving the amount of college educated workers moving to San Antonio, the top total migration markets outside of Texas represent low-‐hanging fruit. Most migrants adhere to path dependency. Deciding to move to a foreign place where you don’t know anyone is rare, highly unlikely. People tend to follow friends and family, or return to a familiar environment (i.e. home). On the next page is a map of Greater San Antonio’s total migration using IRS data from 1996-‐2010:
2 “From the earliest work on basic laws of migration, research shows that every major migration stream generates a counterstream. Large flows from point A to point B all but guarantee partially offsetting flows from point B to point A. Though not exclusively composed of returnees, counterstreams tend to be dominated by returnees together with newcomers who are moving as part of return migration households, most typically spouses and children of returnees.” From “Nonmetropolitan Outmigration Counties: Some Are Poor, Many Are Prosperous” on page 8 at http://www.ers.usda.gov/media/135038/err107.pdf.
12
San Antonio has excellent national connectivity, with strong churn with most major cities. Metros further down the urban hierarchy are more parochial. Much, if not most, of the talent trade remains instate. The largest cities of Texas serve as a gateway to the rest of the country. Like Dallas, Austin, and Houston; San Antonio is a springboard to opportunities outside of Texas.
There are two caveats to using the total migration metric. First, proximity explains a lot of relocation. Most moves are short distances. We would expect Texas metros to dominate San Antonio’s profile. Second, the largest cities as a function of population tend to be major talent trading partners for every US metro. Size is a good predictor of total migration. Therefore, strong total migration with a small city that is far away would be remarkable. Such anomalies are worthy of further research in order to better understand the connection. Such an endeavor is beyond the scope of this project, but would be a future consideration.
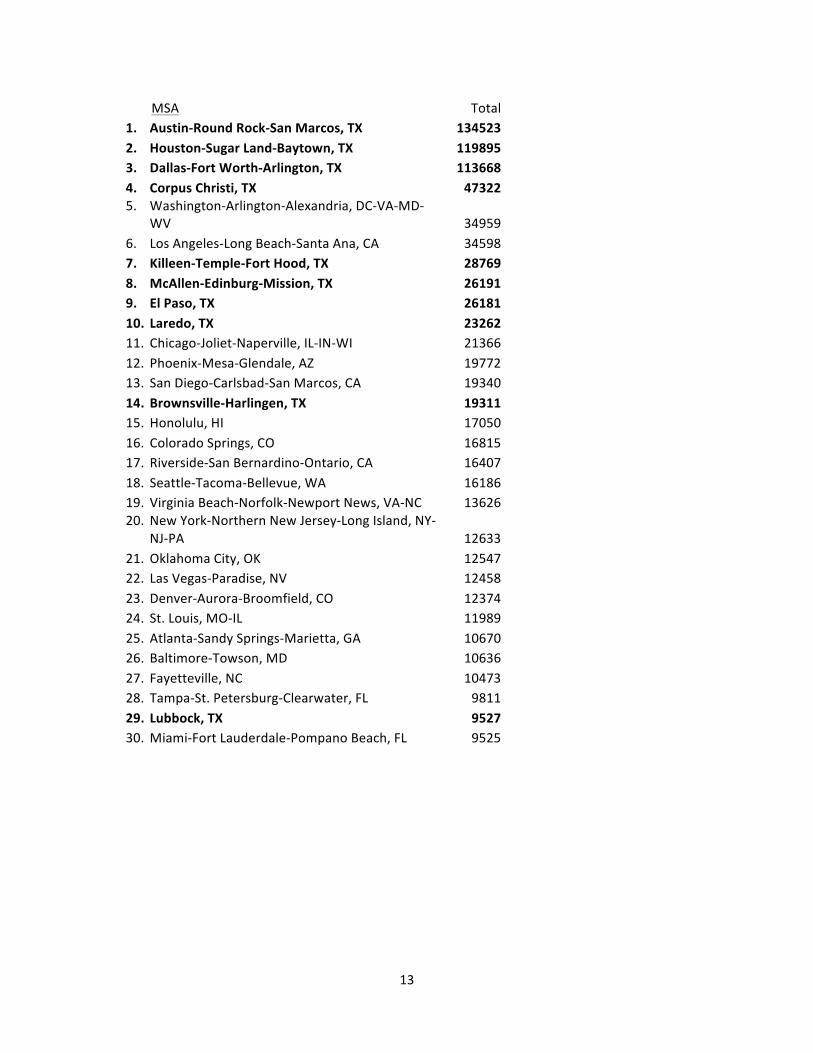
Over the next two pages, top-‐30 “Total Migraton (Exemptions) for San Antonio-‐New Braunfels, TX (1996-‐2010)” for all MSAs and those located outside Texas:
WV 34959 6. Los Angeles-‐Long Beach-‐Santa Ana, CA 34598 7. Killeen-‐Temple-‐Fort Hood, TX 28769 8. McAllen-‐Edinburg-‐Mission, TX 26191 9. El Paso, TX 26181 10. Laredo, TX 23262 11. Chicago-‐Joliet-‐Naperville, IL-‐IN-‐WI 21366 12. Phoenix-‐Mesa-‐Glendale, AZ 19772 13. San Diego-‐Carlsbad-‐San Marcos, CA 19340 14. Brownsville-‐Harlingen, TX 19311 15. Honolulu, HI 17050 16. Colorado Springs, CO 16815 17. Riverside-‐San Bernardino-‐Ontario, CA 16407 18. Seattle-‐Tacoma-‐Bellevue, WA 16186 19. Virginia Beach-‐Norfolk-‐Newport News, VA-‐NC 13626 20. New York-‐Northern New Jersey-‐Long Island, NY-‐
NJ-‐PA 12633 21. Oklahoma City, OK 12547 22. Las Vegas-‐Paradise, NV 12458 23. Denver-‐Aurora-‐Broomfield, CO 12374 24. St. Louis, MO-‐IL 11989 25. Atlanta-‐Sandy Springs-‐Marietta, GA 10670 26. Baltimore-‐Towson, MD 10636 27. Fayetteville, NC 10473 28. Tampa-‐St. Petersburg-‐Clearwater, FL 9811 29. Lubbock, TX 9527 30. Miami-‐Fort Lauderdale-‐Pompano Beach, FL 9525
14
MSA Total 1. Washington-‐Arlington-‐Alexandria, DC-‐VA-‐MD-‐
WV 34959 2. Los Angeles-‐Long Beach-‐Santa Ana, CA 34598 3. Chicago-‐Joliet-‐Naperville, IL-‐IN-‐WI 21366 4. Phoenix-‐Mesa-‐Glendale, AZ 19772 5. San Diego-‐Carlsbad-‐San Marcos, CA 19340 6. Honolulu, HI 17050 7. Colorado Springs, CO 16815 8. Riverside-‐San Bernardino-‐Ontario, CA 16407 9. Seattle-‐Tacoma-‐Bellevue, WA 16186 10. Virginia Beach-‐Norfolk-‐Newport News, VA-‐NC 13626 11. New York-‐Northern New Jersey-‐Long Island, NY-‐
NJ-‐PA 12633 12. Oklahoma City, OK 12547 13. Las Vegas-‐Paradise, NV 12458 14. Denver-‐Aurora-‐Broomfield, CO 12374 15. St. Louis, MO-‐IL 11989 16. Atlanta-‐Sandy Springs-‐Marietta, GA 10670 17. Baltimore-‐Towson, MD 10636 18. Fayetteville, NC 10473 19. Tampa-‐St. Petersburg-‐Clearwater, FL 9811 20. Miami-‐Fort Lauderdale-‐Pompano Beach, FL 9525 21. New Orleans-‐Metairie-‐Kenner, LA 9102 22. Albuquerque, NM 8802 23. San Francisco-‐Oakland-‐Fremont, CA 8131 24. Dayton, OH 7068 25. Tucson, AZ 7063 26. Crestview-‐Fort Walton Beach-‐Destin, FL 7046 27. Omaha-‐Council Bluffs, NE-‐IA 6971 28. Kansas City, MO-‐KS 6580 29. Philadelphia-‐Camden-‐Wilmington, PA-‐NJ-‐DE-‐
MD 6362 30. Clarksville, TN-‐KY 6125
15
Only two of the top ten MSAs for total migration are not in Texas. (Texas metros are in boldface.) Given proximity, connectivity will be strong with other Texas urban regions regardless of policy. There is little to be gained by trying to change instate flows. These patterns are a product of geography.
As one’s level of education increases, out-‐of-‐state (i.e. long distance) moves become more likely. The college educated comprises the most geographically mobile demographic cohort. Thus, talent churn with MSAs outside of Texas contains more people with a bachelor’s degree or higher.
In bold are the metros that also rank in the top-‐10 for net migration. Washington, DC and Los Angeles are clearly San Antonio’s most important talent trading partners. Given Latino domestic migration patterns (see above), LA is likely an immigrant gateway feeder to San Antonio. Such flows are typically dominated by people with less than a college degree. Furthermore, much of the outflow from San Antonio is probably return migration to Los Angeles. LA does a lot to boost San Antonio’s overall population, but hurts the college educational attainment rate.
One way to test the theoretical contrast between Washington, DC and Los Angeles is to use IRS data to track the average adjusted gross income (AGI) per return for outmigration and inmigration. Income is an excellent proxy for educational attainment. People with college degrees earn more than people with only a high school diploma.
For all MSAs (1996-‐2010), the average AGI per return for inmigrants is $39,936 (131st) for Los Angeles and $64,144 (11th) for Washington, DC. The metro ranking is in parentheses. For outmigrants, the LA average is $40,573 (109th) and the DC average is $57,721 (17th). The average migrant coming from DC makes over 60% more than average migrant coming from LA. This analysis matches the above theoretical expectations. The churn between San Antonio and Washington, DC is much better educated than the one between San Antonio and Los Angeles.
Ironic Brain Gain San Antonio
In the introduction of this report, much was made of San Antonio’s relatively poor college educational attainment rate. The implication is that the metro suffers from brain drain, talent leaving home for greener pastures. After extensive migration analysis, a more nuanced picture appears. On net, Los Angeles is a major factor in San Antonio’s population boom. However, this flow is predominately below a bachelor’s degree. Concerning Washington, DC, net migration gains are meager. Yet the DC region is one of the top exporters of people to Greater San Antonio. The average income of these migrants is much higher than those from LA. In addition, Washington has a much higher concentration of bachelor degrees (47% to 31%) for those aged 25 and over. For San Antonio, Washington, DC is a major source of college educated talent. In effect, the population gains for people with less than college degree are glossing over the substantial gains being made in college educated workforce.
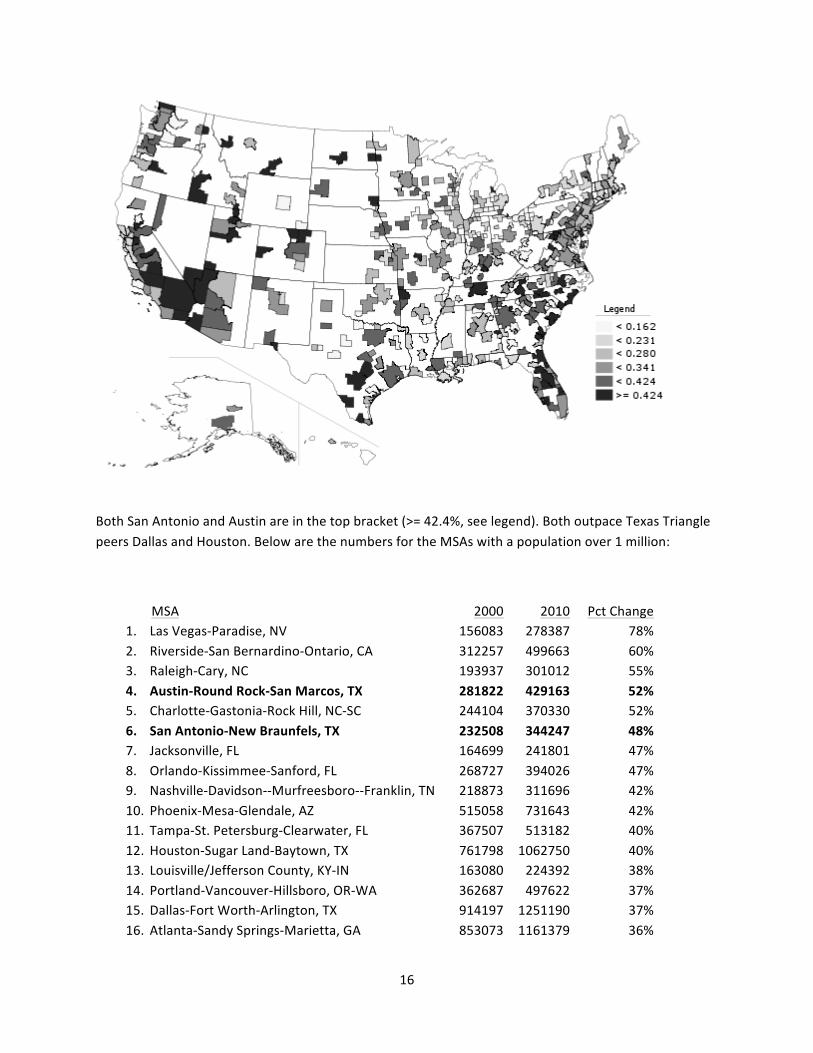
The map below illustrates this point. For all metros (using American Community Survey data), the “Percent Change in Total Number of Bachelors Degree or Higher (2000-‐2010)”:
16
Both San Antonio and Austin are in the top bracket (>= 42.4%, see legend). Both outpace Texas Triangle peers Dallas and Houston. Below are the numbers for the MSAs with a population over 1 million:
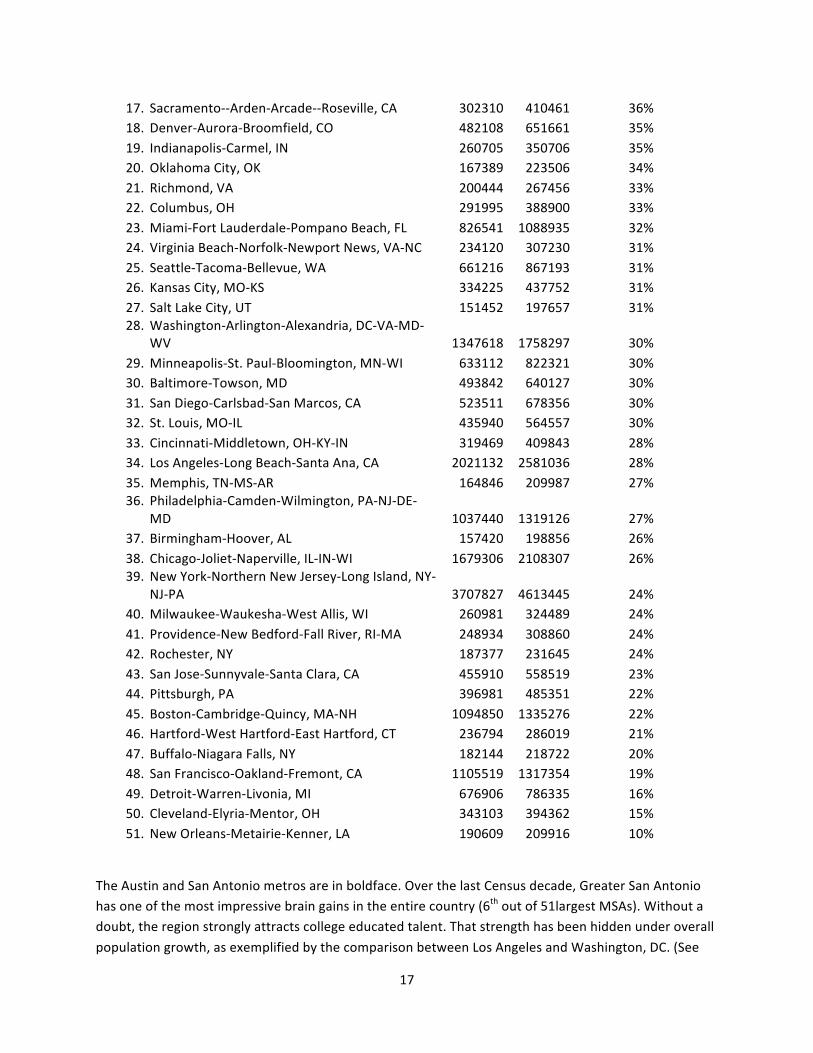
MD 1037440 1319126 27% 37. Birmingham-‐Hoover, AL 157420 198856 26% 38. Chicago-‐Joliet-‐Naperville, IL-‐IN-‐WI 1679306 2108307 26% 39. New York-‐Northern New Jersey-‐Long Island, NY-‐
NJ-‐PA 3707827 4613445 24% 40. Milwaukee-‐Waukesha-‐West Allis, WI 260981 324489 24% 41. Providence-‐New Bedford-‐Fall River, RI-‐MA 248934 308860 24% 42. Rochester, NY 187377 231645 24% 43. San Jose-‐Sunnyvale-‐Santa Clara, CA 455910 558519 23% 44. Pittsburgh, PA 396981 485351 22% 45. Boston-‐Cambridge-‐Quincy, MA-‐NH 1094850 1335276 22% 46. Hartford-‐West Hartford-‐East Hartford, CT 236794 286019 21% 47. Buffalo-‐Niagara Falls, NY 182144 218722 20% 48. San Francisco-‐Oakland-‐Fremont, CA 1105519 1317354 19% 49. Detroit-‐Warren-‐Livonia, MI 676906 786335 16% 50. Cleveland-‐Elyria-‐Mentor, OH 343103 394362 15% 51. New Orleans-‐Metairie-‐Kenner, LA 190609 209916 10%
The Austin and San Antonio metros are in boldface. Over the last Census decade, Greater San Antonio has one of the most impressive brain gains in the entire country (6th out of 51largest MSAs). Without a doubt, the region strongly attracts college educated talent. That strength has been hidden under overall population growth, as exemplified by the comparison between Los Angeles and Washington, DC. (See
18
above talent migration analysis.) The next step is do more research for how that talent flow is impacting the local landscape in order to catalyze more inmigration as well as better focus economic development strategies. For example, simple cohort analysis can be used to indentify neighborhoods that are experiencing brain gain that otherwise would go unnoticed given the general population statistics.3 Once completed, various talent attraction initiatives can be devised. More evident are the neighborhoods best targeted for revitalization and greater investment. Most importantly, the story of brain gain San Antonio must be told. Businesses, venture capital firms, and entrepreneurs should be made aware of the quality of talent found in the metro area.
The research question posed at the beginning of this report is:
Greater Austin is talent rich and renowned as a hotbed of innovation. How might San Antonio become more like its neighbor?
After drilling down into the migration numbers, a different research question is deemed more appropriate:
How is San Antonio already succeeding in attracting college educated migrants?
3 Please see "Not Dead Yet: The Infill of Cleveland's Urban Core" at http://www.metrotrends.org/spotlight/Cleveland_Spotlight.cfm for more details about this approach to demographic analysis.
19
Appendix A
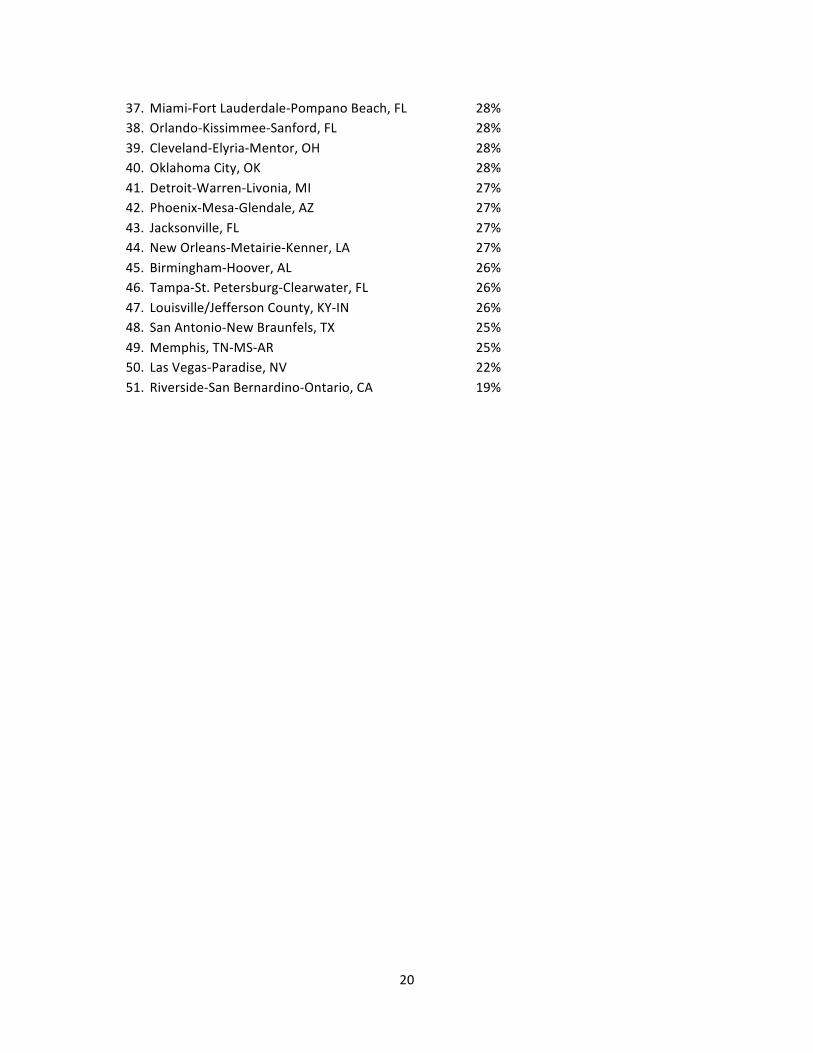
Bachelors Degree or Higher as % of Total Adult (25+) Population (2010) for MSAs over 1 Million People
WV 47% 2. San Jose-‐Sunnyvale-‐Santa Clara, CA 45% 3. San Francisco-‐Oakland-‐Fremont, CA 43% 4. Boston-‐Cambridge-‐Quincy, MA-‐NH 43% 5. Raleigh-‐Cary, NC 41% 6. Austin-‐Round Rock-‐San Marcos, TX 39% 7. Denver-‐Aurora-‐Broomfield, CO 38% 8. Minneapolis-‐St. Paul-‐Bloomington, MN-‐WI 38% 9. Seattle-‐Tacoma-‐Bellevue, WA 37% 10. New York-‐Northern New Jersey-‐Long Island, NY-‐
NJ-‐PA 36% 11. Baltimore-‐Towson, MD 35% 12. Hartford-‐West Hartford-‐East Hartford, CT 35% 13. Atlanta-‐Sandy Springs-‐Marietta, GA 34% 14. Chicago-‐Joliet-‐Naperville, IL-‐IN-‐WI 34% 15. San Diego-‐Carlsbad-‐San Marcos, CA 34% 16. Philadelphia-‐Camden-‐Wilmington, PA-‐NJ-‐DE-‐
MD 33% 17. Portland-‐Vancouver-‐Hillsboro, OR-‐WA 33% 18. Rochester, NY 33% 19. Columbus, OH 33% 20. Kansas City, MO-‐KS 32% 21. Charlotte-‐Gastonia-‐Rock Hill, NC-‐SC 32% 22. Milwaukee-‐Waukesha-‐West Allis, WI 32% 23. Richmond, VA 32% 24. Dallas-‐Fort Worth-‐Arlington, TX 31% 25. Los Angeles-‐Long Beach-‐Santa Ana, CA 31% 26. Indianapolis-‐Carmel, IN 31% 27. St. Louis, MO-‐IL 30% 28. Nashville-‐Davidson-‐-‐Murfreesboro-‐-‐Franklin, TN 30% 29. Sacramento-‐-‐Arden-‐Arcade-‐-‐Roseville, CA 29% 30. Cincinnati-‐Middletown, OH-‐KY-‐IN 29% 31. Pittsburgh, PA 29% 32. Salt Lake City, UT 29% 33. Virginia Beach-‐Norfolk-‐Newport News, VA-‐NC 29% 34. Providence-‐New Bedford-‐Fall River, RI-‐MA 29% 35. Houston-‐Sugar Land-‐Baytown, TX 28% 36. Buffalo-‐Niagara Falls, NY 28%
20
37. Miami-‐Fort Lauderdale-‐Pompano Beach, FL 28% 38. Orlando-‐Kissimmee-‐Sanford, FL 28% 39. Cleveland-‐Elyria-‐Mentor, OH 28% 40. Oklahoma City, OK 28% 41. Detroit-‐Warren-‐Livonia, MI 27% 42. Phoenix-‐Mesa-‐Glendale, AZ 27% 43. Jacksonville, FL 27% 44. New Orleans-‐Metairie-‐Kenner, LA 27% 45. Birmingham-‐Hoover, AL 26% 46. Tampa-‐St. Petersburg-‐Clearwater, FL 26% 47. Louisville/Jefferson County, KY-‐IN 26% 48. San Antonio-‐New Braunfels, TX 25% 49. Memphis, TN-‐MS-‐AR 25% 50. Las Vegas-‐Paradise, NV 22% 51. Riverside-‐San Bernardino-‐Ontario, CA 19%
21
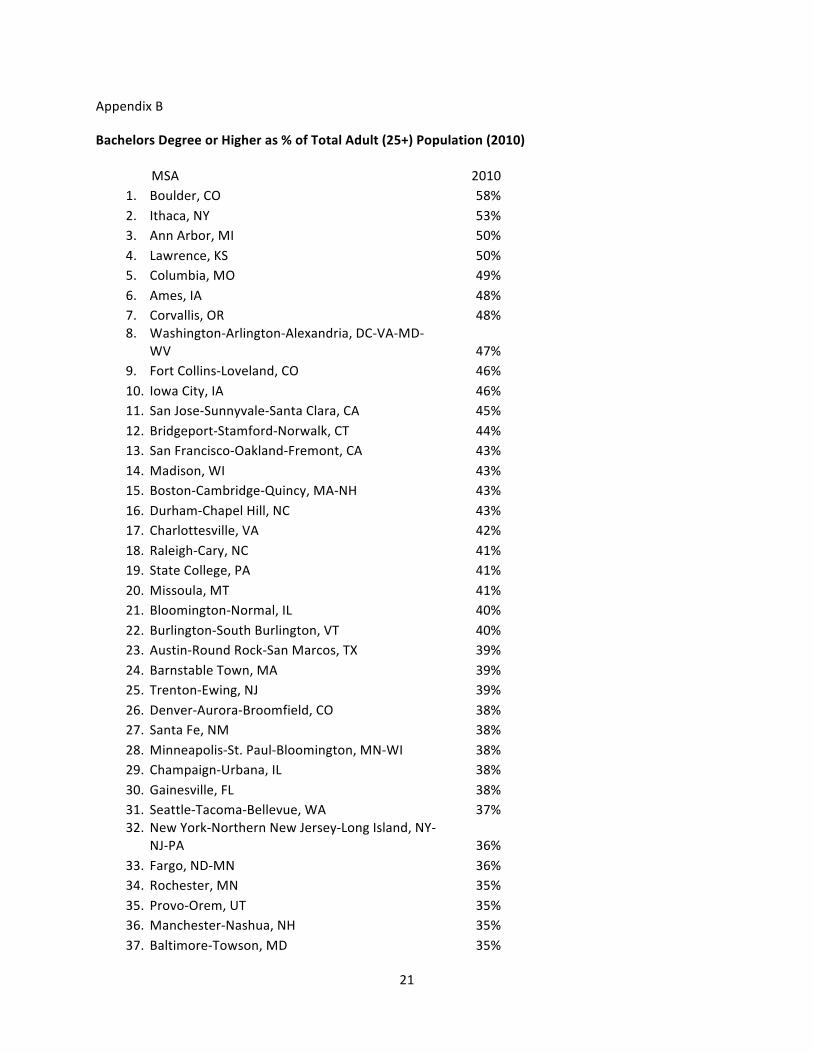
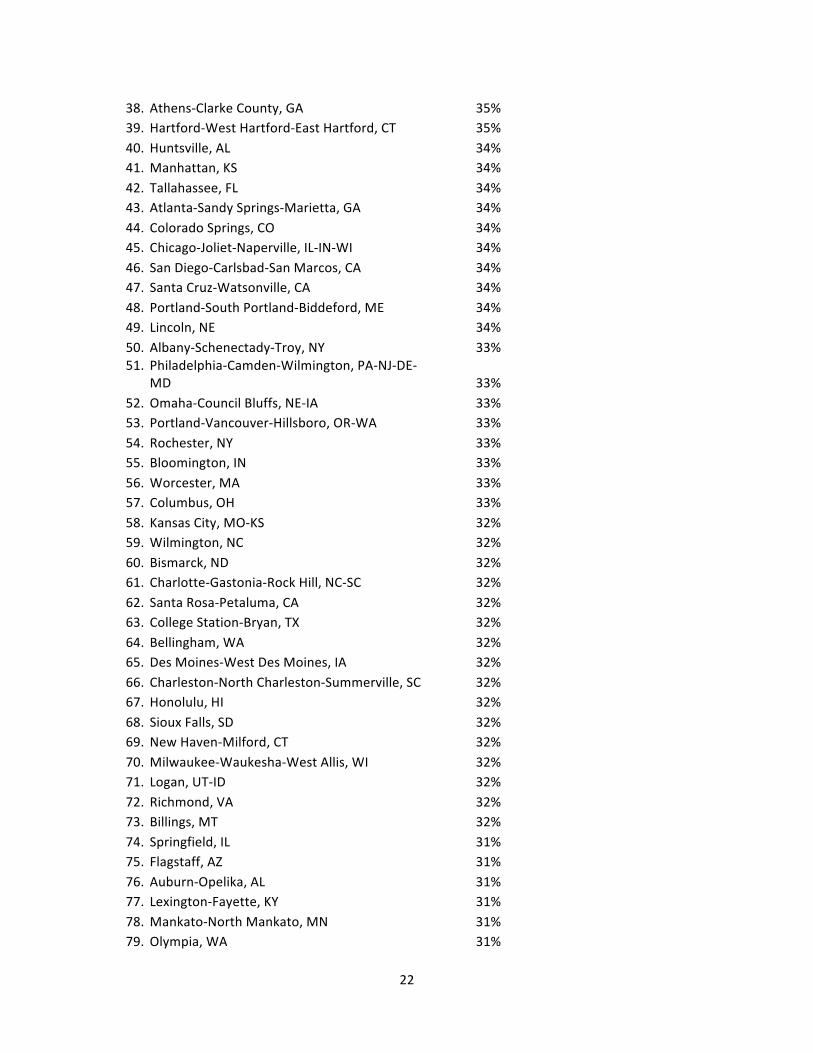
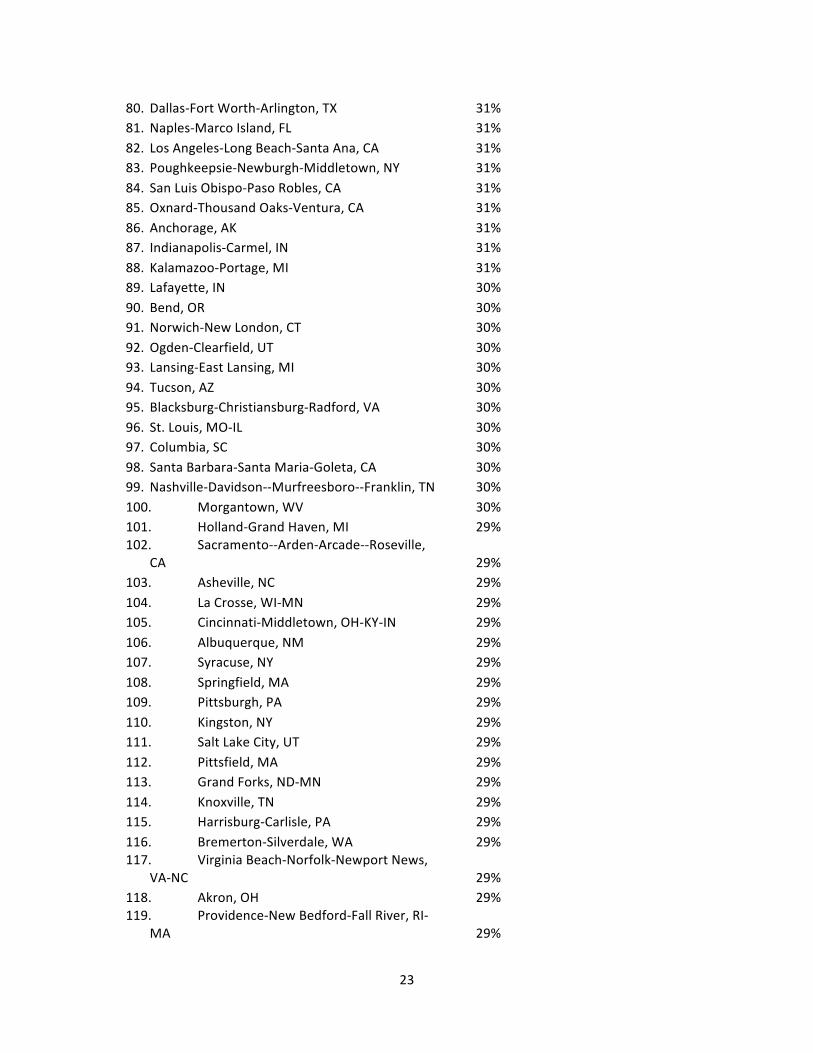
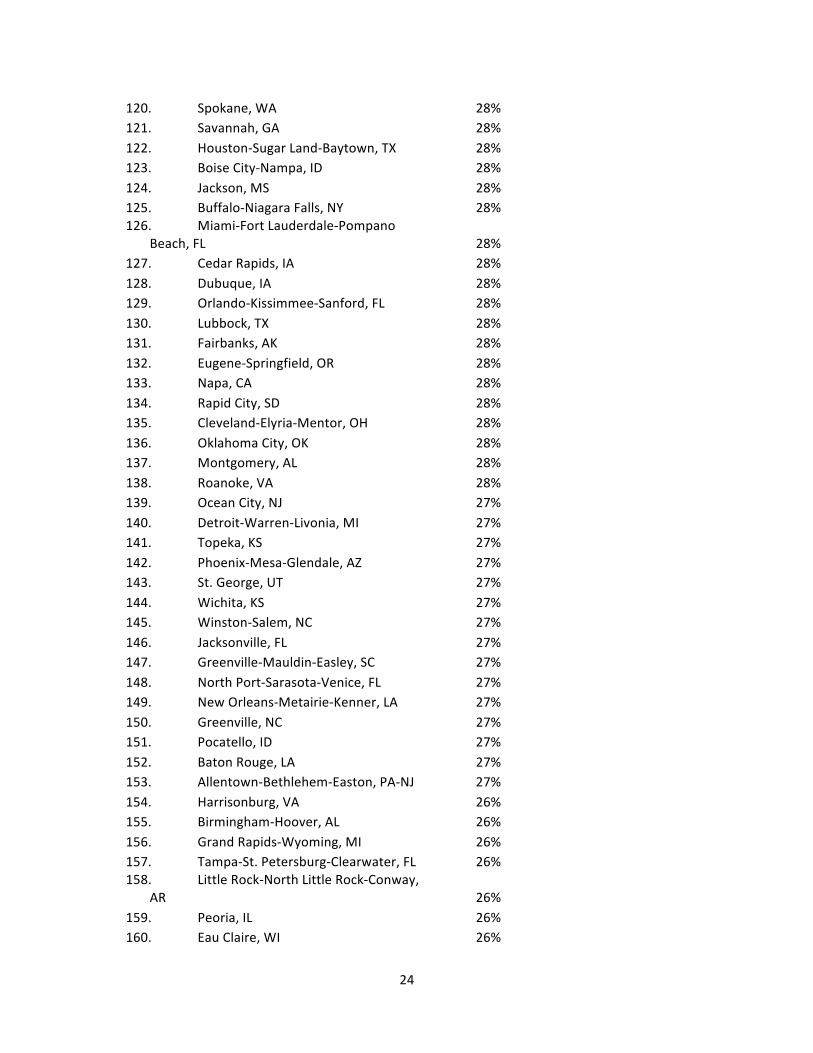
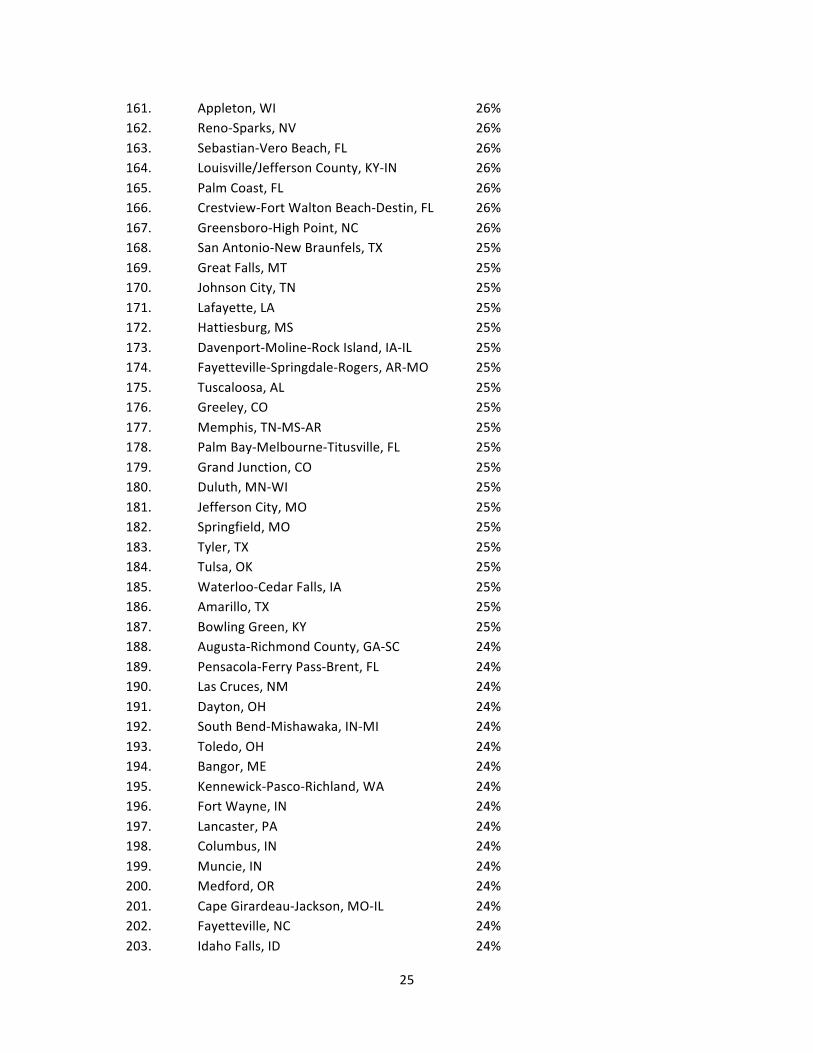
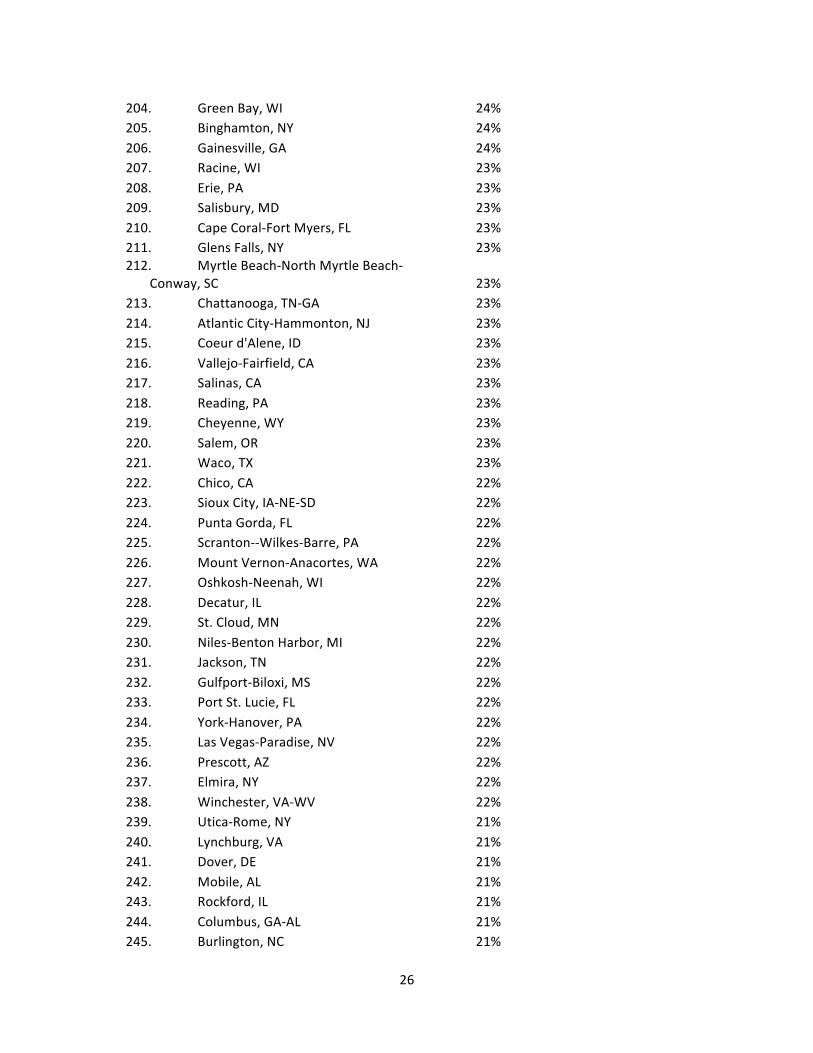
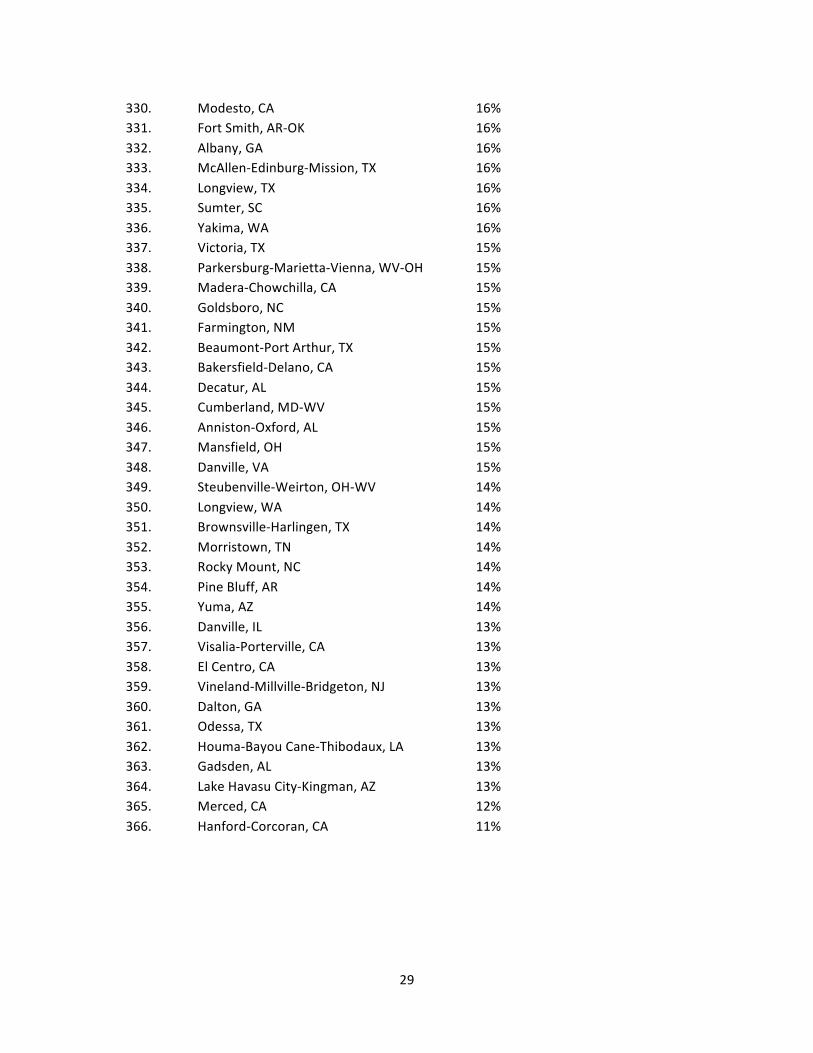
Appendix B
Bachelors Degree or Higher as % of Total Adult (25+) Population (2010)
MSA 2010 1. Boulder, CO 58% 2. Ithaca, NY 53% 3. Ann Arbor, MI 50% 4. Lawrence, KS 50% 5. Columbia, MO 49% 6. Ames, IA 48% 7. Corvallis, OR 48% 8. Washington-‐Arlington-‐Alexandria, DC-‐VA-‐MD-‐
WV 47% 9. Fort Collins-‐Loveland, CO 46% 10. Iowa City, IA 46% 11. San Jose-‐Sunnyvale-‐Santa Clara, CA 45% 12. Bridgeport-‐Stamford-‐Norwalk, CT 44% 13. San Francisco-‐Oakland-‐Fremont, CA 43% 14. Madison, WI 43% 15. Boston-‐Cambridge-‐Quincy, MA-‐NH 43% 16. Durham-‐Chapel Hill, NC 43% 17. Charlottesville, VA 42% 18. Raleigh-‐Cary, NC 41% 19. State College, PA 41% 20. Missoula, MT 41% 21. Bloomington-‐Normal, IL 40% 22. Burlington-‐South Burlington, VT 40% 23. Austin-‐Round Rock-‐San Marcos, TX 39% 24. Barnstable Town, MA 39% 25. Trenton-‐Ewing, NJ 39% 26. Denver-‐Aurora-‐Broomfield, CO 38% 27. Santa Fe, NM 38% 28. Minneapolis-‐St. Paul-‐Bloomington, MN-‐WI 38% 29. Champaign-‐Urbana, IL 38% 30. Gainesville, FL 38% 31. Seattle-‐Tacoma-‐Bellevue, WA 37% 32. New York-‐Northern New Jersey-‐Long Island, NY-‐
38. Athens-‐Clarke County, GA 35% 39. Hartford-‐West Hartford-‐East Hartford, CT 35% 40. Huntsville, AL 34% 41. Manhattan, KS 34% 42. Tallahassee, FL 34% 43. Atlanta-‐Sandy Springs-‐Marietta, GA 34% 44. Colorado Springs, CO 34% 45. Chicago-‐Joliet-‐Naperville, IL-‐IN-‐WI 34% 46. San Diego-‐Carlsbad-‐San Marcos, CA 34% 47. Santa Cruz-‐Watsonville, CA 34% 48. Portland-‐South Portland-‐Biddeford, ME 34% 49. Lincoln, NE 34% 50. Albany-‐Schenectady-‐Troy, NY 33% 51. Philadelphia-‐Camden-‐Wilmington, PA-‐NJ-‐DE-‐
MD 33% 52. Omaha-‐Council Bluffs, NE-‐IA 33% 53. Portland-‐Vancouver-‐Hillsboro, OR-‐WA 33% 54. Rochester, NY 33% 55. Bloomington, IN 33% 56. Worcester, MA 33% 57. Columbus, OH 33% 58. Kansas City, MO-‐KS 32% 59. Wilmington, NC 32% 60. Bismarck, ND 32% 61. Charlotte-‐Gastonia-‐Rock Hill, NC-‐SC 32% 62. Santa Rosa-‐Petaluma, CA 32% 63. College Station-‐Bryan, TX 32% 64. Bellingham, WA 32% 65. Des Moines-‐West Des Moines, IA 32% 66. Charleston-‐North Charleston-‐Summerville, SC 32% 67. Honolulu, HI 32% 68. Sioux Falls, SD 32% 69. New Haven-‐Milford, CT 32% 70. Milwaukee-‐Waukesha-‐West Allis, WI 32% 71. Logan, UT-‐ID 32% 72. Richmond, VA 32% 73. Billings, MT 32% 74. Springfield, IL 31% 75. Flagstaff, AZ 31% 76. Auburn-‐Opelika, AL 31% 77. Lexington-‐Fayette, KY 31% 78. Mankato-‐North Mankato, MN 31% 79. Olympia, WA 31%
23
80. Dallas-‐Fort Worth-‐Arlington, TX 31% 81. Naples-‐Marco Island, FL 31% 82. Los Angeles-‐Long Beach-‐Santa Ana, CA 31% 83. Poughkeepsie-‐Newburgh-‐Middletown, NY 31% 84. San Luis Obispo-‐Paso Robles, CA 31% 85. Oxnard-‐Thousand Oaks-‐Ventura, CA 31% 86. Anchorage, AK 31% 87. Indianapolis-‐Carmel, IN 31% 88. Kalamazoo-‐Portage, MI 31% 89. Lafayette, IN 30% 90. Bend, OR 30% 91. Norwich-‐New London, CT 30% 92. Ogden-‐Clearfield, UT 30% 93. Lansing-‐East Lansing, MI 30% 94. Tucson, AZ 30% 95. Blacksburg-‐Christiansburg-‐Radford, VA 30% 96. St. Louis, MO-‐IL 30% 97. Columbia, SC 30% 98. Santa Barbara-‐Santa Maria-‐Goleta, CA 30% 99. Nashville-‐Davidson-‐-‐Murfreesboro-‐-‐Franklin, TN 30% 100. Morgantown, WV 30% 101. Holland-‐Grand Haven, MI 29% 102. Sacramento-‐-‐Arden-‐Arcade-‐-‐Roseville,
CA 29% 103. Asheville, NC 29% 104. La Crosse, WI-‐MN 29% 105. Cincinnati-‐Middletown, OH-‐KY-‐IN 29% 106. Albuquerque, NM 29% 107. Syracuse, NY 29% 108. Springfield, MA 29% 109. Pittsburgh, PA 29% 110. Kingston, NY 29% 111. Salt Lake City, UT 29% 112. Pittsfield, MA 29% 113. Grand Forks, ND-‐MN 29% 114. Knoxville, TN 29% 115. Harrisburg-‐Carlisle, PA 29% 116. Bremerton-‐Silverdale, WA 29% 117. Virginia Beach-‐Norfolk-‐Newport News,
120. Spokane, WA 28% 121. Savannah, GA 28% 122. Houston-‐Sugar Land-‐Baytown, TX 28% 123. Boise City-‐Nampa, ID 28% 124. Jackson, MS 28% 125. Buffalo-‐Niagara Falls, NY 28% 126. Miami-‐Fort Lauderdale-‐Pompano
Beach, FL 28% 127. Cedar Rapids, IA 28% 128. Dubuque, IA 28% 129. Orlando-‐Kissimmee-‐Sanford, FL 28% 130. Lubbock, TX 28% 131. Fairbanks, AK 28% 132. Eugene-‐Springfield, OR 28% 133. Napa, CA 28% 134. Rapid City, SD 28% 135. Cleveland-‐Elyria-‐Mentor, OH 28% 136. Oklahoma City, OK 28% 137. Montgomery, AL 28% 138. Roanoke, VA 28% 139. Ocean City, NJ 27% 140. Detroit-‐Warren-‐Livonia, MI 27% 141. Topeka, KS 27% 142. Phoenix-‐Mesa-‐Glendale, AZ 27% 143. St. George, UT 27% 144. Wichita, KS 27% 145. Winston-‐Salem, NC 27% 146. Jacksonville, FL 27% 147. Greenville-‐Mauldin-‐Easley, SC 27% 148. North Port-‐Sarasota-‐Venice, FL 27% 149. New Orleans-‐Metairie-‐Kenner, LA 27% 150. Greenville, NC 27% 151. Pocatello, ID 27% 152. Baton Rouge, LA 27% 153. Allentown-‐Bethlehem-‐Easton, PA-‐NJ 27% 154. Harrisonburg, VA 26% 155. Birmingham-‐Hoover, AL 26% 156. Grand Rapids-‐Wyoming, MI 26% 157. Tampa-‐St. Petersburg-‐Clearwater, FL 26% 158. Little Rock-‐North Little Rock-‐Conway,
AR 26% 159. Peoria, IL 26% 160. Eau Claire, WI 26%
25
161. Appleton, WI 26% 162. Reno-‐Sparks, NV 26% 163. Sebastian-‐Vero Beach, FL 26% 164. Louisville/Jefferson County, KY-‐IN 26% 165. Palm Coast, FL 26% 166. Crestview-‐Fort Walton Beach-‐Destin, FL 26% 167. Greensboro-‐High Point, NC 26% 168. San Antonio-‐New Braunfels, TX 25% 169. Great Falls, MT 25% 170. Johnson City, TN 25% 171. Lafayette, LA 25% 172. Hattiesburg, MS 25% 173. Davenport-‐Moline-‐Rock Island, IA-‐IL 25% 174. Fayetteville-‐Springdale-‐Rogers, AR-‐MO 25% 175. Tuscaloosa, AL 25% 176. Greeley, CO 25% 177. Memphis, TN-‐MS-‐AR 25% 178. Palm Bay-‐Melbourne-‐Titusville, FL 25% 179. Grand Junction, CO 25% 180. Duluth, MN-‐WI 25% 181. Jefferson City, MO 25% 182. Springfield, MO 25% 183. Tyler, TX 25% 184. Tulsa, OK 25% 185. Waterloo-‐Cedar Falls, IA 25% 186. Amarillo, TX 25% 187. Bowling Green, KY 25% 188. Augusta-‐Richmond County, GA-‐SC 24% 189. Pensacola-‐Ferry Pass-‐Brent, FL 24% 190. Las Cruces, NM 24% 191. Dayton, OH 24% 192. South Bend-‐Mishawaka, IN-‐MI 24% 193. Toledo, OH 24% 194. Bangor, ME 24% 195. Kennewick-‐Pasco-‐Richland, WA 24% 196. Fort Wayne, IN 24% 197. Lancaster, PA 24% 198. Columbus, IN 24% 199. Muncie, IN 24% 200. Medford, OR 24% 201. Cape Girardeau-‐Jackson, MO-‐IL 24% 202. Fayetteville, NC 24% 203. Idaho Falls, ID 24%
26
204. Green Bay, WI 24% 205. Binghamton, NY 24% 206. Gainesville, GA 24% 207. Racine, WI 23% 208. Erie, PA 23% 209. Salisbury, MD 23% 210. Cape Coral-‐Fort Myers, FL 23% 211. Glens Falls, NY 23% 212. Myrtle Beach-‐North Myrtle Beach-‐
Conway, SC 23% 213. Chattanooga, TN-‐GA 23% 214. Atlantic City-‐Hammonton, NJ 23% 215. Coeur d'Alene, ID 23% 216. Vallejo-‐Fairfield, CA 23% 217. Salinas, CA 23% 218. Reading, PA 23% 219. Cheyenne, WY 23% 220. Salem, OR 23% 221. Waco, TX 23% 222. Chico, CA 22% 223. Sioux City, IA-‐NE-‐SD 22% 224. Punta Gorda, FL 22% 225. Scranton-‐-‐Wilkes-‐Barre, PA 22% 226. Mount Vernon-‐Anacortes, WA 22% 227. Oshkosh-‐Neenah, WI 22% 228. Decatur, IL 22% 229. St. Cloud, MN 22% 230. Niles-‐Benton Harbor, MI 22% 231. Jackson, TN 22% 232. Gulfport-‐Biloxi, MS 22% 233. Port St. Lucie, FL 22% 234. York-‐Hanover, PA 22% 235. Las Vegas-‐Paradise, NV 22% 236. Prescott, AZ 22% 237. Elmira, NY 22% 238. Winchester, VA-‐WV 22% 239. Utica-‐Rome, NY 21% 240. Lynchburg, VA 21% 241. Dover, DE 21% 242. Mobile, AL 21% 243. Rockford, IL 21% 244. Columbus, GA-‐AL 21% 245. Burlington, NC 21%
27
246. Deltona-‐Daytona Beach-‐Ormond Beach, FL 21%
247. Abilene, TX 21% 248. Hot Springs, AR 21% 249. Carson City, NV 21% 250. Brunswick, GA 21% 251. Spartanburg, SC 21% 252. Valdosta, GA 21% 253. Wausau, WI 20% 254. Shreveport-‐Bossier City, LA 20% 255. Bay City, MI 20% 256. Macon, GA 20% 257. Midland, TX 20% 258. Warner Robins, GA 20% 259. Hagerstown-‐Martinsburg, MD-‐WV 20% 260. Evansville, IN-‐KY 20% 261. Fresno, CA 20% 262. Sheboygan, WI 20% 263. Corpus Christi, TX 20% 264. Panama City-‐Lynn Haven-‐Panama City
Beach, FL 20% 265. Killeen-‐Temple-‐Fort Hood, TX 20% 266. Florence-‐Muscle Shoals, AL 20% 267. Canton-‐Massillon, OH 20% 268. Janesville, WI 20% 269. Johnstown, PA 20% 270. Monroe, LA 20% 271. El Paso, TX 20% 272. Pueblo, CO 20% 273. Charleston, WV 20% 274. Lake Charles, LA 20% 275. Wheeling, WV-‐OH 19% 276. Riverside-‐San Bernardino-‐Ontario, CA 19% 277. Redding, CA 19% 278. Youngstown-‐Warren-‐Boardman, OH-‐PA 19% 279. San Angelo, TX 19% 280. Sandusky, OH 19% 281. Flint, MI 19% 282. Wenatchee-‐East Wenatchee, WA 19% 283. Sherman-‐Denison, TX 19% 284. Lebanon, PA 19% 285. Kokomo, IN 19% 286. St. Joseph, MO-‐KS 19%
28
287. Jonesboro, AR 19% 288. Elizabethtown, KY 19% 289. Joplin, MO 19% 290. Clarksville, TN-‐KY 19% 291. Hinesville-‐Fort Stewart, GA 19% 292. Rome, GA 19% 293. Kingsport-‐Bristol-‐Bristol, TN-‐VA 19% 294. Lewiston-‐Auburn, ME 19% 295. Wichita Falls, TX 18% 296. Monroe, MI 18% 297. Lewiston, ID-‐WA 18% 298. Williamsport, PA 18% 299. Fond du Lac, WI 18% 300. Jacksonville, NC 18% 301. Casper, WY 18% 302. Lakeland-‐Winter Haven, FL 18% 303. Lawton, OK 18% 304. Saginaw-‐Saginaw Township North, MI 18% 305. Jackson, MI 18% 306. Stockton, CA 18% 307. Florence, SC 18% 308. Anderson, SC 18% 309. Terre Haute, IN 18% 310. Michigan City-‐La Porte, IN 18% 311. Hickory-‐Lenoir-‐Morganton, NC 18% 312. Yuba City, CA 17% 313. Pascagoula, MS 17% 314. Battle Creek, MI 17% 315. Springfield, OH 17% 316. Anderson, IN 17% 317. Alexandria, LA 17% 318. Laredo, TX 17% 319. Cleveland, TN 17% 320. Elkhart-‐Goshen, IN 17% 321. Owensboro, KY 16% 322. Dothan, AL 16% 323. Lima, OH 16% 324. Ocala, FL 16% 325. Altoona, PA 16% 326. Muskegon-‐Norton Shores, MI 16% 327. Texarkana, TX-‐Texarkana, AR 16% 328. Huntington-‐Ashland, WV-‐KY-‐OH 16% 329. Kankakee-‐Bradley, IL 16%
29
330. Modesto, CA 16% 331. Fort Smith, AR-‐OK 16% 332. Albany, GA 16% 333. McAllen-‐Edinburg-‐Mission, TX 16% 334. Longview, TX 16% 335. Sumter, SC 16% 336. Yakima, WA 16% 337. Victoria, TX 15% 338. Parkersburg-‐Marietta-‐Vienna, WV-‐OH 15% 339. Madera-‐Chowchilla, CA 15% 340. Goldsboro, NC 15% 341. Farmington, NM 15% 342. Beaumont-‐Port Arthur, TX 15% 343. Bakersfield-‐Delano, CA 15% 344. Decatur, AL 15% 345. Cumberland, MD-‐WV 15% 346. Anniston-‐Oxford, AL 15% 347. Mansfield, OH 15% 348. Danville, VA 15% 349. Steubenville-‐Weirton, OH-‐WV 14% 350. Longview, WA 14% 351. Brownsville-‐Harlingen, TX 14% 352. Morristown, TN 14% 353. Rocky Mount, NC 14% 354. Pine Bluff, AR 14% 355. Yuma, AZ 14% 356. Danville, IL 13% 357. Visalia-‐Porterville, CA 13% 358. El Centro, CA 13% 359. Vineland-‐Millville-‐Bridgeton, NJ 13% 360. Dalton, GA 13% 361. Odessa, TX 13% 362. Houma-‐Bayou Cane-‐Thibodaux, LA 13% 363. Gadsden, AL 13% 364. Lake Havasu City-‐Kingman, AZ 13% 365. Merced, CA 12% 366. Hanford-‐Corcoran, CA 11%