65
BARSTOW COMMUNITY COLLEGE DISTRICT San Bernardino County Barstow, California Report on Audit June 30, 2016
BARSTOWCOMMUNITYCOLLEGEDISTRICT
SanBernardinoCountyBarstow,California
Report on Audit
June 30, 2016
Barstow Community College District June 30, 2016
TABLEOFCONTENTSFINANCIAL SECTION
STATEMENT OF NET POSITION……………………………………………………………………………………………………………………………...9
STATEMENT OF REVENUES, EXPENDITURES, AND CHANGES IN NET POSITION………………………………………………………………..10
STATEMENT OF CASH FLOWS……………………………………………………………………………………………………………………………...11
STATEMENT OF FIDUCIARY NET POSITION……………………………………………………………………………………………………………...12
STATEMENT OF CHANGES IN FIDUCIARY NET POSITION…………....................................................................................…13
NOTES TO FINANCIAL STATEMENTS………………………………………………………………………………………………………………………14
REQUIRED SUPPLEMENTARY INFORMATION
SUPPLEMENTARY INFORMATION
OTHER INDEPENDENT AUDITORS’ REPORTS
SCHEDULE OF FINDINGS AND RESPONSES

FINANCIALSECTION
17072 Silica Drive, Suite 101 * Victorville * California 92395 (760) 241-6376 * Fax (760) 241-2011
messnerandhadley.com
Certified Public Accountants
Paul S. Messner, CPA Cindra J. Hadley, CPA James M. Quinn, CPA, CFE
INDEPENDENT AUDITORS’ REPORT
The Board of Trustees
Barstow Community College District
Barstow, California
REPORT ON THE FINANCIAL STATEMENTS
We have audited the accompanying financial statements of the business‐type activities and the fiduciary
activities of Barstow Community College District (the “District”) as of and for the year ended June 30, 2016, and
the related notes to the financial statements, which collectively comprise the District’s basic financial
statements as listed in the table of contents.
MANAGEMENT’S RESPONSIBILITY FOR THE FINANCIAL STATEMENTS
Management is responsible for the preparation and fair presentation of these financial statements in
accordance with accounting principles generally accepted in the United States of America; this includes the
design, implementation, and maintenance of internal control relevant to the preparation and fair presentation
of financial statements that are free from material misstatement, whether due to fraud or error.
AUDITORS’ RESPONSIBILITY
Our responsibility is to express opinions on these financial statements based on our audit. We conducted our
audit in accordance with auditing standards generally accepted in the United States of America and the
standards applicable to financial audits contained in Government Auditing Standards, issued by the Comptroller
General of the United States. Those standards require that we plan and perform the audit to obtain reasonable
assurance about whether the financial statements are free from material misstatement.
An audit involves performing procedures to obtain audit evidence about the amounts and disclosures in the
financial statements. The procedures selected depend on the auditors’ judgment, including the assessment of
the risks of material misstatement of the financial statements, whether due to fraud or error. In making those
risk assessments, the auditor considers internal control relevant to the entity’s preparation and fair presentation
of the financial statements in order to design audit procedures that are appropriate in the circumstances, but
not for the purpose of expressing an opinion on the effectiveness of the entity’s internal control. Accordingly,
we express no such opinion. An audit also includes evaluating the appropriateness of accounting policies used
and the reasonableness of significant accounting estimates made by management, as well as evaluating the
overall presentation of the financial statements.
2
We believe that the audit evidence we have obtained is sufficient and appropriate to provide a basis for our audit
opinions.
OPINIONS
In our opinion, the financial statements referred to above present fairly, in all material respects, the financial
position of the business‐type activities and the fiduciary activities of Barstow Community College District, as of
June 30, 2016, and the changes in net position and, where applicable, cash flows for the year then ended in
accordance with accounting principles generally accepted in the United States of America.
OTHER MATTERS
Required Supplementary Information
Accounting principles generally accepted in the United States of America require that the required supplementary
information, such as management’s discussion and analysis on pages 4 through 8, the Schedule of Other
Postemployment Benefits (OPEB) Funding Progress on page 37, the Schedule of the District’s Proportionate Share
of the Net Pension Liability on page 38, and the Schedule of the District’s Pension Contributions on page 39 be
presented to supplement the basic financial statements. Such information, although not a part of the basic
financial statements, is required by the Governmental Accounting Standards Board who considers it to be an
essential part of financial reporting for placing the basic financial statements in an appropriate operational,
economic, or historical context. We have applied certain limited procedures to the required supplementary
information in accordance with auditing standards generally accepted in the United States of America, which
consisted of inquiries of management about the methods of preparing the information and comparing the
information for consistency with management’s responses to our inquiries, the basic financial statements, and
other knowledge we obtained during our audit of the basic financial statements. We do not express an opinion
or provide any assurance on the information because the limited procedures do not provide us with sufficient
evidence to express an opinion or provide any assurance.
Supplementary Information
Our audit was conducted for the purpose of forming opinions on the financial statements that collectively
comprise the District’s basic financial statements. The supplementary information listed in the Table of Contents,
including the Schedule of Expenditures of Federal Awards, as required by Title 2 U.S. Code of Federal Regulations
Part 200, Uniform Administrative Requirements, Cost Principles and Audit Requirements for Federal Awards
(Uniform Guidance), is presented for purposes of additional analysis and is not a required part of the basic financial
statements.
The supplementary information, including the Schedule of Expenditures of Federal Awards, is the responsibility of
management and was derived from and relates directly to the underlying accounting and other records used to
prepare the basic financial statements. Such information has been subjected to the auditing procedures applied
in the audit of the basic financial statements and certain additional procedures, including comparing and
reconciling such information directly to the underlying accounting and other records used to prepare the basic
financial statements or to the basic financial statements themselves, and other additional procedures in
accordance with auditing standards generally accepted in the United States of America. In our opinion, the
supplementary information is fairly stated, in all material respects, in relation to the basic financial statements as
a whole.
3
OTHER REPORTING REQUIRED BY GOVERNMENT AUDITING STANDARDS
In accordance with Government Auditing Standards, we have also issued our report, dated December 30, 2016,
on our consideration of Barstow Community College District’s internal control over financial reporting and on our
tests of its compliance with certain provisions of laws, regulations, contracts, and grant agreements and other
matters. The purpose of that report is to describe the scope of our testing of internal control over financial
reporting and compliance and the results of that testing, and not to provide an opinion on internal control over
financial reporting or on compliance. That report is an integral part of an audit performed in accordance with
Government Auditing Standards in considering the District’s internal control over financial reporting and
compliance.
Messner & Hadley, LLP
Certified Public Accountants
Victorville, California
December 30, 2016
Barstow Community College District Management’s Discussion and Analysis June 30, 2016
4
MANAGEMENT’SDISCUSSIONANDANALYSISThe purpose of this annual report is to provide readers with information about the activities, programs, and
financial condition of Barstow Community College District (the “District”) as of June 30, 2016. The report consists
of three basic financial statements: the Statement of Net Position; Statement of Revenues, Expenses, and Changes
in Net Position; and Statement of Cash Flows and provides information about the District as a whole. This section
of the annual financial report presents our discussion and analysis of the District’s financial performance during
the fiscal year ended June 30, 2016. Please read it in conjunction with the District’s financial statements, which
immediately follow this section. Responsibility for the completeness and accuracy of this information rests with
the District management.
OVERVIEW OF THE FINANCIAL STATEMENTS
Barstow Community College District’s financial statements are presented in accordance with Governmental
Accounting Standards Board Statements (GASB) No. 34, Basic Financial Statements – and Management’s
Discussion and Analysis – for State and Local Governments, and No. 35, Basic Financial Statements – and
Management’s Discussion and Analysis – for Public Colleges and Universities. These statements allow for the
presentation of financial activity and results of operations which focuses on the District as a whole. The entity‐
wide financial statements present the overall results of operations whereby all of the District’s activities are
consolidated into one total versus the traditional presentation by fund type. The focus of the Statement of Net
Position is designed to be similar to the bottom line results of the District. This statement combines and
consolidates current financial resources with capital assets and long‐term obligations. The Statement of
Revenues, Expenses, and Changes in Net Position focuses on the costs of the District’s operational activities with
revenue and expenses categorized as operating and non‐operating, and expenses are reported by natural
classification. The Statement of Cash Flows provides an analysis of the sources and uses of cash within the
operations of the District.
The California Community College Chancellor’s Office has recommended that all State community colleges follow
the Business‐Type Activity (BTA) model for financial statement reporting purposes.
Financial Highlights Of The Past Year
The District’s primary funding source is from apportionment received from the State of California. The
primary basis of this apportionment is the calculation of Full‐Time Equivalent Students (FTES). During the
2015‐2016 fiscal year, total reported resident FTES were 2,497 as compared to 2,582 in the 2014‐2015
fiscal year.
The Statement of Revenues, Expenses, and Changes in Net Position once again reflects a positive year due
to increased state apportionments. Operating revenues decreased by $153,368, while operating
expenses increased by $37,410. Non‐operating revenues increased by $4,290,917. Other revenues, which
consist primarily of state apportionments for capital projects, were down $1,323,430.
During the 2015‐2016 fiscal year, the District provided over $7.6 million in federal and state financial aid
to students attending the college.
Barstow Community College District Management’s Discussion and Analysis June 30, 2016
5
FINANCIAL ANALYSIS OF THE DISTRICT AS A WHOLE
Net Position
The Statement of Net Position presents the assets, liabilities and net position of the District as of the end of the
fiscal year and is prepared using the accrual basis of accounting, which is similar to the accounting basis used by
most private sector organizations.
The difference between total assets and total liabilities is one indicator of the current financial condition of the
District; the change in net position is an indicator of whether the overall financial condition has improved or
worsened during the year. Assets and liabilities are generally measured using current values. One notable
exception is capital assets, which are stated at historical cost less accumulated depreciation.
The Net Position is divided into three major categories. The first category, net investment in capital assets,
provides the equity amount in property, plant and equipment owned by the District. The second category is
expendable restricted net assets. These net assets are available for expenditure by the District, but must be spent
for purposes as determined by external entities, legislation and/or donors that have placed time or purpose
restrictions on the use of the assets. The final category is unrestricted and is available to the District for any lawful
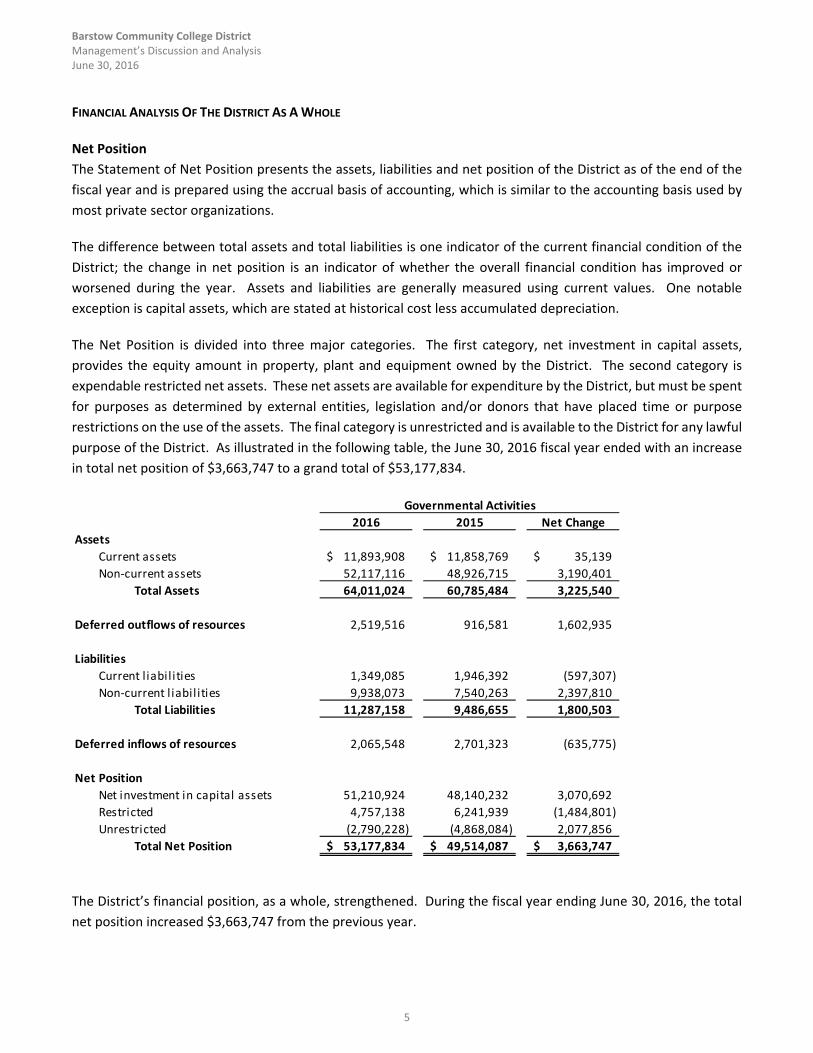
purpose of the District. As illustrated in the following table, the June 30, 2016 fiscal year ended with an increase
in total net position of $3,663,747 to a grand total of $53,177,834.
2016 2015 Net Change
Assets
Current assets 11,893,908$ 11,858,769$ 35,139$
Non‐current assets 52,117,116 48,926,715 3,190,401
Total Assets 64,011,024 60,785,484 3,225,540
Deferred outflows of resources 2,519,516 916,581 1,602,935
Liabilities
Current l iabil ities 1,349,085 1,946,392 (597,307)
Non‐current l iabil ities 9,938,073 7,540,263 2,397,810
Total Liabilities 11,287,158 9,486,655 1,800,503
Deferred inflows of resources 2,065,548 2,701,323 (635,775)
Net Position
Net investment in capital assets 51,210,924 48,140,232 3,070,692
Restricted 4,757,138 6,241,939 (1,484,801)
Unrestricted (2,790,228) (4,868,084) 2,077,856
Total Net Position 53,177,834$ 49,514,087$ 3,663,747$
Governmental Activities
The District’s financial position, as a whole, strengthened. During the fiscal year ending June 30, 2016, the total
net position increased $3,663,747 from the previous year.
Barstow Community College District Management’s Discussion and Analysis June 30, 2016
6
Change in Net Position
The change in total net position presented on the Statement of Net Position is based on the activity presented in
the Statement of Revenues, Expenses and Changes in Net Position. The purpose of this statement is to present
the operating and non‐operating revenues earned (whether received or not) by the District, the operating and
non‐operating expenses incurred (whether paid or not) by the District, and any other revenues, expenses, gains
and/or losses earned or incurred by the District.
Operating activities are those in which a direct payment or exchange is made for the receipt of specified goods or
services. As an example, tuition fees paid by the student are considered an exchange for instructional services.
This activity is considered an operating activity. The receipt of State apportionments and property taxes do not
include this exchange relationship between payment and receipt of goods or services. These revenues and related
expenses are classified as non‐operating activities.
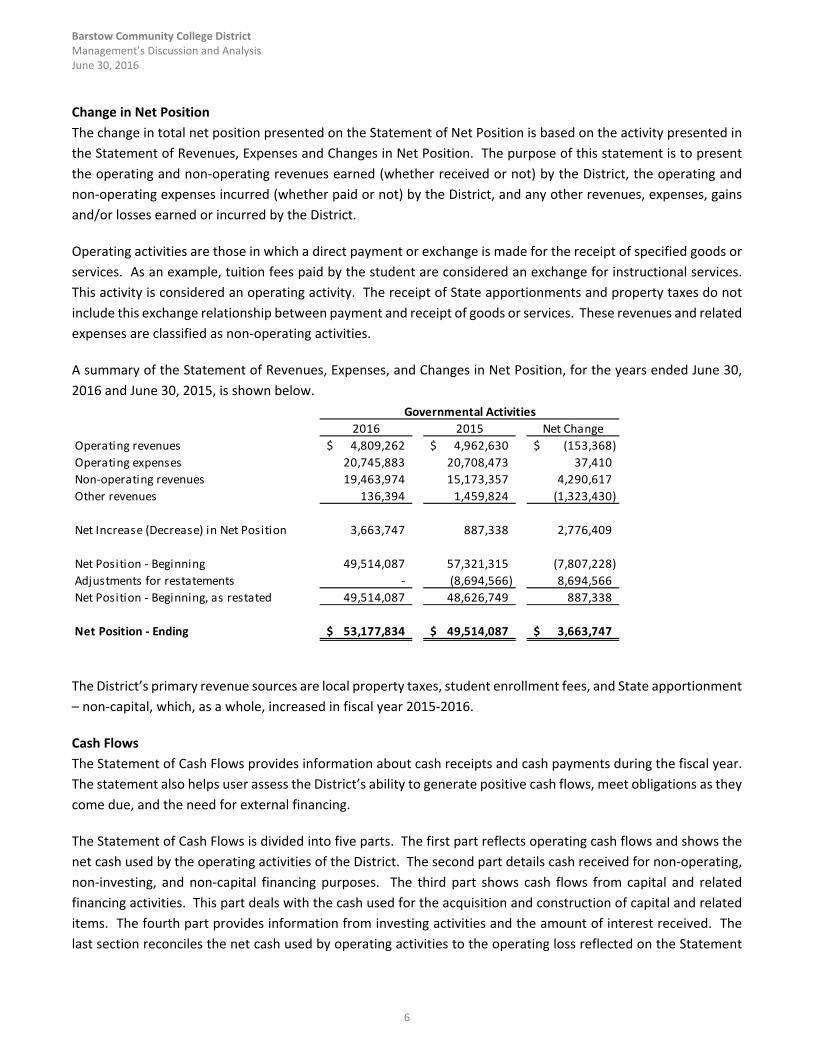
A summary of the Statement of Revenues, Expenses, and Changes in Net Position, for the years ended June 30,
2016 and June 30, 2015, is shown below.
2016 2015 Net Change
Operating revenues 4,809,262$ 4,962,630$ (153,368)$
Operating expenses 20,745,883 20,708,473 37,410
Non‐operating revenues 19,463,974 15,173,357 4,290,617
Other revenues 136,394 1,459,824 (1,323,430)
Net Increase (Decrease) in Net Position 3,663,747 887,338 2,776,409
Net Position ‐ Beginning 49,514,087 57,321,315 (7,807,228)
Adjustments for restatements ‐ (8,694,566) 8,694,566
Net Position ‐ Beginning, as restated 49,514,087 48,626,749 887,338
Net Position ‐ Ending 53,177,834$ 49,514,087$ 3,663,747$
Governmental Activities
The District’s primary revenue sources are local property taxes, student enrollment fees, and State apportionment
– non‐capital, which, as a whole, increased in fiscal year 2015‐2016.
Cash Flows
The Statement of Cash Flows provides information about cash receipts and cash payments during the fiscal year.
The statement also helps user assess the District’s ability to generate positive cash flows, meet obligations as they
come due, and the need for external financing.
The Statement of Cash Flows is divided into five parts. The first part reflects operating cash flows and shows the
net cash used by the operating activities of the District. The second part details cash received for non‐operating,
non‐investing, and non‐capital financing purposes. The third part shows cash flows from capital and related
financing activities. This part deals with the cash used for the acquisition and construction of capital and related
items. The fourth part provides information from investing activities and the amount of interest received. The
last section reconciles the net cash used by operating activities to the operating loss reflected on the Statement
Barstow Community College District Management’s Discussion and Analysis June 30, 2016
7
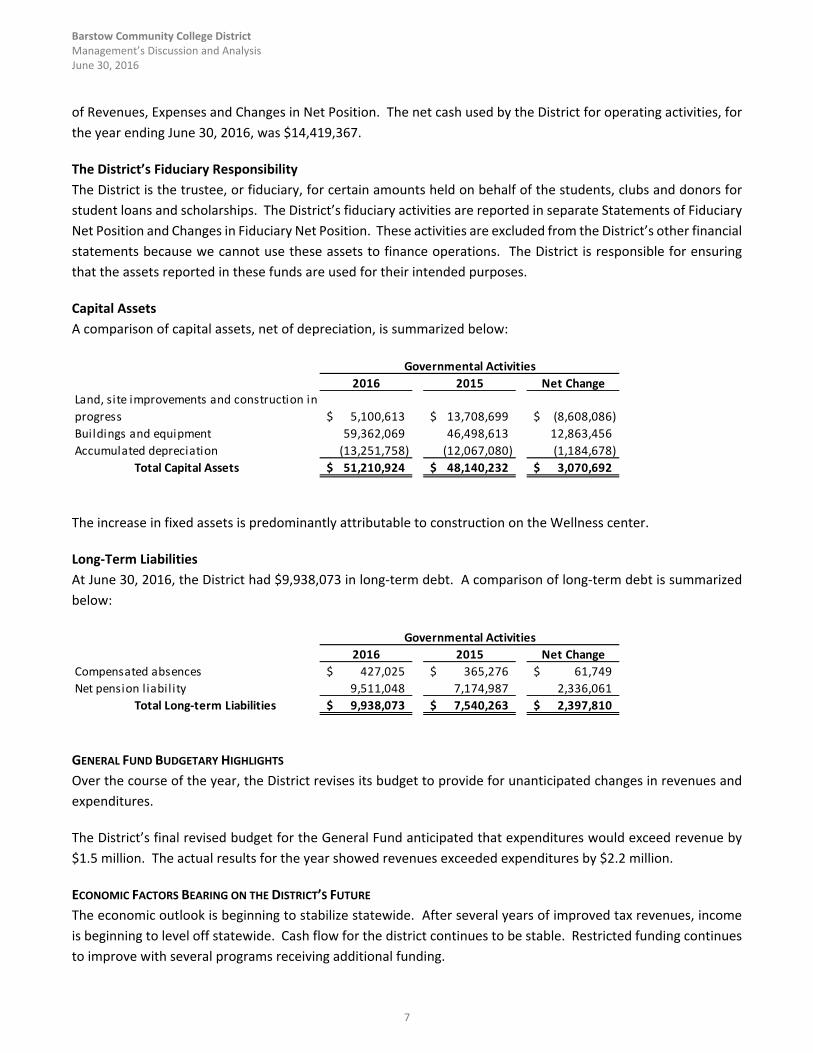
of Revenues, Expenses and Changes in Net Position. The net cash used by the District for operating activities, for
the year ending June 30, 2016, was $14,419,367.
The District’s Fiduciary Responsibility
The District is the trustee, or fiduciary, for certain amounts held on behalf of the students, clubs and donors for
student loans and scholarships. The District’s fiduciary activities are reported in separate Statements of Fiduciary
Net Position and Changes in Fiduciary Net Position. These activities are excluded from the District’s other financial
statements because we cannot use these assets to finance operations. The District is responsible for ensuring
that the assets reported in these funds are used for their intended purposes.
Capital Assets
A comparison of capital assets, net of depreciation, is summarized below:
2016 2015 Net ChangeLand, site improvements and construction in
progress 5,100,613$ 13,708,699$ (8,608,086)$
Buildings and equipment 59,362,069 46,498,613 12,863,456
Accumulated depreciation (13,251,758) (12,067,080) (1,184,678)
Total Capital Assets 51,210,924$ 48,140,232$ 3,070,692$
Governmental Activities
The increase in fixed assets is predominantly attributable to construction on the Wellness center.
Long‐Term Liabilities
At June 30, 2016, the District had $9,938,073 in long‐term debt. A comparison of long‐term debt is summarized
below:
2016 2015 Net Change
Compensated absences 427,025$ 365,276$ 61,749$
Net pension l iabil ity 9,511,048 7,174,987 2,336,061
Total Long‐term Liabilities 9,938,073$ 7,540,263$ 2,397,810$
Governmental Activities
GENERAL FUND BUDGETARY HIGHLIGHTS
Over the course of the year, the District revises its budget to provide for unanticipated changes in revenues and
expenditures.
The District’s final revised budget for the General Fund anticipated that expenditures would exceed revenue by
$1.5 million. The actual results for the year showed revenues exceeded expenditures by $2.2 million.
ECONOMIC FACTORS BEARING ON THE DISTRICT’S FUTURE
The economic outlook is beginning to stabilize statewide. After several years of improved tax revenues, income
is beginning to level off statewide. Cash flow for the district continues to be stable. Restricted funding continues
to improve with several programs receiving additional funding.
Barstow Community College District Management’s Discussion and Analysis June 30, 2016
8
CONTACTING THE DISTRICT’S FINANCIAL MANAGEMENT
This financial report is designed to provide our citizens, taxpayers, and creditors with a general overview of the
District’s finances and to demonstrate the District’s accountability for the money it receives. If you have any
questions about this report or need additional financial information, contact the District’s Office of Business
Services, Barstow Community College, 2700 Barstow Road, Barstow, California 92311‐6608.
BASICFINANCIALSTATEMENTS
The accompanying notes are an integral part of these financial statements
9
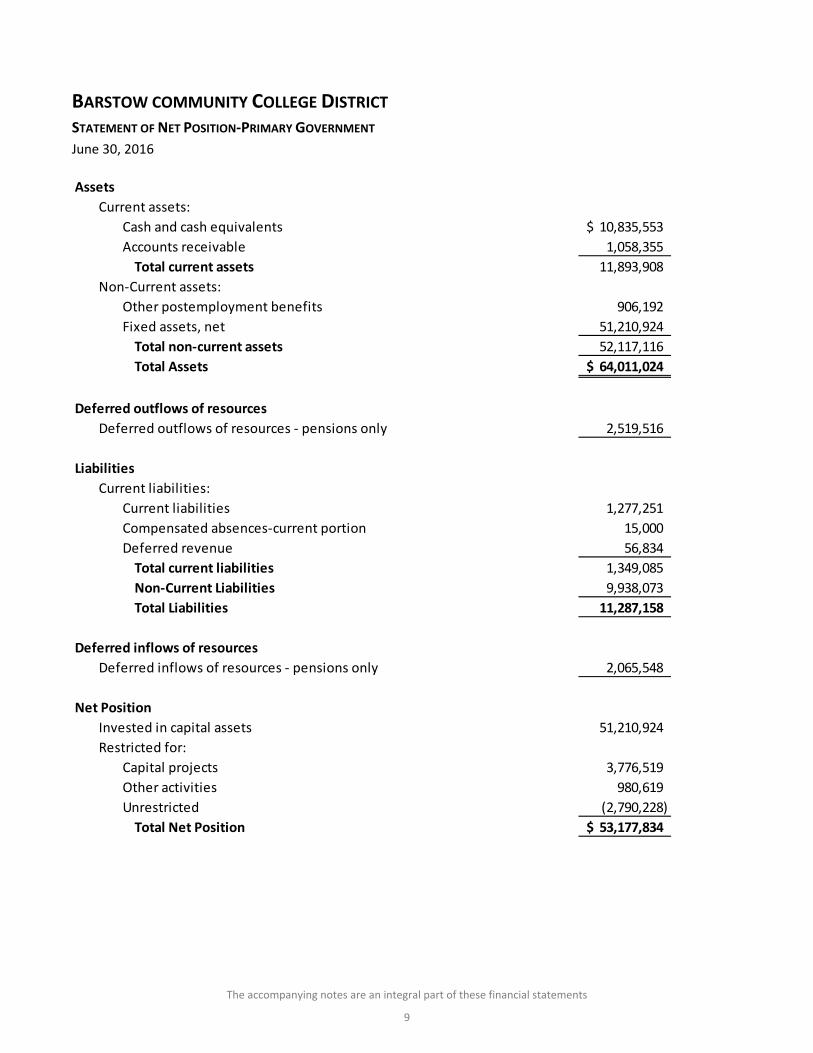
BARSTOW COMMUNITY COLLEGE DISTRICT STATEMENT OF NET POSITION‐PRIMARY GOVERNMENT
June 30, 2016
Assets
Current assets:
Cash and cash equivalents 10,835,553$
Accounts receivable 1,058,355
Total current assets 11,893,908
Non‐Current assets:
Other postemployment benefits 906,192
Fixed assets, net 51,210,924
Total non‐current assets 52,117,116
Total Assets 64,011,024$
Deferred outflows of resources
Deferred outflows of resources ‐ pensions only 2,519,516
Liabilities
Current liabilities:
Current liabilities 1,277,251
Compensated absences‐current portion 15,000
Deferred revenue 56,834
Total current liabilities 1,349,085
Non‐Current Liabilities 9,938,073
Total Liabilities 11,287,158
Deferred inflows of resources
Deferred inflows of resources ‐ pensions only 2,065,548
Net Position
Invested in capital assets 51,210,924
Restricted for:
Capital projects 3,776,519
Other activities 980,619
Unrestricted (2,790,228)
Total Net Position 53,177,834$
The accompanying notes are an integral part of these financial statements
10
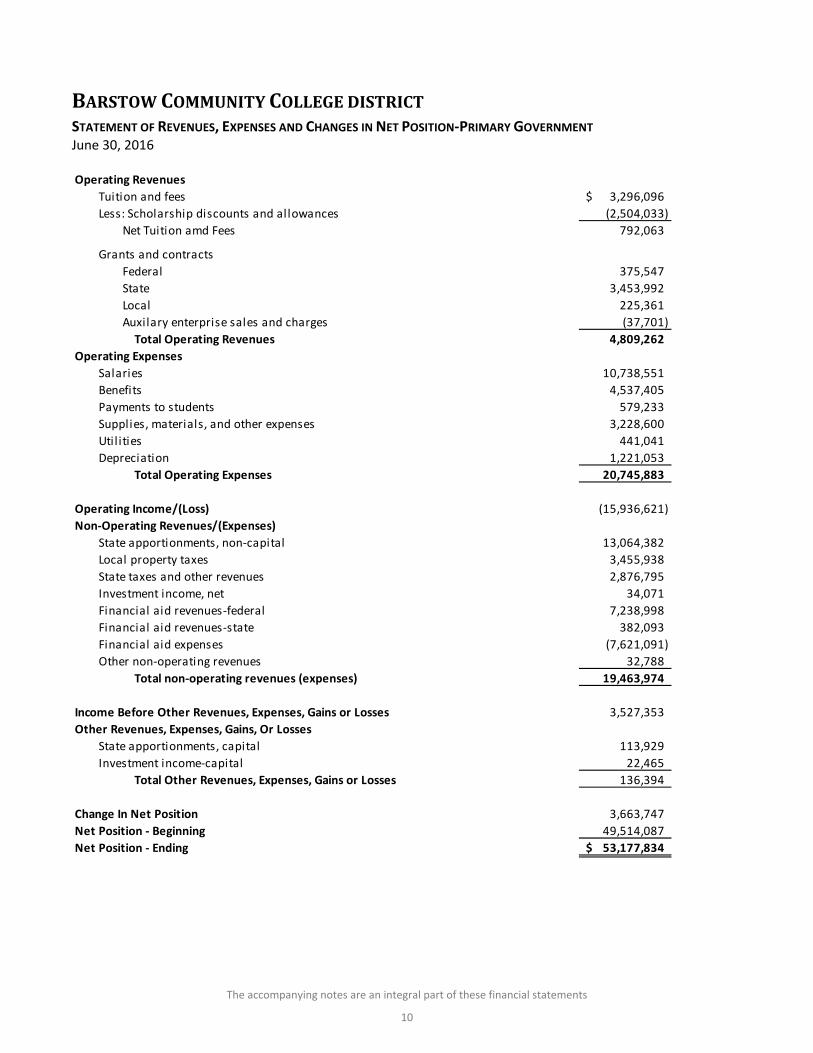
BARSTOWCOMMUNITYCOLLEGEDISTRICTSTATEMENT OF REVENUES, EXPENSES AND CHANGES IN NET POSITION‐PRIMARY GOVERNMENT June 30, 2016
Operating Revenues
Tuition and fees 3,296,096$
Less: Scholarship discounts and allowances (2,504,033)
Net Tuition amd Fees 792,063
Grants and contracts
Federal 375,547
State 3,453,992
Local 225,361
Auxilary enterprise sales and charges (37,701)
Total Operating Revenues 4,809,262
Operating Expenses
Salaries 10,738,551
Benefits 4,537,405
Payments to students 579,233
Supplies, materials, and other expenses 3,228,600
Util ities 441,041
Depreciation 1,221,053
Total Operating Expenses 20,745,883
Operating Income/(Loss) (15,936,621)
Non‐Operating Revenues/(Expenses)
State apportionments, non‐capital 13,064,382
Local property taxes 3,455,938
State taxes and other revenues 2,876,795
Investment income, net 34,071
Financial aid revenues‐federal 7,238,998
Financial aid revenues‐state 382,093
Financial aid expenses (7,621,091)
Other non‐operating revenues 32,788
Total non‐operating revenues (expenses) 19,463,974
Income Before Other Revenues, Expenses, Gains or Losses 3,527,353
Other Revenues, Expenses, Gains, Or Losses
State apportionments, capital 113,929
Investment income‐capital 22,465
Total Other Revenues, Expenses, Gains or Losses 136,394
Change In Net Position 3,663,747
Net Position ‐ Beginning 49,514,087
Net Position ‐ Ending 53,177,834$
The accompanying notes are an integral part of these financial statements
11
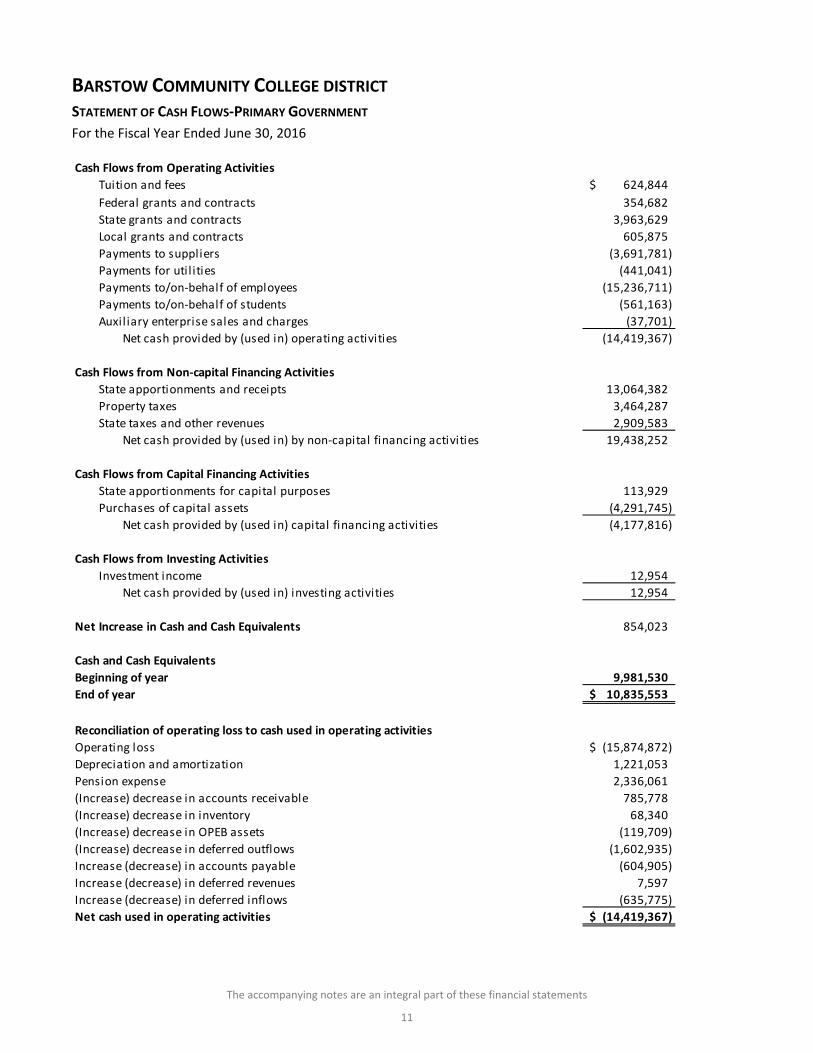
BARSTOW COMMUNITY COLLEGE DISTRICT STATEMENT OF CASH FLOWS‐PRIMARY GOVERNMENT
For the Fiscal Year Ended June 30, 2016
Cash Flows from Operating Activities
Tuition and fees 624,844$
Federal grants and contracts 354,682
State grants and contracts 3,963,629
Local grants and contracts 605,875
Payments to suppliers (3,691,781)
Payments for util ities (441,041)
Payments to/on‐behalf of employees (15,236,711)
Payments to/on‐behalf of students (561,163)
Auxiliary enterprise sales and charges (37,701)
Net cash provided by (used in) operating activities (14,419,367)
Cash Flows from Non‐capital Financing Activities
State apportionments and receipts 13,064,382
Property taxes 3,464,287
State taxes and other revenues 2,909,583
Net cash provided by (used in) by non‐capital financing activities 19,438,252
Cash Flows from Capital Financing Activities
State apportionments for capital purposes 113,929
Purchases of capital assets (4,291,745)
Net cash provided by (used in) capital financing activities (4,177,816)
Cash Flows from Investing Activities
Investment income 12,954
Net cash provided by (used in) investing activities 12,954
Net Increase in Cash and Cash Equivalents 854,023
Cash and Cash Equivalents
Beginning of year 9,981,530
End of year 10,835,553$
Reconciliation of operating loss to cash used in operating activities
Operating loss (15,874,872)$
Depreciation and amortization 1,221,053
Pension expense 2,336,061
(Increase) decrease in accounts receivable 785,778
(Increase) decrease in inventory 68,340
(Increase) decrease in OPEB assets (119,709)
(Increase) decrease in deferred outflows (1,602,935)
Increase (decrease) in accounts payable (604,905)
Increase (decrease) in deferred revenues 7,597
Increase (decrease) in deferred inflows (635,775)
Net cash used in operating activities (14,419,367)$
The accompanying notes are an integral part of these financial statements
12
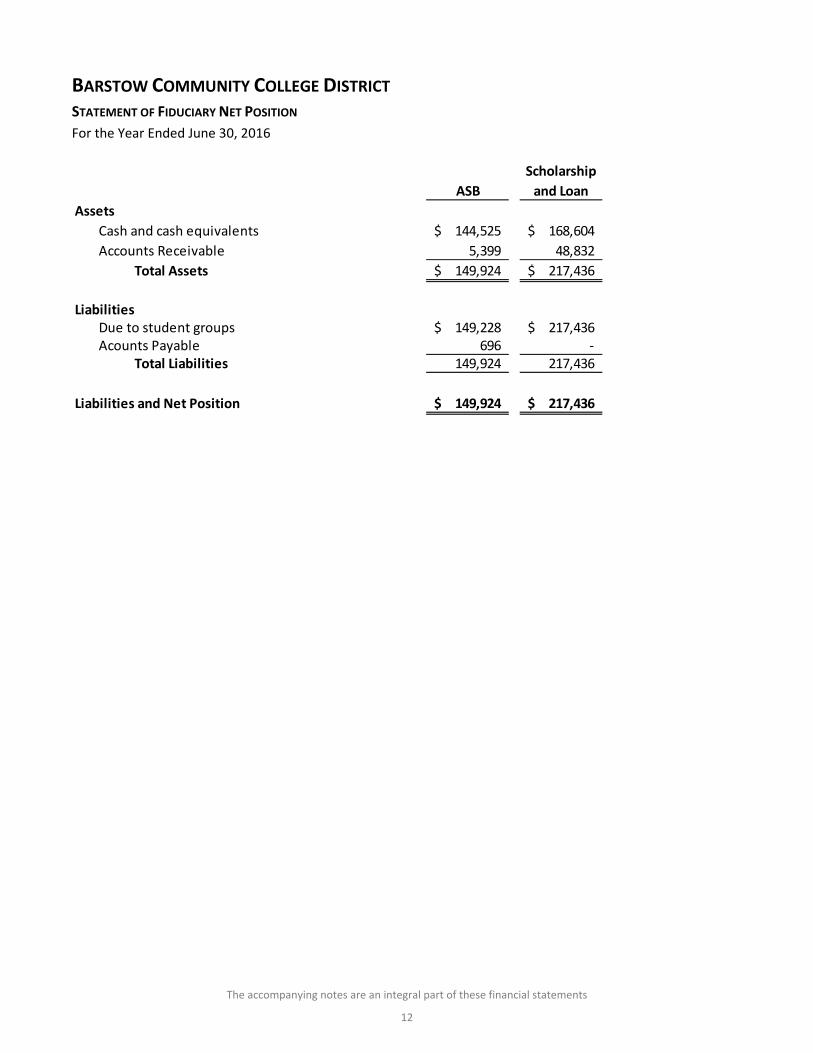
BARSTOW COMMUNITY COLLEGE DISTRICT STATEMENT OF FIDUCIARY NET POSITION
For the Year Ended June 30, 2016
Scholarship
ASB and Loan
Assets
Cash and cash equivalents 144,525$ 168,604$
Accounts Receivable 5,399 48,832
Total Assets 149,924$ 217,436$
LiabilitiesDue to student groups 149,228$ 217,436$ Acounts Payable 696 ‐
Total Liabilities 149,924 217,436
Liabilities and Net Position 149,924$ 217,436$
13
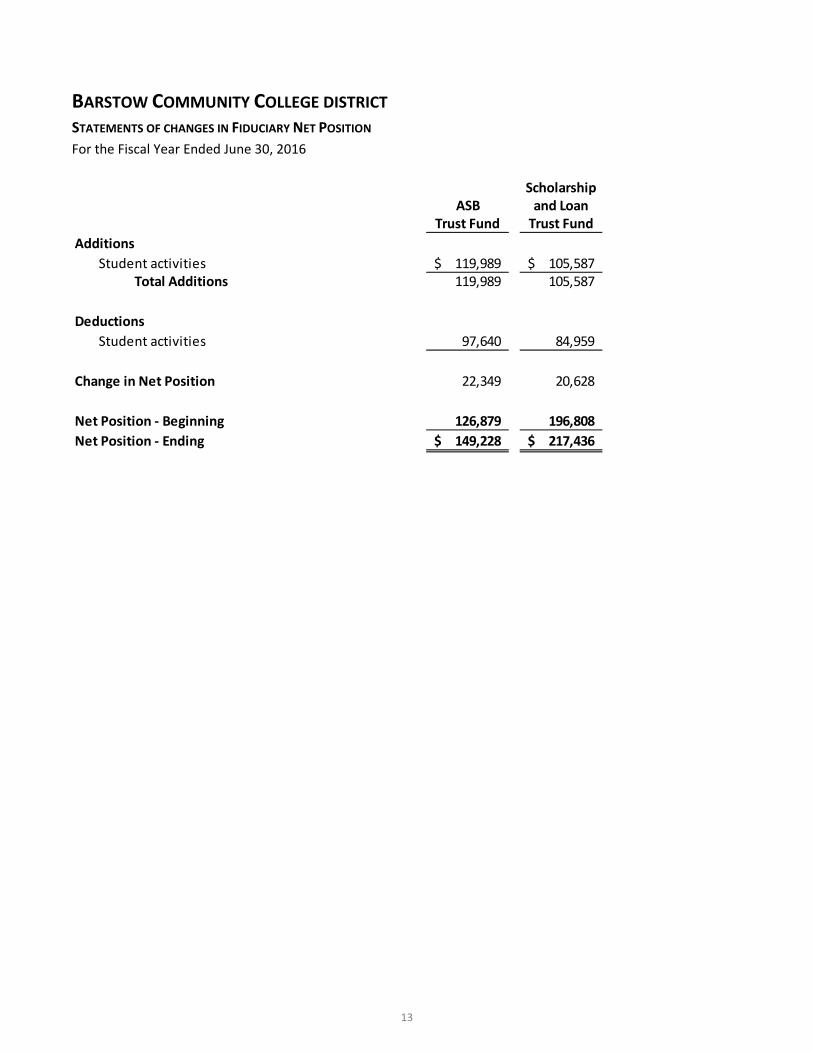
BARSTOW COMMUNITY COLLEGE DISTRICT STATEMENTS OF CHANGES IN FIDUCIARY NET POSITION
For the Fiscal Year Ended June 30, 2016
ScholarshipASB and Loan
Trust Fund Trust Fund
Additions
Student activities 119,989$ 105,587$ Total Additions 119,989 105,587
Deductions
Student activities 97,640 84,959
Change in Net Position 22,349 20,628
Net Position ‐ Beginning 126,879 196,808
Net Position ‐ Ending 149,228$ 217,436$
Barstow Community College District Notes to Financial Statement June 30, 2016
14
NOTE 1 – ORGANIZATION
Barstow Community College District (the “District”) is a political subdivision of the State of California and provides
educational services to the local residents of the surrounding area. The District consists of one community college
located in Barstow, California.
NOTE 2 – SUMMARY OF SIGNIFICANT ACCOUNTING POLICIES
Financial Reporting Entity
While the District is a political subdivision of the State, it is not a component unit of the State in accordance with
the provisions of Governmental Accounting Standards Board (“GASB”) Codification Section (Cod. Sec.) 2100.101.
The District is classified as a state instrumentality under Internal Revenue Code Section 115.
The decision to include potential component units in the reporting entity was made by applying the criteria set
forth in generally accepted accounting principles (GAAP) and GASB Cod. Sec. 2100.101 as amended by GASB Cod.
Sec. 2100.138. The three criteria for requiring a legally separate, tax‐exempt organization to be presented as a
component unit are the “direct benefit” criterion, the “entitlement/ability to access” criterion, and the
“significance” criterion. As defined by accounting principles generally accepted in the United States of America
and established by the Governmental Accounting Standards Board, the financial reporting entity consists of the
primary government, the District.
Basis of Presentation and Basis of Accounting
For financial reporting purposes, the District is considered a special‐purpose government engaged only in
business‐type activities as defined by GASB. Under this model, the District’s financial statements provide a
comprehensive entity‐wide perspective of the District’s financial position and activities. Accordingly, the District’s
financial statements have been presented using the economic resources measurement focus and the accrual basis
of accounting. Under the accrual basis, revenues are recognized when earned and expenses are recorded when
the obligation has been incurred. All significant intra‐agency transactions have been eliminated.
Fiduciary funds for which the District acts only as an agent or trust are not included in the business‐type activities
of the District. These funds are reported in the Statement of Fiduciary Net Position and Statement of Changes in
Fiduciary Net Position at the fund financial statement level.
Cash and Cash Equivalents
The District’s cash and cash equivalents are considered to be cash on hand, demand deposits, and short‐term
investments with original maturities of three months or less from the date of acquisition. Cash equivalents also
include unrestricted cash with county treasury balances for purposes of the Statement of Cash Flows. Restricted
cash and cash equivalents represent balances restricted by external sources such as grants and contracts or
specifically restricted for the repayment of capital debt.
Investments
The District records its investment in San Bernardino County Treasury at fair value. Changes in fair value are
reported as revenue in the Statement of Revenues, Expenses and Changes in Net Position. The fair value of
investments, at June 30, 2016, approximated their carrying value.
Barstow Community College District Notes to Financial Statement June 30, 2016
15
NOTE 2 – SUMMARY OF SIGNIFICANT ACCOUNTING POLICIES (CONTINUED)
Restricted Assets
Restricted assets arise when restrictions on their use change the normal understanding of the availability of the
asset. Such constraints are either imposed by creditors, contributors, grantors, or laws of other governments or
imposed by enabling legislation. Restricted assets are classified on the Statement of Net Position because their
use is limited by enabling legislation, applicable bond covenants, and other laws of other governments. Also,
resources have been set aside to satisfy certain requirements of the bonded debt issuance and to fund certain
capital asset projects.
Accounts Receivable
Accounts receivable consists primarily of amounts due from the Federal, State and/or local governments, or
private sources, in connection with reimbursement of allowable expenditures made pursuant to the District’s
grants and contracts. Accounts receivable are recorded net of estimated uncollectible amounts. The District
recognized for budgetary and financial reporting purposes any amount of State appropriations deferred from the
current fiscal year and appropriated from the subsequent fiscal year for payment of current year costs as a
receivable in the current year.
Prepaid Expenses
Prepaid expenses represent payments made to vendors and others for services that will benefit periods beyond
June 30.
Inventories
Inventories consist primarily of cafeteria food and supplies held for resale to the students and faculty of the
college. Inventories are stated at cost, utilizing the weighted average method. The cost is recorded as an expense
as the inventory is consumed.
Capital Assets and Depreciation
Capital assets are recorded at cost at the date of acquisition. Donated capital assets are recorded at their
estimated fair value at the date of donation. For equipment, the District’s capitalization policy includes all items
with a unit cost of $5,000 or more and an estimated useful life of greater than one year. Buildings, as well as
renovations to buildings, infrastructures, and land improvements, that significantly increase the value or extend
the useful life of the structure are capitalized.
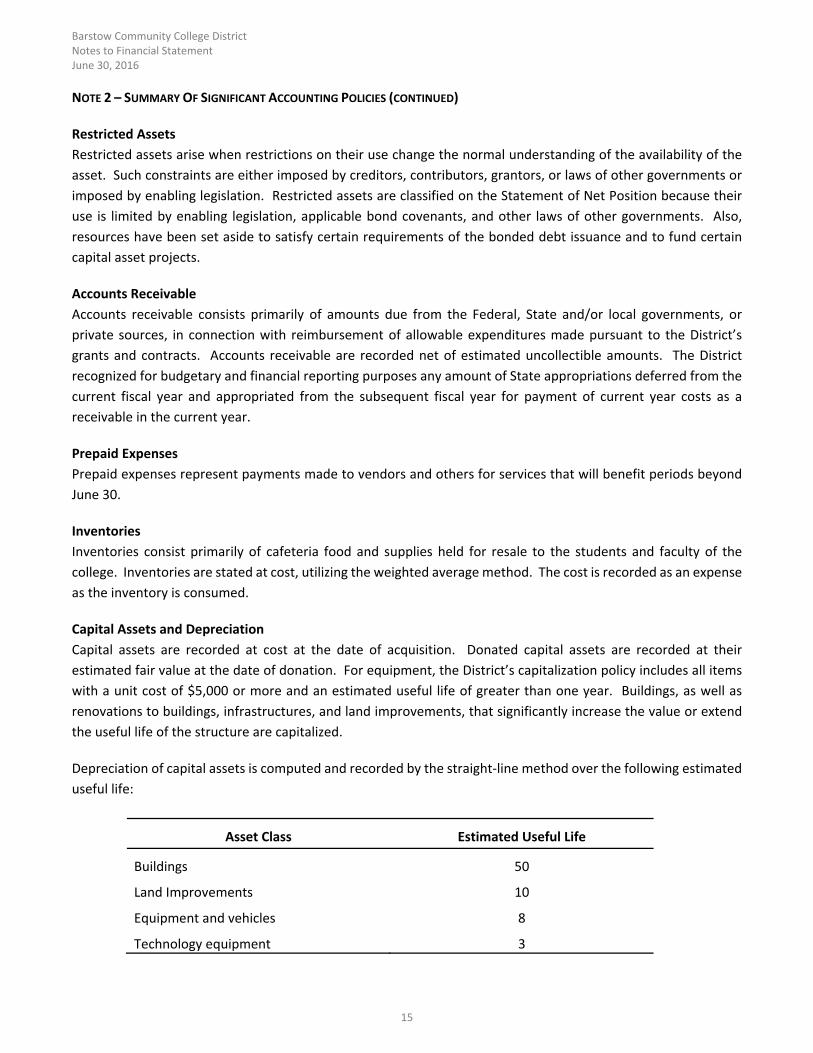
Depreciation of capital assets is computed and recorded by the straight‐line method over the following estimated
useful life:
Asset Class Estimated Useful Life
Buildings 50
Land Improvements 10
Equipment and vehicles 8
Technology equipment 3
Barstow Community College District Notes to Financial Statement June 30, 2016
16
NOTE 2 – SUMMARY OF SIGNIFICANT ACCOUNTING POLICIES (CONTINUED)
Deferred Outflows/Inflows of Resources
In addition to assets, the Statement of Net Position will sometimes report a separate section for deferred outflows
of resources. This separate financial statement element, deferred outflows of resources, represents a
consumption of net position that applies to a future period and so will not be recognized as an outflow of resources
(expense/expenditure) until then. The District has one item that qualifies for reporting in this category. The item
is related to pensions reported in the District‐wide Statement of Net Position. This represents the effects of the
net change in the District’s proportion of the collective net pension asset or liability and difference during the
measurement period between the District’s contributions and its proportionate share of total contributions to the
pension systems not included in pension expense. Lastly is the District contributions to the pension systems (PERS
and STRS) subsequent to the measurement date.
In addition to liabilities, the Statement of Net Position will sometimes report a separate section for deferred
inflows of resources. This separate financial statement element, deferred inflows of resources, represents an
acquisition of net position that applies to a future period(s) and will not be recognized as an inflow of resources
(revenue) until that time. The District has one item that qualifies for reporting in this category. The item is related
to pensions reported in the District‐wide Statement of Net Position. This represents the effect of the net change
in the District’s proportion of the collective net pension liability and difference during the measurement periods
between the District’s contributions and its proportionate share of total contributions to the pension systems not
included in pension expense.
Compensated Absences
Accumulated unpaid employee vacation benefits are recognized as a liability of the District as compensated
absences in the Statement of Net Position. The District has accrued a liability for the amounts attributable to load
banking hours within accrued liabilities. Load banking hours consist of hours worked by instructors in excess of
full‐time load which they may carryover for future paid time off.
Sick leave benefits are accumulated without limit for each employee. Accumulated employee sick leave benefits
are not recognized as a liability of the District. The District’s policy is to record sick leave as an operating expense
in the period taken since such benefits do not vest nor is payment probable; however, unused sick leave is added
to the creditable service period for calculation of retirement benefits when the employee retires and within the
constraints of the appropriate retirement systems.
Accrued Liabilities and Long‐Term Obligations
All payables, accrued liabilities, and long‐term obligations are reported in the entity‐wide financial statements.
Unearned Revenue
Tuition and fees received prior to June 30 for classes and programs offered in the subsequent fiscal year are
reported as unearned revenue. Cash received for Federal and State special projects and programs is recognized
as revenue to the extent that qualified expenditures have been incurred. Unearned revenue is recorded to the
extent that cash received on specific projects and programs exceeds qualified expenditures.
Barstow Community College District Notes to Financial Statement June 30, 2016
17
NOTE 2 – SUMMARY OF SIGNIFICANT ACCOUNTING POLICIES (CONTINUED)
Noncurrent Liabilities
Noncurrent liabilities include bonds and notes payable, compensated absences, and OPEB obligations with
maturities greater than one year.
Pensions
For purposes of measuring the net pension liability, deferred outflows of resources and deferred inflows of
resources related to pensions and pension expense, information about the fiduciary net position of the Public
Employees Retirement Plan (PERS) and the State Teachers Retirement Plan (STRS) and additions to/deductions
from PERS and STRS’ fiduciary net position have been determined on the same basis as they are reported by PERS
and STRS. For this purpose, benefit payments (including refunds of employee contributions) are recognized when
due and payable in accordance with benefit terms. Investments are reported at fair value.
Net Position
GASB Statements No. 34 and No. 35 report equity as “Net Position” and represents the difference between assets
and liabilities. The net position is classified according to imposed restrictions or availability of assets for
satisfaction of District obligations according to the following categories:
Invested in capital assets, net of related debt – This represents the District’s total investment in capital
assets, net of associated outstanding debt obligations related to those capital assets. To the extent debt
has been incurred but not yet expended for capital assets, such amounts are not included as a component
of invested in capital assets, net of related debt.
Restricted – Net position is reported as restricted when there are limitations imposed on their use, either
through enabling legislation adopted by the District, or through external restrictions imposed by creditors,
grantors, or laws or regulations of other governments. The District first applies restricted resources when
an expense in incurred for purposes for which both restricted and unrestricted resources are available.
Unrestricted – Net position that is not subject to externally imposed constraints. Unrestricted net position
may be designated for specific purposes by action of the Board of Trustees or may otherwise be limited
by contractual agreements with outside parties.
When both restricted and unrestricted resources are available for use, it is the District’s practice to use restricted
resources first and the unrestricted resources when they are needed.
State Apportionments
Certain current year apportionments from the State are based on various financial and statistical information of
the previous year. Any prior year corrections due to a recalculation will be recorded in the year computed by the
State.
Barstow Community College District Notes to Financial Statement June 30, 2016
18
NOTE 2 – SUMMARY OF SIGNIFICANT ACCOUNTING POLICIES (CONTINUED)
Property Taxes
Secured property taxes attach as an enforceable lien on property as of March 1. Taxes are payable in two
installments on November 15 and March 15. Unsecured property taxes are payable in one installment on or
before August 31. The District reports real and personal property tax revenues in the same manner in which the
County auditor records and reports actual property tax receipts to the Department of Education. This is generally
on a cash basis. A receivable has been accrued in these financial statements to reflect the amount of property
taxes receivable as of June 30, 2016.
Board of Governors Grants (BOGG) and Fee Waivers
Student tuition and fee revenues and certain other revenues are reported, net of allowances and fee waivers
approved by the Board of Governors through BOGG fee waivers in the statement of revenues, expenses and
changes in net position. Scholarship discounts and allowances are the difference between the stated charge for
goods, and the goods and services provided by the District and the amount that is paid by students and/or third
parties making payments on the students’ behalf. To the extent that fee waivers have been used to satisfy tuition
and fee charges, the District has recorded a scholarship discount and allowance.
Federal Financial Assistance Program
The District participates in federally funded Pell Grants, SEOG grants, and Federal Work‐Study programs, as well
as other programs funded by the Federal government. Financial aid to students is reported as other revenue. The
amount reported as other revenue represents the portion of aid that was provided to the student in the form of
cash. These programs are audited in accordance with Title 2 U.S. Code of Federal Regulations (CFR) Part 200,
Uniform Administrative Requirements, Cost Principles and Audit Requirements for Federal Awards.
On‐Behalf Payments
GASB Cod. Sec N50 requires that direct on‐behalf payments for benefits and salaries made by one entity to a third
party recipient for the employees of another, legally separate entity be recognized as revenue and expenditures
by the employer government. The State of California makes direct on‐behalf payments for retirement benefits to
the State Teachers Retirement Systems on behalf of all Community Colleges in California. These payments consist
of state general fund contributions to CalSTRS.
Classification of Revenues
The District has classified its revenues as either operating or non‐operating. Certain significant revenue streams
relied upon for operations are recorded as non‐operating revenues as defined by GASB Cod. Sec. C05.101,
including state appropriations, local property taxes, and investment income. Nearly all of the District’s expenses
are from exchange transactions.
Barstow Community College District Notes to Financial Statement June 30, 2016
19
NOTE 2 – SUMMARY OF SIGNIFICANT ACCOUNTING POLICIES (CONTINUED)
Revenues are classified according to the following criteria:
Operating revenues and expenses – Operating revenues and expenses include activities that have the
characteristics of exchange transactions, such as: (1) student tuition and fees, net of fee waivers and
allowances, (2) sales and services of auxiliary enterprises, and (3) most Federal, State and local grants and
contracts and Federal appropriations. All expenses are considered operating expenses except for interest
expense on capital asset related debt.
Non‐operating revenues and expenses – Non‐operating revenues include activities that have the
characteristics of nonexchange transactions, such as Pell grants, gifts and contributions, and other
revenue sources described in GASB Cod. Sec. C05.101, such as State appropriations and investment
income. Interest expense on capital related debt is the only non‐operating expense.
Interfund Activity
Interfund transfers and interfund receivables and payables are eliminated within the primary government funds
during the consolidation process in the entity‐wide financial statements.
Estimates
The preparation of the financial statements in conformity with generally accepted accounting principles requires
management to make estimates and assumptions that affect the amounts reported in the financial statements
and accompanying notes. Actual results may differ from those estimates.
New Accounting Standards
The District has adopted all current Statements of the Governmental Accounting Standards Board (GASB) that are
applicable. At June 30, 2016, the District implemented the following new standards issued by GASB:
GASB Statement 72, “Fair Value Measurement and Application”, effective for the year ending June 30,
2016.
GASB Statement 76, “The Hierarchy of Generally Accepted Accounting Principles for State and Local
Governments”, effective for the year ended June 30, 2016.
Future Changes in Accounting Standards
GASB has issued Statement 78, “Pensions Provided Through Certain Multiple‐Employer Defined Benefit Pension
Plans”. The objective of this Statement is to address a practice issue regarding the scope and applicability of
Statement No. 68, Accounting and Financial Reporting for Pensions. This issue is associated with pensions
provided through certain multiple‐employer defined benefit pension plans and to state or local governmental
employers whose employees are provided with such pensions. The District is currently studying the statement
and plans on adoption if and when required, which will be for the June 30, 2017 financial statements.
Barstow Community College District Notes to Financial Statement June 30, 2016
20
NOTE 2 – SUMMARY OF SIGNIFICANT ACCOUNTING POLICIES (CONTINUED)
GASB has issued Statement 79, “Certain External Investment Pools and Pool Participants”. This Statement
addresses accounting and financial reporting for certain external investment pools and pool participants.
Specifically, it establishes criteria for an external investment pool to qualify for making the election to measure all
of its investments at amortized cost for financial reporting purposes. An external investment pool qualifies for
that reporting if it meets all of the applicable criteria established in this Statement. The District is currently
studying the statement and plans on adoption if and when required, which will be for the June 30, 2017 financial
statements.
GASB has issued Statement 80, “Blending Requirements for Certain Component Units‐An Amendment of GASB
Statement No. 14”. The objective of this Statement is to improve financial reporting by clarifying the financial
statement presentation requirements for certain component units. This Statement amends the blending
requirements established in paragraph 53 of Statement No. 14, The Financial Reporting Entity, as amended. The
District is currently studying the statement and plans on adoption if and when required, which will be for the June
30, 2017 financial statements.
GASB has issued Statement 81, “Irrevocable Split‐Interest Agreements”. The objective of this Statement is to
improve accounting and financial reporting for irrevocable split‐interest agreements by providing recognition and
measurement guidance for situations in which a government is a beneficiary of the agreement. The District is
currently studying the statement and plans on adoption if and when required, which will be for the June 30, 2018
financial statements.
GASB has issued Statement No. 82, “Pension Issues‐An Amendment of GASB Statements No. 67, No. 68, and No.
73”. The objective of this Statement is to address certain issues that have been raised with respect to Statements
No. 67, Financial Reporting for Pension Plans, No. 68, Accounting and Financial Reporting for Pensions, and No.
73, Accounting and Financial Reporting for Pensions and Related Assets That Are Not within the Scope of GASB
Statement 68, and Amendments to Certain Provisions of GASB Statements 67 and 68. Specifically, this Statement
addresses issues regarding (1) the presentation of payroll‐related measures in required supplementary
information, (2) the selection of assumptions and the treatment of deviations from the guidance in an Actuarial
Standard of Practice for financial reporting purposes, and (3) the classification of payments made by employers
to satisfy employee (plan member) contribution requirements. The District is currently studying the statement
and plans on adoption if and when required, which will be for the June 30, 2018 financial statements.
NOTE 3 – DEPOSITS AND INVESTMENTS
Summary of Deposits and Investments
As provided for by the Education Code, Section 41001, a significant portion of the District’s cash balances of most
funds is deposited with the San Bernardino County Treasurer for the purpose of increasing interest earnings
through County investment activities. The California Government Code requires California banks and savings and
loan associations to secure the District’s deposits by pledging government securities as collateral. The market
value of pledged securities must equal 110 percent of an agency’s deposits. California law also allows financial
institutions to secure an agency’s deposits by pledging first trust deed mortgage notes having a value of 150
percent of an agency’s total deposits and collateral is considered to be held in the name of the District.
Substantially all cash held by financial institutions is entirely insured or collateralized.
Barstow Community College District Notes to Financial Statement June 30, 2016
21
NOTE 3 – DEPOSITS AND INVESTMENTS (CONTINUED)
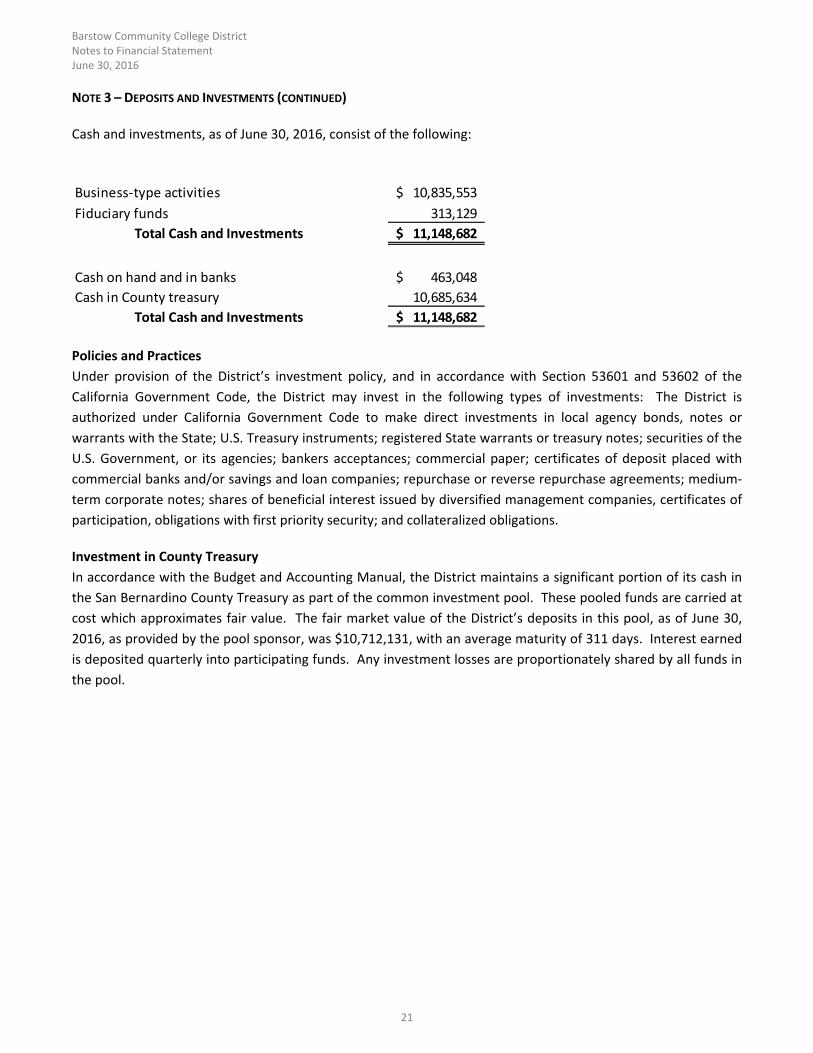
Cash and investments, as of June 30, 2016, consist of the following:
Business‐type activities 10,835,553$
Fiduciary funds 313,129
Total Cash and Investments 11,148,682$
Cash on hand and in banks 463,048$
Cash in County treasury 10,685,634
Total Cash and Investments 11,148,682$
Policies and Practices
Under provision of the District’s investment policy, and in accordance with Section 53601 and 53602 of the
California Government Code, the District may invest in the following types of investments: The District is
authorized under California Government Code to make direct investments in local agency bonds, notes or
warrants with the State; U.S. Treasury instruments; registered State warrants or treasury notes; securities of the
U.S. Government, or its agencies; bankers acceptances; commercial paper; certificates of deposit placed with
commercial banks and/or savings and loan companies; repurchase or reverse repurchase agreements; medium‐
term corporate notes; shares of beneficial interest issued by diversified management companies, certificates of
participation, obligations with first priority security; and collateralized obligations.
Investment in County Treasury
In accordance with the Budget and Accounting Manual, the District maintains a significant portion of its cash in
the San Bernardino County Treasury as part of the common investment pool. These pooled funds are carried at
cost which approximates fair value. The fair market value of the District’s deposits in this pool, as of June 30,
2016, as provided by the pool sponsor, was $10,712,131, with an average maturity of 311 days. Interest earned
is deposited quarterly into participating funds. Any investment losses are proportionately shared by all funds in
the pool.
Barstow Community College District Notes to Financial Statement June 30, 2016
22
NOTE 3 – DEPOSITS AND INVESTMENTS (CONTINUED)
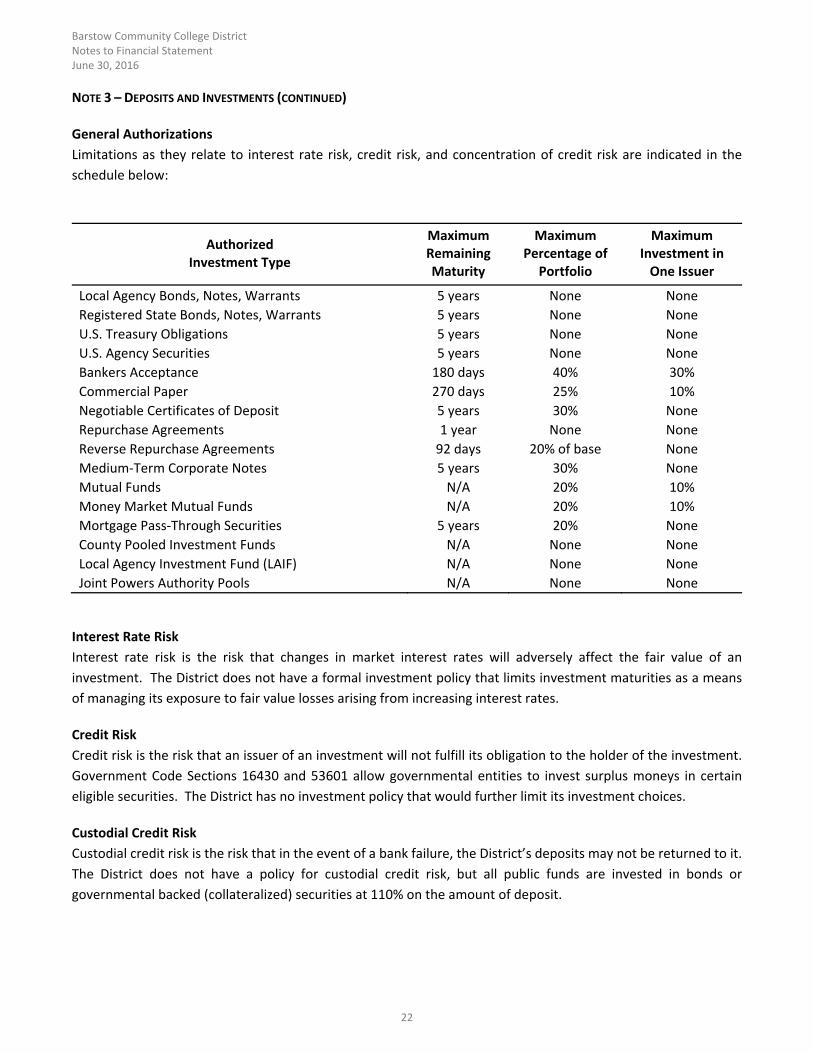
General Authorizations
Limitations as they relate to interest rate risk, credit risk, and concentration of credit risk are indicated in the
schedule below:
Authorized Investment Type
Maximum Remaining Maturity
Maximum Percentage of
Portfolio
Maximum Investment in One Issuer
Local Agency Bonds, Notes, Warrants 5 years None None
Registered State Bonds, Notes, Warrants 5 years None None
U.S. Treasury Obligations 5 years None None
U.S. Agency Securities 5 years None None
Bankers Acceptance 180 days 40% 30%
Commercial Paper 270 days 25% 10%
Negotiable Certificates of Deposit 5 years 30% None
Repurchase Agreements 1 year None None
Reverse Repurchase Agreements 92 days 20% of base None
Medium‐Term Corporate Notes 5 years 30% None
Mutual Funds N/A 20% 10%
Money Market Mutual Funds N/A 20% 10%
Mortgage Pass‐Through Securities 5 years 20% None
County Pooled Investment Funds N/A None None
Local Agency Investment Fund (LAIF) N/A None None
Joint Powers Authority Pools N/A None None
Interest Rate Risk
Interest rate risk is the risk that changes in market interest rates will adversely affect the fair value of an
investment. The District does not have a formal investment policy that limits investment maturities as a means
of managing its exposure to fair value losses arising from increasing interest rates.
Credit Risk
Credit risk is the risk that an issuer of an investment will not fulfill its obligation to the holder of the investment.
Government Code Sections 16430 and 53601 allow governmental entities to invest surplus moneys in certain
eligible securities. The District has no investment policy that would further limit its investment choices.
Custodial Credit Risk
Custodial credit risk is the risk that in the event of a bank failure, the District’s deposits may not be returned to it.
The District does not have a policy for custodial credit risk, but all public funds are invested in bonds or
governmental backed (collateralized) securities at 110% on the amount of deposit.
Barstow Community College District Notes to Financial Statement June 30, 2016
23
NOTE 3 – DEPOSITS AND INVESTMENTS (CONTINUED)
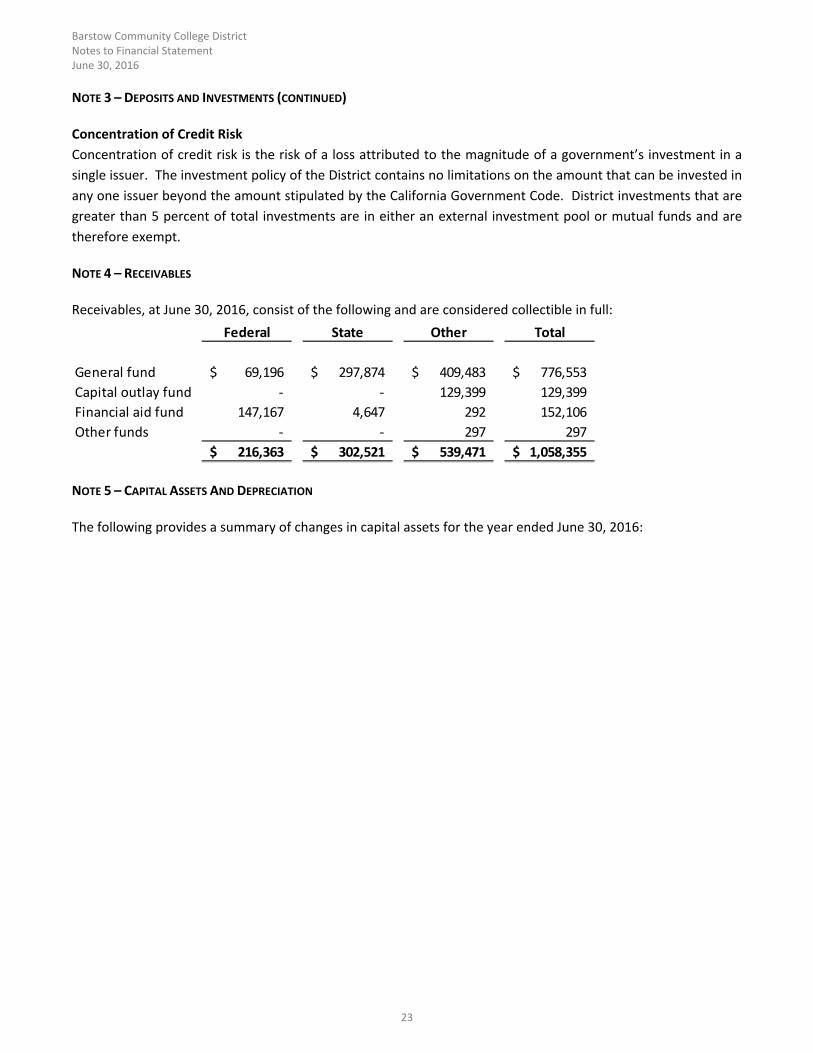
Concentration of Credit Risk
Concentration of credit risk is the risk of a loss attributed to the magnitude of a government’s investment in a
single issuer. The investment policy of the District contains no limitations on the amount that can be invested in
any one issuer beyond the amount stipulated by the California Government Code. District investments that are
greater than 5 percent of total investments are in either an external investment pool or mutual funds and are
therefore exempt.
NOTE 4 – RECEIVABLES
Receivables, at June 30, 2016, consist of the following and are considered collectible in full:
Federal State Other Total
General fund 69,196$ 297,874$ 409,483$ 776,553$
Capital outlay fund ‐ ‐ 129,399 129,399
Financial aid fund 147,167 4,647 292 152,106
Other funds ‐ ‐ 297 297
216,363$ 302,521$ 539,471$ 1,058,355$
NOTE 5 – CAPITAL ASSETS AND DEPRECIATION
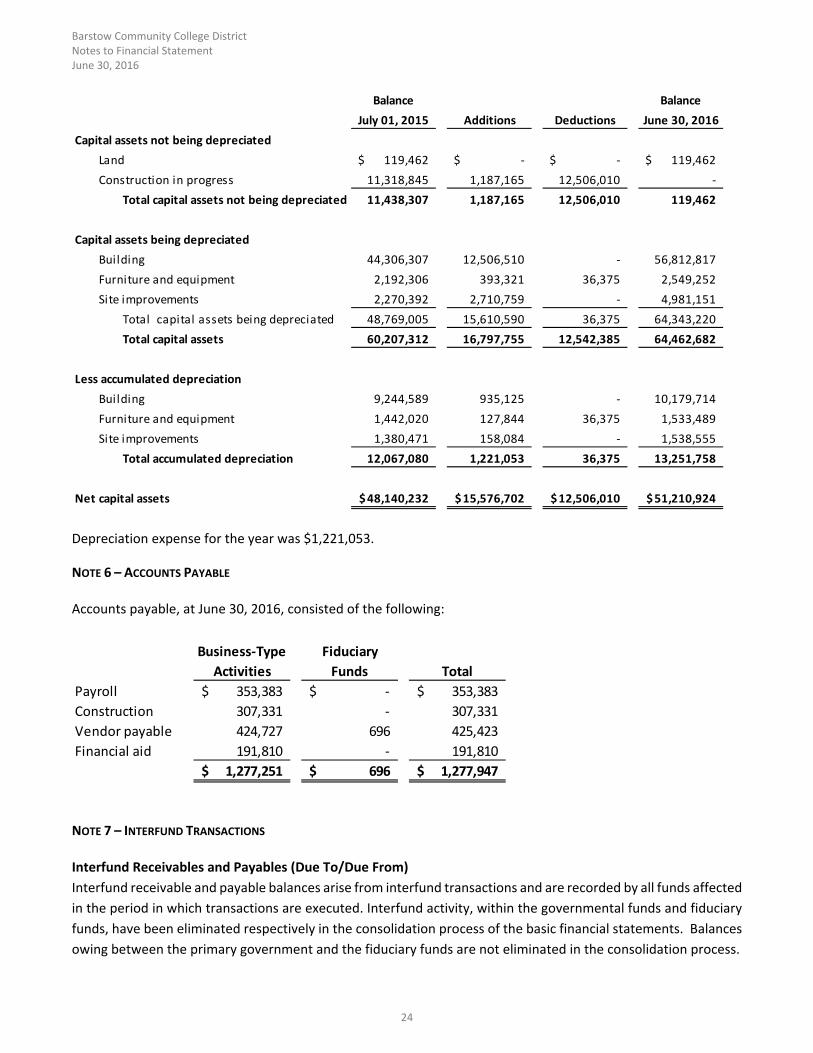
The following provides a summary of changes in capital assets for the year ended June 30, 2016:
Barstow Community College District Notes to Financial Statement June 30, 2016
24
Balance Balance
July 01, 2015 Additions Deductions June 30, 2016
Capital assets not being depreciated
Land 119,462$ ‐$ ‐$ 119,462$
Construction in progress 11,318,845 1,187,165 12,506,010 ‐
Total capital assets not being depreciated 11,438,307 1,187,165 12,506,010 119,462
Capital assets being depreciated
Building 44,306,307 12,506,510 ‐ 56,812,817
Furniture and equipment 2,192,306 393,321 36,375 2,549,252
Site improvements 2,270,392 2,710,759 ‐ 4,981,151
Total capital assets being depreciated 48,769,005 15,610,590 36,375 64,343,220
Total capital assets 60,207,312 16,797,755 12,542,385 64,462,682
Less accumulated depreciation
Building 9,244,589 935,125 ‐ 10,179,714
Furniture and equipment 1,442,020 127,844 36,375 1,533,489
Site improvements 1,380,471 158,084 ‐ 1,538,555
Total accumulated depreciation 12,067,080 1,221,053 36,375 13,251,758
Net capital assets 48,140,232$ 15,576,702$ 12,506,010$ 51,210,924$
Depreciation expense for the year was $1,221,053.
NOTE 6 – ACCOUNTS PAYABLE
Accounts payable, at June 30, 2016, consisted of the following:
Business‐Type Fiduciary
Activities Funds Total
Payroll 353,383$ ‐$ 353,383$
Construction 307,331 ‐ 307,331
Vendor payable 424,727 696 425,423
Financial aid 191,810 ‐ 191,810
1,277,251$ 696$ 1,277,947$
NOTE 7 – INTERFUND TRANSACTIONS
Interfund Receivables and Payables (Due To/Due From)
Interfund receivable and payable balances arise from interfund transactions and are recorded by all funds affected
in the period in which transactions are executed. Interfund activity, within the governmental funds and fiduciary
funds, have been eliminated respectively in the consolidation process of the basic financial statements. Balances
owing between the primary government and the fiduciary funds are not eliminated in the consolidation process.
Barstow Community College District Notes to Financial Statement June 30, 2016
25
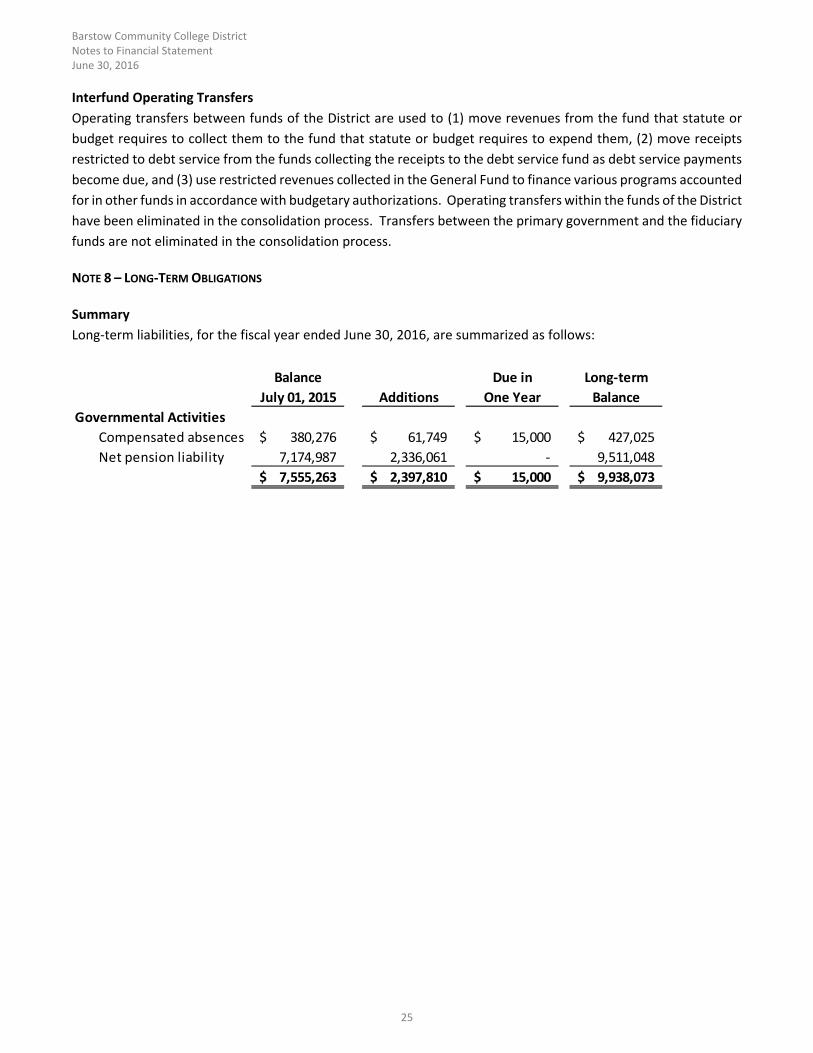
Interfund Operating Transfers
Operating transfers between funds of the District are used to (1) move revenues from the fund that statute or
budget requires to collect them to the fund that statute or budget requires to expend them, (2) move receipts
restricted to debt service from the funds collecting the receipts to the debt service fund as debt service payments
become due, and (3) use restricted revenues collected in the General Fund to finance various programs accounted
for in other funds in accordance with budgetary authorizations. Operating transfers within the funds of the District
have been eliminated in the consolidation process. Transfers between the primary government and the fiduciary
funds are not eliminated in the consolidation process.
NOTE 8 – LONG‐TERM OBLIGATIONS
Summary
Long‐term liabilities, for the fiscal year ended June 30, 2016, are summarized as follows:
Balance Due in Long‐term
July 01, 2015 Additions One Year Balance
Governmental Activities
Compensated absences 380,276$ 61,749$ 15,000$ 427,025$
Net pension liability 7,174,987 2,336,061 ‐ 9,511,048
7,555,263$ 2,397,810$ 15,000$ 9,938,073$
Barstow Community College District Notes to Financial Statement June 30, 2016
26
NOTE 8 – LONG‐TERM OBLIGATIONS (CONTINUED)
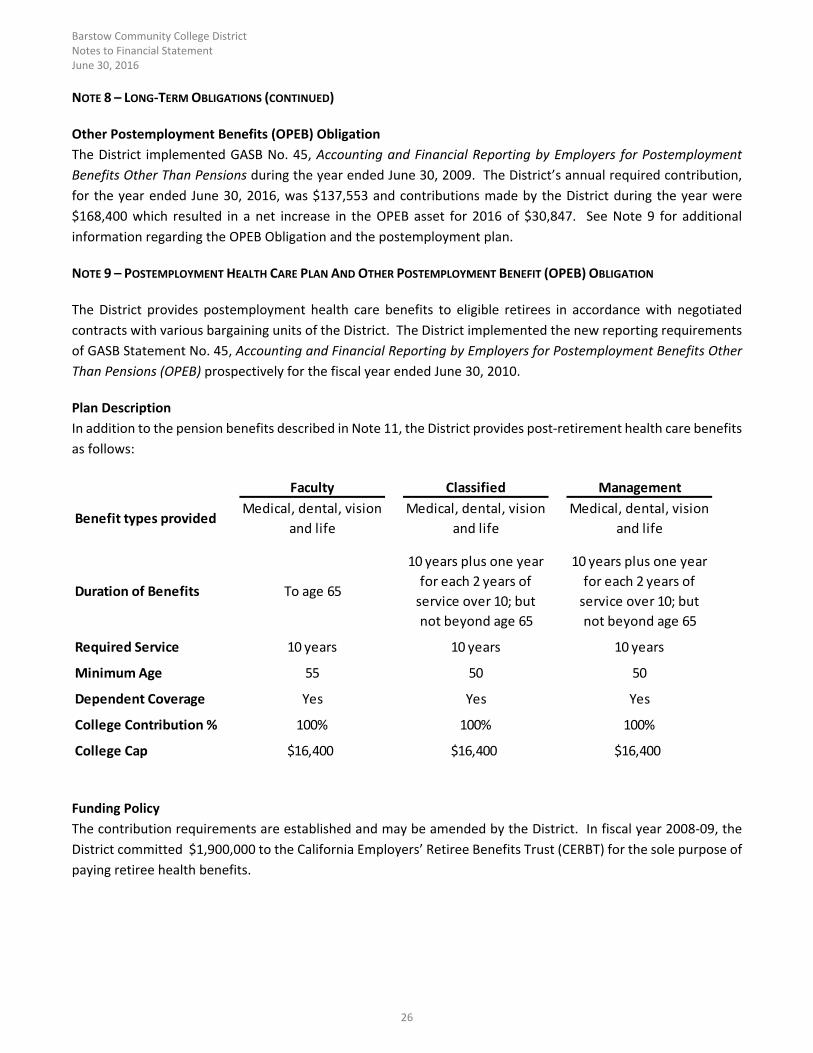
Other Postemployment Benefits (OPEB) Obligation
The District implemented GASB No. 45, Accounting and Financial Reporting by Employers for Postemployment
Benefits Other Than Pensions during the year ended June 30, 2009. The District’s annual required contribution,
for the year ended June 30, 2016, was $137,553 and contributions made by the District during the year were
$168,400 which resulted in a net increase in the OPEB asset for 2016 of $30,847. See Note 9 for additional
information regarding the OPEB Obligation and the postemployment plan.
NOTE 9 – POSTEMPLOYMENT HEALTH CARE PLAN AND OTHER POSTEMPLOYMENT BENEFIT (OPEB) OBLIGATION
The District provides postemployment health care benefits to eligible retirees in accordance with negotiated
contracts with various bargaining units of the District. The District implemented the new reporting requirements
of GASB Statement No. 45, Accounting and Financial Reporting by Employers for Postemployment Benefits Other
Than Pensions (OPEB) prospectively for the fiscal year ended June 30, 2010.
Plan Description
In addition to the pension benefits described in Note 11, the District provides post‐retirement health care benefits
as follows:
Faculty Classified Management
Benefit types providedMedical, dental, vision
and life
Medical, dental, vision
and life
Medical, dental, vision
and life
Duration of Benefits To age 65
10 years plus one year
for each 2 years of
service over 10; but
not beyond age 65
10 years plus one year
for each 2 years of
service over 10; but
not beyond age 65
Required Service 10 years 10 years 10 years
Minimum Age 55 50 50
Dependent Coverage Yes Yes Yes
College Contribution % 100% 100% 100%
College Cap $16,400 $16,400 $16,400
Funding Policy
The contribution requirements are established and may be amended by the District. In fiscal year 2008‐09, the
District committed $1,900,000 to the California Employers’ Retiree Benefits Trust (CERBT) for the sole purpose of
paying retiree health benefits.
Barstow Community College District Notes to Financial Statement June 30, 2016
27
NOTE 9 – POSTEMPLOYMENT HEALTH CARE PLAN AND OTHER POSTEMPLOYMENT BENEFIT (OPEB) OBLIGATION (CONTINUED)
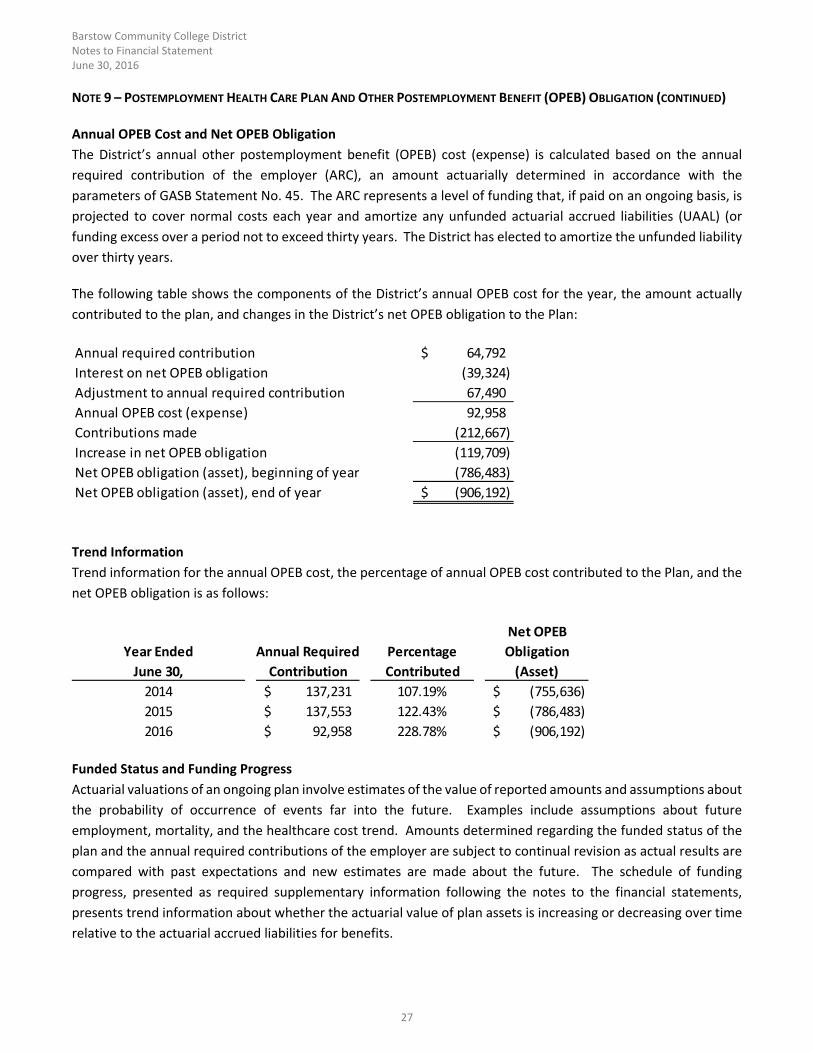
Annual OPEB Cost and Net OPEB Obligation
The District’s annual other postemployment benefit (OPEB) cost (expense) is calculated based on the annual
required contribution of the employer (ARC), an amount actuarially determined in accordance with the
parameters of GASB Statement No. 45. The ARC represents a level of funding that, if paid on an ongoing basis, is
projected to cover normal costs each year and amortize any unfunded actuarial accrued liabilities (UAAL) (or
funding excess over a period not to exceed thirty years. The District has elected to amortize the unfunded liability
over thirty years.
The following table shows the components of the District’s annual OPEB cost for the year, the amount actually
contributed to the plan, and changes in the District’s net OPEB obligation to the Plan:
Annual required contribution 64,792$
Interest on net OPEB obligation (39,324)
Adjustment to annual required contribution 67,490
Annual OPEB cost (expense) 92,958
Contributions made (212,667)
Increase in net OPEB obligation (119,709)
Net OPEB obligation (asset), beginning of year (786,483)
Net OPEB obligation (asset), end of year (906,192)$
Trend Information
Trend information for the annual OPEB cost, the percentage of annual OPEB cost contributed to the Plan, and the
net OPEB obligation is as follows:
Net OPEB
Year Ended Annual Required Percentage Obligation
June 30, Contribution Contributed (Asset)
2014 137,231$ 107.19% (755,636)$
2015 137,553$ 122.43% (786,483)$
2016 92,958$ 228.78% (906,192)$
Funded Status and Funding Progress
Actuarial valuations of an ongoing plan involve estimates of the value of reported amounts and assumptions about
the probability of occurrence of events far into the future. Examples include assumptions about future
employment, mortality, and the healthcare cost trend. Amounts determined regarding the funded status of the
plan and the annual required contributions of the employer are subject to continual revision as actual results are
compared with past expectations and new estimates are made about the future. The schedule of funding
progress, presented as required supplementary information following the notes to the financial statements,
presents trend information about whether the actuarial value of plan assets is increasing or decreasing over time
relative to the actuarial accrued liabilities for benefits.
Barstow Community College District Notes to Financial Statement June 30, 2016
28
NOTE 9 – POSTEMPLOYMENT HEALTH CARE PLAN AND OTHER POSTEMPLOYMENT BENEFIT (OPEB) OBLIGATION (CONTINUED
Actuarial Methods and Assumptions
In the July 1, 2016 actuarial valuation, the entry age normal method was used. The actuarial assumptions included
a 7.00% percent investment rate of return (net of administrative expenses), based on the plan being funded in an
irrevocable employee benefit trust invested in a long‐term fixed income portfolio. Healthcare cost increases were
estimated at 4 percent annually. The UAAL is being amortized at a level dollar method. The actuarial value of
assets held in the trust, at July 1, 2016, was $3,207,735.
NOTE 10 – EMPLOYEE RETIREMENT SYSTEMS
Qualified employees are covered under multiple‐employer defined benefit pension plans maintained by agencies
of the State of California. Certificated employees are members of the State Teachers’ Retirement System
(CalSTRS) and classified employees are members of the California Public Employees’ Retirement System (CalPERS).
CalSTRS
Plan Description
The District contributes to the California State Teachers’ Retirement System (CalSTRS), a cost‐sharing multiple‐
employer public employee retirement system defined benefit pension plan administered by CalSTRS. The plan
provides retirement, disability and survivor benefits to beneficiaries. Benefit provisions are established by State
statutes, as legislatively amended, within the State Teachers’ Retirement Law. CalSTRS issues a separate
comprehensive annual financial report that includes financial statements and required supplementary
information. Copies of the CalSTRS annual financial report can be found on the CalSTRS website under
Publications at: http://www.calstrs.com/member‐publications.
Funding Policy
Active 2% at 60 Non‐PEPRA members and active 2% at 62 PEPRA plan members are required to contribute 9.20
and 8.56 percent of their salary, respectively, and the District is required to contribute an actuarially determined
rate. The actuarial methods and assumptions used for determining the rate are those adopted by CalSTRS
Teachers’ Retirement Board. The required employer contribution rate for fiscal year 2016‐2016 was 10.73 percent
of annual payroll, actuarially determined as an amount that, when combined with employee contributions, is
expected to finance the costs of benefits earned by employees during the year, with an additional amount to
finance any unfunded accrued liability. Contributions to the pension plan from the District were $1,008,442 for
the year ended June 30, 2016.
Barstow Community College District Notes to Financial Statement June 30, 2016
29
NOTE 10 – EMPLOYEE RETIREMENT SYSTEMS (CONTINUED)
CalPERS
Plan Description
The District contributes to the School Employer Pool under the California Public Employees’ Retirement System
(CalPERS), a cost‐sharing multiple‐employer public employee retirement system defined benefit pension plan
administered by CalPERS. The plan provides retirement and disability benefits, annual cost‐of‐living adjustments,
and death benefits to plan members and beneficiaries. Benefit provisions are established by State statutes, as
legislatively amended, within the Public Employees’ Retirement Law. CalPERS issues a separate comprehensive
annual financial report that includes financial statements and required supplementary information. Copies of the
CalPERS annual financial can be found on the CalPERS website under Forms and Publications at:
https://www.calpers.ca.gov/page/forms‐publicatons.
Funding Policy
Active 2% at 60 Non‐PEPRA members and 2% at 62 PEPRA plan members are required to contribute 7.0 percent
and 6.0 percent of their salary, respectively, and the District is required to contribute an actuarially determined
rate. The actuarial methods and assumptions used for determining the rate are those adopted by the CalPERS
Board of Administration. The required employer contribution rate for fiscal year 2016‐2016 was 11.771 percent
of annual payroll, actuarially determined as an amount that, when combined with employee contributions, is
expected to finance the costs of benefits earned by employees during the year, with an additional amount to
finance any unfunded accrued liability. Contributions to the pension plan from the District were $427,651 for the
year ended June 30, 2016.
Pension Liabilities, Pension Expenses, and Deferred Outflows / Inflows of Resources Related to Pensions
At June 30, 2016, the District reported a liability of $9,511,048 for its proportionate share of the net pension
liability. The net pension liability was measured as of June 30, 2015, and the total pension liability used to calculate
the net pension liability was determined by an actuarial valuation as of that date. The District’s proportion of the
net pension liability was based on a projection of the District’s long‐term share of contributions to the pension
plan relative to the projected contributions of all participating school districts, actuarially determined.
Barstow Community College District Notes to Financial Statement June 30, 2016
30
NOTE 10 – EMPLOYEE RETIREMENT SYSTEMS (CONTINUED)
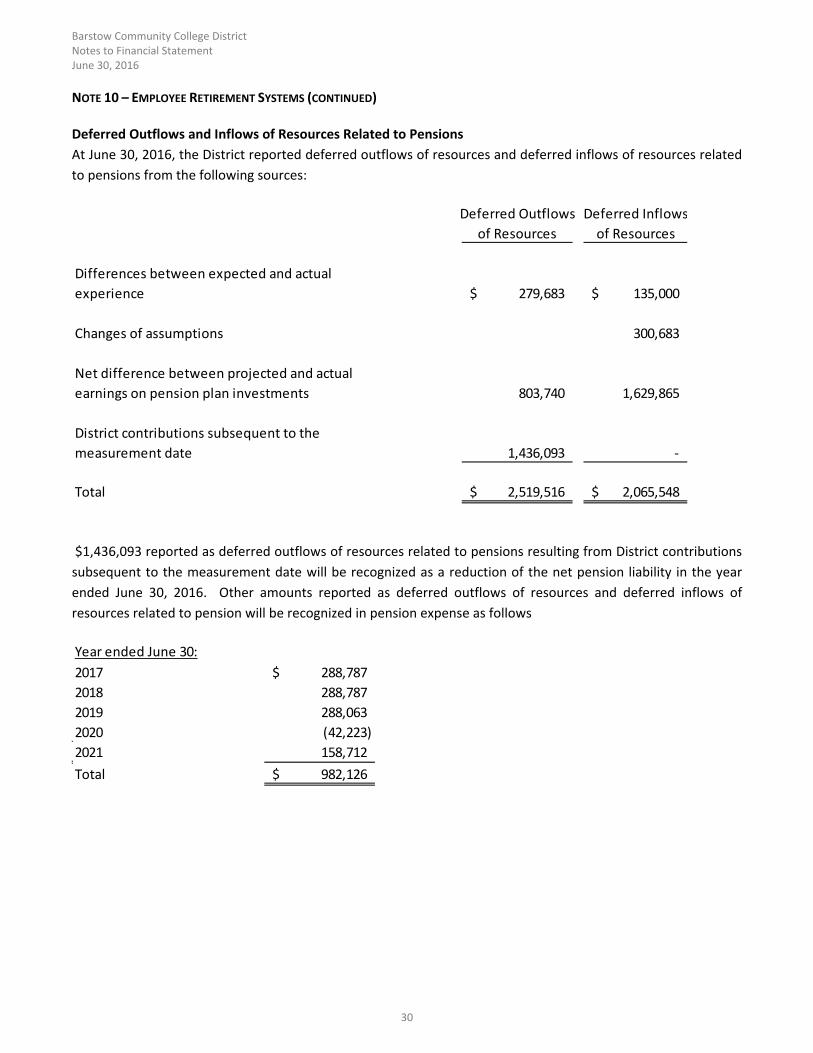
Deferred Outflows and Inflows of Resources Related to Pensions
At June 30, 2016, the District reported deferred outflows of resources and deferred inflows of resources related
to pensions from the following sources:
Deferred Outflows Deferred Inflows
of Resources of Resources
Differences between expected and actual
experience 279,683$ 135,000$
Changes of assumptions 300,683
Net difference between projected and actual
earnings on pension plan investments 803,740 1,629,865
District contributions subsequent to the
measurement date 1,436,093 ‐
Total 2,519,516$ 2,065,548$
$1,436,093 reported as deferred outflows of resources related to pensions resulting from District contributions
subsequent to the measurement date will be recognized as a reduction of the net pension liability in the year
ended June 30, 2016. Other amounts reported as deferred outflows of resources and deferred inflows of
resources related to pension will be recognized in pension expense as follows
Year ended June 30:
2017 288,787$
2018 288,787
2019 288,063
2020 (42,223)
2021 158,712
Total 982,126$
Barstow Community College District Notes to Financial Statement June 30, 2016
31
NOTE 10 – EMPLOYEE RETIREMENT SYSTEMS (CONTINUED)
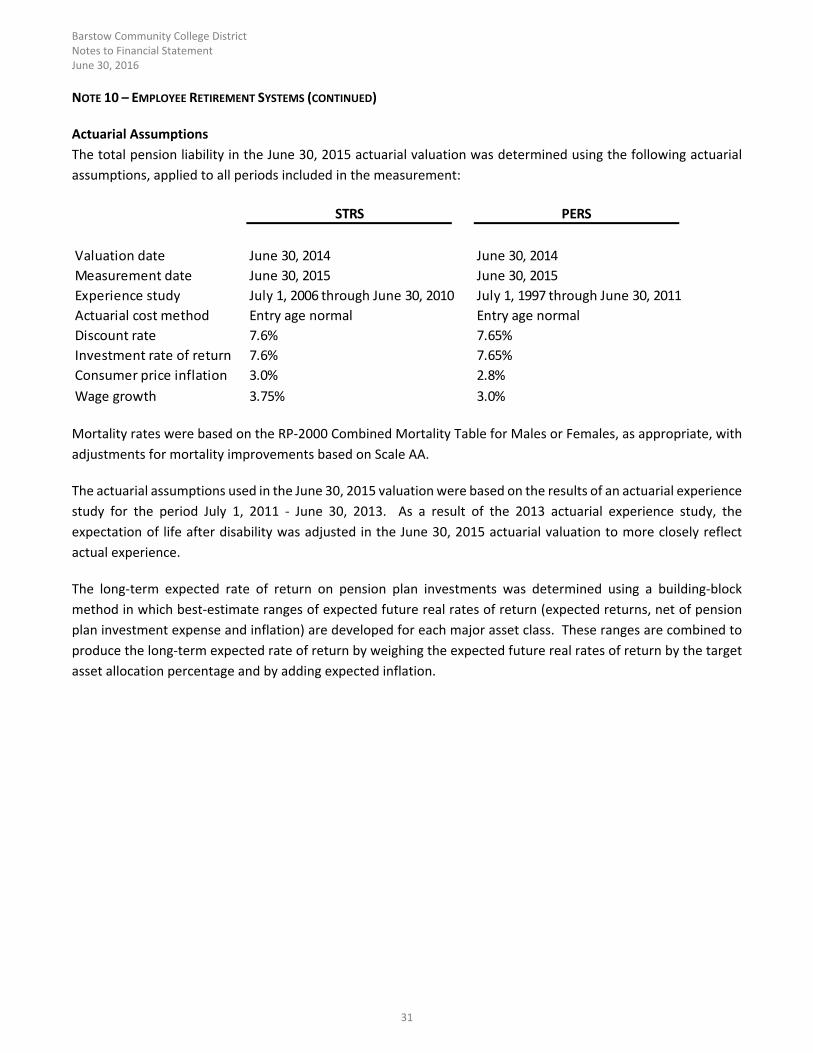
Actuarial Assumptions
The total pension liability in the June 30, 2015 actuarial valuation was determined using the following actuarial
assumptions, applied to all periods included in the measurement:
STRS PERS
Valuation date June 30, 2014 June 30, 2014
Measurement date June 30, 2015 June 30, 2015
Experience study July 1, 2006 through June 30, 2010 July 1, 1997 through June 30, 2011
Actuarial cost method Entry age normal Entry age normal
Discount rate 7.6% 7.65%
Investment rate of return 7.6% 7.65%
Consumer price inflation 3.0% 2.8%
Wage growth 3.75% 3.0%
Mortality rates were based on the RP‐2000 Combined Mortality Table for Males or Females, as appropriate, with
adjustments for mortality improvements based on Scale AA.
The actuarial assumptions used in the June 30, 2015 valuation were based on the results of an actuarial experience
study for the period July 1, 2011 ‐ June 30, 2013. As a result of the 2013 actuarial experience study, the
expectation of life after disability was adjusted in the June 30, 2015 actuarial valuation to more closely reflect
actual experience.
The long‐term expected rate of return on pension plan investments was determined using a building‐block
method in which best‐estimate ranges of expected future real rates of return (expected returns, net of pension
plan investment expense and inflation) are developed for each major asset class. These ranges are combined to
produce the long‐term expected rate of return by weighing the expected future real rates of return by the target
asset allocation percentage and by adding expected inflation.
Barstow Community College District Notes to Financial Statement June 30, 2016
32
NOTE 10 – EMPLOYEE RETIREMENT SYSTEMS (CONTINUED)
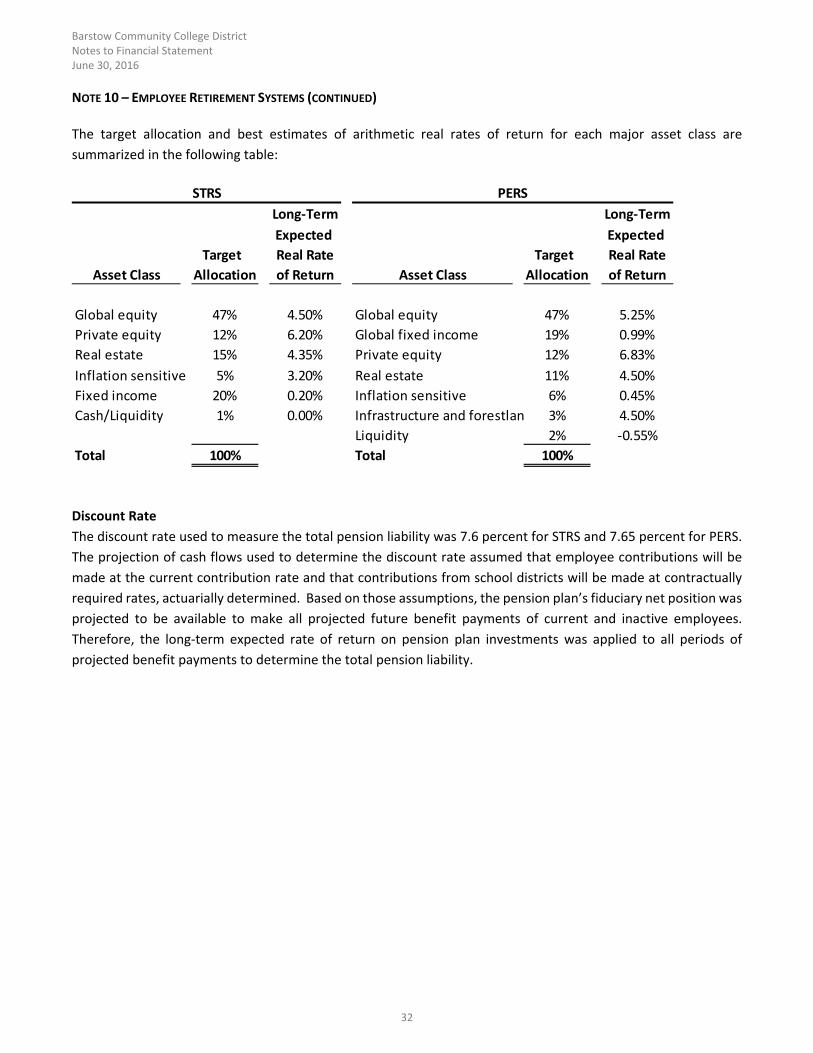
The target allocation and best estimates of arithmetic real rates of return for each major asset class are
summarized in the following table:
Long‐Term Long‐Term
Expected Expected
Target Real Rate Target Real Rate
Asset Class Allocation of Return Asset Class Allocation of Return
Global equity 47% 4.50% Global equity 47% 5.25%
Private equity 12% 6.20% Global fixed income 19% 0.99%
Real estate 15% 4.35% Private equity 12% 6.83%
Inflation sensitive 5% 3.20% Real estate 11% 4.50%
Fixed income 20% 0.20% Inflation sensitive 6% 0.45%
Cash/Liquidity 1% 0.00% Infrastructure and forestlan 3% 4.50%
Liquidity 2% ‐0.55%
Total 100% Total 100%
PERSSTRS
Discount Rate
The discount rate used to measure the total pension liability was 7.6 percent for STRS and 7.65 percent for PERS.
The projection of cash flows used to determine the discount rate assumed that employee contributions will be
made at the current contribution rate and that contributions from school districts will be made at contractually
required rates, actuarially determined. Based on those assumptions, the pension plan’s fiduciary net position was
projected to be available to make all projected future benefit payments of current and inactive employees.
Therefore, the long‐term expected rate of return on pension plan investments was applied to all periods of
projected benefit payments to determine the total pension liability.

Barstow Community College District Notes to Financial Statement June 30, 2016
33
NOTE 10 – EMPLOYEE RETIREMENT SYSTEMS (CONTINUED)
Sensitivity of the District’s Proportionate Share of the Net Pension Liability to Changes in the Discount Rate
The following presents the District’s proportionate share of the net pension liability calculated using the discount
rate of 7.6 percent and 7.65 percent for STRS and PERS, respectively, as well as what the District’s proportionate
share of the net pension liability would be if it were calculated using a discount rate that is 1 percentage point
lower or 1 percentage point higher than the current rate for each plan:
1% Current 1%
Decrease Discount Rate Increase
(6.6%) (7.6%) (8.6%)
District's proportionate share of
the net pension liability 11,098,164$ 5,036,495$ 2,902,111$
1% Current 1%
Decrease Discount Rate Increase
(6.65%) (7.65%) (8.65%)
District's proportionate share of
the net pension liability 7,282,707$ 4,474,552$ 2,139,384$
STRS
PERS
Changes of Assumptions
Changes of assumptions about future economic or demographic factors or other inputs are amortized over a
closed period equal to the average of the expected service lives of all employees that are provided pension
benefits. During the measurement period, there were no changes of assumptions.
Collective Pension Expense
Collective pension expense includes certain current period changes in the collective net pension liability, projected
earnings on pension plan investments, and the amortization of deferred outflows of resources and deferred
inflows of resources for the current period. The collective pension expense for the period ended June 30, 2016 is
$1,533,443.
Pension Plan Fiduciary Net Position
Detailed information about the pension plan’s fiduciary net position is available in the separately issued CalSTRS
and CalPERS financial reports.
Social Security
As established by Federal law, all public sector employees who are not members of their employer’s existing
retirement systems (CalSTRS or CalPERS) must be covered by social security or an alternative plan. The District
has elected to use Social Security as its alternative plan.
Barstow Community College District Notes to Financial Statement June 30, 2016
34
NOTE 10 – EMPLOYEE RETIREMENT SYSTEMS (CONTINUED)
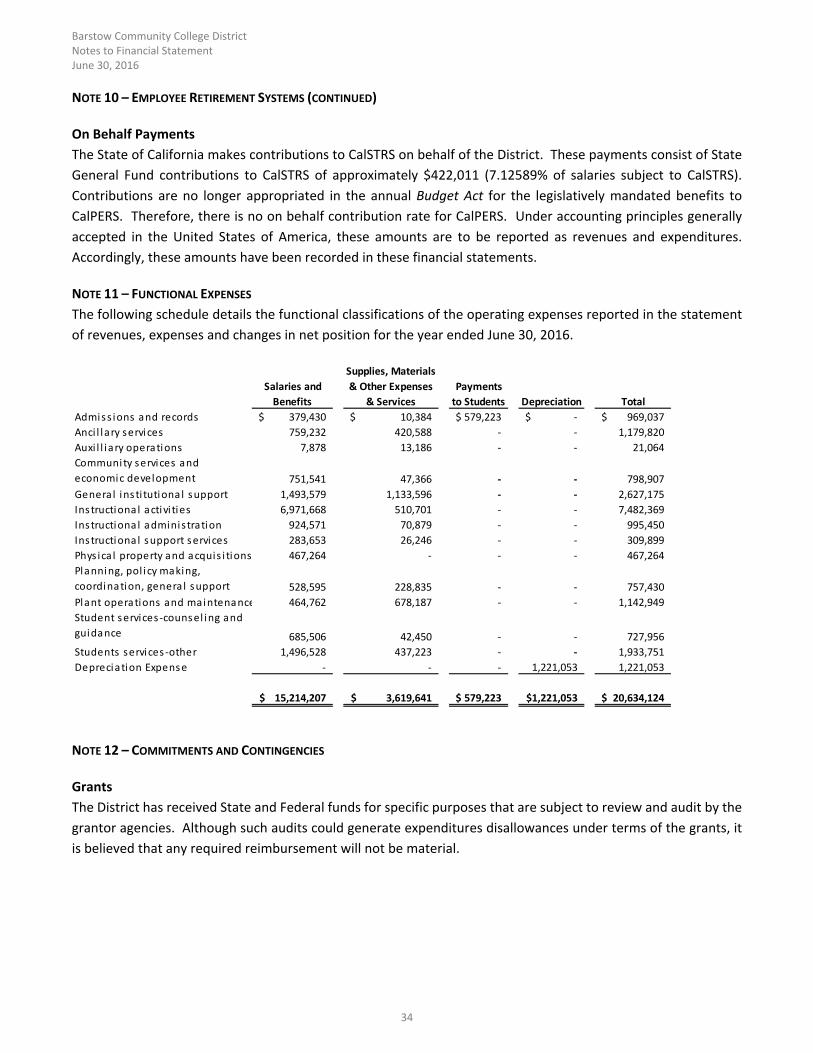
On Behalf Payments
The State of California makes contributions to CalSTRS on behalf of the District. These payments consist of State
General Fund contributions to CalSTRS of approximately $422,011 (7.12589% of salaries subject to CalSTRS).
Contributions are no longer appropriated in the annual Budget Act for the legislatively mandated benefits to
CalPERS. Therefore, there is no on behalf contribution rate for CalPERS. Under accounting principles generally
accepted in the United States of America, these amounts are to be reported as revenues and expenditures.
Accordingly, these amounts have been recorded in these financial statements.
NOTE 11 – FUNCTIONAL EXPENSES
The following schedule details the functional classifications of the operating expenses reported in the statement
of revenues, expenses and changes in net position for the year ended June 30, 2016.
Supplies, Materials
Salaries and & Other Expenses Payments
Benefits & Services to Students Depreciation Total
Admiss ions and records 379,430$ 10,384$ 579,223$ ‐$ 969,037$
Anci l lary services 759,232 420,588 ‐ ‐ 1,179,820
Auxi l l iary operations 7,878 13,186 ‐ ‐ 21,064
751,541 47,366 ‐ ‐ 798,907
1,493,579 1,133,596 ‐ ‐ 2,627,175
Ins tructiona l activi ties 6,971,668 510,701 ‐ ‐ 7,482,369
Ins tructiona l administration 924,571 70,879 ‐ ‐ 995,450
Ins tructiona l support services 283,653 26,246 ‐ ‐ 309,899
Phys ica l property and acquis i tions 467,264 ‐ ‐ ‐ 467,264
528,595 228,835 ‐ ‐ 757,430
Plant operations and maintenance 464,762 678,187 ‐ ‐ 1,142,949
685,506 42,450 ‐ ‐ 727,956
Students services ‐other 1,496,528 437,223 ‐ ‐ 1,933,751
Depreciation Expense ‐ ‐ ‐ 1,221,053 1,221,053
15,214,207$ 3,619,641$ 579,223$ 1,221,053$ 20,634,124$
Community services and
economic development
Planning, pol icy making,
coordination, genera l support
Student services ‐counsel ing and
guidance
General ins ti tutiona l support
NOTE 12 – COMMITMENTS AND CONTINGENCIES
Grants
The District has received State and Federal funds for specific purposes that are subject to review and audit by the
grantor agencies. Although such audits could generate expenditures disallowances under terms of the grants, it
is believed that any required reimbursement will not be material.
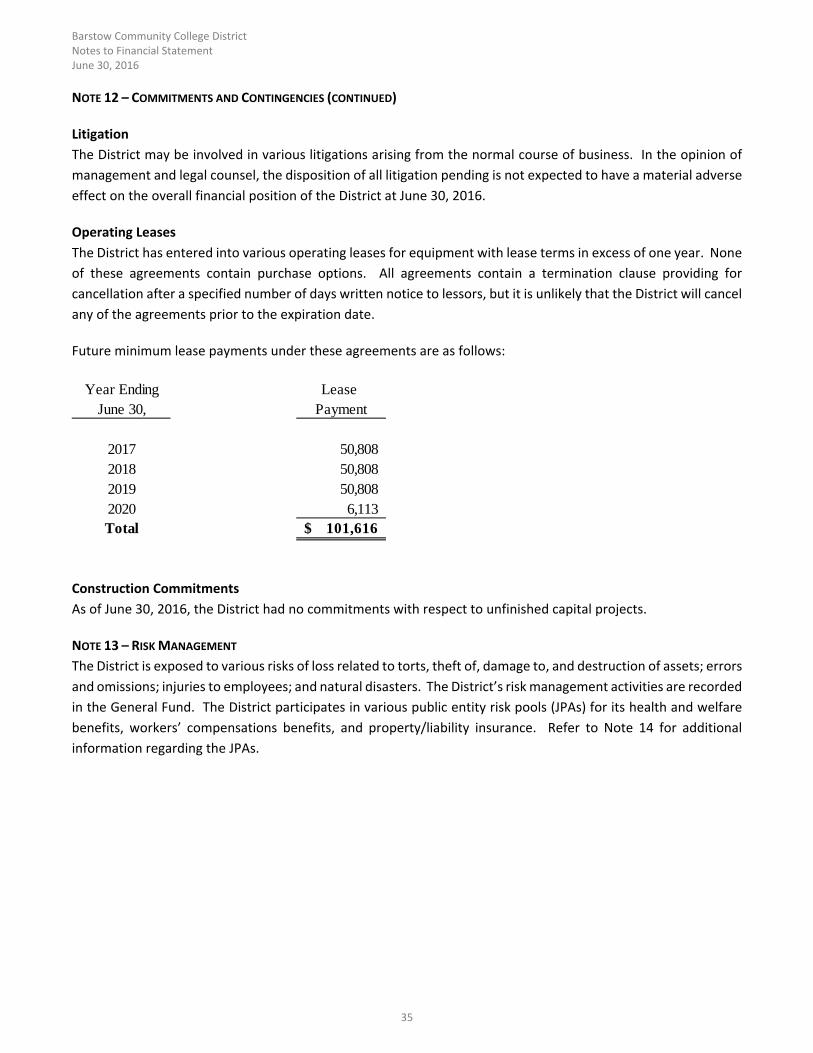
Barstow Community College District Notes to Financial Statement June 30, 2016
35
NOTE 12 – COMMITMENTS AND CONTINGENCIES (CONTINUED)
Litigation
The District may be involved in various litigations arising from the normal course of business. In the opinion of
management and legal counsel, the disposition of all litigation pending is not expected to have a material adverse
effect on the overall financial position of the District at June 30, 2016.
Operating Leases
The District has entered into various operating leases for equipment with lease terms in excess of one year. None
of these agreements contain purchase options. All agreements contain a termination clause providing for
cancellation after a specified number of days written notice to lessors, but it is unlikely that the District will cancel
any of the agreements prior to the expiration date.
Future minimum lease payments under these agreements are as follows:
Year Ending Lease June 30, Payment
2017 50,808 2018 50,808 2019 50,808 2020 6,113 Total 101,616$
Construction Commitments
As of June 30, 2016, the District had no commitments with respect to unfinished capital projects.
NOTE 13 – RISK MANAGEMENT
The District is exposed to various risks of loss related to torts, theft of, damage to, and destruction of assets; errors
and omissions; injuries to employees; and natural disasters. The District’s risk management activities are recorded
in the General Fund. The District participates in various public entity risk pools (JPAs) for its health and welfare
benefits, workers’ compensations benefits, and property/liability insurance. Refer to Note 14 for additional
information regarding the JPAs.
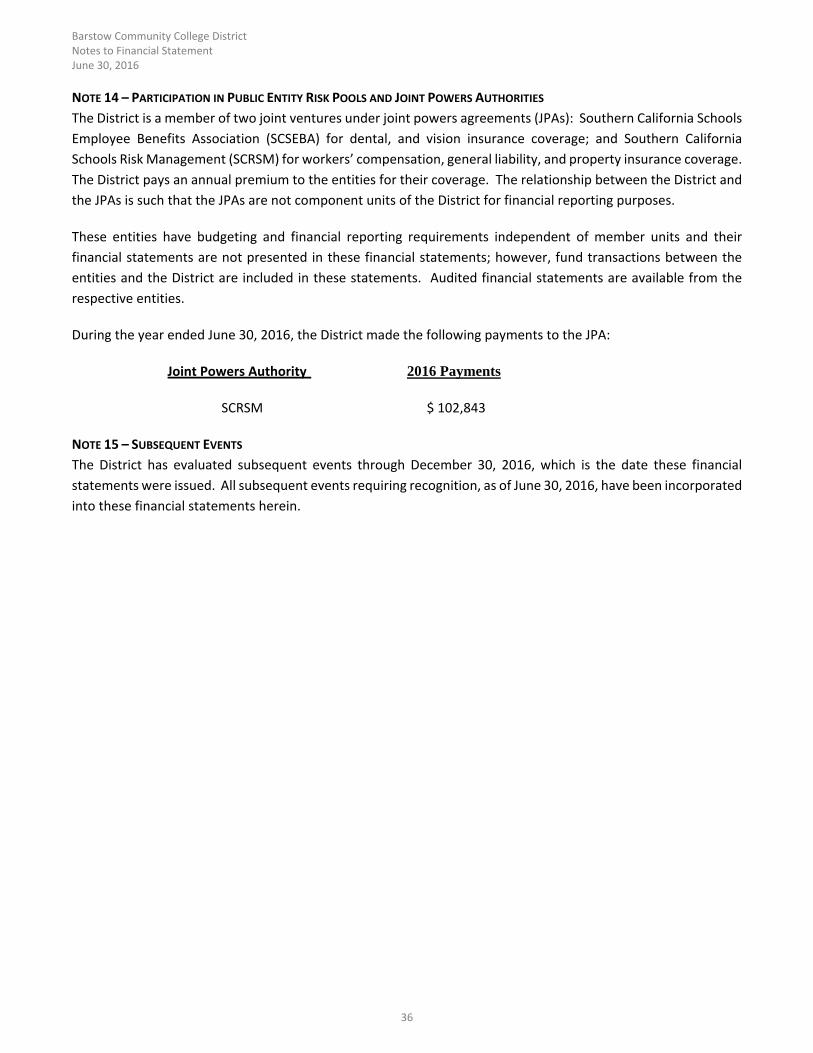
Barstow Community College District Notes to Financial Statement June 30, 2016
36
NOTE 14 – PARTICIPATION IN PUBLIC ENTITY RISK POOLS AND JOINT POWERS AUTHORITIES
The District is a member of two joint ventures under joint powers agreements (JPAs): Southern California Schools
Employee Benefits Association (SCSEBA) for dental, and vision insurance coverage; and Southern California
Schools Risk Management (SCRSM) for workers’ compensation, general liability, and property insurance coverage.
The District pays an annual premium to the entities for their coverage. The relationship between the District and
the JPAs is such that the JPAs are not component units of the District for financial reporting purposes.
These entities have budgeting and financial reporting requirements independent of member units and their
financial statements are not presented in these financial statements; however, fund transactions between the
entities and the District are included in these statements. Audited financial statements are available from the
respective entities.
During the year ended June 30, 2016, the District made the following payments to the JPA:
Joint Powers Authority 2016 Payments
SCRSM $ 102,843
NOTE 15 – SUBSEQUENT EVENTS
The District has evaluated subsequent events through December 30, 2016, which is the date these financial
statements were issued. All subsequent events requiring recognition, as of June 30, 2016, have been incorporated
into these financial statements herein.
REQUIREDSUPPLEMENTARYINFORMATION
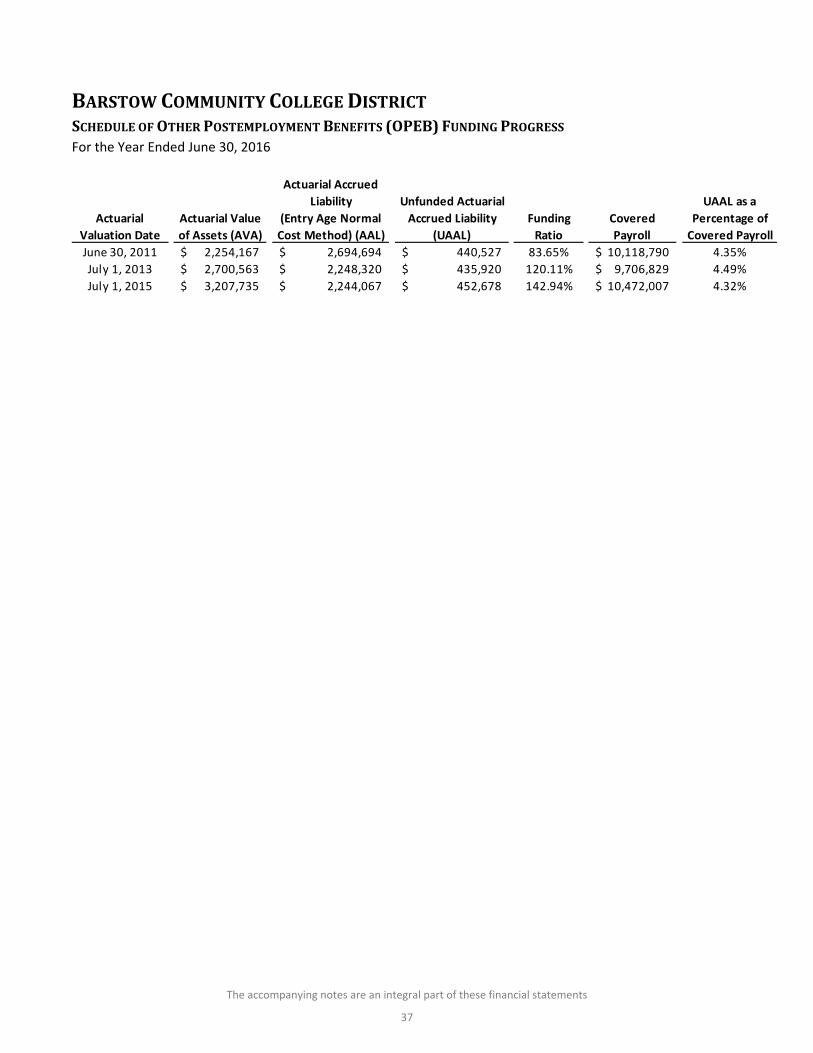
The accompanying notes are an integral part of these financial statements
37
BARSTOWCOMMUNITYCOLLEGEDISTRICTSCHEDULEOFOTHERPOSTEMPLOYMENTBENEFITS(OPEB)FUNDINGPROGRESSFor the Year Ended June 30, 2016
Actuarial Accrued
Liability Unfunded Actuarial UAAL as a
Actuarial Actuarial Value (Entry Age Normal Accrued Liability Funding Covered Percentage of
Valuation Date of Assets (AVA) Cost Method) (AAL) (UAAL) Ratio Payroll Covered Payroll
June 30, 2011 2,254,167$ 2,694,694$ 440,527$ 83.65% 10,118,790$ 4.35%
July 1, 2013 2,700,563$ 2,248,320$ 435,920$ 120.11% 9,706,829$ 4.49%
July 1, 2015 3,207,735$ 2,244,067$ 452,678$ 142.94% 10,472,007$ 4.32%
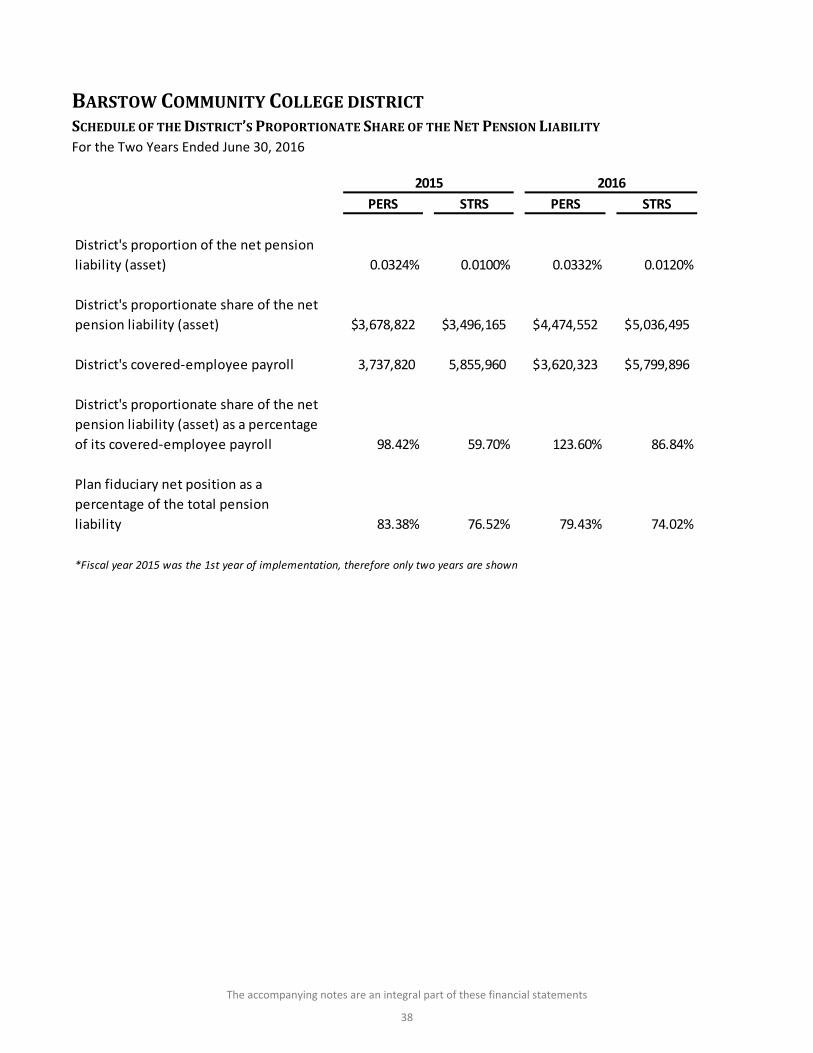
The accompanying notes are an integral part of these financial statements
38
BARSTOWCOMMUNITYCOLLEGEDISTRICTSCHEDULEOFTHEDISTRICT’SPROPORTIONATESHAREOFTHENETPENSIONLIABILITYFor the Two Years Ended June 30, 2016
PERS STRS PERS STRS
District's proportion of the net pension
liability (asset) 0.0324% 0.0100% 0.0332% 0.0120%
District's proportionate share of the net
pension liability (asset) 3,678,822$ 3,496,165$ 4,474,552$ 5,036,495$
District's covered‐employee payroll 3,737,820 5,855,960 3,620,323$ 5,799,896$
District's proportionate share of the net
pension liability (asset) as a percentage
of its covered‐employee payroll 98.42% 59.70% 123.60% 86.84%
Plan fiduciary net position as a
percentage of the total pension
liability 83.38% 76.52% 79.43% 74.02%
*Fiscal year 2015 was the 1st year of implementation, therefore only two years are shown
2015 2016
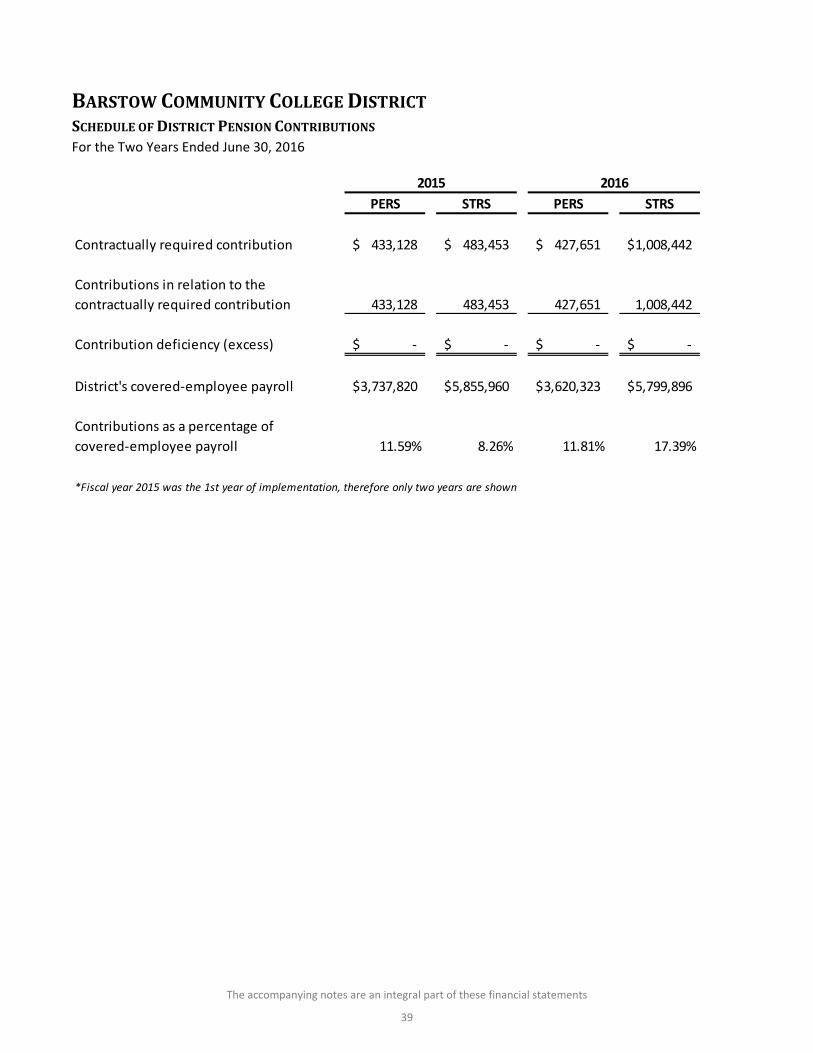
The accompanying notes are an integral part of these financial statements
39
BARSTOWCOMMUNITYCOLLEGEDISTRICTSCHEDULEOFDISTRICTPENSIONCONTRIBUTIONSFor the Two Years Ended June 30, 2016
PERS STRS PERS STRS
Contractually required contribution 433,128$ 483,453$ 427,651$ 1,008,442$
Contributions in relation to the
contractually required contribution 433,128 483,453 427,651 1,008,442
Contribution deficiency (excess) ‐$ ‐$ ‐$ ‐$
District's covered‐employee payroll 3,737,820$ 5,855,960$ 3,620,323$ 5,799,896$
Contributions as a percentage of
covered‐employee payroll 11.59% 8.26% 11.81% 17.39%
*Fiscal year 2015 was the 1st year of implementation, therefore only two years are shown
2015 2016
SUPPLEMENTARYINFORMATION
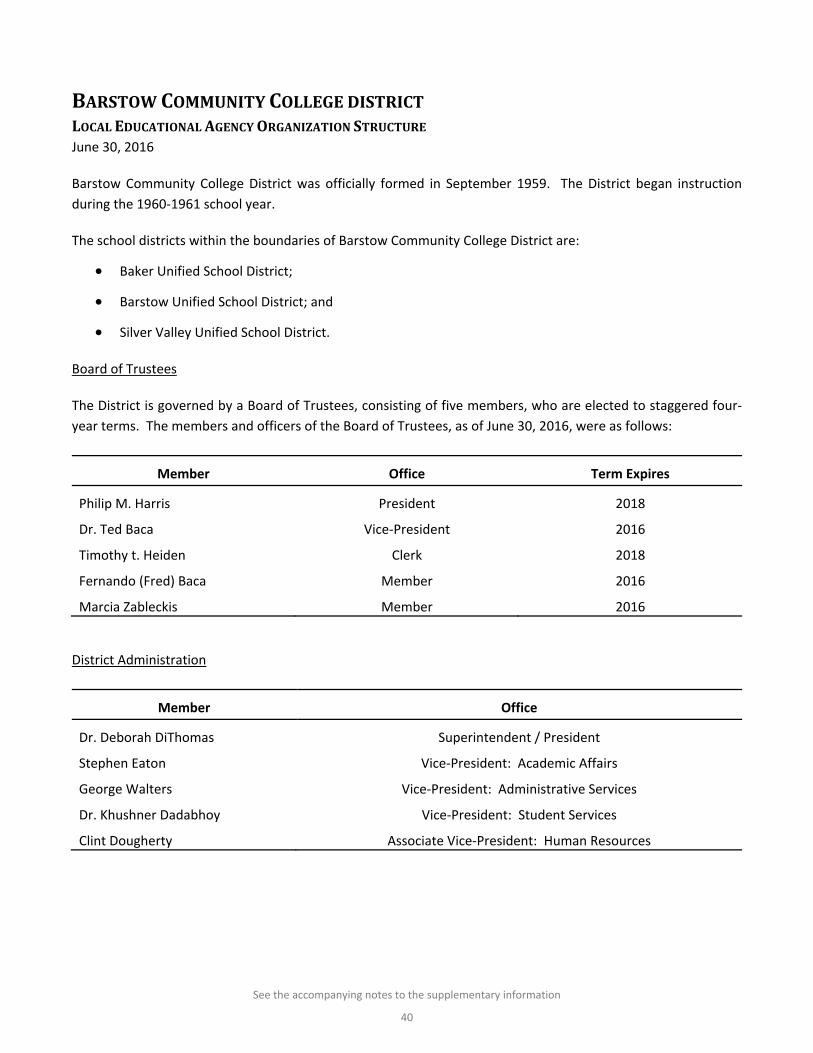
See the accompanying notes to the supplementary information
40
BARSTOWCOMMUNITYCOLLEGEDISTRICTLOCALEDUCATIONALAGENCYORGANIZATIONSTRUCTUREJune 30, 2016
Barstow Community College District was officially formed in September 1959. The District began instruction
during the 1960‐1961 school year.
The school districts within the boundaries of Barstow Community College District are:
Baker Unified School District;
Barstow Unified School District; and
Silver Valley Unified School District.
Board of Trustees
The District is governed by a Board of Trustees, consisting of five members, who are elected to staggered four‐
year terms. The members and officers of the Board of Trustees, as of June 30, 2016, were as follows:
Member Office Term Expires
Philip M. Harris President 2018
Dr. Ted Baca Vice‐President 2016
Timothy t. Heiden Clerk 2018
Fernando (Fred) Baca Member 2016
Marcia Zableckis Member 2016
District Administration
Member Office
Dr. Deborah DiThomas Superintendent / President
Stephen Eaton Vice‐President: Academic Affairs
George Walters Vice‐President: Administrative Services
Dr. Khushner Dadabhoy Vice‐President: Student Services
Clint Dougherty Associate Vice‐President: Human Resources
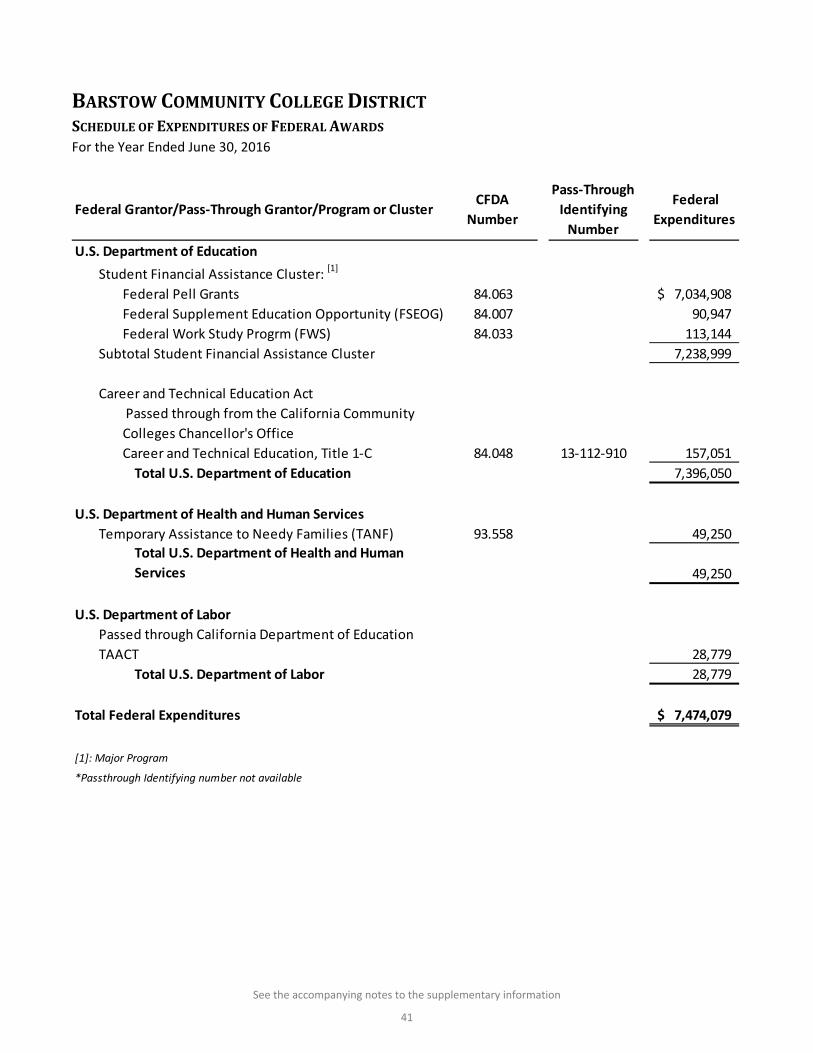
See the accompanying notes to the supplementary information
41
BARSTOWCOMMUNITYCOLLEGEDISTRICTSCHEDULEOFEXPENDITURESOFFEDERALAWARDSFor the Year Ended June 30, 2016
Federal Grantor/Pass‐Through Grantor/Program or ClusterCFDA
Number
Pass‐Through
Identifying
Number
Federal
Expenditures
U.S. Department of Education
Student Financial Assistance Cluster: [1]
Federal Pell Grants 84.063 7,034,908$
Federal Supplement Education Opportunity (FSEOG) 84.007 90,947
Federal Work Study Progrm (FWS) 84.033 113,144
Subtotal Student Financial Assistance Cluster 7,238,999
Career and Technical Education Act
Passed through from the California Community
Colleges Chancellor's Office
Career and Technical Education, Title 1‐C 84.048 13‐112‐910 157,051
Total U.S. Department of Education 7,396,050
U.S. Department of Health and Human Services
Temporary Assistance to Needy Families (TANF) 93.558 49,250
Total U.S. Department of Health and Human
Services 49,250
U.S. Department of Labor
Passed through California Department of Education
TAACT 28,779
Total U.S. Department of Labor 28,779
Total Federal Expenditures 7,474,079$
[1]: Major Program
*Passthrough Identifying number not available
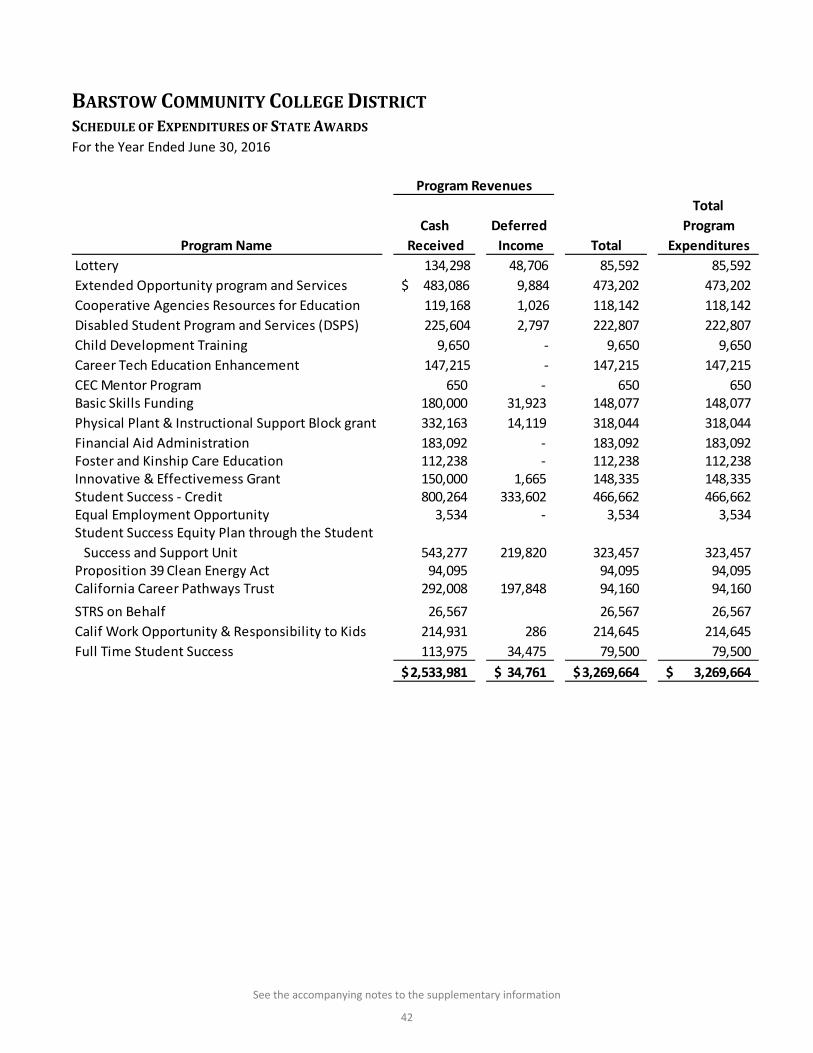
See the accompanying notes to the supplementary information
42
BARSTOWCOMMUNITYCOLLEGEDISTRICTSCHEDULEOFEXPENDITURESOFSTATEAWARDSFor the Year Ended June 30, 2016
Total
Cash Deferred Program
Received Income Total Expenditures
Lottery 134,298 48,706 85,592 85,592
Extended Opportunity program and Services $ 483,086 9,884 473,202 473,202
Cooperative Agencies Resources for Education 119,168 1,026 118,142 118,142
Disabled Student Program and Services (DSPS) 225,604 2,797 222,807 222,807
Child Development Training 9,650 ‐ 9,650 9,650
Career Tech Education Enhancement 147,215 ‐ 147,215 147,215
CEC Mentor Program 650 ‐ 650 650 Basic Skills Funding 180,000 31,923 148,077 148,077
Physical Plant & Instructional Support Block grant 332,163 14,119 318,044 318,044
Financial Aid Administration 183,092 ‐ 183,092 183,092Foster and Kinship Care Education 112,238 ‐ 112,238 112,238Innovative & Effectivemess Grant 150,000 1,665 148,335 148,335Student Success ‐ Credit 800,264 333,602 466,662 466,662Equal Employment Opportunity 3,534 ‐ 3,534 3,534Student Success Equity Plan through the Student
Success and Support Unit 543,277 219,820 323,457 323,457Proposition 39 Clean Energy Act 94,095 94,095 94,095California Career Pathways Trust 292,008 197,848 94,160 94,160
STRS on Behalf 26,567 26,567 26,567
Calif Work Opportunity & Responsibility to Kids 214,931 286 214,645 214,645
Full Time Student Success 113,975 34,475 79,500 79,500
2,533,981$ 34,761$ 3,269,664$ 3,269,664$
Program Revenues
Program Name
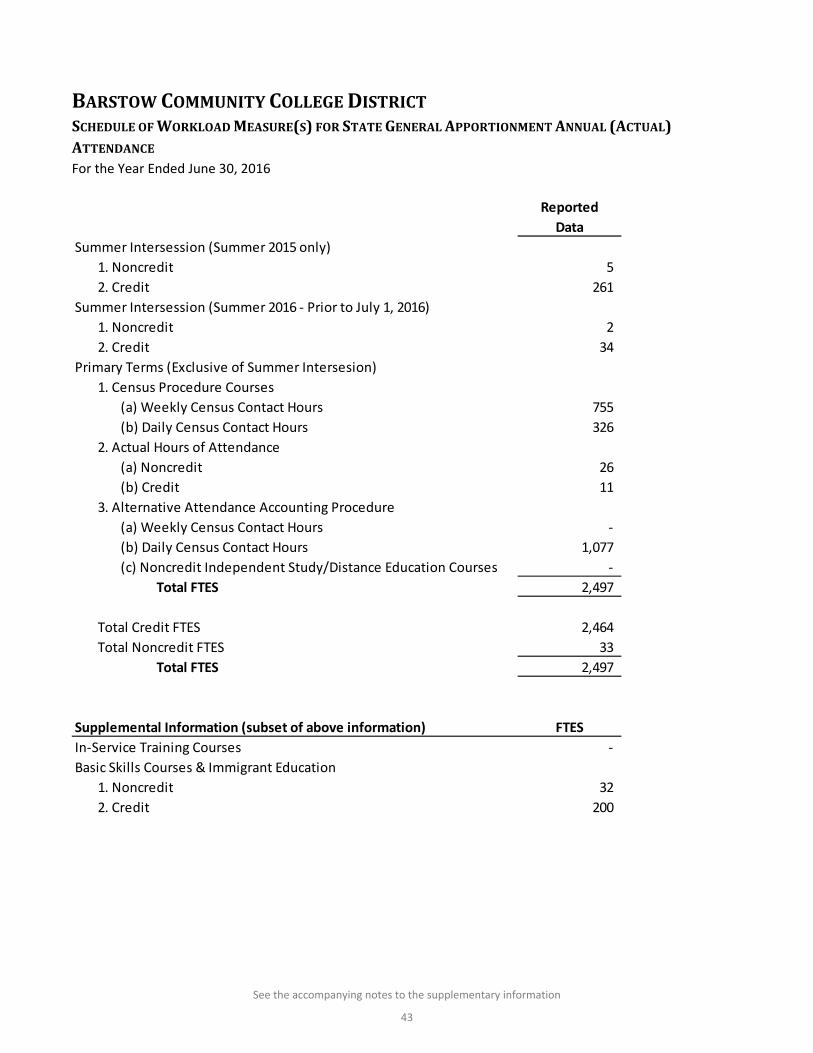
See the accompanying notes to the supplementary information
43
BARSTOWCOMMUNITYCOLLEGEDISTRICTSCHEDULEOFWORKLOADMEASURE(S)FORSTATEGENERALAPPORTIONMENTANNUAL(ACTUAL)ATTENDANCEFor the Year Ended June 30, 2016
Reported
Data
Summer Intersession (Summer 2015 only)
1. Noncredit 5
2. Credit 261
Summer Intersession (Summer 2016 ‐ Prior to July 1, 2016)
1. Noncredit 2
2. Credit 34
Primary Terms (Exclusive of Summer Intersesion)
1. Census Procedure Courses
(a) Weekly Census Contact Hours 755
(b) Daily Census Contact Hours 326
2. Actual Hours of Attendance
(a) Noncredit 26
(b) Credit 11
3. Alternative Attendance Accounting Procedure
(a) Weekly Census Contact Hours ‐
(b) Daily Census Contact Hours 1,077
‐
Total FTES 2,497
Total Credit FTES 2,464
Total Noncredit FTES 33
Total FTES 2,497
Supplemental Information (subset of above information) FTES
In‐Service Training Courses ‐
Basic Skills Courses & Immigrant Education
1. Noncredit 32
2. Credit 200
(c) Noncredit Independent Study/Distance Education Courses
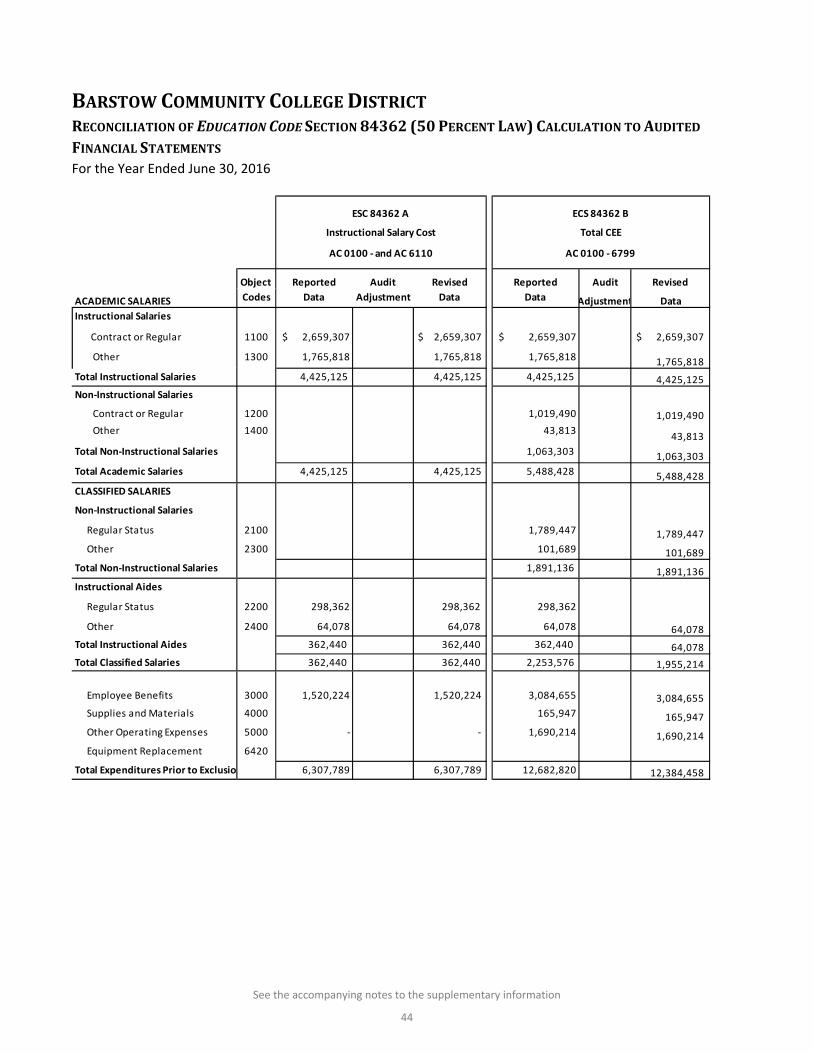
See the accompanying notes to the supplementary information
44
BARSTOWCOMMUNITYCOLLEGEDISTRICTRECONCILIATIONOFEDUCATIONCODESECTION84362(50PERCENTLAW)CALCULATIONTOAUDITEDFINANCIALSTATEMENTSFor the Year Ended June 30, 2016
Audit Revised Audit Revised
Adjustment Data Adjustment Data
$ 2,659,307 2,659,307$
1,765,818 1,765,818
Total Instructional Salaries 4,425,125 4,425,125
1,019,490
43,813
Total Non‐Instructional Salaries 1,063,303
Total Academic Salaries 4,425,125 5,488,428
1,789,447
101,689
Total Non‐Instructional Salaries 1,891,136
298,362
64,078 64,078
Total Instructional Aides 362,440 64,078
Total Classified Salaries 362,440 1,955,214
1,520,224 3,084,655
165,947
‐ 1,690,214
Total Expenditures Prior to Exclusio 6,307,789 12,384,458 6,307,789 12,682,820
Other Operating Expenses 5000 ‐ 1,690,214
Equipment Replacement 6420
Employee Benefits 3000 1,520,224 3,084,655
Supplies and Materials 4000 165,947
362,440 2,253,576
Other 2400 64,078 64,078
362,440 362,440
Instructional Aides
Regular Status 2200 298,362 298,362
Other 2300 101,689
1,891,136
Non‐Instructional Salaries
Regular Status 2100 1,789,447
CLASSIFIED SALARIES
1,063,303
4,425,125 5,488,428
Contract or Regular 1200 1,019,490
Other 1400 43,813
4,425,125 4,425,125
Non‐Instructional Salaries
Contract or Regular 1100 $ 2,659,307 $ 2,659,307
Other 1300 1,765,818 1,765,818
Instructional Salaries
AC 0100 ‐ and AC 6110 AC 0100 ‐ 6799
Object Reported Reported
ESC 84362 A ECS 84362 B
Instructional Salary Cost Total CEE
ACADEMIC SALARIES Codes Data Data
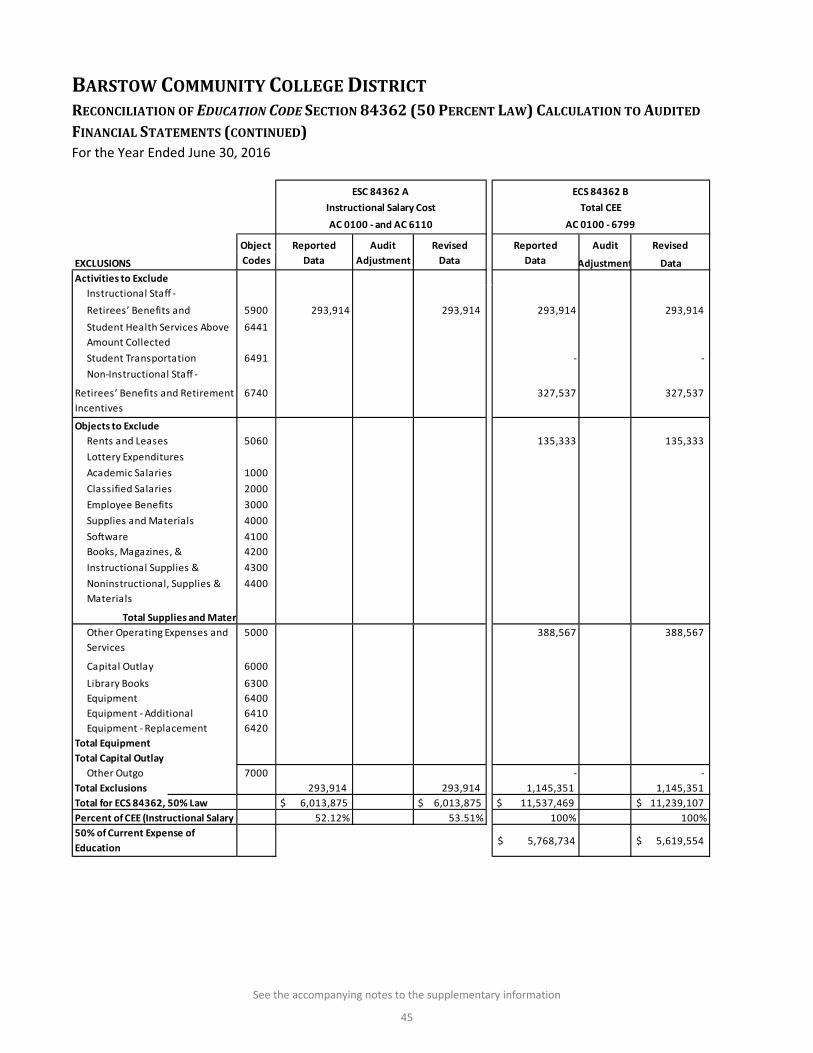
See the accompanying notes to the supplementary information
45
BARSTOWCOMMUNITYCOLLEGEDISTRICTRECONCILIATIONOFEDUCATIONCODESECTION84362(50PERCENTLAW)CALCULATIONTOAUDITEDFINANCIALSTATEMENTS(CONTINUED)For the Year Ended June 30, 2016
Audit Revised Audit Revised
Adjustment Data Adjustment Data
293,914 293,914
‐
327,537
135,333
Total Supplies and Mater
388,567
Total Equipment
Total Capital Outlay
‐
Total Exclusions 293,914 1,145,351
Total for ECS 84362, 50% Law $ 6,013,875 11,239,107$
53.51% 100%
5,619,554$
Percent of CEE (Instructional Salary 52.12% 100%
$ 5,768,734
293,914 1,145,351
$ 6,013,875 $ 11,537,469
50% of Current Expense of
Education
7000 ‐
6420
Equipment 6400
6410
Capital Outlay 6000
Library Books 6300
Equipment ‐ Additional
Other Operating Expenses and
Services
5000 388,567
Instructional Supplies & 4300
Noninstructional, Supplies &
Materials
4400
Software 4100
Books, Magazines, & 4200
Employee Benefits 3000
Supplies and Materials 4000
Academic Salaries 1000
Classified Salaries 2000
Rents and Leases 5060 135,333
Lottery Expenditures
Objects to Exclude
Student Health Services Above
Amount Collected
6441
Student Transportation 6491 ‐
Non‐Instructional Staff ‐
Instructional Staff ‐
ESC 84362 A ECS 84362 B
Instructional Salary Cost Total CEE
Equipment ‐ Replacement
Other Outgo
AC 0100 ‐ and AC 6110 AC 0100 ‐ 6799
Object Reported Reported
EXCLUSIONS Codes Data Data
Activities to Exclude
Retirees’ Benefits and 5900 293,914 293,914
Retirees’ Benefits and Retirement
Incentives
6740 327,537
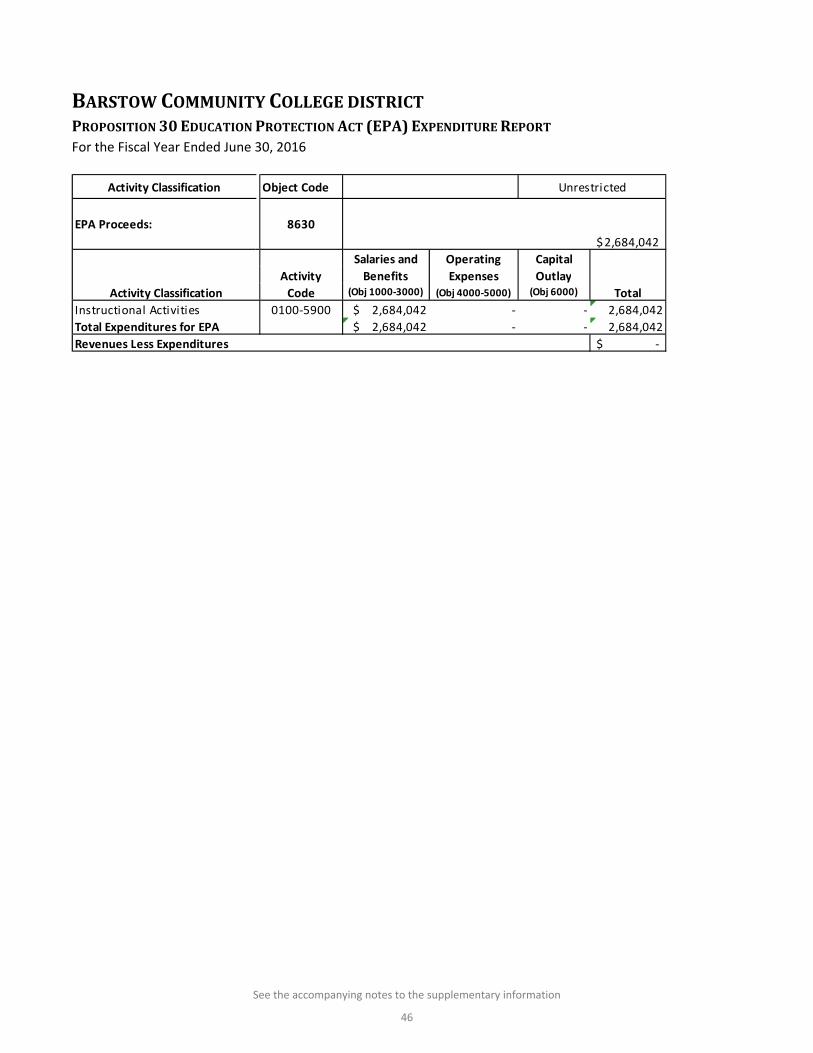
See the accompanying notes to the supplementary information
46
BARSTOWCOMMUNITYCOLLEGEDISTRICTPROPOSITION30EDUCATIONPROTECTIONACT(EPA)EXPENDITUREREPORTFor the Fiscal Year Ended June 30, 2016
2,684,042$
Operating
Expenses(Obj 4000‐5000) Total
‐ 2,684,042
‐ 2,684,042
‐$ Revenues Less Expenditures
Total Expenditures for EPA $ 2,684,042 ‐
Instructional Activities 0100‐5900 $ 2,684,042 ‐
Activity Classification Object Code Unrestricted
Activity Classification Code
Activity Benefits Outlay(Obj 1000‐3000) (Obj 6000)
Salaries and Capital
EPA Proceeds: 8630
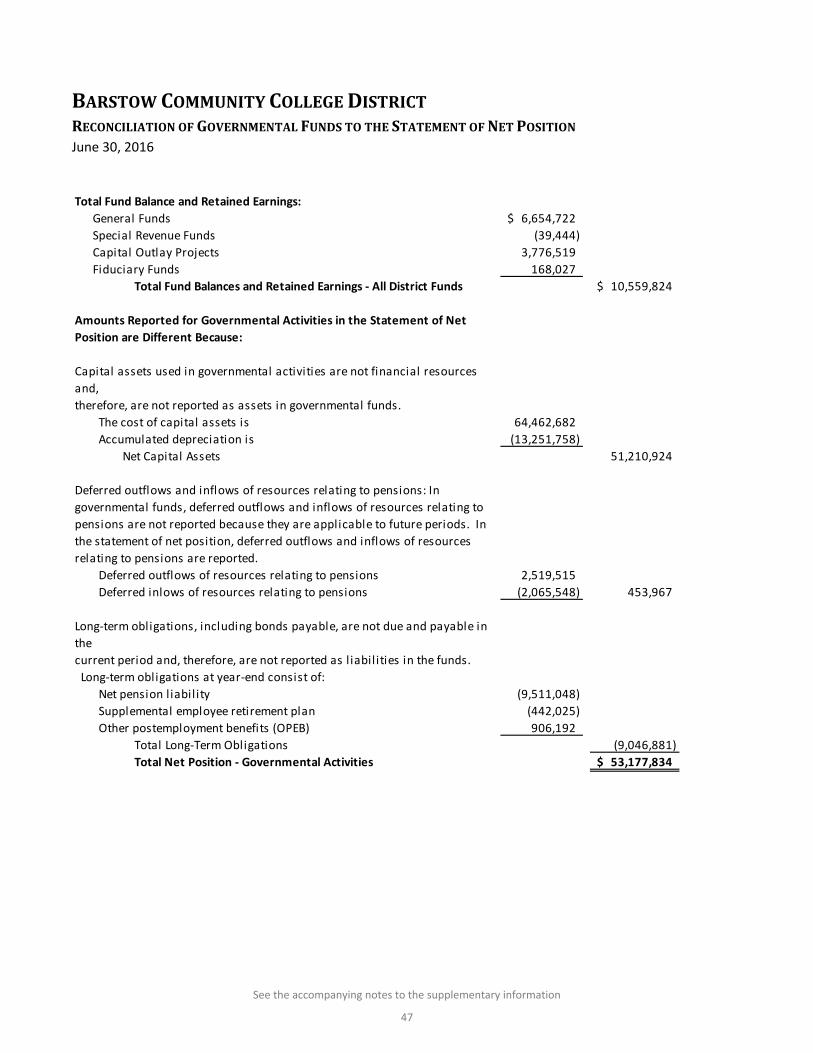
See the accompanying notes to the supplementary information
47
BARSTOWCOMMUNITYCOLLEGEDISTRICTRECONCILIATIONOFGOVERNMENTALFUNDSTOTHESTATEMENTOFNETPOSITIONJune 30, 2016
Total Fund Balance and Retained Earnings:
General Funds 6,654,722$
Special Revenue Funds (39,444)
Capital Outlay Projects 3,776,519
Fiduciary Funds 168,027
Total Fund Balances and Retained Earnings ‐ All District Funds 10,559,824$
Amounts Reported for Governmental Activities in the Statement of Net
Position are Different Because:
Capital assets used in governmental activities are not financial resources
and,
therefore, are not reported as assets in governmental funds.
The cost of capital assets is 64,462,682
Accumulated depreciation is (13,251,758)
Net Capital Assets 51,210,924
Deferred outflows and inflows of resources relating to pensions: In
governmental funds, deferred outflows and inflows of resources relating to
pensions are not reported because they are applicable to future periods. In
the statement of net position, deferred outflows and inflows of resources
relating to pensions are reported.
Deferred outflows of resources relating to pensions 2,519,515
Deferred inlows of resources relating to pensions (2,065,548) 453,967
Long‐term obligations, including bonds payable, are not due and payable in
the
current period and, therefore, are not reported as l iabil ities in the funds.
Long‐term obligations at year‐end consist of:
Net pension l iabil ity (9,511,048)
Supplemental employee retirement plan (442,025)
Other postemployment benefits (OPEB) 906,192
Total Long‐Term Obligations (9,046,881)
Total Net Position ‐ Governmental Activities 53,177,834$
48
BARSTOWCOMMUNITYCOLLEGEDISTRICTNOTETOSUPPLEMENTARYINFORMATIONJune 30, 2016
NOTE 1 – PURPOSE OF SCHEDULES
History and Organization – This schedule provides information about the District’s organization, members of the
governing board, and administration members.
Schedule of Expenditures of Federal Awards – The accompanying Schedule of Expenditures of Federal Awards
includes the Federal grant activity of the District and is presented on the modified accrual basis of accounting.
The information in this schedule is presented in accordance with the requirements of Title 2 U.S. Code of Federal
Regulations (Part 200), Uniform Administrative Requirements, Cost Principles, and Audit Requirements for Federal
Awards (Uniform Guidance). Therefore, some amounts presented in this schedule may differ from amounts
presented in, or used in the preparation of, the financial statements. The District has not elected to use the ten
percent de minimis cost rate as covered in Section 200.414 Indirect (F&A) costs of the Uniform Guidance.
Schedule of Expenditures of State Awards – The accompanying Schedule of Expenditures of State Awards includes
the State grant activity of the District and is presented on the modified accrual basis of accounting. Therefore,
some amounts presented in this schedule may differ from amounts presented in, or used in the preparation of,
the financial statements. The information in this schedule is presented to comply with reporting requirements of
the California State Chancellor’s Office.
Schedule of Workload Measures for State General Apportionment Annual (Actual) Attendance – FTES is a
measurement of the number of pupils attending classes of the District. The purpose of attendance accounting
from a fiscal standpoint is to provide the basis on which apportionments of State funds, including restricted
categorical funding, are made to community college districts. This schedule provides information regarding the
annual attendance measurements of students throughout the District.
Reconciliation of Education Code Section 84362 (50 percent Law) Calculation – ECS 84362 requires the District
to expend a minimum of 50 percent of the unrestricted General Fund monies on salaries of classroom instructors.
This is reported annually to the State Chancellor’s Office. This schedule provides a reconciliation of the amount
reported to the State Chancellor’s Office and the impact of any audit adjustments and/or corrections noted during
the audit.
Proposition 30 Education Protection Act (EPA) Expenditure Report – This schedule provides the District’s
summary of receipts and uses of the monies received through the EPA.
Reconciliation of Governmental Funds to the Statement of Net Position – This schedule provides a reconciliation
of the adjustments necessary to bring the District’s internal fund financial statements, prepared on a modified
accrual basis, to the entity‐wide full accrual basis financial statements required under GASB Statements No. 34
and No. 35 business‐type activities reporting model.
OTHERINDEPENDENTAUDITORS’REPORTS
17072 Silica Drive, Suite 101 * Victorville * California 92395 (760) 241-6376 * Fax (760) 241-2011
messnerandhadley.com
Certified Public Accountants
Paul S. Messner, CPA Cindra J. Hadley, CPA James M. Quinn, CPA, CFE
INDEPENDENT AUDITOR’S REPORT ON INTERNAL CONTROL OVER FINANCIAL REPORTING AND ON COMPLIANCE
AND OTHER MATTERS BASED ON AN AUDIT OF FINANCIAL STATEMENTS PERFORMED IN ACCORDANCE WITH
GOVERNMENT AUDITING STANDARDS
The Board of Trustees
Barstow Community College District
Barstow, California
We have audited, in accordance with the auditing standards generally accepted in the United States of America
and the standards applicable to financial audits contained in Government Auditing Standards issued by the
Comptroller General of the United States, the financial statements of the business‐type activities and the
fiduciary activities of Barstow Community College District (the “District”), as of and for the year ended June 30,
2016, and the related notes to the financial statements, which collectively comprise the District’s basic financial
statements, and have issued our report thereon dated December 30, 2016.
INTERNAL CONTROL OVER FINANCIAL REPORTING
In planning and performing our audit of the financial statements, we considered the District’s internal control
over financial reporting (internal control) to determine the audit procedures that are appropriate in the
circumstances for the purpose of expressing our opinions on the financial statements, but not for the purpose of
expressing an opinion on the effectiveness of the District’s internal control. Accordingly, we do not express an
opinion on the effectiveness of the District’s internal control.
A deficiency in internal control exists when the design or operation of a control does not allow management or
employees, in the normal course of performing their assigned functions, to prevent, or detect and correct,
misstatements on a timely basis. A material weakness is a deficiency, or combination of deficiencies, in internal
control such that there is a reasonable possibility that a material misstatement of the District’s financial
statements will not be prevented, or detected and corrected, on a timely basis. A significant deficiency is a
deficiency, or a combination of deficiencies, in internal control that is less severe than a material weakness, yet
important enough to merit attention by those charged with governance.
Our consideration of internal control was for the limited purpose described in the first paragraph of this section
and was not designed to identify all deficiencies in internal control that might be material weaknesses or
significant deficiencies. Given these limitations, during our audit we did not identify any deficiencies in internal
control that we consider to be material weaknesses. However, material weaknesses may exist that have not
been identified.
50
COMPLIANCE AND OTHER MATTERS
As part of obtaining reasonable assurance about whether the District’s financial statements are free from material
misstatement, we performed tests of its compliance with certain provisions of laws, regulations, contracts, and
grant agreements, noncompliance with which could have a direct and material effect on the determination of
financial statement amounts. However, providing an opinion on compliance with those provisions was not an
objective of our audit and, accordingly, we do not express such an opinion. The results of our tests disclosed no
instances of noncompliance or other matters that are required to be reported under Government Auditing
Standards.
PURPOSE OF THIS REPORT
The purpose of this report is solely to describe the scope of our testing of internal control over financial reporting and compliance and the results of that testing, and not to provide an opinion on the effectiveness of the District’s internal control or on compliance. This report is an integral part of an audit performed in accordance with Government Auditing Standards in considering the District’s internal control and compliance. Accordingly, this communication is not suitable for any other purpose.
Messner & Hadley, LLP
Certified Public Accountants
Victorville, California
December 30, 2016
17072 Silica Drive, Suite 101 * Victorville * California 92395 (760) 241-6376 * Fax (760) 241-2011
messnerandhadley.com
Certified Public Accountants
Paul S. Messner, CPA Cindra J. Hadley, CPA James M. Quinn, CPA, CFE
INDEPENDENT AUDITORS’ REPORT ON COMPLIANCE FOR EACH MAJOR FEDERAL PROGRAM AND ON INTERNAL
CONTROL OVER COMPLIANCE REQUIRED BY UNIFORM GUIDANCE
The Board of Trustees
Barstow Community College District
Barstow, California
REPORT ON COMPLIANCE FOR EACH MAJOR FEDERAL PROGRAM
We have audited Barstow Community College District’s (the “District”) compliance with the types of compliance
requirements described in OMB Compliance Supplement that could have a direct and material effect on each of
the District’s major Federal programs for the year ended June 30, 2016. The District’s major Federal programs
are identified in the Summary of Auditors’ Results section of the accompanying Schedule of Findings and
Questioned Costs.
MANAGEMENT’S RESPONSIBILITY
Management is responsible for compliance with the requirements of laws, regulations, contracts, and grants
applicable to its Federal programs.
AUDITORS’ RESPONSIBILITY
Our responsibility is to express an opinion on compliance for each of the District’s major Federal programs based
on our audit of the types of compliance requirements referred to above. We conducted our audit of compliance
in accordance with auditing standards generally accepted in the United States of America; the standards
applicable to financial audits contained in Government Auditing Standards issued by the Comptroller General of
the United States; and Title 2 U.S. Code of Federal Regulations Part 200, Uniform Administrative Requirements,
Cost Principles, and Audit Requirements for Federal Awards (Uniform Guidance). Those standards and the
Uniform Guidance require that we plan and perform the audit to obtain reasonable assurance about whether
noncompliance with the types of compliance requirements referred to above that could have a direct and
material effect on a major Federal program occurred. An audit includes examining, on a test basis, evidence
about the District’s compliance with those requirements and performing such other procedures as we consider
necessary in the circumstances.
We believe that our audit provides a reasonable basis for our opinion on compliance for each major Federal
program. However, our audit does not provide a legal determination of the District’s compliance.
52
OPINION ON EACH MAJOR FEDERAL PROGRAM
In our opinion, the District complied, in all material respects, with the types of compliance requirements referred
to above that could have a direct and material effect on each of its major Federal programs for the year ended
June 30, 2016.
REPORT ON INTERNAL CONTROL OVER COMPLIANCE
Management of the District is responsible for establishing and maintaining effective internal control over
compliance with the types of compliance requirements referred to above. In planning and performing our audit
of compliance, we considered the District’s internal control over compliance with the types of requirements that
could have a direct and material effect on each major Federal program to determine the auditing procedures that
are appropriate in the circumstances for the purpose of expressing an opinion on compliance for each major
Federal program and to test and report on internal control over compliance in accordance with the Uniform
Guidance, but not for the purpose of expressing an opinion on the effectiveness of internal control over
compliance. Accordingly, we do not express an opinion on the effectiveness of the District’s internal control over
compliance.
A deficiency in internal control over compliance exists when the design or operation of a control over compliance
does not allow management or employees, in the normal course of performing their assigned functions, to
prevent, or detect and correct, noncompliance with a type of compliance requirement of a Federal program on a
timely basis. A material weakness in internal control over compliance is a deficiency, or combination of
deficiencies, in internal control over compliance, such that there is a reasonable possibility that material
noncompliance with a type of compliance requirement of a Federal program will not be prevented, or detected
and corrected, on a timely basis. A significant deficiency is a deficiency, or a combination of deficiencies, in internal
control over compliance with a type of compliance requirement of a Federal program that is less severe than a
material weakness in internal control over compliance, yet important enough to merit attention by those charged
with governance.
Our consideration of internal control over compliance was for the limited purpose described in the first paragraph
of this section and was not designed to identify all deficiencies in internal control over compliance that might be
material weaknesses or significant deficiencies. Given these limitations, during out audit, we did not identify any
deficiencies in internal control over compliance that we consider to be material weaknesses. However, material
weaknesses may exist that have not been identified.
PURPOSE OF THIS REPORT
The purpose of this report on internal control over compliance is solely to describe the scope of our testing of
internal control over compliance and the results of that testing based on the requirements of the Uniform
Guidance. Accordingly, this report is not suitable for any other purpose.
Messner & Hadley, LLP
Certified Public Accountants
Victorville, California
December 30, 2016
17072 Silica Drive, Suite 101 * Victorville * California 92395 (760) 241-6376 * Fax (760) 241-2011
messnerandhadley.com
Certified Public Accountants
Paul S. Messner, CPA Cindra J. Hadley, CPA James M. Quinn, CPA, CFE
INDEPENDENT AUDITORS’ REPORT ON STATE COMPLIANCE
The Board of Trustees
Barstow Community College District
Barstow, California
REPORT ON STATE COMPLIANCE
We have audited Barstow Community College District’s (the “District”) compliance with the state laws and
regulations in accordance with Section 400 of the Chancellor’s Office’s California Community Colleges
Contracted District Audit Manual (CDAM) for the year ended June 30, 2016 and issued our report thereon
December 30, 2016.
MANAGEMENT’S RESPONSIBILITY
Management is responsible for compliance with the requirements of State laws and regulations, and the terms
and conditions identified in the California Community Colleges Chancellor’s Office District Audit Manual issued
in November 2015.
AUDITORS’ RESPONSIBILITY
Our responsibility is to express an opinion on compliance of each of the District’s programs based on our audit
of the types of compliance requirements referred to above. We conducted our audit in accordance with
auditing standards generally accepted in the United States of America and the standards applicable to financial
audits contained in Government Auditing Standards, issued by the Comptroller General of the United States and
the Standards and procedures identified in the California Community Colleges Chancellor’s Office District Audit
Manual issued in November 2015. These standards require that we plan and perform the audit to obtain
reasonable assurance about whether noncompliance with the compliance requirements referred to above could
have a material effect on the applicable programs noted below. An audit includes examining, on a test basis,
evidence about the District’s compliance with those requirements and performing such procedures as we
consider necessary in the circumstances. We believe that our audit provides a reasonable basis for our opinion.
Our audit does not provide a legal determination of the District’s compliance with those requirements.
UNMODIFIED OPINION ON EACH OF THE PROGRAMS
In our opinion, the District complied, in all material respects, with the compliance requirements referred to
above that are applicable to the programs noted below that were audited for the year ended June 30, 2016.
54
In connection with our audit referred to above, we selected and tested transactions and records to determine the
District’s compliance with State laws and regulations in accordance with Section 400 of the Chancellor’s Office’s
California Community College Contracted District Audit Manual (CDAM):
Section 421 Salaries of Classroom Instructors (50 Percent Law)
Section 423 Apportionment for Instructional Service Agreements/Contract
Section 424 State General Apportionment Funding System
Section 425 Residency Determination for Credit Courses
Section 426 Students Actively Enrolled
Section 427 Concurrent Enrollment of K-12 Students in Community College Credit Courses
Section 429 Student Success and Support Program (SSSP)
Section 430 Scheduled Maintenance Program
Section 431 Gann Limit Calculation
Section 435 Open Enrollment
Section 438 Student Fees – Health Fees and Use of Health Fee Funds
Section 439 Prop 39 Clean Energy Fund
Section 440 Intersession Extension Programs
Section 475 Disabled Student Programs and Services (DSPS)
Section 479 To Be Arranged (TBA) Hours
Section 490 Proposition 1D State Bond Funded Projects
Section 491 Education Protection Account Funds
PURPOSE OF THIS REPORT
The purpose of this report is solely to describe the scope of our testing over state laws and regulations based on
the requirements described in the California Community Colleges Contracted District Audit Manual 2015‐2016.
Accordingly, this report is not suitable for any other purpose.
Messner & Hadley, LLP
Certified Public Accountants
Victorville, California
December 30, 2016
SCHEDULEOFFINDINGSANDRESPONSES
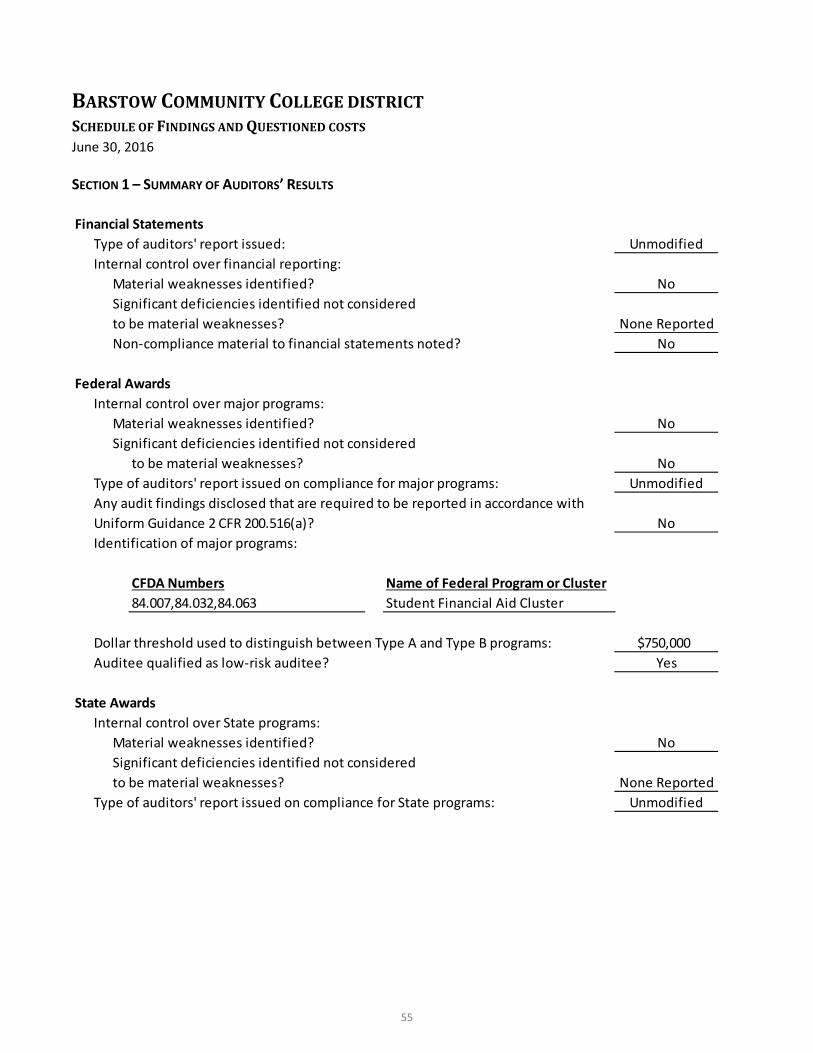
55
BARSTOWCOMMUNITYCOLLEGEDISTRICTSCHEDULEOFFINDINGSANDQUESTIONEDCOSTSJune 30, 2016
SECTION 1 – SUMMARY OF AUDITORS’ RESULTS
Financial Statements
Type of auditors' report issued: Unmodified
Internal control over financial reporting:
Material weaknesses identified? No
Significant deficiencies identified not considered
to be material weaknesses? None Reported
Non‐compliance material to financial statements noted? No
Federal Awards
Internal control over major programs:
Material weaknesses identified? No
Significant deficiencies identified not considered
to be material weaknesses? No
Type of auditors' report issued on compliance for major programs: Unmodified
Any audit findings disclosed that are required to be reported in accordance with
Uniform Guidance 2 CFR 200.516(a)? No
Identification of major programs:
CFDA Numbers Name of Federal Program or Cluster
84.007,84.032,84.063 Student Financial Aid Cluster
Dollar threshold used to distinguish between Type A and Type B programs: $750,000
Auditee qualified as low‐risk auditee? Yes
State Awards
Internal control over State programs:
Material weaknesses identified? No
Significant deficiencies identified not considered
to be material weaknesses? None Reported
Type of auditors' report issued on compliance for State programs: Unmodified
56
BARSTOWCOMMUNITYCOLLEGEDISTRICTSCHEDULEOFFINDINGSANDQUESTIONEDCOSTSJune 30, 2016
SECTION2‐FINANCIALSTATEMENTFINDINGS
The results of our tests did not disclose any findings related to the financial statements that are required to be
reported under Government Auditing Standards.
SECTION3‐FEDERALAWARDSFINDINGSANDRESPONSES
The results of our tests did not disclose any findings and questioned costs related to the federal awards.
SECTION4‐STATEAWARDSFINDINGSANDRESPONSES
The results of our tests did not disclose any findings and questioned costs related to the state awards.
57
BARSTOWCOMMUNITYCOLLEGEDISTRICTSTATUS OF PRIOR YEAR FINDINGS AND QUESTIONED COSTS
JUNE 30, 2016
FINANCIAL STATEMENT FINDINGS
There were no prior year findings or questioned costs.
FEDERAL AWARDS FINDINGS
There were no prior year findings or questioned costs.
STATE AWARDS FINDINGS
There were no prior year findings or questioned costs.


