1 SAN FRANCISCO DEPARTMENT OF PUBLIC HEALTH San Francisco Community Health Improvement Plan ▪ December 2012 ▪ Report can be found online at www.sfdph.org 415.554.2500 This report was not reproduced at public expense.
Transcript
1
SAN FRANCISCO DEPARTMENT OF PUBLIC HEALTH
San Francisco Community Health Improvement Plan
▪ December 2012 ▪
Report can be found online at www.sfdph.org 415.554.2500
Community Connections ........................................................................................................................... 9
Health Equity ............................................................................................................................................. 9
Developing Health Priorities for San Francisco ........................................................................................... 15
Data Sources + Synthesis ........................................................................................................................ 15
San Francisco’s Key Health Priorities for Action ..................................................................................... 17
San Francisco’s Community Health Improvement Plan .............................................................................. 19
Ensure Safe + Healthy Living Environments ............................................................................................ 20
In coordination with nonprofit hospital and academic partners as well as the broader San Francisco community, the San Francisco Department of Public Health (SFDPH) built on the success of the 14-month community health assessment (CHA) effort to create a community health improvement plan (CHIP) for San Francisco. Serving California’s only consolidated city and county and a diverse population of 805,235 residents, SFDPH and its partners endeavored to create a community-driven and transparent CHIP aligned with community values. Building on the past success of Community Vital Signs, SFDPH relied on the Mobilizing for Action Through Planning and Partnerships (MAPP) framework to guide the current CHIP. The result was a community-driven CHIP development process that engaged more than 160 community residents and local public health system partners to identify the following key health priorities for action:
Ensure Safe + Healthy Living Environments
Increase Healthy Eating + Physical Activity
Increase Access to Quality Health Care + Services
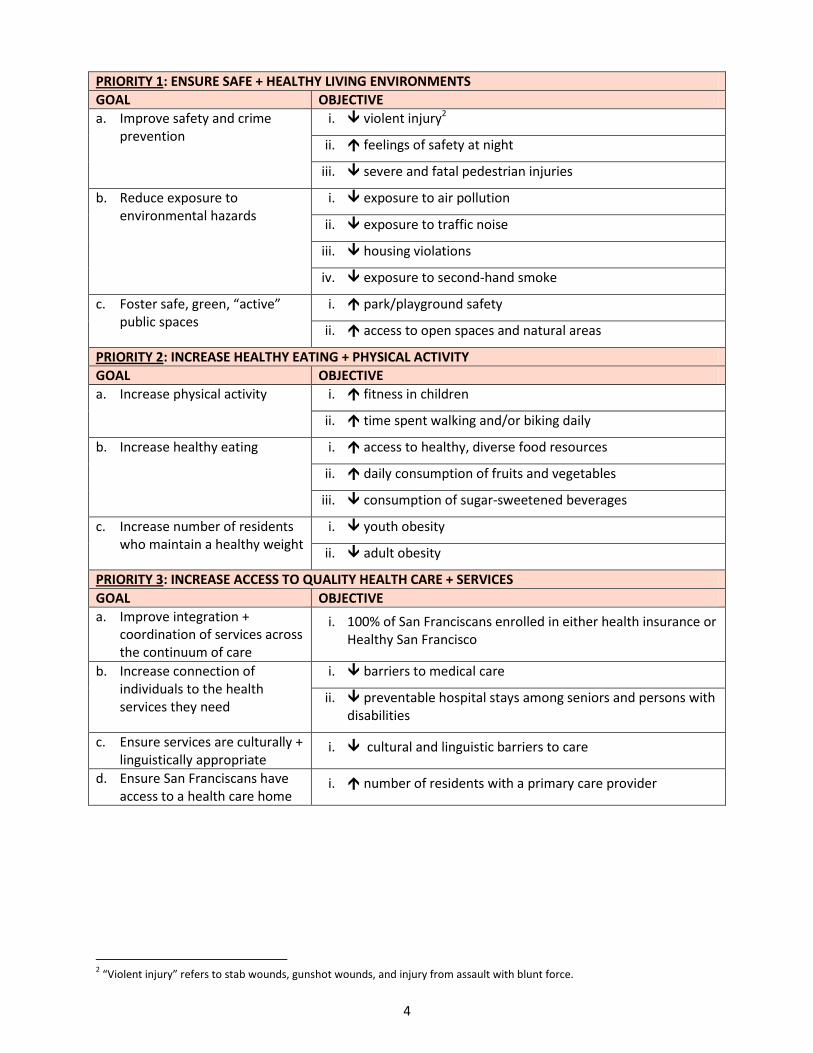
In collaboration with community residents and stakeholders, SFDPH and its partners developed goals and objectives for each priority as well as related measures and strategies that comprise the current CHIP. The diversity of project leads assigned to identified strategies – including a range of government agencies, public/nonprofit/community collaborations, nonprofit organizations, and other entities – demonstrates that the current CHIP is a bold effort to harness the collective impact of San Francisco’s communities and local public health system partners to improve population health. Slated to begin implementation in early 2013, SFDPH and its partners plan to conduct a CHA/CHIP process every three years in alignment with other health improvement initiatives. Please find a summary of San Francisco’s CHIP on the next page.1 SFDPH encourages residents and community groups to join the CHIP process as it enters the Action Phase. For more information, please email [email protected]. By collaborating on priority health issues, community members will help realize the vision of making San Francisco the healthiest place in which to live, learn, play, and earn.
1 Please note that the summary CHIP presents broad-level priorities, goals, and objectives only. The detailed CHIP presents
specific data at the citywide level and also highlights existing disparities by objective.
Health Equity Gives Context to San Francisco’s CHIP
Community residents and stakeholders agree that addressing the social determinants of health (e.g., poverty, educational attainment) are a necessary first step in improving population health and eliminating health disparities. San Francisco’s CHIP highlights health equity as a fundamental value by:
Presenting select socioeconomic data to identify subpopulations and neighborhoods most likely to face health disparities and inequities.
Highlighting baseline data along relevant CHIP indicators for which identified subpopulations face health disparities.
Setting ambitious citywide targets for health improvement, guided by the conviction that all San Franciscans are entitled to a high standard of health and wellness.
b. Increase healthy eating i. access to healthy, diverse food resources
ii. daily consumption of fruits and vegetables
iii. consumption of sugar-sweetened beverages
c. Increase number of residents who maintain a healthy weight
i. youth obesity
ii. adult obesity
PRIORITY 3: INCREASE ACCESS TO QUALITY HEALTH CARE + SERVICES
GOAL OBJECTIVE
a. Improve integration + coordination of services across the continuum of care
i. 100% of San Franciscans enrolled in either health insurance or Healthy San Francisco
b. Increase connection of individuals to the health services they need
i. barriers to medical care
ii. preventable hospital stays among seniors and persons with disabilities
c. Ensure services are culturally + linguistically appropriate
i. cultural and linguistic barriers to care
d. Ensure San Franciscans have access to a health care home
i. number of residents with a primary care provider
2 “Violent injury” refers to stab wounds, gunshot wounds, and injury from assault with blunt force.
5
Approach
Mobilizing for Action Through Planning and Partnerships (MAPP)
Committed to a community-driven health improvement process, San Francisco selected Mobilizing for Action Through Planning and Partnerships (MAPP) as the framework for developing its community health improvement process. Developed by the National Association of County and City Health Officials (NACCHO) and the Centers for Disease Control and Prevention (CDC), MAPP is a community-wide strategic planning process for improving community health. Facilitated by public health leaders and used by local health departments across the country, MAPP helps communities apply strategic thinking to prioritize public health issues and to identify the resources needed to address them. MAPP is not an agency-focused assessment framework; rather, it is an interactive process that can improve the efficiency, effectiveness, and performance of local public health systems. The MAPP process includes six key phases:
Organizing for success and partnership development
Visioning
Conducting the four MAPP assessments
Identifying strategic issues
Formulating goals and strategies
Taking action: planning, implementing, and evaluating
Having completed the first three MAPP phases as part of its Community Health Assessment (CHA) process, San Francisco progressed to the stages of identifying strategic issues and formulating related goals and strategies to complete the current Community Health Improvement Plan (CHIP). SFDPH, in collaboration with the community and its partners, will begin implementing the CHIP – the final phase of the MAPP process – in early 2013. The MAPP framework complements the city/county’s commitment to engage the community in health planning and action in a deliberate and meaningful way. MAPP also builds well on past community health improvement processes while more consistently involving traditional and non-traditional partners of the local public health system. In this way, MAPP offers a “new way of doing business” in San Francisco while achieving greater alignment between all members of the local public system and community.
Exhibit 1. MAPP cycle
6
Community + Partner Engagement
San Francisco’s CHA process engaged hundreds of community residents and local public health system stakeholders. Building on that success, SFDPH sought to engage a range of community stakeholders at each step of CHIP development. Specifically:
Hospital and academic partners continued to partner with SFDPH on San Francisco’s CHA/CHIP Leadership Council, which has guided the development and will guide the implementation of San Francisco’s CHIP. The Leadership Council remains committed to transparency and community and partner engagement throughout the community health improvement process.
Nearly 30 community stakeholders – including representatives from San Francisco’s nonprofit hospitals, academic institutions, health plans, the African American Health Disparities Project, San Francisco Human Services Agency, and SFDPH – gathered for a half-day session on August 3, 2012 to apply standard criteria to cross-cutting data themes and identify San Francisco’s top three health priorities for action.
Close to 70 community residents and members of the local public health system – including representatives from K-12 education, higher education, philanthropy, nonprofit agencies, minority health equity coalitions, government (including the San Francisco Mayor’s Office and Health Commission), hospitals, and more – came together for a full-day session on August 28, 2012 to review San Francisco’s identified health priorities and draft goals and possible strategies for each priority.
More than 60 health content experts engaged with SFDPH as well as its hospital and academic partners to refine priority goals, objectives, measures, and strategies that have come to form the current CHIP.
SFDPH wishes to acknowledge the expertise, enthusiasm, and countless hours committed to CHIP efforts by all persons listed above. SFDPH is committed to building on this foundation of community engagement and partnership as it implements and evaluates the impact of San Francisco’s CHIP.
San Francisco’s Vision for Health and Wellbeing
To develop a community-informed health and wellness vision for San Francisco, SFDPH commissioned four community focus groups between September 22, 2011 and March 22, 2012. In addition, SFDPH and its partners hosted a specific visioning session on June 13, 2012. To ensure adequate focus on vulnerable populations, the four community focus groups took place in those San Francisco neighborhoods with residents most likely to have high health disparities. While the focus of these meetings was access to health services, feedback from community members included broader concerns, including cultural and linguistic competency in service delivery, the need for community outreach and education, the importance of partnerships with community-based organizations, community safety concerns as prerequisite to health, expansion to a broader “wellness” orientation, and the socioeconomic factors that impact health in a community, such as unemployment, housing, and violence. The June 13, 2012
Healthy People, Healthy Families, Healthy Communities: living, learning, playing, earning in San Francisco
160+
Estimated number of community residents and local public health system partners who collaborated to inform and develop San Francisco’s CHIP.
7
meeting focused on eliciting a vision of health and engaged 21 San Francisco residents, each representing a different neighborhood and none affiliated with a health or health care service agency. In each of these sessions, participants answered the following questions, “What does health and wellbeing mean to you? Think about your family, your neighbors, your street, your community. What is your vision for health in San Francisco? What would you do to achieve that vision?” The work of these community participants resulted in San Francisco’s vision for health and wellbeing, which SFDPH reviewed with and received endorsements for from its hospital and academic partners as well as SFDPH leadership, the San Francisco Mayor’s Office, and the San Francisco Health Commission.
At the Foundation: Values for Health and Wellness
From the visioning activities three key values emerged, which serve as the foundation for the process of community health improvement. These are cross-cutting principles that participants and community members viewed as essential to achieving San Francisco’s health vision. The three values for the Community Health Improvement Planning efforts include:
Each of the values is described in more detail below.
Alignment
During the CHA/CHIP process, many residents and service providers expressed the need for greater alignment of efforts in order to have the greatest impact on health; participants repeatedly commented on being in meetings with the same people for similar purposes and the need to merge related endeavors. As such, this plan defines “alignment” as shared priorities, partnerships, and collective effort to reach goals. Also, SFDPH, the University of California – San Francisco (UCSF), and San Francisco’s nonprofit hospitals have come together in a new leadership group under the banner of “Aligned for Action” to coordinate San Francisco’s health assessment and improvement activities.
• To facilitate ALIGNMENT of San Francisco’s priorities, resources, and actions to improve health and wellbeing.
– Engaging communities and health system partners to identify shared priorities and develop effective partnerships.
– Harnessing the collective impact of individuals and organizations working together in coordination.
• To promote COMMUNITY CONNECTIONS that support health and wellbeing.
– Getting to know each other and looking out for one another. – Increasing communication and collaboration among individuals
and organizations within communities.
• To ensure that HEALTH EQUITY is addressed throughout program planning and service delivery.
– Reducing disparities in health access and health outcomes for San Francisco’s diverse communities.
– Partnering with those most affected by health disparities to create innovative and impactful health actions.
8
Alignment brings together a number of intersecting initiatives, all of which share common aims:
San Francisco Health Improvement Partnerships (SFHIP): A program of UCSF to improve the health of the community by integrating the interests, assets, and expertise of UCSF, community, and civic stakeholders to address the most compelling public health issues in San Francisco.
Health Care Services Master Plan (HCSMP): Created by local ordinance, the HCSMP requires SFDPH and the San Francisco Planning Department to create a plan that identifies the current and projected needs for health care services in San Francisco and recommends how to achieve and maintain an equitable and appropriate distribution of health care services in the city.
Nonprofit Hospital Community Needs Assessment: Building a Healthier San Francisco is a citywide collaborative of nonprofit hospitals, SFDPH, local foundations, health plans, and a variety of health organizations and philanthropic foundations that conducts a community health needs assessment for San Francisco every three years as required by state and now federal law.
Public Health Department Accreditation: Public health department accreditation seeks to advance quality and performance within public health departments nationwide. Accreditation is conferred by the national Public Health Accreditation Board and documents the capacity of a public health department to perform the core functions of public health and the 10 Essential Public Health Services. Accreditation signifies that the health department has an appropriate mission and purpose and the ability to meet the needs of the community it serves. SFDPH is pursuing public health department accreditation for which this CHIP is a prerequisite.
Exhibit 2 below depicts how these various processes align.
Exhibit 2. Alignment of San Francisco Health Assessment Initiatives
9
Community Connections
“Community Connections” refers to engaging people and communities to solve problems collectively. Community members, including those unaffiliated with health or healthcare service agencies, expressed interest in being part of the process and not just the objects of interventions designed to “improve their health.” Additionally, people stated their desire for greater social cohesion through connection to their communities by getting to know better and look out for their neighbors. They also noted the need for increased communication and collaboration among individuals and organizations within their communities as ways to foster community connection. Connection with community exemplifies how San Francisco completed its CHA/CHIP by engaging San Franciscans in envisioning health for the city and in articulating and defining the strategies that will lead us to that vision. This value will become increasingly important during the implementation phase as we work to connect people and organizations to accomplish the goals and objectives of the CHIP.
Health Equity
Vulnerable populations and communities often experience health disparities; that is, they have poorer health outcomes than other segments of the population. Health disparities that are avoidable, associated with social disadvantages that create barriers to opportunity, and are considered ethically unfair are called health inequities.3 Health equity requires addressing the social determinants of health (e.g., poverty, educational attainment) as a necessary first step to have a lasting and positive impact on health disparities (e.g., disparities in mortality and morbidity). A NATIONAL MODEL IDENTIFYING THE SOCIAL + ECONOMIC FACTORS AFFECTING HEALTH County Health Rankings4 is a project of the University of Wisconsin Population Health Institute and the Robert Wood Johnson Foundation that helps counties across the country understand what influences how healthy residents are and how long they will live. The Rankings are based on a model of population health that emphasizes the many factors that, if improved, can help make communities healthier places to live, learn, work, and play. This important tool looks at a variety of measures that affect health such as the rate of people dying before age 75, high school graduation rates, access to healthy foods, air pollution levels, and income as well as rates of smoking, obesity and teen births. Each county is then ranked in each category and on each measure relative to other counties in the state.
3 T Truman BI, Smith KC, Roy K, Chen Z, Moonesinghe R, Zhu J, Crawford CG, Zaza S; Centers for Disease Control and Prevention
(CDC), “Rationale for Regular Reporting on Health Disparities and Inequalities — United States,” MMWR Surveill Summ. 2011 Jan 14;60 Suppl:3-10. (http://www.cdc.gov/mmwr/preview/mmwrhtml/su6001a2.htm, accessed 4/15/12.) 4 www.countyhealthrankings.org
Community residents and local public health system partners gathered on August 28, 2012 to review CHIP priorities and brainstorm possible related strategies. The event afforded stakeholders the opportunity to share information and “connect” in meaningful ways.
10
The County Health Rankings model, which appears in Exhibit 3, shows schematically how health factors affect health outcomes. The Rankings measure four types of health factors including physical environment, social and economic factors, clinical care, and health behaviors. (A fifth set of factors that influence health – genetics and biology – is not included in the Rankings model.) As Exhibit 3 shows, the Rankings model holds that social and economic factors – also called social determinants of health – account for 40 percent of the impact on health outcomes. A clear implication of this framework is that vulnerable populations and communities often experience health disparities, at the foundation of which are often health inequities. The Rankings uses the following seven indicators to measure the social and economic factors influencing health; San Francisco ranks 14 out of 56 counties in California for these factors.
San Francisco
County National
Benchmark* California
SF Rank Among CA Counties (of 56)^
Social & Economic Factors 14
High school graduation 76% None Noted 74% 30
Some college 82% 68% 60% 1
Unemployment 9.5% 5.4% 12.4% 4
Children in poverty 15% 13% 22% 8
Inadequate social support 26% 14% 25% 44
Children in single-parent households 29% 20% 30% 24
Violent crime rate per 100,000 population 824 73 500 54
Exhibit 3. County Health Rankings Model
Exhibit 4. County Health Rankings 2012 Measures for San Francisco for Social + Economic Factors
* 90th
percentile (i.e., only 10 percent are better) ^ “1” represents the best possible county rank; “56” the worst.
THE SOCIAL + ECONOMIC FACTORS AFFECTING HEALTH IN SAN FRANCISCO’S DIVERSE COMMUNITIES One key challenge of the Rankings is the inability to drill down and assess these indicators for San Francisco’s neighborhoods and/or racial/ethnic populations; these data do not tell the whole story for San Francisco’s diverse population. To better illustrate San Francisco’s socioeconomic reality, and using the Rankings’ measures as a guide,5 the CHIP presents below a series of similar socioeconomic indicators for which data exist by neighborhood and subpopulation to highlight disparities within San Francisco. Exhibit 5 below shows high school non-graduation, unemployment, poverty, and inadequate social support by race/ethnicity in San Francisco. As reported in the Rankings, these measures have critical and studied links to health:
Educational attainment has an important impact on health as years of formal education correlates strongly with improved work and economic opportunities, reduced psychosocial stress, and healthier lifestyles.
Unemployment may lead to physical health responses ranging from self-reported physical illness to mortality, especially suicide. It has also been shown to lead to an increase in unhealthy behaviors related to alcohol and tobacco consumption, diet, exercise, and other health-related behaviors, which in turn can lead to increased risk for disease or mortality. Because employee-sponsored health insurance is the most common source of health insurance coverage, unemployment can also limit access to health care.
Poverty can result in negative health consequences, such as increased risk of mortality, increased prevalence of medical conditions and disease incidence, depression, intimate partner violence, and poor health behaviors.
Poor family support, minimal contact with others, and limited involvement in community life are associated with increased morbidity and early mortality. Furthermore social support networks have been identified as powerful predictors of health behaviors, suggesting that individuals without a strong social network are less likely to participate in healthy lifestyle choices.
The disproportionately high rates for Black/African American residents for every one of these socioeconomic factors underscores the significant health equity issues that exist for Black/African American San Franciscans.
5 Please note that, diverging from the Rankings, the current CHIP does not present data on children living in single-parent
households. San Francisco’s rate of children in single-parent households may be higher than other areas given its significant lesbian, gay, bisexual, and transgender population. Please note that the US Census Bureau defines “family” as a group of two or more people living together who are related by birth, marriage, or adoption.
12
Exhibit 6 displays these same socioeconomic factors by San Francisco neighborhood. Only those neighborhoods consistently above the citywide average appear on the chart. Please note that it is primarily the same four to five neighborhoods that have the highest disparities among these social and economic determinants of health: Bayview, Chinatown, Downtown/Civic Center, Visitacion Valley, and Excelsior. The Financial District also shows significant disparities, but these data are less reliable due to the relatively small population living in this area.
0%
10%
20%
30%
40%
50%
60%
High School Non-Graduation Rate
Unemployment Poverty Inadequate Social Support
Social/Economic Factors
Non-Hispanic White
Black/African-American
Latino
Asian
Citywide Average
Exhibit 5. Social + Economic Factors in San Francisco by Race/Ethnicity
Source: High School Non-Graduation Rate: CDE, Education Demographics Office, 2009-2010; Unemployment: ACS 1-Year Estimates, 2010; Poverty, Individuals: ACS 1-Year Estimates, 2010; Inadequate Social Support: Moderate or severe interference of emotions with family life, CHIS, 2009 (Note: Due to small CHIS sample size, data for Black/African American, Latino, and Asian populations are statistically unstable.)
13
Exhibit 7 displays violent crime in San Francisco’s neighborhoods. High levels of violent crime compromise physical safety and psychological wellbeing. Crime rates can also deter residents from pursuing healthy behaviors such as exercising outside. Additionally, some evidence indicates that increased stress levels may contribute to obesity, even after controlling for diet and physical activity levels. Many of the same neighborhoods with low educational attainment, high unemployment, and high rates of poverty correlate with high rates of violent crime, specifically, Downtown/Civic Center, Bayview, and Chinatown. As in the chart above, only those neighborhoods with rates above the citywide average are displayed.
0%
10%
20%
30%
40%
50%
60%
70%
80%
Residents 25+ years old with High School Education or Less
Unemployment Percent in Poverty
Chinatown
Visitacion Valley
Bayview
Downtown/Civic Center
Excelsior
South of Market
Mission
Western Addition
Citywide Average
Exhibit 6. Social + Economic Factors in San Francisco by Neighborhood
Source: San Francisco Planning Department, San Francisco Neighborhoods: Socioeconomic Profiles based on ACS 2006-2010.
14
ADDRESSING SOCIAL + ECONOMIC INEQUITIES IN IDENTIFIED SAN FRANCISCO POPULATIONS AND NEIGHBOROODS IS A PREREQUISITE TO ELIMINATING HEALTH DISPARITIES IN THESE COMMUNITIES The data in the three previous exhibits identify the following key health equity issues in San Francisco:
Black/African American San Franciscans fare worse than other residents on every social and economic factor affecting health status.
Latino residents also fare more poorly than other San Franciscans on the social determinants of health.
A handful of San Francisco neighborhoods rate poorly on multiple socioeconomic indicators known to lower residents’ health status:
Bayview Chinatown Downtown/Civic Center Mission South of Market Visitacion Valley
The socioeconomic indicator data on these San Francisco neighborhoods and racial/ethnic populations strongly correlate with health disparities among San Franciscans. CHIP stakeholders repeatedly indicated the need to address these socioeconomic disparities before those communities and residents most affected by them can turn to the downstream factors that impact health. Please note, however, that while education, employment, income, social support, and other socioeconomic factors are important for health and wellbeing, the current CHIP does not address these issues directly. This is largely because these factors are broad social issues that require systematic, institutional change reaching beyond a local public health system’s primary activities. By highlighting the importance of social and economic factors on community health, we hope to provide further motivation to promote broad, cross-cutting efforts to affect change in these areas. To underscore the importance of addressing health equity as a foundational value for addressing population health, health disparities are highlighted in a separate “Equity” column in the health priority section of this CHIP. (Please see Page 19 for more information.)
0
20
40
60
80
100
120
140
160
180
200
Violent Crime Rate
South of Market
Downtown/Civic Center
Bayview
North Beach
Mission
Chinatown
Potrero Hill
Castro/Upper Market
Exhibit 7. Violent Crime in San Francisco by Neighborhood
Source: SFPD, 2005-2007
15
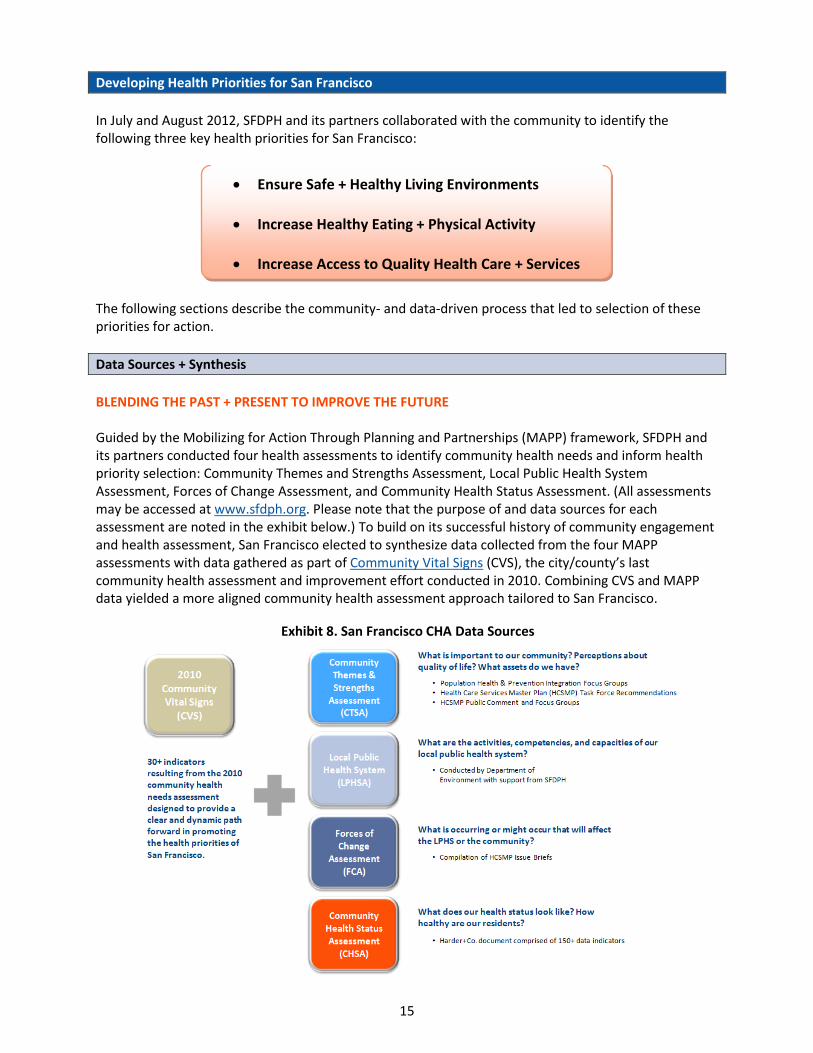
Developing Health Priorities for San Francisco
In July and August 2012, SFDPH and its partners collaborated with the community to identify the following three key health priorities for San Francisco:
The following sections describe the community- and data-driven process that led to selection of these priorities for action.
Data Sources + Synthesis
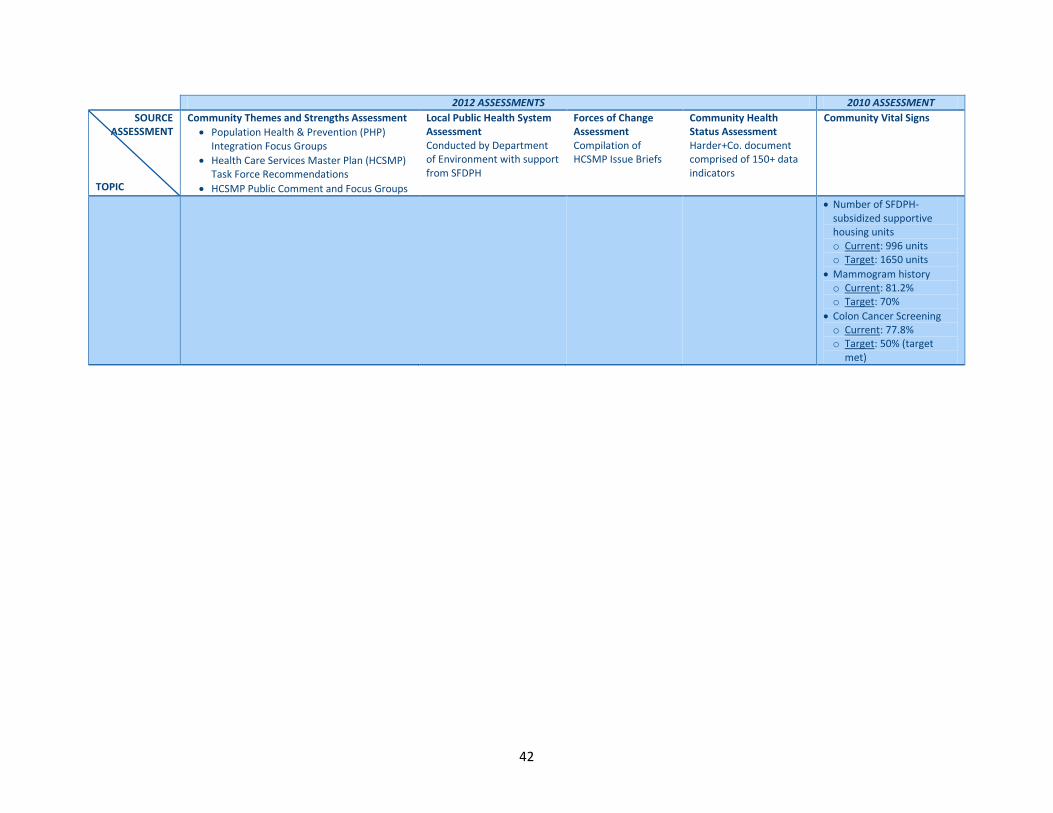
BLENDING THE PAST + PRESENT TO IMPROVE THE FUTURE Guided by the Mobilizing for Action Through Planning and Partnerships (MAPP) framework, SFDPH and its partners conducted four health assessments to identify community health needs and inform health priority selection: Community Themes and Strengths Assessment, Local Public Health System Assessment, Forces of Change Assessment, and Community Health Status Assessment. (All assessments may be accessed at www.sfdph.org. Please note that the purpose of and data sources for each assessment are noted in the exhibit below.) To build on its successful history of community engagement and health assessment, San Francisco elected to synthesize data collected from the four MAPP assessments with data gathered as part of Community Vital Signs (CVS), the city/county’s last community health assessment and improvement effort conducted in 2010. Combining CVS and MAPP data yielded a more aligned community health assessment approach tailored to San Francisco.
To honor community members’ substantive contributions of time and energy devoted to generating MAPP data for the 2012 CHA process, San Francisco’s CHA/CHIP Leadership Council – consisting of SFDPH, nonprofit hospital, and academic partner representatives – took initial responsibility for synthesizing MAPP and CVS data.
The data synthesis process occurred as follows:
1. SFDPH staff grouped MAPP and CVS data by common themes, using “sticky wall” technology to group like data points.
2. SFDPH documented the outcomes of the sticky wall exercise in grid form, presenting easy-to-understand high-level data concepts by data source (e.g., MAPP assessment vs. CVS) and overarching theme. (Please see Appendix A.)
3. SFDPH staff vetted the resulting data synthesis grid with members of the CHA/CHIP Leadership Council, the San Francisco’s Mayor’s Office, and SFDPH leadership and amended the document as necessary.
4. On August 3, 2012, community residents and members of the broader local public health system had the opportunity to comment on the data synthesis grid following an in-depth presentation of MAPP and CVS data. Event participants approved and finalized the grid and cross-cutting data themes.
CROSS-CUTTING THEMES CHA data synthesis yielded the seven cross-cutting themes listed below:
Ensure safe and healthy living environments
Improve behavioral health
Increase access to quality health care and services
Increase physical activity and healthy eating
Reduce the spread of infectious disease
Support early childhood development
Support seniors and persons with disabilities
SFDPH staff member, Jim Soos, participates in a sticky wall exercise to synthesize San Francisco’s CHA data in July 2012.
What is a “sticky wall”?
A sticky wall is a large adhesive surface that affords groups a visual and consensus-based means of organizing similar ideas into cross-cutting concepts and themes. Commonly used as part of Technology of Participation (ToP) facilitation methods, the sticky wall technique:
Engages the participation of all group members,
Helps groups – small and large – reach consensus, and
Builds an effective team partnership. SFDPH relied on the sticky wall technique throughout its CHA/CHIP process, using it to develop San Francisco’s health vision and values, synthesize CHA data into possible health priorities, and identify possible strategies for action along each identified priority.
HEALTH PRIORITY SELECTION On August 3, 2012, SFDPH and its nonprofit hospital and academic partners convened nearly 30 stakeholders for a half-day session to identify community-driven, data-based health priorities for action in San Francisco. Participants included representatives from SFDPH, San Francisco’s nonprofit hospitals and other members of the Community Benefit Partnership, the University of California – San Francisco, and the San Francisco Human Services Agency. Following a brief presentation of San Francisco’s CHA efforts and resulting data and cross-cutting themes, session participants selected San Francisco’s three health priorities as follows:
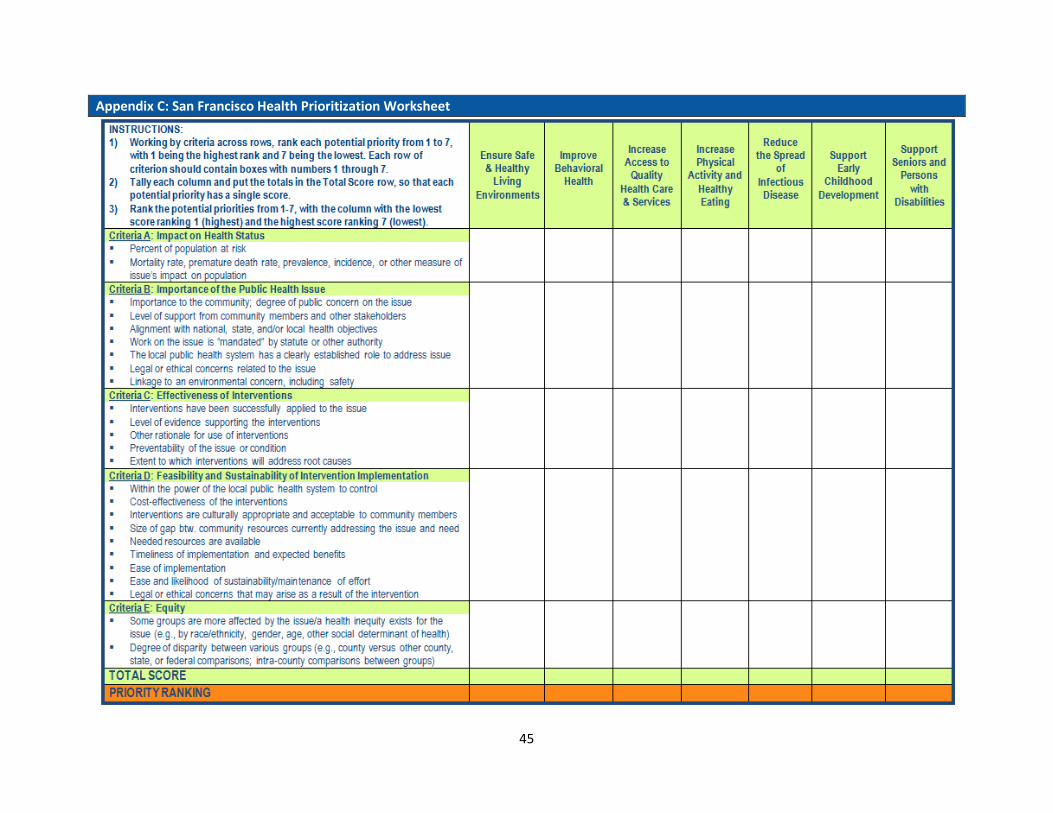
1. Participants reviewed a set of five standard criteria developed and vetted by San Francisco’s CHA/CHIP Leadership Council. Inspired by the “Hanlon Method,” San Francisco priority-selection criteria include:
Magnitude/Size of the Public Health Issue
Other Factors Related to Importance of the Public Health Issue
Effectiveness of Interventions Feasibility and Sustainability of
Intervention Implementation Equity
Please note that San Francisco elected to highlight equity as a priority-selection criterion to uphold the city/county’s fundamental value of reducing disparities in health access and outcomes for San Francisco’s diverse communities. (Please see Appendix B for a more detailed explanation of San Francisco’s priority-selection criteria.)
Top and Middle: Participants rank possible San Francisco health priorities against five standard criteria. Bottom: Comprehensive score sheet identifying San Francisco’s top three health priorities for action.
2. Each participant individually ranked the seven identified cross-cutting data themes against health priority-selection criteria with “1” indicating highest rank and “7” indicating lowest rank. (Please see Appendix C for the rating tool and a more detailed explanation of the scoring process.)
3. Facilitators totaled individual scores for each data theme and criterion to identify San Francisco’s top three health priorities for action. These priorities include:
Ensure Safe + Healthy Living Environment Increase Healthy Eating + Physical Activity Increase Access to Quality Health Care + Services
4. Session participants reviewed the identified priorities and agreed that all selected priority issues
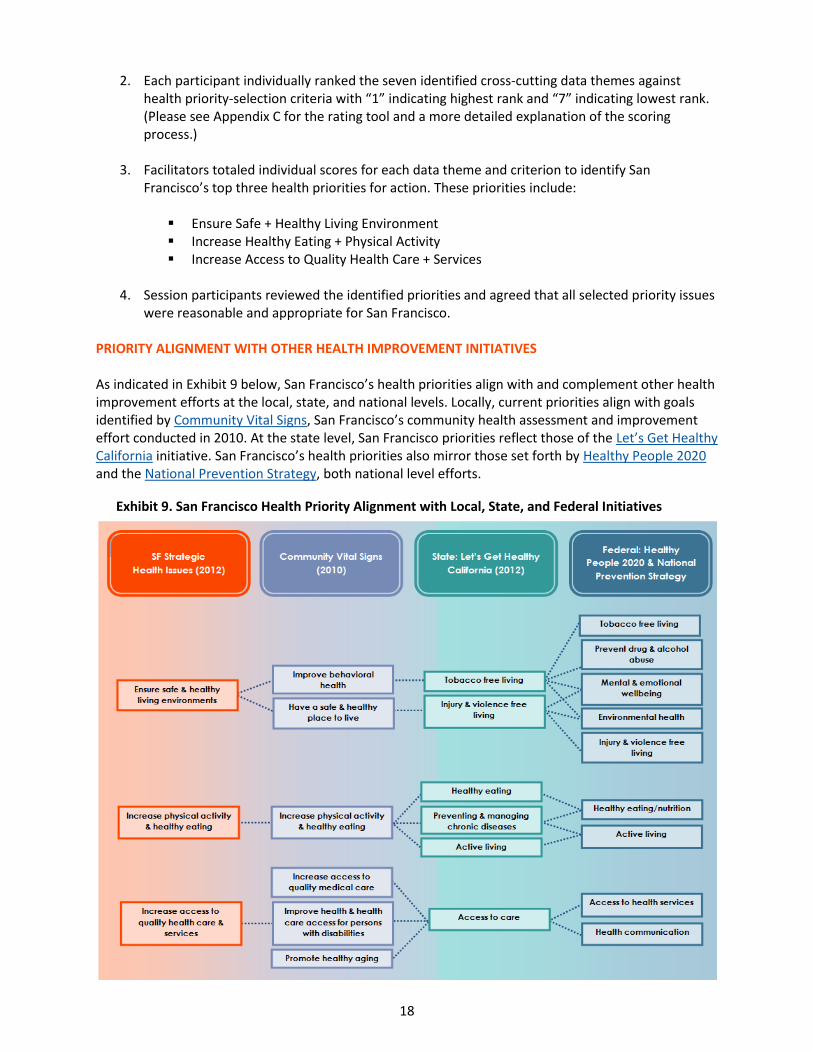
were reasonable and appropriate for San Francisco. PRIORITY ALIGNMENT WITH OTHER HEALTH IMPROVEMENT INITIATIVES As indicated in Exhibit 9 below, San Francisco’s health priorities align with and complement other health improvement efforts at the local, state, and national levels. Locally, current priorities align with goals identified by Community Vital Signs, San Francisco’s community health assessment and improvement effort conducted in 2010. At the state level, San Francisco priorities reflect those of the Let’s Get Healthy California initiative. San Francisco’s health priorities also mirror those set forth by Healthy People 2020 and the National Prevention Strategy, both national level efforts.
Exhibit 9. San Francisco Health Priority Alignment with Local, State, and Federal Initiatives
The following sections detail goals, objectives, indicators, and targets for San Francisco’s health priorities as well as strategies and community assets/resources aligned with each priority. Please note that San Francisco selected the best available indicators to measure community health improvement along its chosen health priorities; however, San Francisco acknowledges that all indicators present limitations, meaning that more specific and appropriate indicators may become available in the future. In addition, please note that San Francisco presents only a select number of strategies in the current CHIP. This list in no way represents the full spectrum of efforts and partners working to improve population health in San Francisco; rather, listed strategies serve as an abbreviated representation of health improvement work happening in San Francisco among community residents, community-based organizations, as well as the private and public sectors. San Francisco elected to set targets for each health improvement objective for both 2020 – in alignment with Healthy People 2020 – and 2016. In general, San Francisco determined the 2020 targets by adopting the Healthy People 2020 methodology of setting a 10 percent improvement over the most recent citywide baseline measurement for the respective indicator. This translates to an intermediate target of five percent improvement for 2016. Focused on health equity, San Francisco deliberated its target setting methodology, considering whether to base targets on citywide averages versus targets that reflect the best-performing sub-populations (e.g., racial/ethnic group, neighborhood, or age group depending on the measure). San Francisco ultimately set targets based on the citywide average – intentionally not setting distinct targets by subpopulation – to show levels of acceptable improvement while also conveying the conviction that all San Francisco residents are entitled to the same high standard of health and wellness. (Please note, however, that, for each measure in the grids that follow, San Francisco highlights data for the best performing subpopulation as an indication of what is possible.) Some targets may appear especially ambitious; however, health equity – and the disparities health inequities cause – is a fundamental San Francisco value that drives decisions on resource allocation and intervention strategies. To ensure CHIP readability, please note the icons below. Each icon corresponds to a different San Francisco health priority for action.
20
Ensure Safe + Healthy Living Environments
Despite being one of the wealthiest and most socially progressive cities in the country, not everyone in
San Francisco has a safe and healthy place to live. Some neighborhoods in San Francisco, for example, have great access to parks, public transit, grocery stores, and other resources that benefit health and wellness. Other neighborhoods – often poor communities of color – are closer to fast food and alcohol outlets, freeways, industrial pollutants, and other factors that contribute to high rates of disease, death, injury, and violence. Community residents echoed the above in
focus groups, community meetings throughout San Francisco’s CHA, and also as voiced through formal grievance channels such as through SFDPH’s Environmental Health Section. Bayview-Hunters Point residents, for example, voiced concerns about environmental hazards in their neighborhood and emphasized – along with other communities – the need for access to clean, green open spaces to support their health and wellbeing.
Community data also indicate that certain neighborhoods and particular racial/ethnic groups are more impacted by crime and violence. San Francisco has an annual violent crime rate of 824 per 100,000, which is higher than both the state average (500 per 100,000) and the national benchmark (73 per 100,000).6 Looking at homicides alone, San Francisco experienced a decline in
the number of homicides between 2007 and 2009; however, Black/African American residents, followed by Latinos, are more likely than other racial/ethnic groups to be killed prematurely by homicide. The “Ensure Safe + Healthy Living Environments” priority highlights the need for health- and wellness-oriented land use planning, meaningful opportunities for outdoor recreation, and a positive built environment for the health of all individuals and communities.
6 County Health Rankings, 2012
Bayview-Hunters Point, Downtown/Civic Center, Financial
District, Mission, and South of Market appear in the top 10 for
all three categories of violent crime (homicide, physical
assaults, rape/sexual assault).
Source: SFPD, 2005-2007
Exhibit 11. Premature Death by Homicide by Age-Adjusted Years of Life Lost (YLL)* for Males by Race/Ethnicity, 2004-2007
*Years of life lost (YLL) equals the number of deaths multiplied by a standard life expectance at the age at which death occurs. Source: CADPH Annual Master Death File, calculated by SFDPH
21
PRIORITY 1: ENSURE SAFE + HEALTHY LIVING ENVIRONMENTS
GOAL OBJECTIVE (Source) INDICATOR (Source) SF BASELINE 2016 CITYWIDE
TARGET (5% Improvement)
2020 CITYWIDE TARGET (10% Improvement)
EQUITY CITYWIDE
a. Improve safety and crime prevention
i. violent injury (SFGH)7 Annual SFGH violent injury incident rate per 100,000 population (SFGH Trauma Registry)
Black/African
American: 453.8
Latino: 121.1
75.1 (606/year = actual number)
71.3 67.6
Best-performing : Asian: 18.9
ii. feelings of safety at night (SF City Survey/SCI)
Perceived safety at night among adult residents (SF City Survey)
Percent of San Francisco playgrounds scoring an “A” or “B” for infrastructure quality and condition, cleanliness, and upkeep (San Francisco Playground Report Card)
Subpopulation disparity data unavailable.
61.0% 64.1% 67.1%
23
PRIORITY 1: ENSURE SAFE + HEALTHY LIVING ENVIRONMENTS
GOAL OBJECTIVE (Source) INDICATOR (Source) SF BASELINE 2016 CITYWIDE
TARGET (5% Improvement)
2020 CITYWIDE TARGET (10% Improvement)
EQUITY CITYWIDE
ii. access to open spaces and natural areas (SCI)
Percent of land that is open space (SF Planning Department via SCI)
Treasure Island + Yerba Buena Island:
0.0% Crocker Amazon:
0.6% SOMA + Nob Hill:
1.3% Mission + Presidio
Heights: 2.0% Outer Richmond:
2.9%
22.8% 23.9% 25.1%
Best-performing: Seacliff: 70.4%
PROJECT LEAD(S) SELECTED STRATEGIES POSSIBLE INDICATOR(S)
HOPE SF, Mayor’s Office Implement recommendations of HOPE SF program, an initiative that seeks to transform eight of San Francisco’s most distressed public housing sites into vibrant, thriving communities through holistic revitalization.
Agendas and/or minutes from public implementation meetings
Kaiser Permanente Promote public-private partnerships to support community gardening projects, which promote individual and neighborhood health and wellbeing.
Creation and maintenance of community gardens
Mayor’s Office, Department of Children Youth and Their Families
Fully implement San Francisco’s Violence Prevention Plan. Dedicated staff to implement plan
Progress reports
SF Department of Environment Implement recommendations of the Healthy Homes Project, a collaboration to develop a plan to transform the community’s vision of healthy homes and neighborhoods into achievable goals and actions with a particular focus on San Francisco’s southeastern neighborhoods.
Agendas and/or minutes from public meetings
Evidence of trainings (e.g., training materials) provided to residents on Integrated Pest Management and the use of safer cleaning products
SF Department of Public Health number of low-income households receiving free healthy homes assessments and, as needed and as funds are available, supporting physical improvements to the home environment.
Documentation that at least 100 low-income households have received free healthy homes assessment by 2016
24
PRIORITY 1: ENSURE SAFE + HEALTHY LIVING ENVIRONMENTS
PROJECT LEAD(S) SELECTED STRATEGIES POSSIBLE INDICATOR(S)
SF Department of Public Health, Community Transformation Grant Team
Reduce exposure to second hand smoke in multi-unit housing. Outline of findings gathered from apartment owners and tenants rights groups’ regarding smoke free housing through surveys, focus groups, and/or meetings
SF Department of Public Health, Community Transformation Grant Team
Facilitate creation of joint use agreements through creation of an online reservation system that will allow community groups to reserve school play yards during non-school hours (Evidence-Based).
Existence of single online database and reservation system expected by October 2015
SF Health Improvement Partnerships, SF Department of Public Health
Assess Deemed Approved Uses Ordinance (DAO) enforcement and implementation.
Agendas and meeting notes
Surveys
SF Human Services Agency – Department of Aging and Adult Services
Implement recommendations of the Age and Disability-Friendly San Francisco Work Group.
Agendas and/or meeting minutes from Age and Disability-Friendly San Francisco Work Group
SF Planning Department Implement San Francisco Better Streets Plan, which creates a unified set of standards, guidelines, and implementation strategies to govern how San Francisco designs, builds, and maintains its pedestrian environment.
Minutes from public meetings focused on implementation
SF Planning Department Completion of first phase, Green Connections grant program, which will result in a Citywide network of green streets that can be built over time, improving pedestrian and bicycle access to parks, open space, and the waterfront.
Six concept plans
Three details designs
Green Connections implementation strategy
SF Recreation and Parks Offer athletic programs to reduce violence. SF Recreation and Parks online calendar of events + activities
COMMUNITY ASSETS + RESOURCES (Examples)
Strong interagency and community collaboration (e.g., SFHIP, CBP, Community Transformation Grant Team, Healthy Homes Project)
Sustainable Communities Index, which facilitates health impact assessment in land use planning
Strong existing programs that address these issues such as SF Tobacco Free Project and Bayview Safe Haven afterschool program (Effective Practice)
Strong network of existing and well-maintained parks
Science links health conditions such as heart disease, diabetes, and cancer to daily practices like eating a
healthy, balanced diet and getting regular exercise. However, the healthy choice is not always the “easy” choice – particularly for San Francisco’s more vulnerable residents – as was repeatedly voiced by community members throughout the CHA/CHIP development process. Socioeconomic factors – such as whether people can afford to buy nutritious foods and safely engage in
exercise in their neighborhoods – and environmental factors – such as whether healthy food options are locally available – impact what individuals eat as well as their activity practices. As indicated in Exhibit 12 below, San Franciscans of all ages fall short of the California average in terms of consumption of five or more fruits and vegetables daily. In addition, disparities exist among different racial/ethnic groups in terms of obesity risk; Latino adults are at greatest risk for obesity, followed by Black/African American residents.10 Physical activity can be discouraged by risk for injury. In San Francisco, for example, pedestrians face greater risk for injury and death in some neighborhoods than others. The Financial District, Chinatown, South of Market, Downtown/Civic Center, North Beach, Castro/Upper Market, Western Addition, Glen Park, and Mission neighborhoods exceed the citywide average for pedestrian injury and death.11 The “Increase Healthy Eating + Physical Activity” priority strives to demonstrate the link between diet, inactivity, and chronic disease and to help San Francisco create environments that make healthy choices the easy choices, so all San Francisco residents have an equal chance to eat well and move more.
10
California Health Interview Survey, 2009 11
Calculated from 2004-2008 SWITRS data and 2007 population data from Applied Geographic Solutions, Inc.
Exhibit 12. Percentage of Residents Consuming Five or More Fruits/Vegetables Daily, 2005 and 2009
San Francisco Percentage
California Percentage
Children (ages 2-11), 2009 25.2 48.7
Teens (ages 12-17), 2009 6.8 19.9
Adults (ages 18+), 2005 46.9 48.7
Source: CHIS, 2005 and 2009
[Young people’s] diets are horrible corner store diets, they don’t have physical education in schools, and they are not paying attention to their health.
GOAL OBJECTIVE (Source) INDICATOR (Source) SF BASELINE 2016 CITYWIDE
TARGET (5% Improvement)
2020 CITYWIDE TARGET (10% Improvement)
EQUITY CITYWIDE
a. Increase physical activity
i. fitness in children (LGHC) Percentage of physically fit children within the San Francisco Unified School District who score 6 of 6 on the California Fitness-gram test (CDE and SFUSD)
GOAL OBJECTIVE (Source) INDICATOR (Source) SF BASELINE 2016 CITYWIDE
TARGET (5% Improvement)
2020 CITYWIDE TARGET (10% Improvement)
EQUITY CITYWIDE
ii. daily consumption of fruits and vegetables (CHIS)
Percent of children and teens (ages 2-17) who consume five or more servings of fruits and vegetables daily (CHIS)
Black/African American: Not
Available12 White: 17.6%* Asian: 17.2%*
18.3%* 19.2% 20.1%
Best-performing: Latino: 26.7%*
iii. consumption of sugar-sweetened beverages (LGHC)
Percent of children and adolescents who consumed two or more glasses of soda or sugary drink yesterday (CHIS)
Asian: 24.2%* Latino: 33.9%*
17.2% 16.3% 15.5% Best-performing:
White: 4.4%*
c. Increase number of residents who maintain a healthy weight
i. youth obesity (LGHC/HP 2020)
Percent of youth (San Francisco students in Grades 5, 7, and 9) who score within the “High Risk” category (obese) for body composition on the Fitnessgram physical fitness test (CDE via Kaiser Permanente)
American Indian/Alaska Native: 42.6% Latino: 37.7% Black/African
American: 32.8% 24.2 23.0% 21.8%
Best-performing: Asian: 15.3%
ii. adult obesity (HP 2020) Percent of adults that report a BMI ≥ 30 (CHIS)
Latino: 56.9% Black/African
American: 33.4%* 17.2%
16.3% 15.5%
Best-performing: Asian: 7.1%*
12
Please note that Black/African Americans and other racial/ethnic groups may be underrepresented among children and teens who consume 5+ servings of fruits and vegetables daily; CHIS does not provide estimates for samples smaller than 500 people.
* Statistically unstable due to small subpopulation sample size; best data available.
PROJECT LEAD(S) SELECTED STATEGIES POSSIBLE INDICATOR(S)
American Heart Association Support healthy food procurement and healthy food retail incentives.
Documented procurement and incentive policies for healthy food
Boys and Girls Club of SF Implement Power Play, 30 minutes of daily fun, non-competitive physical activity at each of San Francisco’s nine Boys and Girls Clubs.
Average daily attendance records
Children’s Council of SF Increase physical activity by developing and enforcing a physical activity policy for child care providers involved in the US Department of Agriculture’s Child and Adult Care Food Program.
Written, approved physical activity policy
SF Department of Public Health Maintain Safe Routes to Schools programming (Evidence- Based).
Continued online presence and project updates posted for Safe Routes to Schools Program
SF Human Services Agency - Department of Aging and Adult Services
Continue to support evidence-based preventive programs for adults with disabilities and seniors such as Chronic Disease Self-Management and Healthier Aging.
Department of Aging and Adult Services Annual Area Plan Update
SF Municipal Transportation Agency Encourage more regular physical activity through a citywide network of Sunday Streets events (Promising Practice).
Online calendar of Sunday Streets events
SF Municipal Transportation Agency, SF Bike Coalition
Connect emerging regional bike sharing project with HOPE SF projects and other city-funded development to ensure the presence of bike sharing at the new developments.
Map of bike sharing stations + HOPE SF project locations
SF Municipal Transportation Agency, SF Bike Coalition
creation of new separated bikeways in San Francisco. Agendas and/or minutes from public meetings advancing installation of bike sharing system
Shape Up SF Promote physical activity through Shape Up SF’s annual Walking Challenge.
Data from Walking challenge website + database
Shape Up SF education and awareness efforts regarding the health impacts of sugar-sweetened beverages.
Organizations adopting wellness policies
Copies of awareness campaign materials
Shape Up SF, Kaiser Permanente, Healthy Eating Active Living (HEAL) Zone, Southeast Food Access Work Group, Tenderloin Healthy Corner Store Coalition, SF Department of Public Health, Community Transformation Grant Team
Conduct healthy retail assessments in the Bayview-Hunters Point and Tenderloin neighborhoods.
Store assessment data from Bayview and Tenderloin as well as retail assessments from other neighborhoods
Shape Up SF/Physical Education Advocates, University of California-Berkeley, SF Unified School District
amount of physical education for elementary school students by working with SFUSD administration and principals.
University of California, Berkeley Physical Education Assessment
PROJECT LEAD(S) SELECTED STATEGIES POSSIBLE INDICATOR(S)
Southeast Food Access Work Group + Other Neighborhood-Specific Groups
Implement Food Guardian program in underserved neighborhoods.
Agendas and/or minutes from public meetings advancing expansion of Food Guardian program to other neighborhoods
YMCA of San Francisco Develop and implement healthy eating and nutritional standards in all YMCA youth and out-of-school time programs in San Francisco.
Audit of YMCA-provided meals and snacks by JNC Consulting
YMCA of San Francisco Develop and implement physical activity standards measuring minutes per day on age- and program-appropriate basis.
Evidence of written physical activity standards
COMMUNITY ASSETS + RESOURCES (Examples)
Strong interagency and community collaboration to improve nutrition (e.g., SFHIP, Southeast Food Access Network, SF Food Security Task Force)
Strong interagency and community collaboration to improve opportunities for physical activity (e.g., Sunday Streets, Walk First, Bayview HEAL Zone, Safe Routes to School, SFHIP)
Current Assessment Efforts: Communities of Excellence in Nutrition, Physical Activity, and Obesity Prevention (CX3)
30
Increase Access to High Quality Health Care + Services
Access to comprehensive, high quality health care and other services is essential in preventing illness,
promoting wellness, and fostering vibrant communities. While San Francisco often outperforms the state and other California counties in terms of health care resources like primary care doctors, availability does not always equal accessibility; many of San Francisco’s more vulnerable residents – ranging from low-income persons to non-native English speakers seeking culturally competent care in their primary language – struggle to get the services they need to be healthy and well.
As of 2010, 94 percent of San Franciscans between the ages of 18 and 64 either had health insurance or were enrolled in Healthy San Francisco, a program that is part of San Francisco’s safety net.13 As indicated in Exhibit 13 above, however, San Francisco falls short of the Healthy People 2020 target for residents with a usual source of care. Some residents may lack a usual source of care because they do not have insurance and are not enrolled in Healthy San Francisco; others, because providers do not accept their coverage. According to a study conducted in 2008, California providers are less likely to serve Medi-Cal beneficiaries compared to those with private insurance or Medicare, likely because of the state’s low reimbursement rate.14 Data also suggest that San Franciscans who speak English less than very well – as well as English speakers with limited literacy skills – may struggle to access the services they need. In focus groups, residents often expressed the importance of the linguistic and cultural competency of service providers in diminishing their anxiety and frustration. The “Increase Access to High Quality Health Care + Services” priority strives to bridge these gaps, so all residents may access the services they need to support their health and wellbeing.
13
Health Matters in San Francisco; American Community Survey 1-Year Estimates, 2010 14
Bindman, A, Chu P, Grumbach K. Physician Participation in Medi-Cal, 2008. Prepared for the California Health Care Foundation. July 2010.
Exhibit 13. Percentage of Residents with Usual Source of Care (2009)
San Francisco Percentage
California Percentage
HP 2020 National Target Percentage
Usual source of care (all ages) 86.8 85.8 95.0
Source: California Health Interview Survey (CHIS), 2009; Healthy People 2020
My English level is okay for daily speaking. For medical questions, I need a translator, but it takes a long time. Sometimes I don’t want to wait, so I just guess what it’s about.
- Chinese-speaking Excelsior resident
31
PRIORITY 3: INCREASE ACCESS TO HIGH QUALITY HEALTH CARE + SERVICES
GOAL OBJECTIVE (Source) INDICATOR (Source) SF BASELINE 2016 CITYWIDE
TARGET (5% Improvement)
2020 CITYWIDE TARGET (10% Improvement)
EQUITY CITYWIDE
a. Improve integration + coordination of services across the continuum of care
i. 100% of San Franciscans enrolled in either health insurance or Healthy San Francisco (HP 2020/Community Target)
Percent of currently insured (CHIS) + percent enrolled in Healthy San Francisco (HSF) Subpopulation data
unavailable 94% 99% 100%
b. Increase connection of individuals to the health services they need
i. barriers to medical care (HP 2020)
Percent of persons who delayed or did not obtain medical care (CHIS)
* Statistically unstable due to small subpopulation sample size; best data available.
32
PRIORITY 3: INCREASE ACCESS TO HIGH QUALITY HEALTH CARE + SERVICES
PROJECT LEAD(S) SELECTED STRATEGIES POSSIBLE INDICATOR(S)
SF Department of Public Health Implement the Medical Home Model at all SFDPH clinics (Evidence-Based)
Health Commission meeting minutes
SF Department of Public Health, Community Transformation Grant Team
the number of primary care health systems in San Francisco that use community health workers to help patients manage chronic conditions (Evidence-Based).
Post-graduation placement data from City College of San Francisco Community Health Worker Certificate Program
SF Department of Public Health; participating SF hospitals, community clinics, and medical groups
Maintain Healthy San Francisco (HSF) program. Continued HSF online presence
HSF Annual Reports
SF hospitals Provide charity care to qualified individuals. Annual Charity Care Report
SF hospitals Provide medical financial assistance for those who qualify. Annual Charity Care Report
SF Human Services Agency - Department of Aging and Adult Services
access to long-term supports and services through better coordination of primary care and long-term supports and services.
Creation of Long-Term Care Integration Plan
SF Medical Society Sustain a local health information exchange. Continued online presence and operation of HealthShare Bay Area
YMCA of San Francisco Develop and implement with health care providers and insurers community-based chronic disease prevention programs, such as the CDC-approved diabetes prevention program.
Written program brochures/materials
COMMUNITY ASSETS + RESOURCES (Examples)
Health Reform as driver toward primary care home as well as integration and Coordination
Healthy San Francisco + SFPATH
SF system of care (SFDPH, nonprofit hospitals, community clinics, private providers)
Addressing the Factors that Affect Health Outcomes
As noted previously, the County Health Rankings model shows how four different factors (physical environment, health behaviors, clinical care, and social and economic factors) affect health outcomes. Health outcomes measure the health of a community and are often described as measures of morbidity (how healthy people feel) and mortality (how long people live). San Francisco’s three CHIP priorities, combined with the CHIP’s foundational value of health equity, align with these four health factors. Exhibit 14 below illustrates this alignment and how it impacts key health outcomes currently facing San Francisco, as outlined in the Community Health Status Assessment. Exhibit 14. Alignment of CHIP to the County Health Rankings Model
34
From Planning to Action: Next Steps
CHIP Implementation, Evaluation, and Sustained Action
San Francisco will begin CHIP implementation in early 2013. After implementation, San Francisco will:
Continue to engage community stakeholders via CHIP implementation and evaluation activities.
Evaluate and track progress along priority objectives and measures. This monitoring will take place annually and at the end of the current CHIP’s lifecycle. As required by specific objectives, longer term measures will be tracked as directed.
The current CHIP reflects coordinated health improvement efforts for the period 2013 to 2015 inclusive. In alignment with other initiatives, San Francisco will conduct a new CHA/CHIP process every three years. Such aligned initiatives include:
SFDPH pursuit of public health department accreditation;
Nonprofit hospital health assessment and community benefit requirements set forth by federal Health Reform, California Senate Bill 697, and the San Francisco Charity Care Ordinance;
University of California, San Francisco Health Improvement Partnerships;
Health Care Services Master Plan; and
US Centers for Disease Control and Prevention Community Transformation Grant To support sustained action, San Francisco is currently working to develop a community health improvement leadership structure that will include traditional and non-traditional partners as well as community residents. This body will oversee CHA/CHIP planning and implementation going forward and will assure alignment of San Francisco’s health improvement efforts for the benefit of all San Franciscans.
What You Can Do to Improve Community Health in San Francisco
SFDPH and its partners encourage all community residents and stakeholders to participate in improving health in San Francisco. Engagement can take many forms. For example:
Join SFDPH and its partners as San Francisco enters the Action Phase of CHIP implementation. Please email [email protected] for more information.
Attend regular meetings of the Community Benefit Partnership (CBP), which meets on the first Friday of each month from 10 am – 12 noon. CBP seeks to harness the collective energy and resources of San Francisco’s private nonprofit hospitals, City/County departments, community clinics, health plans, and nonprofit providers, residents, and advocacy groups to improve the health status of San Francisco residents as guided by community-identified health priorities.
Commit yourself or your agency to improving health along a San Francisco-identified health priority. SFDPH and its partners acknowledge that the number of possible objectives and strategies for each health priority exceed what could reasonably be included in the current CHIP; however, all are welcome to use the CHIP to guide their own work and related efforts to improve health in San Francisco!
Appendix A: San Francisco CHA Data Synthesis Grid by Cross-Cutting Theme + Data Source
Please see the pages that follow for San Francisco’s final CHA data synthesis grid by cross-cutting theme and data source.
Potential Priority Health Issues for San Francisco
2012 ASSESSMENTS 2010 ASSESSMENT
SOURCE ASSESSMENT
TOPIC
Community Themes and Strengths Assessment
Population Health & Prevention (PHP) Integration Focus Groups
Health Care Services Master Plan (HCSMP) Task Force Recommendations
HCSMP Public Comment and Focus Groups
Local Public Health System Assessment Conducted by Department of Environment with support from SFDPH
Forces of Change Assessment Compilation of HCSMP Issue Briefs
Community Health Status Assessment Harder+Co. document comprised of 150+ data indicators
Community Vital Signs
Ensure Safe & Healthy Living Environments
Certain communities and subpopulations face violence to greater degrees than others. In addition to threatening one’s physical health, violence also subjects communities to trauma and possible mental health issues. When asked to envision what a healthy San Francisco would look like, many residents cited safety as a key component.
Residents noted the importance of access to a quality, affordable education and economic (i.e., job) opportunities in order to secure a living wage that supports healthy choices.
Many community residents cited the importance of a clean environment in promoting optimal health and wellbeing. Bayview residents, for example, cited concerns about environmental toxicity.
The HCSMP should address identified social and environmental factors that impede and prevent access to optimal care, including but not limited to violence and safety issues as well as environmental hazards.
There is moderate activity by the local public health system to diagnose and investigate health problems and health hazards.
There is significant activity by the local public health system to enforce laws and regulations that protect health and ensure safety.
San Francisco has an annual violent crime rate that is higher than the state average and national benchmark.
Disparities in crime appear to exist by race/ethnicity and neighborhoods.
Significant disparities exist between neighborhoods for risk of ped. injury & death.
Homicide is the leading cause of death among Latino males in San Francisco.
Although there appears to be a recent dramatic decline in the number of homicides in San Francisco, Blacks/African Americans are more likely than those in other racial/ethnic groups to die of homicide.
Rate of pedestrian injuries and deaths o Current: 101/100,000 o Target: 20/100,000
Violent crime rate o Current: 8.45/1,000 o Target: 1.0/1,000
Ratio of bike lanes and bike paths to miles of road o Current: 0.066 miles of
bike lanes to 1 mile of streets
o Target: 0.054 miles of bike lanes to 1 mile of streets
36
2012 ASSESSMENTS 2010 ASSESSMENT
SOURCE ASSESSMENT
TOPIC
Community Themes and Strengths Assessment
Population Health & Prevention (PHP) Integration Focus Groups
Health Care Services Master Plan (HCSMP) Task Force Recommendations
HCSMP Public Comment and Focus Groups
Local Public Health System Assessment Conducted by Department of Environment with support from SFDPH
Forces of Change Assessment Compilation of HCSMP Issue Briefs
Community Health Status Assessment Harder+Co. document comprised of 150+ data indicators
Community Vital Signs
Income inequality is growing. San Francisco has the highest degree of income inequality among Bay Area counties, and certain sub-populations are more likely than others to experience poverty.
Improve Behavioral Health
Participants in the transgender and monolingual Spanish focus groups cited mental health services as a particular need.
The HCSMP should promote behavioral health, including the integration of behavioral health and medical care services.
Age-adjusted death rate due to suicide o Current: 10.7/100,000 o Target: 5.0/100,000
Adults who smoke o Current: 12.5% o Target: 12%
Lung & Bronchus Cancer Incidence Rate o Current: 51.6/100,000 o Target: 48.7/100,000
Liver & bile duct cancer incidence rate o Current: 14.8/100,000 o Target: 5.5/100,000
Increase Access to Quality Health Care & Services
The need for culturally competent health care services, including language access, emerged throughout public comment and focus groups.
Some members of the public as well as participants in the monolingual Spanish focus group noted that they experienced limited access to health care services due to unlimited hours of operation.
Many focus group participants noted the need for greater access to affordable dental and vision services.
Medi-Cal recipients expressed a desire for more options when choosing a health care
There is moderate activity by the local public health system to evaluate the effectiveness, accessibility, and quality of personal and population-based health services.
There is moderate activity to inform, educate, and empower individuals and communities about health issues.
There is moderate activity
Health Reform will place greater demand on San Francisco’s health care resources.
Health care finance trends – including reimbursement mechanisms – impact the provision and outcomes of patient care.
More than 12 languages are spoken in San Francisco, a sign of its cultural diversity.
San Francisco offers a rich array health care services and resources to residents; however, resource availability does not necessarily equate with access.
The Tenderloin, South of Market and Bayview-
98 percent of San Franciscans have health insurance or enrolled in a comprehensive access program (Goal = 100%).
Preventable emergency room visits: o Current: 237.8/10,000 o Target: 234.6/10,000
Hospitalization rate due to congestive heart failure o Current: 30.9/10,000
37
2012 ASSESSMENTS 2010 ASSESSMENT
SOURCE ASSESSMENT
TOPIC
Community Themes and Strengths Assessment
Population Health & Prevention (PHP) Integration Focus Groups
Health Care Services Master Plan (HCSMP) Task Force Recommendations
HCSMP Public Comment and Focus Groups
Local Public Health System Assessment Conducted by Department of Environment with support from SFDPH
Forces of Change Assessment Compilation of HCSMP Issue Briefs
Community Health Status Assessment Harder+Co. document comprised of 150+ data indicators
Community Vital Signs
provider.
Many focus group participants cited cost as a barrier to care, particularly for the uninsured.
Public comment & focus group comments touched on the importance of the location of health care facilities. Several members of the public – and representatives from all focus groups –noted that lengthy travel between home & health care, particularly via public transit, pose a barrier to care.
Excelsior focus group participants suggested that increasing access to urgent care centers would decrease inappropriate use of emergency services.
Focus groups participants & community members noted long wait times for appointments can be a barrier to care & can encourage inappropriate emergency room use.
Many focus group participants, especially those with private health coverage, noted overall satisfaction with services received in San Francisco, and many noted the importance of customer service in the provision of health care.
Public comment & focus group participants commonly noted the importance of support services (e.g., navigators and “promotoras”) in helping people access needed services and health information.
Focus group participants & community members noted that lack of information or knowledge about resources prevents them from accessing the health care services they need. They cited the need for greater outreach & education to bridge this information gap.
by the local public health system to link people to needed personal and health services and assure the provision of health care when otherwise available.
Innovations in health information technology and health care delivery are shaping San Francisco’s health care future and offer the potential to improve access to care for all San Franciscans, including the city/county’s more vulnerable residents.
Approximately 24% of San Franciscans age five and older speak English less than very well, leaving them at risk for poorer health outcomes and more limited health care access.
Certain San Francisco subpopulations are more susceptible to limited health literacy and related outcomes – including San Francisco’s vulnerable populations (e.g., older adults,
Hunters Point neighborhoods far exceed the city/countywide rate and goal for preventable emergency room visits.
o Target: 18.3/10,000
Hospitalization rate due to uncontrolled diabetes o Current: 0.40/10,000 o Target: 0.40/10,000
Hospitalization rate due to immunization-preventable pneumonia or flu o Current: 7.1/10,000 o Target: 2.6/10,000
38
2012 ASSESSMENTS 2010 ASSESSMENT
SOURCE ASSESSMENT
TOPIC
Community Themes and Strengths Assessment
Population Health & Prevention (PHP) Integration Focus Groups
Health Care Services Master Plan (HCSMP) Task Force Recommendations
HCSMP Public Comment and Focus Groups
Local Public Health System Assessment Conducted by Department of Environment with support from SFDPH
Forces of Change Assessment Compilation of HCSMP Issue Briefs
Community Health Status Assessment Harder+Co. document comprised of 150+ data indicators
Community Vital Signs
The HCSMP should ensure that health care and support service providers have the cultural, linguistic, and physical capacity to meet the needs of San Francisco’s diverse population.
The HCSMP should ensure that San Francisco residents – particularly those without regular car access – have available a range of appropriate transportation options (e.g., public transportation, shuttle services, bike lanes, etc.) that enable them to reach their health care destinations safely, affordably, and in a timely manner.
The HCSMP should, to maximize service effectiveness and cost-effectiveness, ensure collaboration between San Francisco’s existing health and social services networks and the community.
The HCSMP should facilitate sustainable health information technology systems that are interoperable, consumer-friendly, and that increase access to high-quality health care and wellness services.
The HCSMP TF encourages SFDPH and the Planning Department to explore incentives for the development of needed health care infrastructure. Incentives should facilitate and expedite projects that meet the goals of the HCSMP TF, without creating unintended negative consequences (e.g., housing displacement).
The HCSMP should promote the development of cost-effective health care delivery models that address patient needs.
Existing service, or “connectivity,” gaps (e.g., in transportation, cultural and linguistic access, etc.) in San Francisco may prevent San Francisco’s vulnerable populations from accessing appropriate health care services needed to optimize their health and wellness.
Promote community collaboration across the local public health system (e.g., with community-based organizations, academic institutions, etc.) to improve health outreach, education, and service delivery.
39
2012 ASSESSMENTS 2010 ASSESSMENT
SOURCE ASSESSMENT
TOPIC
Community Themes and Strengths Assessment
Population Health & Prevention (PHP) Integration Focus Groups
Health Care Services Master Plan (HCSMP) Task Force Recommendations
HCSMP Public Comment and Focus Groups
Local Public Health System Assessment Conducted by Department of Environment with support from SFDPH
Forces of Change Assessment Compilation of HCSMP Issue Briefs
Community Health Status Assessment Harder+Co. document comprised of 150+ data indicators
Community Vital Signs
Increase Physical Activity and Healthy Eating
Many focus groups – including all neighborhood focus groups – emphasized the importance of healthy eating and active living. Residents noted the need for affordable, accessible fresh foods and safe and affordable opportunities for physical activity.
Many residents noted their desire for increased green space in San Francisco to facilitate activity.
The HCSMP should assess the need for future health care facility development and plan for San Francisco’s evolving health care needs to support “healthy” urban growth.
Four of the top five leading causes of death for men in San Francisco are related to cardiovascular disease.
Three of the top five causes of death for women in San Francisco are related to cardiovascular disease.
African-Americans have far higher rates of death due to cardiovascular disease than San Franciscans overall.
Among San Franciscans, Latinos are at greatest risk for obesity.
Adults engaging in moderate physical activity o Current: 26.3% o Target: 30%
Retail food environ. index o Current: 3.18 fast
food/convenience stores per produce outlet
o Target: 3.10 fast food/convenience stores per produce outlet
Proportion of households within ½ mile of a farmer’s market o Current: 35% o Target: 88%
7th grade students who are physically fit o Current: 66.3% o Target: 66.1%
40
2012 ASSESSMENTS 2010 ASSESSMENT
SOURCE ASSESSMENT
TOPIC
Community Themes and Strengths Assessment
Population Health & Prevention (PHP) Integration Focus Groups
Health Care Services Master Plan (HCSMP) Task Force Recommendations
HCSMP Public Comment and Focus Groups
Local Public Health System Assessment Conducted by Department of Environment with support from SFDPH
Forces of Change Assessment Compilation of HCSMP Issue Briefs
Community Health Status Assessment Harder+Co. document comprised of 150+ data indicators
Community Vital Signs
Reduce the Spread of Infectious Disease
There is moderate activity to inform, educate, and empower individuals and communities about health issues.
HIV/AIDS is the 7th leading cause of death among men in San Francisco, with a death rate among Black/African American men nearly three times that of the city overall.
San Francisco has experienced an increase in active tuberculosis (TB) cases and ranks third statewide. Foreign-born Asians bear the largest TB burden; TB rates among Latinos have increased significantly.
Number of clinicians on the SF Hep B Free Clinician’s Honor Roll (DPH) o Current: 702 clinicians o Target: 1,350 clinicians
Infants fully immunized at 24 months o Current: 79% o Target: 90 %
HIV incidence estimate o Current: 621 new
infections o Target: 467 new
infections
Chlamydia incidence rate o Current: 530.4/100,000 o Target: 314.6/100,000
Gonorrhea incidence rate o Current: 258.6/100,000 o Target: 47.5/100,000
Primary and secondary syphilis rate o Current: 44.0/100,000 o Target: 2.1/100,000
Liver and bile duct cancer incidence rate o Current: 14.8/100,000 o Target: 5.5/100,000
Support Early Childhood Development
Tenderloin residents reported a lack of nearby family health services such as prenatal and pediatric care
Black/African American babies in San Francisco have notably higher peri-natal and infant mortality rates compared to other racial/ethnic groups.
The South of Market,
Mothers who received early prenatal care o Current: 87.3% o Target: 90%
Hospitalization rate due to pediatric asthma o Current: 11.9/10,000 o Target: 3.3/10,000
41
2012 ASSESSMENTS 2010 ASSESSMENT
SOURCE ASSESSMENT
TOPIC
Community Themes and Strengths Assessment
Population Health & Prevention (PHP) Integration Focus Groups
Health Care Services Master Plan (HCSMP) Task Force Recommendations
HCSMP Public Comment and Focus Groups
Local Public Health System Assessment Conducted by Department of Environment with support from SFDPH
Forces of Change Assessment Compilation of HCSMP Issue Briefs
Community Health Status Assessment Harder+Co. document comprised of 150+ data indicators
Community Vital Signs
Excelsior, Bayview-Hunters Point and Visitacion Valley neighborhoods, exceed city/county rates across three prenatal care and birth outcome risk factors.
Support Seniors and Persons with Disabilities
The HCSMP should ensure that San Francisco has a sufficient capacity of long-term care options for its growing senior population and for persons with disabilities to support their ability to live independently in the community
Over the next two decades, it is estimated that 55 percent of San Franciscans will be over the age of 45, and the population over age 75 will increase from seven percent to 11 percent by 2030. This has implications for the need of more long-term care options moving forward.
San Francisco has experienced a decrease in the number of families with young children.
Influenza immunization rate for residents age 65+ o Current: 76.2% o Target: 90%
Hospitalization rate due to hip fractures among women ages 65+ o Current: 581.5/100,000 o Target: 433.8/100,000
Hospitalization rate due to hip fractures among men ages 65+ o Current: 319.2/100,000 o Target: 204.7/100,000
Average wait time before receiving home-delivered meals o Current: 36 days o Target: 45 days (target
met)
Disabled persons with health insurance o Current: 94.1% o Target: 100%
Percentage of San Francisco corners with curb ramps o Current: 89% o Target: 100%
42
2012 ASSESSMENTS 2010 ASSESSMENT
SOURCE ASSESSMENT
TOPIC
Community Themes and Strengths Assessment
Population Health & Prevention (PHP) Integration Focus Groups
Health Care Services Master Plan (HCSMP) Task Force Recommendations
HCSMP Public Comment and Focus Groups
Local Public Health System Assessment Conducted by Department of Environment with support from SFDPH
Forces of Change Assessment Compilation of HCSMP Issue Briefs
Community Health Status Assessment Harder+Co. document comprised of 150+ data indicators
Community Vital Signs
Number of SFDPH-subsidized supportive housing units o Current: 996 units o Target: 1650 units
Mammogram history o Current: 81.2% o Target: 70%
Colon Cancer Screening o Current: 77.8% o Target: 50% (target
met)
43
Appendix B: San Francisco Criteria for Prioritizing Key Health Issues
Criteria A: Magnitude/Size of the Public Health Issue
Percent of population at risk Mortality rate, premature death rate, prevalence, incidence, or other measure of issue’s impact
on population Degree of disparity between various groups (e.g., county versus other county, state, or federal
comparisons; intra-county comparisons between groups)
Criteria B: Other Factors Related to Importance of the Public Health Issue
Importance to the community; degree of public concern on the issue Level of support from community members and other stakeholders Alignment with national, state, and/or local health objectives Work on the issue is “mandated” by statute or other authority The local public health system has a clearly established role to address the issue Legal or ethical concerns related to the issue Linkage to an environmental concern, including safety
Criteria C: Effectiveness of Interventions
Interventions have been successfully applied to the issue Level of evidence supporting the interventions Other rationale for use of interventions Preventability of the issue or condition Extent to which interventions will address root causes
Criteria D: Feasibility and Sustainability of Intervention Implementation
Within the power of the local public health system to control Cost-effectiveness of the interventions Interventions are culturally appropriate and acceptable to community members Size of the gap between community resources currently addressing the issue and need Needed resources are available Timeliness of implementation and expected benefits Ease of implementation Ease and likelihood of sustainability/maintenance of effort Legal or ethical concerns that may arise as a result of the intervention
Criteria E: Equity
Some groups are more affected by the issue/a health inequity exists for the issue (e.g., by
race/ethnicity, gender, age, other social determinant of health)
44
Criteria Definitions
Health Disparity: Difference in the distribution of disease and illness across populations.
Health Equity: Health equity is achieved when every person has the opportunity to “attain his or
her full health potential” and no one is “disadvantaged from achieving this potential because of social position or other socially determined circumstances.”
Health Inequity: Systemic, unfair, avoidable, and unjust differences in health status and mortality rates
Intervention: Action intended to improve a specific public health issue
Social Determinant of Health: Economic and social conditions that influence the health of individuals, communities, and jurisdictions as a whole
45
Appendix C: San Francisco Health Prioritization Worksheet
46
Appendix D: CHIP Acronym Glossary
ACS: American Community Survey
CBP: Community Benefit Partnership
CDC: Centers for Disease Control and Prevention
CDE: California Department of Education
CHA: Community Health Assessment, a process that engages with community members and
local public health system partners to systematically collect and analyze qualitative and
quantitative health related data from a variety of sources within a specific community.
CHIP: Community Health Improvement Plan, an action-oriented plan outlining the priority
community health issues (based on CHA findings as well as community member and local public
health system partner input) and how these issues will be addressed, including strategies and
measures, to ultimately improve community health.
CHIS: California Health Interview Survey. (Note: Due to small CHIS sample size, data by
race/ethnic group and other subpopulations may be statistically unstable.)
CHR: County Health Rankings
CHSA: Community Health Status Assessment
CTSA: Community Themes and Strengths Assessment
CVS: Community Vital Signs
DAO: Deemed Approved Ordinance
FCA: Forces of Change Assessment
HCSMP: Health Care Services Master Plan
HEAL Zone: Healthy Eating Active Living Zone
HOPE SF: Housing Opportunities for People Everywhere in San Francisco
HP 2020: Healthy People 2020
HSF: Healthy San Francisco
LGHC: Let’s Get Healthy California
LPHSA: Local Public Health System Assessment
MAPP: Mobilizing for Action Through Planning and Partnerships
NACCHO: National Association of County and City Health Officials