San Francisco Estuary Institute San Francisco Estuary Institute Annual Meeting Annual Meeting October 7, 2008 October 7, 2008 Water Quality Science and Management in the Delaware Estuary Thomas J. Fikslin, Ph.D. Thomas J. Fikslin, Ph.D.
Transcript
San Francisco Estuary InstituteSan Francisco Estuary InstituteAnnual MeetingAnnual MeetingOctober 7, 2008October 7, 2008
Water Quality Science and Management in theDelaware Estuary
Thomas J. Fikslin, Ph.D.Thomas J. Fikslin, Ph.D.
ThemesThemesBackgroundBackground
Delaware River WatershedDelaware River Watershed Management IssuesManagement Issues
National Water Quality National Water Quality Monitoring NetworkMonitoring Network Delaware River Basin PilotDelaware River Basin Pilot
Achieving water quality Achieving water quality standards for PCBsstandards for PCBs
Basin Facts
● Largest un-dammed river east of the Mississippi – 330 miles
● 13,539 square mile drainage
● 17 million water users
● 216 tributaries
● Three reaches included in National Wild and Scenic River System
● One of the world’s largest freshwater tidal estuaries
● Delaware Bay- 782 sq. miles
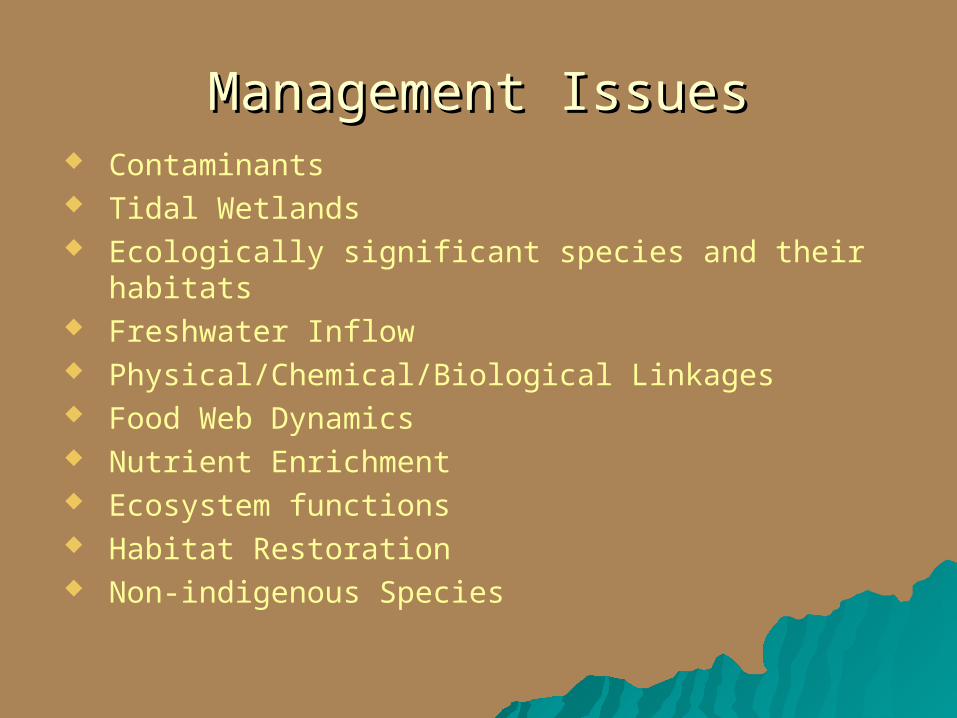
Management IssuesManagement Issues Contaminants Tidal Wetlands Ecologically significant species and their habitats Freshwater Inflow Physical/Chemical/Biological Linkages Food Web Dynamics Nutrient Enrichment Ecosystem functions Habitat Restoration Non-indigenous Species
ThemesThemesBackgroundBackground
Delaware River WatershedDelaware River Watershed Management IssuesManagement Issues
National Water Quality National Water Quality Monitoring NetworkMonitoring Network Delaware River Basin PilotDelaware River Basin Pilot
Achieving water quality Achieving water quality standards for PCBsstandards for PCBs
Entire Delaware BasinEntire Delaware Basin 4 states—NY, PA, NJ, DE4 states—NY, PA, NJ, DE Several Physiographic Several Physiographic
Provinces and EcoregionsProvinces and Ecoregions Major inflows—Lehigh, Major inflows—Lehigh,
Plans for enhanced Plans for enhanced coastal endurance linecoastal endurance line
DRB Pilot Study Area DRB Pilot Study Area BoundaryBoundary
Monitoring Organizations and Resource Monitoring Organizations and Resource Components MonitoredComponents Monitored
OrgOrgEstuary/Estuary/
EmbaymentEmbaymentNearshore Nearshore
CoastCoastOffshore Offshore
CoastCoast RiversRivers Ground Ground WaterWater
Atmos.Atmos.
Depos.Depos.WetlandsWetlands BeachesBeaches
USEPAUSEPA
NOAANOAA
USGSUSGS
COECOE
DE DNRECDE DNREC
PADEPPADEP
NJ DEPNJ DEP
UDELUDEL
RUTGERSRUTGERS
DRBCDRBC EstuaryEstuaryProgramProgram
PhiladelphiaPhiladelphia
CamdenCamden Power Power UtilitiesUtilities
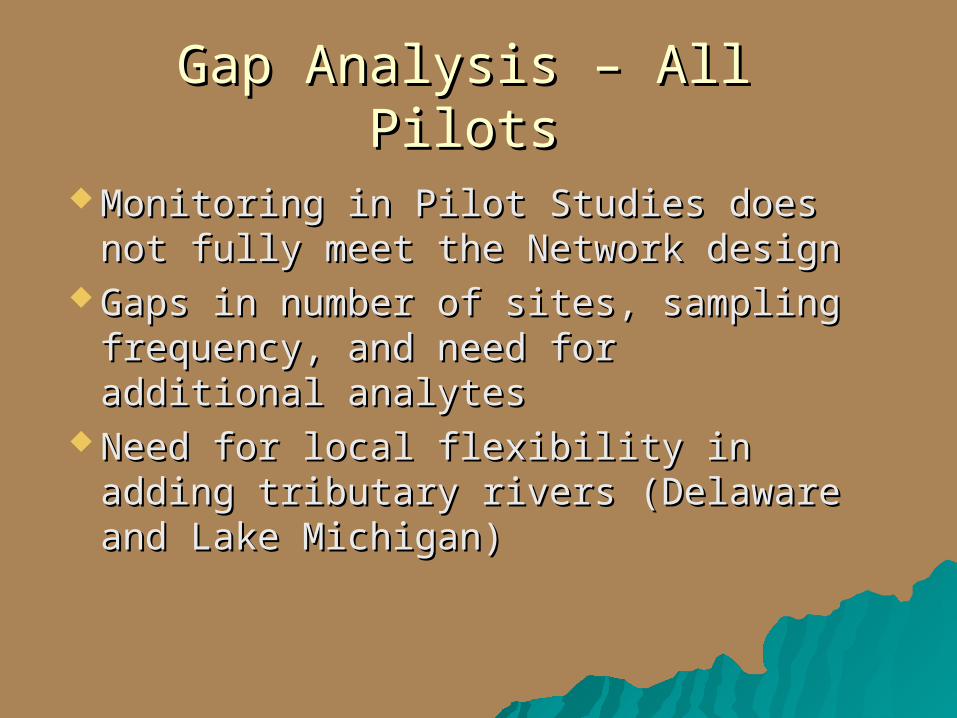
Monitoring in Pilot Studies does not Monitoring in Pilot Studies does not fully meet the Network designfully meet the Network design
Gaps in number of sites, sampling Gaps in number of sites, sampling frequency, and need for additional frequency, and need for additional analytes analytes
Need for local flexibility in adding Need for local flexibility in adding tributary rivers (Delaware and Lake tributary rivers (Delaware and Lake Michigan)Michigan)
Gap Analysis – All PilotsGap Analysis – All Pilots
Add nutrient monitoring to existing program Add nutrient monitoring to existing program in river, estuary, and Bay.in river, estuary, and Bay.
Improve the watershed-to-ocean observing Improve the watershed-to-ocean observing system web site to facilitate data sharing.system web site to facilitate data sharing.
Continue to investigate Emerging Continue to investigate Emerging Contaminants (PBDEs, PFOAs/PFOSs, Contaminants (PBDEs, PFOAs/PFOSs, PPCPs).PPCPs).
Establish capacity to monitor wetland Establish capacity to monitor wetland condition.condition.
FY 08 PlansFY 08 PlansDelaware Estuary and BayDelaware Estuary and Bay
ThemesThemesBackgroundBackground
Delaware River WatershedDelaware River Watershed Management IssuesManagement Issues
National Water Quality National Water Quality Monitoring NetworkMonitoring Network Delaware River Basin PilotDelaware River Basin Pilot
Achieving water quality Achieving water quality standards for PCBsstandards for PCBs
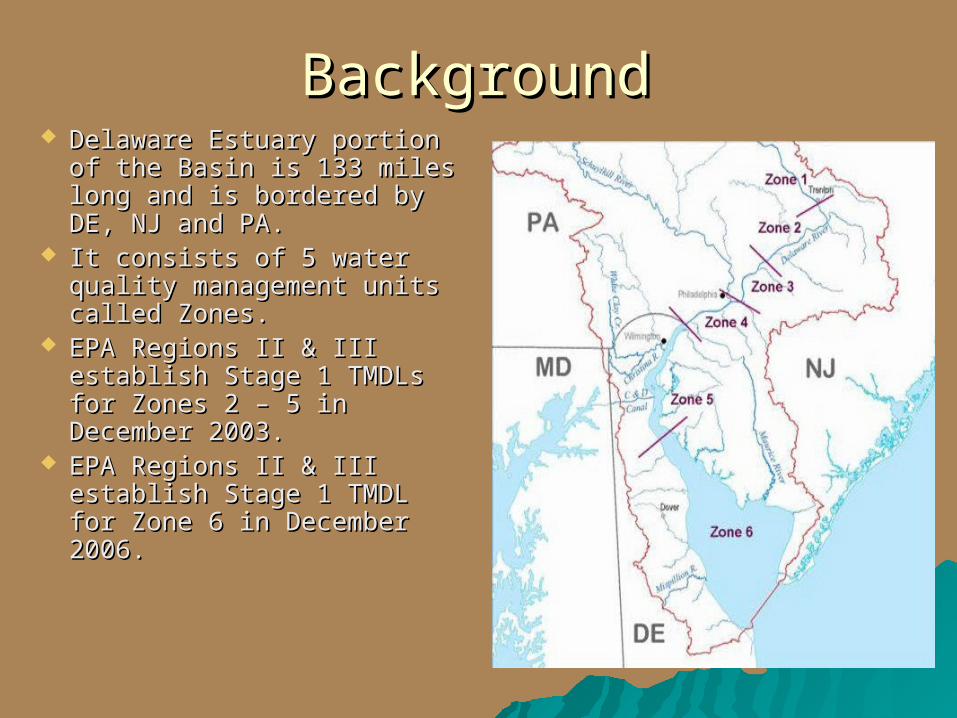
of the Basin is 133 miles of the Basin is 133 miles long and is bordered by long and is bordered by DE, NJ and PA.DE, NJ and PA.
It consists of 5 water It consists of 5 water quality management units quality management units called Zones.called Zones.
EPA Regions II & III EPA Regions II & III establish Stage 1 TMDLs establish Stage 1 TMDLs for Zones 2 – 5 in for Zones 2 – 5 in December 2003.December 2003.
EPA Regions II & III EPA Regions II & III establish Stage 1 TMDL for establish Stage 1 TMDL for Zone 6 in December 2006.Zone 6 in December 2006.
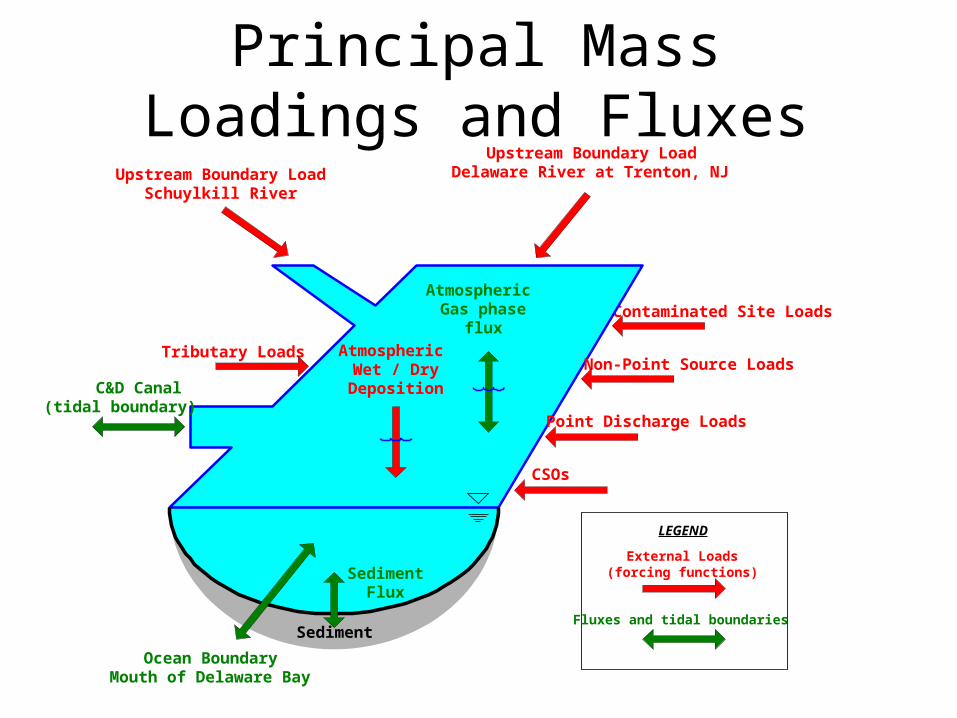
Principal Mass Loadings and Fluxes
Contaminated Site Loads
Upstream Boundary LoadDelaware River at Trenton, NJ
SedimentFlux
AtmosphericWet / Dry
Deposition
AtmosphericGas phase
flux
Upstream Boundary LoadSchuylkill River
Non-Point Source LoadsTributary Loads
Point Discharge Loads
Sediment
C&D Canal(tidal boundary)
Ocean BoundaryMouth of Delaware Bay
CSOs
LEGEND
External Loads(forcing functions)
Fluxes and tidal boundaries
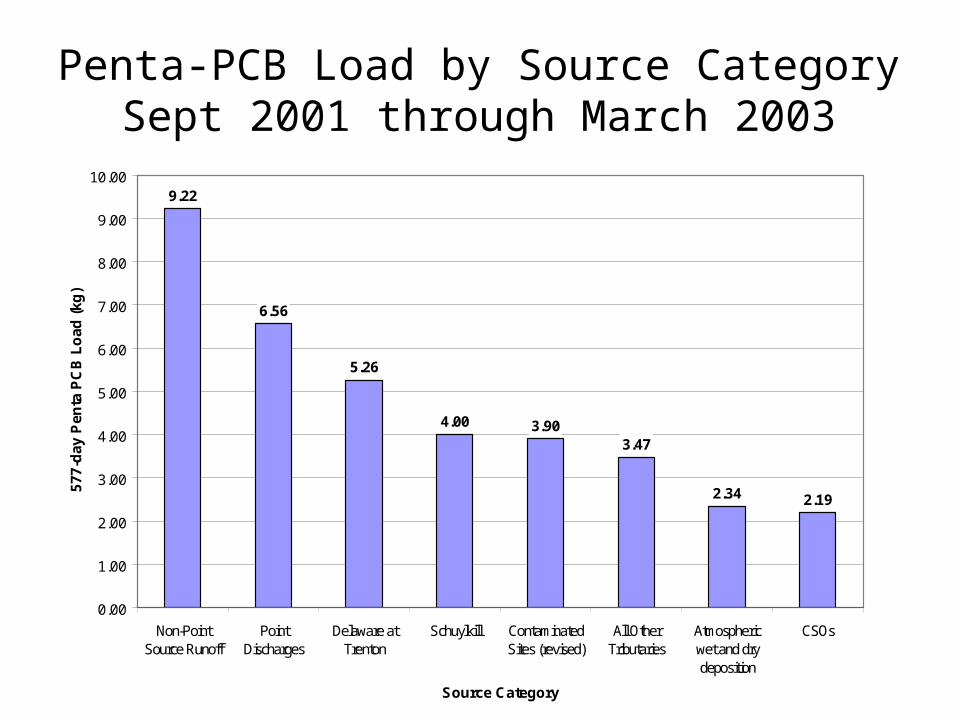
Penta-PCB Load by Source CategorySept 2001 through March 2003
9.22
6.56
5.26
4.00 3.903.47
2.34 2.19
0.00
1.00
2.00
3.00
4.00
5.00
6.00
7.00
8.00
9.00
10.00
Non-PointSource Runoff
PointDischarges
Delaware atTrenton
Schuylkill ContaminatedSites (revised)
All OtherTributaries
Atmosphericwet and drydeposition
CSOs
Source Category
577-
da
y P
enta
PC
B L
oad
(kg
)
Achieving PCB WQ CriteriaAchieving PCB WQ Criteria Reductions in PCB loadings will not immediately Reductions in PCB loadings will not immediately
result in lower ambient water concentrations or in result in lower ambient water concentrations or in reduced tissue levels of PCBs in resident fish reduced tissue levels of PCBs in resident fish species.species.
This is due to the continuing flux of PCBs from the This is due to the continuing flux of PCBs from the sediments to the water column. As solids sediments to the water column. As solids uncontaminated by PCBs settle to the bottom, uncontaminated by PCBs settle to the bottom, this flux will ultimately reach equilibrium with the this flux will ultimately reach equilibrium with the water column.water column.
A long-term strategy for permitting point source A long-term strategy for permitting point source discharges and addressing non-point sources discharges and addressing non-point sources such as contaminated sites and air sources is such as contaminated sites and air sources is needed to ensure continued progress in reducing needed to ensure continued progress in reducing PCBs.PCBs.
The ProblemThe Problem Federal regulations require permits to be Federal regulations require permits to be
consistent with WLAs established with consistent with WLAs established with TMDLs, and achieve the underlying WQ TMDLs, and achieve the underlying WQ criteria within a permit cycle (5 years).criteria within a permit cycle (5 years).
The Concept:The Concept: WQS Implementation Plan WQS Implementation Plan Under the WQS regulations at 40 CFR 131.13, Under the WQS regulations at 40 CFR 131.13,
states may, at their discretion, adopt policies states may, at their discretion, adopt policies affecting the application and implementationaffecting the application and implementationof designated uses and criteria.of designated uses and criteria.
States could adopt a “standards implementation States could adopt a “standards implementation plan” as a component of their WQS to address plan” as a component of their WQS to address long-term attainability issues.long-term attainability issues.
How it WorksHow it Works Lead by DRBC, monitoring using Method Lead by DRBC, monitoring using Method
1668A and Pollutant Minimization Plans 1668A and Pollutant Minimization Plans were required following the establishment were required following the establishment of the TMDLs. of the TMDLs.
For selected pollutants and water bodies, a For selected pollutants and water bodies, a WQS Implementation Plan (WQSIP) would WQS Implementation Plan (WQSIP) would be required under regulations to be be required under regulations to be adopted by DRBC.adopted by DRBC.
The plan would allow phased attainment of The plan would allow phased attainment of a WQ criterion by specifying numeric and a WQ criterion by specifying numeric and narrative restoration objectives for one or narrative restoration objectives for one or more restoration periods. Periods of 10 more restoration periods. Periods of 10 years in length are proposed.years in length are proposed.
Are We Making Progress?Are We Making Progress?
Progress in achieving the PCB WQ criterion Progress in achieving the PCB WQ criterion is expected to be slow due to the is expected to be slow due to the modulating effects of estuary sediments modulating effects of estuary sediments and the adaptive management approach and the adaptive management approach of identifying sources and reducing PCB of identifying sources and reducing PCB loadings.loadings.
Adoption of the Stage 1 TMDLs and Adoption of the Stage 1 TMDLs and regulations requiring point sources to regulations requiring point sources to conduct Pollutant Minimization Plans conduct Pollutant Minimization Plans (PMPs) may be driving source reduction.(PMPs) may be driving source reduction.
•Although 128 discharges are currently Although 128 discharges are currently being evaluated for PCB loadings, being evaluated for PCB loadings, 95% of the loading is contributed by a 95% of the loading is contributed by a relatively few discharges (relatively few discharges (1616).).
Point Source Discharges:Point Source Discharges:• Although 128 discharges are currently Although 128 discharges are currently
being evaluated for PCB loadings, being evaluated for PCB loadings, 95% of the loading is contributed by a 95% of the loading is contributed by a relatively few discharges (relatively few discharges (1616).).
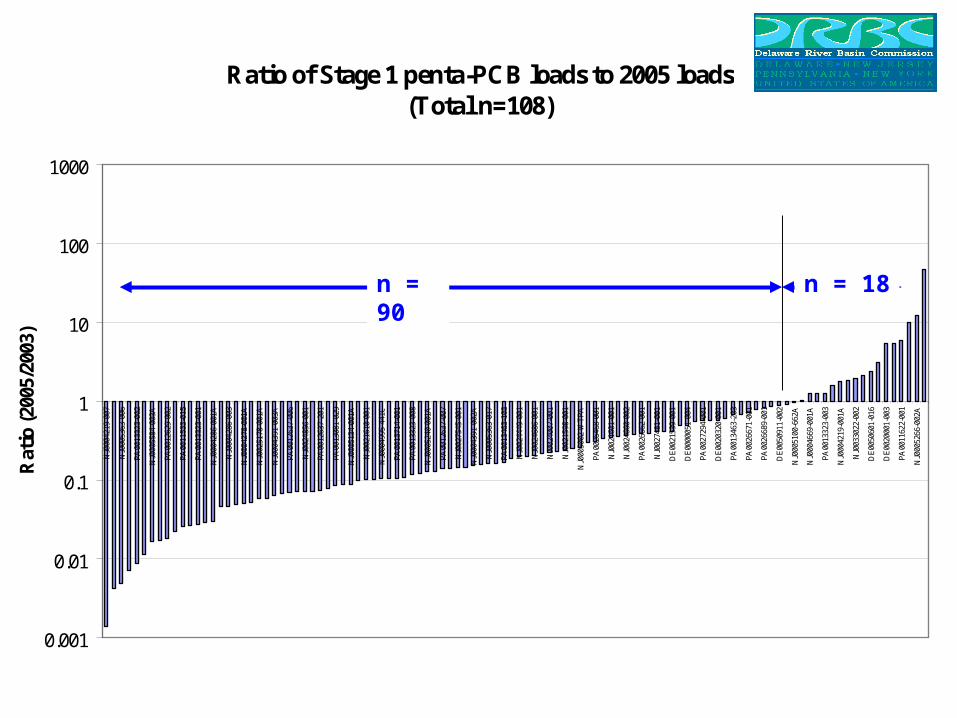
• Loadings calculated from monitoring Loadings calculated from monitoring data collected during 2005 – 2006 data collected during 2005 – 2006 indicate that indicate that 90 of 108 discharges 90 of 108 discharges have reduced loadingshave reduced loadings compared to compared to Stage 1 loadings.Stage 1 loadings.
Ratio of Stage 1 penta-PCB loads to 2005 loads(Total n=108)
0.001
0.01
0.1
1
10
100
1000
NJ0
0042
19-0
07
NJ0
0053
63-0
06
PA
0013
323-
002
NJ0
0055
84-0
03A
PA
0012
629-
002
PA
0011
533-
015
PA
0013
323-
001
NJ0
0042
86-0
01A
NJ0
0042
86-0
03
NJ0
0042
78-0
01A
NJ0
0251
78-0
01A
NJ0
0043
91-0
03A
PA
0012
637-
006
NJ0
0248
56-0
01
PA
0012
637-
201
PA
0013
081-
029
NJ0
0051
34-0
01A
NJ0
0216
10-0
01
NJ0
0049
95-4
41C
PA
0013
714-
001
PA
0013
323-
008
NJ0
0052
40-0
01A
PA
0012
637-
007
NJ0
0275
45-0
01
NJ0
0043
91-0
02A
NJ0
0053
63-0
17
PA
0013
463-
103
NJ0
0244
49-0
01
NJ0
0246
86-0
01
NJ0
0240
07-0
01
NJ0
0215
98-0
01
NJ0
0050
02-W
TP
A
PA
0026
468-
001
NJ0
0216
01-0
01
NJ0
0246
60-0
02
PA
0026
662-
001
NJ0
0274
81-0
01
DE
0021
539-
001
DE
0000
051-
004
PA
0027
294-
001
DE
0020
320-
001
PA
0013
463-
203
PA
0026
671-
001
PA
0026
689-
001
DE
0050
911-
002
NJ0
0051
00-6
62A
NJ0
0046
69-0
01A
PA
0013
323-
003
NJ0
0042
19-0
01A
NJ0
0330
22-0
02
DE
0050
601-
016
DE
0020
001-
003
PA
0011
622-
001
NJ0
0052
66-0
02A
Rat
io (
2005
/200
3)
A ratio of <1 means the 2005 loadingsare less than the Stage 1 loadings
The WQSIP would also identify reduction The WQSIP would also identify reduction strategies and measures for other source strategies and measures for other source categories such as tributaries, categories such as tributaries, contaminated sites, non-point source contaminated sites, non-point source runoff, and air deposition.runoff, and air deposition.
Recent Initiatives:Recent Initiatives: Passive Air SamplingPassive Air Sampling – to identify the – to identify the
location of air sources of PCBs.location of air sources of PCBs. Refining Loadings from Contaminated Refining Loadings from Contaminated
SitesSites – thru application of RUSLE2. – thru application of RUSLE2.
Passive Air SamplingPassive Air Sampling In cooperation with In cooperation with
Rutgers University and EPA Rutgers University and EPA Region II, studies were Region II, studies were initiated in 2005 to initiated in 2005 to evaluate sampling evaluate sampling techniques to identify air techniques to identify air sources of PCBs.sources of PCBs.
34 sites were sampled 34 sites were sampled between March and June between March and June 2005.2005.
48 sites were sampled 48 sites were sampled between March and June between March and June 2008 in a second survey.2008 in a second survey.
11 Publication of proposed rule Publication of proposed rule and WQ Implementation Plan and WQ Implementation Plan for PCBs.for PCBs.
Nov. 2008Nov. 2008
22 60 day comment period ends60 day comment period ends Jan. 2009Jan. 2009
33 Commission ActionCommission Action May 6, 2009May 6, 2009
44 Adoption of Stage 2 TMDLs for Adoption of Stage 2 TMDLs for PCBs for Zones 2 – 6.PCBs for Zones 2 – 6.
Dec. 15, 2009Dec. 15, 2009
SummarySummary DRBC, in cooperation with EPA Headquarters, Regions DRBC, in cooperation with EPA Headquarters, Regions
II & III, and state agencies are implementing PCB II & III, and state agencies are implementing PCB TMDLs by:TMDLs by:
♦ Requiring low level monitoring and PMPs, andRequiring low level monitoring and PMPs, and♦ Adopting a revised PCB criterion, and regulatory language Adopting a revised PCB criterion, and regulatory language
for an adaptive implementation approach within the for an adaptive implementation approach within the framework of the CWA to achieve WQS for hydrophobic framework of the CWA to achieve WQS for hydrophobic contaminants like PCBs.contaminants like PCBs.
The cornerstone of this approach is a WQS The cornerstone of this approach is a WQS implementation plan that addresses long-term implementation plan that addresses long-term attainment of WQS through point and non-point source attainment of WQS through point and non-point source controls over multiple permit cycles. controls over multiple permit cycles.
Information on the TMDLs, model Information on the TMDLs, model development, sampling and analytical development, sampling and analytical information, and PMP requirements and information, and PMP requirements and resources are available on the DRBC resources are available on the DRBC website at:website at: