July 2015 Monthly Snapshot One-Year Change in One-Year Change in Median Sales Price Single Family Median Sales Price Condo/TIC/Coop 2 3 4 5 6 7 8 9 10 11 12 13 14 15 16 Current as of August 11, 2015. All data from the San Francisco MLS. Powered by 10K Research and Marketing. Condo/TIC/Coop Activity Overview Inventory of Active Listings % of Properties Sold Over List Price % of List Price Received Housing Affordability Ratio All Properties Activity Overview New Listings Pending Sales Sold Listings Median Sales Price Average Sales Price Days on Market Until Sale Activity by District Monthly Indicators + 18.8% + 6.3% + 15.0% One-Year Change in According to the U.S. Census, homeownership is at 63.4 percent for the second quarter of 2015, down 1.3 percent from the second quarter of 2014. This is the lowest rate of homeownership since 1967. To put that in greater context, homeownership peaked at 69.2 percent in 2004, and the 50-year average is 65.3 percent. Although the data may be indicating otherwise on a macro level, mortgage applications have kept REALTORS® busy through summer. New Listings were down 17.7 percent for single family homes and 32.9 percent for Condo/TIC/Coop properties. Pending Sales decreased 9.7 percent for single family homes and 13.5 percent for Condo/TIC/Coop properties. The Median Sales Price was up 18.8 percent to $1,284,444 for single family homes and 6.3 percent to $1,010,000 for Condo/TIC/Coop properties. Months Supply of Inventory decreased 23.8 percent for single family units and 28.6 percent for Condo/TIC/Coop units. Ever since the Great Recession ended in about June 2009, the market has strengthened to once again become a cornerstone of the national economy. Better lending standards, lower oil prices and higher wages are a few of the catalysts for positive change. Many trends continue to reveal a stable housing market. Federal Reserve Chair, Janet Yellen, has predicted a fine-tuning of monetary policy by the end of the year. It is widely believed that interest rates will go up before the year is over, an indicator that the housing market is ready for such a move. Median Sales Price All Property Types Residential real estate activity in San Francisco County (Districts 1-10), comprised of single-family properties, townhomes and condominiums. Percent changes are calculated using rounded figures. Single Family Activity Overview Months Supply of Inventory
Transcript
July 2015 Monthly Snapshot
One-Year Change in One-Year Change inMedian Sales Price
Single FamilyMedian Sales Price Condo/TIC/Coop
23456789
10111213141516
Current as of August 11, 2015. All data from the San Francisco MLS. Powered by 10K Research and Marketing.
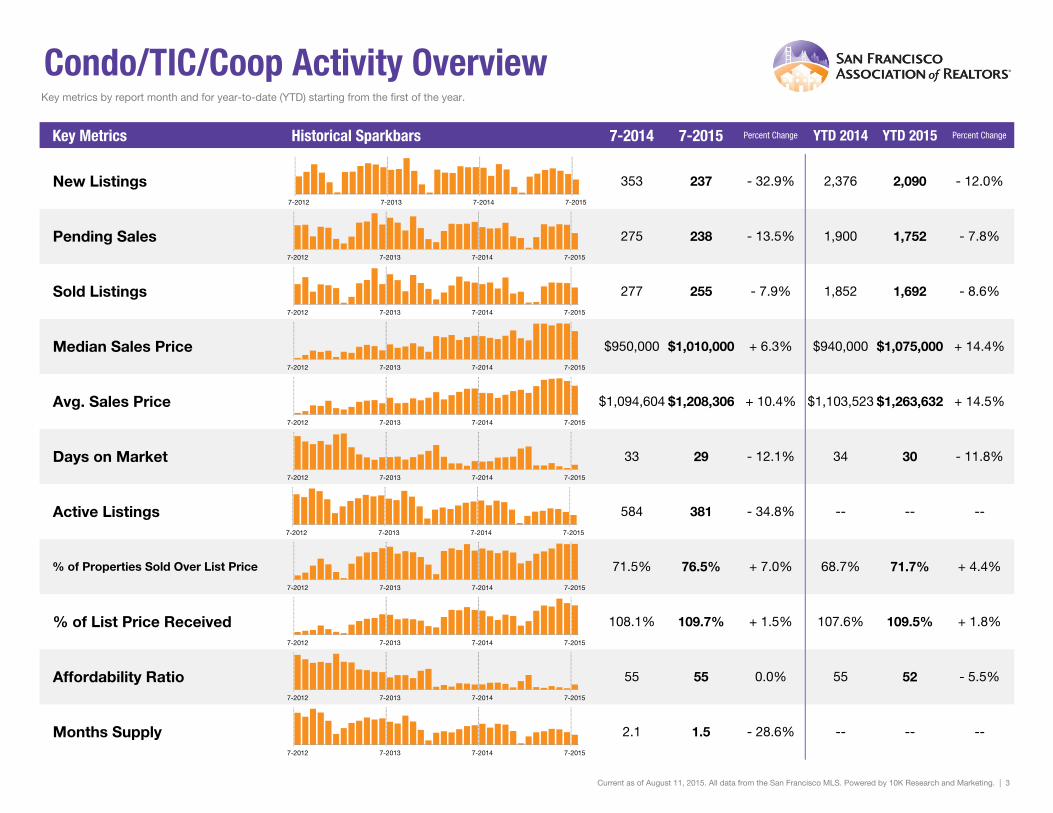
Condo/TIC/Coop Activity Overview
Inventory of Active Listings% of Properties Sold Over List Price% of List Price ReceivedHousing Affordability Ratio
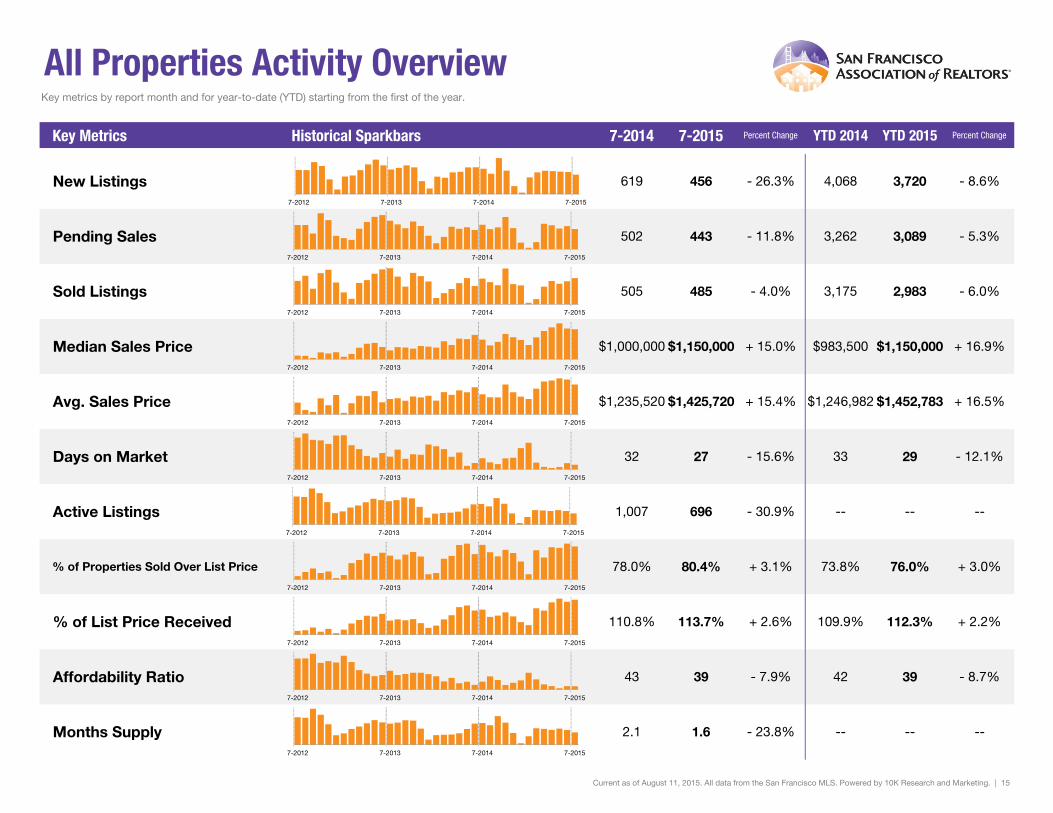
All Properties Activity Overview
New ListingsPending SalesSold ListingsMedian Sales PriceAverage Sales PriceDays on Market Until Sale
Activity by District
Monthly Indicators
+ 18.8% + 6.3% + 15.0%One-Year Change inAccording to the U.S. Census, homeownership is at 63.4 percent for the second
quarter of 2015, down 1.3 percent from the second quarter of 2014. This is the lowest rate of homeownership since 1967. To put that in greater context, homeownership peaked at 69.2 percent in 2004, and the 50-year average is 65.3 percent. Although the data may be indicating otherwise on a macro level, mortgage applications have kept REALTORS® busy through summer.
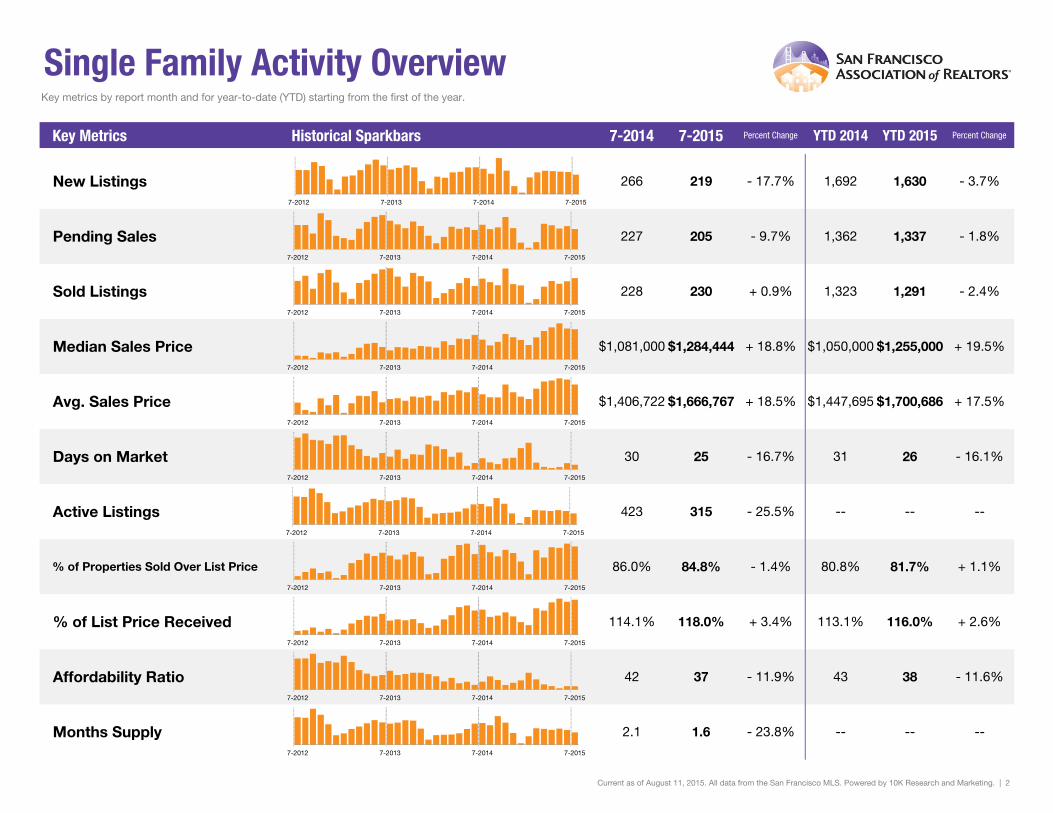
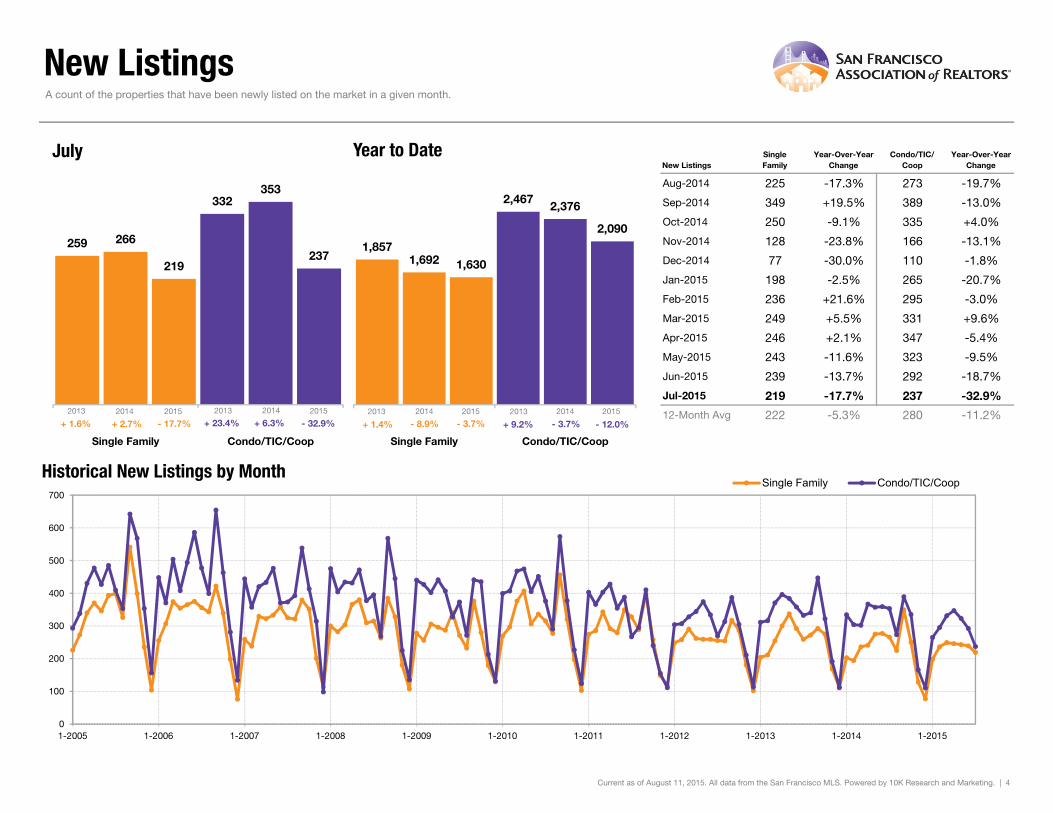
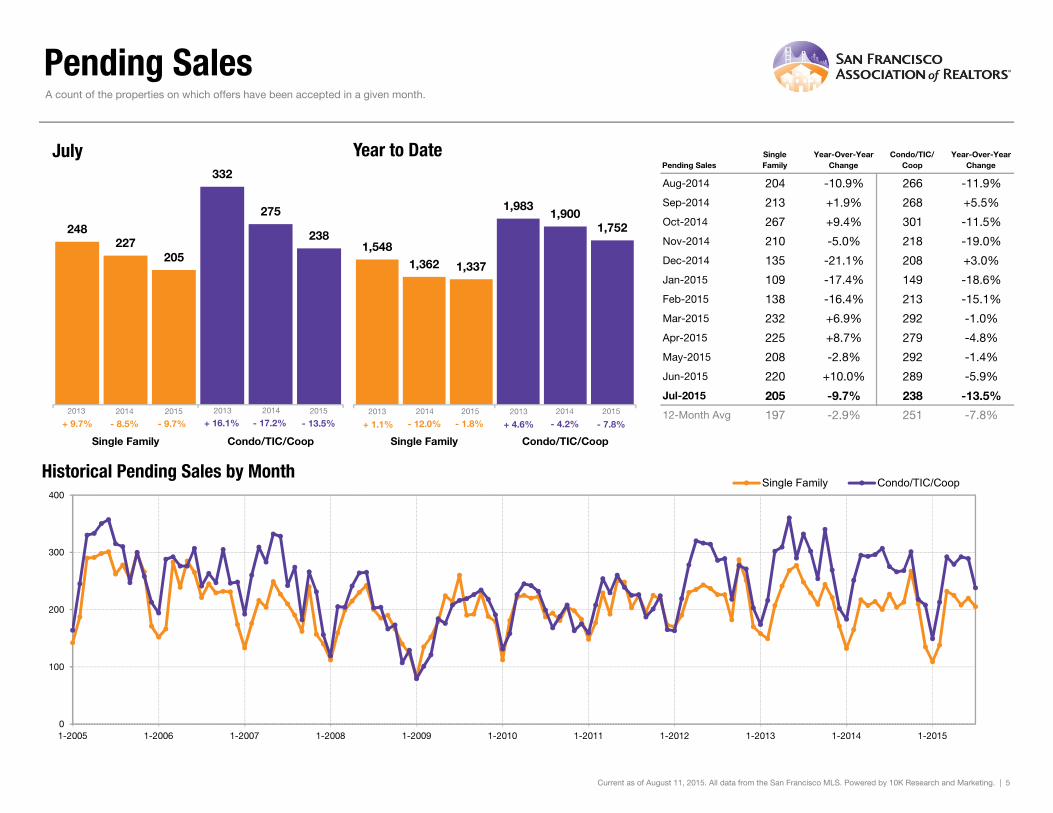
New Listings were down 17.7 percent for single family homes and 32.9 percent for Condo/TIC/Coop properties. Pending Sales decreased 9.7 percent for single family homes and 13.5 percent for Condo/TIC/Coop properties.
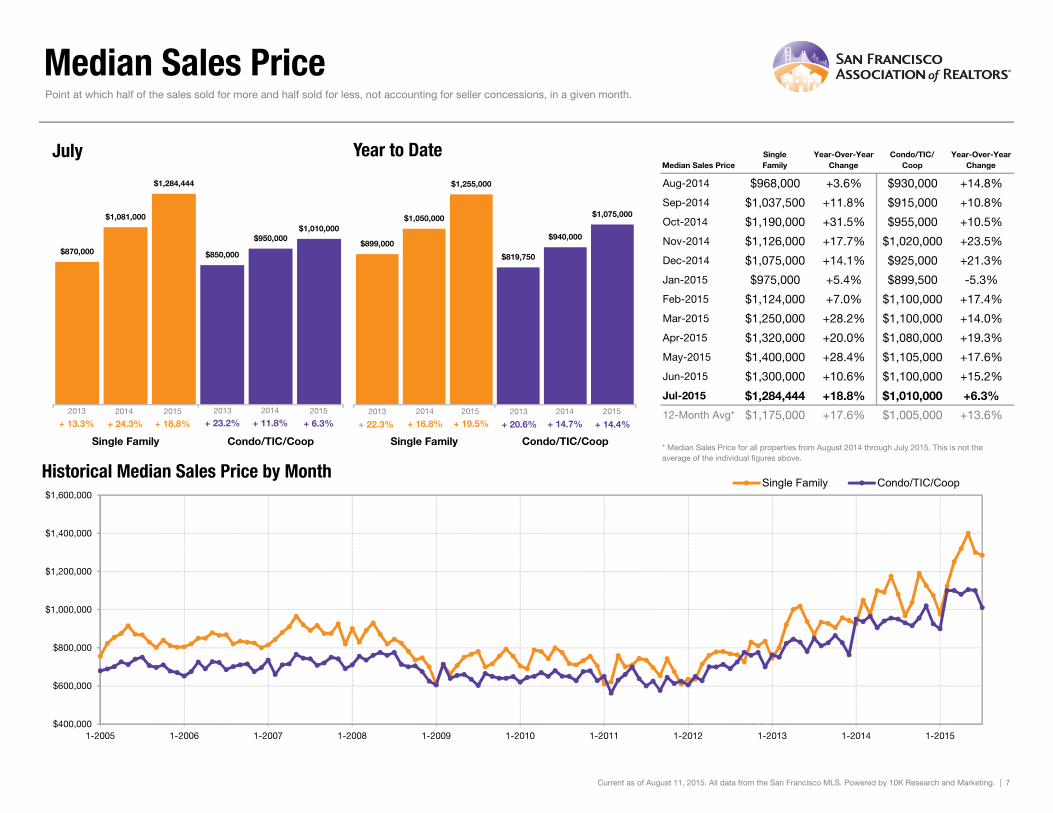
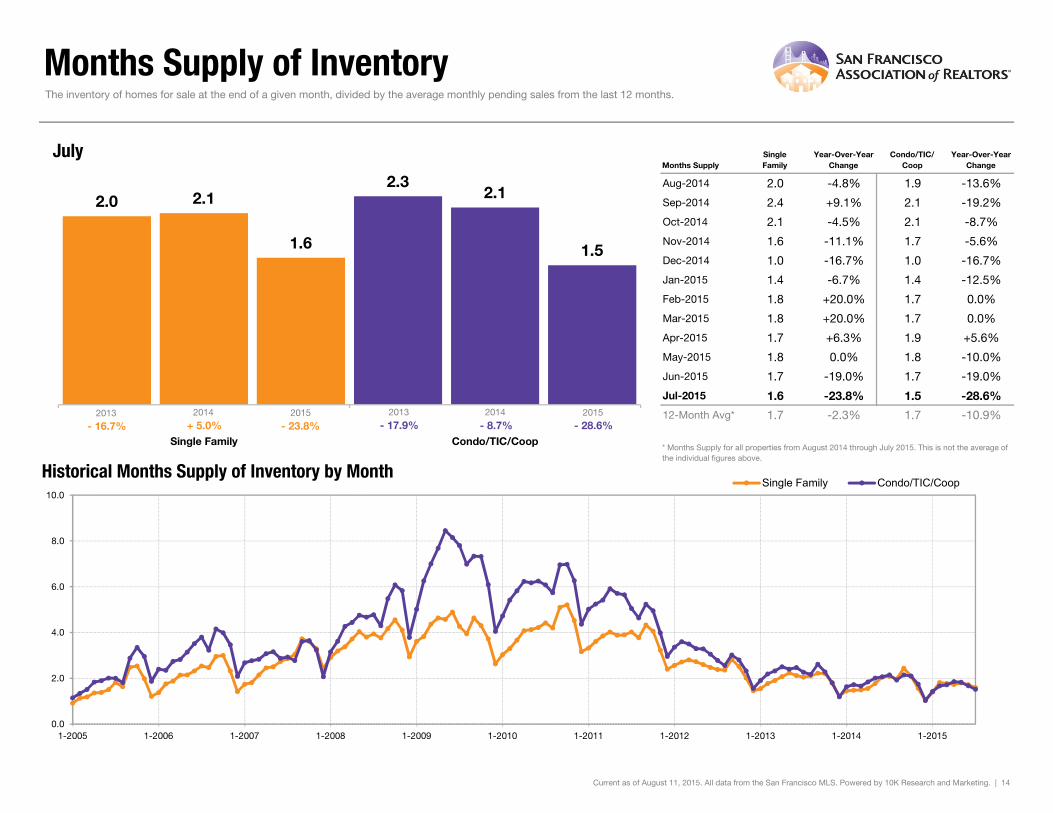
The Median Sales Price was up 18.8 percent to $1,284,444 for single family homes and 6.3 percent to $1,010,000 for Condo/TIC/Coop properties. Months Supply of Inventory decreased 23.8 percent for single family units and 28.6 percent for Condo/TIC/Coop units.
Ever since the Great Recession ended in about June 2009, the market has strengthened to once again become a cornerstone of the national economy. Better lending standards, lower oil prices and higher wages are a few of the catalysts for positive change. Many trends continue to reveal a stable housing market. Federal Reserve Chair, Janet Yellen, has predicted a fine-tuning of monetary policy by the end of the year. It is widely believed that interest rates will go up before the year is over, an indicator that the housing market is ready for such a move.
Median Sales Price All Property Types
Residential real estate activity in San Francisco County (Districts 1-10), comprised of single-family properties, townhomes and condominiums. Percent changes are calculated using rounded figures.
Single Family Activity Overview
Months Supply of Inventory
Single Family Activity OverviewKey metrics by report month and for year-to-date (YTD) starting from the first of the year.
Historical Median Sales Price by Month* Median Sales Price for all properties from August 2014 through July 2015. This is not the average of the individual figures above.
Current as of August 11, 2015. All data from the San Francisco MLS. Powered by 10K Research and Marketing. | 7
Point at which half of the sales sold for more and half sold for less, not accounting for seller concessions, in a given month.
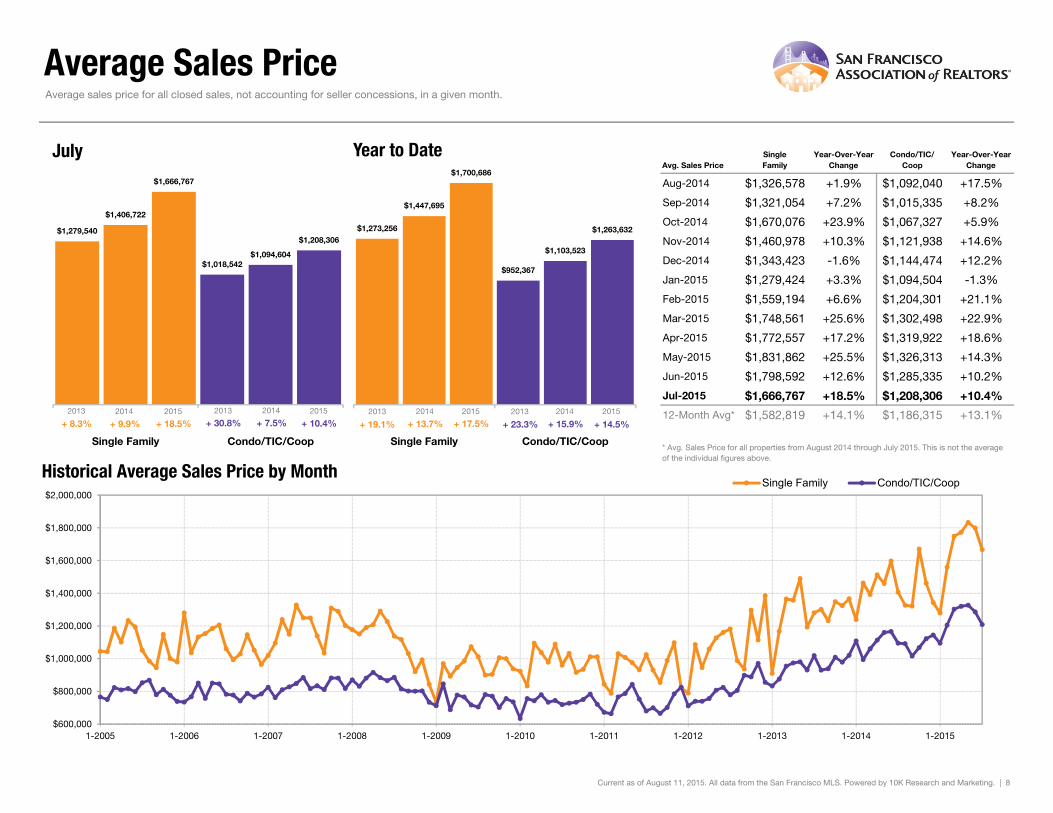
Historical Average Sales Price by Month* Avg. Sales Price for all properties from August 2014 through July 2015. This is not the average of the individual figures above.
Current as of August 11, 2015. All data from the San Francisco MLS. Powered by 10K Research and Marketing. | 8
Average sales price for all closed sales, not accounting for seller concessions, in a given month.
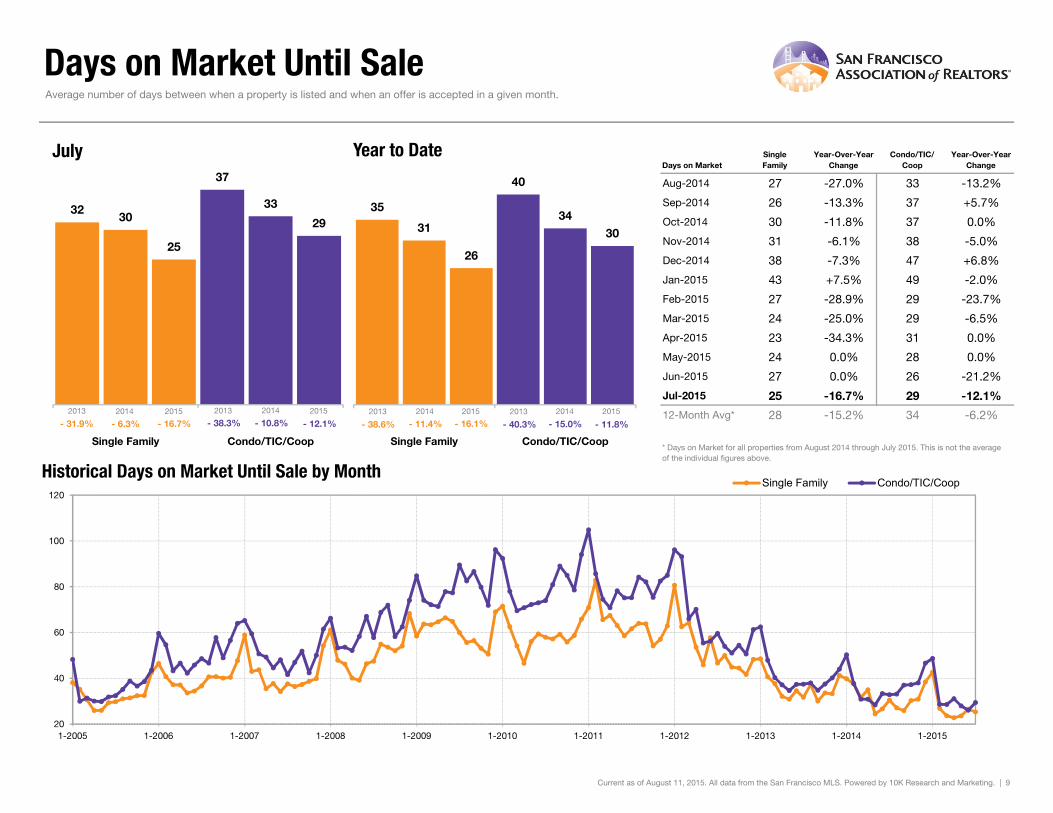
Historical Days on Market Until Sale by Month* Days on Market for all properties from August 2014 through July 2015. This is not the average of the individual figures above.
Current as of August 11, 2015. All data from the San Francisco MLS. Powered by 10K Research and Marketing. | 9
Average number of days between when a property is listed and when an offer is accepted in a given month.
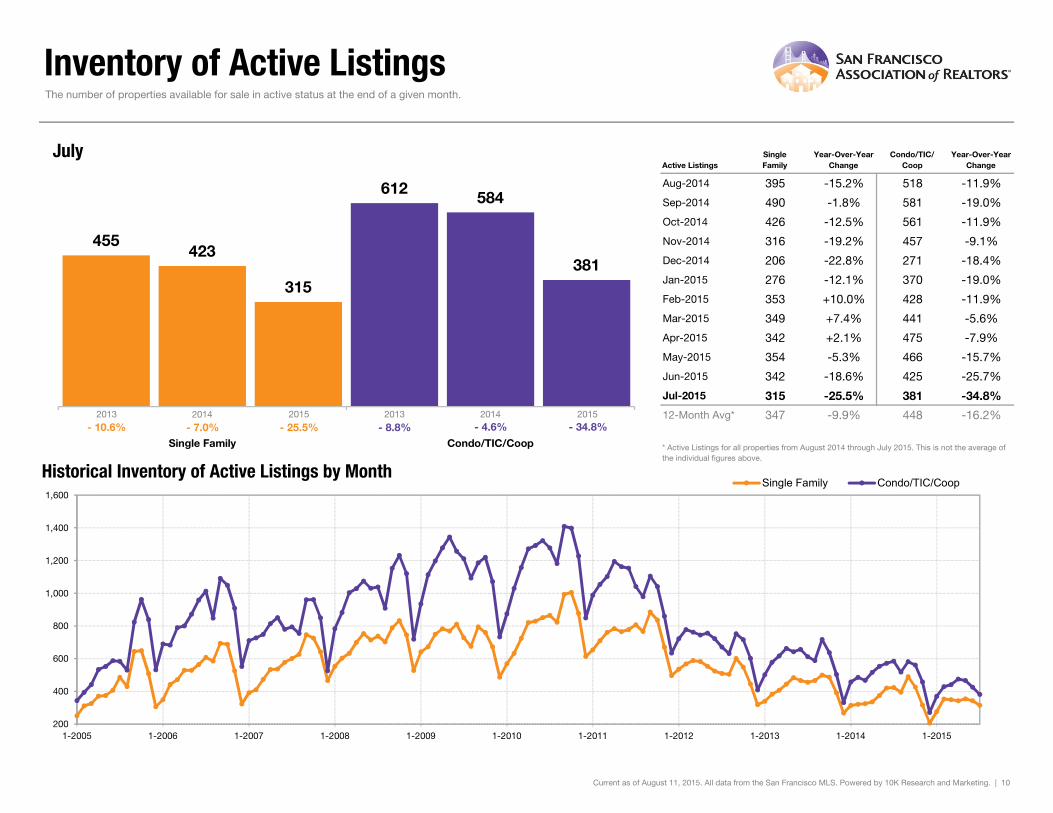
Historical Inventory of Active Listings by Month* Active Listings for all properties from August 2014 through July 2015. This is not the average of the individual figures above.
Current as of August 11, 2015. All data from the San Francisco MLS. Powered by 10K Research and Marketing. | 10
The number of properties available for sale in active status at the end of a given month.
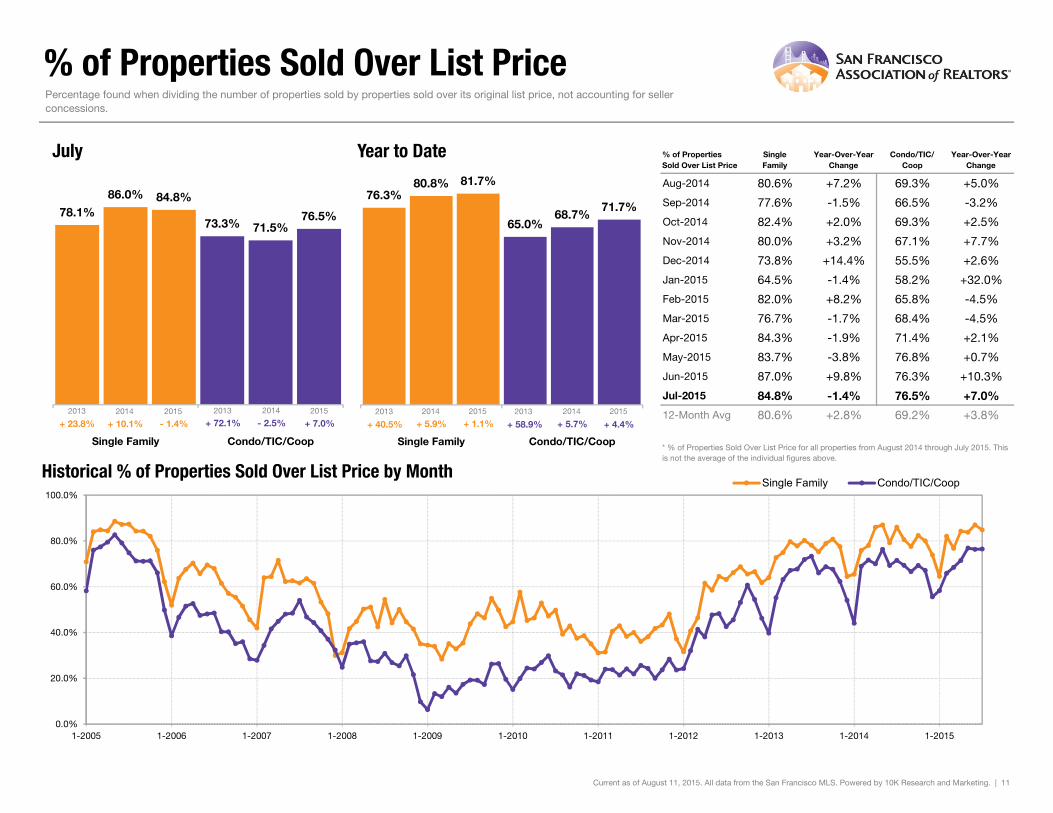
Historical % of Properties Sold Over List Price by Month* % of Properties Sold Over List Price for all properties from August 2014 through July 2015. This is not the average of the individual figures above.
Current as of August 11, 2015. All data from the San Francisco MLS. Powered by 10K Research and Marketing. | 11
Percentage found when dividing the number of properties sold by properties sold over its original list price, not accounting for seller concessions.
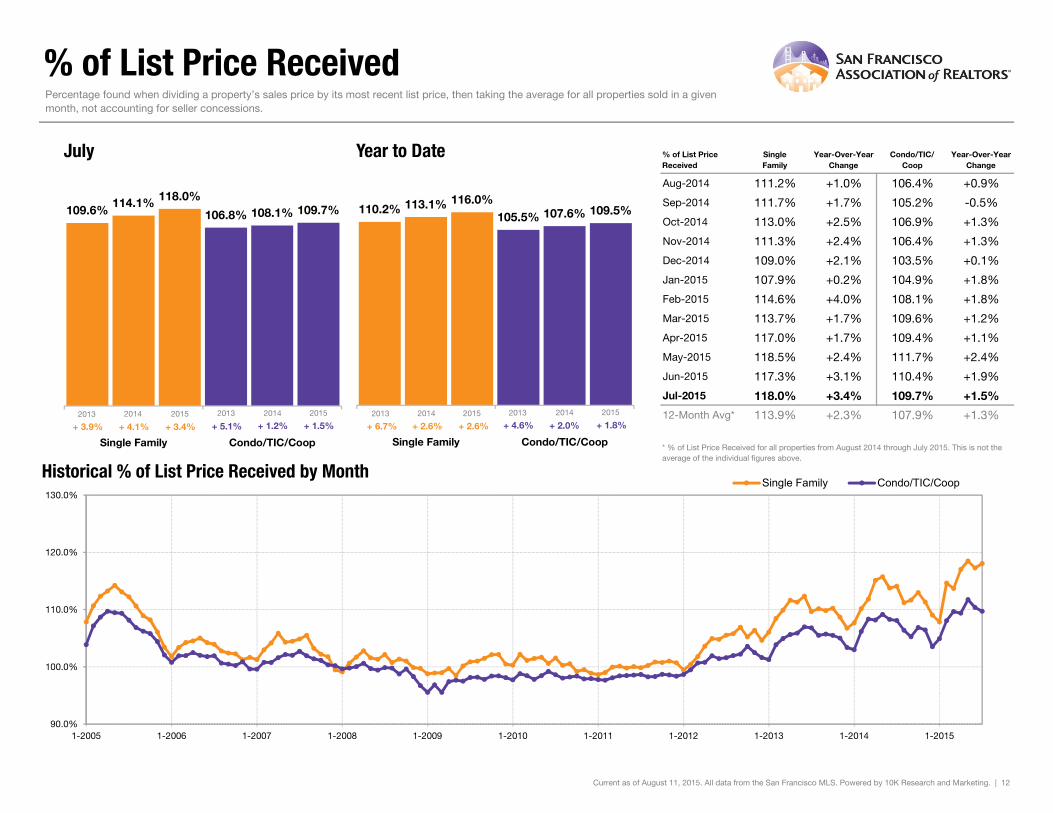
Historical % of List Price Received by Month* % of List Price Received for all properties from August 2014 through July 2015. This is not the average of the individual figures above.
Current as of August 11, 2015. All data from the San Francisco MLS. Powered by 10K Research and Marketing. | 12
Percentage found when dividing a property’s sales price by its most recent list price, then taking the average for all properties sold in a given month, not accounting for seller concessions.
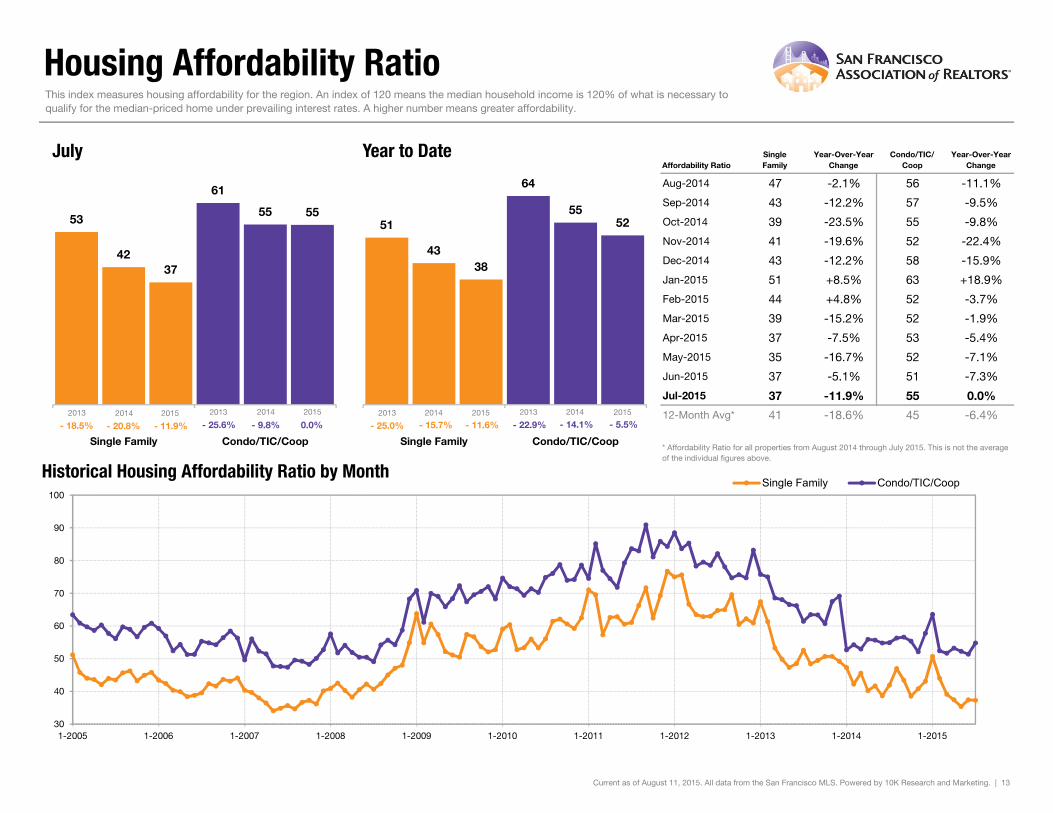
Historical Housing Affordability Ratio by Month* Affordability Ratio for all properties from August 2014 through July 2015. This is not the average of the individual figures above.
Current as of August 11, 2015. All data from the San Francisco MLS. Powered by 10K Research and Marketing. | 13
This index measures housing affordability for the region. An index of 120 means the median household income is 120% of what is necessary to qualify for the median-priced home under prevailing interest rates. A higher number means greater affordability.
Historical Months Supply of Inventory by Month* Months Supply for all properties from August 2014 through July 2015. This is not the average of the individual figures above.
Current as of August 11, 2015. All data from the San Francisco MLS. Powered by 10K Research and Marketing. | 14
The inventory of homes for sale at the end of a given month, divided by the average monthly pending sales from the last 12 months.
% of Properties Sold Over List Price 78.0% 80.4% + 3.1% 73.8%
42
76.0% + 3.0%
+ 2.2%
39 - 8.7%
112.3%% of List Price Received 110.8% 113.7% + 2.6% 109.9%
Current as of August 11, 2015. All data from the San Francisco MLS. Powered by 10K Research and Marketing. | 15
Months Supply 2.1 1.6 - 23.8% -- -- --
Affordability Ratio 43 39 - 7.9%
7-2012 7-2013 7-2014 7-2015
7-2012 7-2013 7-2014 7-2015
7-2012 7-2013 7-2014 7-2015
7-2012 7-2013 7-2014 7-2015
7-2012 7-2013 7-2014 7-2015
7-2012 7-2013 7-2014 7-2015
7-2012 7-2013 7-2014 7-2015
7-2012 7-2013 7-2014 7-2015
7-2012 7-2013 7-2014 7-2015
7-2012 7-2013 7-2014 7-2015
7-2012 7-2013 7-2014 7-2015
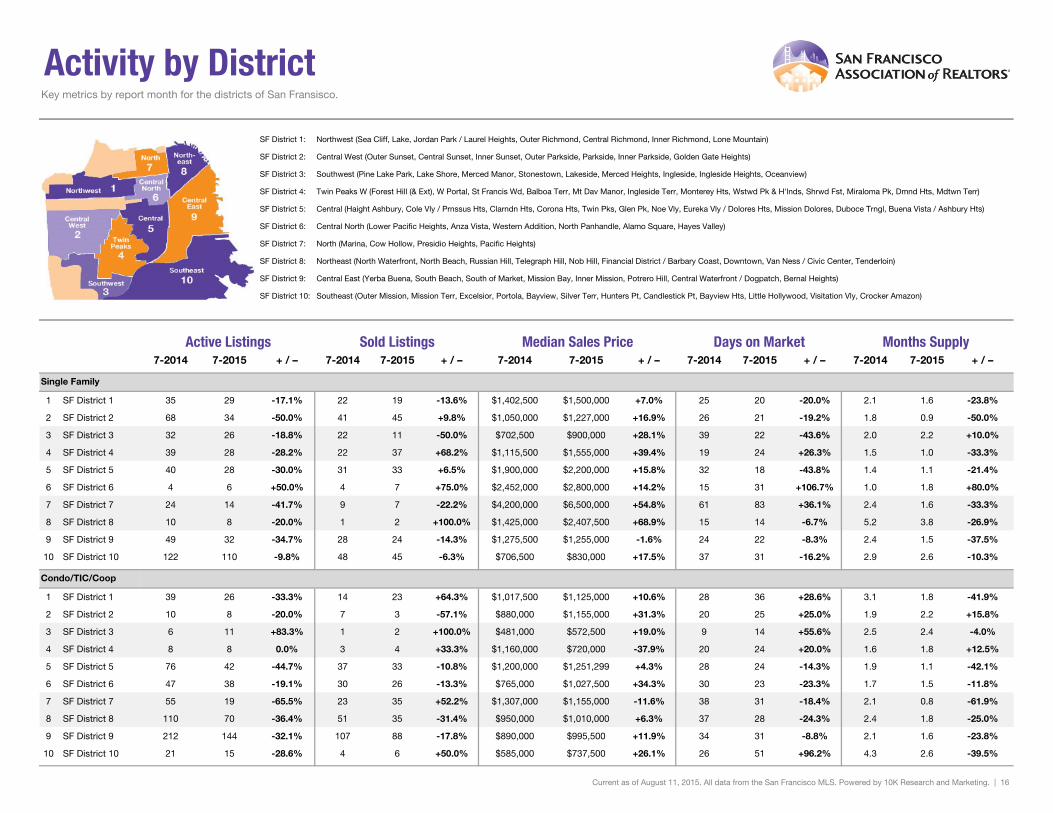
Activity by District
SF District 1: Northwest (Sea Cliff, Lake, Jordan Park / Laurel Heights, Outer Richmond, Central Richmond, Inner Richmond, Lone Mountain)
SF District 2: Central West (Outer Sunset, Central Sunset, Inner Sunset, Outer Parkside, Parkside, Inner Parkside, Golden Gate Heights)
SF District 3: Southwest (Pine Lake Park, Lake Shore, Merced Manor, Stonestown, Lakeside, Merced Heights, Ingleside, Ingleside Heights, Oceanview)
SF District 4: Twin Peaks W (Forest Hill (& Ext), W Portal, St Francis Wd, Balboa Terr, Mt Dav Manor, Ingleside Terr, Monterey Hts, Wstwd Pk & H'lnds, Shrwd Fst, Miraloma Pk, Dmnd Hts, Mdtwn Terr)
SF District 5: Central (Haight Ashbury, Cole Vly / Prnssus Hts, Clarndn Hts, Corona Hts, Twin Pks, Glen Pk, Noe Vly, Eureka Vly / Dolores Hts, Mission Dolores, Duboce Trngl, Buena Vista / Ashbury Hts)
SF District 6: Central North (Lower Pacific Heights, Anza Vista, Western Addition, North Panhandle, Alamo Square, Hayes Valley)
SF District 7: North (Marina, Cow Hollow, Presidio Heights, Pacific Heights)
SF District 8: Northeast (North Waterfront, North Beach, Russian Hill, Telegraph Hill, Nob Hill, Financial District / Barbary Coast, Downtown, Van Ness / Civic Center, Tenderloin)
SF District 9: Central East (Yerba Buena, South Beach, South of Market, Mission Bay, Inner Mission, Potrero Hill, Central Waterfront / Dogpatch, Bernal Heights)
SF District 10: Southeast (Outer Mission, Mission Terr, Excelsior, Portola, Bayview, Silver Terr, Hunters Pt, Candlestick Pt, Bayview Hts, Little Hollywood, Visitation Vly, Crocker Amazon)