San Francisco–Oakland Bay Bridge East Span Seismic Safety Project FINAL SFOBB Pier E3 Implosion Demonstration Project Report EA 04-013544 EFIS#: 0415000281 04-SF-80 KP 12.2/KP 14.3 04-ALA-80 KP 0.0/KP 2.1 May 2016
Transcript
San Francisco–Oakland Bay Bridge
East Span Seismic Safety Project
FINAL SFOBB Pier E3 Implosion Demonstration Project Report
EA 04-013544
EFIS#: 0415000281
04-SF-80 KP 12.2/KP 14.3
04-ALA-80 KP 0.0/KP 2.1
May 2016
Acknowledgments
The California Department of Transportation (Department) would like to acknowledge its agency partners for their contribution to the success of the Pier E3 Demonstration Project. The following agencies provided invaluable input, direction and support to the project and allowed the Department to design and implement this innovative and environmentally-responsible method of removal of the largest marine foundation of the original San Francisco-Oakland Bay Bridge East Spans:
San Francisco Bay Conservation and Development Commission
United States Army Corps of Engineers
National Oceanic and Atmospheric Administration – National Marine Fisheries Service
California Department of Fish and Wildlife
San Francisco Bay Regional Water Quality Control Board
United States Fish and Wildlife Service
United States Coast Guard
For individuals with sensory disabilities, this document is available in Braille, large print,
on audiocassette, or computer disk. To obtain a copy in one of these alternate formats,
please call or write to Caltrans, Attn. Stefan Galvez-Abadia, District Office Chief,
Environmental Analysis, 111 Grand Avenue, Oakland, CA 94612; (510) 867-6785 Voice,
or use the California Relay Service TTY number (800)-735-2929 or 711
This page intentionally left blank.
Table of Contents
FINAL SFOBB Pier E3 Implosion Demonstration Project Report i
Table of Contents
Chapter 1. Introduction ............................................................................................................... 1 1.1. Background ...................................................................................................................... 1 1.2. Purpose and Need ............................................................................................................. 1
Chapter 2. Project Description ................................................................................................... 3 2.1. Cantilever Superstructure and YBI Detour ...................................................................... 4 2.2. 504-foot and 288-foot (504/288) Spans Superstructure ................................................... 4 2.3. Marine Foundations .......................................................................................................... 5 2.4. Dismantling of the SFOBB Original East Span ............................................................... 5 2.5. FEIS Project Description Update and FEIS Re-Validation .............................................. 6 2.6. Pier E3 Site Location and Description ............................................................................. 6 2.7. Pier E3 Demonstration Project Overview ........................................................................ 9 2.8. Geotechnical ................................................................................................................... 12
Appendix A. Response to Comments matrix .......................................................................... 150
List of Figures
FINAL SFOBB Pier E3 Implosion Demonstration Project Report ii
List of Figures
Figure 1. SFOBB Project Map ......................................................................................................... 3 Figure 2. Elevation View Schematic of the Original SFOBB East Span ......................................... 4 Figure 3. Sections of the Original SFOBB East Span ...................................................................... 5 Figure 4. Schematic of the East Span of the SFOBB ....................................................................... 7 Figure 5. Final Plan Sheet of Pier E3 Showing Elevations, Dimensions, and Limits of
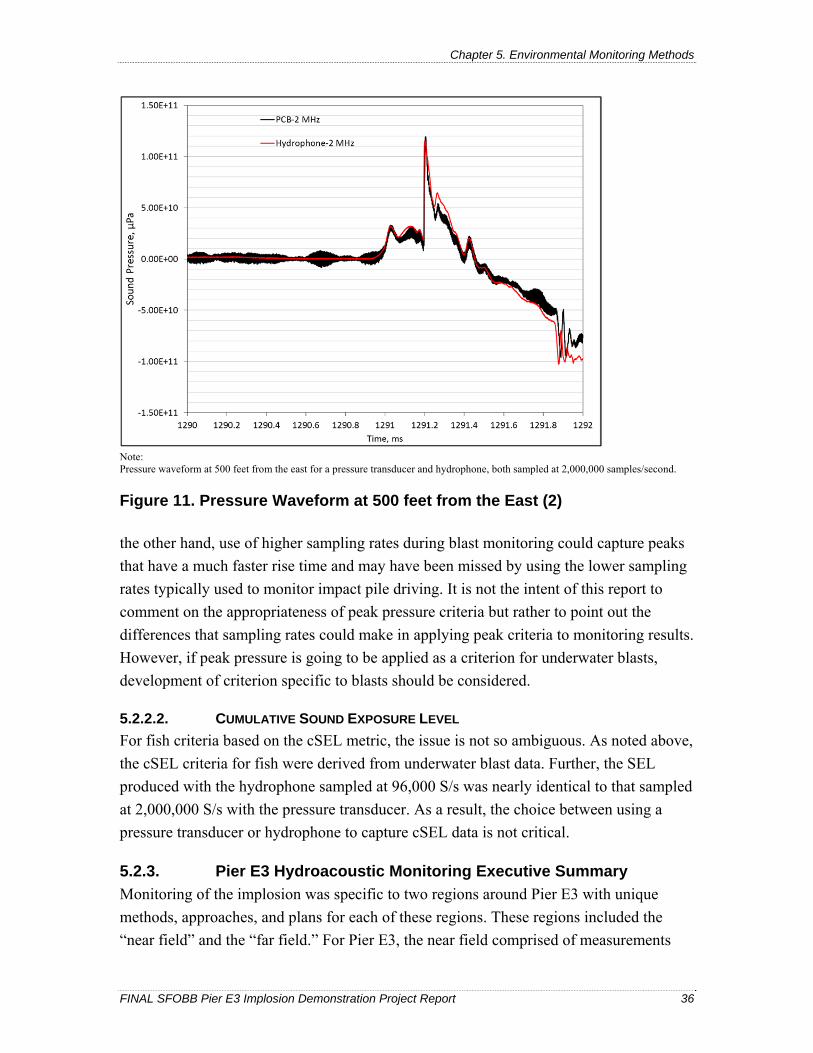
Removal ..................................................................................................................................... 8 Figure 6. View of Pier E3 Facing Northwest ................................................................................... 9 Figure 7. Pier E3 Drilling Template Schematic ............................................................................. 11 Figure 8. Soil Profile along the Alignment of the Original Bay Bridge East Spans ...................... 14 Figure 9. View of an Eelgrass Bed ................................................................................................. 18 Figure 10. Pressure Waveform at 500 feet from the East (1) ......................................................... 35 Figure 11. Pressure Waveform at 500 feet from the East (2) ......................................................... 36 Figure 12. Summary of Peak Pressure Level and Cumulative Sound Exposure Level Results ..... 39 Figure 13. Summary of the Calculated Distances to Criteria and Those Indicated by
Measurements .......................................................................................................................... 39 Figure 14. Blast Attenuation System Schematic ............................................................................ 40 Figure 15. BAS Operating before the Implosion ............................................................................ 40 Figure 16. Sequence of the Firing of Individual Charges ............................................................... 43 Figure 17. Propagation Effects in Shallow Water .......................................................................... 45 Figure 18. Calculated Blast Wave Time Histories for Different Blast Distances .......................... 47 Figure 19. Calculated Total Pressure Versus Time History for Combined Direct And Surface
Relief Wave ............................................................................................................................. 48 Figure 20. Effect of Bubble Screens of Different Parameters on Underwater Unconfined Blast .. 51 Figure 21. Weighting Functions for Marine Mammal Species of Concern for the Pier E3
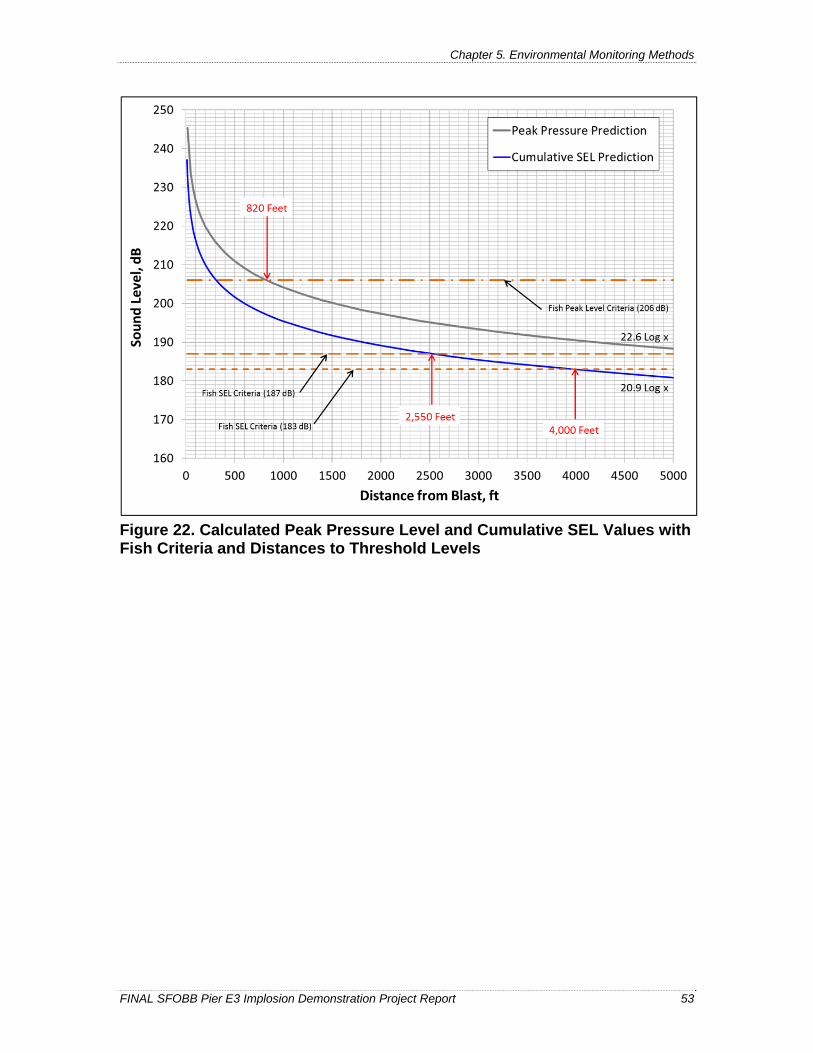
Implosion ................................................................................................................................. 52 Figure 22. Calculated Peak Pressure Level and Cumulative SEL Values with Fish Criteria
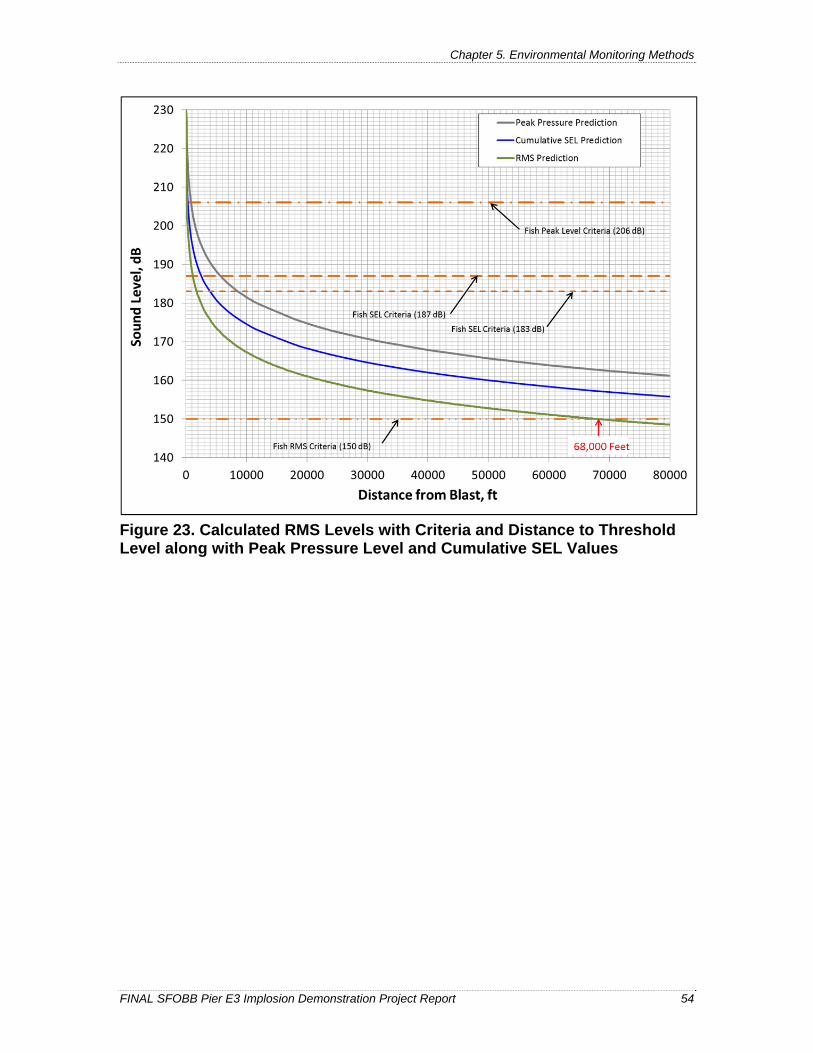
and Distances to Threshold Levels .......................................................................................... 53 Figure 23. Calculated RMS Levels with Criteria and Distance to Threshold Level along with
Peak Pressure Level and Cumulative SEL Values ................................................................... 54 Figure 24. Calculated Cumulative PWI Weighted SEL for Seals with Criteria and Distance to
Thresholds Indicated ................................................................................................................ 55 Figure 25. Calculated Cumulative OWI Weighted SEL for Sea Lions with Criteria and
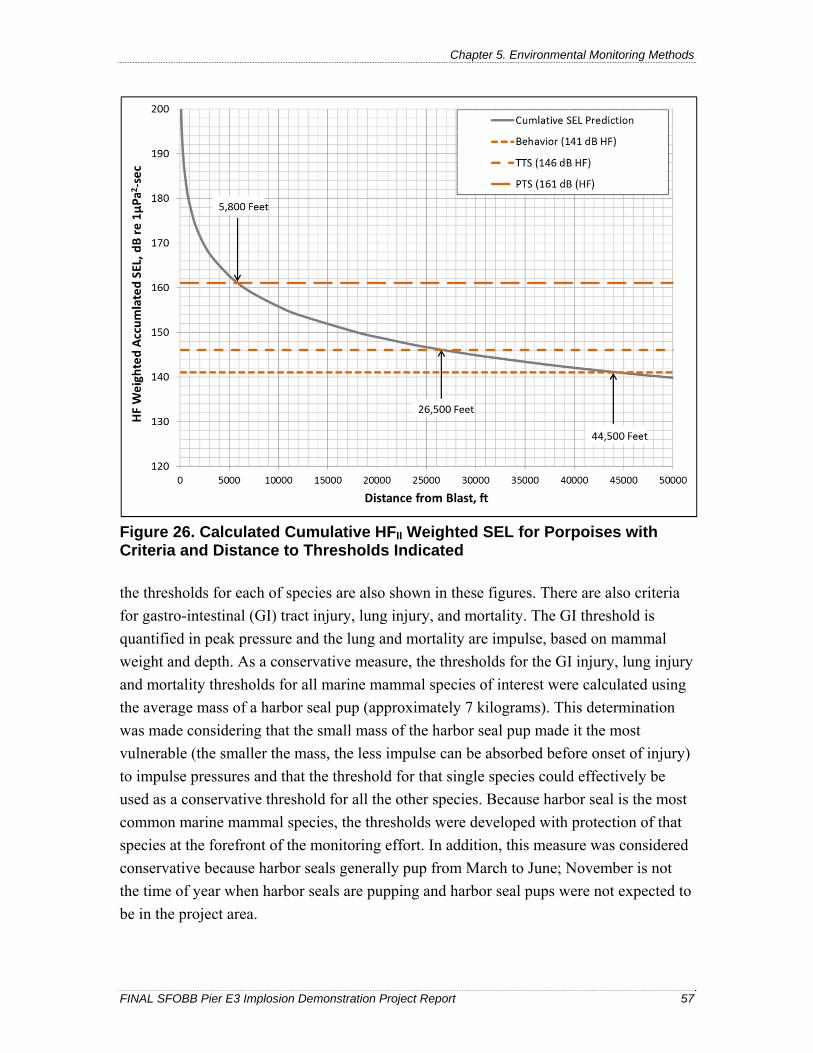
Distance to Thresholds Indicated ............................................................................................. 56 Figure 26. Calculated Cumulative HFII Weighted SEL for Porpoises with Criteria and
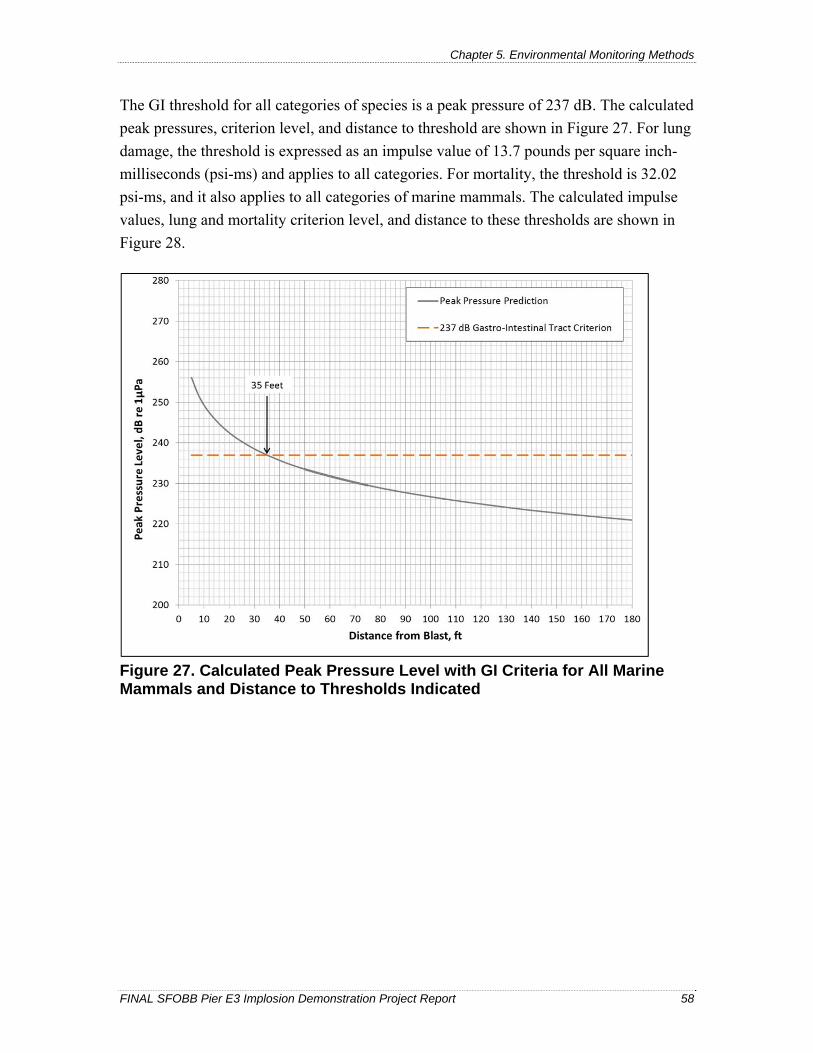
Distance to Thresholds Indicated ............................................................................................. 57 Figure 27. Calculated Peak Pressure Level with GI Criteria for All Marine Mammals and
Distance to Thresholds Indicated ............................................................................................. 58 Figure 28. Calculated Impulse Values with Lung and Mortality Criteria for All Marine
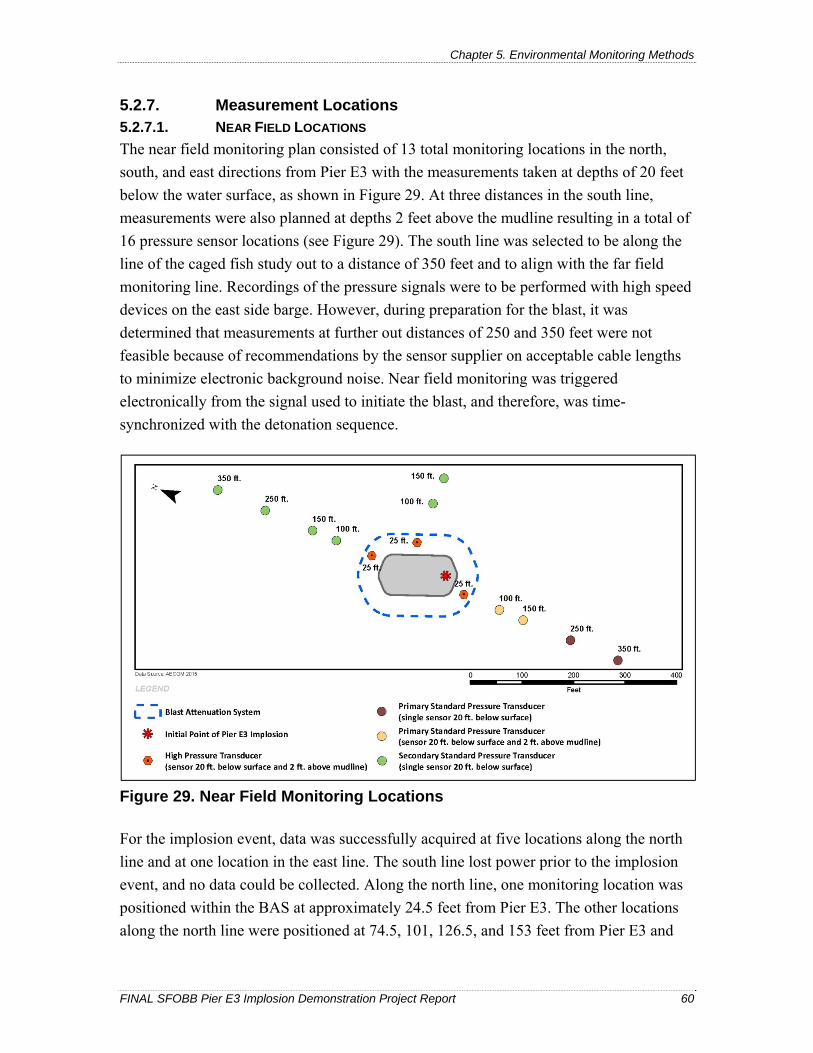
Mammals and Distance to Thresholds Indicated ..................................................................... 59 Figure 29. Near Field Monitoring Locations .................................................................................. 60 Figure 30. Deployed Near-Field Locations where Data was Collected during Pier E3
Implosion ................................................................................................................................. 61 Figure 31. Proposed and Deployed Locations of All Far Field Monitoring Points ........................ 62 Figure 32. Far-Field Deployed Locations where Data was Collected during Pier E3 Implosion .. 63 Figure 33. Fishery Assessment Areas for Acoustic Surveys on October 29 and 30 and Trawl
Tracks on October 31 ............................................................................................................... 73 Figure 34. Fishery Assessment Areas for Acoustic Surveys on October 29 and 30 and Trawl
Tracks on November 14 ........................................................................................................... 74
List of Figures
FINAL SFOBB Pier E3 Implosion Demonstration Project Report iii
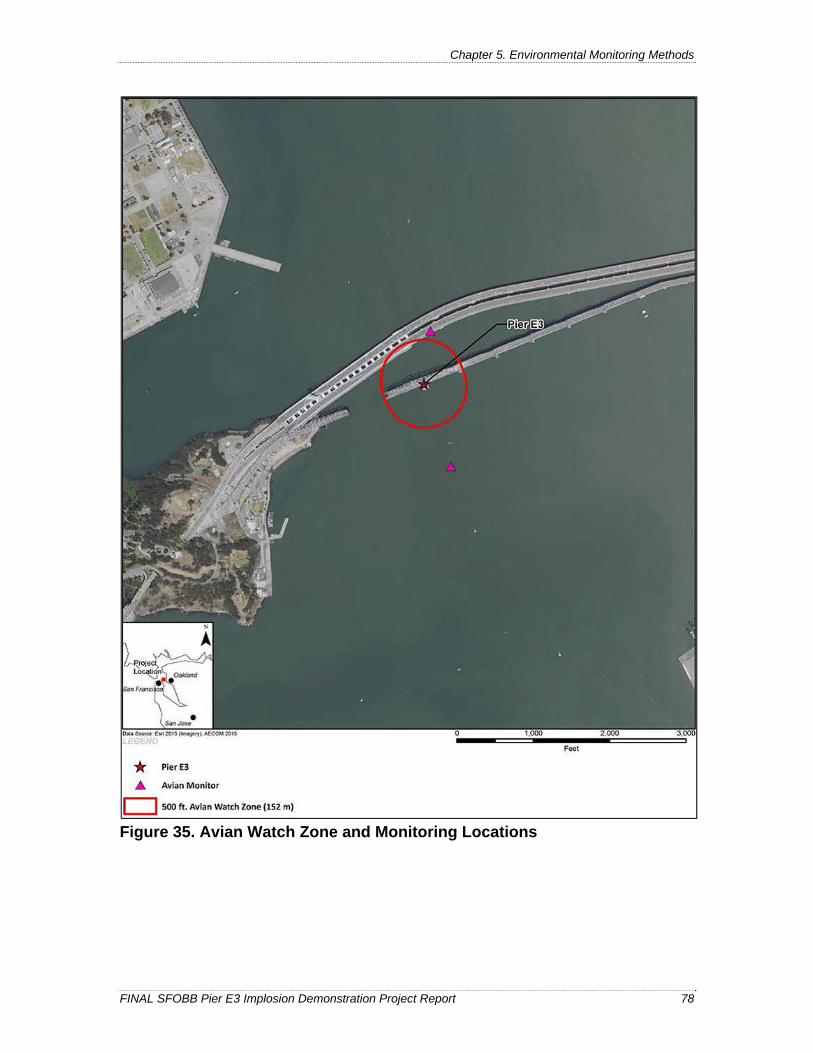
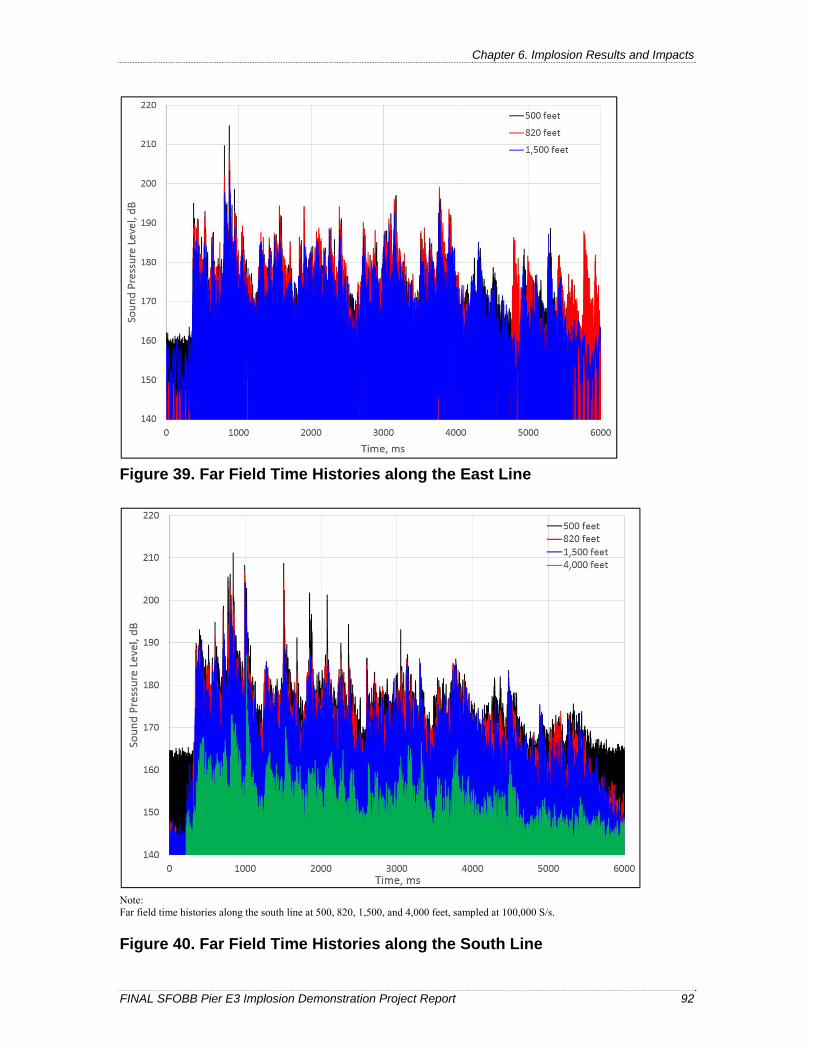
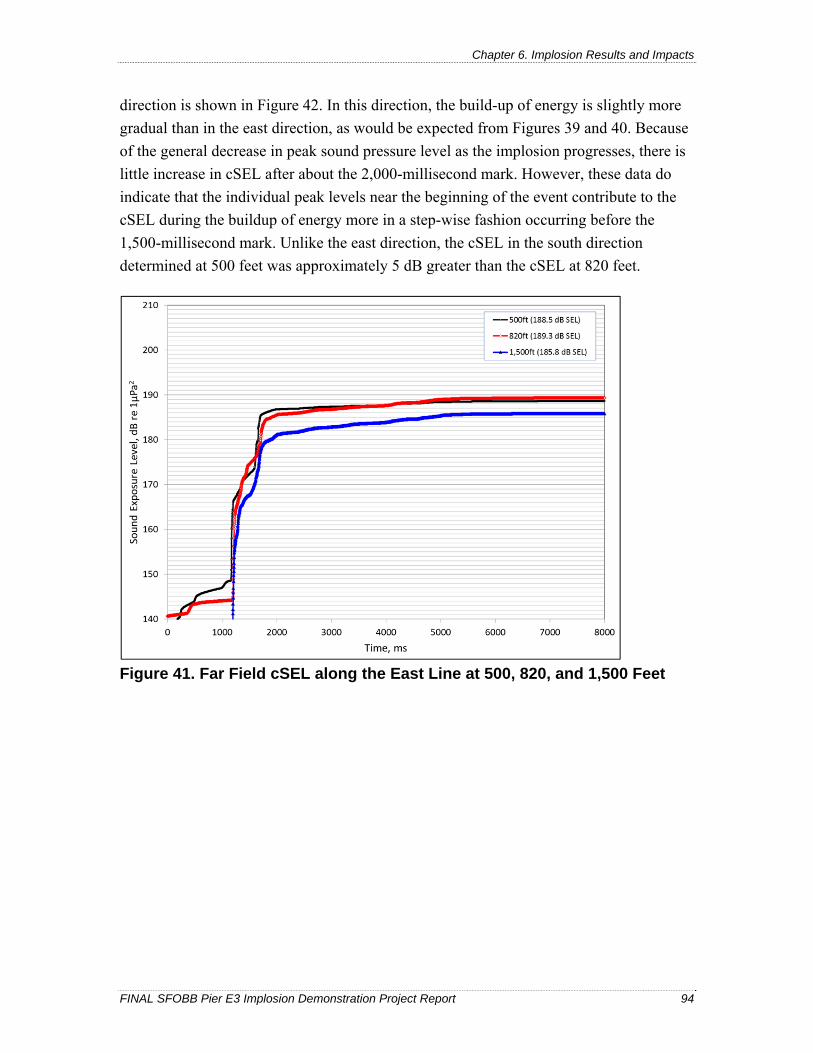
Figure 35. Avian Watch Zone and Monitoring Locations .............................................................. 78 Figure 36. Pier E3 Pre-Implosion, August 7, 2015 ........................................................................ 88 Figure 37. Pier E3 Site after Implosion, November 14, 2015 ........................................................ 89 Figure 38. Pier E3 Site after Completion of Cleanup Activities, December 10, 2015 ................... 90 Figure 39. Far Field Time Histories along the East Line ............................................................... 92 Figure 40. Far Field Time Histories along the South Line ............................................................. 92 Figure 41. Far Field cSEL along the East Line at 500, 820, and 1,500 Feet .................................. 94 Figure 42. Far Field cSEL along the South Line at 500, 820, 1,500, and 4,000 Feet ..................... 95 Figure 43. One-Third Octave band Levels for cSEL at the Far Field Monitoring Locations to
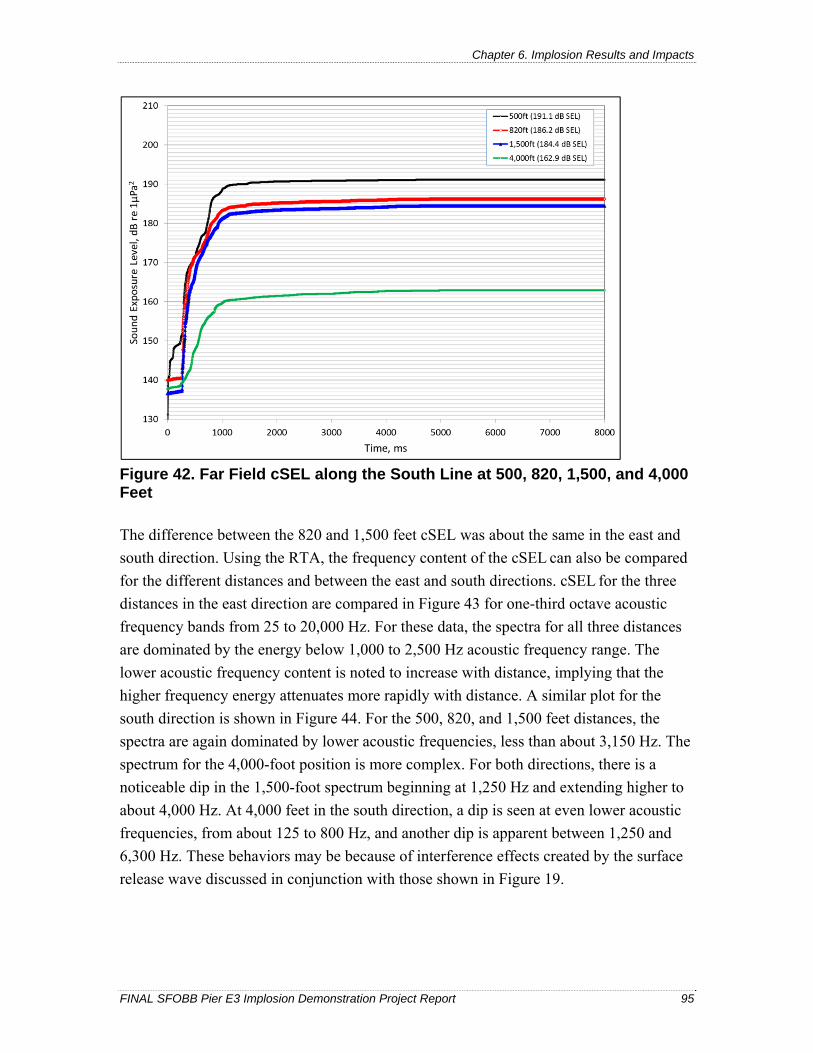
the East ..................................................................................................................................... 96 Figure 44. One-Third Octave Band Levels for cSEL at the Far Field Monitoring Locations to
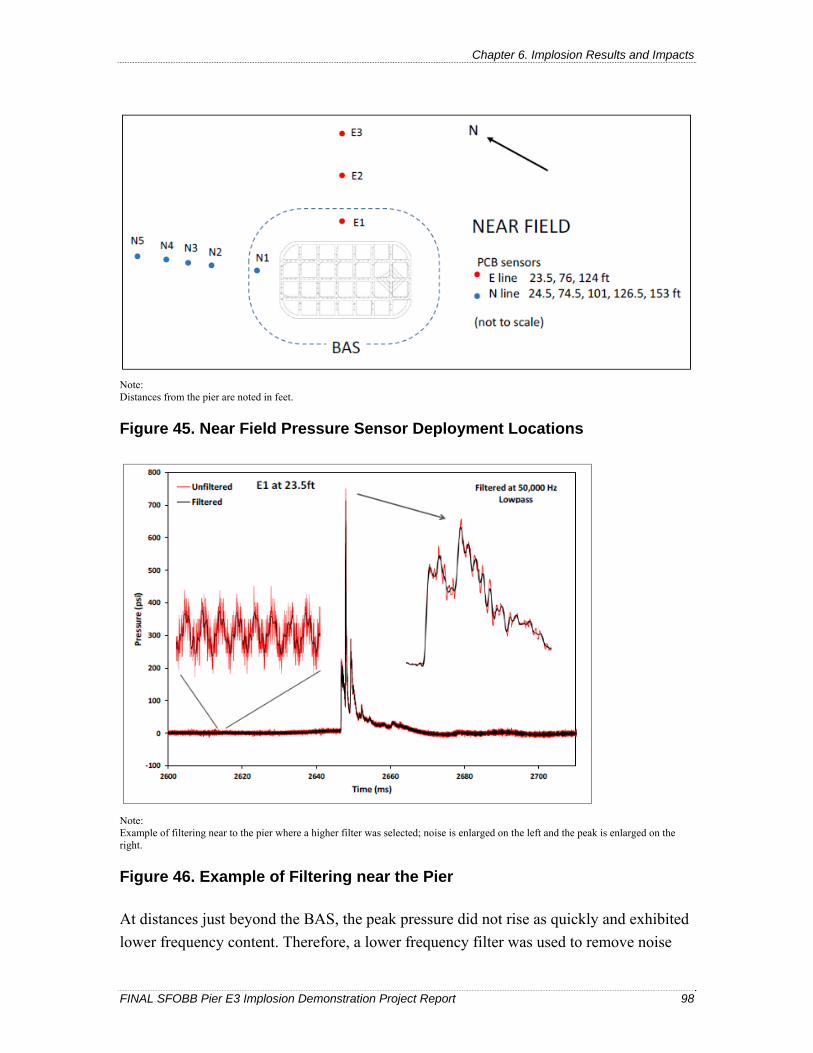
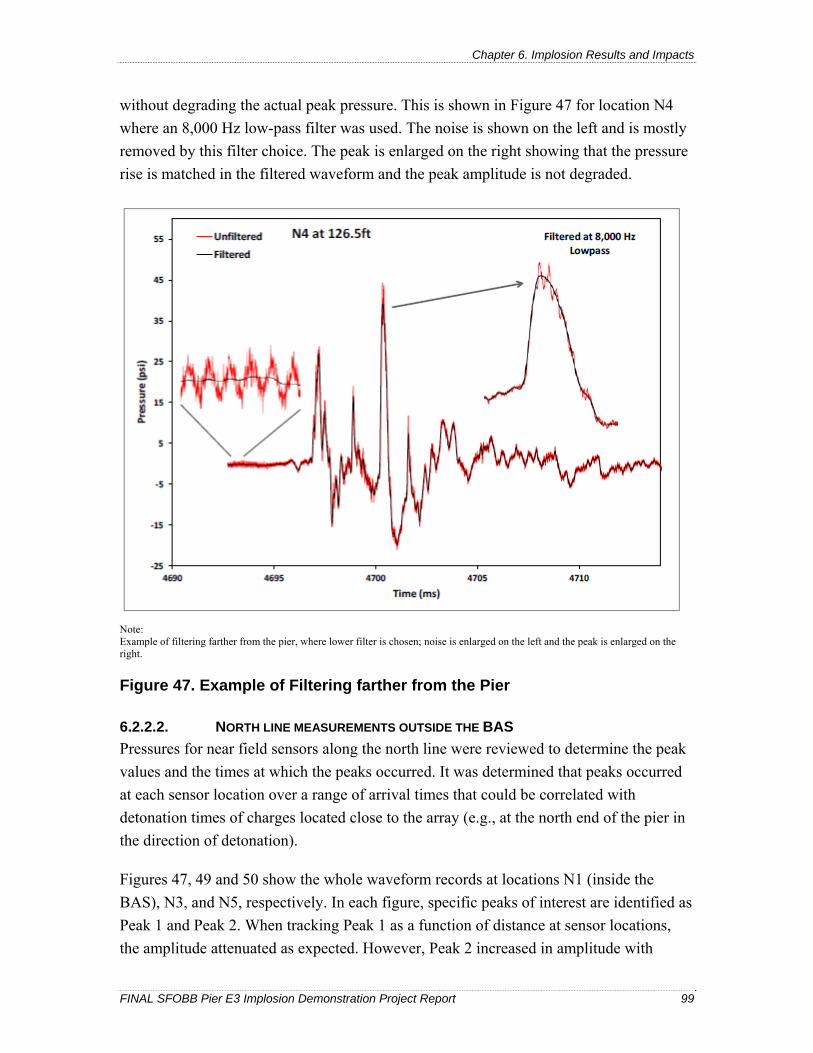
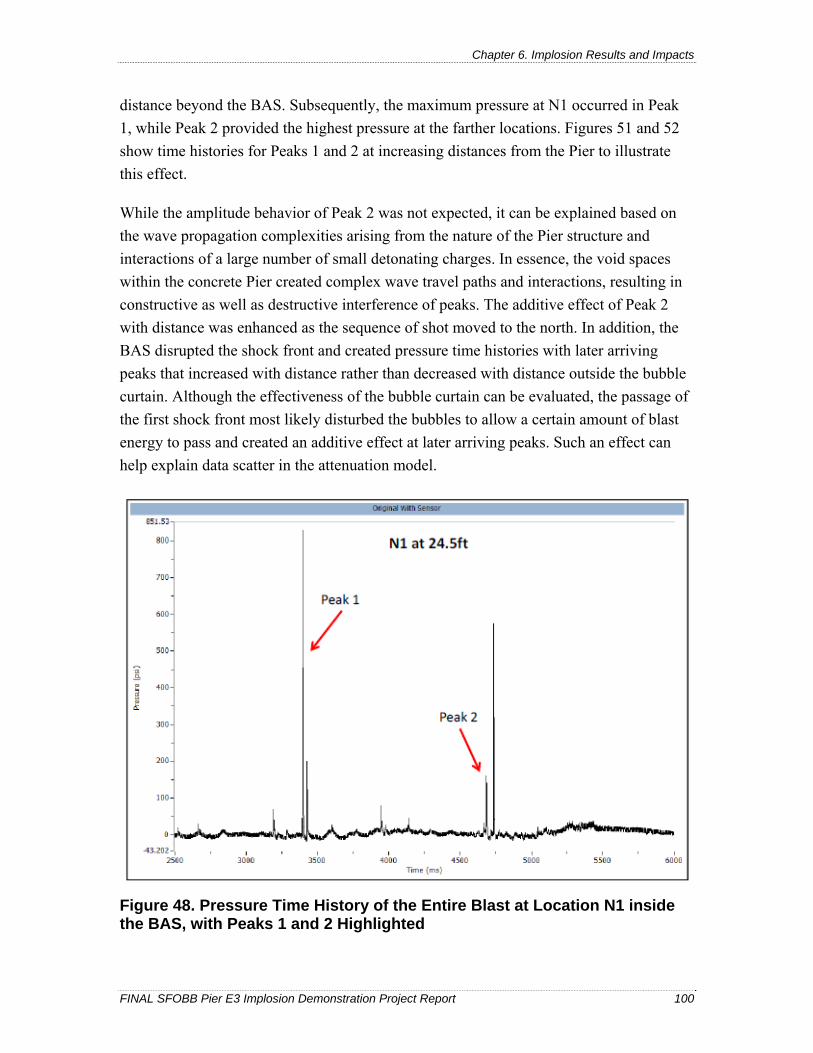
the South .................................................................................................................................. 97 Figure 45. Near Field Pressure Sensor Deployment Locations ...................................................... 98 Figure 46. Example of Filtering near the Pier ................................................................................ 98 Figure 47. Example of Filtering farther from the Pier .................................................................... 99 Figure 48. Pressure Time History of the Entire Blast at Location N1 inside the BAS, with
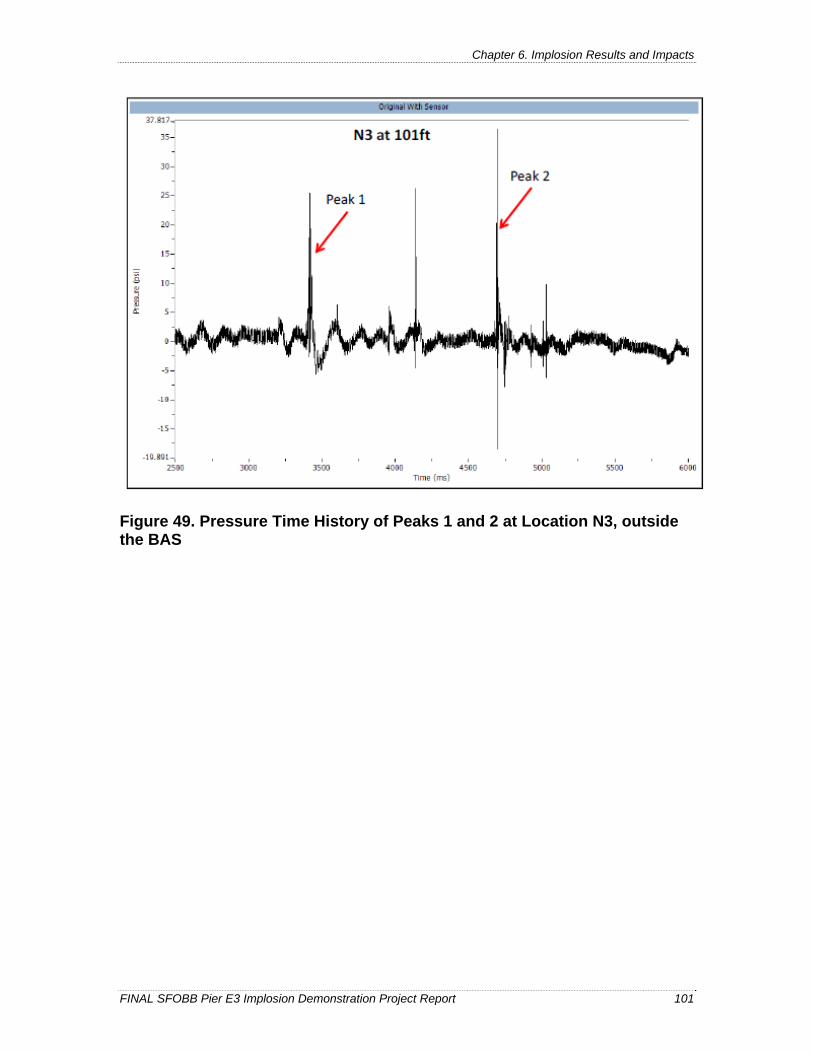
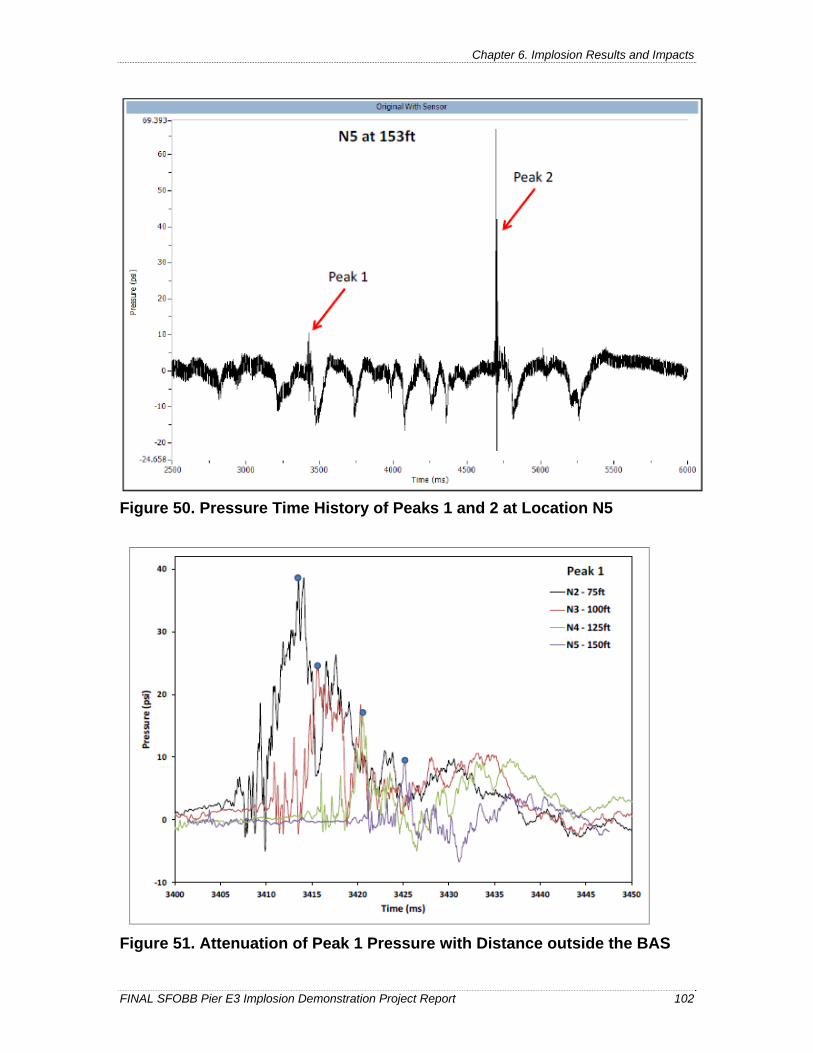
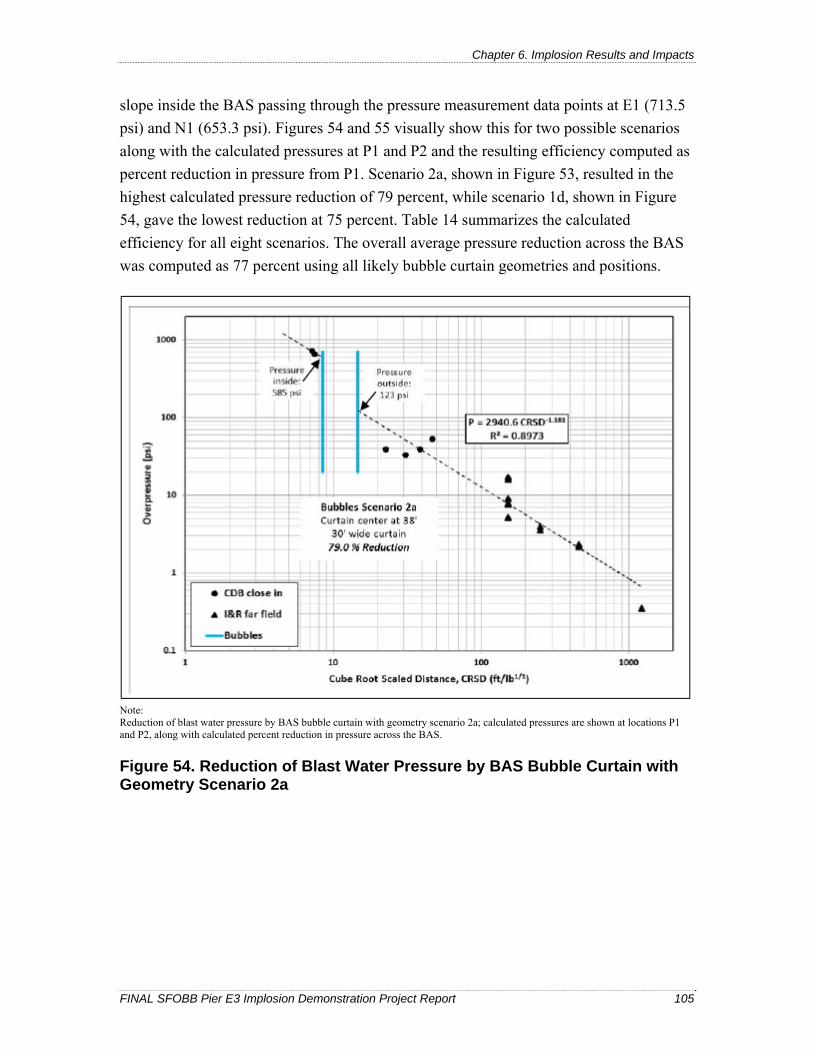
Peaks 1 and 2 Highlighted ..................................................................................................... 100 Figure 49. Pressure Time History of Peaks 1 and 2 at Location N3, outside the BAS ................ 101 Figure 50. Pressure Time History of Peaks 1 and 2 at Location N5 ............................................ 102 Figure 51. Attenuation of Peak 1 Pressure with Distance outside the BAS ................................. 102 Figure 52. Increase of Peak 2 Pressure with Distance outside the BAS ....................................... 103 Figure 53. Cross-Section of BAS Bubble Curtain with Relevant Geometric Relations............... 104 Figure 54. Reduction of Blast Water Pressure by BAS Bubble Curtain with Geometry
Scenario 2a ............................................................................................................................. 105 Figure 55. Reduction of Blast Water Pressure across the BAS Bubble Curtain for Geometry
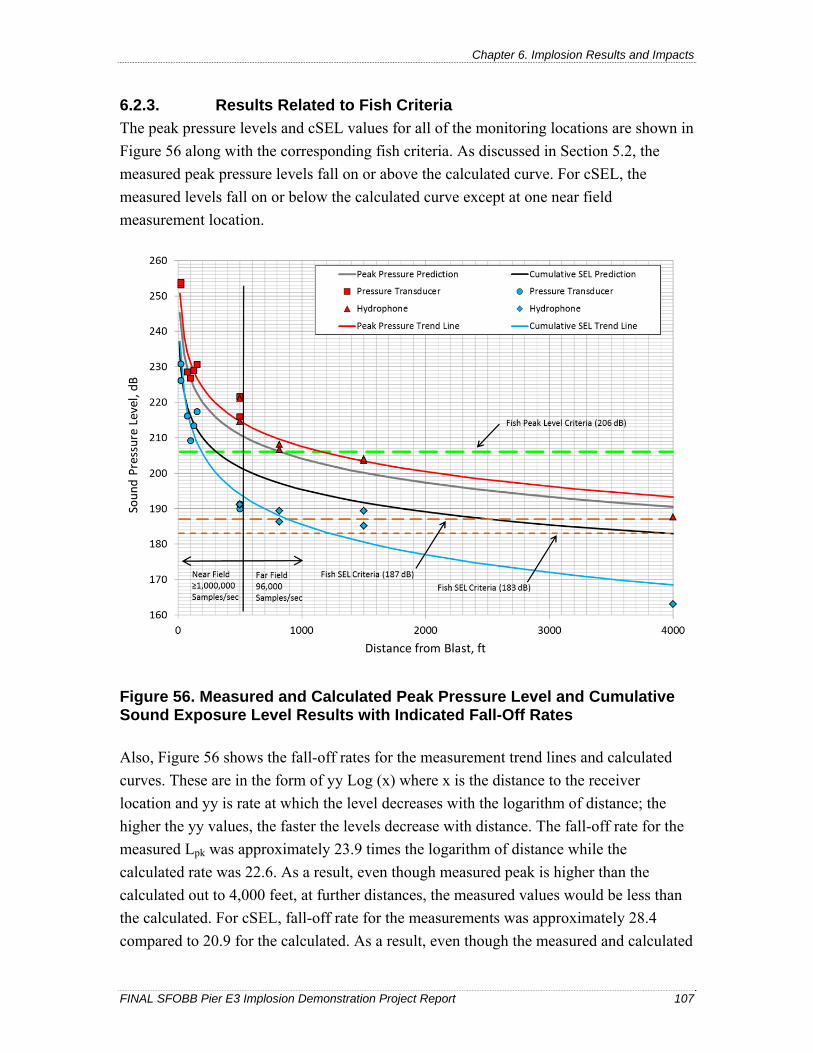
Scenario 1d ............................................................................................................................ 106 Figure 56. Measured and Calculated Peak Pressure Level and Cumulative Sound Exposure
Level Results with Indicated Fall-Off Rates .......................................................................... 107 Figure 57. Comparison of Measured RMS Levels to Calculated and Data Trend Line ............... 108 Figure 58. Marine Mammal Weighted Measured Levels Compared to Calculated Values and
Criteria ................................................................................................................................... 110 Figure 59. Marine Mammal Weighted Measured Levels and Trend Lines Compared to
Criteria ................................................................................................................................... 111 Figure 60. Summary of Impulse Results Compared to the Calculated and the Marine Mammal
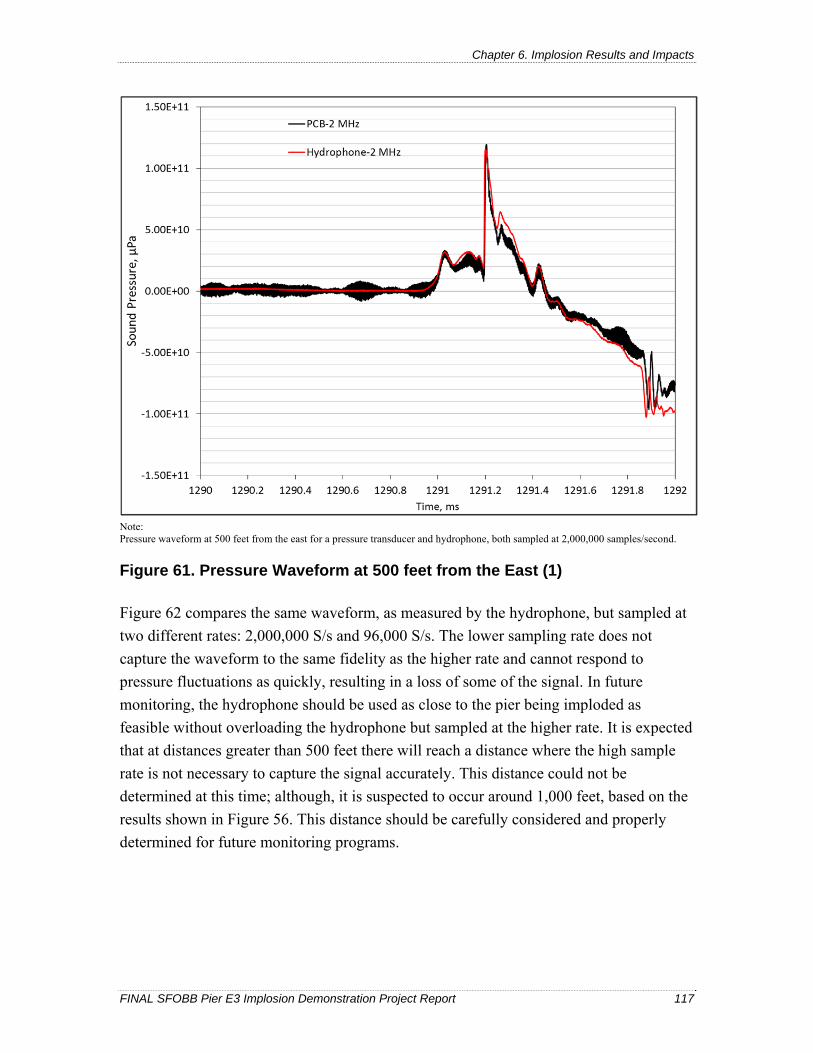
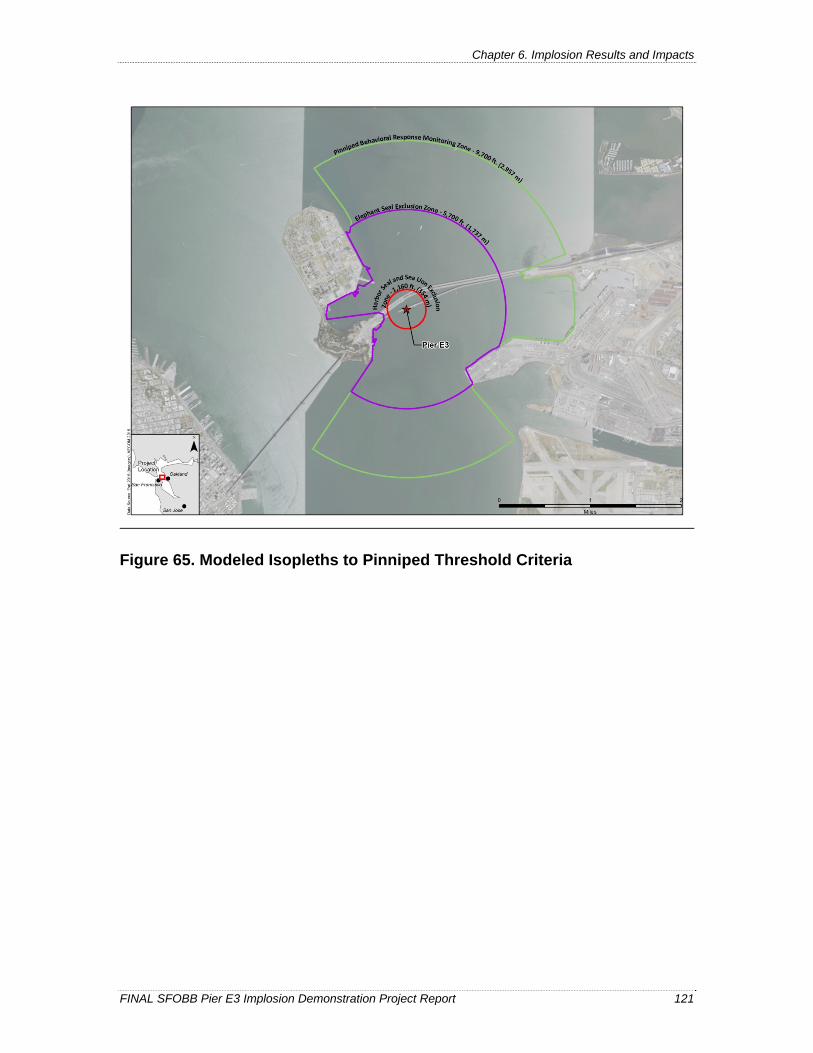
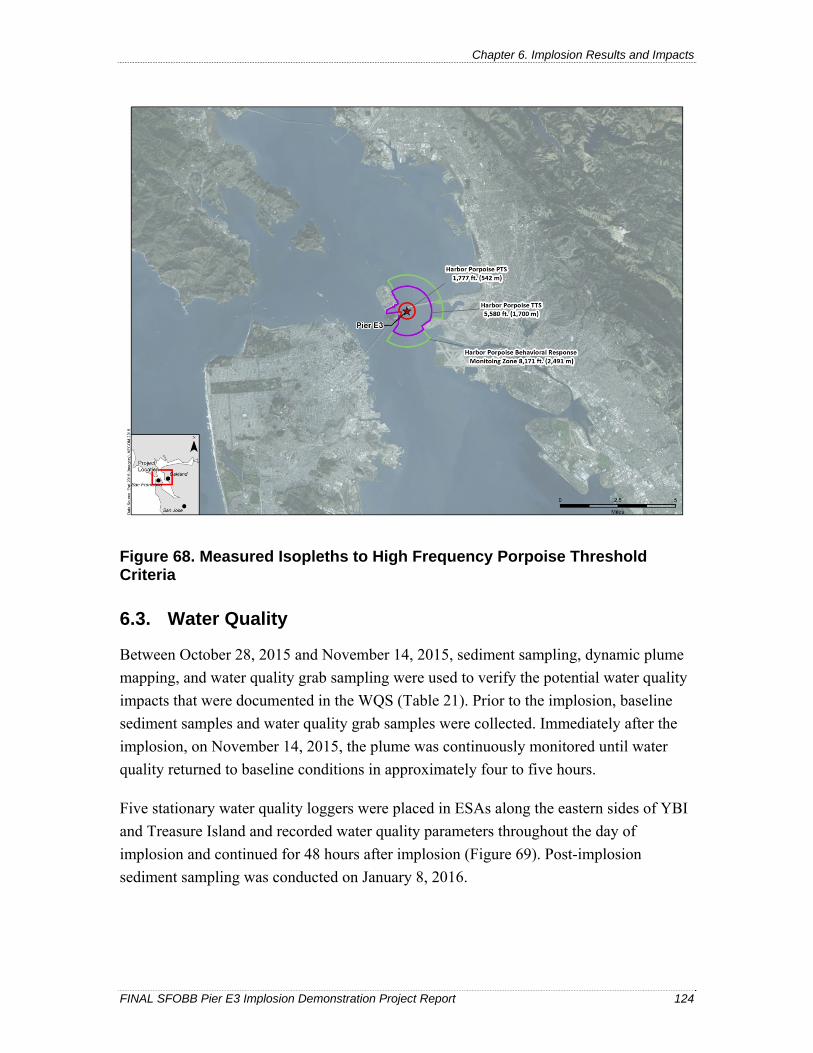
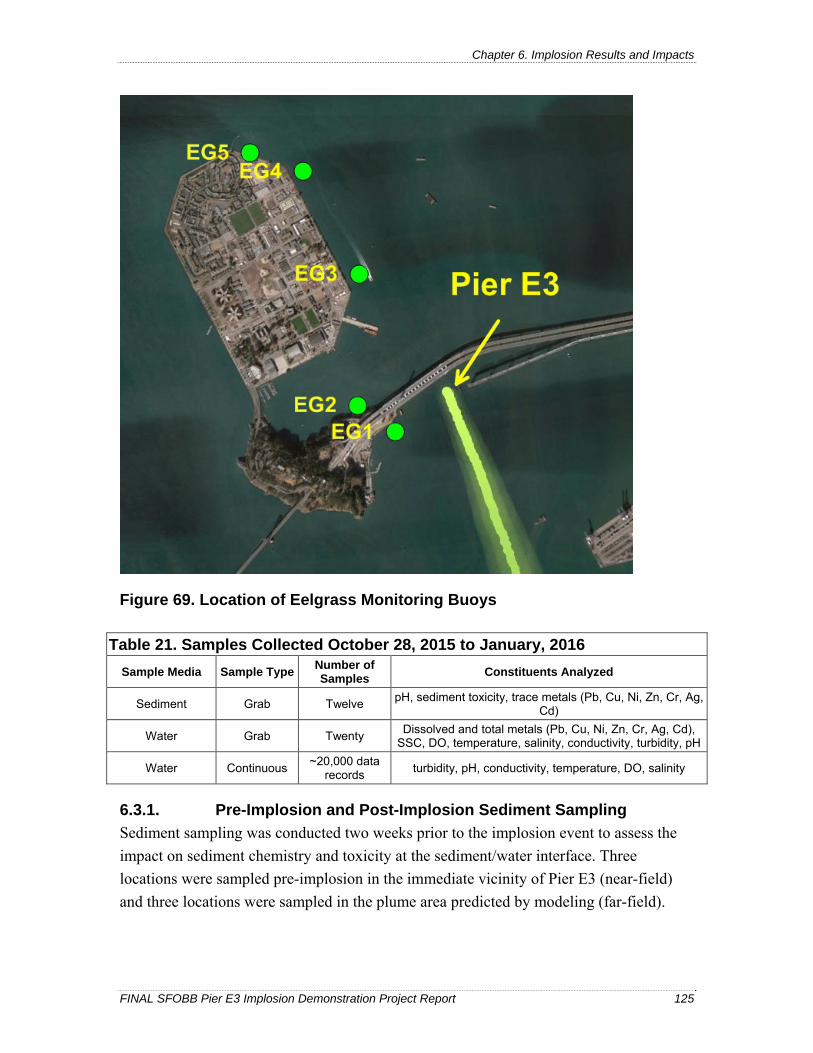
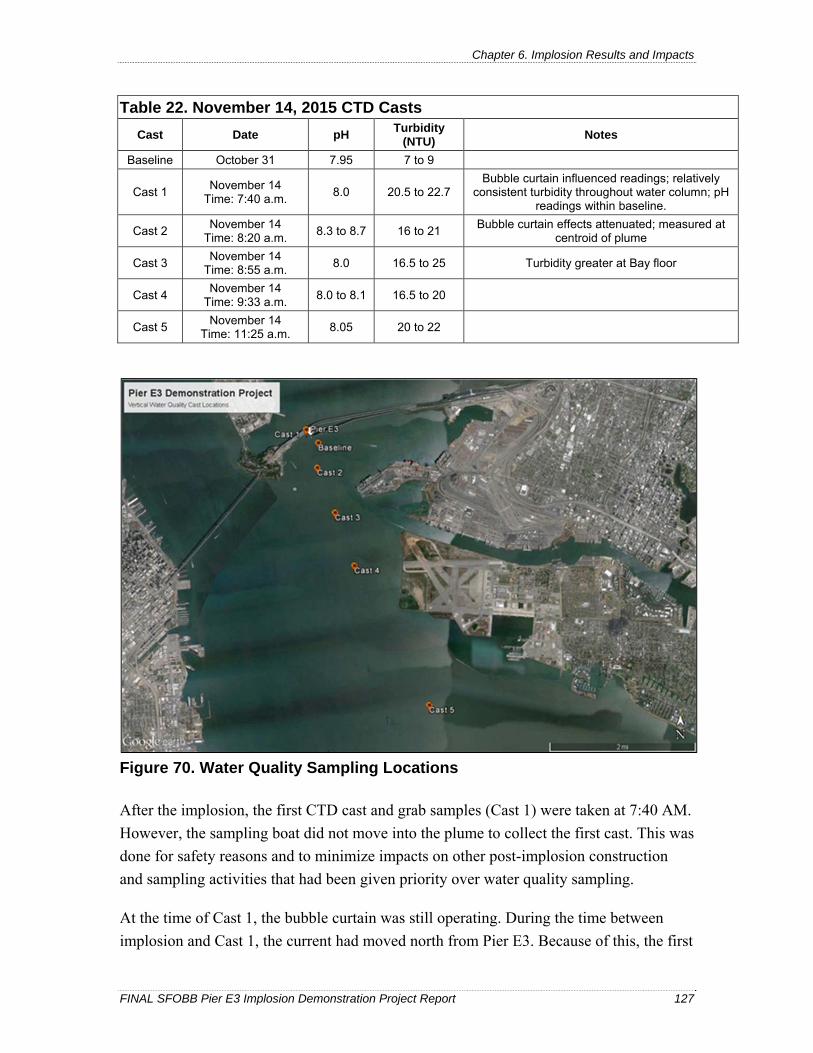
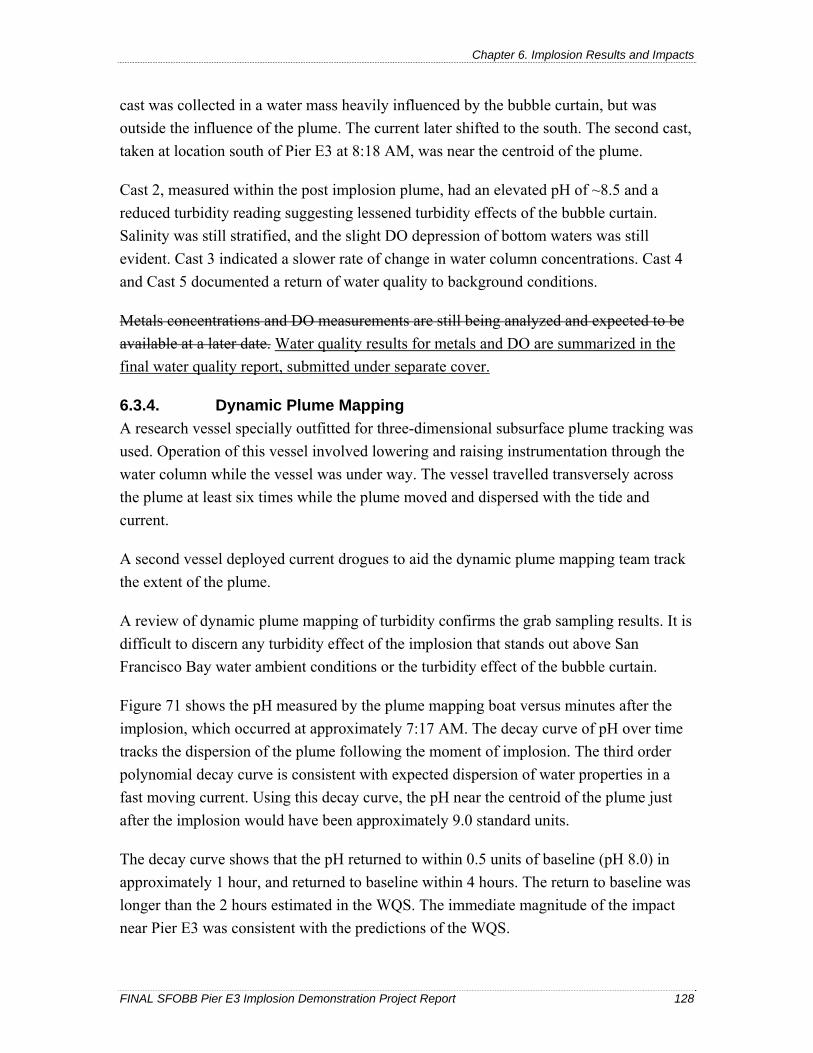
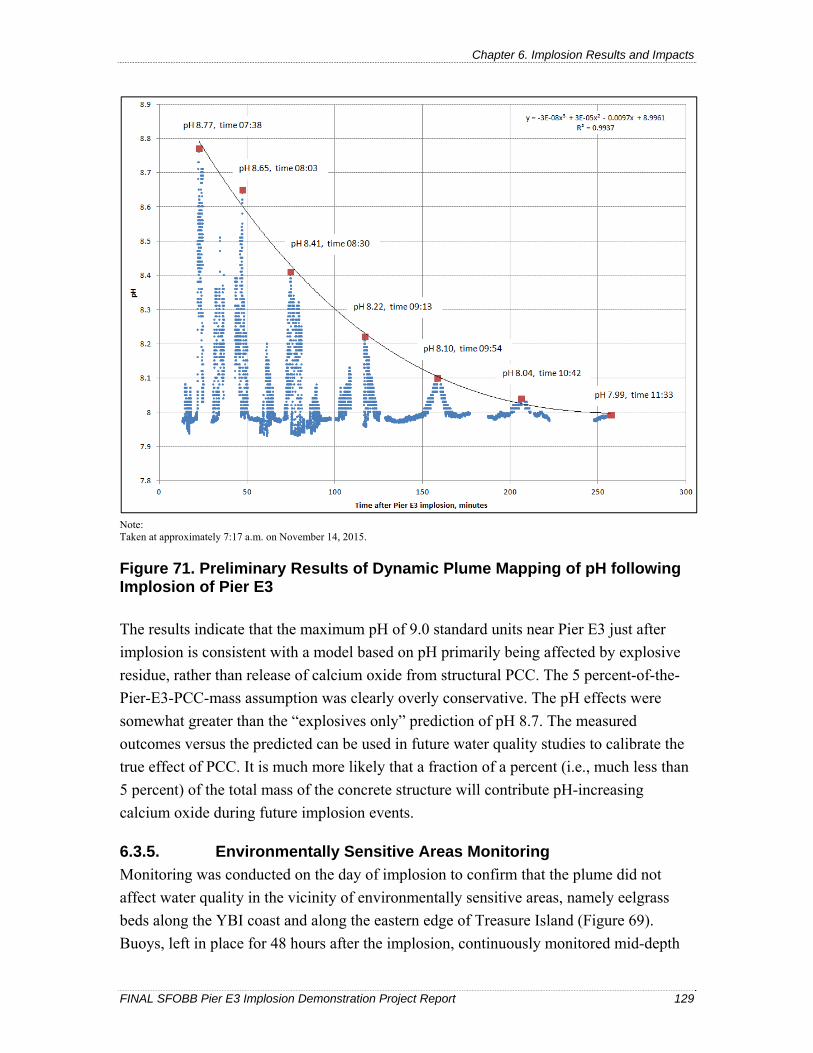
Criteria ................................................................................................................................... 111 Figure 61. Pressure Waveform at 500 feet from the East (1) ....................................................... 117 Figure 62. Pressure Waveform at 500 feet from the East (2) ....................................................... 118 Figure 63. Modeled Isopleths to Fish Threshold Criteria ............................................................. 119 Figure 64. Measured Isopleths to Fish Threshold Criteria ........................................................... 120 Figure 65. Modeled Isopleths to Pinniped Threshold Criteria ..................................................... 121 Figure 66. Measured Isopleths to Pinniped Threshold Criteria .................................................... 122 Figure 67. Modeled Isopleths to High Frequency Porpoise Threshold Criteria ........................... 123 Figure 68. Measured Isopleths to High Frequency Porpoise Threshold Criteria ......................... 124 Figure 69. Location of Eelgrass Monitoring Buoys ..................................................................... 125 Figure 70. Water Quality Sampling Locations ............................................................................. 127 Figure 71. Preliminary Results of Dynamic Plume Mapping of pH following Implosion of
Pier E3 .................................................................................................................................... 129 Figure 72. Percent of Normal Fish from Each Cage Deployed for the Pier E3 Implosion .......... 131 Figure 73. Percent of Impaired Fish (orange) and Dead Fish (gray) in Each Cage by Distance
FINAL SFOBB Pier E3 Implosion Demonstration Project Report iv
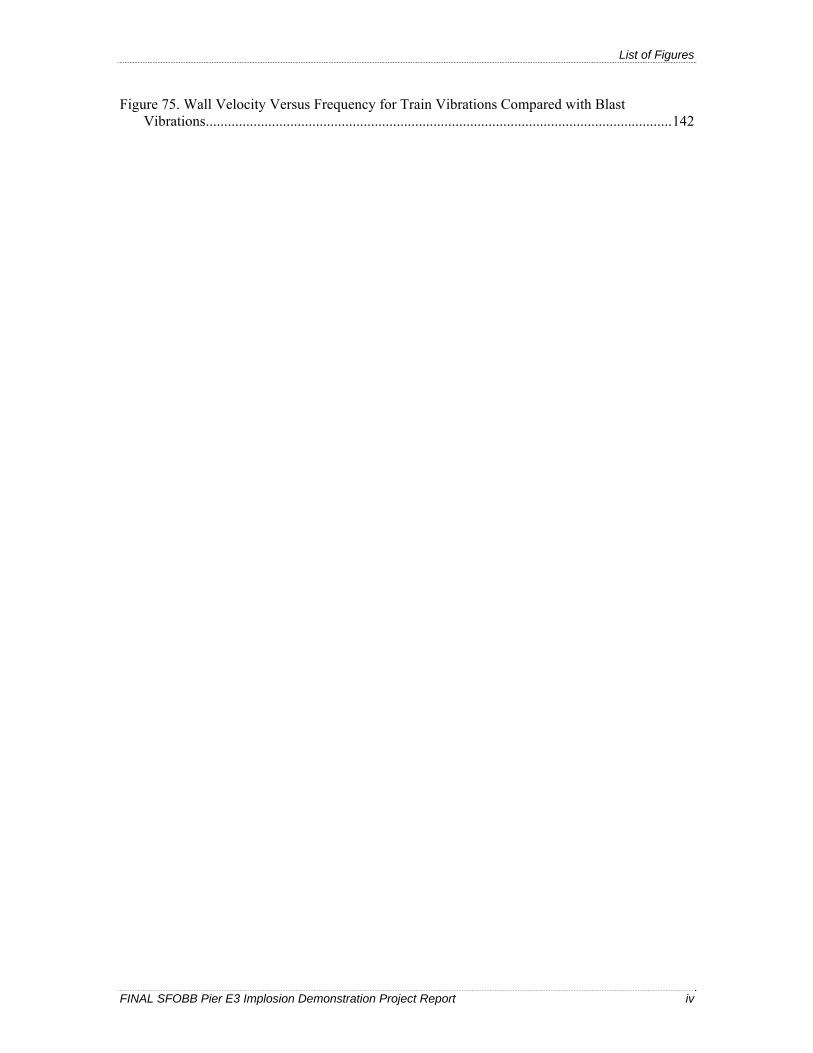
Figure 75. Wall Velocity Versus Frequency for Train Vibrations Compared with Blast Vibrations ............................................................................................................................... 142
List of Tables
FINAL SFOBB Pier E3 Implosion Demonstration Project Report v
List of Tables
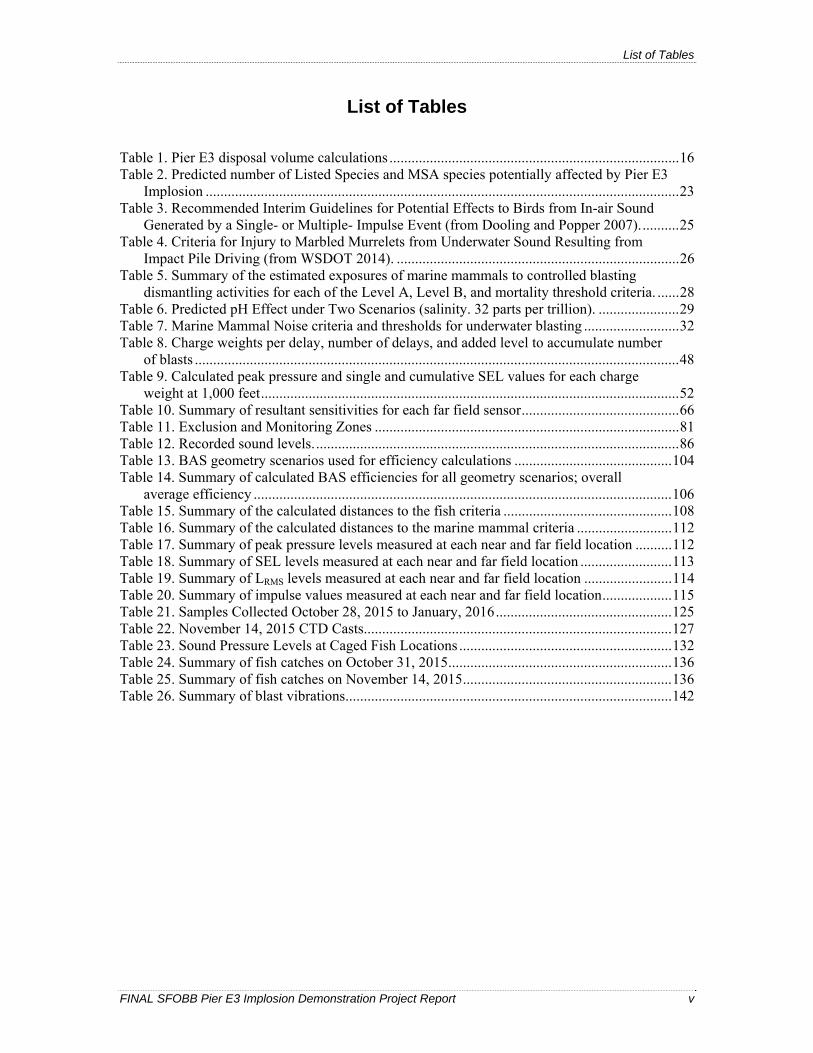
Table 1. Pier E3 disposal volume calculations ............................................................................... 16 Table 2. Predicted number of Listed Species and MSA species potentially affected by Pier E3
Implosion ................................................................................................................................. 23 Table 3. Recommended Interim Guidelines for Potential Effects to Birds from In-air Sound
Generated by a Single- or Multiple- Impulse Event (from Dooling and Popper 2007). .......... 25 Table 4. Criteria for Injury to Marbled Murrelets from Underwater Sound Resulting from
Impact Pile Driving (from WSDOT 2014). ............................................................................. 26 Table 5. Summary of the estimated exposures of marine mammals to controlled blasting
dismantling activities for each of the Level A, Level B, and mortality threshold criteria. ...... 28 Table 6. Predicted pH Effect under Two Scenarios (salinity. 32 parts per trillion). ...................... 29 Table 7. Marine Mammal Noise criteria and thresholds for underwater blasting .......................... 32 Table 8. Charge weights per delay, number of delays, and added level to accumulate number
of blasts .................................................................................................................................... 48 Table 9. Calculated peak pressure and single and cumulative SEL values for each charge
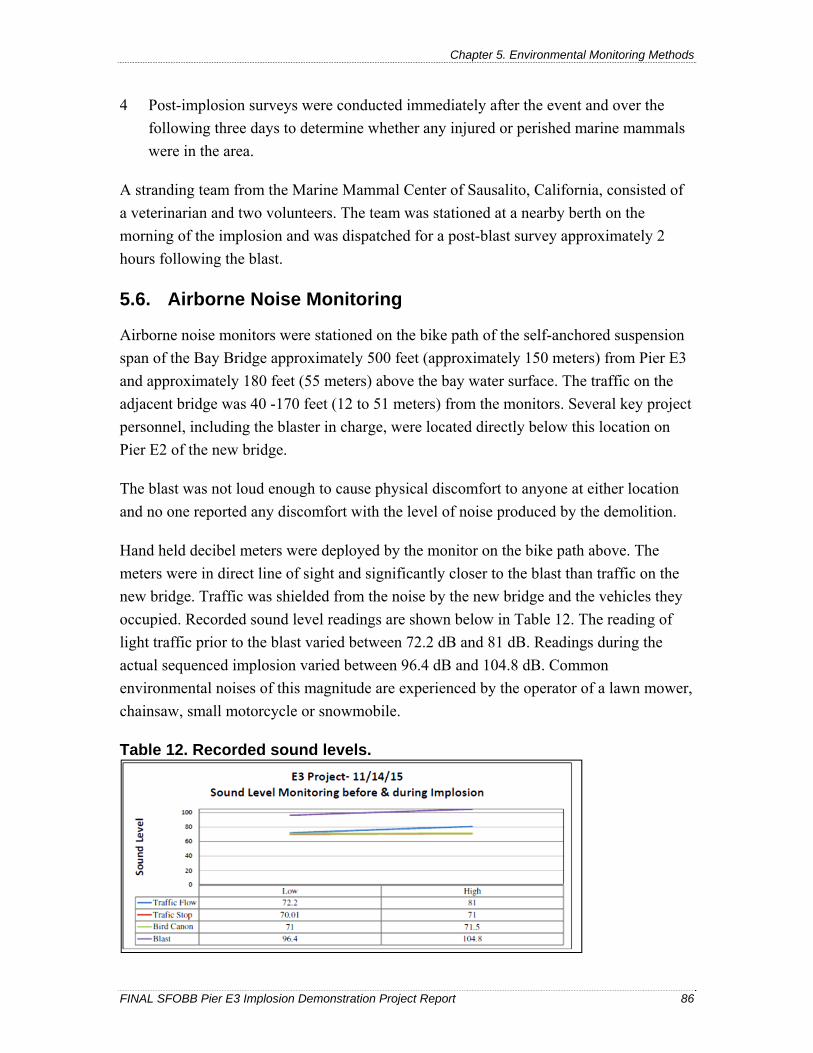
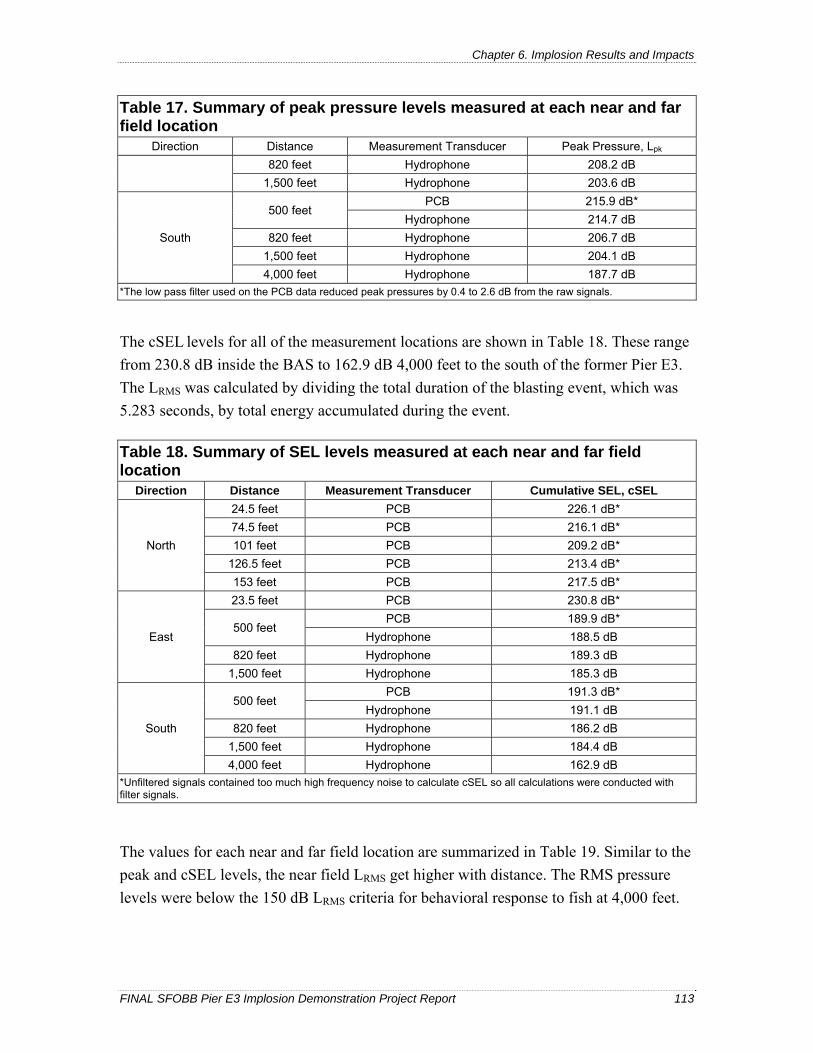
weight at 1,000 feet .................................................................................................................. 52 Table 10. Summary of resultant sensitivities for each far field sensor ........................................... 66 Table 11. Exclusion and Monitoring Zones ................................................................................... 81 Table 12. Recorded sound levels. ................................................................................................... 86 Table 13. BAS geometry scenarios used for efficiency calculations ........................................... 104 Table 14. Summary of calculated BAS efficiencies for all geometry scenarios; overall
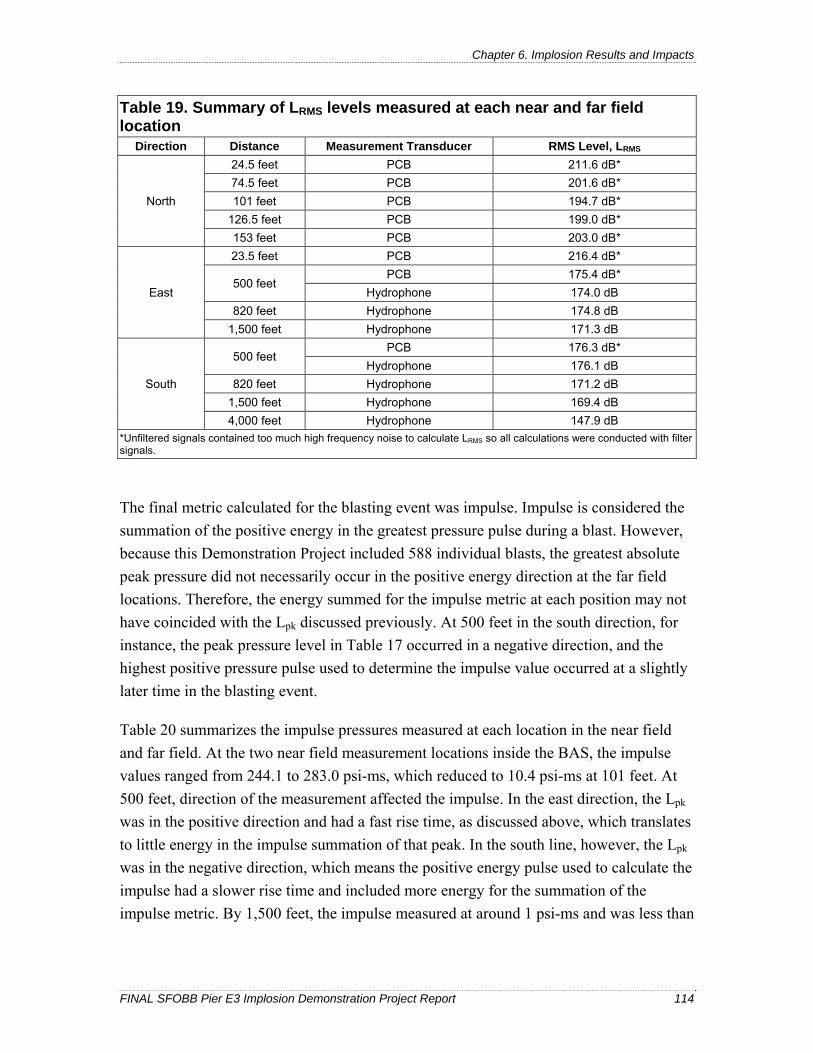
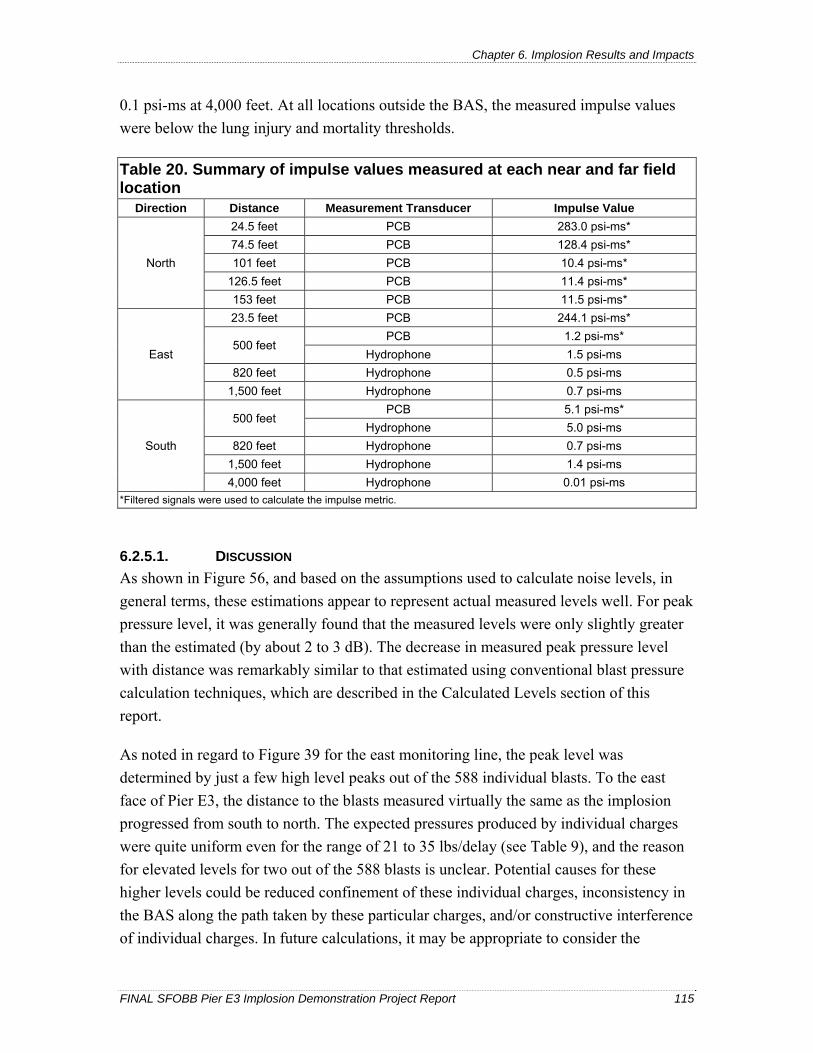
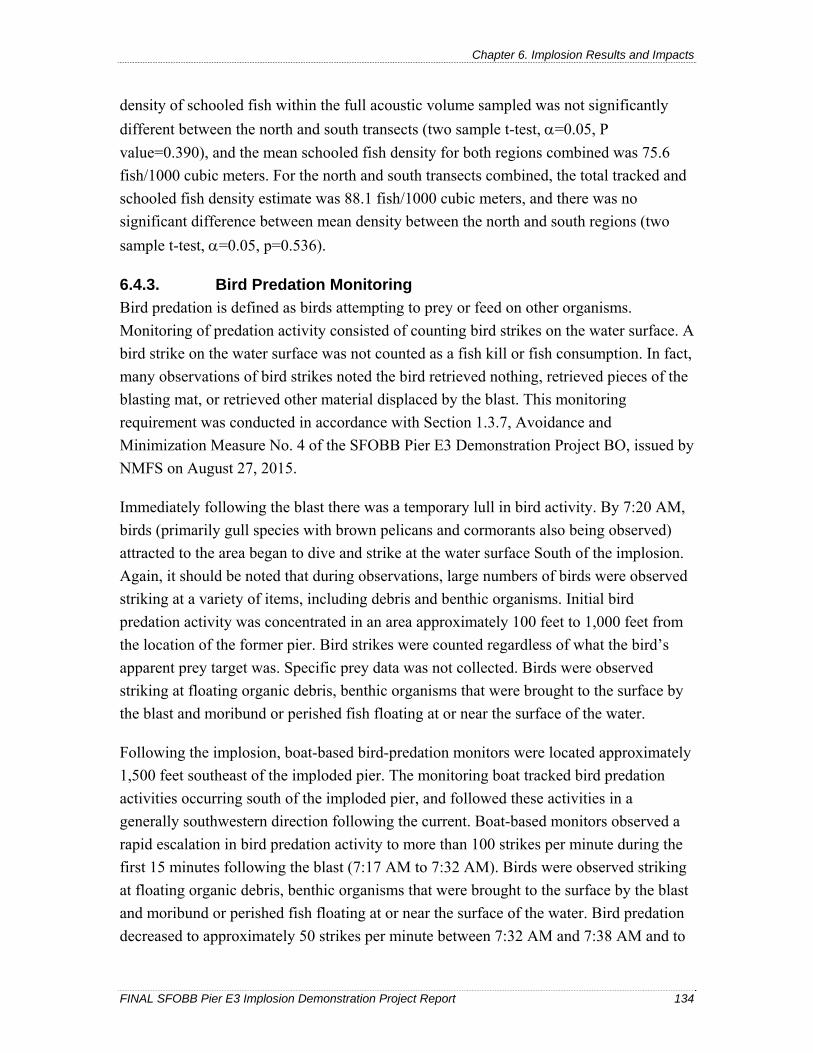
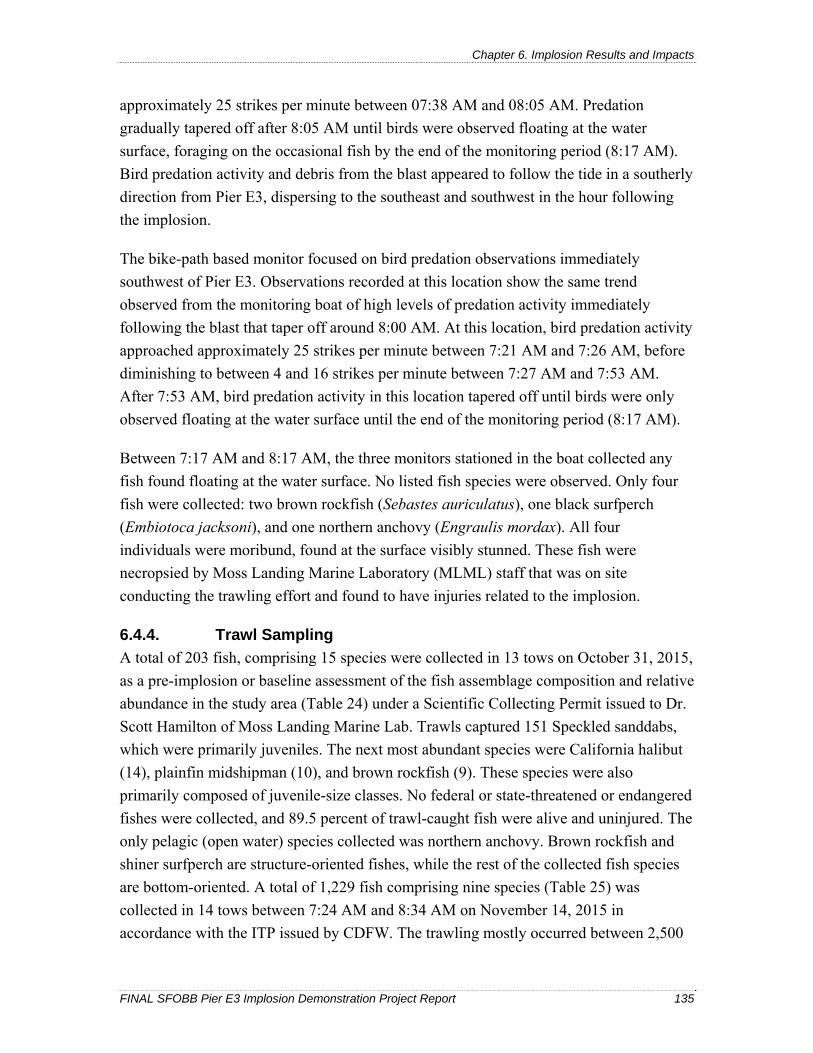
average efficiency .................................................................................................................. 106 Table 15. Summary of the calculated distances to the fish criteria .............................................. 108 Table 16. Summary of the calculated distances to the marine mammal criteria .......................... 112 Table 17. Summary of peak pressure levels measured at each near and far field location .......... 112 Table 18. Summary of SEL levels measured at each near and far field location ......................... 113 Table 19. Summary of LRMS levels measured at each near and far field location ........................ 114 Table 20. Summary of impulse values measured at each near and far field location ................... 115 Table 21. Samples Collected October 28, 2015 to January, 2016 ................................................ 125 Table 22. November 14, 2015 CTD Casts.................................................................................... 127 Table 23. Sound Pressure Levels at Caged Fish Locations .......................................................... 132 Table 24. Summary of fish catches on October 31, 2015 ............................................................. 136 Table 25. Summary of fish catches on November 14, 2015 ......................................................... 136 Table 26. Summary of blast vibrations ......................................................................................... 142
List of Abbreviated Terms
FINAL SFOBB Pier E3 Implosion Demonstration Project Report vi
List of Abbreviated Terms
°F degrees Fahrenheit
μPa microPascal
ADD acoustic deterrent device
AMA Aimone-Martin Associates LLC
BA Biological Assessment
BART Bay Area Rapid Transit
BAS Blast Attenuation System
Bay San Francisco Bay
BMP best management practice
BO Biological Opinion
CDB Contract Drilling & Blasting LLC
CDFW California Department of Fish and Wildlife
CESA California Endangered Species Act
CFGC California Fish and Game Commission
CFIMIS Caged Fish Immediate Mortality and Injury Study (Caged Fish
Study)
CHP California Highway Patrol
CL centerline
cSEL Cumulative Sound Exposure Level
CTD conductivity-temperature-depth
d bubble curtain width
dB decibel(s)
dBA A-weighted decibel(s)
Dcl BAS centerline
Delta Sacramento–San Joaquin Delta
Demonstration Project Demonstration project to remove Pier E3 as part of the San
Francisco–Oakland Bay Bridge East Span Seismic Safety Project
Department California Department of Transportation
DO dissolved oxygen
DPS Distinct Population Segment
EFH Essential Fish Habitat
EIS Environmental Impact Statement
ESA environmentally sensitive area
FEIS Final Environmental Impact Statement
FESA Federal Endangered Species Act
List of Abbreviated Terms
FINAL SFOBB Pier E3 Implosion Demonstration Project Report vii
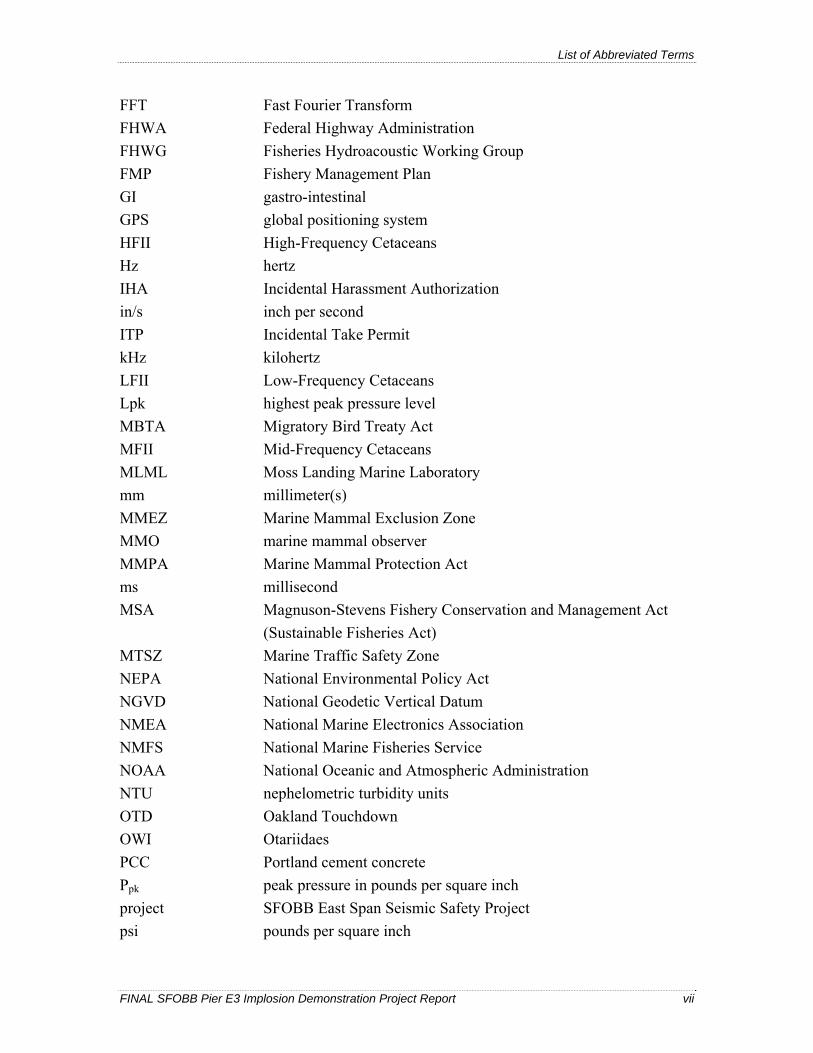
FFT Fast Fourier Transform
FHWA Federal Highway Administration
FHWG Fisheries Hydroacoustic Working Group
FMP Fishery Management Plan
GI gastro-intestinal
GPS global positioning system
HFII High-Frequency Cetaceans
Hz hertz
IHA Incidental Harassment Authorization
in/s inch per second
ITP Incidental Take Permit
kHz kilohertz
LFII Low-Frequency Cetaceans
Lpk highest peak pressure level
MBTA Migratory Bird Treaty Act
MFII Mid-Frequency Cetaceans
MLML Moss Landing Marine Laboratory
mm millimeter(s)
MMEZ Marine Mammal Exclusion Zone
MMO marine mammal observer
MMPA Marine Mammal Protection Act
ms millisecond
MSA Magnuson-Stevens Fishery Conservation and Management Act
(Sustainable Fisheries Act)
MTSZ Marine Traffic Safety Zone
NEPA National Environmental Policy Act
NGVD National Geodetic Vertical Datum
NMEA National Marine Electronics Association
NMFS National Marine Fisheries Service
NOAA National Oceanic and Atmospheric Administration
NTU nephelometric turbidity units
OTD Oakland Touchdown
OWI Otariidaes
PCC Portland cement concrete
Ppk peak pressure in pounds per square inch
project SFOBB East Span Seismic Safety Project
psi pounds per square inch
List of Abbreviated Terms
FINAL SFOBB Pier E3 Implosion Demonstration Project Report viii
psi-ms psi-milliseconds
PTS permanent threshold shift
PWI Phocidaes
RMS Root Mean Square
RTA real-time analyzer
SAP sampling and analysis plan
SEL Sound Exposure Level
SFOBB San Francisco–Oakland Bay Bridge
SMP self-monitoring program
S/s samples per second
TS target strength
TTS temporary threshold-hearing shifts
USACE United States Army Corps of Engineers
USFWS United States Fish and Wildlife Service
V Volt(s)
WQS Water Quality Study
WSDOT Washington Department of Transportation
YBI Yerba Buena Island
Chapter 1. Introduction
FINAL SFOBB Pier E3 Implosion Demonstration Project Report 1
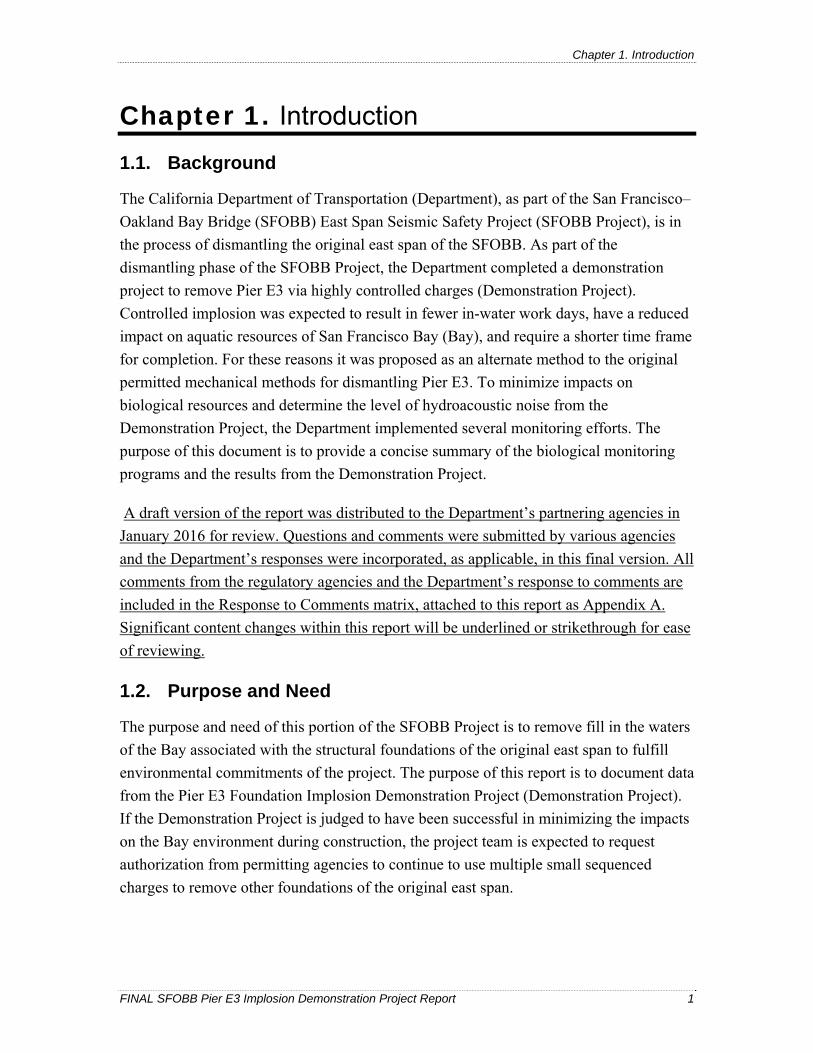
Chapter 1. Introduction
1.1. Background
The California Department of Transportation (Department), as part of the San Francisco–
Oakland Bay Bridge (SFOBB) East Span Seismic Safety Project (SFOBB Project), is in
the process of dismantling the original east span of the SFOBB. As part of the
dismantling phase of the SFOBB Project, the Department completed a demonstration
project to remove Pier E3 via highly controlled charges (Demonstration Project).
Controlled implosion was expected to result in fewer in-water work days, have a reduced
impact on aquatic resources of San Francisco Bay (Bay), and require a shorter time frame
for completion. For these reasons it was proposed as an alternate method to the original
permitted mechanical methods for dismantling Pier E3. To minimize impacts on
biological resources and determine the level of hydroacoustic noise from the
Demonstration Project, the Department implemented several monitoring efforts. The
purpose of this document is to provide a concise summary of the biological monitoring
programs and the results from the Demonstration Project.
A draft version of the report was distributed to the Department’s partnering agencies in
January 2016 for review. Questions and comments were submitted by various agencies
and the Department’s responses were incorporated, as applicable, in this final version. All
comments from the regulatory agencies and the Department’s response to comments are
included in the Response to Comments matrix, attached to this report as Appendix A.
Significant content changes within this report will be underlined or strikethrough for ease
of reviewing.
1.2. Purpose and Need
The purpose and need of this portion of the SFOBB Project is to remove fill in the waters
of the Bay associated with the structural foundations of the original east span to fulfill
environmental commitments of the project. The purpose of this report is to document data
from the Pier E3 Foundation Implosion Demonstration Project (Demonstration Project).
If the Demonstration Project is judged to have been successful in minimizing the impacts
on the Bay environment during construction, the project team is expected to request
authorization from permitting agencies to continue to use multiple small sequenced
charges to remove other foundations of the original east span.
Chapter 1. Introduction
FINAL SFOBB Pier E3 Implosion Demonstration Project Report 2
The need for the removal of the in-water foundations is based on the requirement to
remove those foundations from the waters of the Bay as presented in the project
Environmental Impact Statement (EIS) and project permits, which are fundamentally
based on three factors: risk to marine navigation, environmental values to minimize fill in
the bay and minimize disruption to natural water flow. The need to consider using
sequenced explosives is based on the requirement to minimize impacts on the bay
environment during deconstruction.
Chapter 2. Project Description
FINAL SFOBB Pier E3 Implosion Demonstration Project Report 3
Chapter 2. Project Description
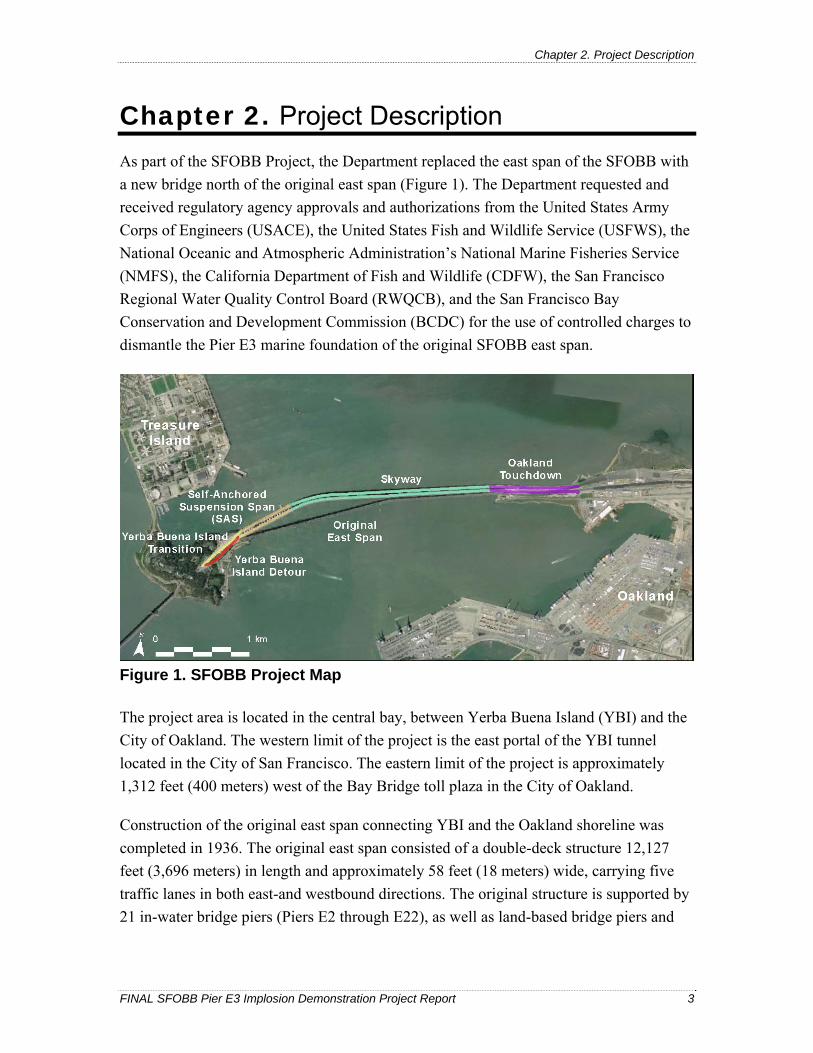
As part of the SFOBB Project, the Department replaced the east span of the SFOBB with
a new bridge north of the original east span (Figure 1). The Department requested and
received regulatory agency approvals and authorizations from the United States Army
Corps of Engineers (USACE), the United States Fish and Wildlife Service (USFWS), the
National Oceanic and Atmospheric Administration’s National Marine Fisheries Service
(NMFS), the California Department of Fish and Wildlife (CDFW), the San Francisco
Regional Water Quality Control Board (RWQCB), and the San Francisco Bay
Conservation and Development Commission (BCDC) for the use of controlled charges to
dismantle the Pier E3 marine foundation of the original SFOBB east span.
Figure 1. SFOBB Project Map
The project area is located in the central bay, between Yerba Buena Island (YBI) and the
City of Oakland. The western limit of the project is the east portal of the YBI tunnel
located in the City of San Francisco. The eastern limit of the project is approximately
1,312 feet (400 meters) west of the Bay Bridge toll plaza in the City of Oakland.
Construction of the original east span connecting YBI and the Oakland shoreline was
completed in 1936. The original east span consisted of a double-deck structure 12,127
feet (3,696 meters) in length and approximately 58 feet (18 meters) wide, carrying five
traffic lanes in both east-and westbound directions. The original structure is supported by
21 in-water bridge piers (Piers E2 through E22), as well as land-based bridge piers and
Chapter 2. Project Description
FINAL SFOBB Pier E3 Implosion Demonstration Project Report 4
bents on both YBI and Oakland. As shown in Figure 2, the original east span is divided
into three major sections.
Figure 2. Elevation View Schematic of the Original SFOBB East Span
2.1. Cantilever Superstructure and YBI Detour
The cantilever section was comprised of three major components: (1) a 508 feet (154.8
meters) long cantilever anchor arm (2) a 512 feet (156 meters) long cantilever section;
and (3) a 1,400 foot (426.7 meter) long main span over the navigation channel consisting
of a suspended segment supported on either side by anchor arms. The superstructure of
this segment included the trusses, road deck and steel support towers.
To complete construction of the new SFOBB east span and tie into the YBI tunnel, a
portion of the original east span between Pier E1 and the YBI tunnel was dismantled in
2009 and replaced with the YBI Detour. The YBI Detour consisted of a double-decked
bypass structure that connects into the original east span at Pier E1 on the east side of
YBI.
2.2. 504-foot and 288-foot (504/288) Spans Superstructure
The 504/288 segment of the bridge is comprised of five 504-foot (153.6 meter) long steel
truss spans and fourteen 288-foot (87.8 meter) long steel truss spans. The vertical
clearance beneath the 504’ spans is approximately 165 feet (50 meters) above mean high
water levels, while the vertical clearance beneath the 288’ spans gradually decrease from
approximately 165 feet (50 meters) to approximately 10 feet (3 meters) as the structure
descends towards the Oakland shoreline. The superstructure of this segment includes the
trusses, road deck and steel and/or concrete support towers.
Chapter 2. Project Description
FINAL SFOBB Pier E3 Implosion Demonstration Project Report 5
2.3. Marine Foundations
The in-water or marine foundations vary in type. Pier E2 is a cellular spread footing
while Piers E3 through E5 consist of concrete caissons. Piers E6 through E22 consist of
lightly reinforced concrete foundations that are supported by timber piles.
2.4. Dismantling of the SFOBB Original East Span
Dismantling of the SFOBB original east span began in late 2013. The dismantling was
divided into multiple contracts corresponding to the different sections of the original east
span (Figure 3). These contracts include:
Demolition of the YBI Detour and Cantilever Structures (Yerba Buena Island
Figure 3. Sections of the Original SFOBB East Span
The first of the above-mentioned contracts, the YBITS 2 dismantling contract, started in
late 2013 and includes the dismantling of the YBI Detour and Cantilever Structures. The
second contract, the 504/288 dismantling contract, began work in mid-2015 and includes
removing the superstructure and tower legs. Lastly, the marine foundation contract to
remove Pier E3 was executed in April 2015. As the first marine foundation available for
dismantling and the largest, Pier E3 was selected to demonstrate the effective use of
controlled charges in-water to remove the marine foundations.
Chapter 2. Project Description
FINAL SFOBB Pier E3 Implosion Demonstration Project Report 6
The original regulatory agency authorizations for the project covered the dismantling of
the original east span via mechanical methods. In 2012, the Department amended the
project’s existing permits and received authorizations to build temporary trestles and
falsework to facilitate the dismantling of the original east span. These approvals did not
include the use of controlled implosion. For this reason, the Department sought approval
for the use of controlled charges to dismantle the Pier E3 marine foundation.
2.5. FEIS Project Description Update and FEIS Re-Validation
To address potential impacts on environmental resources during bridge construction and
dismantling, the Department and the Federal Highway Administration (FHWA)
completed the SFOBB Project Final Environmental Impact Statement (FEIS), in May
2001, pursuant to the National Environmental Policy Act (NEPA). In the same year, the
Department also obtained approvals from regulatory agencies for all activities associated
with both the construction of the new east span and the dismantling of the original east
span. Mechanical dismantling methods and dismantling dredging were included in the
FEIS and agency approvals. In addition, the FEIS and certain agency approvals contain
language approving the disposal of all inert, non-toxic, and non-hazardous dismantling
debris of the original bridge in the hollow pier footings.
To remove the marine foundations in an expedient manner with less environmental
impact, the Department updated the original project description dismantling methods to
include the use of controlled charges to remove the Pier E3 marine foundation. Based on
the proposed modifications to the project description, the Department conducted a re-
evaluation of the FEIS. The Department prepared a number of technical documents and
based on these documents, the re-evaluation concluded that the use of controlled charges
to remove the pier foundation would not result in new significant environmental impacts.
2.6. Pier E3 Site Location and Description
Pier E3 was located on the alignment of the original east span, 1,535 feet (468 meters)
east of YBI near the coordinates 37048’56.75”N 122021’14.75”W, in San Francisco
County (Figure 4). Pier E3 was located in an approximately 50-foot (15 meters) deep area
of the Bay and flanked the east side of a deeper shipping channel.
The Pier E3 caisson was a cellular concrete structure approximately 268 feet (82 meters)
tall containing 28 total chambers. Of these, there were 24 rectangular chambers and 4
irregular shaped chambers. Fourteen of the chambers occurred only below an elevation of
approximately -51 feet (referenced to the 1929 National Geodetic Vertical Datum
Chapter 2. Project Description
FINAL SFOBB Pier E3 Implosion Demonstration Project Report 7
Note: Figure shows a schematic of the east span of the SFOBB showing the cantilever truss span and the former location of Pier E3 (circled) relative to other piers on the bridge.
Figure 4. Schematic of the East Span of the SFOBB
[NGVD 29]). These lower chambers were found in two separate rows of seven chambers
on each length side of the structure. The four irregular shaped chambers occurred at the
terminal ends of these lower chamber rows. Fourteen of the chambers ran lengthwise in
two adjacent rows of seven through the middle of the structure and extend above the
mudline to support the pier cap and concrete pedestals. The structure had 12 angled
buttress walls that were approximately 51 feet (15.5 meters) tall. Six buttress walls were
on each of the two lengthwise faces of the upper portion of the pier between -51 feet and
0 feet and were completely submerged at most times. All buttress walls were
perpendicular to the structure. The hypotenuse side of each buttress wall ran at an angle
from the outer top of the lower walls and terminated at the face of the structure
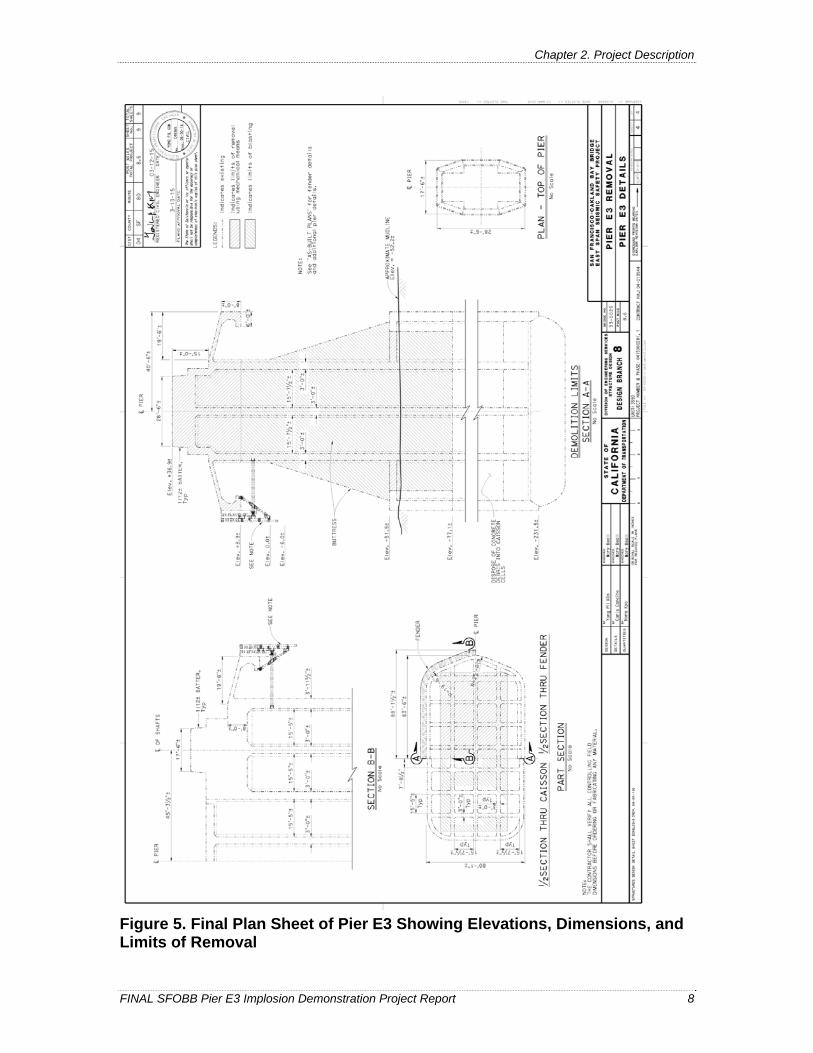
(Figure 5). Weep holes in the foundation located at an approximate elevation of -5 feet
allowed these chambers to fill with water. The water line inside the caisson varied with
the tide, but +1.5 feet was the most common elevation measured in a Department
sampling study of the caisson cell water before dismantling. Its cutting edge (deepest part
of the caisson) remains at -231 feet (Figure 5). Approximately 175 feet (53 meters) of the
structure’s height remains buried in bay mud. The Pier E3 caisson does not reach
bedrock.
Chapter 2. Project Description
FINAL SFOBB Pier E3 Implosion Demonstration Project Report 8
Figure 5. Final Plan Sheet of Pier E3 Showing Elevations, Dimensions, and Limits of Removal
Chapter 2. Project Description
FINAL SFOBB Pier E3 Implosion Demonstration Project Report 9
Top dimensions of the pier cap were 40 feet (12.2 meters) by 134.5 feet (41 meters), not
including the fender apron (Figure 5). Exterior walls along the perimeter of the caisson
were 4 feet (1.2 meters) wide, while the interior walls comprising the rectangular
chambers were 3 feet (1 meter) in width. The scoured mudline (i.e., the Bay floor) around
Pier E3 ranges in elevation from -43 to -51 feet. The pier cap, fender system and upper
most portions extended above the water line to support the steel superstructure of the
cantilever section and were visible from the Bay (Figure 6).
Note: View showing the wood structure and concrete apron of the fender system. The pier cap including the concrete pedestals are visible below the netted tower legs.
Figure 6. View of Pier E3 Facing Northwest
2.7. Pier E3 Demonstration Project Overview
On November 14, 2015, the Department removed Pier E3 by use of controlled charges
and imploded the pier into its open cellular chambers below mudline. A Blast Attenuation
System (BAS) was used to minimize impacts on biological resources in the Bay. The
Department’s goal was to achieve a safe and efficient method for removing submerged
foundations while avoiding and minimizing impacts on environmental resources in the
Bay.
Chapter 2. Project Description
FINAL SFOBB Pier E3 Implosion Demonstration Project Report 10
The Demonstration Project resulted in reduced environmental impacts as compared to
permitted conventional dismantling methods which would require large cofferdams with
extensive amounts of associated pile driving, and dewatering. The use of controlled
charges has greatly reduced in-water work periods and shortened the overall duration of
marine foundation removal for Pier E3.
2.7.1. Dismantling of Pier E3 Overview
Dismantling of Pier E3 took place in 4 phases:
Dismantling of pier cap and fender system
Drilling of bore holes into caisson and buttress walls and installing the BAS
Installing charges, activating the BAS and imploding the pier
Management and removal of remaining dismantling debris
Dismantling of Pier E3 commenced in June of 2015, following the removal of the
cantilever truss section and steel support tower that are part of the YBITS 2 dismantling
contract. The basic steps involved were mechanically removing the timber and steel
supported fender system that surrounded Pier E3, dismantling the concrete pier cap by
mechanical means to an elevation of +9 feet, and drilling vertical boreholes where
controlled charges were loaded for the controlled implosion per a project-specific blast
plan (Blast Plan). Charges were loaded into the drilled boreholes as defined in the Blast
Plan. Controlled implosion was then accomplished using hundreds of small charges with
delays between individual charges. The entire detonation sequence of controlled
implosion lasted approximately 5.3 seconds and removed nearly all of the pier to, or
below, the current surrounding low scour elevation of -51 feet. The Blast Plan is include
in Appendix Y.
2.7.2. Dismantling of Pier E3 Cap and Fender System
Dismantling of the Pier E3 cap started in June 2015. Support barges were used to move
hydraulic excavators (equipped with hoe rams and shearing attachments and other
equipment needed for dismantling), cutting lances and torches to Pier E3. A barge-
mounted crane was used to move equipment onto and off of Pier E3. The fender system,
including timber, metal framing, and concrete apron, was removed and disposed of off-
site. The concrete pedestals, pier cap, and fender system were removed mechanically.
Support platforms were installed to provide a working surface for the excavators to
dismantle the upper portion of Pier E3. A debris containment system was in place to deter
concrete debris from discharging into the Bay during dismantling operations. All concrete
rubble from the mechanical dismantling was placed into exposed cells of the caisson and
Chapter 2. Project Description
FINAL SFOBB Pier E3 Implosion Demonstration Project Report 11
fell below mudline for disposal. The Department monitored for nesting birds, marine
mammals, and water quality during mechanical dismantling and employed best
management practices (BMPs) to prevent discharges into the Bay.
2.7.3. Drill Boreholes, Install BAS, and Controlled Implosion
After the pier was dismantled to the mechanical dismantling elevation, access platforms
were installed to support the drilling equipment while exposing the top of the interior
cells and outside walls (Figure 7). An overhanging template system was installed to guide
the drill below the waterline. Divers were required to cut notches into the buttress walls
to guide the drilling of underwater boreholes. A concrete drill rig drilled holes consistent
with the Blast Plan.
Note: This plan view shows installed platforms over all inner cells to support drilling equipment and installed overhang template system to facilitate drilling activities below the waterline.
Figure 7. Pier E3 Drilling Template Schematic
2.7.4. Controlled Implosion of Remaining Pier
The controlled implosion event took place on November 14, 2015, at 7:17 AM. Prior to
the event, the bore holes in Pier E3 were loaded with controlled charges, as described in
the Blast Plan. Individual cartridge charges, versus pump-able liquid blasting agents,
were chosen to provide greater control and accuracy in estimating the individual and total
charge weights.
Chapter 2. Project Description
FINAL SFOBB Pier E3 Implosion Demonstration Project Report 12
Boreholes varied in diameter and depth and were designed to provide optimal efficiency
in transferring the energy created by the controlled charges to dismantle the pier.
Individual charge weights ranged from 21 to 35 pounds and total charge weight was 16,
875 pounds. Charges were arranged in different levels (decks) and separated in the
boreholes by stemming. Stemming is the insertion of inert materials, such as sand or
gravel, to insulate and retain charges in an enclosed space. Stemming allows for more
efficient transfer of energy into the structural concrete for fracture, and further reduces
the release of potential energy into the adjacent water column. The total number of
charges and delays, and total shot time are provided in the Blast Plan.
Public safety measures were implemented during the controlled implosion event. Safety
zones were established and enforced in conjunction with the California Highway Patrol
(CHP) and CDFW to exclude marine traffic not directly involved in the implosion. Safety
procedures, including a rolling traffic stop in both directions on the new east span of the
SFOBB in advance of detonation, were implemented successfully.
2.7.5. Debris Removal and Site Restoration
Following the controlled implosion event and confirmation that the area was safe to work
in, construction crews removed all associated equipment including barges, compressors,
BAS, and blast mats. The greater majority of the Pier was successfully removed to the
proposed removal limits. A small portion, including approximately 6 of the low corners
of the buttress walls, remained approximately 3 to 6 feet above the -51 feet removal limit.
These areas were removed mechanically.
Rubble resulting from the controlled implosion dismantling consisted of concrete and
rebar. Most rubble fell within the caisson cells below mudline. Approximately 2,200
cubic yards (13 percent of the total rubble, including the removal of the pier cap) of
rubble mounded on top of the caisson, or fell onto the bay floor next to the caisson.
Rubble that did not fall into caisson cells was picked up and entombed within the caisson
cells below mudline. Management of extraneous rubble was done by a barge-mounted
crane with a clamming bucket. Buckets used during this debris management phase were
equipped with a GPS unit to accurately guide the location of the bucket in the water. The
clamming and in-water site management operation was completed on December 11,
2015.
2.8. Geotechnical
Geologic conditions are very poor from a structural and geotechnical perspective along
the entire bridge between piers E3 and E22. The bay floor soil at the piers consists of
Chapter 2. Project Description
FINAL SFOBB Pier E3 Implosion Demonstration Project Report 13
young bay mud and is extremely soft and weak. This condition is the major reason the
foundations of the new bridge extending down 300 feet. This is relevant to the foundation
removal work because the poor soil conditions would require long, large and many piles
for both strength and stability for any structure such as cofferdams constructed along the
alignment. Figure 8 shows the subsurface soil conditions along the original bridge
alignment.
Chapter 2. Project Description
FINAL SFOBB Pier E3 Implosion Demonstration Project Report 14
Figure 8. Soil Profile along the Alignment of the Original Bay Bridge East Spans
Chapter 3. Environmental Setting
FINAL SFOBB Pier E3 Implosion Demonstration Project Report 15
Chapter 3. Environmental Setting
3.1. Physical Conditions
3.1.1. Climate and Topography
The San Francisco Bay is the largest estuary along the western coast of the United States
and is characterized by a Mediterranean climate. Generally, the climate is defined as
having a dry season in the summer and fall followed by a wet winter. However, a variety
of features ranging from coastal mountain ranges, inland valleys, and smaller bays within
the larger Bay create unique local climates. Coastal areas are typically cooler than inland
areas, and northern portions of the Bay generally receive more rainfall than southern
areas. Average high temperature in San Francisco is 63.7 degrees Fahrenheit (°F), and
average low temperature is 51.1°F.
3.1.2. Hydrology
The project area is located within the San Francisco Bay hydrological region. Fresh water
from the Sacramento and San Joaquin Rivers enter the Bay at the Sacramento–San
Joaquin Delta (Delta) before being carried into the Pacific Ocean through other portions
of the Bay. Outflow from these rivers varies seasonally with rainfall and with releases of
managed reservoirs and diversions located upstream.
Generally, freshwater outflow into the Delta (and into the Bay) is greatest during the
spring and lowest in the late summer and fall. Furthermore, this interaction between
freshwater outflow from the Delta and tidal conditions influence the salinity gradient in
the larger Bay. In turn, numerous fish and wildlife species change their spatial
distribution in the Bay in response to changes in this salinity gradient.
The project area is located in what is generally considered the Central Bay. The Central
Bay is the deepest basin, is most influenced by the ocean, and has the saltiest water (on
average) in the Bay. The deepest point is over 100 meters deep near the Golden Gate
Bridge. The Central Bay has the most marine species in the Bay and likely the highest
species diversity. Silting in of Remaining Pier E3 Structure
The remaining caisson cells below mudline are expected to silt in after the removal of the
Pier E3. The Pier E3 site is located east of YBI in the Central Bay portion of the Bay in a
deep-water area, approximately 40 to 55 feet (12 to 16.75 meters) deep, flanking the east
edge of a deeper channel that runs generally north-south. The sandy sediments in this
portion of the Bay are understood to be sourced from shoreline sediments from outside
Chapter 3. Environmental Setting
FINAL SFOBB Pier E3 Implosion Demonstration Project Report 16
the Bay, or from the Sierras via San Pablo Bay. Sediments in the Central Bay are
estimated to be up to 100 meters thick. The deep channel area around Pier E3 is also
subject to strong tidal currents of up to two knots. The Department estimates that the area
to be filled in with sediment after completion of the Demonstration Project is
approximately 22,190 cubic yards (16,965 cubic meters) (Table 1). Now that the majority
of the sediment loads introduced by hydraulic mining and during the 19th century
California gold rush and agricultural practices of that era have flushed through
watersheds and the Bay, current trends show a reduced annual sediment input into the
Bay. However sediment input still remains on the order of over 5 billion pounds (2.3
million metric tons) annually (Bernard et al. 2013; BCDC 2014). Given this large annual
input, the relatively small volume of the pier area, the known strong tidal action and
sediments already present in the Bay, the Department believes the silting in of the Pier E3
caisson will have less than a minimal impact on sediment transport in the Bay.
Furthermore, the Department believes that given the relatively small area being exposed
for silting in, the Pier E3 caisson remaining below mudline will likely fill within a few
Total Volume Available in Caisson Cells 38,295 29,280 Total Volume of Concrete to be Disposed In-situ
10,065 7,695
Total Volume of Concrete to be Disposed In-situ with 1.6 Bulking Factor*
16,105 12,310
Surplus Capacity to be Silted In 22,190 16,965 *To account for the volume expansion of concrete material after it has been pulverized, a standard estimated 1.6 bulking factor is applied to the total volume of source concrete volume.
The Department asserts that the measures proposed will fulfill current permit
requirements for the removal of permanent fill in the Bay by dismantling Pier E3 to the
low scour line and allow for opportunity to work with its resource agency partners to
satisfy the needs of the Bay.
3.1.3. Substrate/Sediments
Most of the Bay within the vicinity of Pier E3 is comprised of small, soft particles that
can be moved by tidal currents. Sediments range in size from clay (0.001 to 0.0039
millimeter [mm]) to silt (0.0039 to 0.0625 mm) to sand (0.0625 to 2 mm). Larger
particles, including gravel (2 to 64 mm) and cobble (64 to 256 mm) also can be found in
soft bottomed habitats. Sand deposits can be found through the deeper parts of the
Central Bay and the main channel through San Pablo Bay. Strong tidal currents along the
Chapter 3. Environmental Setting
FINAL SFOBB Pier E3 Implosion Demonstration Project Report 17
Bay floor make it a dynamic environment, with significant alteration and movement of
sediments over time.
3.2. Biological Conditions
3.2.1. Background
The open water environment around YBI and Treasure Island is almost entirely marine in
composition because of a lack of significant freshwater flow. Numerous fish and marine
mammals are known to occupy the Bay and are likely to occur, at some point in their life
cycle, around Pier E3. In addition, many bird species are known to forage and nest
throughout the original east span of the SFOBB, including on and around Pier E3.
3.2.2. Environmentally Sensitive Areas
The marine environment around Pier E3 consists of largely open water habitat along with
subtidal and intertidal habitats closer to YBI and Treasure Island. Within intertidal zones,
eelgrass (Zostera marina) beds occur along the northeast and east sides of Treasure
Island and within Clipper Cove, adjacent to the northeast shore of YBI. In addition,
historical records from 1999 and 2005 exist for eelgrass beds immediately off the
southeastern shores of YBI. Eelgrass can also occupy the subtidal zone. Eelgrass is
designated as an environmentally sensitive area (ESA) and is protected from
encroachment from construction activities related to the implosion activities and the
regular project activities.
Eelgrass meadows occur in shallow, saline regions of San Francisco Bay estuary (Figure
9). The major ecological roles of eelgrass include clearing water, trapping and stabilizing
sediment, cycling nutrients, oxygenating water, and is a major base of a food web for
invertebrates, fishes, and birds (Kitting 1994). This eelgrass food web can also extend to
marine mammals. Eelgrass provides valuable shelter with concentrated food for juvenile
and other small marine animals and as nursery areas for larger species including diverse
economically valuable fisheries.
To protect and demarcate these ESAs, the Department installed buoys along their outer
boundaries. To protect eelgrass beds during the Demonstration Project, all project-related
equipment (e.g., barges, cranes, piles, BAS) were placed and/or staged outside the
eelgrass ESA buoys. Extensive water quality monitoring was conducted before, during
and after the implosion activities to assess impacts on the eelgrass beds as a result of the
implosion. The monitoring methods and results related to water quality are included in
subsequent sections of this report.
Chapter 3. Environmental Setting
FINAL SFOBB Pier E3 Implosion Demonstration Project Report 18
Note: Photo taken during post-blast eelgrass distribution survey, at Emeryville Flats near Oakland Touchdown, November 23, 2015. Source: Alluvion Biological Consulting (Caltrans 2015a)
Figure 9. View of an Eelgrass Bed
3.2.3. Federally/State Listed or Other Animal Species of Concern 3.2.3.1. FISH
Four federally and state listed fish species and their critical habitat are known to occur in
the project vicinity. These species include Chinook salmon (Oncorhynchus tshawytscha),
steelhead (Oncorhynchus mykiss), longfin smelt (Spirinchus thaleichthys) and green
sturgeon (Acipenser medirostris).
The Sacramento winter-run Chinook salmon is listed as endangered and the Central
Valley spring-run Chinook salmon is listed as threatened under both the Federal
Endangered Species Act (FESA) and California Endangered Species Act (CESA).
Central Valley fall/late fall-run Chinook salmon is not listed. All Chinook salmon also
are protected under the MSA. In addition, portions of the project area occur within EFH
for several species managed under the MSA. The Central California Coast and Central
Valley DPS of steelhead are listed as threatened under the FESA. The southern DPS of
green sturgeon (Acipenser medirostris) was listed as federally threatened on April 6,
2006, by NMFS. This DPS of green sturgeon consists of all coastal and Central Valley
populations south of the Eel River, with the only known spawning population in the
Sacramento River (Federal Register 62:43937-43954). On October 9, 2009September 5,
2008, NMFS issued a proposal that would designated final critical habitat for green
Chapter 3. Environmental Setting
FINAL SFOBB Pier E3 Implosion Demonstration Project Report 19
sturgeon (50 CFR Part 226, Federal Register, Vol. 74, No. 195). Designated critical
habitat for this species includes the Bay Estuary. Longfin smelt are listed as threatened
under the CESA and a managed species under the MSA (Caltrans 2015b).
3.2.3.2. BIRDS
The following protected bird species of concern are known to occur in the project area:
American Peregrine Falcon (Falco peregrinus anatum). Two pairs of peregrine falcons
nest and roost on the SFOBB. One pair nests on the West Span and one pair on the East
Span. Courtship behavior and other nesting activities can begin as early as December for
these pairs. Eggs are usually laid in early March, and the young generally fledge in the
third week of May. This species has been removed from federal listing, but is still
protected by the Migratory Bird Treaty Act (MBTA) and the CESA.
Double-crested Cormorant (Phalacrocorax auritus). This species breeds in dense
colonies that can be found on rocky coasts and offshore islands, as well as on inland lakes
and rivers. Cormorants have the ability to nest at any time during the breeding season if
the first nesting attempt is unsuccessful. Therefore, nests may be active any time between
March and September. Double-crested cormorants have nested on the East Span of the
SFOBB since 1984. The colony of double-crested cormorants includes 400 to 600 nesting
pairs and represents the second-largest colony in Northern California. The highest
concentrations of nesting pairs occur between Columns E5 and E15. The double-crested
cormorant is designated as a species of special concern under the CESA.
California Brown Pelican (Pelecanus occidentalis californicus). The California brown
pelican is known to rest on bridge footings and forage in the project area. No known nest
sites occur in the project area. The California brown pelican is listed as endangered under
both the State and Federal Endangered Species Acts.
Western Gull (Larus occidentalis). The western gull is protected under the Migratory
Bird Treaty Act. Western gulls nest on the column footings of the SFOBB West Span and
have the potential to nest on the footings of the East Span.
California Least Tern (Sterna antillarum browni). The California least tern nests in
colonies on bare or sparsely vegetated areas near the coast. This species is found in the
Bay Area during the breeding season from May through August. Nesting habitat which
supports the California least tern does not occur within the study area. The California
least tern is designated as an endangered species under both the State and Federal
Endangered Species Acts.
Chapter 3. Environmental Setting
FINAL SFOBB Pier E3 Implosion Demonstration Project Report 20
3.2.3.3. MARINE MAMMALS
The following marine mammal species of concern are known to occur in the project area,
though several are not common during the winter months:
Harbor Seal (Phoca vitulina). Harbor seals are protected from harassment under the
federal Marine Mammal Protection Act (MMPA), as amended. Foraging sites are
generally close to shore where medium-sized fish in addition to bivalves, crab, octopus,
herring, and squid are taken as prey. Harbor seals use the south side of YBI as a haul-out
site year-round. This site is located approximately 305 meters (1,000 feet) from the
nearest construction limit boundary.
California Sea Lion (Zalophus californianus). Like the harbor seal, the California sea
lion is protected by the Federal Marine Mammal Protection Act. While little information
is available on the foraging patterns of California sea lions in the Bay, individual sea
lions have been observed on a fairly regular basis in the shipping channel to the south of
YBI. Individuals have also been sighted in the waters east of YBI. Pier 39 in San
Francisco, about 4 miles (6 kilometers) from the project area, has become a haul-out site
for sea lions. Most of the sea lions hauled out at this site are males and no pupping has
been observed.
Northern Elephant Seal (Mirounga angustirostris). The northern elephant seal is
protected under the MMPA, but it is not listed as a strategic or depleted species under the
MMPA (Carretta et al. 2013), or listed as endangered or threatened under the FESA. The
population size for the California breeding stock is estimated at 124,000 to 179,000 seals
and is increasing (Lowry et al. 2010; Carretta et al. 2012). The elephant seal is not
commonly seen in the Bay during the colder months.
Harbor Porpoise (Phocoena phocoena). The harbor porpoise is protected under the
MMPA and is not considered a depleted or strategic stock under the MMPA (Carretta et
al. 2012). Harbor porpoises are not listed as threatened or endangered under the
Endangered Species Act. Census data suggest a stable population trend and the latest
NMFS stock estimate for the San Francisco-Russian River stock is 9,189 porpoises.
Harbor porpoise are not common in the area, however, an increasing trend of sightings
has been observed over the last decade.
Chapter 4. Anticipated Impacts
FINAL SFOBB Pier E3 Implosion Demonstration Project Report 21
Chapter 4. Anticipated Impacts
4.1. Biological Resources
4.1.1. Fish
The Department submitted a Biological Assessment (BA) to NMFS to provide technical
information about the proposed Demonstration Project and described potential effects to
threatened, endangered, or proposed threatened or endangered species and their habitats
on February 17, 2015. The BA was prepared in accordance with Section 7(a)(2) of the
FESA (16 U.S.C. 1536[c]). The Department requested that NMFS re-open consultation
and issue the Department a supplemental Biological Opinion (BO) and incidental take
statement for potential impacts incidental to the Demonstration Project on NMFS-listed
fisheries (Sacramento River winter-run Chinook salmon [endangered], Sacramento River
spring-run Chinook salmon [threatened], , Central Valley steelhead DPS [threatened],
Central California Coast steelhead DPS [threatened], Southern DPS of green sturgeon
[threatened]), and critical habitat associated with NMFS-listed fisheries.
The BA also provided an analysis of potential adverse effects to Essential Fish Habitat
(EFH)take under the MSA, managed fisheries, and associated EFH. Eelgrass beds are
classified as EFH. The entire Bay is classified as EFH for species managed under the
Pacific Coast Salmon Fishery Management Plan (FMP; Coho and Chinook salmon) and
also for species managed under the Coastal Pelagic Species FMP and Pacific Coast
Groundfish FMP (Pacific Fishery Management Council 1998; 2005). Pelagic species that
are not federally-listed but managed under the MSA include Pacific sardine, Northern
anchovy, Pacific herring, jacksmelt, and English sole (Parophrys vetulus).
NMFS-jurisdictional fisheries include Endangered Species Act-listed species and MSA
managed species. A summary of potential affects to NMFS-jurisdictional fisheries,
associated critical habitat, and EFH is provided below.
Based on analysis of the proposed Demonstration Project, NMFS the Department
determined that the proposed project would have no effect on Coho salmon, may
affect, but not likely to adversely affect Chinook salmon, or steelhead. NMFS The
Department concluded determined that the proposed project would not jeopardize
the continued existence of these species. Installation of a BAS and timing the
implosion when these species are not present in the action area were proposed as
methods by which to minimize avoid take to these species.
Chapter 4. Anticipated Impacts
FINAL SFOBB Pier E3 Implosion Demonstration Project Report 22
NMFS determined the The proposed project had the potential to was likely to affect,
but not adversely affect, green sturgeon. Installation of a BAS and timing the
implosion when adults and sub-adults of this species are not present in the area were
proposed as methods by which to minimize avoid take to these species. Juvenile
green sturgeon, however, can occur anywhere in the Bay at any time of year.
Although no data was available to inform this potential impact, the current
understanding was that the potential for impact on juvenile green sturgeon was very
low.
The proposed project was expected to result in temporary impacts on critical habitat
for Chinook salmon, steelhead, and green sturgeon through water quality impacts
and high-intensity sound associated with the 4 to 6 second implosion. Temporary
impacts on salmonid critical habitat were anticipated at the following totals:
469.80 acres (190 hectares) for Central CA Coast steelhead and green sturgeon
229.74 acres (93 hectares) for Central Valley steelhead and Chinook salmon
On June 12, 2008, the Fisheries Hydroacoustic Working Group (FHWG), whose
members include NMFS’s Southwest and Northwest Divisions, California, Washington,
and Oregon Departments of Transportation, USFWS, CDFW, and FHWA issued an
agreement for the establishment of interim threshold criteria to determine the effects of
high-intensity sound on fish. These criteria were established after extensive review of the
most recent analysis of the effect of underwater noise on fish from pile driving in water.
The agreed-on threshold for the onset of injury to fish from sound pressure criteria for
noise to have an injury effect on fish has been set at 206 decibel (dB) peak, 187 dB
cumulative accumulated Sound Exposure Level (cSEL) for fish over 2 grams, and 183 dB
cSEL for fish less than 2 grams (FHWG 2008). The FHWG has determined that sound
pressure levels noise at or above these levels can cause injury to damage to auditory
tissues and temporary threshold-hearing shifts (TTS) in fish. In addition, a threshold of
150 dB Root Mean Square (RMS) was established as the level that elicits a behavioral
response, but no injury, in fish. A summary of effects to listed species and MSA managed
fisheries is provided in Table 2 below.
Chapter 4. Anticipated Impacts
FINAL SFOBB Pier E3 Implosion Demonstration Project Report 23
Table 2. Predicted number of Listed Species and MSA species potentially affected by Pier E3 Implosion
Species # of Individuals
(206 dB peak Sound Pressure Level [SPL])
# of Individuals (187 dB cSEL)
# of Individuals (183 dB cSEL)
Coho Salmon 0 0 Not Applicable (N/A)
Chinook salmon 0 0 N/A
Steelhead 0 0 N/A
Green Sturgeon 0 0 N/A
Northern Anchovy 18,938 160,825 197,513
Pacific Herring 246 1,641 N/A
Pacific Sardine 0 0 0
English Sole 2,568 24,455 24,993
Jacksmelt 381 2,594 3,080
Longfin Smelt 132 1,075 1,775
The anticipated impacts and minimization measures included the following:
Installation of a BAS and implementation of BMPs were proposed as methods to
limit the amount of temporary impacts on critical habitat. In addition, the removal of
Pier E3 resulted in the permanent restoration of 16,995 cubic yards (12,990 cubic
meters) of pelagic habitat.
The proposed project was expected to result in temporary impacts to critical habitat
for listed fish and on EFH through water quality impacts following pier implosion
and during removal of debris, as well as, and high-intensity sound associated with
the 4 to 6 second implosion. Temporary impacts were modeled to total
approximately 1,026 acres (415 hectares).
Impacts on eelgrass beds were not anticipated from the proposed project. Installation
of a BAS and implementation of BMPs, including the monitoring of eelgrass were
proposed as methods by which to limit the amount of temporary impacts on critical
habitat.
Physical disturbance or shading of eelgrass was not anticipated from the proposed
project. Care, however, was taken to ensure project-related equipment (e.g., barges,
cranes, piles, BAS) were not placed or stored in a manner to cause physical
disturbance or shading of any eelgrass communities.
Chapter 4. Anticipated Impacts
FINAL SFOBB Pier E3 Implosion Demonstration Project Report 24
4.1.1.1. STATE PROTECTED FISH SPECIES
The Department requested a major amendment to its CDFW-issued Incidental Take
Permit (ITP), pursuant to Section 783.6(c)(4) of the California Code of Regulations for
potential impact incidental to the Demonstration Project on CDFW-listed fisheries
(Sacramento River winter-run Chinook salmon (endangered), Sacramento River spring-
run Chinook salmon (threatened), Central California Coast Coho salmon (endangered),
longfin smelt (threatened)), CDFW-managed fisheries (Pacific herring), and habitat
associated with CDFW-listed fisheries on February 18, 2015. A summary of potential
affects to CDFW-jurisdictional fisheries is provided below.
The proposed project was expected to have no effect to CDFW-listed Chinook
salmon and Coho salmon. Installation of a BAS and timing the implosion in
November when these species are not present in the area of impact were proposed as
methods to avoid take of this species.
The Demonstration Project had potential to result in effects to Pacific herring.
However, these potential effects were estimated at 1,641 individual Pacific herring,
which represented only 0.5 percent of the larger Central/South Bay population in
November. Installation of a BAS, timing the blast when this species is at its lowest
seasonal density, and conducting Pacific herring monitoring, if work were to be
conducted during the spawning season, were proposed as methods by which to avoid
effects to this species resulting from the Demonstration Project.
The Demonstration Project had potential to result in take of longfin smelt. However,
take was estimated at 1,775 individual longfin smelt, which represented only
approximately 1.3 percent of the Central/South Bay population present in November.
Installation of a BAS and timing the blast when this species is at a lower density in
the area of impact were proposed as methods by which to avoid take of this species.
The proposed project was expected to result in temporary impacts on longfin smelt
and Pacific herring marine habitat through water quality impacts and high-intensity
sound associated with the 4-6 second blast. Temporary impacts were estimated to
total 1,026 acres (415 hectares). Installation of a BAS and implementation of BMPs
were proposed as methods by which to limit the amount of temporary impacts on
marine habitat.
4.1.2. Birds
With the exception of endangered avian species (e.g., marbled murrelets), there are no
official in-air sound thresholds for evaluating the potential for auditory damage to birds
Chapter 4. Anticipated Impacts
FINAL SFOBB Pier E3 Implosion Demonstration Project Report 25
from impulse noise events like pile-driving or implosions. Dooling and Popper (2007), in
a white paper reviewing the effects of noise on avian behavior, suggested interim
thresholds of 140 A-weighted decibel (dBA) for a single impulse event (e.g., detonation
of a single charge) and 125 dBA for multiple impulse events (e.g., repeated charges or
pile-driving strikes) See Table 3.
Table 3. Recommended Interim Guidelines for Potential Effects to Birds from In-air Sound Generated by a Single- or Multiple- Impulse Event (from Dooling and Popper 2007).
140 dBA NA NA Any audible component of highway noise has the potential of causing behavioral and/or physiological effects independent of any direct effects on the auditory system of PTS, TTS, or masking
Multiple Impulse (e.g., jackhammer, pile driver)
125 dBA NA ambient dBA
The literature suggests that birds are most sensitive to sounds from around 1 to 4
kilohertz (kHz) (1,000 to 4,000 hertz [Hz]), but they can perceive sounds at higher or
lower frequencies (Beason 2004). The recognized typical low-frequency cut-off of
hearing in birds is between 250 to 300 Hz (Heffner & Heffner 1998; Dooling and Popper
2007). In contrast, humans have a hearing range from 20 Hz to 20 kHz and hear as well
or better than birds over a wider range of sound frequencies (Dooling and Popper 2007).
Sound data provided to the Department by the blasting contractor from previous in-water
implosion events document in-air sound levels that ranged from 146 dBA at 8 feet to 105
dBA at 340 feet from the underwater blasts. Fitting a best-fit line to these data, in-air
sound levels drop below Dooling and Popper’s interim guideline value of 125 dBA
within 200 feet of the implosion. However, and more importantly, sound frequencies
during these past implosions ranged from 2 to 23 Hz, which are well below the typical
low-frequency cut-off value for most birds.
The Department concluded that in-air sound levels from the implosion are likely to fall
below 125 dBA within 200 feet of the implosion and these loudest sources of noise occur
at frequencies (2 to 23 Hz) that are not detected by birds. Therefore, the implosion is
likely to have negligible in-air auditory effects to birds because of the low frequency
signature of the noise.
Chapter 4. Anticipated Impacts
FINAL SFOBB Pier E3 Implosion Demonstration Project Report 26
4.1.2.1. IN-WATER NOISE REGULATORY THRESHOLDS AND ANALYSIS
To evaluate the potential for auditory damage to birds from impulse noise in-water, the
Department used the 2014 USFWS and Washington Department of Transportation
(WSDOT) criteria for injury to the marbled murrelet resulting from impact pile driving of
steel piles. These threshold criteria were developed to evaluate the effects of impact pile
driving on foraging marbled murrelets in the marine environment. This guidance
established a 202 dB cSEL threshold for auditory injury and 208 dB cSEL for non-
auditory injury from underwater noise, as well as a 150 dB RMS potential behavioral
response zone. These thresholds are summarized in Table 4. USFWS considers the 150
dB RMS zone to be a guideline, not a threshold.
Table 4. Criteria for Injury to Marbled Murrelets from Underwater Sound Resulting from Impact Pile Driving (from WSDOT 2014).
Type of Injury Threshold
Auditory Injury 202 dB cSEL
Non-auditory Injury 208 dB cSEL
Potential Behavioral Response 150 dB RMS
The Department used the 202dB cSEL criteria for auditory injury to assess the potential
hydroacoustic impact on birds exposed to the in-water impulse sound generated by the
implosion of Pier E3. The Department calculated a 500-foot distance to the 202 dB cSEL
threshold.
Specific avoidance and minimization measures were developed to minimize impacts on
birds that are likely to dive and/or forage in the water column around Pier E3 during the
implosion. Of particular concern were diving birds protected by MBTA, FESA and
CESA listed bird species, and California Fish and Game Code (CFGC) fully-protected
bird species. The only diving FESA and CESA listed species that may occur in the
vicinity of Pier E3 is the California least tern and the only CFGC fully protected species
that are known to occur in the vicinity of Pier E3 is the California least tern and the
California brown pelican. Specific avoidance and minimization measures include:
The implosion was scheduled for November. During project-related bird monitoring
conducted from 2002 to 2014, California least terns have only been observed during
their April to August nesting season. Therefore, California least terns were not
expected to be in the Demonstration Project area in November. Monitoring data also
shows a reduced number of California brown pelican sightings in November.
Chapter 4. Anticipated Impacts
FINAL SFOBB Pier E3 Implosion Demonstration Project Report 27
The Department implemented an avian monitoring plan to reduce the potential for
project-related bird effects. This plan included the following avoidance and
minimization measures:
Establishment of a 500-foot (152-meter) Avian Watch Zone around Pier E3 to
protect diving birds.
Use of deterrents to encourage target avian species to relocate from the 500-foot
Avian Watch Zone. Deterrents included the use of a high-powered laser and
sound cannons.
The Department stationed avian monitors at two locations in the vicinity of Pier
E3 to observe bird activity prior to, during, and following the implosion.
Per the avian monitoring plan, the implosion would be delayed if any USFWS or
CDFW special-status birds (including California least tern or California brown
pelican) were actively diving into the water within 500 feet of Pier E3
immediately prior to the implosion.
4.1.3. Marine Mammals
The Department requested an Incidental Harassment Authorization (IHA) from NMFS
pursuant to Section 101(a)(5)(A) of the MMPA for the harassment of marine mammals
incidental to the Demonstration Project. The Department determined that the following
marine mammals could have been affected by the Demonstration Project: California sea
lion, Pacific harbor seal, northern elephant seal, and harbor porpoise. A summary of
potential impacts on marine mammals is provided next.
4.1.3.1. IMPACTS ON MARINE MAMMAL HABITAT
The removal of Pier E3 through controlled implosion was determined to be unlikely to
negatively affect the habitat of marine mammal populations, as no loss of habitat would
occur and only a minor, temporary modification of habitat would occur from the
hydroacoustic impacts of the controlled implosion. The SFOBB is not used as a haul-out
site by pinnipeds, and dismantling of the concrete marine foundations is unlikely to
permanently decrease fish populations, a primary food resource for many marine
mammals. The physical effects from pressure waves generated by underwater impulse
sounds (e.g., underwater implosions) were anticipated to affect fish populations within
the proximity of project activities. The abundance and distribution of fish near Pier E3
could be altered for a few hours after the implosion and before individual fish from
surrounding areas are redistributed within the area. These fish populations, however,
were anticipated to return to pre-implosion levels as project activities cease and the local
population mixes again.
Chapter 4. Anticipated Impacts
FINAL SFOBB Pier E3 Implosion Demonstration Project Report 28
4.1.3.2. IMPACTS ON MARINE MAMMAL POPULATION
The numbers presented in Table 5 represent estimated modeled exposures to each
harassment threshold criteria zone under the MMPA. These calculated values were
conservative (i.e., over predictive) estimates of harassment, that calculated exposure
without taking into consideration avoidance and minimization measures that would be
employed (i.e., marine mammal observers, real time acoustic monitoring). As a result of
Table 5. Summary of the estimated exposures of marine mammals to controlled blasting dismantling activities for each of the Level A, Level B, and mortality threshold criteria.
Species
LEVEL B EXPOSURES LEVEL A EXPOSURES*
Mortality* Behavioral Response
Temporary Threshold
Shift
Permanent Threshold
Shift
Gastro Intestinal
Tract Injury
Slight Lung Injury
Pacific Harbor Seal
6 3 0 0 0 0
Northern Elephant Seal
1 0 0 0 0 0
California Sea Lion 0 0 0 0 0 0
Harbor Porpoise 1 0 0 0 0 0
Total 8 3 0 0 0 0
* No detonations would occur if any marine mammal was within Level A or mortality threshold criteria zones.
this analysis and through the implementation of these measures, the Department
concluded that the controlled implosion of Pier E3 would only result in Level B
Behavioral Harassment, or TTS. Level B Harassment is statutorily defined by the 1994
amendments to the MMPA as any act of pursuit, torment, or annoyance which has the
potential to disturb a marine mammal or marine mammal stock in the wild by causing
disruption of behavioral patterns, including, but not limited to, migration, breathing,
nursing, breeding, feeding, or sheltering but which does not have the potential to injure a
marine mammal or marine mammal stock in the wild (Public Law 103-238, April 30,
1994, 108 Statute 532). Based on the best available science, exposures to marine mammal
species and stocks because the controlled implosion would result in only short-term
effects to individuals exposed, would likely not affect annual rates of recruitment or
survival, and employed avoidance and minimization measures will prevent any Level A
exposures or mortality. Level A Harassment is statutorily defined by the 1994
amendments to the MMPA as, any act of pursuit, torment, or annoyance which has the
potential to injure a marine mammal or marine mammal stock in the wild (Public Law
103-238, April 30, 1994, 108 Statute 532).
Chapter 4. Anticipated Impacts
FINAL SFOBB Pier E3 Implosion Demonstration Project Report 29
Based on observations during 14 years of previous construction and dismantling activities
associated with the SFOBB Project, the protective measures described, and the very short
duration of the explosion, the Department anticipated there would be no permanent injury
or mortality to animals, or impacts (short or long term) on the populations or stocks of
marine mammals that regularly inhabit or occasionally enter the Bay.
4.2. Waters and Water Quality
As described below, the Demonstration Project was expected to have some impact on
waters and water quality.
4.2.1. Impacts on Water Quality during Controlled Implosion
A Water Quality Study (WQS) was prepared by the Department and submitted to
resource agencies (Caltrans, 2015c). The WQS examined potential water quality impacts
caused by turbidity and suspended sediment, pH, non-visible pollutants, and temperature.
The WQS demonstrated that potential impacts on water quality would be minimal and
temporary, and that no permanent impacts on water quality were anticipated to result
from the Demonstration Project.
Two additional technical reports evaluated the potential impacts from Portland Cement
Concrete slurry created during the implosion and the potential impacts on sediment
quality and benthic habitat from cement residue released from PCC during implosion.
The first technical report provided a conservative estimate of increase in pH caused by an
assumed release of alkalinity-changing materials (Table 6). The second technical report
predicted a low potential for benthic impacts caused by the settling of fine concrete
residue resulting from the controlled implosion of Pier E3.
Table 6. Predicted pH Effect under Two Scenarios (salinity. 32 parts per trillion).
Scenario ~100 footdistance
~1,000 foot distance
~2,000 footdistance
Explosives-only scenario 8.7 8.2 8.2
Explosives and dissolution of 5 percent of Pier E3 mass 12.7 11.3 9.1
Changes in pH were expected to be the most significant water quality impact. The pH
would increase as a result of explosive by-products and the release of fine-grained PCC
residue from the imploded structure. Two scenarios were modeled: pH impacts because
of release of explosive by-products only, and pH effects from the release of explosive by-
products along with dissolution of 5 percent of the mass of the Pier E3 as soluble calcium
oxide from PCC (Table 6).
Chapter 4. Anticipated Impacts
FINAL SFOBB Pier E3 Implosion Demonstration Project Report 30
The pH was not expected to exceed 9 standard units within the affected area under the
explosives-only scenario, and the effects would diminish within hours of implosion as a
result of mixing from tidal currents. The more extreme effects predicted by release of
calcium oxide from 5 percent of the total mass of the pier was deemed unlikely, based on
the experience from the Port Mann Bridge demolition as well as the higher buffering
capacity of San Francisco Bay water relative to the Fraser River (the river over which the
Port Mann Bridge passes).
Turbidity was expected to be the next most significant water quality impact. The
maximum turbidity was predicted by in the Department’s Water Quality Study for the
Pier E3 Demonstration Project (Caltrans 2015c) to be 300 nephelometric turbidity units
(NTU), rapidly dropping to below 50 NTU within 50 minutes, and back to baseline
within four hours. Changes in the water column temperature and concentrations of metal
and dissolved oxygen (DO) were expected to be de minimis.
4.2.2. Impacts on Water Quality during Site Restoration
Site restoration included movement of concrete rubble into the void created by the
implosion of Pier E3. During this phase, water quality impacts were anticipated to be
minimal. To verify this, monitoring was conducted in accordance with methods and
standards outlined in the Water Quality Self-Monitoring Program required by the
RWQCB Order No. R2-2002-0011, or as required by the RWQCB (RWQCB 2002).
4.2.3. Fill
In the 2001 FEIS and original applications submitted to regulatory agencies, the
Department acknowledged that the project would result in a net decrease to fill in the Bay
after the installation of the new east span and removal of the original bridge. A volume of
85,600 cubic yards (65,450 cubic meters) of permanent fill was calculated from the piers
and fenders of the original bridge. The dismantling of Pier E3 to low scour line represents
the removal of approximately 16,995 cubic yards (12,990 cubic meters) of permanent fill
in the Bay consisting of 15,745 cubic yards (12,035 cubic meters) of permanent fill from
the concrete pier structure and approximately 1,250 cubic yards (955 cubic meters) of
permanent fill removed via the pier fender system. This removal of permanent fill in the
Bay restored approximately 16,995 cubic yards (12,990 cubic meters) of pelagic habitat.
Chapter 5. Environmental Monitoring Methods
FINAL SFOBB Pier E3 Implosion Demonstration Project Report 31
Chapter 5. Environmental Monitoring Methods
5.1. Water Quality Monitoring
A water quality monitoring program was conducted to verify predictions of potential
impacts as described in the WQS for the Demonstration Project (Caltrans 2015c). Water
quality monitoring program activities are described in detail in the Demonstration Project
sampling and analysis plan (Caltrans 2015d)
5.1.1. Implosion Monitoring Plan
To document impacts resulting from the controlled implosion, the SAP built on the self-
monitoring program (SMP) contained in the project’s Waste Discharge Requirement,
Order No. R2-2002-0011 (2002). This SAP either met or exceeded the specifications
provided in the SMP. Water quality monitoring for the controlled implosion consisted of
five techniques:
Dynamic Plume Mapping: Dynamic and static water column profiling techniques
were used to define the three-dimensional extent of the plume and track its
dispersion over a 5-hour window following the implosion. Dynamic profiling used a
boat-towed monitoring array to continuous measure and defined the three-
dimensional shape of the plume. Static profiling involved raising and lowering a
monitoring device from a stationary vessel.
Current-Tracking Drogues: Current drogues were used to track the movement of the
plume and guide the profiling effort. Drogues were deployed in two sets – one set
upstream of the plume and another downstream of the plume – to move with the
current and track the plume in real-time. Attached buoys with GPS sensors and radio
transmitters sent drogue position coordinates to the plume mapping vessel. A second
vessel, the drogue tender, shepherded the drogues as they moved along with the
current and prevented the drogues from encountering any obstructions.
Environmentally Sensitive Area (ESA) monitoring: To confirm that the water quality
in the vicinity of the eelgrass beds was not affected, five continuous monitoring
buoys measured turbidity and pH at middle depth.
Water Quality Grab Sampling: Water quality sampling was conducted from a third
vessel. Grab samples were collected as the vessel moved along the path of the plume.
Samples were measured for pH, turbidity and suspended solids concentration, and
total and dissolved metals.
Chapter 5. Environmental Monitoring Methods
FINAL SFOBB Pier E3 Implosion Demonstration Project Report 32
Sediment Quality Assessment: Sediment analysis was conducted before and after the
implosion to measure potential benthic effects. A random stratified sampling design
was implemented to test the spatial variability of sediment chemistry (metals and
pH) and toxicity at the sediment-water interface.
5.2. Hydroacoustic/Underwater Pressure Monitoring
5.2.1. Background: Regulatory Thresholds for Hydroacoustic
Impacts
The criteria used by NMFS and CDFW to regulate for potential impacts on fish are those
currently established by the FHWG for underwater impact pile driving along the U.S.
West Coast (FHWG 2008). These criteria were established after extensive review of the
most recent analysis of the effect of underwater noise on fish from pile driving in water.
The criteria use two metrics, highest peak pressure level (Lpk) and accumulated cSEL.
Peak pressure is the effective sound pressure level converted to dB of the highest
monitored peak pressure measured at a single location during an underwater sound event.
The cSEL is the total noise energy produced from a single noise event and includes both
the intensity and duration of the pulses generated as monitored from a single point. The
agreed-on threshold criteria for in-water noise for the onset of injury to fish has been set
at a single-strike peak level (Lpk) of 206 dB referenced to 1 microPascal (re 1 μPa), 187
dB cSEL referenced to 1 μPa squared per second (re 1μPa2-s) for fish over 2 grams, and
183 dB cSEL re 1 μPa2-s for fish less than 2 grams (FHWG 2008). The FHWG
determined that noise at or above these levels can cause injury to damage to auditory
tissues and TTS in fish. In addition, a threshold of 150 dB RMS was used per the NMFS
BO of August 2015 as the level that elicits a behavioral response, but no injury, in fish.
The 150 dB RMS threshold is reported at the request of regulatory agencies, but is not
included as a criterion that is regulated.
Noise criteria for marine mammals used for the implosion of Pier E3 followed the interim
underwater explosive criteria established by the National Oceanic and Atmospheric
Administration (NOAA) and consist of cSEL, Lpk, and acoustic impulse. The cSEL
criteria for marine mammals are complex as the levels vary by species and have
individual frequency weightings that also vary by species. The marine mammal criteria
are shown in Table 7.
Table 7. Marine Mammal Noise criteria and thresholds for underwater blasting
Chapter 5. Environmental Monitoring Methods
FINAL SFOBB Pier E3 Implosion Demonstration Project Report 33
5.2.2. Fish Criteria 5.2.2.1. PEAK PRESSURE LEVEL
At this time, NMFS, CDFW and USFWS do not have specific peak pressure criteria for
potential impacts on fish from underwater blasting. In the absence of such criteria, and
after consultation with NMFS and CDFW (no fish species in the project area are
regulated by USFWS), it was decided to compare the measured peak pressure level from
the Pier E3 implosion to the existing criterion used for impact pile driving.
The pressure pulses generated by impact pile driving do not have rise times as fast as
those generated by underwater blasts. While lower in amplitude, pile driving pressure
Chapter 5. Environmental Monitoring Methods
FINAL SFOBB Pier E3 Implosion Demonstration Project Report 34
fluctuations are longer in duration and as a result may have more energy when integrated
over time. Further, for fish injury/mortality, the metric with the best correlation of
underwater blast pressures to injury is impulse, not peak pressure, based on the research
by Govoni et al. (2003) and Yelverton et al (1975). In developing the interim criteria for
fish, it was recognized that the impacts from pile driving as compared to underwater
blasts were significantly different and the pressure rise time could be a factor. After
review of the work done by Yelverton et al. (1975) that involved underwater blasts,
Hastings and Popper (2005) recommended cSEL as the metric most appropriate for
assessing injury impacts of pile driving sound on fish. This was further affirmed by
Hastings (2007) review of other work done that included blasts by Govoni et al (2003,
2007). Based on the preference of impulse over peak pressure to assess impacts from pile
driving on fish, became the initial basis for fish thresholds (Pogger et al. 2006; Carlson et
al. 2007). However, it was also considered that alone may not completely capture
impacts on fish. Therefore, a peak pressure level criterion based on this metric was
added. The cSEL criteria for fish were derived from blasting data sampled at a higher rate
(approximately 1,000,000 samples per second) and with appropriate pressure transducers
(Hastings 2007). However, the peak pressure level criterion was based on the nature of
the peaks produced by pile driving that do not have the high frequency components that
are seen in pressure fluctuations produced by blasting.
In 2005, Hastings and Popper published a paper assessing the Effects of Sound on Fish
(Hasting and Popper 2005). Hastings and Popper concluded the body of data currently
available is inadequate to develop anything more than the most preliminary scientifically
supportable criteria for injury to fish from pile driving sounds (Hasting and Popper 2005).
Therefore such a criteria was not proposed in their 2005 report (Hasting and Popper
2005). Instead, information from blasting and pure tone studies were used to develop
recommendations for interim guidance (Hasting and Popper 2005). Hasting and Popper
noted that such guidance should not be used for any signal other than pile driving
(Hasting and Popper 2005). In 2006, Popper et al. recommended that interim criteria for
injury to fish from pile driving be set at a peak sound pressure level of 208 dB Peak and
an SEL level of 187 dB SEL (single strike) (Popper et al. 2006). This recommended
interim criteria was based on findings from four studies; blasting and pure tone studies
previously considered by Hasting and Popper in their 2005 report and one study by the
Department using pile driving stimuli (Popper et al. 2006). In 2007 Hastings, Popper and
Carlson recommended a slightly more stringent peak criteria of 206 dB Peak and
cumulative SEL criteria of 189 dB cSEL for fish greater than 2 grams and 183 dB cSEL
for fish less than 3 grams (Carlson et al. 2007, Buehler et al. 2007). Ultimately, in 2008
the Fisheries Hydroacoustic Working Group agreed in principle on an interim criteria for
Chapter 5. Environmental Monitoring Methods
FINAL SFOBB Pier E3 Implosion Demonstration Project Report 35
injury to fish from pile driving activities of 206 dB Peak for all fish and a cumulative
SEL criteria of 187 dB cSEL for fish greater than 2 grams and 183 dB cSEL for fish less
than 3 grams (FHWG 2008).
In practice, impact pile driving is typically measured with hydrophones and sampled at
lower rates (typically less than 100,000 samples per second [S/s]). Figure 10 shows
results from the Pier E3 implosion measuring the same event with the same sensor type
(hydrophone) sampled at two different rates, high speed (2,000,000 S/s) compared to a
lower speed (96,000 S/s). Sampling at the lower rates that are typically used for
measuring peak pressures during pile driving may not capture the actual peak pressure
when monitoring during blasting. When monitoring the Pier E3 implosion two types of
sensors were used, hydrophones and pressure transducers. The technical differences
between these sensor types are given in detail in later sections of this report. The peaks
measured with either a pressure transducer or hydrophone using the same high sampling
rate are both likely to capture the fast peaks generated by blasting (Figure 10 and 11). On
Note: Pressure waveform at 500 feet from the east for a hydrophone sampled at both 2,000,000 and 96,000 samples/second.
Figure 10. Pressure Waveform at 500 feet from the East (1)
Chapter 5. Environmental Monitoring Methods
FINAL SFOBB Pier E3 Implosion Demonstration Project Report 36
Note: Pressure waveform at 500 feet from the east for a pressure transducer and hydrophone, both sampled at 2,000,000 samples/second.
Figure 11. Pressure Waveform at 500 feet from the East (2)
the other hand, use of higher sampling rates during blast monitoring could capture peaks
that have a much faster rise time and may have been missed by using the lower sampling
rates typically used to monitor impact pile driving. It is not the intent of this report to
comment on the appropriateness of peak pressure criteria but rather to point out the
differences that sampling rates could make in applying peak criteria to monitoring results.
However, if peak pressure is going to be applied as a criterion for underwater blasts,
development of criterion specific to blasts should be considered.
5.2.2.2. CUMULATIVE SOUND EXPOSURE LEVEL
For fish criteria based on the cSEL metric, the issue is not so ambiguous. As noted above,
the cSEL criteria for fish were derived from underwater blast data. Further, the SEL
produced with the hydrophone sampled at 96,000 S/s was nearly identical to that sampled
at 2,000,000 S/s with the pressure transducer. As a result, the choice between using a
pressure transducer or hydrophone to capture cSEL data is not critical.
As part of this demonstration, hydroacoustic monitoring was performed during the
implosion at strategic locations around Pier E3. The purpose of hydroacoustic monitoring
during the controlled implosion of Pier E3 was twofold: 1) to evaluate distances to
specific fish and marine mammal impact noise criteria; and 2) to improve the calculation
of underwater noise impacts that removal by controlled implosion of the remaining in-
water piers may have.
The Pier E3 implosion consisted of 588 detonations of 8 different charge weights,
ranging from 21 to 35 pound/delay. The duration of the event was 5.3 seconds from the
first to the last detonation with individual charges separated by 9 milliseconds. Close to
the pier, the individual blasts are distinguishable from each other. For any one
measurement location, the highest peak pressure could occur at any time during the
implosion event. During the demolition event, the pier was encircled with a BAS, which
produced a stream of air bubbles surrounding the structure, as shown schematically in
Figure 14 and in a photograph of the water surface around Pier E3 in Figure 15. Blast
mats were positioned on the top and sides of the structure to control fly rock.
Chapter 5. Environmental Monitoring Methods
FINAL SFOBB Pier E3 Implosion Demonstration Project Report 39
Figure 12. Summary of Peak Pressure Level and Cumulative Sound Exposure Level Results
Figure 13. Summary of the Calculated Distances to Criteria and Those Indicated by Measurements
Chapter 5. Environmental Monitoring Methods
FINAL SFOBB Pier E3 Implosion Demonstration Project Report 40
Figure 14. Blast Attenuation System Schematic
Figure 15. BAS Operating before the Implosion
Chapter 5. Environmental Monitoring Methods
FINAL SFOBB Pier E3 Implosion Demonstration Project Report 41
As part of the process for permitting the demonstration implosion, underwater sound
levels were calculated based on accepted theory for open water blasts. These equations
were modified to account for confinement of the individual charges imbedded in the
concrete structure and an assumed efficiency of the BAS to reduce the underwater blast
pressures. A critical component of the analysis of the hydroacoustic results is the
comparison between these estimated and actual measured levels. This report includes a
description of the methods used to calculate the estimated hydroacoustic levels, a
description of the monitoring measurements, a summary of the results, and a discussion
on the implications for future calculated modeling and monitoring based on the Pier E3
implosion experience.
5.2.5. Estimated Levels 5.2.5.1. METRICS
To compare with appropriate marine mammal and fish sound criteria, the implosion’s
pressure signals were reduced and analyzed to obtain maximum peak pressure level,
impulse, cSEL, and RMS levels. The pressure versus time signals from the near and far
field monitoring locations were processed using the same algorithm to calculate the
required metrics. Peak pressure level is defined as:
20 / (1)
where Lpk is the peak level in dB, and Pref is the reference pressure of 1 μPa. The acoustic
impulse which is the time integral of the energy under the greatest positive peak pressure
is given as:
(2)
where P(t) is the instantaneous positive pressure, t1 is the start of the positive pressure
corresponding to highest positive peak in the blasting event, and t2 is end of the positive
pressure. To calculate the impulse numerically, a discrete summation was used for the
implosion of the form:
∑ (3)
where tn is the time resolution of the pressure versus time signal (e.g., 0.005 milliseconds
for the 2,000,000 Hz signals), Pn is the pressure in a specific increment of time, and N is
sufficiently that N×tn covers the duration of the positive pressure pulse. Cumulative SEL
is given by:
Chapter 5. Environmental Monitoring Methods
FINAL SFOBB Pier E3 Implosion Demonstration Project Report 42
10
(4)
where T is the duration of entire implosion, P2(t) is the instantaneous pressure squared,
and Pref is the reference pressure of 1 μPa. The numerical calculation used for the analysis
of the near and far field locations is determined similarly to the impulse, except that
integration is applied to the pressure squared and the integration time includes the entire
blasting event, not just a single positive pressure pulse. Cumulative SEL is calculated as a
summation by:
10 ∑ (5)
where Δti is the time resolution of the pressure versus time signal, pi2 is the pressure
squared in a specific increment of time, and t is the total duration of the blasting event.
For the SEL in general, the limits or duration of the summation are harder to determine
than impulse values, as the waveform can contain both positive and negative pressures.
The RMS level is given by:
20
where T1 is the time at the beginning of the blasting event, and T2 is the time at the end.
Numerically, the RMS calculation is given by:
20 ∑ ∆
5.2.5.2. GENERAL ASSUMPTIONS
The blasting sequence was rather complex and is shown schematically in Figure 16.
Blasts started in several interior walls of the southern portion of the structure followed by
the outer walls of the south side. The blasts in the inner walls occurred just prior to the
adjacent outer walls. The interior first, exterior second blast sequence continued across
the structure, moving from south to north. As the blasting progressed, locations to the
east, north, and west of the pier were shielded from the blasting on the interior of the
structure from the still standing exterior walls of Pier E3. However, towards the
conclusion of the blast, each direction experienced blasts from the outer walls that were
not shielded.
(6)
(7)
(8)
Chapter 5. Environmental Monitoring Methods
FINAL SFOBB Pier E3 Implosion Demonstration Project Report 43
Figure 16. Sequence of the Firing of Individual Charges
To calculate Ppk and P(t), several assumptions were made. For simplification, it was
assumed that there was only one blast distance, and it would occur at the closest point on
Pier E3 from the receiver point. In actuality for almost all explosions, distances from the
blast were greater, as the portion of the pier that was removed via blasting was
approximately 135 feet across and 40 feet wide. Based on these dimensions, the actual
blast point could have been up to the diagonal distance of 141 feet farther from the
receptor point used for the calculation. As a result, the calculated peak level was the
maximum expected for one 35-pound blast, while the other levels were expected to be
lower, depending on the distance from the actual blast location to the calculation point
and weight of the charge. In other words, the pressure received at the calculation point
would not be 588 signals of the same amplitude but would be from one at the calculated
level for a 35-pound charge and 587 of varying lower amplitudes. Similarly, in the
N
Chapter 5. Environmental Monitoring Methods
FINAL SFOBB Pier E3 Implosion Demonstration Project Report 44
vertical direction, the location varies over a height of about 50 feet, and those blasts that
were not at the same depth as the receiver would also be lower. This effect of variation in
assumed blast-to-receiver distance would be most pronounced close to the pier, while at
distances of about 1,000 feet or greater, the effect would be less than 1 dB.
In the calculations, it was also assumed that there would be no self-shielding of the pier
as the explosions progressed. From the above discussion of the blast sequence, some
shielding of the blasts along the interior of the pier is expected. However, the blasts that
occurred in outer wall (towards the end of the detonation) would not be shielded for all
blasts. A blast in the outer wall that has a direct line-of-sight to the receiver calculation
point would not be shielded and would generate the highest peak pressure relative to the
Lpk criterion. The cSEL and the RMS levels however, would be reduced to some degree
by the outer walls until they are demolished, as these metrics are defined by the pressure
received throughout the entire 5.3 second event. Because of the complexity of the blast
sequence, this shielding effect was not considered in the calculated cSEL and RMS
levels.
The explosives were placed in 2-3/4 to 3-inch-diameter holes drilled into the concrete
pier structure. The outer walls of Pier E3 are nominally 3 feet and 11-1/2 inches thick and
inner walls are nominally 3 feet thick. Individual blasts should not be exposed to open
water and some confinement of the blasts was expected. For confined blasts, the
calculated pressures can be reduced by 65 percent to 95 percent (Rickman 2000; Revey
2011; Nedwell and Thandavamoorthy 1992; Oriard 2002), corresponding to
multiplication factors from 0.35 to 0.05, respectively. Based on a review of the available
literature and recent data from similar explosive projects, a conservative confinement
factor of K=7500 was assumed. This equated to a reduction in pressure by a
multiplication factor of 0.3472.
Another assumption was to consider only the direct wave from an individual blast. In
shallow water, the signal at the receiver point could consist of the direct wave, surface-
relief wave generated at the water/air interface, a reflected wave from the bottom, and a
wave transmitted through the bottom material, as shown in Figure 17 (USACE 1991). For
estimating Ppk , only the direct wave was considered as it was expected to have the
highest magnitude and will arrive at the receiver location before any other wave
component. However, P(t) after the arrival of the direct wave, peak pressure will be
affected. The surface-relief wave is negative so that when it arrives at the receiver
location, it will reduce the positive pressure of the direct wave and can make the total
pressure negative at times after the arrival of the initial positive peak pressure. Because
Chapter 5. Environmental Monitoring Methods
FINAL SFOBB Pier E3 Implosion Demonstration Project Report 45
Figure 17. Propagation Effects in Shallow Water
the cSEL is a pressure-squared quantity, any negative pressure can also contribute to the
cSEL. However, the amplitude and arrival time of the surface-relief wave depends on the
geometry of the propagation case, that is, depth of water, depth of blast, and distance and
depth of the receiver point. The effect of this assumption is discussed further in the
section on cSEL.
5.2.5.3. CALCULATION OF PEAK PRESSURE
Peak pressures were calculated by following the modified version of the Cole Equation
for calculation of blasts in open, deep water (Cole 1948). The peak pressure is determined
by:
λ .
where Ppk is peak pressure in psi, and λ is the scaled range given by R/W⅓, in which R is
the distance in feet and W is the weight of the explosive charge in pounds. A modified
version of the Cole Equation has been documented in USACE Technical Letter No.
1110-8-11(USACE 1991) and is applicable to shallow water cases, such as that of the
Pier E3 demolition7. The constant K factor multiplier in the USACE calculation is 21,600
for an open-water blast instead of the 22,550 from the original Cole Expression. This
factor is slightly less (approximately 4 percent) than the original Cole. The decay factor (-
1.13) used in the USACE modified equation remains the same as the original Cole
Equation. To account for the confining effect of the concrete pier structure, a
conservative K factor of 7,500 was used, corresponding to multiplying USACEP by a
factor of 0.3472. With a minimum delay between blasts of 9 milliseconds, the individual
explosions were planned sufficiently apart in time to avoid individual blasts combining
into a higher peak pressure. As a result, the peak pressure was taken as that calculated for
(9)
Chapter 5. Environmental Monitoring Methods
FINAL SFOBB Pier E3 Implosion Demonstration Project Report 46
the largest charge weight of 35 pound/delay. A BAS was specified in the blast plan.
Based on the literature and recent results from similar projects, reductions in the pressure
peak of 85 percent to 90 percent or more were expected. For determining Ppk in this
analysis, a conservative reduction of 80 percent was used. Based on values of
confinement, anticipated BAS performance, and the general assumptions above, the
calculated peak pressures were expected to be conservative.
5.2.5.4. CALCULATION OF CUMULATIVE SEL VALUES
To calculate cSEL values as a function of distance from the blast, pressure versus time
histories for all of the 8 charge weights were calculated for varying distances. The open-
water equation used for these calculations was that modified by the USACE (1991), and
based on methods pioneered by Cole (1948). Pressure as a function of time is given by:
(10)
Where is the charge weight and ta is given as R/5000 and θ is:
6.0 10 ⅓ . (11)
Some of the time histories produced by these equations are shown in Figure 18 for
varying distances from the blast.
As discussed previously, there are other wave components that could have been
considered in the cSEL calculation, including the surface relief wave, reflection from the
bottom, and transmission through and re-radiation from the bottom. Little or no
contribution was expected from the bottom, based on its sedimentary nature and previous
experiences measuring noise during underwater pile driving in the area of the San
Francisco Bay around Pier E3. The negative surface relief wave could be a factor in the
cSEL calculation. This wave could either increase or decrease the cSEL, depending on its
arrival time relative to the direct wave. For small differences in arrival time, the surface
relief wave would decrease the total cSEL as a portion of the positive direct wave is
negated by the addition of the negative surface relief wave. This is shown in Figure 19
for a blast and receiver depth of 30 feet and at a range of 1,000 feet. In this case, the
surface relief wave essentially balances the direct wave so that the total cSEL is within a
few tenths of a decibel of the direct wave only. For closer distances and when the
receiver and blast locations are near the bottom, the total cSEL can become greater than
the direct wave cSEL, but only by less than 3 dB. However, whenever the source or
receiver is near the surface, the direct wave cSEL would be greater than the total cSEL
and could approach being 10 dB or greater at distances beyond 1,000 feet. Because the
Chapter 5. Environmental Monitoring Methods
FINAL SFOBB Pier E3 Implosion Demonstration Project Report 47
Figure 18. Calculated Blast Wave Time Histories for Different Blast Distances
cSEL values only approach the criteria at distances greater than about 2,300 feet, the
surface relief wave is ignored in this analysis, knowing that the surface relief wave would
only tend to produce lower cSEL values than the direct wave.
Considering only the direct wave, the time histories such as those in Figure 19 were
squared and summed in a numerical version of Equation 2 to calculate single blast cSEL
for each blast weight.
These calculations were then extended to distances out to 160,000 feet. To determine the
cSEL for all 588 blasts, the single blast cSEL values, as a function of distance, were
calculated for the other charge weights of 35, 32.5, 30, 29.6, 26, 24, 22.5, and 21 lbs. For
each weight, the cSEL was determined by adding 10Log(N), where N is the number of
the blasts for each weight. For example, 21.3 dB was added to the 35-lb single blast cSEL
to account for 135 blasts of this charge weight. The values for all the charge weights are
summarized in Table 8. These cSEL values for each charge weight were then summed
(on an energy basis) to get the total cSEL for the unconfined blast sequence. To account
Chapter 5. Environmental Monitoring Methods
FINAL SFOBB Pier E3 Implosion Demonstration Project Report 48
for the confinement factor of 0.3472 (K=7500), 20Log(0.3472) or -9.2 dB was added to
the unconfined values.
Note:
Calculated total pressure versus time history for combined direct and surface relief wave 1,000 feet from the blast with source and
receptor 30 feet deep.
Figure 19. Calculated Total Pressure Versus Time History for Combined Direct And Surface Relief Wave
Table 8. Charge weights per delay, number of delays, and added level to accumulate number of blasts
lbs/Delay Total Number of Delays, N 10Log(N), dB
35 135 21.3
32.5 24 13.8
30 135 21.3
29.6 111 20.5
26 24 13.8
24 12 10.8
22.5 12 10.8
21 135 21.3
Total 588
Chapter 5. Environmental Monitoring Methods
FINAL SFOBB Pier E3 Implosion Demonstration Project Report 49
The BAS would have an effect on the wave after a blast passes through it. In a research
report by USACE in 1961, the performance of BAS was examined in detail. It was
reported that a BAS reduces the peak pressure and elongates the pressure time history, as
shown in Figure 19. It has also been found for an energy metric, such as cSEL, that the
reduction produced by the BAS was equal to or greater than the reduction of the peak
pressure. To estimate the reduction for cSEL values because of the BAS proposed blast
design, cSEL was reduced by 80 percent. Effectively, this was done by reducing the
cSEL by 20Log(0.20), or 14 dB. These cSEL values and those without the BAS were
then compared to the fish criteria of 183 dB and 187 dB cSEL. Because the calculation of
cSEL is based on the peak pressure, these calculated values for the direct wave
component were expected to be conservative for the same reasons as described for the
peak pressures.
5.2.5.5. CALCULATION OF RMS LEVELS
The RMS levels were derived from the cSEL values. Comparing Equations 2 and 3, the
difference between cSEL and RMS is that RMS is divided by the interval from the start
of the blast to the end of the blast (ΔT). The “end” of the blast is somewhat ill-defined,
however. The cSEL is concluded when the received energy stops increasing with time.
The time over which this occurs is not a factor. For RMS, time is a factor, and the RMS
value is inversely related to ΔT. If ΔT is too short such that it does not include all of the
energy from the blast, the RMS value may be overestimated. For calculations of RMS
level for the Pier E3 blast event, the blast time of 5.3 seconds was used. The time over
which energy is received, however, was probably slightly longer than this because of the
elongating effect of the BAS and outward propagation of the wave. Given the 9-
millisecond delay between detonations, the error should be quite small, and values
calculated would be conservative. To calculate the RMS levels, 10Log(1/5.3), or -7.2 was
added to the cSEL values.
5.2.5.6. CALCULATION OF IMPULSE VALUES
To calculate positive impulse values, the expression originally developed by Cole for
open water was used8. This expression includes only contributions from the direct wave
neglecting any contribution from the surface relief, bottom reflected, and bottom
transmitted, consistent with the assumptions used to calculate cSEL. In this case, impulse
is given by Equation 12 with variables described previously:
2.18 ⅓⅓ .
(12)
Chapter 5. Environmental Monitoring Methods
FINAL SFOBB Pier E3 Implosion Demonstration Project Report 50
The impulse can also equivalently be calculated from wave forms, as shown in Figure 20.
Equation 10 produces impulse values in psi-milliseconds, which were converted to Pa-sec
by multiplying by 6.9 for comparison to the marine mammal criteria.
Unlike Ppk and cSEL, no reduction by the BAS was assumed for the impulse calculation.
As shown in Figure 20, the area under the p(t) curve undergoes little change after passing
through the BAS. The peak pressure is reduced, as noted previously; however, because
the p(t) expands in duration, the area change is minimal. This behavior is well-
documented in the literature. As discussed above, this is not the case for cSEL, which is
determined by the area under the p2(t) curve.
5.2.5.7. MARINE MAMMAL WEIGHTING
For marine mammals, five groupings are considered in the criteria. These include Low-
Frequency Cetaceans (LFII), Mid-Frequency Cetaceans (MFII), High-Frequency
Cetaceans (HFII), Phocidaes (PWI), and Otariidaes (OWI). In the San Francisco Bay
around Pier E3, the mammals of concern were identified to be Pacific harbor and
northern elephant seals (PWI), sea lion (OWI), and harbor porpoise (HFII). The filters
corresponding to these three groupings are shown in Figure 21. To apply these
weightings, the Fast Fourier Transform (FFT) was calculated for the pressure time
histories at each analysis distance (see Figure 18). Each FFT was then filtered using the
frequency weighting specified for each group/species from Figure 21. Filter factors were
then determined for each distance by subtracting the filtered result from the unfiltered
FFT data and determining the overall noise reduction in decibels because of the filters.
These filter factors were then applied to the cSEL determined for the entire blast event
for each distance from Pier E3.
5.2.5.8. RESULTS OF CALCULATIONS
As discussed above, the peak pressure and cSEL values were calculated for each of the
eight charge weights. An example of this is provided in Table 9 for a distance of 1,000
feet. Corresponding values were calculated for distances from 10 to 160,000 feet.
5.2.5.9. FISH CRITERIA
Plots of the calculated peak pressure level, cSEL, and RMS pressure level are shown in
Figures 22 and 23, along with the respective criteria levels for fish. The intersection of
the criteria lines and the calculated lines are also indicated, giving the calculated distance
to criteria threshold values given in Table 9.
Chapter 5. Environmental Monitoring Methods
FINAL SFOBB Pier E3 Implosion Demonstration Project Report 51
Figure 20. Effect of Bubble Screens of Different Parameters on Underwater Unconfined Blast
Chapter 5. Environmental Monitoring Methods
FINAL SFOBB Pier E3 Implosion Demonstration Project Report 52
Figure 21. Weighting Functions for Marine Mammal Species of Concern for the Pier E3 Implosion
Table 9. Calculated peak pressure and single and cumulative SEL values for each charge weight at 1,000 feet
lbs/Delay Peak Pressure,
dB Single Blast
cSEL, dB Total Number of Delays, N
10Log(N), dB Cumulative SEL for Each Weight
35 204.1 168.6 135 21.3 189.9
32.5 203.9 168.3 24 13.8 182.1
30 203.6 167.9 135 21.3 189.2
29.6 203.6 167.8 111 20.5 188.3
26 203.1 167.3 24 13.8 181.1
24 202.9 166.9 12 10.8 177.7
22.5 202.7 166.6 12 10.8 177.4
21 202.4 166.3 135 21.3 187.6
Total 588 195.4
5.2.5.10. MARINE MAMMAL CRITERIA
For marine mammals, three cSEL threshold values are prescribed corresponding to
behavioral, TTS, and PTS. The values of the thresholds are also specific to each species
grouping. The calculated cSEL values and specific thresholds are shown in Figures 24
through 26 for seals, sea lions, and porpoises, respectively. The distances to the each of
Chapter 5. Environmental Monitoring Methods
FINAL SFOBB Pier E3 Implosion Demonstration Project Report 53
Figure 22. Calculated Peak Pressure Level and Cumulative SEL Values with Fish Criteria and Distances to Threshold Levels
Chapter 5. Environmental Monitoring Methods
FINAL SFOBB Pier E3 Implosion Demonstration Project Report 54
Figure 23. Calculated RMS Levels with Criteria and Distance to Threshold Level along with Peak Pressure Level and Cumulative SEL Values
Chapter 5. Environmental Monitoring Methods
FINAL SFOBB Pier E3 Implosion Demonstration Project Report 55
Figure 24. Calculated Cumulative PWI Weighted SEL for Seals with Criteria and Distance to Thresholds Indicated
Chapter 5. Environmental Monitoring Methods
FINAL SFOBB Pier E3 Implosion Demonstration Project Report 56
Figure 25. Calculated Cumulative OWI Weighted SEL for Sea Lions with Criteria and Distance to Thresholds Indicated
Chapter 5. Environmental Monitoring Methods
FINAL SFOBB Pier E3 Implosion Demonstration Project Report 57
Figure 26. Calculated Cumulative HFII Weighted SEL for Porpoises with Criteria and Distance to Thresholds Indicated
the thresholds for each of species are also shown in these figures. There are also criteria
for gastro-intestinal (GI) tract injury, lung injury, and mortality. The GI threshold is
quantified in peak pressure and the lung and mortality are impulse, based on mammal
weight and depth. As a conservative measure, the thresholds for the GI injury, lung injury
and mortality thresholds for all marine mammal species of interest were calculated using
the average mass of a harbor seal pup (approximately 7 kilograms). This determination
was made considering that the small mass of the harbor seal pup made it the most
vulnerable (the smaller the mass, the less impulse can be absorbed before onset of injury)
to impulse pressures and that the threshold for that single species could effectively be
used as a conservative threshold for all the other species. Because harbor seal is the most
common marine mammal species, the thresholds were developed with protection of that
species at the forefront of the monitoring effort. In addition, this measure was considered
conservative because harbor seals generally pup from March to June; November is not
the time of year when harbor seals are pupping and harbor seal pups were not expected to
be in the project area.
Chapter 5. Environmental Monitoring Methods
FINAL SFOBB Pier E3 Implosion Demonstration Project Report 58
The GI threshold for all categories of species is a peak pressure of 237 dB. The calculated
peak pressures, criterion level, and distance to threshold are shown in Figure 27. For lung
damage, the threshold is expressed as an impulse value of 13.7 pounds per square inch-
milliseconds (psi-ms) and applies to all categories. For mortality, the threshold is 32.02
psi-ms, and it also applies to all categories of marine mammals. The calculated impulse
values, lung and mortality criterion level, and distance to these thresholds are shown in
Figure 28.
Figure 27. Calculated Peak Pressure Level with GI Criteria for All Marine Mammals and Distance to Thresholds Indicated
Chapter 5. Environmental Monitoring Methods
FINAL SFOBB Pier E3 Implosion Demonstration Project Report 59
Figure 28. Calculated Impulse Values with Lung and Mortality Criteria for All Marine Mammals and Distance to Thresholds Indicated
5.2.6. Description of Hydroacoustic/Pressure Monitoring Plan
Monitoring of the implosion was specific to two regions around Pier E3 with unique
methods, approaches, and plans for each of these regions. These regions included the
“near field” and the “far field.” For Pier E3, the near field comprised of measurements
taken within 200 feet of the pier, while the far field comprised of measurements taken at
500 to 4,000 feet. Because of the peak pressures that were expected within 500 feet,
pressure transducers were required for data acquisition instead of the conventional
hydrophones. In the near field, the dimensions of the pier were relatively large compared
to the measurement distance. As a result, the relationship between sound pressure and
distance from the pier was complex, as the pressure from any one blast would depend not
only on distance from the pier but also on the position of the blast along the face of the
pier. Beyond 500 feet, sound levels were expected to display a more consistent
logarithmic fall off with distance. The blasting contractor limited the personnel and
materials within 1,500 feet of the implosion.
Chapter 5. Environmental Monitoring Methods
FINAL SFOBB Pier E3 Implosion Demonstration Project Report 60
5.2.7. Measurement Locations 5.2.7.1. NEAR FIELD LOCATIONS
The near field monitoring plan consisted of 13 total monitoring locations in the north,
south, and east directions from Pier E3 with the measurements taken at depths of 20 feet
below the water surface, as shown in Figure 29. At three distances in the south line,
measurements were also planned at depths 2 feet above the mudline resulting in a total of
16 pressure sensor locations (see Figure 29). The south line was selected to be along the
line of the caged fish study out to a distance of 350 feet and to align with the far field
monitoring line. Recordings of the pressure signals were to be performed with high speed
devices on the east side barge. However, during preparation for the blast, it was
determined that measurements at further out distances of 250 and 350 feet were not
feasible because of recommendations by the sensor supplier on acceptable cable lengths
to minimize electronic background noise. Near field monitoring was triggered
electronically from the signal used to initiate the blast, and therefore, was time-
synchronized with the detonation sequence.
Figure 29. Near Field Monitoring Locations
For the implosion event, data was successfully acquired at five locations along the north
line and at one location in the east line. The south line lost power prior to the implosion
event, and no data could be collected. Along the north line, one monitoring location was
positioned within the BAS at approximately 24.5 feet from Pier E3. The other locations
along the north line were positioned at 74.5, 101, 126.5, and 153 feet from Pier E3 and
Chapter 5. Environmental Monitoring Methods
FINAL SFOBB Pier E3 Implosion Demonstration Project Report 61
outside the BAS, as shown in Figure 30. The successful measurement along the east line
was located within the BAS, approximately 23.5 feet from the pier. The two planned
locations outside the BAS along the east line were affected by flying debris and resulted
in contaminated data, which could not be used for analysis.
Figure 30. Deployed Near-Field Locations where Data was Collected during Pier E3 Implosion
5.2.7.2. FAR FIELD LOCATIONS
Far field monitoring was planned at 10 locations in the east, south, and southwest
directions, with the south and east lines measured at a logarithmic progression of 500,
1,000, 2,000, and 4,000 feet. The south line was selected to be a continuation of the south
near field line and to be in deeper water. The east line was selected to provide
comparable data to the south line, but in shallower water. It was of interest to examine the
sound propagation differences between the shallower and deeper water to determine if
significant differences occur as the remaining piers to the east are in shallower water.
Two locations in the southwest direction were planned at distances of 500 and 1,000 feet
that would complement the data at the same distances to the south and east. At the 500
feet locations, it was planned that the data would be taken from boats with the
instrumentation operated by hydroacoustic monitoring personnel. This plan was later
modified because of a requirement that a buffer zone of 1,500 feet surrounding Pier E3 be
maintained in which only personnel directly involved with the blasting were allowed. A
caged fish study was carried out by the Department within the near field and portions of
the far field monitoring range during the implosion to examine any impacts from the
Chapter 5. Environmental Monitoring Methods
FINAL SFOBB Pier E3 Implosion Demonstration Project Report 62
implosion on fish. The caged fish study was designed to run along the same transect as
the hydroacoustic monitoring lines. Obtaining data toward the end of the caged fish line,
located at approximately 820 feet from Pier E3, was also important. The 11 resultant
planned monitoring locations are shown in Figure 31. Because of the 1,500 feet buffer
limitation, it was determined that measurements at the closer distances would need to be
unattended for safety reasons.
Figure 31. Proposed and Deployed Locations of All Far Field Monitoring Points
For the implosion event, data was successfully captured at a total of seven locations in the
south and east directions shown in Figure 32. Because of the distances measured in the
far field, monitoring operations could only be triggered by the received acoustic signal.
The high speed recorders were programmed to trigger after a predetermined voltage
threshold was exceeded. Using a pre-trigger recording feature, the recorders did capture
the signal 0.8 seconds prior to the actual trigger point and continued to capture data for a
Chapter 5. Environmental Monitoring Methods
FINAL SFOBB Pier E3 Implosion Demonstration Project Report 63
Figure 32. Far-Field Deployed Locations where Data was Collected during Pier E3 Implosion
total of eight seconds. At all other far field positions, hydroacoustic signals were recorded
during the entire event, starting when the hydrophone was placed into position and
ending when the hydrophone was collected after the event. Along the east line, data was
measured at 500, 820, and 1,500 feet. Along the south line, data was measured at 500,
820, 1,500, and 4,000 feet. For these locations, all of the monitoring was conducted at
depths of 20 feet from the water surface or at mid-depth for shallower locations. Data for
three locations (southwest 820 feet, east 2,500 feet, and east 4,000 feet) are not available
as the recorders shutdown prior to the implosion after approximately 14 hours of
operation because of memory issues. At 2,500 feet in the south direction, the buoy
supporting the measurement recorder could not be found and was presumed to be struck
by a water craft operating in the area.
5.2.8. Instrumentation 5.2.8.1. NEAR FIELD MONITORING
Within the BAS where pressures from the implosion were highest, the rise time of the
pressure signals were very short and required high speed acquisition of data. To meet this
Chapter 5. Environmental Monitoring Methods
FINAL SFOBB Pier E3 Implosion Demonstration Project Report 64
requirement, PCB 138A05 high pressure transducers capable of measuring up to 5,000
psi were used. Outside the BAS at each near field location, PCB 138A01 pressure
transducers capable of measuring up to 1,000 psi were used to improve the measurement
resolution. These transducers were capable of capturing acoustic frequencies greater than
1,000,000 Hz. Because of the design of the pressure transducers, there is no method for
field calibration of either of these pressure transducers. For these pressure transducers,
the manufacturer supplied calibration was obtained within six months of the implosion.
The voltage signals proportional to pressure were recorded by an eight channel MREL
DataTrap II high speed recorder sampling at 1,000,000 S/s (one record per 0.001
milliseconds) per the Near Field Hydroacoustic Monitoring Plan. With the expected rapid
rise time of pressure from individual blasts in the implosion event, the sampling rate of
1,000,000 S/s was determined to be the appropriate for capturing the true peak pressures.
5.2.8.2. FAR FIELD MONITORING
500 Feet Locations
At both of the 500-foot monitoring locations, high speed Dash 8HF recorders were used
to capture the voltage signals proportional to pressure. These units provided a sampling
rate of 2,000,000 S/s. The input signals were measured using two methods. The first
consisted of a PCB 138A01 pressure transducer (as used in the near field monitoring
outside the BAS), which was powered by a PCB 482A22 signal conditioner with an
acoustic frequency response range greater than 1,000,000 Hz. The second signal was
produced by a Reson TC4013 hydrophone with an upper acoustic frequency range of
170,000 Hz. To avoid extraneous noise, the output of the hydrophone was passed through
a PCB 422E04 in-line charge converter limited to an upper acoustic frequency range of
100,000 Hz. This signal was then conditioned with a second channel of the PCB 482A22.
The output of each system was split and fed into two channels of the recorder set to two
different voltage ranges to capture an optimize signal. As the more distant monitoring
locations used hydrophones only, the 500-foot systems were used as a comparison point
between the high speed/high frequency pressure transducer system and the more
moderate speed hydrophone-based systems. The hydrophone systems are more sensitive,
provide less electronic noise floor issues, and are more suitable for the lower levels
estimated for the distant locations.
Because of the large number of samples generated at 2,000,000 samples per second, the
Dash recorder could not be left continuously collecting data without quickly filling its
memory. As a result, the Dash recorder was triggered by the incoming signal of blast
sequence. This trigger was armed when the unit was deployed about two hours prior to
the implosion. The Dash recorder did not have internal electrical power and had to be
Chapter 5. Environmental Monitoring Methods
FINAL SFOBB Pier E3 Implosion Demonstration Project Report 65
powered with heavy-duty batteries supplying 12-volt DC power to an inverter, which in
turn provided 110-volt AC power to the recorder. The signal conditioner was also
powered by external batteries. As a backup to the high speed recorder, a solid state
Roland R-05 audio recorder captured the hydrophone signal as well. The sampling rate
for this recorder was 96,000 samples per second. The input to this recorder was split at
the output of the signal condition with one signal going to the Dash recorder and one to
the Roland.
The complete recording systems with batteries were housed in 48-gallon, weather-
resistant plastic storage containers. For the two 500-foot positions, the recording systems
were placed in skiffs anchored at each location where previously deployed buoys marked
the position. After being transferred to the skiff, the separate pressure transducer and
hydrophone lines were lowered into the water with a weighted line to a depth of 20 feet
and attached to the skiff. This deployment method reduced any possibility of flow
induced vibration of the lines producing extraneous strumming sounds in the recordings.
Because the measurements occurred during slack tide, no additional measures were
necessary to reduce strumming effects. Then the high speed Dash recorder trigger was
armed, and the Roland solid state recorder was turned on to begin continuously recording
signals through the time of the blast.
820 Feet Locations
At the 820-foot locations to the south and east, unmanned rafts were deployed and
secured to an anchor line attached to a buoy about two hours prior to the implosion. For
the south position, a system identical to those at the 500-foot locations was placed into
the raft. Prior to the placing the raft into the water, the Dash recorder was installed,
powered, and armed. The raft was then placed into the water over the side of the boat
with some difficulty, and in the process, power to the recorder was lost. It was not
possible to confirm the status of the instrumentation after the raft was in the water.
However, the backup Roland recorder was not affected and produced usable data. For the
east location, the acquisition system consisted of only a Roland recorder with a Reson
TC4033 hydrophone, a PCB 422E13 charge converter, and a PCB 482A22 signal
conditioner. Compared to the TC4013, the TC4033 had more sensitivity but is limited to
a maximum acoustic frequency response of 140,000 Hz. Similar to the 500 feet positions,
the hydrophone lines were loosely attached to the raft and suspended down a separate
weighted line to a depth of 20 feet.
Chapter 5. Environmental Monitoring Methods
FINAL SFOBB Pier E3 Implosion Demonstration Project Report 66
1,500 Feet Locations
At 1,500 feet, attended monitoring systems in the south and east direction were deployed
from boats alongside buoys that were set out and positioned the afternoon before the
implosion. Two engineers with multiple years of experience in hydroacoustic monitoring
were on each boat. The data acquisition systems used were similar to those at the east 820
feet location, except that TC4013 hydrophones were used at these locations. The voltage
signals were also captured with Roland R-05 solid state recorders.
4,000 Feet Location
At 4,000 feet in south direction, an autonomous unit was deployed about one hour prior
to the implosion. This unit consisted of a TC4013 hydrophone, a PCB 422E13 charge
converter, and a PCB 480E09 signal conditioner all housed in a water-tight cylindrical
case about five inches in diameter and 12 inches long. The unit was guided down the
anchor and buoy using a separate, weighted line that was secured to the buoy. The
autonomous unit was positioned at a depth of 20 feet.
5.2.9. Data Processing 5.2.9.1. CALIBRATION
The various pieces of equipment used for measuring the implosion required different
calibration methods. For the PCB 138A05 and 138A01 pressure transducers, the
sensitivities supplied by the manufacturer were used to convert the measured voltages
into pressure versus time. The accuracy of the MREL DataTrap II and Dash 8HF
recorders were supplied by the sources of the recorders. For the TC4013 and TC4033
hydrophones, direct calibration was possible using a traceable pistonphone (calibrator).
For these hydrophones, a G.R.A.S. 42AC Pistonphone, high pressure, Class 1 was used.
This pistonphone was calibrated to produce a 165.3 dB sound pressure level at 250 Hz
when used with a G.R.A.S. RA0078 Calibration Coupler for the TC4013. When used
with G.R.A.S. RA0043 coupler, the pistonphone produces a level of 156.5 dB for the
TC4033. For systems using the Roland R-05 solid state recorder, the calibration tone was
directly recorded and used to determine hydrophone sensitivities for the complete
instrument chain. The resultant sensitivities are shown in Table 10.
Table 10. Summary of resultant sensitivities for each far field sensor Direction Distance Measurement Transducer Sampling Rate Sensitivity
East 500 feet PCB 2,000,000 S/s 5.208 mV/psi
Hydrophone 2,000,000 S/s 1.0436 x 10⁸ µPa/mV
Hydrophone 96,000 S/s 2.1656 x 10⁸ µPa/mV
820 feet Hydrophone 96,000 S/s 4.4046 x 10⁷ µPa/mV
1,500 feet Hydrophone 96,000 S/s 2.6334 x 10⁷ µPa/mV
South 500 feet PCB 2,000,000 S/s 5.005 mV/psi
Chapter 5. Environmental Monitoring Methods
FINAL SFOBB Pier E3 Implosion Demonstration Project Report 67
Hydrophone 2,000,000 S/s 1.0436 x 10⁸ µPa/mV
Hydrophone 96,000 S/s 3.7187 x 10⁸ µPa/mV
820 feet Hydrophone 96,000 S/s 2.8989 x 10⁷ µPa/mV
1,500 feet Hydrophone 96,000 S/s 3.1199 x 10⁷ µPa/mV
4,000 feet Hydrophone 96,000 S/s 2.8319 x 10⁷ µPa/mV
5.2.9.2. DATA CAPTURE
For far field measurements at 500 feet, data were recorded directly into high speed
recorders sampling at 2,000,000 samples/second. Also at 500 feet, signals were captured
by a Roland solid state audio recorder sampling at 96,000 samples/second. At the other
distances, the signals were captured by the Roland solid state recorders. The analog
signals from these recordings were played back into the high speed recorder and sampled
at 200,000 samples/second. Because the playback signals were analog, not digital, they
were sampled at a rate twice the playback rate to be certain that the fluctuations were
captured properly.
Dash 8HF-HS High Speed Recorder. At 500 feet in the east and south directions, a
Reson TC4013 hydrophone and a PCB 138 transducer measured underwater data that
was recorded in a Dash 8HF-HS high speed recorder at a rate of 2,000,000 S/s. Data from
both transducers were recorded in voltage units, and two voltage ranges were used for
both transducer types. For the hydrophone, input ranges on the Dash recorder were set to
1 and 10 Volts (V), while the input ranges for the PCB transducer were set to 0.1 and 1
V. This was done to ensure that the peak pressures were captured with both transducer
types. The Dash recorder was programmed to trigger automatically when the hydrophone
signal measured 0.05 V. Data was collected for eight seconds, with 800 milliseconds
being pre-trigger data so the entire blasting event was recorded.
Roland R-05 Solid State Recorder. Each far field measurement location included a
medium speed Roland R-05 solid state recorder with a maximum sampling rate of 96,000
S/s. At each location, either a Reson TC4013 or a Reson TC4033 hydrophone measured
underwater data that was recorded with a Roland solid state recorder. At the unattended
locations (i.e., 500, 820, and 4,000 feet), the Roland devices started recording at the time
the hydrophone was deployed and continued for up to 14 hours until the equipment was
collected following the blasting event. At the attended locations at 1,500 feet, the
recorders were manually started prior to the blast and stopped following the blast. During
post-processing, the audio recordings from the solid state devices were played into the
Dash 8HF-HS high speed recorder so analysis of the voltage outputs could be consistent
for all far field measurement locations. The Dash high speed recorder was programmed to
Chapter 5. Environmental Monitoring Methods
FINAL SFOBB Pier E3 Implosion Demonstration Project Report 68
record voltage at a sampling rate of 200,000 S/s; however, the hydrophone audio
recordings would remain limited to the maximum sampling rate of the Roland solid state
recorder (96,000 S/s).
5.2.10. Data Analysis
The near field data pressure signals were acquired and analyzed by Contract Drilling &
Blasting LLC (CDB) under the direction of Albert VanNiekerk, Ph.D. and Aimone-
Martin Associates LLC (AMA) under the direction of Dr. Cathy Aimone-Martin. The Far
Field data was acquired by Illingworth & Rodkin, Inc. under the direction of Paul
Donavan, Sc.D. As part of the quality assurance and quality control process, both teams
exchanged raw data and analyzed the other’s results with their data analysis procedures.
This resulted in consistent methods being applied through both data sets.
To compare with appropriate marine mammal and fish sound criteria, the implosion’s
pressure signals were reduced and analyzed to obtain peak pressure level, impulse, cSEL,
and RMS levels. The PCB transducers used at each near field location and at the 500-foot
far field locations were designed to capture the true peaks in signals with rapid rise times,
and as such, have excessive instrumentation noise. To eliminate this noise, each PCB
signal was filtered using a low pass filter to reduce the high frequency content not
because of the blasting event. Based on the signal, acoustic cutoff frequencies used for
the near field analysis ranged from 8,000 to 50,000 Hz. The 500-foot signals were filtered
with a cutoff frequency of 50,000 Hz. The hydrophone signals did not contain the high
frequency noise found with the PCB transducers and did not require filtering.
Spreadsheet Calculations. The high speed recordings (1,000,000 to 2,000,000 S/s) from
the near field and 500-foot far field locations were programmed to record up to eight
seconds of data during the implosion event. The near field time signatures were provided
in pressure units of psi in text format. The sampling rate of 1,000,000 S/s translated to
approximately 8 million lines of data at each location. The high speed far field time
signatures were exported in voltage units from the Dash 8HF-HS device in text format, as
well, with 16 million total lines for both 500-foot locations. After the medium speed
recordings (96,000 S/s) at the far field locations were scanned to isolate the implosion
and captured in the Dash device, the time signatures were also exported in voltage units
to text format. With the Dash device programmed to record at 200,000 S/s, the data set
for each far field location totaled 1.6 million lines. All text files were imported into
Microsoft Excel and converted into µPa using either 6.89 x 10⁹ µPa/psi for near field
measurements or the corresponding sensitivities shown in Table 10 for each far field
location.
Chapter 5. Environmental Monitoring Methods
FINAL SFOBB Pier E3 Implosion Demonstration Project Report 69
The pressure versus time signals from the near field and far field monitoring locations
were processed using the same algorithm to calculate the required metrics. The peak
pressure levels were determined by identifying the maximum pressure in each signal and
calculating the level as defined in Equation 1. For the PCB transducers, the other
quantities, as defined in Equations 2 through 8, were calculated using the numerical
equivalent of these equations.
Real-Time Analyzer Calculations. For signals captured with at 96,000 samples/second,
a Larson-Davis 3000 real-time analyzer (RTA) was used for some of the data processing.
This instrument can be directly calibrated from the calibration signals recorded using the
Roland solid state recorders and offers an improved dynamic range as the signals can be
amplified on playback. However, the sampling rate of the RTA is limited as it is designed
for the frequency range of human audibility. The RTA can directly capture and report the
cSEL value or, alternatively, it can report the average of the sound pressure level over a
time interval of 2.5 milliseconds. These average levels can also be summed using
Equation 5 to calculate. Both methods give identical results. As a result, the RTA can be
effectively used for determining cSEL values. This was verified by comparison to cSEL
values determined for the 500 feet hydrophone data recorded with both the high speed
and the Roland recorders. For the high speed recorder, the cSEL values were calculated
with the spreadsheet method described above and then compared to those from the RTA.
These compared to each other within 0.1 and 0.2 dB. As a result, the reported SEL
cumvalues were determined using the RTA. This method also provides the opportunity to
examine the frequency content in the acoustic frequency range from 25 to 20,000 Hz.
5.3. Caged Fish Study
To assess the potential effects of the blast on fish in the Bay, the Department opted to
conduct a Caged Fish Immediate Mortality and Injury Study (CFIMIS; Caged Fish
Study). Details of the cage design and construction and fish species used can be found in
the CFIMIS Study Plan (Caltrans 2015e) and are not repeated here. There were minor
changes to the location of some of the cages following the October 31 test and in
response to comments received from regulatory agencies up to close to the day of the
Blast. The largest change was in the location of the cages. Cages were not deployed at
distances of 100 and 125 feet, as called for in the CFIMIS Study Plan, because these
locations were both within the turbulence created by the bubble curtain. These cages were
deployed at 2,500 feet and 3,315 feet from Pier E3. The CFIMIS involved deployment of
caged fish along a line extending out into the Bay from Pier E3. Cages were positioned
along a surface poly rope line with buoys at 150, 200, 250, 350, 400, 500, 600, 700, 820
Chapter 5. Environmental Monitoring Methods
FINAL SFOBB Pier E3 Implosion Demonstration Project Report 70
feet due south of Pier E3. Cages also were deployed from anchored boats at 2,500, and
3,315 feet from the pier face. Distances were closely matched to hydrophone locations.
The caged fish buoy line was held in place by a crown buoy at each end, connected to a
2,500 pound deadman on the bottom. Late fall-run juvenile Chinook salmon
approximately 5 to 8 inches in length were used as test subjects. Fish were transported
from Coleman National Fish Hatchery and were acclimated to Bay water in a net pen
within Clipper Cove, 2 days before the implosion. Pre-loaded cages containing
approximately 40 fish were deployed about 1.5 hours before the implosion. Immediately
following the implosion, the cages were retrieved and transported back to Clipper Cove
to be processed. One additional cage was used as a control and was handled in exactly the
same manner as the deployed cages, but was retrieved from the Bay prior to the
implosion and was retained aboard the boat to avoid exposure to the pressure and sound
waves.
Each cage was inspected by two fishery biologists back at Clipper Cove. Test fish were
assessed as normal, impaired (unable to hold position in the water column, were
swimming erratically or were lying on the bottom of the cage), or dead (no evidence of
gill movement). All dead and impaired fish were removed from the cages and were
necropsied following the implosion using a pre-established protocol to score external and
internal injury. A subsample of 12 normal fish each from Cage 150, Cage 200, the
Control Cage and 12 fish from the non-deployed net pen control fish were also
necropsied. Each cage then had an associated number of normal, impaired and/or dead
fish relative to distance from Pier E3. All necropsied fish were scored for external and
internal injuries. All remaining live fish in each cage, which were classified as normal,
were tallied and then were released into the net pen.
5.3.1. Sonar Assessment and Trawl Sampling
The Department was issued ITP Major Amendment No. 4 by CDFW (ITP No. 2081-
2001-021-03, issued August 12, 2015) to include the authorized incidental take of listed
species during the Demonstration Project. The ITP includes coverage of the Pier E3
implosion activities and augments existing monitoring and mitigation requirements. Per
Section 3 (i) of the ITP, the Department was required to deploy sonar technology pre-
implosion to establish a background of fish assemblages in the area. In addition,
Section 3 (ii) stipulates that the Department was to conduct a series of oblique (mid-
water) and otter (deep water) trawls to assess potential project related mortality and
perform necropsies to help determine the cause of death. The following sections
summarize the findings from these activities.
Chapter 5. Environmental Monitoring Methods
FINAL SFOBB Pier E3 Implosion Demonstration Project Report 71
5.3.1.1. SONAR ASSESSMENT
To gain an understanding of fish distribution and assemblages present in the water
column surrounding Pier E3, the Department conducted a series of sonar surveys before
the implosion. The abundance and size of fish in the vicinity of Bay Bridge Pier E3 were
estimated using mobile hydroacoustic survey techniques (Brandt 1996; Rudstam et al.
2009; Simmonds and MacLennan 2005). Hydroacoustic sampling was performed on 29
and 30 October 2015 along four transects in areas north and south of Pier E3. The
surveys established the defined trawling areas north and south of Pier E3. In addition to
surveying the trawling area for debris that could possibly snag the trawls, the locations of
individual fish and large fish assemblages (schools) were recorded.
Sampling was conducted using a 70-kHz Simrad EK60 echosounder (Kongsberg
Maritime AS, Norway) with a 7.1° split-beam transducer. The transducer was mounted
downward-looking from a pole attached to the starboard side of the vessel and 0.5 m
below the surface. During data collection, the echosounder transmitted ten pings per
second with a pulse duration of 0.128 millisecond (ms). This pulse duration provided a
vertical resolution between individual echoes of approximately 10 cm. Latitude and
longitude coordinates were embedded directly into the raw acoustic files using the time-
stamped National Marine Electronics Association (NMEA) output from a handheld GPS
unit (Magellan eXplorist 310). The GPS unit was also used to maintain a vessel speed of
3 to 4.5 knots during data collection.
The echosounder system was calibrated in the field on 30 October using the standard
target method (Foote et al. 1987) with a 38.1 mm tungsten-carbide sphere as the reference
target. The target was suspended from a monofilament fishing line at a depth of
approximately 8 m until echoes were detected throughout the beam and in the center of
the beam (on axis). Gain levels were adjusted until measured target strength (TS) was
equal to the theoretical TS of the reference target and then applied to the raw data during
post-processing.
5.3.1.2. PRE-IMPLOSION TRAWLING
The Department used three trawling boats, two that were set up to tow otter trawls for
sampling benthic (bottom-dwelling species) and one vessel set up to conduct oblique
(mid-water) trawl for pelagic (open-water species).
Otter trawls were conducted from two 17 foot Boston Whalers. Each vessel towed an
otter trawl with a 16 foot headrope and 1 inch stretch mesh body and 0.5” woven mesh
cod end, with trawl doors that held the net open on the bottom to catch fish. Nets were
deployed with a 5:1 scope in 40-50 feet of water depth and were towed on the bottom for
Chapter 5. Environmental Monitoring Methods
FINAL SFOBB Pier E3 Implosion Demonstration Project Report 72
5 minutes per trawl at a speed of 1.5-2 knots, before being manually retrieved. After
completion of each trawl, the contents of the catch were placed immediately into large
tubs containing seawater and the boat was positioned for the next tow. While the net was
redeployed for the next tow, two people recorded, identified, and enumerated the fish
caught and separated the individuals into groups that were alive, dead, or moribund.
Tows were conducted sequentially with approximately 10 minutes between net retrieval
and redeployment at the next trawling location.
The midwater trawls were conducted off the R/V John Martin, which is a 56-foot
oceanographic and research vessel with an A-frame, winch, sonar, fluorometer, and
underway data acquisition system. The net had a 42-foot headrope and a 35-foot
footrope, with 1” stretch mesh throughout, grading to 3/8” at the cod end, with doors that
were sufficient to keep the net mouth open during towing. Midwater tows were
conducted as oblique trawl tows (with the net deployed from the surface to the bottom
and back up to the surface) and each tow lasted 10 minutes at a speed of 1.5-2 knots
using a 3:1 scope. After completion of each trawl, the contents of the catch were placed
immediately into large tubs containing seawater and the boat was positioned for the next
tow. While the net was redeployed for the next tow, two people recorded, identified, and
enumerated the fish caught and separated the individuals into groups that were alive,
dead, or moribund. Tows were conducted sequentially with approximately 10 minutes
between net retrieval and redeployment at the next trawling location.
The midwater and one otter trawler sampled north of Pier E3 and one otter trawl sampled
on the south side of Pier E3 (Figure 33).
5.3.1.3. POST-IMPLOSION TRAWLING
The Department used same three trawling boats, net rigs and stationing as for the pre-
implosion sampling. The sampling boats remained stationed outside the 1,500-foot
Marine Traffic Safety Zone (MTSZ), and then began trawling within the designated areas
north and south of the pier immediately following the implosion.
5.3.1.4. TRAWLING LOCATIONS
Trawling was conducted within the two previously identified trawling areas, located
north and south of Pier E3. The two trawling areas were located between approximately
2,500 and 4,000 feet from Pier E3 (corresponding to the modeled distances of the 187 dB
and 183 dB sound level thresholds for injury to fish). One area was located north of Pier
E3 and one area was located south of Pier E3. An overview of the trawling zones is
shown in Figure 33. Measured sound pressure levels, however, show the 187 dB cSEL
and 183 dB cSEL thresholds were at distances of 899 feet and 1,230 feet from Pier E3,
Chapter 5. Environmental Monitoring Methods
FINAL SFOBB Pier E3 Implosion Demonstration Project Report 73
Figure 33. Fishery Assessment Areas for Acoustic Surveys on October 29 and 30 and Trawl Tracks on October 31
Chapter 5. Environmental Monitoring Methods
FINAL SFOBB Pier E3 Implosion Demonstration Project Report 74
Figure 34. Fishery Assessment Areas for Acoustic Surveys on October 29 and 30 and Trawl Tracks on November 14
Chapter 5. Environmental Monitoring Methods
FINAL SFOBB Pier E3 Implosion Demonstration Project Report 75
respectively. Therefore, fish potentially exposed to these sound levels would not have
been captured in the trawls unless due to time and currents exposed fish had moved into
the trawling area.
5.3.1.5. TRAWLING DURATION
Recognizing that tidal currents in the project area could shift quickly and become strong,
the Department and CDFW had an understanding that a short window existed
surrounding the slack tide, when low-speed current conditions occurred. Therefore,
trawling was conducted between slack tide (or the implosion) up to approximately 1 hour
following the slack tide or the implosion. The trawling lasted approximately 70 minutes.
5.3.1.6. FISH PROCESSING
For each trawl, a record was kept of species and a count for all fish, distinguishing
between live, dead, and moribund fish. Moribund fish were identified by an inability to
maintain an upright orientation, particularly when the water was “swirled” in the tub or
new water was added. Live fish were identified by an ability to remain oriented in an
upright position. Live fish were identified, counted, and then were released immediately
back into the Bay. All fish of 7.8 inches fork-length or greater were measured before
release. After all live fish were returned to the Bay, dead and moribund fish were
counted, recorded, and then were returned to the Bay. Permit conditions required that any
collected and dead or moribund federally or State-protected species: salmonids, Longfin
Smelt, or Green Sturgeon, be retained and turned over their respective agencies, however
none of these fish species were collected. For non-listed species, up to 10 representative
individual fish per species were retained from each tow.
5.3.1.7. NECROPSIES
All fish retained from the trawl catches were preserved in 10 percent formalin for
necropsies, to assess external and internal damage. All retained fish were labeled “Bay
Bridge Implosion,” with the following information:
Trawl type (otter trawl or oblique trawl)
Date and tow start time (i.e., when net reached full scope),
GPS coordinates of both the start and stop locations of the trawl
Tow lane (1, 2, or 3)
Tow number
Species
Length
Disposition
Chapter 5. Environmental Monitoring Methods
FINAL SFOBB Pier E3 Implosion Demonstration Project Report 76
Preservative
Name of collector
Necropsies were conducted by qualified fisheries experts, to assess the effects of both the
sound and pressure waves on individual fish. Qualified individuals (with experience and
knowledge of fish morphology, including internal organ position, shape, color and
condition) assessed the fish for disease, parasite loads, general physical health, and
injury. In addition to the assessment of physiological damage, all individual fish
specimens retained were examined to confirm whether the injury/death resulted from the
implosion or from the trawling, handling, or another cause.
5.3.2. Bird Predation Monitoring
Bird predation is defined as birds attempting to prey or feed on other organisms.
Monitoring of predation activity consisted of counting bird strikes on the water surface. A
bird strike on the water surface was not counted as a fish kill or fish consumption.
Monitoring for bird predation was conducted in compliance with the terms and conditions
of NMFS 2015 supplemental BO for the project, and the Department’s Pier E3
Demonstration Project Biological Monitoring Programs. The purpose of the monitoring
was to observe and record any occurrence of birds exhibiting predation behavior
following the implosion of Pier E3. A congregation of birds striking the surface of the
water was assumed to be evidence of some level of fish mortality and/or injury because
of the underwater pressure wave generated by the implosion. However, monitoring or
counting bird strikes on the water surface does not provide a quantifiable level of the
magnitude of fish mortality. The monitors attempted to identify the species and size of
any affected fish through observation with binoculars and collect any fish found floating
at the water surface.
During the implosion work, one monitor tasked with recording bird strike data was
positioned on the bike path of the new eastern span of the Bay Bridge in a location that
afforded a clear view of Pier E3 and waters surrounding the pier. A boat with three
monitors was staged approximately 1,500 south of the pier prior to the implosion, and
was equipped with multiple nets and containers for storing collected fish. Of the three
monitors on the boat, one was dedicated to collected bird strike data, while the other two
were responsible for identifying and capturing impaired fish from the water. The boat
was allowed into the blast zone approximately 15 minutes following the blast.
In addition to the dedicated bird monitors there were other members of the entire team
that made observations.
Chapter 5. Environmental Monitoring Methods
FINAL SFOBB Pier E3 Implosion Demonstration Project Report 77
5.4. Bird Monitoring
Bird monitoring was conducted immediately before, during, and following the implosion
of Pier E3 in compliance with the Department’s SFOBB Project Pier E3 Demonstration
Project Biological Monitoring Programs (October 2015). As explained in Chapter 4, the
Department utilized avian deterrence measures and established a 500-foot Avian Watch
Zone to protect diving birds during the implosion of Pier E3. Because of sound’s
impedance at the air-water interface, it was concluded that impacts on birds would be
limited to any individuals submerged in this 500-foot zone during the implosion. The
following sections describe the avian monitoring that was conducted before, during, and
after the Pier E3 implosion. Protected diving bird species include the California least tern
and the California brown pelican.
5.4.1. Establishment of the Avian Watch Zone
To protect diving birds, the Department established a 500-foot Avian Watch Zone around
Pier E3 prior to the implosion. This 500-foot zone reflects the modeled distance to a
cSEL of 202 dB during the implosion (see Figure 35). In 2014, the Washington
Department of Transportation and USFWS established a regulatory threshold of 202 dB
cSEL for auditory injury and 208 dB cSEL for non-auditory injury thresholds during in-
water pile driving for marbled murrelets (WSDOT 2014). Use of the auditory injury
threshold (i.e., 202 dB cSEL) to avoid impacts on protected diving birds during the Pier
E3 implosion was designed to maintain consistency with past projects where measures
were taken to protected avian species.
5.4.2. Avian Deterrents
The Department used a combination of visual deterrents and hazing to encourage target
avian species to relocate from the 500-foot Avian Watch Zone prior to implementation of
the 1,500-foot MTSZ. A high-powered laser beam, operated by the avian monitor
stationed on the bicycle and pedestrian pathway on the new east span, was used to
visually deter birds. Per the Pier E3 Demonstration Project Biological Monitoring
Programs, the avian monitoring boat was to haze birds in the area immediately outside
the 500-foot Avian Watch Zone before the implementation of the MTSZ. However, on
the morning of the implosion, birds were not observed in this area prior to the
implementation of the MTSZ, and hazing was not necessary. The bird monitoring boat
staged 1,500 feet south of Pier E3 following implementation of the MTSZ to conduct
visual monitoring of birds in the vicinity of the Avian Watch Zone.
Propane-powered sound cannons were used to deter birds from the Avian Watch Zone
immediately prior to the implosion. Propane-powered sound cannons emit a short, loud
Chapter 5. Environmental Monitoring Methods
FINAL SFOBB Pier E3 Implosion Demonstration Project Report 78
Figure 35. Avian Watch Zone and Monitoring Locations
Chapter 5. Environmental Monitoring Methods
FINAL SFOBB Pier E3 Implosion Demonstration Project Report 79
shot and can cover areas up to 5 acres. These sound cannons were staged on the barges
supporting the air compressors for the Blast Attenuation System, located approximately
100 feet from Pier E3. The cannons were remotely triggered immediately prior to the
blast to discourage individuals from occupying the Avian Watch Zone. Cannon fire
immediately prior to the implosion ensured protected diving birds were cleared of the
Avian Watch Zone and did not enter the water at the moment of implosion.
5.4.3. Avian Monitoring Plan
Avian monitors were located on the bicycle and pedestrian path of the new east span and
on a boat to the south of Pier E3. Monitors observed and recorded all bird activity within
the Avian Watch Zone for bird activity prior to, during, and following the implosion of
Pier E3. The monitor in the bicycle and pedestrian path of the new east span was
designated as the lead avian monitor and communicated directly with the Lead Biological
Monitor. The following data was recorded:
start and end time;
monitoring location;
time of observation;
species and approximate number;
location of bird observed;
activity observed (e.g., flying through, foraging from the air, on water, diving,
foraging below surface)
Per the Pier E3 SFOBB Project Pier E3 Demonstration Project Biological Monitoring
Programs, if a protected (e.g., FESA, CESA, or CFGC-fully protected) bird(s) was
sighted, the monitors would observe its activity. If the bird(s) was in the air and traveling
from the watch zone, no further action would be necessary. If the bird(s) was sighted
diving into or foraging in the water column within the 500-foot watch zone, the monitor
would communicate this information to the lead avian monitor, who would then relay the
information to the Lead Biological Monitor. The implosion of Pier E3 would be delayed
until the protected species is no longer submerged in the water column within the watch
zone. Departure of an individual bird from the Avian Watch Zone would be documented
immediately and would be communicated to the Lead Biological Monitor.
If an injured or dead bird was sighted after the demolition blast event, the lead avian
monitor would notify the Lead Biological Monitor who will contact USFWS and CDFW
within 24 hours. Rescued or salvaged individuals would be transferred to a wildlife care
facility for rehabilitation and will be released or euthanized if required. USFWS and
Chapter 5. Environmental Monitoring Methods
FINAL SFOBB Pier E3 Implosion Demonstration Project Report 80
CDFW would have the authority to perform a necropsy on any captured bird to determine
whether the implosion was cause of the injury or death. In addition to the protocol above,
the following steps were followed prior to and/or during the implosion:
The avian monitoring plan was finalized in coordination with the licensed blaster, the
observation team, USFWS, CDFW, and the Department.
The avian monitoring crew consisted of a lead avian monitor located on the bicycle
and pedestrian path of the new east span, and three avian monitors staged in a boat to
the south of Pier E3. All observers had previous experience in observing/spotting
diving birds.
Avian monitoring began at least 1 hour before the scheduled start of the implosion to
identify the possible presence of diving birds. Monitoring during this period before
the implosion allowed observers to evaluate the potential risk to protected species.
Avian monitoring continued for 60 minutes after the implosion.
Observers followed the protocol established in the October 2015 SFOBB Project Pier
E3 Demonstration Project Biological Monitoring Programs and conducted the watch
in good faith and to the best of their abilities.
Per the October 2015 SFOBB Project Pier E3 Demonstration Project Biological
Monitoring Programs, avian deterrents were used prior to the implosion.
The implosion was weather-dependent. Climatic conditions had to be suitable for
viewing of avian species. The implosion would have been delayed if weather
conditions result in unsafe boat observations because of fog, wind, or heavy rain.
The lead avian monitor, with direction from the Lead Biological Monitor, was to
determine whether observation conditions were suitable before the start of the survey
for the implosion.
Implosion was limited to daylight hours for safety reasons and to allow for adequate
observation of the project area for diving birds.
5.5. Marine Mammal Monitoring
5.5.1. Establishment of Marine Mammal Exclusion and Behavioral
Response Zones
Before the implosion of Pier E3, a 1,160-foot (354 meter) Pacific harbor seal and
California sea lion exclusion zone (see footnote in Table 11), a 5,700-foot (1,737 meter)
Chapter 5. Environmental Monitoring Methods
FINAL SFOBB Pier E3 Implosion Demonstration Project Report 81
northern elephant seal exclusion zone, and a 26,500-foot (8,077 meter) harbor porpoise
exclusion zone was established (Table 11). The Marine Mammal Exclusion Zones
(MMEZs) included all areas where the underwater SPLs or SELs were anticipated to
equal or exceed the Level A threshold criteria for harbor seal and the TTS criteria for sea
lion, elephant seal, and harbor porpoise.
A 5,700-foot (1,737 meter) Level B Harassment—TTS monitoring zone was established
for harbor seals (Table 11). A 9,700-foot (2,957 meter) Level B Harassment—Behavioral
Response monitoring zone was established for pinnipeds (i.e., harbor seal, sea lion, and
elephant seal) (Table 11). A 44,500-foot (13,564 meter) Level B Harassment—
Behavioral Response monitoring zone was established for harbor porpoise (Table 11).
Table 11. Exclusion and Monitoring Zones
Species Exclusion Zone
Monitoring Zone
TTS Behavioral Response
Pacific harbor seal 1,160 feet
(354 meters) 5,700 feet (1,737 m)
9,700 feet (2,957 meters)
California sea lion* 1,160 feet
(354 meters) No TTS take was allowed.
Area was included in
Exclusion Zone
9,700 feet (2,957 meters)
Northern elephant seal 5,700 feet
(1,737 meters) 9,700 feet
(2,957 meters)
Harbor porpoise 26,500 feet
(8,077 meters) 44,500 feet
(13,564 meters)
Note: The IHA required a 470-foot (143 meter) exclusion zone and an 800-foot (244 meter) Level B Harassment—Behavioral Response monitoring zone for California sea lion. As these zones are in the near-field of the implosion, the Department elected to monitor a larger exclusion zone and Level B Harassment—Behavioral Response monitoring zone for this species. Source: NMFS 2015
5.5.2. Marine Mammal Observers
A minimum of 10 NMFS-approved marine mammal observers (MMOs) were required by
the IHA during the Pier E3 controlled implosion; however, the Department elected to
employ a minimum of 13 MMOs so that all of the MMEZs, Level B Harassment—TTS
and Behavioral Response zones were monitored. MMOs were positioned near the edge of
each of the pinniped threshold criteria zones and within the larger harbor porpoise
exclusion zone, using boats, barges, bridge piers, and roadway, as well as sites on YBI
and Treasure Island. One MMO was designated as the lead MMO and located on the new
bridge’s bike path and was in constant communication with the Lead Biological Monitor
who was physically with the Department Resident Engineer during the implosion. The
lead MMO received updates from the other MMOs on the presence or absence of marine
mammals within the MMEZs and notified the Lead Biological Monitor of cleared
MMEZs before the implosion.
Chapter 5. Environmental Monitoring Methods
FINAL SFOBB Pier E3 Implosion Demonstration Project Report 82
5.5.3. Monitoring Protocol
Implosion of Pier E3 was conducted when there was sufficient visibility to monitor for a
minimum of 30 minutes prior to the implosion. The implosion occurred during good
weather (i.e., clear skies and no high winds) so that the MMOs were able to detect marine
mammals within the MMEZs and beyond. As the time for the implosion approached, any
marine mammal sightings were discussed between the lead MMO, the Lead Biological
Monitor and the Department Resident Engineer. If any marine mammals had entered the
MMEZs within 30 minutes of blasting, the lead MMO would have notified the Lead
Biological Monitor and Resident Engineer that the implosion may need to be delayed.
The lead MMO would have kept them informed of the disposition of the animal. If the
animal remained in the MMEZs, blasting would have been delayed until it had left the
MMEZs. If the animal dove and was not seen again, blasting would have been delayed at
least 30 minutes from the time the animal was last sighted. After the implosion occurred,
the MMOs continued to monitor the area for at least 60 minutes.
Although any injury or mortality to marine mammals from the implosion of Pier E3 was
very unlikely, boat and shore surveys were conducted for 3 days following the event to
determine whether any injured or stranded marine mammals were in the area. If an
injured or dead animal was discovered during these surveys or by other means, the
NMFS-designated stranding team would be contacted to pick up the animal.
Veterinarians would treat the animal or conduct a necropsy to attempt to determine
whether it was stranded or injured by the Pier E3 implosion.
5.5.4. Data Collection
Each MMO recorded his/her observation position, start and end times of observations,
and weather conditions (e.g., sunny/cloudy, wind speed, fog, visibility). For each marine
mammal sighting, the following items were recorded, if possible:
1. Species
2. Number of animals (i.e., with or without pup/calf)
3. Age class (i.e., pup/calf, juvenile, adult)
4. Identifying marks or color (e.g., scars, red pelage, damaged dorsal fin)
5. Position relative to Pier E3 (i.e., distance and direction)
6. Movement (i.e., direction and relative speed)
Chapter 5. Environmental Monitoring Methods
FINAL SFOBB Pier E3 Implosion Demonstration Project Report 83
7. Behavior (e.g., logging [resting at the surface], swimming, spy-hopping [raising
above the water surface to view the area], foraging)
[Signs of injury, stress, or other unusual behavior also will be noted.]
8. Duration of sighting or times of multiple sightings of the same individual
5.5.5. Communication
All MMOs were equipped with mobile phones and/or radios. One person was designated
as the lead MMO and was in constant contact with the Lead Biological Monitor who was
with the Department Resident Engineer. The lead MMO coordinated marine mammal
sightings with the other MMOs. MMOs contacted the other MMOs when a sighting was
made within the MMEZs or near the MMEZs so that the MMOs within overlapping areas
of responsibility could continue to track the animal and the lead MMO was aware of the
animal. If the sighting was within 30 minutes of blasting and an animal had entered the
MMEZs or was near it, the lead MMO notified the Lead Biological Monitor and made
updates on the animal’s disposition and direction of travel.
5.5.6. Real-Time Acoustic Monitoring
Although harbor porpoises were not expected to be in the project area (within 44,500 feet
[13,564 meters] of the Behavioral Response zone) in November, real-time acoustic
monitoring to confirm species absence and active monitoring was performed by trained
observers. Harbor porpoises vocalize frequently with other animals in their group, and
they use echolocation to navigate and to locate prey. Therefore, real-time acoustic
monitoring can be used to detect this species as a supplement to visual monitoring.
Harbor porpoise generally are observed near the entrance to the Bay between the Golden
Gate Bridge, Tiburon, Angel Island, the north side of the west span of the Bay Bridge and
west side of Treasure Island. Two bio-acousticians performed real-time acoustic
monitoring within the 26,500-foot (8,077-meter)-radius harbor porpoise exclusion zone
north of the east span of the SFOBB. An MMO was also present on the acoustic
monitoring boat to perform visual monitoring. A high-frequency hydrophone, calibrated
to detect harbor porpoise, was towed from the monitoring boat. All acoustic monitoring
equipment was calibrated and tested before the implosion to check functionality.
Acoustic monitoring started just prior to sunrise on the morning of the implosion and
continued through the implosion and for at least 60 minutes following the implosion. The
acoustic monitoring boat transited slowly throughout the northern portion of the harbor
porpoise exclusion zone, north of the east span of the SFOBB. Acoustic and visual
monitoring efforts focused on deeper water areas north of Treasure Island, near the
Chapter 5. Environmental Monitoring Methods
FINAL SFOBB Pier E3 Implosion Demonstration Project Report 84
western edge of the harbor porpoise exclusion zone, because this is the most likely area
of the exclusion zone to be visited by a transiting harbor porpoise. The acoustic
monitoring equipment would not be able to give an accurate location for the detected
animals but would provide a relative distance and direction so that the MMOs could
search for the animals and determine whether those animals have entered or may enter
the exclusion zone. If a harbor porpoise was detected either through audible “clicks” or
visually before the implosion, the lead MMO would have been notified immediately. On
detection of clicks, the acoustic monitoring boat would travel in the direction of the
detected animal to confirm its location visually. If the animal was confirmed to be within
the exclusion zone, the lead MMO would notify the Lead Biological Monitor, who would
notify the Department Resident Engineer to delay the implosion. The animal would be
tracked and after outside the exclusion zone, the implosion would proceed as planned. If
the animal could not be visually located, the implosion would be delayed for 30 minutes
after the last click was detected.
5.5.7. Acoustic Deterrent Devices
Acoustic deterrent devices (ADDs) commonly are used in commercial fishing and at fish
farms to scare marine mammals away from nets or structures to prevent predation on fish,
but they have not been used during blasting to minimize impacts. These devices
supplemented the visual monitoring, to deter marine mammals from entering the MMEZs
before and during the implosion. The pulse of the ADDs had a frequency of 10 kHz, at
sound levels of approximately 130 dB with regular interpulse intervals of 4 seconds
(Airmar manufacturing specifications). The Airmar ADDs had an effective range of
approximately 300 feet (100 meters).
Marine mammals may habituate to ADDs over time, because nets or fish farms are a
regular source of food. It is likely that marine mammals, particularly harbor seals that are
resident to the Bay, have never encountered ADDs and therefore, the ADDs were an
effective deterrent for the short time they were used before detonation (up to 2 days prior
to the blast, for several hours each day). An ADD was attached to each demarcating
buoys to deter seals or sea lions from the 1,160-foot (354-meter) Level A and mortality
threshold areas. Two ADDs were suspended from Pier E2 of the new bridge, the closest
structure to Pier E3 and a common foraging location for harbor seals. ADDs were also
suspended from each boat carrying an MMO at the specified MMEZ, with the exception
of the boat used for the real-time acoustic monitoring for harbor porpoise to prevent
disruption to the hydroacoustic monitoring equipment.
Chapter 5. Environmental Monitoring Methods
FINAL SFOBB Pier E3 Implosion Demonstration Project Report 85
5.5.8. Stranding Plan
A stranding plan was prepared, in cooperation with the NMFS-designated marine
mammal stranding, rescue, and rehabilitation center for central California. Although
avoidance and minimization measures were likely to prevent any injuries from the
implosion, preparations were made in the unlikely event that marine mammals were
injured. In addition, it would be necessary to determine the cause of stranding for any
marine mammals that appear within 3 days after the implosion. Sick, injured, or dead
marine mammals often strand in the Bay because of the large number of marine
mammals, primarily pinnipeds, which inhabit or regularly use the Bay. Therefore, sick or
injured individuals observed after the implosion would need to be examined more
thoroughly to determine the cause of the stranding.
Elements of the stranding plan included the following:
1 A stranding center crew and a veterinarian was on call near the Pier E3 site at the
time of the implosion to quickly recover any injured marine mammals, provide
emergency veterinary care, stabilize the animal’s condition, and transport individuals
to the stranding facility. If an injured or dead animal was found, NMFS (both the
regional office and headquarters) would have been notified immediately, even if the
animal appeared to be sick or injured from a cause other than the implosion.
2 The stranding center crew would prepare treatment areas at the facility for cetaceans
or pinnipeds that may be injured by the implosion. Preparation would include
equipment to treat lung injuries, auditory testing equipment, dry and wet caged areas
to hold animals, and operating rooms if surgical procedures were necessary. The
stranding center regularly treats sick and injured marine mammals, so all of the
facilities and equipment were ready at all times. Equipment to conduct auditory
brainstem response hearing testing will be available to determine whether any inner
ear threshold shifts (TTS or PTS) had occurred (Thorson et al. 1999).
3 Any veterinarian procedures, euthanasia, rehabilitation decisions and time of release
or disposition of the animal would be at the discretion of the stranding center staff
and the veterinarians treating the animals. Any necropsies to determine whether the
injuries or death of an animal was the result of the implosion or other anthropogenic
or natural causes would be conducted at the stranding center by the crew and
veterinarians. The results would be communicated to the Department and NMFS as
soon as possible, followed by a written report within a month.
Chapter 5. Environmental Monitoring Methods
FINAL SFOBB Pier E3 Implosion Demonstration Project Report 86
4 Post-implosion surveys were conducted immediately after the event and over the
following three days to determine whether any injured or perished marine mammals
were in the area.
A stranding team from the Marine Mammal Center of Sausalito, California, consisted of
a veterinarian and two volunteers. The team was stationed at a nearby berth on the
morning of the implosion and was dispatched for a post-blast survey approximately 2
hours following the blast.
5.6. Airborne Noise Monitoring
Airborne noise monitors were stationed on the bike path of the self-anchored suspension
span of the Bay Bridge approximately 500 feet (approximately 150 meters) from Pier E3
and approximately 180 feet (55 meters) above the bay water surface. The traffic on the
adjacent bridge was 40 -170 feet (12 to 51 meters) from the monitors. Several key project
personnel, including the blaster in charge, were located directly below this location on
Pier E2 of the new bridge.
The blast was not loud enough to cause physical discomfort to anyone at either location
and no one reported any discomfort with the level of noise produced by the demolition.
Hand held decibel meters were deployed by the monitor on the bike path above. The
meters were in direct line of sight and significantly closer to the blast than traffic on the
new bridge. Traffic was shielded from the noise by the new bridge and the vehicles they
occupied. Recorded sound level readings are shown below in Table 12. The reading of
light traffic prior to the blast varied between 72.2 dB and 81 dB. Readings during the
actual sequenced implosion varied between 96.4 dB and 104.8 dB. Common
environmental noises of this magnitude are experienced by the operator of a lawn mower,
chainsaw, small motorcycle or snowmobile.
Table 12. Recorded sound levels.
Chapter 6. Implosion Results and Impacts
FINAL SFOBB Pier E3 Implosion Demonstration Project Report 87
Chapter 6. Implosion Results and Impacts
6.1. Subsurface Sonar Scan
Hydrographic surveys of the bay floor in the vicinity of Pier E3 were performed several
times including: prior to demolition, immediately after the controlled implosion of Pier
E3, and after cleanup of blast related equipment and accessible concrete debris. The final
surveys are shown in Figures 36 through 38. Each image shows the bathymetry of Pier
E3 and the surrounding bay floor in elevations referenced to the National Geodetic
Datum of 1929. In each image, elevations are represented by colors which transition as
indicated on the legend strip on the right side, from red through green, to dark blue and
black (shallow to deep). Five foot interval contour lines are included on the images to
assist in reading the color transitions.
Survey Methods
Hydrographic surveys were conducted by boat using a multibeam sonar system and a
global positioning system (GPS). Software packages were used to calibrate, collect, and
process the survey datasets.
Surveys were conducted by eTrac Incorporated. The survey vessel “S/V Taku” was used
for the data acquisition. An R2Sonic 2024 Multibeam Sonar was used to acquire
sounding data. Positions were acquired using an Applanix POSMV Wavemaster GPS
with combined inertial positioning and motion reference. The acquisition hardware was
interfaced with a QPS Qinsy Multibeam software package. Sound velocity corrections
were obtained with an AML sound velocity profiler and applied to the MBES data in real
time.
Processing was performed using the QPS Qinsy and Qloud software packages and
Hypack. Final images were created in Autocad Civil3D, Qloud and Global Mapper 16.0.
Post-implosion surveys were performed several times each day for multiple days leading
up to the final survey of the area. Construction operations were directed with real-time
acquisition and analysis of the data. Maximum coverage was targeted in an effort to
ensonify all possible obstructions and structures in the area surveyed. Times of best GPS
and GLONASS constellation geometry were planned to perform the highest under-
structure accuracy survey work in the field. The Applanix POSMV inertial positioning
system was used for under bridge data collection, which was attained even with decrease
or loss of satellite coverage.
Chapter 6. Implosion Results and Impacts
FINAL SFOBB Pier E3 Implosion Demonstration Project Report 88
Passes were made by the survey vessel at slow, consistent speeds with minimum steering
corrections following established perpendicular transects to allow the system to most
effectively use the inertial inputs from the gyro to capture data.
Survey Results
Figure 36 shows the results of the pre-demolition survey conducted on August 7, 2015.
This image shows the Pier E3 in place with buttress walls on two sides.
Figure 36. Pier E3 Pre-Implosion, August 7, 2015
Figure 37 shows the results of the post demolition survey conducted on November 14,
2015. This image shows the deep depression into which demolished Pier E3 collapsed
after the implosion and the associated rubble and blast equipment that necessitated
cleanup. A reddish orange area protruding above the -45 contour on the south end of the
caisson was noted as an area that would require management. Other high spots occurred
around the perimeter of the caisson. Some of these were portions of the corners of pier
buttress walls that remained in place. These remnants ranged in height from
approximately three to six feet and were mechanically removed during the final site
cleanup.
Chapter 6. Implosion Results and Impacts
FINAL SFOBB Pier E3 Implosion Demonstration Project Report 89
Figure 37. Pier E3 Site after Implosion, November 14, 2015
Figure 38 shows the results after the final clean up. This survey was conducted on
December 10, 2015. This image shows the condition of the site after all blasting
equipment had been retrieved. Several beams found near Pier E3, likely discarded during
construction of the original east span in the 1930s, were moved out of the way of the
BAS frames prior to the blast to the northwest and southeast of Pier E3 were removed
pursuant to regulatory agency requirements. All concrete demolition was completed to
below the pre-construction surrounding low scour line. The debris that fell outside the
caisson was dredged up with a clamshell bucket and placed inside the caisson as planned.
There are still pits that remain inside the caisson that extend to approximately 70 feet
deep, as indicated by the green and dark blue areas on Image 3. Contours of the scoured
area surrounding Pier E3 have been restored to a condition similar to the pre-demolition
condition as planned. The scoured area around Pier E3 is anticipated to silt up to meet the
elevation of the surrounding area to an approximate depth of less than 45 feet, burying
the caisson remains to a depth of over five feet.
Chapter 6. Implosion Results and Impacts
FINAL SFOBB Pier E3 Implosion Demonstration Project Report 90
Figure 38. Pier E3 Site after Completion of Cleanup Activities, December 10, 2015
Debris Cleanup
Cleanup activities were initiated on November 14, 2015, immediately following the
implosion of Pier E3. A post-blast hydrographic survey was conducted on November 14,
2014, to locate blast related equipment, assess the success of removal of the upper
caisson of Pier E3 by implosion and to determine the amount of rubble that would need to
be managed. The blast related equipment to be retrieved included the BAS frames, steel
blast mats, steel cables, and I-beams. Divers were dispatched to confirm items identified
in the hydrographic survey. Most implosion-related materials were removed from the Bay
with a clamshell bucket mounted on a barge-based derrick crane.
The post-implosion hydrographic survey showed areas of the Pier E3 caisson that had
significant void space, as well as areas where debris had mounded above the planned
limits of demolition. In particular, the hydrographic survey results showed debris
mounded at the southern edge of the caisson. The crane-mounted clamshell bucket was
used to tamp down mounded debris and re-distribute it into the voids of the remaining
lower caisson. Large debris that fell outside the caisson and onto the Bay floor were
dredged up with the clamshell bucket and placed into the voids of the lower caisson.
Following the initial cleanup of the imploded remains of Pier E3, there were nine areas
associated with the pier’s remaining structure that protruded above the -51-foot removal
limit. These included portions of six buttress walls, a portion of the caisson wall, a debris
pile, and a rebar cluster. Similar to the operation above, a clamshell bucket was used to
Chapter 6. Implosion Results and Impacts
FINAL SFOBB Pier E3 Implosion Demonstration Project Report 91
tamp down and dredge up protruding debris and re-distribute it into the voids of the
remaining lower caisson.
All of the Pier E3 implosion cleanup activities were completed on December 10, 2015.
Overall, approximately 13 percent of the rubble generated from the implosion of Pier E3
landed outside the footprint of the pier.
6.2. Hydroacoustic/Underwater Pressure Monitoring and BAS Effectiveness
6.2.1. Sound Pressure Level vs. Time
Sound pressures were measured at six near field positions: one along the east line at 23.5
feet; and five along the north line at 24.5, 74.5, 101, 126.5, and 153 feet (see Figure 30).
Hydroacoustic data was taken at seven far field positions: three along the east line at 500,
820, and 1,500 feet; and four along the south line at 500, 820, 1,500, and 4,000 feet (see
Figures 39 and 40). All of the monitoring was done at a depth of 20 feet. Figures 39 and 40
show the time histories for the far field measurement locations along the east and south
lines, respectively. Because of the number of data points captured with the 2,000,000 S/s
and 200,000 S/s sampling rates, the results shown in Figures 39 and 40 were sampled at
100,000 S/s. Comparison of the peak sound pressure levels calculated with the 200,000 S/s
and 100,000 S/s sampling rates resulted in negligible differences no greater than 0.3 dB.
Therefore, the time histories shown in the figures for far field locations at 820 feet and
beyond would be identical for the 200,000 S/s. At 500 feet, the peak sound pressure level is
lower than it would be with the 2,000,000 S/s sampling. The time for each figure is relative
to the recordings and does not directly correlate to the timing of the blast event. Each
recording was lined up starting at the time the first indication of the blast occurred.
In the east direction (Figure 39), the two highest peaks are located close together just prior
to the one second mark occurring about 0.5 seconds after the initiation of the recording.
These peak pressure levels were over 10 dB higher than any other peaks measured during
the event. Aside from these two peaks, the other highest peaks in the first 4 seconds of the
blast were typically between 190 and 199 dB. As noted in Table 3, the calculated peak
sound pressure levels for the 588 individual charge weights cover a range of only about 2
dB relative to each other. The results shown in Figure 39 indicate that circumstances other
than charge weight differences created the two high peak levels occurring around 0.5
seconds into the implosion event.
In the south direction (Figure 40), the highest peaks in the first two seconds are somewhat
more consistent than in the east direction.
Chapter 6. Implosion Results and Impacts
FINAL SFOBB Pier E3 Implosion Demonstration Project Report 92
Figure 39. Far Field Time Histories along the East Line
Note: Far field time histories along the south line at 500, 820, 1,500, and 4,000 feet, sampled at 100,000 S/s.
Figure 40. Far Field Time Histories along the South Line
Chapter 6. Implosion Results and Impacts
FINAL SFOBB Pier E3 Implosion Demonstration Project Report 93
From the highest peak occurring about 0.5 seconds into the event, the peaks tend to
decrease in amplitude with time. For the blast plan, as shown in Figure 16, this is
expected as the blasting moves south to north, and the distance from the blasts to the
monitoring locations increases. For the east direction (Figure 39), the blasts continue
down the length of the pier at a similar distance from the monitoring locations. For the
south direction, it is particularly apparent that the “peaky-ness” of the sound pressure
levels generally decreases with increased distance from the blasts. This can be seen by
considering the peak that occurs at a time of approximately about 1,500 milliseconds, as
shown in Figure 40. At the distances of 500 and 820 feet, the peak is much higher in level
than the surrounding levels by about 20 dB. At 1,500 and 4,000 feet, this same peak is
only about 10 dB greater than the surrounding levels. An interesting exception to this is
the peak that occurs at the 1,000-millisecond grid line. In this case, the peak at 4,000 feet
remains quite “sharp” and is about 20 dB higher than the surrounding data.
6.2.1.1. CUMULATIVE SEL VS. TIME
The cSEL was calculated numerically for the 2,000,000 S/s PCB in the near field and at
500 feet. In the far field and 500 feet, cSEL was determined using the RTA for the
hydrophone data sampled at the rate of 96,000 S/s. At the overlapping positions at 500
feet, the cSEL determined with the pressure transducers and the hydrophones were within
2 dB of each other. Because the cSEL calculated numerically for the PCB and with the
RTA for the hydrophone differed only by these small amounts at the 500 feet locations, it
was determined that the energy accumulated over the entire blasting event was captured
adequately with the slower sampling rate. Unlike peak sound pressure level, the cSEL
values are not as sensitive to sampling rate at the closer monitoring locations.
Differences in the progression of the blasts noted for Figures 39 and 40 are also apparent
in plots of the cSEL versus time. For the cSEL in the east direction, as shown in Figure
41, the two large peaks shown in Figure 39 have a major effect in determining the
ultimate cSEL value for the 500-foot monitoring distance. These peaks define a rise in
cSEL of about 12 dB in a short time, starting at about 1,600 milliseconds, as shown in
Figure 41. After these two peaks, the cSEL versus time curve flattens, increasing only
about 1.5 dB in the remainder of the implosion event. For the further distances, the rise is
not as pronounced, and the cSEL continues to build over the duration of the event,
increasing by about 3.5 dB and 4 dB for the 820 and 1,500 feet distances, respectively.
For the 820 feet cSEL, the final value actually exceeds the 500-foot result, as the more
uniform peaks after about 2,300 milliseconds continue to increase the accumulated cSEL.
The effect of more uniform peaks is also seen at the 1,500-foot location, although the
cSEL remains lower than the other two distances. The cSEL versus time in the south
Chapter 6. Implosion Results and Impacts
FINAL SFOBB Pier E3 Implosion Demonstration Project Report 94
direction is shown in Figure 42. In this direction, the build-up of energy is slightly more
gradual than in the east direction, as would be expected from Figures 39 and 40. Because
of the general decrease in peak sound pressure level as the implosion progresses, there is
little increase in cSEL after about the 2,000-millisecond mark. However, these data do
indicate that the individual peak levels near the beginning of the event contribute to the
cSEL during the buildup of energy more in a step-wise fashion occurring before the
1,500-millisecond mark. Unlike the east direction, the cSEL in the south direction
determined at 500 feet was approximately 5 dB greater than the cSEL at 820 feet.
Figure 41. Far Field cSEL along the East Line at 500, 820, and 1,500 Feet
Chapter 6. Implosion Results and Impacts
FINAL SFOBB Pier E3 Implosion Demonstration Project Report 95
Figure 42. Far Field cSEL along the South Line at 500, 820, 1,500, and 4,000 Feet
The difference between the 820 and 1,500 feet cSEL was about the same in the east and
south direction. Using the RTA, the frequency content of the cSEL can also be compared
for the different distances and between the east and south directions. cSEL for the three
distances in the east direction are compared in Figure 43 for one-third octave acoustic
frequency bands from 25 to 20,000 Hz. For these data, the spectra for all three distances
are dominated by the energy below 1,000 to 2,500 Hz acoustic frequency range. The
lower acoustic frequency content is noted to increase with distance, implying that the
higher frequency energy attenuates more rapidly with distance. A similar plot for the
south direction is shown in Figure 44. For the 500, 820, and 1,500 feet distances, the
spectra are again dominated by lower acoustic frequencies, less than about 3,150 Hz. The
spectrum for the 4,000-foot position is more complex. For both directions, there is a
noticeable dip in the 1,500-foot spectrum beginning at 1,250 Hz and extending higher to
about 4,000 Hz. At 4,000 feet in the south direction, a dip is seen at even lower acoustic
frequencies, from about 125 to 800 Hz, and another dip is apparent between 1,250 and
6,300 Hz. These behaviors may be because of interference effects created by the surface
release wave discussed in conjunction with those shown in Figure 19.
Chapter 6. Implosion Results and Impacts
FINAL SFOBB Pier E3 Implosion Demonstration Project Report 96
Figure 43. One-Third Octave band Levels for cSEL at the Far Field Monitoring Locations to the East
Chapter 6. Implosion Results and Impacts
FINAL SFOBB Pier E3 Implosion Demonstration Project Report 97
Figure 44. One-Third Octave Band Levels for cSEL at the Far Field Monitoring Locations to the South
6.2.2. Near Field Peak Pressures, Data Filtering and BAS
Near field data obtained was analyzed first to determine peak pressures, assess data
quality, and evaluate the performance of the BAS. The PCB pressure sensors have an
inherent amount of high-frequency electronic noise and hence the pressure records
required post-process filtering. Careful consideration was given in selecting a low-pass
filter to remove the high-frequency noise without removing key signatures of the true
pressure amplitude.
For sensors inside the BAS (Figure 45) and outside the BAS, pressure shock fronts were
steep and included a very fast rise in amplitude. As such, a higher frequency filter was
selected. Figure 46 shows an example of this at location E1 where a 50,000 Hz low-pass
filter was chosen. The background noise is shown on the left and is not completely
removed by this filter frequency. The peak is enlarged on the right and shows that the
sharp rise in pressure is maintained with this filter choice.
Chapter 6. Implosion Results and Impacts
FINAL SFOBB Pier E3 Implosion Demonstration Project Report 98
Note: Distances from the pier are noted in feet.
Figure 45. Near Field Pressure Sensor Deployment Locations
Note: Example of filtering near to the pier where a higher filter was selected; noise is enlarged on the left and the peak is enlarged on the right.
Figure 46. Example of Filtering near the Pier
At distances just beyond the BAS, the peak pressure did not rise as quickly and exhibited
lower frequency content. Therefore, a lower frequency filter was used to remove noise
Chapter 6. Implosion Results and Impacts
FINAL SFOBB Pier E3 Implosion Demonstration Project Report 99
without degrading the actual peak pressure. This is shown in Figure 47 for location N4
where an 8,000 Hz low-pass filter was used. The noise is shown on the left and is mostly
removed by this filter choice. The peak is enlarged on the right showing that the pressure
rise is matched in the filtered waveform and the peak amplitude is not degraded.
Note: Example of filtering farther from the pier, where lower filter is chosen; noise is enlarged on the left and the peak is enlarged on the right.
Figure 47. Example of Filtering farther from the Pier
6.2.2.2. NORTH LINE MEASUREMENTS OUTSIDE THE BAS
Pressures for near field sensors along the north line were reviewed to determine the peak
values and the times at which the peaks occurred. It was determined that peaks occurred
at each sensor location over a range of arrival times that could be correlated with
detonation times of charges located close to the array (e.g., at the north end of the pier in
the direction of detonation).
Figures 47, 49 and 50 show the whole waveform records at locations N1 (inside the
BAS), N3, and N5, respectively. In each figure, specific peaks of interest are identified as
Peak 1 and Peak 2. When tracking Peak 1 as a function of distance at sensor locations,
the amplitude attenuated as expected. However, Peak 2 increased in amplitude with
Chapter 6. Implosion Results and Impacts
FINAL SFOBB Pier E3 Implosion Demonstration Project Report 100
distance beyond the BAS. Subsequently, the maximum pressure at N1 occurred in Peak
1, while Peak 2 provided the highest pressure at the farther locations. Figures 51 and 52
show time histories for Peaks 1 and 2 at increasing distances from the Pier to illustrate
this effect.
While the amplitude behavior of Peak 2 was not expected, it can be explained based on
the wave propagation complexities arising from the nature of the Pier structure and
interactions of a large number of small detonating charges. In essence, the void spaces
within the concrete Pier created complex wave travel paths and interactions, resulting in
constructive as well as destructive interference of peaks. The additive effect of Peak 2
with distance was enhanced as the sequence of shot moved to the north. In addition, the
BAS disrupted the shock front and created pressure time histories with later arriving
peaks that increased with distance rather than decreased with distance outside the bubble
curtain. Although the effectiveness of the bubble curtain can be evaluated, the passage of
the first shock front most likely disturbed the bubbles to allow a certain amount of blast
energy to pass and created an additive effect at later arriving peaks. Such an effect can
help explain data scatter in the attenuation model.
Figure 48. Pressure Time History of the Entire Blast at Location N1 inside the BAS, with Peaks 1 and 2 Highlighted
Chapter 6. Implosion Results and Impacts
FINAL SFOBB Pier E3 Implosion Demonstration Project Report 101
Figure 49. Pressure Time History of Peaks 1 and 2 at Location N3, outside the BAS
Chapter 6. Implosion Results and Impacts
FINAL SFOBB Pier E3 Implosion Demonstration Project Report 102
Figure 50. Pressure Time History of Peaks 1 and 2 at Location N5
Figure 51. Attenuation of Peak 1 Pressure with Distance outside the BAS
Chapter 6. Implosion Results and Impacts
FINAL SFOBB Pier E3 Implosion Demonstration Project Report 103
Figure 52. Increase of Peak 2 Pressure with Distance outside the BAS
6.2.2.3. BAS EFFECTIVENESS: COMPUTING THE REDUCTION IN PRESSURE FROM THE
BAS
The efficiency of the BAS in terms of percent reduction of the blast pressure from inside
the bubble curtain to outside was performed. Calculations of this reduction were
performed for a number of scenarios based on the cross-section geometry of the bubble
curtain shown in Figure 53. The BAS centerline (CL) distance from the Pier and width of
bubbles at the surface, d, were the two key parameters. From these two parameters, the
locations of the inside pressure, P1, and exiting pressure, P2, at the sensor depth of 20 ft
could be determined. Because the BAS is a dynamic phenomenon whose bubble strength
varies in time and location around the Pier, a range of possible distances between the Pier
and BAS centerline (Dcl) and bubble curtain widths (d) were considered. Careful review
of Demonstration Project as-built plans, and photographs and videos of the operating
BAS from multiple angles resulted in eight total scenarios with specific centerline
distances and widths given in Table 13 used to calculate the BAS efficiency.
Chapter 6. Implosion Results and Impacts
FINAL SFOBB Pier E3 Implosion Demonstration Project Report 104
Figure 53. Cross-Section of BAS Bubble Curtain with Relevant Geometric Relations
Table 13. BAS geometry scenarios used for efficiency calculations
Scenario
Distance from Pier to bubble curtain center
Bubble curtain width at surface
(feet) (feet)
1a 38 25
1b 40 25
1c 42 25
1d 44 25
2a 38 30
2b 40 30
2c 42 30
2d 44 30
The attenuation relationship established for the Pier was used to calculate pressures P1
and P2 at their respective scaled distances. The attenuation was assumed to have the same
Chapter 6. Implosion Results and Impacts
FINAL SFOBB Pier E3 Implosion Demonstration Project Report 105
slope inside the BAS passing through the pressure measurement data points at E1 (713.5
psi) and N1 (653.3 psi). Figures 54 and 55 visually show this for two possible scenarios
along with the calculated pressures at P1 and P2 and the resulting efficiency computed as
percent reduction in pressure from P1. Scenario 2a, shown in Figure 53, resulted in the
highest calculated pressure reduction of 79 percent, while scenario 1d, shown in Figure
54, gave the lowest reduction at 75 percent. Table 14 summarizes the calculated
efficiency for all eight scenarios. The overall average pressure reduction across the BAS
was computed as 77 percent using all likely bubble curtain geometries and positions.
Note: Reduction of blast water pressure by BAS bubble curtain with geometry scenario 2a; calculated pressures are shown at locations P1 and P2, along with calculated percent reduction in pressure across the BAS.
Figure 54. Reduction of Blast Water Pressure by BAS Bubble Curtain with Geometry Scenario 2a
Chapter 6. Implosion Results and Impacts
FINAL SFOBB Pier E3 Implosion Demonstration Project Report 106
Figure 55. Reduction of Blast Water Pressure across the BAS Bubble Curtain for Geometry Scenario 1d
Table 14. Summary of calculated BAS efficiencies for all geometry scenarios; overall average efficiency
Scenario
Distance from pier to
bubble curtain center
Bubble curtain width at surface
Estimated bubble curtain
width at 20ft depth of
Overpressure at edges of bubble Calculated BAS
efficiency (P1-
P2)/P1*100%
Overall average BAS efficiency for all scenarios
(ft) (ft) (ft) Inside (P1) (psi)
Outside (P2) (psi)
1a 38 25 17.4 550 127 76.9%
77.0%
1b 40 25 17.4 509 121 76.2%
1c 42 25 17.4 473 116 75.6%
1d 44 25 17.4 441 110 75.0%
2a 38 30 20.4 585 123 79.0%
2b 40 30 20.4 539 117 78.3%
2c 42 30 20.4 499 112 77.6%
2d 44 30 20.4 465 107 77.0%
Chapter 6. Implosion Results and Impacts
FINAL SFOBB Pier E3 Implosion Demonstration Project Report 107
6.2.3. Results Related to Fish Criteria
The peak pressure levels and cSEL values for all of the monitoring locations are shown in
Figure 56 along with the corresponding fish criteria. As discussed in Section 5.2, the
measured peak pressure levels fall on or above the calculated curve. For cSEL, the
measured levels fall on or below the calculated curve except at one near field
measurement location.
Figure 56. Measured and Calculated Peak Pressure Level and Cumulative Sound Exposure Level Results with Indicated Fall-Off Rates
Also, Figure 56 shows the fall-off rates for the measurement trend lines and calculated
curves. These are in the form of yy Log (x) where x is the distance to the receiver
location and yy is rate at which the level decreases with the logarithm of distance; the
higher the yy values, the faster the levels decrease with distance. The fall-off rate for the
measured Lpk was approximately 23.9 times the logarithm of distance while the
calculated rate was 22.6. As a result, even though measured peak is higher than the
calculated out to 4,000 feet, at further distances, the measured values would be less than
the calculated. For cSEL, fall-off rate for the measurements was approximately 28.4
compared to 20.9 for the calculated. As a result, even though the measured and calculated
Chapter 6. Implosion Results and Impacts
FINAL SFOBB Pier E3 Implosion Demonstration Project Report 108
levels were close in level out to about 200 feet, at farther distances they separate because
of the greater fall-off rate of the measure values. At 500 feet the measured cSEL was
about 5 dB below the calculated and at 4,000 feet this difference dropped to about 15 dB.
The RMS sound pressure level results are shown in Figure 57 along with the calculated
level, RMS criterion, and trend line of the measured data. Similar to the cSEL results, the
fall-off rate of the measured RMS levels is greater than the calculated rate, and the
measured levels are below the calculated for 500 feet and beyond. The calculated and
measured fall-off rate is the same as the corresponding rate of the cSEL (see Figure 55).
The calculated and measured distances to the peak, cSEL, and RMS levels are shown in
the Table 15.
Table 15. Summary of the calculated distances to the fish criteria Criteria Threshold Calculated Distance Measured Distance
records turbidity, pH, conductivity, temperature, DO, salinity
6.3.1. Pre-Implosion and Post-Implosion Sediment Sampling
Sediment sampling was conducted two weeks prior to the implosion event to assess the
impact on sediment chemistry and toxicity at the sediment/water interface. Three
locations were sampled pre-implosion in the immediate vicinity of Pier E3 (near-field)
and three locations were sampled in the plume area predicted by modeling (far-field).
Chapter 6. Implosion Results and Impacts
FINAL SFOBB Pier E3 Implosion Demonstration Project Report 126
Pre-implosion sediment sampling indicated some toxic effect on mussel larvae at the
sediment/water interface. This is typical for San Francisco Bay and comparable to results
from the San Francisco Bay Regional Monitoring Program.
Post-implosion sediment sampling was conducted on January 8, 2016. Sampling was
conducted at the same near-field sampling locations sampled pre-implosion. Far-field
sampling locations were modified based on the actual path of the plume. Post-implosion
sediment laboratory results are included in the final Pier E3 Water Quality Monitoring
Results report, submitted under separate cover. expected in late January or early
February.
6.3.2. Pre-Implosion Water Quality Sampling
Pre-implosion water quality grab sampling was conducted on October 31, 2015
measuring water quality parameters in the San Francisco Bay using three different 5-L
Niskin bottle samplers. This was done to establish baseline water quality values. Each
sampler was triggered at a different water column depth (top, middle, and bottom). The
Niskin bottles were attached to the cage of a conductivity-temperature-depth (CTD)
water column profiler which measured turbidity, pH, and DO at the three different water
column depths.
A sample was collected in each Niskin bottle. Each sample was analyzed for DO,
salinity, conductance, turbidity, and pH in the field. A portion of the sample was filtered
in the field. The filtered and unfiltered samples were placed in clean pre-labeled bottles,
capped, stored on ice and shipped to an analytical laboratory. Filters used during field
sampling were disposed of as non-hazardous solid waste.
Turbidity, DO, and pH that were measured on October 31 were relatively unstratified.
Turbidity varied between approximately 7 and 9 NTU; DO held steady at approximately
6.6 milligrams per liter; and, pH remained at approximately 7.95. Metals concentrations
are still being analyzed and results are expected to be available at a later date.
6.3.3. Post-Implosion Water Quality Sampling
A set of five post-implosion water quality grab samples and CTD casts were taken on
November 14, 2015 (Figure 70). Post-implosion grab sampling and CTD casts were
conducted in the same manner as those collected prior to implosion. See Table 22 for a
summary of CTD casts.
Chapter 6. Implosion Results and Impacts
FINAL SFOBB Pier E3 Implosion Demonstration Project Report 127
Table 22. November 14, 2015 CTD Casts
Cast Date pH Turbidity
(NTU) Notes
Baseline October 31 7.95 7 to 9
Cast 1 November 14
Time: 7:40 a.m. 8.0 20.5 to 22.7
Bubble curtain influenced readings; relatively consistent turbidity throughout water column; pH
readings within baseline.
Cast 2 November 14
Time: 8:20 a.m. 8.3 to 8.7 16 to 21
Bubble curtain effects attenuated; measured at centroid of plume
Cast 3 November 14
Time: 8:55 a.m. 8.0 16.5 to 25 Turbidity greater at Bay floor
Cast 4 November 14
Time: 9:33 a.m. 8.0 to 8.1 16.5 to 20
Cast 5 November 14
Time: 11:25 a.m. 8.05 20 to 22
Figure 70. Water Quality Sampling Locations
After the implosion, the first CTD cast and grab samples (Cast 1) were taken at 7:40 AM.
However, the sampling boat did not move into the plume to collect the first cast. This was
done for safety reasons and to minimize impacts on other post-implosion construction
and sampling activities that had been given priority over water quality sampling.
At the time of Cast 1, the bubble curtain was still operating. During the time between
implosion and Cast 1, the current had moved north from Pier E3. Because of this, the first
Chapter 6. Implosion Results and Impacts
FINAL SFOBB Pier E3 Implosion Demonstration Project Report 128
cast was collected in a water mass heavily influenced by the bubble curtain, but was
outside the influence of the plume. The current later shifted to the south. The second cast,
taken at location south of Pier E3 at 8:18 AM, was near the centroid of the plume.
Cast 2, measured within the post implosion plume, had an elevated pH of ~8.5 and a
reduced turbidity reading suggesting lessened turbidity effects of the bubble curtain.
Salinity was still stratified, and the slight DO depression of bottom waters was still
evident. Cast 3 indicated a slower rate of change in water column concentrations. Cast 4
and Cast 5 documented a return of water quality to background conditions.
Metals concentrations and DO measurements are still being analyzed and expected to be
available at a later date. Water quality results for metals and DO are summarized in the
final water quality report, submitted under separate cover.
6.3.4. Dynamic Plume Mapping
A research vessel specially outfitted for three-dimensional subsurface plume tracking was
used. Operation of this vessel involved lowering and raising instrumentation through the
water column while the vessel was under way. The vessel travelled transversely across
the plume at least six times while the plume moved and dispersed with the tide and
current.
A second vessel deployed current drogues to aid the dynamic plume mapping team track
the extent of the plume.
A review of dynamic plume mapping of turbidity confirms the grab sampling results. It is
difficult to discern any turbidity effect of the implosion that stands out above San
Francisco Bay water ambient conditions or the turbidity effect of the bubble curtain.
Figure 71 shows the pH measured by the plume mapping boat versus minutes after the
implosion, which occurred at approximately 7:17 AM. The decay curve of pH over time
tracks the dispersion of the plume following the moment of implosion. The third order
polynomial decay curve is consistent with expected dispersion of water properties in a
fast moving current. Using this decay curve, the pH near the centroid of the plume just
after the implosion would have been approximately 9.0 standard units.
The decay curve shows that the pH returned to within 0.5 units of baseline (pH 8.0) in
approximately 1 hour, and returned to baseline within 4 hours. The return to baseline was
longer than the 2 hours estimated in the WQS. The immediate magnitude of the impact
near Pier E3 was consistent with the predictions of the WQS.
Chapter 6. Implosion Results and Impacts
FINAL SFOBB Pier E3 Implosion Demonstration Project Report 129
Note: Taken at approximately 7:17 a.m. on November 14, 2015.
Figure 71. Preliminary Results of Dynamic Plume Mapping of pH following Implosion of Pier E3
The results indicate that the maximum pH of 9.0 standard units near Pier E3 just after
implosion is consistent with a model based on pH primarily being affected by explosive
residue, rather than release of calcium oxide from structural PCC. The 5 percent-of-the-
Pier-E3-PCC-mass assumption was clearly overly conservative. The pH effects were
somewhat greater than the “explosives only” prediction of pH 8.7. The measured
outcomes versus the predicted can be used in future water quality studies to calibrate the
true effect of PCC. It is much more likely that a fraction of a percent (i.e., much less than
5 percent) of the total mass of the concrete structure will contribute pH-increasing
calcium oxide during future implosion events.
6.3.5. Environmentally Sensitive Areas Monitoring
Monitoring was conducted on the day of implosion to confirm that the plume did not
affect water quality in the vicinity of environmentally sensitive areas, namely eelgrass
beds along the YBI coast and along the eastern edge of Treasure Island (Figure 69).
Buoys, left in place for 48 hours after the implosion, continuously monitored mid-depth
Chapter 6. Implosion Results and Impacts
FINAL SFOBB Pier E3 Implosion Demonstration Project Report 130
turbidity, pH, dissolved oxygen, temperature, and conductivity. The implosion did not
appear to create a measureable impact on parameters measured by the buoys. This
indicated that water quality measured at the eelgrass beds appeared to remain within
background levels for the entire 48-hour post-implosion measurement period.
6.4. Fish
6.4.1. Caged Fish
Of 491 caged fish subjected to exposure to the implosion, 37 fish were impaired and five
fish died. Injuries detected during the necropsy process were inconsistent with
barotrauma and are more indicative of handling stress for the impaired and dead fish as
well as the live fish that were subjected to necropsies. There was no pattern to the
incidence of injury or mortality within the cages, further suggesting the finding that
injuries were unrelated to blast exposure.
Twelve cages, each with about 40 hatchery-reared juvenile late fall-run Chinook salmon,
were deployed in the Bay at known distances from Pier E3 before the implosion. A
control cage was deployed 2,550 feet from the pier, but was retrieved from the Bay just
before the implosion. Following the implosion, the eleven remaining cages were retrieved
from the Bay and were taken back to Clipper Cove. The salmon in each cage were
assessed as normal, impaired or dead. A subset of the normal fish and all the impaired
and dead fish were necropsied. Following the implosion, two experienced fishery
biologists inspected each cage and classified the fish. Normal swimming fish appeared
healthy, swam in an upright position holding their bodies parallel to the surface and
responding to stimuli. Impaired fish were disoriented, swam weakly, often with their
heads up and tails down and often would turn on their sides or rest on the bottom of the
cage. Impaired swimming fish were slow to respond or did not respond to stimuli (e.g.,
did not attempt to avoid the dip net). Fish that showed no evidence of moving their gill
covers were classified as dead.
Normal swimming fish were by far the most common condition found in all the cages
following the implosion, ranging from about 82 percent to 100 percent of each cage.
Figure 72 shows the percent of normal fish from each cage deployed for the implosion.
The cage designation is typically the deployment distance from the southwest face of Pier
E3 in feet. The exception is that Cage 4000 was deployed at 3,315 feet to avoid the
shipping channel to the Port of Oakland.
Chapter 6. Implosion Results and Impacts
FINAL SFOBB Pier E3 Implosion Demonstration Project Report 131
Figure 72. Percent of Normal Fish from Each Cage Deployed for the Pier E3 Implosion
Impaired fish were distributed randomly throughout the cages. A slightly higher number
of impaired fish occurred in cages 200 and 250 (seven fish in each). Both of those cages
had slightly higher counts of deployed fish (42 and 44, respectively). The pattern shows a
fairly consistent rate of impairment across the spectrum of exposure (Figure 73). Only
five fish were classified as dead. All the dead fish occurred between 250 and 700 feet
from Pier E3. Figure 73 shows the percent of impaired fish (orange) and dead fish (gray)
in each cage by distance from Pier E3.
Chapter 6. Implosion Results and Impacts
FINAL SFOBB Pier E3 Implosion Demonstration Project Report 132
Figure 73. Percent of Impaired Fish (orange) and Dead Fish (gray) in Each Cage by Distance from Pier E3
Hydroacoustic monitoring results were used to determine received peak and cSEL sound
pressure levels at each of the caged fish locations (Table 23).
Table 23. Sound Pressure Levels at Caged Fish Locations Cage ID Distance Peak cSEL
150 150 feet 227 dB 209 dB
200 200 feet 224 dB 205 dB
250 250 feet 222 dB 203 dB
350 350 feet 218 dB 198 dB
400 400 feet 217 dB 197 dB
500 500 feet 215 dB 194 dB
600 600 feet 213 dB 192 dB
700 700 feet 211 dB 190 dB
820 820 feet 210 dB 188 dB
2550 2550 feet 198 dB 174 dB
4000 3315 feet 195 dB 171 dB
All cages had similar soak times (the amount of time the cage was deployed in the Bay),
ranging from 1 hour and 38 minutes to 2 hours and 14 minutes. Cage confinement times
(the amount of time the fish were confined inside the cage) ranged from 3 hours and 30
minutes to 6 hours and 6 minutes. These differences primarily were related to the 3-hour
processing time needed for all the fish, following the implosion.
Chapter 6. Implosion Results and Impacts
FINAL SFOBB Pier E3 Implosion Demonstration Project Report 133
Caged Chinook salmon subjected to necropsy after the implosion did not have any
lesions related to barotrauma. The range of lesions was similar in controls, fish caged
nearest to the implosion, and fish caged further from the implosion.
After the implosion, the pathology team conducted necropsies on 90 fish, including all
fish that had died (n = 5), all fish that were impaired (n = 37), and four groups of 12
randomly selected, normally swimming fish from the: 1) un-deployed net pen controls; 2)
caged fish deployed in the control cage; 3) caged fish deployed at 150 feet; and 4) caged
fish deployed at 200 feet. All necropsies were completed within 3 hours of the implosion.
The swim bladder was assessed on every fish necropsied. All swim bladders were intact
and fully inflated (= score of 0). Among the 90 fish subjected to necropsy, only two fish
had internal hemorrhaging. The two fish that showed signs of hemorrhaging, one on the
ventral surface of the swim bladder and one on the surface of the intestinal mesentaries -
were deployed at 350 and 3,315 feet respectively. Because the affected fish were not in
the closest cages during the implosion, the lesions likely were the consequence of trauma
sustained during handling (ESA 2015).
6.4.2. Sonar Fishery Assessment
On October 29 and 30, 2015, acoustic data were collected along a total of 16 transects,
with four transects north and four south of the original Bay Bridge Pier E3 surveyed on
each day. A total transect length of 4.24 miles (6.8 kilometers [km]) was sampled on
October 29, and 4.5 miles (7.2 km) was sampled on October 30. The approximate total
area of water represented by acoustic surveys was 43.8 hectare (ha) north of Pier E3, and
49.2 ha south of Pier E3. Water conditions were calm on both survey dates, with surface
water temperature of 20°C and salinity of 30 parts per trillion (ppt).
For both days combined, the target strength distributions for tracked fish were similar
between the north and south transects. The conversion of target strength to length
indicated a mode of approximately 60 millimeter (mm). Fish greater than 100 mm
represented less than 7 percent of the total for the north transects, and less than 4 percent
of the total for the south transects. For each 25 mm size class, tracked fish density was
typically higher along the south transects. The highest estimated mean density among all
size classes was 8.7 fish/1,000 cubic meters for the 25 to 50 mm class along the south
transects.
The mean density of all tracked fish was significantly higher for the south transects
compared to the north (two sample t-test, =0.05, P value=0.008), and the overall mean
density for both regions combined was 12.5 fish/1000 cubic meters. The overall mean
Chapter 6. Implosion Results and Impacts
FINAL SFOBB Pier E3 Implosion Demonstration Project Report 134
density of schooled fish within the full acoustic volume sampled was not significantly
different between the north and south transects (two sample t-test, =0.05, P
value=0.390), and the mean schooled fish density for both regions combined was 75.6
fish/1000 cubic meters. For the north and south transects combined, the total tracked and
schooled fish density estimate was 88.1 fish/1000 cubic meters, and there was no
significant difference between mean density between the north and south regions (two
sample t-test, =0.05, p=0.536).
6.4.3. Bird Predation Monitoring
Bird predation is defined as birds attempting to prey or feed on other organisms.
Monitoring of predation activity consisted of counting bird strikes on the water surface. A
bird strike on the water surface was not counted as a fish kill or fish consumption. In fact,
many observations of bird strikes noted the bird retrieved nothing, retrieved pieces of the
blasting mat, or retrieved other material displaced by the blast. This monitoring
requirement was conducted in accordance with Section 1.3.7, Avoidance and
Minimization Measure No. 4 of the SFOBB Pier E3 Demonstration Project BO, issued by
NMFS on August 27, 2015.
Immediately following the blast there was a temporary lull in bird activity. By 7:20 AM,
birds (primarily gull species with brown pelicans and cormorants also being observed)
attracted to the area began to dive and strike at the water surface South of the implosion.
Again, it should be noted that during observations, large numbers of birds were observed
striking at a variety of items, including debris and benthic organisms. Initial bird
predation activity was concentrated in an area approximately 100 feet to 1,000 feet from
the location of the former pier. Bird strikes were counted regardless of what the bird’s
apparent prey target was. Specific prey data was not collected. Birds were observed
striking at floating organic debris, benthic organisms that were brought to the surface by
the blast and moribund or perished fish floating at or near the surface of the water.
Following the implosion, boat-based bird-predation monitors were located approximately
1,500 feet southeast of the imploded pier. The monitoring boat tracked bird predation
activities occurring south of the imploded pier, and followed these activities in a
generally southwestern direction following the current. Boat-based monitors observed a
rapid escalation in bird predation activity to more than 100 strikes per minute during the
first 15 minutes following the blast (7:17 AM to 7:32 AM). Birds were observed striking
at floating organic debris, benthic organisms that were brought to the surface by the blast
and moribund or perished fish floating at or near the surface of the water. Bird predation
decreased to approximately 50 strikes per minute between 7:32 AM and 7:38 AM and to
Chapter 6. Implosion Results and Impacts
FINAL SFOBB Pier E3 Implosion Demonstration Project Report 135
approximately 25 strikes per minute between 07:38 AM and 08:05 AM. Predation
gradually tapered off after 8:05 AM until birds were observed floating at the water
surface, foraging on the occasional fish by the end of the monitoring period (8:17 AM).
Bird predation activity and debris from the blast appeared to follow the tide in a southerly
direction from Pier E3, dispersing to the southeast and southwest in the hour following
the implosion.
The bike-path based monitor focused on bird predation observations immediately
southwest of Pier E3. Observations recorded at this location show the same trend
observed from the monitoring boat of high levels of predation activity immediately
following the blast that taper off around 8:00 AM. At this location, bird predation activity
approached approximately 25 strikes per minute between 7:21 AM and 7:26 AM, before
diminishing to between 4 and 16 strikes per minute between 7:27 AM and 7:53 AM.
After 7:53 AM, bird predation activity in this location tapered off until birds were only
observed floating at the water surface until the end of the monitoring period (8:17 AM).
Between 7:17 AM and 8:17 AM, the three monitors stationed in the boat collected any
fish found floating at the water surface. No listed fish species were observed. Only four
fish were collected: two brown rockfish (Sebastes auriculatus), one black surfperch
(Embiotoca jacksoni), and one northern anchovy (Engraulis mordax). All four
individuals were moribund, found at the surface visibly stunned. These fish were
necropsied by Moss Landing Marine Laboratory (MLML) staff that was on site
conducting the trawling effort and found to have injuries related to the implosion.
6.4.4. Trawl Sampling
A total of 203 fish, comprising 15 species were collected in 13 tows on October 31, 2015,
as a pre-implosion or baseline assessment of the fish assemblage composition and relative
abundance in the study area (Table 24) under a Scientific Collecting Permit issued to Dr.
Scott Hamilton of Moss Landing Marine Lab. Trawls captured 151 Speckled sanddabs,
which were primarily juveniles. The next most abundant species were California halibut
(14), plainfin midshipman (10), and brown rockfish (9). These species were also
primarily composed of juvenile-size classes. No federal or state-threatened or endangered
fishes were collected, and 89.5 percent of trawl-caught fish were alive and uninjured. The
only pelagic (open water) species collected was northern anchovy. Brown rockfish and
shiner surfperch are structure-oriented fishes, while the rest of the collected fish species
are bottom-oriented. A total of 1,229 fish comprising nine species (Table 25) was
collected in 14 tows between 7:24 AM and 8:34 AM on November 14, 2015 in
accordance with the ITP issued by CDFW. The trawling mostly occurred between 2,500
Chapter 6. Implosion Results and Impacts
FINAL SFOBB Pier E3 Implosion Demonstration Project Report 136
and 4,000 feet from the pier and began immediately after the implosion was over. Trawls
captured 1,073 juvenile
Table 24. Summary of fish catches on October 31, 2015
Species
Midwater trawl (north)n = 3 trawls
Otter trawl (north)n = 5 trawls
Otter trawl (south) n = 5 trawls
Total Alive
Total dead
Number Alive
Number Dead
Number Alive
Number Dead
Number Alive
Number Dead
Bay Goby 2 0 2 0
Brown Rockfish 1 1 8 0 9 1
California Halibut 2 0 12 0 14 0
California Tonguefish 1 0 1 0
Chameleon Goby 1 0 1 0
Diamond Turbot 2 0 2 0
English Sole 1 0 1 0
Guitarfish 1 0 1 0 2 0
Lizardfish 1 0 1 1 2 1
Northern Anchovy 2 2 2 2
Plainfin Midshipman 10 0 10 0
Shiner Surfperch 1 0 1 0
Speckled Sanddab 131 17 131 17
Unidentified Goby 2 0 2 0
Unidentified Sculpin 2 0 2 0
Grand Total 1 0 4 1 177 20 182 21
Note: Summary of catches of fishes on the practice day (October 31, 2015) using one midwater trawl and two bottom (otter) trawls to the north and south of Pier E3. Of total trawl-caught fish, 11.5 percent were dead because of damage from the trawl gear.
Table 25. Summary of fish catches on November 14, 2015
Species
Midwater trawl (north)n = 4 trawls
Otter trawl (north)n = 4 trawls
Otter trawl (south) n = 6 trawls
Total Alive
Total dead
Number alive
Number Dead
Number alive
Number Dead
Number alive
Number Dead
Brown Rockfish 2 0 2 0 13 0 17 0
California Halibut 2 0 19 0 21 0
California Tonguefish 1 0 1 0 2 0
English Sole 1 0 1 0
Northern Anchovy 978 61 26 8 1004 69
Pipefish 1 0 1 0
Plainfin Midshipman 13 0 13 0
Speckled Sanddab 6 0 2 0 90 2 98 2
Staghorn Sculpin 1 0 1 0
Grand Total 989 61 4 0 165 10 1158 71
Note: Summary of catches of fishes on the demolition day (November 14, 2015) using one midwater trawl and two bottom (otter) trawls to the north and south of Pier E3. Of the total trawl-caught fish on demolition day, 5.8 percent were dead, most likely because of damage caused from the trawl gear.
Chapter 6. Implosion Results and Impacts
FINAL SFOBB Pier E3 Implosion Demonstration Project Report 137
anchovies. The next most abundant species captured by the trawls included speckled
sanddabs (100), California halibut (21), and brown rockfish (17). All fishes caught were
juveniles. No federal or state-threatened or endangered fishes were collected and
94.2 percent of the trawl-caught fish were alive and uninjured. Again, the only pelagic
species collected was Northern anchovy. Pipefish are typically associated with beds of
underwater vegetation.
No federal or State-threatened or endangered fishes were collected by any of the
trawls. Necropsies were conducted on 37 injured fish caught by trawls. A small number
of trawl-caught fish had injuries that could have been attributed to the implosion or to
the trawl gear.
For the purposes of this effort, moribund fish were considered to be perished. A
moribund fish is not technically dead, but is unable to swim or maintain an upright
position in the water column, and thus would almost certainly result in a death if more
time was allowed to pass. Moribund and dead fish were lumped together into the same
data class—the distinction between the two was not recorded. A total of 71 out of 1,158
fish captured in the trawls were moribund or dead. Necropsies were performed on 37 of
those 71. The rest of the fish were noted as having either no visible injuries (22) or only
light hemorrhaging (17). This light hemorrhaging/damage was so minor that it could be
attributed to the blast, caused by the trawling nets, or caused by handling. Based on how
far the majority of these fish were collected from the pier, their injuries were most likely
the result of the trawling net and handling, not the blast.
6.5. Birds
On November 14, bird monitors were in position by 5:30AM; the lead avian monitor was
positioned on the new SFOBB east span bike path, and three monitors were positioned in
a boat. The monitor positioned on the bike path was located directly northwest of Pier E3.
The boat-based monitors were located directly south of Pier E3, near the boundary of the
1,500 foot MTSZ. Between 5:30AM and approximately 6:30AM, visibility was limited
because of the lack of daylight. At that time, most of the visible bird activity was
concentrated around the anchored barges, where multiple species of gulls were observed
feeding on fish at the surface. On two occasions (6:00 AM and 6:30 AM), a laser with a
30 milliwatt green beam with a 532 nanometer wavelength was used from the bike path
to flush birds from the vicinity of the Pier E3 blast mat. On the first occasion, an
unidentified gull flushed immediately and departed to the east; on the second occasion,
ambient light conditions had reduced the visibility of the laser enough that the operator
Chapter 6. Implosion Results and Impacts
FINAL SFOBB Pier E3 Implosion Demonstration Project Report 138
was unable to track the laser’s path and the targeted bird did not appear to respond to the
laser light aimed in their direction.
As daylight increased visibility leading up to the blast (6:35 AM to 7:16 AM),
approximately 100 birds were seen flying in different directions through the general
project area; typical species observed included double-crested cormorant (Phalacrocorax
auritus), Canada geese (Branta canadensis), brown pelican (Pelecanus occidentalis),
osprey (Pandion haliaetus), and multiple species of gulls.
As the time of the implosion approached, boat-based hazing of the area immediately
outside the 500-foot Avian Watch Zone was determined to be unnecessary because of the
absence of birds. As stated above, birds observed prior to the blast were primarily limited
to fly-overs, with instances of feeding on the surface earlier in the morning. The boat-
based avian monitors did not observe birds at the water’s surface or diving into the water
column in or near the 500-foot Avian Watch Zone immediately prior to the implosion of
Pier E3.
The propane-powered bird cannons were fired at 7:16 AM, one minute prior to the
implosion of Pier E3. Three western gulls were observed flushing from the area at the
time of the sound cannon. The gulls appeared to be located near the support barge to the
east of the Pier E3 and left the area. Immediately following the implosion (7:17 AM),
there was a temporary lull in bird activity. By 7:20 AM, birds (primarily gull species
[brown pelicans and cormorants also observed]) attracted to the area began to dive and
strike floating debris and dead and stunned fish immediately south of the implosion site.
Avian monitors observed hundreds of birds fly over and dive into the water column
within an approximate 1,000-foot radius of the imploded p in the first 15 minutes
following the implosion. Bird activity gradually tapered off in the hour following the
blast, and monitoring was concluded at 8:00 AM Monitoring results of bird predation is
described in greater detail in the Bird Predation Monitoring results section. No injured or
dead birds were found by avian monitors following the implosion of Pier E3.
As described in Section 4.1.2.1 of this report, the Department used the 202dB cSEL
criteria to calculate the area of potential auditory injury to birds exposed to the in-water
impulse sound generated by the implosion of Pier E3. The Department calculated a 500-
foot distance to the 202 dB cSEL threshold based on advance modeling. Based on the
Demonstration Project’s hydroacoustic monitoring results, the 202 dB cSEL threshold
was measured at approximately 300 feet, resulting in a 200-foot reduction in the distance
to the potential auditory injury threshold from the modeled to the measured distance.
Chapter 6. Implosion Results and Impacts
FINAL SFOBB Pier E3 Implosion Demonstration Project Report 139
These results indicate that the Department’s calculated distance for potential auditory
injury to birds was conservative, and slightly higher than the measured cSEL levels.
Hydroacoustic monitoring results are presented in Section 6.2 and measured cSEL values
for all of the monitoring locations are shown in Figure 56.
6.6. Marine Mammals
Prior to the implosion of Pier E3, only one marine mammal, a harbor seal, was observed
by any of the marine mammal monitors. The seal was observed at approximately 6:45AM
and approximately 4,500 feet north of Pier E3 by the marine mammal observer positioned
on Treasure Island. The animal was within the Level B Harassment – TTS monitoring
zone, as specified in the Incidental Harassment Authorization, however, it dove into the
water shortly after being seen and then was not seen again for over 30 minutes prior to
the implosion. This did not result in any delay of the implosion. No other animals were
observed prior to the blast.
Following implosion, 60 minutes of monitoring was conducted for marine mammals.
During this time, several harbor seals and California sea lions were observed in the
surrounding area, but none exhibited any evidence of blast-related injury or impairment.
Two hours after the implosion and for three days following (November 15 through 17),
surveys were conducted of haul out sites in the vicinity of the pier to locate any
potentially impaired or injured animals. Surveyed areas included Treasure Island, Yerba
Buena Island, Emeryville Crescent, Oakland Harbor, and Oakland Touchdown. No
potentially injured animals were identified. It was also confirmed with the Marine
Mammal Center, a local wildlife rescue organization and the official NOAA-designated
marine mammal stranding center for northern California, that no animals with blast-
related injuries were reported.
6.7. Traffic
6.7.1. San Francisco-Oakland Bay Bridge
To minimize distraction to the public a full traffic stop in both directions of the SFOBB
was executed for the implosion. Twenty California Highway Patrol (CHP) vehicles and
associated personnel were used for this detail. The eastbound onramp at the tunnel on
YBI was also closed. In addition, to meet the request of the San Francisco Fire
Department for emergency response to the island the eastbound number 1 lane (farthest
left lane) was closed from San Francisco to YBI. The lane closure was installed 60
minutes before the planned implosion. The westbound traffic block began 10 minutes
before the planned implosion. The eastbound traffic block began 10 minutes before the
Chapter 6. Implosion Results and Impacts
FINAL SFOBB Pier E3 Implosion Demonstration Project Report 140
planned implosion. Traffic in both directions was held until the implosion occurred.
Traffic was released in both directions after the all-clear safety signal was given and the
eastbound onramp was reopened. Heavy traffic conditions cleared within 10 minutes after
the lanes were reopened. The eastbound number 1 lane closure was removed within 30
minutes after the implosion.
6.7.2. Bay Area Rapid Transit
The Bay Area Rapid Transit (BART) Transbay tube (Figure 74) is a 3.6-mile-long
underwater rail tunnel which carries four Transbay rail lines under the Bay between the
cities of San Francisco and Oakland. At its nearest point the tube is approximately 3,000
feet to the south of Pier E3. Prior to the implosion, the Department collaborated with
BART officials and provided data and calculations indicating the expected impact of the
implosion on the tube. As a precaution, BART officials chose to shut the tube down
during the implosion event. Trains were held up at each end of the tube on the same time
schedule as the traffic blocks on the SFOBB noted above.
Blast vibration monitoring was conducted on the tube gallery wall during the implosion.
Four velocity geophones and one accelerometer were affixed on brackets to the North
wall of the central gallery near door 36 at mile post 4.78. The geophones were mounted
on separate brackets approximately 6 feet apart on the tube gallery wall and the
accelerometer was affixed to a bracket below the geophones.
Data acquisition systems included three White Seismology blasting-type seismographs,
one NOMIS seismograph and an HBM eDAQ Lite. Seismograph operating parameters
are provided in Table 26. Wall motions using a PCB Piezotronics 356A34 triaxial
accelerometer were recorded using the eDAQ Lite at a sample rate of 100 kHz. The
trigger level was set to 0.1 g.
Before the blast, all recording systems were used to record vibrations from passing trains
starting at 6:02 AM. All five systems were operable and recorded wall vibrations from
several trains. The blast occurred at 7:17 AM and triggered all four seismograph systems.
However, the accelerometer system did not trigger because of the very low frequency of
the blast motions on the wall (less than 4.1 Hz). All systems remained on operating mode
after the blast to record wall vibrations during the passing of several trains. All five
systems were confirmed to be in operating condition.
Table 26 provides a summary of the measurements from each of the 4 seismograph
monitoring systems. The highest wall velocity recorded during the blast was 0.061 inch
per second (in/s). This was recorded with the NOMIS system sampling at the highest
Chapter 6. Implosion Results and Impacts
FINAL SFOBB Pier E3 Implosion Demonstration Project Report 141
sample rate of 16,384 samples per second. The high sampling rate resulted in a peak
frequency of 115.3 Hz. Sample rates of 4,098 and less used for the other systems
produced lower peaks at peak frequencies less than 4.1 Hz. It is apparent that lower
sample rates may miss many of the high frequency peaks.
The highest background velocity recorded during the passing of a train on November 14
was 0.0944 in/s at 200 Hz peak frequency. The peak was recorded with the NOMIS
system with the highest sample rate.
The highest vibration on the wall from the blast was 1.55 times lower than the highest
train vibration and more than four times lower than the BART significance threshold of
0.25 inches per second, as shown in Figure 75.
Source: The Chronicle/Kim Komenich
Figure 74. BART Transbay Tube
Chapter 6. Implosion Results and Impacts
FINAL SFOBB Pier E3 Implosion Demonstration Project Report 142
Table 26. Summary of blast vibrations
Ser
ial
No
.
Man
ufa
ctu
rer
Mo
del
Lo
w-e
nd
re
solu
tio
n
Up
per
Ran
ge
Sam
ple
ra
te
Rec
ord
len
gth
Pea
k P
arti
cle
Vel
ocity
Pea
k
Freq
uenc
y
FF
T
Fre
qu
ency
Acc
eler
atio
n
Dis
pla
cem
ent
(in/s) (in/s) (S/s) (s) (in/s) (Hz) (Hz) (g's) (in)
2407 White Miniseis II 0.0003 0.163 2048 6 0.044 4.1 4.13 0.0398 0.0018
5159 White Miniseis II 0.0025 0.65 2048 6 0.044 4.1 4.13 0.0638 0.0016
7211 White Miniseis III 0.0025 1.25 4096 12 0.053 1.8 1.25 0.0629 0.0018
Note: Wall velocity versus frequency for train vibrations compared with blast vibrations plotted on the US Bureau of Mine safe vibration criteria; the BART vibration limit and safe recommended limit used in the blasting industry for concrete are also shown. Source: Siskind et al. 1980
Figure 75. Wall Velocity Versus Frequency for Train Vibrations Compared with Blast Vibrations
USBM SafeVibration
2.0
0 75
BART Limit -
(2 data)
Train
vibrations
Concrete Limit -8 0 i /
0.1
0.01
1
10
Chapter 7. Summary and Conclusions
FINAL SFOBB Pier E3 Implosion Demonstration Project Report 143
Chapter 7. Summary and Lessons Learned
7.1. Summary
The Demonstration Project was a success based on results described in this report. It was
completed safely and resulted in lower levels of impact than anticipated. The Department
believes that the use of controlled blasting should be considered as a viable option for
marine foundation removal for the SFOBB Project. A summary of the Pier E3
Demonstration Project conclusions follows:
Safety was top priority! No injuries occurred to project personnel or the public
Pier E3 was removed to the desired depth, the majority of debris successfully fell
into caisson cells; cleanup activities were completed by December 11, 2015
The Blast Attenuation System effectiveness was at or around modeled levels
Measured cSEL levels were lower than modeled; measured peak pressure levels
were slightly above what was modeled
No birds or marine mammals were impacted
Cage Fish Study indicated low fish mortality, observed mortality likely due to
handling stress
CDFW Required Trawls: no state or federally listed fish species were collected; low
mortality observed, mortality likely due to handling stress
Water quality impacts were less than predicted
Bird predation on fish occurred within the area where large amounts of implosion
debris was observed immediately following blast
Traffic and BART stops were successful
7.2. Lessons Learned
During the course of the Demonstration Project, the Department evaluated areas that
could be improved, expanded upon or be done more efficiently. While always looking for
ways to improve the methodology of construction to be safer, more cost effective and
Chapter 7. Summary and Conclusions
FINAL SFOBB Pier E3 Implosion Demonstration Project Report 144
more environmentally protective, the Department strives to incorporate lessons learned
into future projects. The following summarizes the main areas where the Department sees
opportunities for improvement:
Develop a more comprehensive hydroacoustics monitoring plan including:
Increased instrument redundancy; and
Enhanced equipment reliability and deployment procedures;
Improve Bird Predation Monitoring Methods to better quantify and distinguish actual
bird strikes on fish versus strikes on other organic and inorganic floating material;
Attempt to develop a system to effectively collect and contain debris generated by
the blast;
Research the efficacy of marine mammal deterrent devices to ensure members of
these species will not enter marine mammal exclusion zones; and
Refine the Caged Fish Study and improve acclimation procedures and staging for the
caged fish study subjects.
References
FINAL SFOBB Pier E3 Implosion Demonstration Project Report 145
References Barnard, P. L., D. H. Schoellhamer, B. E. Jaffe and L. J. McKee. 2013.Sediment
Transport in the San Francisco Bay Coastal System: An Overview.
Marine Geology 345:3-17.
Beason, R. C. 2004. What Can Birds Hear? USDA National Wildlife Research Center,
Staff Publications. Paper 78. Available:
http://digitalcommons.unl.edu/icwdm_usdanwrc/78.
Brandt, S. B. 1996. Acoustic Assessment of Fish Abundance and Distribution. In
Fisheries Techniques, B. R. Murphy and D. W. Willis, editors, pages 385–419.
American Fisheries Society, Bethesda, MD.
Buehler, D., R. Oestman, and J. Reyff. 2007 (December) 21. Application of Revised
Agency Date Agency Question/Comment Caltrans' Response to CommentsResponse Included in Final E3
Report? (Y/N)
1 BCDC 2/11/2016
Special Condition II.G.5.a requires that necropsies be conducted on perished fish from the trawls. According to page 131, necropsies were conducted on “37 injured fish.” Were necropsies conducted on dead fish? The report also says that a “small number" had injuries that could have been attributed to the implosion. How many?
For the purposes of this effort, moribund fish were considered to be perished. A moribund fish is not technically dead, but is unable to swim or maintain an upright position in the water column, and thus would almost certainly result in a death if more time was allowed to pass. Moribund and dead fish were lumped together into the same data class—the distinction between the two was not recorded. A total of 71 out of 1,158 fish captured in the trawls were moribund or dead. Necropsies were performed on 37 of those 71. In addition, 4 fish were collected on the surface and necropsied. Of these 41 total fish necropsied, only 2 had the kind of severe hemorrhaging that would most likely to be blast‐related and these were 2 of the surface water fish caught closer to the pier. The rest of the fish were noted as having either no visible injuries (22) or only light hemorrhaging (17). This light hemorrhaging/damage was so minor that it could be attributed to the blast, caused by the trawling nets, or caused by handling. Based on how far the majority of these fish were collected from the pier, their injuries were most likely the result of the trawling net and handling, not the blast.
YSee Section 6.4.4.
2 BCDC 2/11/2016Special Condition II.G.5.c requires hydroacoustic monitoring. Please explain how the sound pressure differed between the deeper and shallower areas. What does this tell us about possible future implosions of piers in shallower water?
For Pier E3, the water depths surrounding the Pier and out to the monitoring locations were from about 40ft to 50ft. Monitoring was performed at a depth of 20ft. The results did not indicate any dependence on water depth. For shallower water, the peak pressure should not change as it only depends on the direct path of sound traveling from the pier to the receiver location. For SEL, the levels would be lower in shallower water for same distances monitored for Pier E3. This occurs as the received sound depends on both the direct and surface reflected sound. In shallower water, there is more interference between the direct and reflected sound causing lower SEL values.
N
3 BCDC 2/11/2016
Special Condition II.G.5.e requires water quality monitoring. In particular: Caltrans is required to "map the plume predicted by the three‐dimensional hydrodynamic and sediment transport modeling, bathymetry of the Pier 3 area and anticipated tidal conditions.” ‐ As I am new on this project, it is unclear to me whether Caltrans was supposed to provide a predicted map of the plume or to map the plume, which was previously predicted. How does Caltrans understand this condition? Monitoring should have included sensors for pH, turbidity, DO, temperature, depth and an Acoustic Doppler Current Profiler with a GPS and data acquisition system. However, the report did not provide results for turbidity, DO, temperature and depth. These should be included in the report. Also, was an Acoustic Doppler Current Profiler used? Grab samples should have measured suspended sediment concentration and total and dissolved metals. Please provide the results of these measurements.
‐Plume map/mapping. The Water Quality team mapped the plume and through that effort has also created a map of the plume track as it moved south after the implosion. A plan view of the plume path will be provided in the Water Quality Monitoring Results (WQMR) report to be submitted to the agencies under separate cover. Additionally, an appendix to the WQMR report will provide a horizontal profile of selected plume transects.‐pH, turbidity, DO, temperature, and depth were continuously measured and latitude and longitude of these measurements were recorded using GPS. The acoustic Doppler current profiler was not used because other methods were implemented to measure current speed and to track the plume. A summary of post‐implosion water quality results for pH and turbidity are included in Table 22 in Section 6.3.3 of the final report. The WQMR report will contain the full range of turbidity, DO, temperature and depth readings in the body of the text with field data sheets contained in the appendices.‐Water grab samples (five “casts”), using a 5‐L Niskin bottle, were collected at three depths (top, middle, and bottom) and analyzed for total and dissolved metals. Each cast included a vertical water column profile using the conductivity‐temperature‐depth profiler. Grab samples were tested for dissolved and total metals and suspended sediment concentration. The WQMR Report discusses the water quality results in more detail and will be submitted under separate cover.
N
4 BCDC 2/11/2016
Special Condition II.G.5.f Please provide the volume of debris that fell into the caisson after the implosion, prior to rubble management. What volume of rubble fell outside the footprint of the pier and over what area? The report cites that 2,200 cy was mounded on top of the caisson or next to the caisson.
Approximately 9,550 cubic yards of material fell into the caissons immediately after the implosion and before rubble management began. Caltrans transmitted the PIER E3 DEMONSTRATION PROJECT CLEANUP & HYDROGRAPHIC SURVEY REPORT on December 29, 2015 to comply with Special Condition II.G.5.f. The report includes further detail on the final bathymetry and debris management resulting from the project. That report includes the estimated volume of concrete that was managed during mechanical dismantling, after the Pier E3 implosion and post rubble management.
Approximately 2,200 cubic yards is the estimated volume that required clean‐up from outside of the caisson. This debris was estimated to cover an area approximately 7,000 square feet around the pier, a majority of it being on the south side of the pier.
N
5 BCDC 2/11/2016
Special Condition II.G.5.g ‐ Where are the locations of the five monitoring stations that were used to monitor for water quality impacts to eelgrass? Please show them on a map. ‐ Please provide the final elevation of the rubble within the pier. ‐ What are possible improvements to minimization measures and monitoring, and what are the lessons learned? ‐ Please provide an evaluation of whether implosions are appropriate for the demolition of the other piers.
Autonomous monitoring buoys were placed along the eastern edge of Treasure Island and on the north and south sides of the eastern edge of Yerba Buena Island. These locations corresponded to the locations of eelgrass beds closest to Pier E3. A map has been included in the final report as Figure 69 in Section 6.3 of the final report.
Final elevation of rubble within the caisson was no higher than ‐50 feet NGVD.
A brief summary of Lessons Learned is included in Chapter 7, Section 7.2 of the final report. As Caltrans evaluates the means and methods for future pier implosions, a more comprehensive Lessons Learned memo will be prepared and will be submitted separately.
The intent of this report is to provide an evaluation of the use of controlled blasting as a viable dismantling method for marine foundation removal. Based on the data provided by this report, Caltrans believes that use of controlled blasting is a viable option that provides less potential environmental impacts as compared to the already authorized mechanical dismantling methods.
Agency Date Agency Question/Comment Caltrans' Response to CommentsResponse Included in Final E3
Report? (Y/N)
6 BCDC 2/11/2016Other comments: It would be helpful to see the measured isopleths for the fish and marine mammals on a map.
These isopleth maps have been added to Section 6.2.5.3 of the report.Y
See Section 6.2.5.3.
7 BCDC 2/25/2016 What is the area (square feet) of the rubble that fell outside the caisson?
Caltrans has estimated that an area of approximately 7,000 square feet, the majority of which occurred on the south side of the pier, had rubble that fell outside of the pier's footprint. The debris that fell out of the pier's footprint to the north east and west sides approximately within 15 feet from the pier. To the south side of the pier, where the greatest extent of debris fell, the debris fell approximately within 60 feet away from the pier.
N
8 CDFW 2/17/2016
The California Department of Fish and Wildlife (Department) has completed its preliminary review of the draft report for the Pier E3 Demonstration Project (Project). Our preliminary analysis of the Project results concluded that of the possible methods for dismantling Pier E3, controlled implosion was likely the least environmentally impactful method for dismantling the underwater pier. Given this determination, the Department does not object to Caltrans moving forward with the implosion methodology for demolishing the remaining piers.
No Response Required N
9 NOAA 2/23/2016In general there are quite a few grammatical errors to fix throughout the document
A thorough grammar review was performed.Y
Universal change
10 NOAA 2/23/2016The project is the SFOBB East Span not spans Seismic Safety Project. I recommend a universal search and replace
Agreed, a find and replace for spans when referring to the SFOBB project title has been performed.Y
Universal change as applicable
11 NOAA 2/23/2016Section 3.2.3 pg. 17. Critical habitat for green sturgeon has been finalized as of 10/9/2009. The information for green sturgeon needs to be updated in his section.
Information regarding critical habitat for green sturgeon has be updated. See change in Section 3.2.3.1.Y
See Section 3.2.3.1.
12 NOAA 2/23/2016
Section 4.1.1 page 20. There is no "take" for EFH, EFH consultations are based on the analyses of effects on EFH, which supports those species managed under the MSA. We consult on adverse effects to EFH, not take of individuals under the MSA. "Take" is a term used for the ESA.
Revised language to discuss potential adverse effects to EFH. See change in Section 4.1.1.Y
See Section 4.1.1.
13 NOAA 2/23/2016
Section 4.1.1 page 20, first bullet. Under the ESA, the consultation was based on effects to the listed species that could be present or have CH in the area. There would be no consultation if [Caltrans] truly made a no effect determination. Rather, for all species other than green sturgeon, the determination was a "may affect, not likely to adversely affect, nor adversely modify CH for the species. For green sturgeon, the effect determination was a potential to adversely affect, thus [Caltrans] was exempted incidental take for that species, as well as for the temporary impacts to their CH. Also, [Caltrans] or Federal lead agency does not make the jeopardy determination, that is the responsibility of the Services, either NOAA or USFWS.
Revised language per comment, to match affect determinations from the 2015 BO. See changes in Section 4.1.1.Y
See Section 4.1.1.
14 NOAA 2/23/2016
Section 4.1.1 Page 20. Regarding the last sentence and the BAS system. The BAS system was not really implemented to avoid take, we knew take would occur, but it was rather there to minimize the extent of area affected, thereby reducing the amount of take that was expected to occur as well as reduce the area of EFH adversely affected. I guess its more of a preferred word choice :)
Language revised to describe BAS as a minimization measure, as opposed to an avoidance measure. See change in Section 4.1.1.Y
See Section 4.1.1.
15 NOAA 2/23/2016
Section 4.1.1 second bullet, page 21. See previous comments, the effects determination for green sturgeon is incorrect. If green sturgeon would have been anywhere within the vicinity of the ensonified area around E3, they were considered to be adversely affected, thus the entire reason for the biological opinion and not an LOC.
Revised language per comment, to match effects determination from the 2015 BO. See change in Section 4.1.1.Y
See Section 4.1.1.
16 NOAA 2/23/2016
Section 4.1.1 page 21. regarding the FHWG: Just for clarification, the current thresholds for pile driving were established from impulsive sound sources at the time since there was very little info about pile driving. Seismic sound and explosives were used to develop the criteria, that is why we felt it was suitable to use for the E3 project.
Language suggesting that criteria for injury to fish were based on pile driving has been removed. See change in Section 4.1.1.Y
See Section 4.1.1.
17 NOAA 2/23/2016Section 4.1.1 last paragraph, page 21. The thresholds are also used to determine the onset of injury that can be any type of barotrauma, physical injury that is not solely auditory damage.
Revised text per comment to clarify criteria are based on onset of injury, not solely auditory damage. See change in Section 4.1.1.Y
See Section 4.1.1.
18 NOAA 2/23/2016Section 4.1.1 page 22, second bullet: temporary impacts to CH and EFH were also expected from the water quality issues associated with the blast, but also clean‐up, etc.
Text revised to include impacts to CH and EFH from pier implosion and removal of debris. See change in Section 4.1.1.Y
Agency Date Agency Question/Comment Caltrans' Response to CommentsResponse Included in Final E3
Report? (Y/N)
19 NOAA 2/29/2016
Section 5.2.1, page 31. The interim thresholds were established based on the available data from impulsive sound sources on fish. This was primarily from blasts and seismic surveys, there was very little known at the time about pile driving.
Removed language stating the criteria was based on noise from pile driving . See change in Section 5.2.1.Y
See Section 5.2.1.
20 NOAA 2/29/2016Section 5.2.1., page 31. When making reference to the thresholds, cumulative SEL (cSEL) should always be noted since there is also single‐pulse SEL also. This is an important distinction.
Revised to cSEL throughout document.Y
Universal change
21 NOAA 2/29/2016
Section 5.2.1. page 31. The 150 dB RMS is not part of the interim criteria for thresholds, but it is the most current level we use to assess potential non or sub‐injury to fish, therefore it is considered something that we "regulate" for the purposes of our consultations and identifying a continuum of effects within the sound field.
Sentence stating 150 dB RMS is not "regulated" has been removed. See change in Section 5.2.1.Y
See Section 5.2.1.
22 NOAA 2/29/2016
Section 5.2.2.1. page 33. There is a little mix‐up here. When we originally developed the thresholds for pile driving, the only metric that was typically applied was a peak pressure. It was determined though that we needed a total dose response, thus, the cSEL metric was added, giving us the "dual" metric thresholds. So Peak pressure was always there, then cSEL was added.
Text revised to clarify that initial criteria was based on peak pressure and cSEL was added later to capture total dose response. See change in Section 5.2.2.1.
YSee Section 5.2.2.1.
23 NOAA 2/29/2016Section 5.2.2.2 . Page 34. Again, please make the distinction between a single pulse SEL versus a cSEL.
Revised to cSEL throughout document.Y
Universal change
24 NOAA 2/29/2016Section 5.2.3. page 36, last paragraph, first sentence please add the word "level" after sound exposure…
Edit made. See change in Section 5.2.3.Y
See Section 5.2.3.
25 NOAA 2/29/2016Section 5.3. page 68. I am not going to go into any great detail about the caged fish study at this time. But would be willing to discuss aspects of it if another is being proposed.
Caltrans is planning to conduct a Caged Fish Study for Piers E4 and E5. Caltrans welcomes a discussion and hopes resources agencies will partner with Caltrans on the endeavor to take advantage of the opportunity to use state of the art technology for the advancement of science.
N
26 NOAA 2/29/2016
Section 5.3.1.4. page 71. It does not appear that any of the trawl passes occurred in any of the actual blast injury zones. Therefore, no fish would likely show signs of barotrauma unless due to the time it took after to begin the trawl they had moved into the trawl area. It seems that the trawl data is inconclusive for assessing any effects on fish from the blast.
The trawling was conducted between the predicted 187 dB and 183 dB cSEL zones. Measured cSEL distances to the 187 and 183 dB zones were much smaller than the predicted zones, so these fish were likely not exposed to harmful sound levels. The south trawl may have encountered fish that could have been within those injury zones during the blast and that drifted south with the tides following the blast, however there is no way to confirm this. Trawling was not a very effective method for assessing injury from the Pier E3 implosion because it could not be conducted safely close enough to the pier to capture fish that may have been harmed. Language has been added clarifying that trawling locations did not correspond with measured distances to threshold criteria. See change in Section 5.3.1.4.
YSee Section 5.3.1.4.
27 NOAA 2/29/2016Section 5.3.1.6. page 75. What were the other external physical parameters that were assessed for fish? Was it only whether or not they could remain upright?
Fish behavior was observed in each cage to assess swimming performance, orientation and reaction to stimuli. This assessment classified fish as normal, impaired or dead. All impaired and dead fish were necropsied along with a subsample of normal fish. The necropsy looked at external and internal injury and each fish was scored based on those attributes on the data sheet.
N
28 NOAA 2/29/2016Section 5.3.1.6. page 75. Why were fish that did not immediately show signs of balance issues released so soon? Why were they not held for observation?
Release of these fish occurred from between one and three hours post blast exposure. The fish were not held longer because the assessment protocols were based on immediate injury and included an assessment of behavior plus a necropsy.
N
29 NOAA 2/29/2016Section 5.3.1.6. page 75. Did the fish biologists who performed the necropsies have specific experience with assessment of barotrauma?
Dr. Gary Marty, DVM, Ph.D. is a fish pathologist with an established record conducting necropsies on of fish exposed to sound. He was the only biologist that conducted the necropsies for this project and examined and scored every fish. This was intentionally done to minimize any observer bias. Other biologists helped to weigh, measure and prep the fish for necropsy, but Dr. Marty was the only person conducting and scoring the external and internal assessments.
N
30 NOAA 2/29/2016Section 6.2.5.1. page 116. Although there is uncertainty as to why there were these two high peak levels, fish exposed to a single pulse this high could have been injured or killed.
Agreed. No edit made to report text. No death or injury in the caged fishes that could have been attributed to over/underpressure exposure was observed. Two fish had signs of internal hemorrhaging (barotrauma), one fish at 350 feet and one 3,315 feet from the Pier. Because of their distance from the Pier, both of these injuries were likely related to handling and not barotrauma.
N
31 NOAA 2/29/2016Section 6.4. page 125. See previous comments on this. I have several concerns about this study that should be discussed if another is going to be proposed.
Caltrans is planning to conduct a Caged Fish Study for Piers E4 and E5. Caltrans welcomes a discussion and hopes resources agencies will partner with Caltrans on the endeavor to take advantage of the opportunity to use state of the art technology for the advancement of science.
N
32 NOAA 2/29/2016Section 6.4.1.page 125. What were the sound exposure levels for each cage, and how might this relate to injury? The graph should include the sound levels that correspond with the distances of the cages.
Sound exposure levels at each cage distance are included in Table 23 in Section 6.4.1 of the final report. Y
See Section 6.4.1.
33 NOAA 2/29/2016
Section 6.4.1. page 125. There needs to be significantly more information on the types of injuries. What has been omitted from any of this discussion is the state of the swim bladder and state of buoyancy of the fish during the implosion. What was the external condition of the fish prior to exposure to the blast? Were they all visually inspected before being placed in the cages?
The full details of the necropsy results are in Dr. Gary Marty's Necropsy Report, appended to the Caged Fish Immediate Mortality and Injury and Trawling Report, which can be provided separately. The swim bladder was assessed on every fish necropsied. All swim bladders were intact and fully inflated (= score of 0). Two fish that showed signs of hemorrhaging, one on the ventral surface of the swim bladder and one on the surface of the intestinal mesenteries ‐ were deployed at 350 and 3,315 feet respectively. The study design used a deployed cage control (fish that were deployed and not exposed to the blast) and non‐deployed net pen controls (fish from the net pen) to account for handling effects. All fish that were moved into the cages were inspected at the dock prior to transferring the cages to the buoy line. They were inspected again in the vessel prior to moving the cage overboard.
Agency Date Agency Question/Comment Caltrans' Response to CommentsResponse Included in Final E3
Report? (Y/N)
34 RWQCB 2/19/2016
SWPPP Amendment #4 described that booms will be deployed prior to the implosion and skimmers would be used to collect and remove floating materials after the implosion. It did not appear that booms or skimmers were deployed before or after the implosion. Were booms and skimmers used to contain and capture floating implosion debris, and if not, why?
Booms were not deployed prior to implosion. A decision was made not to deploy booms around the work area during implosion because of safety and environmental monitoring access concerns. The changed plan was conveyed as part of SWPPP Amendment 8 which also stated that a skimmer would be used to collect wood that may break off of the implosion platform system. After the implosion, skiff boats were used to collect floating debris – mostly large debris, but some small debris was collected as well. Additionally, as discussed during the March 4, 2016 meeting with the Water Board (where Pier E3 implosion water quality and future Pier E4‐E18 BMPs and water pollution control measures were discussed), if significant changes are made to the pollution prevention plan for future pier dismantling activities, both verbal and written (i.e., email) correspondence will clearly highlight these changes.
N
35 RWQCB 2/19/2016
Before the implosion, a foamy, grayish, substance was accumulating at the surface around the pier. After the implosion, this substance disbursed and was floating widely around the implosion site. Did [Caltrans] investigate what this foamy substance was composed of? It did not appear a boom or skimmer was deployed to contain this substance, is this the case?
Foam was observed around the pier. The most likely source of this foam was aerated San Francisco Bay waters and the cause of this aeration was pressurized air being released from the blast attenuation system (BAS) surrounding Pier E3. Water Quality sampling personal located north of and near Pier E3 reported that the foam had a consistency similar to sea foam (i.e., foam generated by the mechanical aeration of wind or wave action). Additionally, the BAS was tested two times prior to the implosion. During both of those testing events, a similar sea foam was observed. Because the foam was observed before the implosion (immediately after activating the BAS) and during previous BAS testing events, it was not considered a nuisance and therefore no attempt to remove it was made.
N
36 RWQCB 2/19/2016
The SWPPP amendment described a decanting barge and operation that would occur during the clamshell operation. During the clamshell removal of debris from the bay floor after the implosion, was any material off‐hauled, or was all demo material placed in the caisson? The report does not mention any off‐hauling. What was the reason to describe the decanting and mechanical separation of demo material in the SWPPP amendment?
a. None of the Pier E3 debris field that was found surrounding the former Pier E3 boundary was brought to the surface. All this debris was moved from outside the Pier E3 boundary and placed into the caissons. However, the obstructions that were identified in mid‐2015 that hindered the initial placement of the BAS were removed after the implosion. This is in keeping with Caltrans’s commitment to the Water Board that after the implosion was complete, any debris that was moved to allow placement of the BAS would later be removed. Two steel pipes were removed.b. The SWPPP amendment described the decanting and mechanical separation of the material as a precaution in the event more material needed management than there was space within the caisson void. While it was the intention that all of the material would fall into the caisson, there was a chance that the voids may have been obstructed with material that got tangled up with rebar after the implosion or for whatever reason was a larger quantity than anticipated. Off‐hauling the material may have been necessary in the event the material couldn't be deposited to at least 1.5 feet below mudline within the caisson. This did not end up occurring and so the decanting barge was not used.
N
37 RWQCB 2/19/2016Will there be a stand‐alone water quality and sediment sampling report submitted that includes the reporting information described in the Sampling and Analysis Plan?
Yes. A stand alone water quality report summarizing the results will be submitted separately from this post blast report. N
38 USACE 3/14/2016Did you...get the sediment samples that the report said would come in around late February and the metals samples which were going to be "available at a later date"?
A stand alone water quality report summarizing the results will be submitted separately from this post blast report. N
39 USACE 3/14/2016 What was done with the filters from the pre and post‐implosion filtered water? The filters were sent for disposal to a non‐hazardous solid waste landfill. Text added to Section 6.3.2.Y
See Section 6.3.2.
Contributing Agencies:BCDC ‐ San Francisco Bay Conservation and Development CommissionCDFW ‐ California Department of Fish and WildlifeNOAA ‐ National Oceanic & Atmospheric Administration ‐ National Marine Fisheries Service (Fisheries)RWQCB ‐ San Francisco Bay Regional Water Quality Control BoardUSACE ‐ United States Army Corps of Engineers