150
San Juan Waterfront Project Declaración de Impacto Ambiental - Preliminar December 2008 APPENDIX H San Juan Waterfront Master Plan Transport Assessment (subject to update)

San Juan Waterfront Project Declaración de Impacto Ambiental - Preliminar
December 2008
APPENDIX H
San Juan Waterfront Master Plan Transport Assessment (subject to update)


Prepared for: Prepared by:
Global Development Solutions Colliers International 27th Floor 221 E. Forth Street Cincinnati OH 45202
Steer Davies Gleave 1606 Ponce de León Avenue Suite 500 San Juan Puerto Rico 00909 +1 787 721 2002 www.steerdaviesgleave.com
SAN JUAN WATERFRONT MASTERPLAN
Transport Assessment
November 2008

P:\Projects\220022~1\01\Work\SJW\Output\Report\San Juan Waterfront Masterplan Transport Assessment_5-review.doc
Content
Contents Page
1. BACKGROUND 1
Purpose of this Report 1
Site Location 1
2. ASSESSMENT OF EXISTING CONDITIONS 3
Current Development 3
Road Network 3
Signals 6
Public Transport Network 10
Pedestrian and Cycle Network 13
Parking 14
Intersection 5 16
3. MASTERPLAN PROPOSED FUTURE CONDITIONS 21
Development Proposal; Proposed Action-Alternative 1 21
Road Network 23
Servicing 24
Signals 26
Public Transport 28
Pedestrian and Cyclist Accessibility 32
Parking 34
Intersection 5 38
4. IMPACT ANALISYS ALTERNATIVES 41
Introduction 41
Development Proposal: Proposed Action Alternative 2 41
Alternative 3 - Modified No Action 48
Alternative 4 - No Action 48
5. PARAMICS MODELING FOR ALTERNATIVES 49
Base Model 49
Proposed Action Alternative 1 57
Proposed Action-Alternative 2 65
Modified No Action-Alternative 3 73
No Action-Alternative 4 79

P:\Projects\220022~1\01\Work\SJW\Output\Report\San Juan Waterfront Masterplan Transport Assessment_5-review.doc
Content
6. TRIP GENERATION 84
Introduction 84
Trip Generation Manual 84
San Juan: Other Developments 84
Convention Center District (PRCCD) 88
San Juan Waterfront, Proposed Alternative 1 88
San Juan Waterfront, Proposed Alternative 2 91
San Juan Waterfront: CT-3 Zoning (Alternative 3) 92
7. PARAMICS MODELING RESULTS 94
Introduction 94
Base Model 95
Proposed Action-Alternative 1 98
Proposed Action-Alternative 2 98
Modified No Action-Alternative 3 103
No Action-Alternative 4 103
Results Analysis 108
8. SIGNAL NEED STUDY 111
Introduction 111
Manual of Uniform Traffic Control Devices 111
Traffic Signal Warrants 111
9. CONSTRUCTION PHASES 114
Introduction 114
Construction Phase 1 114
Results 117
Construction Phase 2 120
Results 121
10. CONCLUSIONS AND RECOMMENDATIONS 123
Conclusions 123
Recommendations 123

P:\Projects\220022~1\01\Work\SJW\Output\Report\San Juan Waterfront Masterplan Transport Assessment_5-review.doc
Content
FIGURES
Figure 1.1 Project Area 2
Figure 2.1 Existing Road Network 5
Figure 2.2 Fernández Juncos Avenue and Valdés Street Intersection Signal Timings – AM Peak 6
Figure 2.3 Fernández Juncos Avenue and Valdés Street Intersection Signal Timings – PM Peak 6
Figure 2.4 Fernández Juncos Avenue and San Andrés Street Intersection Signal Timings – AM Peak 7
Figure 2.5 Fernández Juncos Avenue and San Andrés Street Intersection Signal Timings – PM Peak 7
Figure 2.6 Fernández Juncos Avenue and Matias Ledesma Street Intersection Signal Timings – AM Peak 7
Figure 2.7 Fernández Juncos Avenue and Matías Ledesma Street Intersection Signal Timings – PM Peak 8
Figure 2.8 AMA Bus Routes to Isleta de San Juan 11
Figure 2.9 Pedestrian Crossings at Fernández Juncos Avenue 13
Figure 2.10 Del Tren Street - Existing Conditions 14
Figure 2.11 Existing Mayor Parking Facilities at the Isleta 15
Figure 2.12 Intersection 5 Location 17
Figure 2.13 Current Intersection 5 Road Network 18
Figure 2.14 AM Peak Period Traffic 19
Figure 2.15 PM Peak Period Traffic 19
Figure 3.1 Proposed Action Development Blocks 22
Figure 3.2 Proposed Vehicular Connectors 25
Figure 3.3 Proposed Signalization Startegy 27
Figure 3.4 Light Rail Example 28
Figure 3.5 Light Rail Proposed Allignment and Stops Along the Isleta 29
Figure 3.6 Water Taxis Route 31
Figure 3.7 Pedestrians and Cyclist Pathways 33
Figure 3.8 Pedestrians Crossing Light Rail Tracks 34
Figure 3.9 Intersection 5 Proposed Design 40
Figure 4.1 Alternative 2 Development Blocks 43
Figure 5.1 Base Modelled; Modeled Highway Network 52

P:\Projects\220022~1\01\Work\SJW\Output\Report\San Juan Waterfront Masterplan Transport Assessment_5-review.doc
Content
Figure 5.2 Base AM Turning Movements; Intersection 1 53
Figure 5.3 Base AM Turning Movements; Intersections 2 53
Figure 5.4 Base AM Turning Movements; Intersections4, 5A, 6 53
Figure 5.5 Base AM Turning Movements; Intersections 8, 9, 10, 11 54
Figure 5.6 Base AM Turning Movements; Intersections 12, 13, 14, 15, 16, 17 54
Figure 5.7 Base AM Turning Movements; Intersections 18, 19, 20, 21 54
Figure 5.8 Base PM Turning Movements; Intersection 1 55
Figure 5.9 Base PM Turning Movements; Intersection 2 55
Figure 5.10 Base PM Turning Movements; Intersections 4, 5A, 6 55
Figure 5.11 Base PM Turning Movements; Intersections 8, 9, 10, 11 56
Figure 5.12 Base PM Turning Movements; Intersections 12, 13, 14, 15, 16, 17 56
Figure 5.13 Base PM Turning Movements; Intersections 18, 19, 20, 21 56
Figure 5.14 Proposed Action Alternative 1; Modeled Highway Network 58
Figure 5.15 PA_Alt1 AM Turning Movements; Intersection 1 59
Figure 5.16 PA_Alt1 AM Turning Movements; IntersectionS 2, 3 59
Figure 5.17 PA_Alt1 AM Turning Movements; IntersectionS 4, 5A, 6, 7, 8, 9, 22, 23 59
Figure 5.18 PA_Alt1 AM Turning Movements; IntersectionS 10, 11, 12, 13, 24 60
Figure 5.19 PA_Alt1 AM Turning Movements; IntersectionS 14, 15 60
Figure 5.20 PA_Alt1 AM Turning Movements; IntersectionS 16, 17, 18, 19, 25, 26 61
Figure 5.21 PA_Alt1 AM Turning Movements; IntersectionS 21, 27, 28 61
Figure 5.22 PA_Alt1 PM Turning Movements; Intersection 1 62
Figure 5.23 PA_Alt1 PM Turning Movements; IntersectionS 2, 3, 4, 5A 62
Figure 5.24 PA_Alt1 PM Turning Movements; IntersectionS 4, 5A, 6, 7, 8, 9, 22, 23 63
Figure 5.25 PA_Alt1 PM Turning Movements; IntersectionS 10, 11, 12, 13, 24 63
Figure 5.26 PA_Alt1 PM Turning Movements; IntersectionS 14, 15 64
Figure 5.27 PA_Alt1 PM Turning Movements; IntersectionS 16, 17, 18, 19, 25, 26 64
Figure 5.28 PA_Alt1 PM Turning Movements; IntersectionS 21, 27, 28 64
Figure 5.29 Proposed Action Alternative 2; Modeled Highway Network 66
Figure 5.30 PA_Alt2 AM Turning Movements; Intersection 1 67
Figure 5.31 PA_Alt2 AM Turning Movements; Intersection 2 67
Figure 5.32 PA_Alt2 AM Turning Movements; Intersections 3, 4, 5A, 6, 7, 22 67

P:\Projects\220022~1\01\Work\SJW\Output\Report\San Juan Waterfront Masterplan Transport Assessment_5-review.doc
Content
Figure 5.33 PA_Alt2 AM Turning Movements; Intersections 8, 9, 10, 11, 23 68
Figure 5.34 PA_Alt2 AM Turning Movements; Intersections 12, 13, 15 68
Figure 5.35 PA_Alt2 AM Turning Movements; Intersection 14 69
Figure 5.36 PA_Alt2 AM Turning Movements; Intersections 16, 17, 18, 19, 25 69
Figure 5.37 PA_Alt2 AM Turning Movements; Intersections 21, 26, 27, 28 69
Figure 5.38 PA_Alt2 PM Turning Movements; Intersection 1 70
Figure 5.39 PA_Alt2 PM Turning Movements; Intersection 2 70
Figure 5.40 PA_Alt2 PM Turning Movements; Intersections 3, 4, 5A, 6, 7, 22 70
Figure 5.41 PA_Alt2 PM Turning Movements; Intersections 8, 9, 10, 11, 23 71
Figure 5.42 PA_Alt2 PM Turning Movements; Intersections 12, 13, 15 71
Figure 5.43 PA_Alt2 PM Turning Movements; Intersection 14 72
Figure 5.44 PA_Alt2 PM Turning Movements; Intersections 16, 17, 18, 19, 25 72
Figure 5.45 PA_Alt2 PM Turning Movements; Intersections 21, 26, 27, 28 72
Figure 5.46 Modified No Action and No Action (Alterantives 3 & 4); Modeled Highway Network 74
Figure 5.47 MNA_Alt3 AM Turning Movements; Intersection 1 75
Figure 5.48 MNA_Alt3 AM Turning Movements; Intersection 2 75
Figure 5.49 MNA_Alt3 AM Turning Movements; Intersections 4, 5A, 6 75
Figure 5.50 MNA_Alt3 AM Turning Movements; Intersections 8, 9, 10, 11 76
Figure 5.51 MNA_Alt3 AM Turning Movements; Intersections 12, 13, 14, 15, 16, 17 76
Figure 5.52 MNA_Alt3 AM Turning Movements; Intersection 18, 19, 21 76
Figure 5.53 MNA_Alt3 PM Turning Movements; Intersection 1 77
Figure 5.54 MNA_Alt3 PM Turning Movements; Intersection 2 77
Figure 5.55 MNA_Alt3 PM Turning Movements; Intersections 4, 5A, 6 77
Figure 5.56 MNA_Alt3 PM Turning Movements; Intersections 8, 9, 10, 11 78
Figure 5.57 MNA_Alt3 PM Turning Movements; Intersections 12, 13, 14, 15, 16, 17 78
Figure 5.58 MNA_Alt3 AM Turning Movements; Intersection 18, 19, 21 78
Figure 5.59 NA_Alt4 AM Turning Movements; Intersection 1 79
Figure 5.60 NA_Alt4 AM Turning Movements; Intersection 2 79
Figure 5.61 NA_Alt4 AM Turning Movements; Intersections 4, 5A, 6 80
Figure 5.62 NA_Alt4 AM Turning Movements; Intersections 8, 9, 10, 11 80

P:\Projects\220022~1\01\Work\SJW\Output\Report\San Juan Waterfront Masterplan Transport Assessment_5-review.doc
Content
Figure 5.63 NA_Alt4 AM Turning Movements; Intersections 12, 13, 14, 15, 16, 17 80
Figure 5.64 NA_Alt4 AM Turning Movements; Intersection 18, 19, 21 81
Figure 5.65 NA_Alt4 PM Turning Movements; Intersection 1 81
Figure 5.66 NA_Alt4 PM Turning Movements; Intersection 2 81
Figure 5.67 NA_Alt4 PM Turning Movements; Intersections 4, 5A, 6 82
Figure 5.68 NA_Alt4 PM Turning Movements; Intersections 8, 9, 10, 11 82
Figure 5.69 NA_Alt4 PM Turning Movements; Intersections 12, 13, 14, 15, 16, 17 82
Figure 5.70 NA_Alt4 AM Turning Movements; Intersection 18, 19, 21 83
Figure 6.1 Locations of Developments within the study influence area 86
Figure 7.1 AM Results; Base Model 96
Figure 7.2 PM Results; Base Model 97
Figure 7.3 AM Results; PA_Alt 1 Models 99
Figure 7.4 PM Resuts; PA_Alt 1 Model 100
Figure 7.5 AM Results; PA_Alt2 Model 101
Figure 7.6 PM Results; PA_Alt2 Model 102
Figure 7.7 AM Results; MNA_Alt 3 Model 104
Figure 7.8 PM Results; MNA_Alt 3 Model 105
Figure 7.9 AM Results; NA_Alt 4 Model 106
Figure 7.10 PM Results; NA_Alt 4 Model 107
Figure 9.1 Construction Phase 1; Modeled Highway Network 116
Figure 9.2 Construction Phase 1 Version 2; Modeled Highway Network 119
Figure 9.3 Construction Phase 2; Modeled Highway Network 122
TABLES
Table 2.1 Bus Services via Del Tren Street 10
Table 2.2 Bus Services via Muñoz Rivera Avenue 12
Table 2.3 AM Peak Period Bus Services Usage at the San Juan Isleta 12
Table 2.4 PM Peak Period Bus Services Usage at the San Juan Isleta 13
Table 3.1 Western Area Development Program: Proposed Action 21
Table 3.2 Eastern Area Development Program: Proposed Action 21
Table 3.3 Proposed Parking per Block for the West Area 35

P:\Projects\220022~1\01\Work\SJW\Output\Report\San Juan Waterfront Masterplan Transport Assessment_5-review.doc
Content
Table 3.4 Proposed Parking per Block for the East Area 35
Table 3.5 Required Parking per Block for the West Area 35
Table 3.6 Required Parking per Block for the East Area 36
Table 3.7 Shared Parking Requirement Analysis for the West Area; Typical Weekday 37
Table 3.8 Shared Parking Requirement Analysis for the East Area; Typical Weekday 38
Table 4.1 Western Area Development Program: Alternative 2 41
Table 4.2 Eastern Area Development Program: Alternative 2 42
Table 4.3 Alternative 2 Parking per Block for the West Area 44
Table 4.4 Alternative 2 Parking per Block for the East Area 44
Table 4.5 Required Parking per Block for the West Area; Alt2 45
Table 4.6 Required Parking per Block for the East Area; Alt2 45
Table 4.7 Shared Parking Requirement Analysis for the West Area; Typical Weekday; Alt2 46
Table 4.8 Shared Parking Requirement Analysis for the East Area; Typical Weekday; Alt2 47
Table 5.1 Journey Time Data Validation 50
Table 5.2 DMRB Validation Guidelines 50
Table 6.1 Expected Developments within the Study Influence Area 85
Table 6.2 Total Adjusted Trip Generation of Expected Developments within the Study influence area 87
Table 6.3 Convention Center District Land Uses 88
Table 6.4 Convention Center District Total Adjusted Trip Generation 88
Table 6.5 Proposed Alternative 1 Areas Per Land Use; West End 89
Table 6.6 Proposed Alternative 1 Areas Per Land Use; East End 89
Table 6.7 Porposed Alternative 1 Adjusted trip generation; West End 90
Table 6.8 Proposed Alternative 1 Adjusted trip Generation; East End 90
Table 6.9 Proposed Alternative 2 Areas Per Land Use; West End 91
Table 6.10 Porposed Alternative 2 Areas Per Land Use; East End 91
Table 6.11 Proposed Alternative 2 Adjusted Trip Generation; West End 92
Table 6.12 Proposed Alternative 2 Adjusted Trip Generation; East End 92
Table 6.13 San Juan Waterfront Development Under CT-3 Zoning 93
Table 6.14 San Juan Waterfront CT-3 Zoning Adjusted Trip Generation 93

P:\Projects\220022~1\01\Work\SJW\Output\Report\San Juan Waterfront Masterplan Transport Assessment_5-review.doc
Content
Table 7.1 Grades of Level of Service 94
Table 7.2 Travel Times along Fernández Juncos Ave and Del Tren Street; Base Model 95
Table 7.3 Travel Times along Fernández Juncos Ave and Del Tren Street; PA Alt 1 Model 98
Table 7.4 Travel Times along Fernández Juncos Ave and Del Tren Street; PA_Alt2 Model 98
Table 7.5 Travel Times along Fernández Juncos and Del Tren Street; MNA_Alt 3 Model 103
Table 7.6 Travel Times along Fernández Juncos and Del Tren Street; NA_Alt 4 Model 103
Table 8.1 AM and PM Traffic Volumes for the Proposed Action 113
Table 9.1 Trip Generation for the PRCCD by 2011 115
Table 9.2 Travel Times for Fernández Juncos during Construction Phase 1 117
Table 9.3 Travel Time along Fernández Juncos for the Construction Phase V2 Models 118
Table 9.4 Trip Generation for the PRCCD by 2015 120
Table 9.5 Trip Generation for the San Juan Waterfront by 2015 120
Table 9.6 Travel Times for Fernández Juncos during Construction Phase 2 121
APPENDIX
APPENDIX A Study Area Photos APPENDIX B Traffic Counts, Bus and Journey Time Surveys APPENDIX C Average Annual Daily Traffic on the Project Area APPENDIX D Trip Generation Spreadsheets APPENDIX E Paramics Demand Inputs APPENDIX F Paramics Outputs APPENDIX G Accident Data for the San Juan Isleta

P:\Projects\220022~1\01\Work\SJW\Output\Report\San Juan Waterfront Masterplan Transport Assessment_5-review.doc
1
1. BACKGROUND
1.1 Colliers International has putted together a multidisciplinary group to prepare the San Juan Waterfront Masterplan on behalf of the Puerto Rico Ports Authority (PRPA). Steer Davies Gleave, as transport consultants for the Puerto Rico Highway and Transportation Authority (PRHTA), has been working with the Colliers team providing transportation advice throughout the definition and preparation of this Masterplan.
Purpose of this Report
1.2 This report represents the Transport Assessment for the Environmental Impact Statement (EIS) for the San Juan Waterfront development project.
1.3 The work presented in this report is a continuation of the San Antonio Canal Masterplan Transport Report issued to Colliers in August 2006.
Site Location
1.4 The Masterplan scheme will be located in Puerta de Tierra at the San Juan Isleta. This area is bounded by Muñoz Rivera Avenue to the north, Baldorioty de Castro to the east, San Antonio Canal o the south and Del Muelle Street to the west.
1.5 The San Juan Waterfront Masterplan covers the predominantly industrial area in the southern part of Puerta de Tierra bounded by Fernández Juncos Avenue to the north, Intersection 5 (I5) to the east, the San Antonio Canal to the south and Del Muelle Street to the west. Intersection 5 is referred to the junction area where all the access roads to the Isleta de San Juan merge. The intersection area is over the San Antonio Canal. The roads composing the Intersection 5 area: Ponce de León Avenue (PR-25), Fernández Juncos Avenue (PR-35), Baldorioty de Castro Ave (PR-26), Muñoz Rivera Avenue (PR-1), Condado Avenue1..
1.6 Figure 1.1 shows the location of the San Juan Waterfront Masterplan area.
1 Intersection 5 is defined in more detail in Chapter 2

P:\P
rojects\220
022~1
\01\W
ork\SJW
\Ou
tput\Report\S
an Juan Waterfront M
asterplan T
ransport Assessm
ent_5
-review.doc
2
FIG
UR
E 1.1
PR
OJE
CT A
RE
A
N

P:\Projects\220022~1\01\Work\SJW\Output\Report\San Juan Waterfront Masterplan Transport Assessment_5-review.doc
3
2. ASSESSMENT OF EXISTING CONDITIONS
Current Development
2.1 The San Juan Waterfront Masterplan area is currently occupied predominantly by industrial premises, mostly owned by PRPA. Other varied uses are found within this area including office buildings (public, private and federal), gas stations, and a police precinct.
2.2 The area to the north of the Waterfront development boundaries is occupied by residential units, government buildings and small retail units.
2.3 Appendix A includes a series of pictures of the study area.
Road Network
2.4 Whilst connections to the east and west are relatively good for the site area, connectivity in a north-south direction is less easy. Existing access to the Masterplan area is provided from the east and west by Fernández Juncos Avenue (via I5 from the east and from Old San Juan from the west). Access to the San Juan Waterfront area is provided via a series of side streets perpendicular to Fernández Juncos Avenue including San Andrés, Tadeo Rivera, Matías Ledesma and San Juan Bautista. Figure 2.1 shows the existing road network of the area.
2.5 PR-35 (Fernández Juncos Avenue) provides an access from the San Juan Isleta to Hato Rey passing through Miramar and Santurce. This is a two to three lanes one-way road going southbound from I5 to Hato Rey.
2.6 Along the Isleta Fernández Juncos Ave becomes the southern access to Old San Juan with four-lane two-way traffic from I5 to G. Concepción de Gracia Street.
2.7 Del Tren Street extends parallel to Fernández Juncos Avenue along the Isleta and provides two-way bus only access.
2.8 There are various traffic signals along Fernández Juncos Avenue and Del Tren Street (immediately north of the Masterplan area):
• Fernández Juncos Avenue and: Valdés, San Andrés, Matías Ledesma, and Calle 3 streets.
• Del Tren and: Valdés, Matías Ledesma, Ramon Power, and Calle 5 streets.
2.9 PR-1 (Muñoz Rivera Avenue) south of Intersection 5 provides a strategic highway to highway interchange connecting the Isleta the San Juan to major highways such as PR-18, PR-2, PR-26 and PR-22.
2.10 Along the Isleta, Muñoz Rivera Avenue provides inbound access to the north by two-lanes of traffic road westbound only. It has a counter-flow bus lane from Gerardo Dávila to San Agustín Street.

P:\Projects\220022~1\01\Work\SJW\Output\Report\San Juan Waterfront Masterplan Transport Assessment_5-review.doc
4
2.11 PR-25 [Ponce de León Avenue/Constitución Avenue (along Puerta de Tierra)] provides a link between San Juan Isleta and Río Piedras (passing by the University of Puerto Rico) via Miramar and Hato Rey (the business district of San Juan). This is a one-way, three lane road northbound from I5 to Río Piedras with a counter-flow bus lane.
2.12 Along the Isleta this road provides two to three lanes of traffic road eastbound. A westbound bus lane is provided along the length of this road from I5 to Gerardo Dávila Street.
2.13 PR-26 (Baldorioty de Castro Expressway) provides a strategic link between the San Juan Isleta and Carolina to the east of San Juan. PR-26 passes through Condado and Isla Verde by the Luis Muñoz Marín International Airport.

P:\P
rojects\220
022~1
\01\W
ork\SJW
\Ou
tput\Report\S
an Juan Waterfront M
asterplan T
ransport Assessm
ent_5
-review.doc
5
Fern
andez J
uncos A
ve
.
Muñoz R
ivera
Ave
.
Del T
ren S
t
Ponce d
e L
eón A
ve.
San A
gustin
St
San Juan
Bautistat St
Matias Ledesma
Valdes St
S. Andres St
N. Pelayo St
Tadeo Rivera
St
Ramon Power St
Gerardo Davila
St.
Estevez St.
Tra
ffic D
irectio
n
Exclu
siv
e B
us R
oad
; Tra
ve
l Dire
ctio
n
Tra
ffic S
ignal
San Agustin
FIG
UR
E 2.1
EX
IST
ING
RO
AD
NE
TWO
RK
N
Old S
an Juan
G. C
oncepción de G
racia
Fern
ández
I5

P:\Projects\220022~1\01\Work\SJW\Output\Report\San Juan Waterfront Masterplan Transport Assessment_5-review.doc
6
Signals
2.14 Steer Davies Gleave personnel undertook signal timings surveys in June 2007 for the intersections along the Fernández Juncos Avenue. These signal timings are shown in Figure 2.2 to Figure 2.7. The signal of Fernández Juncos and Calle 3 was not surveyed since this is only activated by request and it is most of the time giving continuous green to Fernández Juncos Avenue traffic.
FIGURE 2.2 FERNÁNDEZ JUNCOS AVENUE AND VALDÉS STREET INTERSECTION SIGNAL TIMINGS – AM PEAK
Cycle TimePhase 1 6 3 107Phase 2 74 3 107Phase 3 16 2 1 107
6 9 10 84 87 88 104 106 1076 3 1 74 3 1 16 2 1
AM
Phase 1 Phase 2 Phase 3
9810 20
88
FIGURE 2.3 FERNÁNDEZ JUNCOS AVENUE AND VALDÉS STREET INTERSECTION SIGNAL TIMINGS – PM PEAK
Cycle TimePhase 1 6 3 109Phase 2 76 3 109Phase 3 15 2 1 109
6 9 10 86 89 90 105 108 1096 3 1 76 3 1 15 3 1
PM
Phase 1 Phase 2 Phase 3
10010 19
90

P:\Projects\220022~1\01\Work\SJW\Output\Report\San Juan Waterfront Masterplan Transport Assessment_5-review.doc
7
FIGURE 2.4 FERNÁNDEZ JUNCOS AVENUE AND SAN ANDRÉS STREET INTERSECTION SIGNAL TIMINGS – AM PEAK
Cycle TimePhase 1 16 3 112Phase 2 112Phase 3 81 3 1 112
16 19 20 101 104 10516 3 1 81 3 1
AM
93
2720 7 85
1127
Phase 3Phase 2Phase 1
FIGURE 2.5 FERNÁNDEZ JUNCOS AVENUE AND SAN ANDRÉS STREET INTERSECTION SIGNAL TIMINGS – PM PEAK
Cycle TimePhase 1 17 3 125Phase 2 125Phase 3 93 3 1 125
17 20 21 114 117 11817 3 1 93 3 1
PM
7125
Phase 1 Phase 3Phase 2
72128
97105
FIGURE 2.6 FERNÁNDEZ JUNCOS AVENUE AND MATIAS LEDESMA STREET INTERSECTION SIGNAL TIMINGS – AM PEAK
Cycle TimePhase 1 20 3 101Phase 2 3 101Phase 3 34 4 101Phase 4 15 4 1 101
20 23 24 42 76 80 81 96 100 10120 3 1 3 34 4 1 15 4 1
AM
Phase 1 Phase 2 Phase 3 Phase 4
81
3915
7824
42 2115 59

P:\Projects\220022~1\01\Work\SJW\Output\Report\San Juan Waterfront Masterplan Transport Assessment_5-review.doc
8
FIGURE 2.7 FERNÁNDEZ JUNCOS AVENUE AND MATÍAS LEDESMA STREET INTERSECTION SIGNAL TIMINGS – PM PEAK
Cycle TimePhase 1 20 3 101Phase 2 3 101Phase 3 34 4 101Phase 4 15 4 1 101
20 23 24 42 76 80 81 96 100 10120 3 1 3 34 4 1 15 4 1
PM
Phase 1 Phase 2 Phase 3 Phase 4
15
42 2181
39
7824 15 59
Traffic Survey
2.15 Automatic traffic counts (9 locations) and manual traffic counts (20 intersections) were undertaken along the San Juan Isleta from December 2006 to February 20072: (Surveys are included in Appendix B)
Automatic Traffic Counts:
• Fernández Juncos Avenue east of Concepción de Gracia St.
• Del Tren Street east of Concepción de Gracia St.
• Covandonga west of Gerardo Dávila Street
• Constitución west of Gerardo Dávila Street
• Muñoz Rivera west of Gerardo Dávila Street
• Fernández Juncos east of Calle 5
• Del Tren Street east of Calle 5
• Constitución Ave. east of Calle 5
• Muñoz Rivera west of Normandie Hotel
Manual Counts:
• Fernández Juncos Avenue / Calle 5
• Fernández Juncos Avenue / Calle 3
• Fernández Juncos Avenue / Ramón Power Street
• Fernández Juncos Avenue / Fernández Street
2 No counts were undertaken during the Christmas holidays.

P:\Projects\220022~1\01\Work\SJW\Output\Report\San Juan Waterfront Masterplan Transport Assessment_5-review.doc
9
• Fernández Juncos Avenue / San Juan Bautista Street
• Fernández Juncos Avenue / Matías Ledesma Street
• Fernández Juncos Avenue / San Andrés Street
• Fernández Juncos Avenue / Valdés Steet Street
• Fernández Juncos Avenue / G. Concepción de Gracia Street
• Muñoz Rivera Avenue / Normandie access
• Muñoz Rivera Avenue / Matías Ledesma Street
• Muñoz Rivera Avenue / Pelayo Street
• Muñoz Rivera Avenue / Esteves Street
• Muñoz Rivera Avenue / Reverendo Gerardo Dávila Street
• De la Constitución Avenue / Calle 5
• De la Constitución Avenue / Ramón Power Street
• De la Constitución Avenue / San Agustín Street
• De la Constitución Avenue / Matías Ledesma Street
• De la Constitución Avenue / Pelayo Street
• De la Constitución Avenue / Esteves Street
2.16 Further manual counts were undertaken in May 2007 at:
• Muñoz Rivera Avenue / San Francisco Street
• Ponce de León Avenue / Fortaleza Street
• Covadonga / J.A. Corretjer Street
• Los Veteranos Ave. / J.A. Corretjer Street

P:\Projects\220022~1\01\Work\SJW\Output\Report\San Juan Waterfront Masterplan Transport Assessment_5-review.doc
10
Public Transport Network
AMA
2.17 The San Juan Isleta is served by six bus routes of the Metropolitan Transit Authority (AMA, for its Spanish acronym). These routes have exclusive lanes along Muñoz Rivera Avenue and Ponce de León Avenue and a dedicated two-way transit corridor (Del Tren Street).
2.18 Figure 2.8 shows the routes of the AMA bus services through the Isleta.
2.19 The three bus services shown in Table 2.1 are routed into and out of the San Juan Isleta via the Del Tren Street, which runs through the center of the San Juan Isleta, immediately to the north of the Masterplan area.
TABLE 2.1 BUS SERVICES VIA DEL TREN STREET
Frequency Service Number Service Route
Mon-Fri (daytime) Saturday/Sunday & Holiday
A-5 San Juan – Pda. 18 – Calle Loiza – Isla Verde – Los Ángeles - Iturregui
Every 8 minutes Every 15/20 minutes
A-9
Río Piedras – Ave. Borinquen - Estación Sagrado Corazón – Ave. F. Juncos – Pda. 18 – San Juan
Every 9 minutes Every 15/20 minutes
B-8 San Juan – Pda. 18 – Ave. Kennedy – San Patricio
Every 20 minutes Every 30/20 minutes
2.20 The three bus services shown in Table 2.3 are routed into and out of the San Juan Isleta via Muñoz Rivera (eastbound) and De la Constitución (westbound) avenues, which run to the north of the Masterplan area.

P:\P
rojects\220
022~1
\01\W
ork\SJW
\Ou
tput\Report\S
an Juan Waterfront M
asterplan T
ransport Assessm
ent_5
-review.doc
11
FIG
UR
E 2.8
AM
A B
US
RO
UT
ES
TO IS
LETA
DE
SA
N JU
AN
N

P:\Projects\220022~1\01\Work\SJW\Output\Report\San Juan Waterfront Masterplan Transport Assessment_5-review.doc
12
TABLE 2.2 BUS SERVICES VIA MUÑOZ RIVERA AVENUE
Frequency Service Number Service Route
Mon-Fri (daytime) Weekend
B-21
San Juan – Condado -Pda. 18 – Ave. F. Juncos – Estación Sagrado Corazón – Plaza Las Américas
Every 20 minutes Every 25 minutes
M-1
San Juan – Santurce – Estación Sagrado Corazón – Estación Hato Rey – Estación Roosevelt – Estación Domenech – Río Piedras
Every 10 minutes Every 15 minutes
M-E
San Juan – Santurce – Estación Sagrado Corazón – Estación Hato Rey – Estación Roosevelt – Estación Domenech – Río Piedras
Every 10 minutes No service
2.21 A survey was undertaken on September 2007 to assess peak hour3 bus usage on a typical weekday at the Isleta. The number of passengers using the bus service within the Isleta4 was counted for Inbound and Outbound services by boarding the buses along their route in the Isleta for the peak periods. Table 2.3 summarizes the AM Peak bus usage and Table 2.4 shows the survey results for the PM Peak period. Surveys are included in Appendix B.
TABLE 2.3 AM PEAK PERIOD BUS SERVICES USAGE AT THE SAN JUAN ISLETA
Inbound Bus Service
A-5 A-9 B-8 B-21 M-1 M-E TOTAL
Total Buses 2 4 3 1 7 2 19
Average No. Passengers 11 18 5 7 38 13 92
Bus Usage 22 72 15 7 266 26 408
Outbound Bus Service
A-5 A-9 B-8 B-21 M-1 M-E TOTAL
Total Buses 3 3 2 3 9 1 21
Average No. Passengers 10 9 3 11 14 6 53
Bus Usage 30 27 6 33 126 6 228
3 Road/traffic peak hour – AM (7:30-8:30) and PM (4:00-5:00). 4 Service within the Isleta considers every bus passenger that access or egress the bus at the San Juan Isleta area,
considered to be west of Intersection 5.

P:\Projects\220022~1\01\Work\SJW\Output\Report\San Juan Waterfront Masterplan Transport Assessment_5-review.doc
13
TABLE 2.4 PM PEAK PERIOD BUS SERVICES USAGE AT THE SAN JUAN ISLETA
Inbound Bus Service
A-5 A-9 B-8 B-21 M-1 M-E TOTAL
Total Buses 4 1 1 2 7 3 18
Average No. Passengers 19 13 7 12 18 11 110
Bus Usage 76 13 7 24 126 33 279
Outbound Bus Service
A-5 A-9 B-8 B-21 M-1 M-E TOTAL
Total Buses 4 2 4 2 6 3 21
Average No. Passengers 23 24 7 22 18 24 118
Bus Usage 92 48 28 44 108 72 392
Pedestrian and Cycle Network
2.22 Fernández Juncos Avenue which runs in the northern edge of the Masterplan area, has narrow sidewalks that are in a poor condition along both sides of the street. Pedestrian crossings are demarked at the signalized intersections along Fernández Juncos Avenue (Figure 2.9). There are no other formal pedestrian crossing facilities to cross this four-lane highway creating a degree of pedestrian severance between the southern and northern sides of the highway.
FIGURE 2.9 PEDESTRIAN CROSSINGS AT FERNÁNDEZ JUNCOS AVENUE

P:\Projects\220022~1\01\Work\SJW\Output\Report\San Juan Waterfront Masterplan Transport Assessment_5-review.doc
14
2.23 The Del Tren Street (exclusive AMA bus corridor, Figure 2.10) has no proper sidewalks on either side of the highway and lacks proper bus stops. The Street is lightly trafficked since it dedicated exclusively to AMA bus services. Del Tren Street has vacant building on both sides and rough neighborhood, which has resulted in it been known as a crime hotspot and a local ‘no go area’. Both of these facts have resulted in pedestrians avoiding this Street.
FIGURE 2.10 DEL TREN STREET - EXISTING CONDITIONS
2.24 All the sounding side streets leading off from Fernández Juncos Avenue have sidewalks along both sides of the street; the qualities of these facilities varies from street to street, but in general are poor.
2.25 No formal cycle lanes or cycle parking facilities are currently provided within the Masterplan area and the San Juan Isleta. Existing road pavement conditions along Fernández Juncos Avenue make cycling an unsafe practice. The deserted environment of Del Tren Street results in cyclists avoiding this Street.
Parking
2.26 There are various major parking facilities in the Isleta that currently serve residents, retail outlets and offices in the area (Figure 2.11).
2.27 In total there are 1,885 spaces but most of these are not available for use by the general public, being exclusive for government agencies or residential buildings.

P:\P
rojects\220
022~1
\01\W
ork\SJW
\Ou
tput\Report\S
an Juan Waterfront M
asterplan T
ransport Assessm
ent_5
-review.doc
15
FIG
UR
E 2.11
EX
IST
ING
MA
YO
R P
AR
KIN
G F
AC
ILITIE
S A
T T
HE
ISLE
TA
910
2
51
8
43
76
24 Ho
ur se
rvice
exclus
ively for
Cam
era and S
enate
· Ge
naral L
ibrary spaces are
for e
mp
loyee
s (6-16:30)· A
afet space
s are on
stre
et re
serve
for the
A
dministratio
n· A
trium P
arkin
g adm
inis
ter by C
en
tral Parking
; th
ey h
ave s
ome
mo
nthly rente
d s
paces
and the
parking is
rarelly fu
ll
MA
IN P
AR
KIN
G A
RE
AS
:
*Information ob
tained from: O
ld San Juan C
orridor Study; June 1998; P
RH
TA
12345
678910
Capitolio (300 spaces)*
Luis A Ferre (750 spaces for C
amera and S
enate employees)
Near H
ogares Crea (150 spaces for the C
amera em
ployees)
Sm
all Parking (17 spaces for Senate em
ployees)
PR N
ational Guard (396 spaces)*
Abandoned Parking
Abandoned Parking
Sm
all Parking (15 spaces)
Torre la Reina (180 spaces)*
General Library/A
afet/Atrium
(30/11/36 spaces)
N

P:\Projects\220022~1\01\Work\SJW\Output\Report\San Juan Waterfront Masterplan Transport Assessment_5-review.doc
16
Intersection 5
2.28 This intersection provides the “gateway” to the Isleta and it is one of the most heavily used intersections in Puerto Rico (Figure 2.12). It caters for a significant amount of traffic (the traffic surveys recorded around 97,700 vehicles crossing the Esteves and San Antonio bridges daily on a typical weekday).
2.29 The existing road network near I5 comprises a variety of highway features: over-bridges, traffic signals, on and off highway ramps, lane diverges, lane merges, weaving sections and some priority controlled movements. In addition, some movements can only be made by taking complex, circuitous routes.
2.30 The existing design of I5 does not encourage pedestrians and cyclists, except perhaps around the perimeter of the Intersection.
2.31 The existing road layout is shown in Figure 2.13. To the south, a complex series of bridges, merges and diverges provides connections to the following roads:
• San Antonio Bridge (only used by southbound traffic)
• Esteves Bridge (only used by northbound traffic)
• Luis Muñoz Rivera Expressway (PR-1) (provides access to Hato Rey)
• Ponce de León Avenue (PR-25) (provides access from Hato Rey)
• Fernández Juncos Avenue (PR-35)
• Baldorioty de Castro Expressway (PR-26) (Provides access towards the Luis Muñoz Marín International Airport and Isla Verde)
• Baldorioty de Castro Boulevard (provides access to the Convention Center)
2.32 To the northern side of the two bridges, a third bridge (Dos Hermanos Bridge) provides access to Condado. Further to the north, the two main bridges (San Antonio and Esteves) are connected together by a set of ramps, which links with two separate routes heading towards the Isleta of San Juan (Fernández Juncos Avenue and Luis Muñoz Rivera) and from the Isleta (Fernández Juncos Avenue and Ponce de León Avenue).
2.33 The existing design of the road network combined with the high traffic volume result in regularly experienced delays and congestion during morning and evening peak periods. The number of vehicles using I5 during these peak periods is shown in Figure 2.14 and Figure 2.15.
2.34 Traffic levels are expected to grow in the future due to increased economic activity and higher levels of tourism from proposed development including the San Juan Waterfront and the Convention Centre District. Convenient access to each of the areas is critical to their success.

P:\P
rojects\220
022~1
\01\W
ork\SJW
\Ou
tput\Report\S
an Juan Waterfront M
asterplan T
ransport Assessm
ent_5
-review.doc
17
FIG
UR
E 2.12
INT
ER
SE
CT
ION
5 LOC
ATIO
N
N

P:\Projects\220022~1\01\Work\SJW\Output\Report\San Juan Waterfront Masterplan Transport Assessment_5-review.doc
18
FIGURE 2.13 CURRENT INTERSECTION 5 ROAD NETWORK

P:\Projects\220022~1\01\Work\SJW\Output\Report\San Juan Waterfront Masterplan Transport Assessment_5-review.doc
19
FIGURE 2.14 AM PEAK PERIOD TRAFFIC
16051605811811
337337
222222
531531
26532653
13811381
456456
518
518
11531153
43564356
20172017
229
22933
333
3
2466
2466
1135
1135
16051605811811
337337
222222
531531
26532653
13811381
456456
518
518
11531153
43564356
20172017
229
22933
333
3
2466
2466
1135
1135
FIGURE 2.15 PM PEAK PERIOD TRAFFIC
78178116311631
482482
418418
451451
16491649
563563
17851785
179
179
22922292
23802380
42204220
314
31445
045
0
1214
1214
2260
2260
78178116311631
482482
418418
451451
16491649
563563
17851785
179
179
22922292
23802380
42204220
314
31445
045
0
1214
1214
2260
2260
N
N

P:\Projects\220022~1\01\Work\SJW\Output\Report\San Juan Waterfront Masterplan Transport Assessment_5-review.doc
20
2.35 Steer Davies Gleave have been working with the Puerto Rico Highway and Transportation Authority (PRHTA) since 1996 assessing a number of different schemes for I5, depending on the prevailing public policy at the moment.
2.36 Currently, Steer Davies Gleave helped the PRHTA study various proposed design alternatives for I5 in order to:
• Improve vehicle flow through the I5 network
• Remove existing weaving sections and formalize weaving movements (improve safety)
• Improve pedestrian access through I5 to connect:
� Condado/Hotel District, the Convention Center District and the proposed development of the San Juan Waterfront
2.37 The conclusions of this I5 study will directly affect the assessment for the San Juan Waterfront and consequently are part of the future Waterfront roadway network assessment.

P:\Projects\220022~1\01\Work\SJW\Output\Report\San Juan Waterfront Masterplan Transport Assessment_5-review.doc
21
3. MASTERPLAN PROPOSED FUTURE CONDITIONS
Development Proposal; Proposed Action-Alternative 1
3.1 Two alternatives for proposed actions are evaluated in this study; they are referred as Proposed Action Alternative 1 and Proposed Action Alternative 2. They are similar in nature with variations on Marina and Parque de la Bahia locations. These variations in turn have some effect over the roadway network. Alternative 2 and other two alternatives consisting in variations on No-Action Alternatives are discussed on Chapter 4. This Chapter is concerned with Proposed Action Alternative 1, which is the preferred alternative.
3.2 The San Juan Waterfront will be a mixed-use development including residential, commercial, office, hotel and civic uses covering some 2,700,000 sq ft.
3.3 A land-use breakdown is divided in the eastern and western areas defined by Fernández Street (Figure 3.1). Table 3.1 and Table 3.2 below summarize the proposed development program for these two (2) areas of the San Juan Waterfront.
TABLE 3.1 WESTERN AREA DEVELOPMENT PROGRAM: PROPOSED ACTION
Block Commercial (Sq.ft.)
Hotel (Keys)
Casino (Sq.ft.)
Marina Facilities (Berths)
Residential (units)
Civic (Sq.ft.)
A+B+C 27,000 270 10,000 4 D 19,949 31 E1 23,350 115 E2 17,099 200 13 F1 13,492 89 F2 13,727 90 53 G 24,753 160 93 H 16,922 90 71 I 16,558 80 68 J 18,925 80 K 16,700 80 68 L1 17099 62 L2 58,265
TABLE 3.2 EASTERN AREA DEVELOPMENT PROGRAM: PROPOSED ACTION
Block Commercial (Sq.ft.) Residential (units) Civic (Sq.ft.) Office
(Sq.ft.) M 5,364 109 N 8,108 98 O 122 P 119 Q 12,003 128 R 12,004 127 S+T 6,562 68,952 U 35,677 143,206

P:\P
rojects\220022~1\01\Work\S
JW\O
utput\R
eport\San Juan W
aterfront Masterplan T
ransport Assessm
ent_5-review.doc
22
FIG
UR
E 3.1
PR
OP
OS
ED
AC
TION
DE
VE
LOP
ME
NT
BLO
CK
S
N

P:\Projects\220022~1\01\Work\SJW\Output\Report\San Juan Waterfront Masterplan Transport Assessment_5-review.doc
23
Road Network
East/West Connection
3.4 Due to the increased number of vehicles trips likely to be attracted to the Waterfront as a result of the proposed development, it is important that north/south vehicle movements are rationalized to improve the flow along the Fernández Juncos Avenue corridor. The Masterplan proposes to change the existing two-way system of Fernández Juncos to a one-way eastbound (two-lane 10 feet section) system complemented by Del Tren Street by changing the existing character of this Street from a dedicated mass transit corridor to two-lanes westbound general traffic road. (Figure 3.2). This proposed change will increase traffic activity along Del Tren Street, recovering the area from an abandoned zone and generally, resulting in a more attractive environment for pedestrians.
3.5 A mass transport exclusive corridor is proposed along the northern edge of Fernández Juncos Ave. The proposed system is a tramway or light rail transit that will run two-way in a 22 feet section parallel to traffic5.
3.6 East-West movement along the San Juan Waterfront southern edge will be provided by the Paseo del Puerto. This will be a two-way, two lane road with traffic calming to reduce speeds and to discourage use as a by-pass to avoid signals along Fernández Juncos Ave.
North/South Connection
3.7 It is important to improve the existing connectivity Fernández Juncos Avenue and Del Tren Street as these will represent the main accesses to the San Juan Waterfront area. The Masterplan proposes to improve and extend to the south existing corridors (Figure 3.2):
• Valdés Street
• San Andrés Street
• Matías Ledesma Street
• San Juan Bautista Street
• Fernández Street
• Ramón Power Street
• Calle 3
• Calle 5
3.8 Also, new access roads are proposed connecting north-south, including:
• Marina Access
• Pelayo Street
• Padre Hoff Street
5 The proposed tramway is explained in more detail later on this Chapter

P:\Projects\220022~1\01\Work\SJW\Output\Report\San Juan Waterfront Masterplan Transport Assessment_5-review.doc
24
• SJW Access A
• SJW Access B
• SJW Access C
• SJW Access D
• SJW Access E
• SJW Access F
Servicing
3.9 Service vehicles required to access the developments and commercial establishments within the Masterplan area will do so via the primary highway network and then into the proposed San Juan Waterfront internal road network.
3.10 The development proposals have been prepared to ensure that all servicing can be conducted within the back/local internal roads of the commercial properties and proposed blocks therefore avoiding service from main roads or the Paseo del Puerto.

P:\P
rojects\220022~1\01\Work\S
JW\O
utput\R
eport\San Juan W
aterfront Masterplan T
ransport Assessm
ent_5-review.doc
25
FIG
UR
E 3.2
PR
OP
OS
ED
VE
HIC
ULA
R C
ON
NE
CT
OR
S
N

P:\Projects\220022~1\01\Work\SJW\Output\Report\San Juan Waterfront Masterplan Transport Assessment_5-review.doc
26
Signals
3.11 It is proposed that key intersections through the Masterplan area along Fernández Juncos Ave, and Del Tren streets will be signalized to regulate traffic flow and allow vehicular access to these main corridors. It will also provide formal crossing facilities for pedestrians and cyclists. The introduction of a tramway along the northern edge of Fernández Juncos Ave will require the addition of traffic signal control at intersections to facilitate tramway crossing, improve safety and organize traffic flow. Figure 3.3 shows in red the proposed new signals for the Masterplan area, including:
• Fernández Juncos Avenue intersections with:
� Pelayo St.
� Padre Hoff St.
� San Juan Bautista St.
� Fernández St.
� Ramón Power St.
� Calle 5*
� Pedestrian Signal east of Calle 5∗
• Del Tren Street and Fernández St.*
3.12 Chapter 8 details the signal need study for the first four intersections mentioned above since this are the new ones proposed by the San Juan Waterfront Masterplan.
3.13 The existing signalized intersections (shown in Figure 3.3 in blue) will be maintained:
• Fernández Juncos Avenue intersections with:
� Valdés Street
� San Andrés Street**
� Matías Ledesma
� Calle 3
• Del Tren Street with:
� Matías Ledesma
� Ramón Power*
� Calle 5 (this is combine with the Fernández Juncos and Calle 5 intersection)
.
∗ Intersections proposed as part of the Intersection 5 re-design scheme
** Signalized Intersection only to avoid conflict of turning vehicles and tram

P:\P
rojects\220022~1\01\Work\S
JW\O
utput\R
eport\San Juan W
aterfront Masterplan T
ransport Assessm
ent_5-review.doc
27
FIG
UR
E 3.3
PR
OP
OS
ED
SIG
NA
LIZA
TION
ST
AR
TE
GY
N
P:\Projects\220022~1\01\Work\SJW\Output\Report\San Juan Waterfront Masterplan Transport Assessment_5-review.doc
28
Public Transport
New Service
3.14 Providing the Waterfront area with a connection to a mass transit system that could connect to the Tren Urbano is part of the San Juan Waterfront Masterplan.
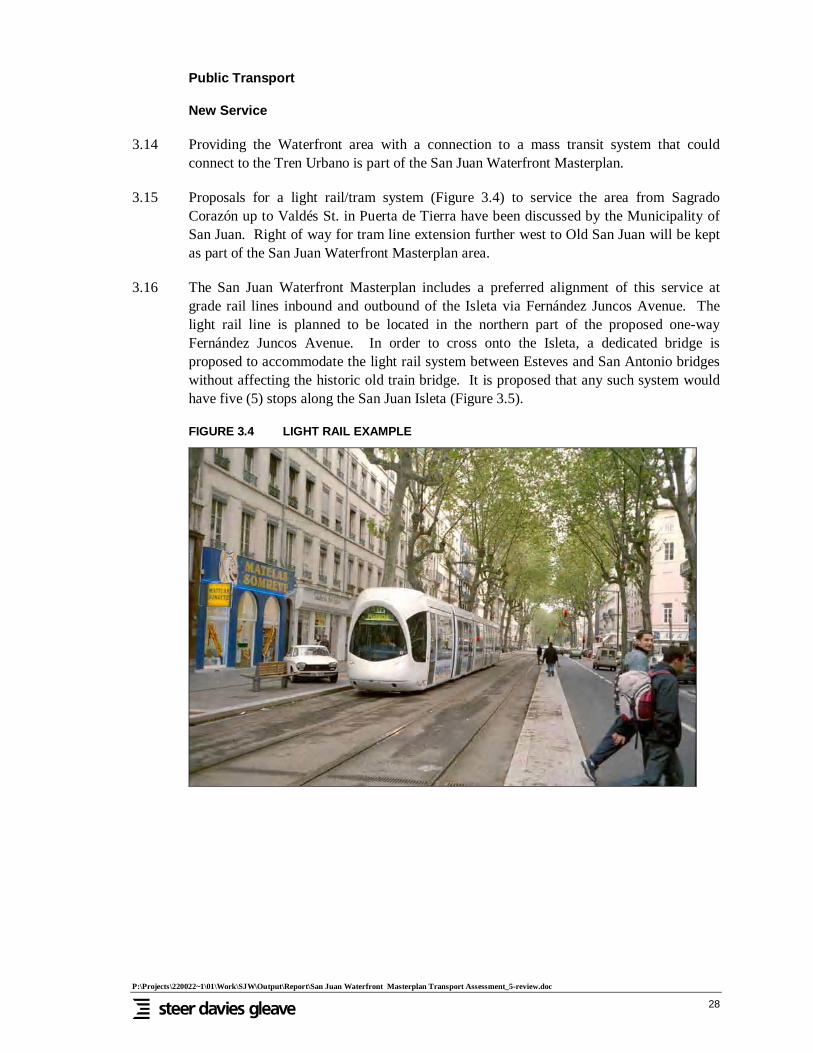
3.15 Proposals for a light rail/tram system (Figure 3.4) to service the area from Sagrado Corazón up to Valdés St. in Puerta de Tierra have been discussed by the Municipality of San Juan. Right of way for tram line extension further west to Old San Juan will be kept as part of the San Juan Waterfront Masterplan area.
3.16 The San Juan Waterfront Masterplan includes a preferred alignment of this service at grade rail lines inbound and outbound of the Isleta via Fernández Juncos Avenue. The light rail line is planned to be located in the northern part of the proposed one-way Fernández Juncos Avenue. In order to cross onto the Isleta, a dedicated bridge is proposed to accommodate the light rail system between Esteves and San Antonio bridges without affecting the historic old train bridge. It is proposed that any such system would have five (5) stops along the San Juan Isleta (Figure 3.5).
FIGURE 3.4 LIGHT RAIL EXAMPLE

P:\P
rojects\220022~1\01\Work\S
JW\O
utput\R
eport\San Juan W
aterfront Masterplan T
ransport Assessm
ent_5-review.doc
29
FIG
UR
E 3.5
LIGH
T R
AIL P
RO
PO
SE
D A
LLIGN
ME
NT
AN
D S
TO
PS
ALO
NG
TH
E IS
LET
A
N

P:\Projects\220022~1\01\Work\SJW\Output\Report\San Juan Waterfront Masterplan Transport Assessment_5-review.doc
30
AMA Services
3.17 The introduction of a light rail system along Fernández Juncos Avenue would result in the need to examine the existing bus services, which currently run along Del Tren Street (A5, A9 and B8). These services can be redirected to Muñoz Rivera and Constitución Avenues or run with traffic along Fernández Juncos Avenue or Del Tren Street together with any residual and complimentary bus services to the tram.
3.18 The counter-flow bus lane along Muñoz Rivera Ave. will be extended east along this avenue up to the intersection with Constitución Ave. as part of the Intersection 5 improvements. This will be explained in more detail later in this Chapter.
Water Transport
3.19 The San Juan Waterfront Masterplan considers a multimodal approach to mobility. Therefore is allowing provision for water taxi services. Water taxi service is proposed between the San Juan Waterfront area with Pier 2 in Old San Juan, the Convention Center District and the Pan-American Pier (Figure 3.6).

P:\P
rojects\220022~1\01\Work\S
JW\O
utput\R
eport\San Juan W
aterfront Masterplan T
ransport Assessm
ent_5-review.doc
31
FIG
UR
E 3.6
WA
TE
R T
AX
IS R
OU
TE
N
Route
Proposed S
tops

P:\Projects\220022~1\01\Work\SJW\Output\Report\San Juan Waterfront Masterplan Transport Assessment_5-review.doc
32
Pedestrian and Cyclist Accessibility
3.20 Given that the proposed redevelopment containing a mix of land-uses including residential and commercial, it can be expected that pedestrian footfall through the Masterplan area will increase. Improved traffic control and organization through the use of traffic signals along the main corridors will improve pedestrian and cyclist crossing gaps and safety.
3.21 Pedestrians and cyclists will also benefit from reduced speeds along the street adjacent to the Canal itself, where traffic-calming measures such as raised crossings or surfaced pavements and exclusive bike lanes are proposed.
3.22 Also, pedestrian access and safety will be greatly improved by the conversion of Fernández Juncos Avenue into a one-way street with wide sidewalks along both sides of the Avenue (9.84 ft on the south side and 16.4 ft on the north side).
3.23 Paseo del Puerto will be providing 16.4 feet sidewalks to the north and a 43 feet Canal walk and to the south towards the San Antonio Canal for general public enjoyment.
3.24 Landscape and green areas will assist pedestrian mobility and encourage people to walk along the Isleta. The north-south green connectors (called the Cross Island Parks and Rambla) will provide an enjoyable walking access from the Atlantic Ocean to the San Antonio Canal that is currently lacking such connection.
3.25 The proposed I5 design (explained in detail later on this Chapter) include a series of signalized intersections that will allow for safer crossings connecting pedestrian walkways from the Isleta to Condado, Miramar and the Convention Centre District. Figure 3.7 shows in red the pedestrians pathways.

P:\P
rojects\220022~1\01\Work\S
JW\O
utput\R
eport\San Juan W
aterfront Masterplan T
ransport Assessm
ent_5-review.doc
33
FIG
UR
E 3.7
PE
DE
ST
RIA
NS
AN
D C
YC
LIST
PA
TH
WA
YS
N

P:\Projects\220022~1\01\Work\SJW\Output\Report\San Juan Waterfront Masterplan Transport Assessment_5-review.doc
34
3.26 Pedestrian safety has been considered in the development of the light rail proposals (Figure 3.8). The alignment on the northern side of Fernández Juncos Avenue has incorporated a facility to permit safe crossing of multiple two directional lanes (vehicular and train traffic westbound at the southern end and train traffic eastbound at the eastern end). The proposed system provides a pedestrian friendly environment since it allows pedestrians to cross tracks safely at grade.
FIGURE 3.8 PEDESTRIANS CROSSING LIGHT RAIL TRACKS
3.27 Cyclist access and safety will be greatly improved by the creation of cycle lanes (2-way 9.8 feet wide) along Paseo del Puerto and the Cross Island Parks.
3.28 Traffic calming measures and landscaped areas will improve overall conditions for cyclists on the Isleta. Figure 3.7 shows in blue cycle access to the Isleta.
Parking
3.29 Table 3.3 and Table 3.4 summarize the proposed action parking provision for the west and east areas of the San Juan Waterfront development.
3.30 On street parallel parking spaces are proposed along Fernández Juncos Avenue and the north-south and east-west roads along the Waterfront development area. A total of 501 on-street parking spaces are provided as part of the proposed parking plan for the west area of the San Juan Waterfront. These are included in the numbers presented in the tables below.

P:\Projects\220022~1\01\Work\SJW\Output\Report\San Juan Waterfront Masterplan Transport Assessment_5-review.doc
35
TABLE 3.3 PROPOSED PARKING PER BLOCK FOR THE WEST AREA
Use Proposed Parking Provision
Commercial 688
Hotel 535
Casino 39
Port 39
Residential 1,665
Civic 179
TOTAL 3,146
TABLE 3.4 PROPOSED PARKING PER BLOCK FOR THE EAST AREA
Use Proposed Parking Provision
Commercial 239
Residential 1,544
Office 429
Civic 207
TOTAL 2,419
Parking Provision Analysis
3.31 Using the Institute of Transport Engineers’ (ITE) Parking Generation (3rd Ed.), projections of the maximum parking requirement were made based on each of the San Juan Waterfront proposed land uses. Table 3.5 and Table 3.6 present the results of these projections.
TABLE 3.5 REQUIRED PARKING PER BLOCK FOR THE WEST AREA
Use ITE Projected Parking
Requirement Difference between proposed
and required parking
Commercial 2,041 -1,352 Hotel 883 -347
Casino 58 -19
Port and Terminal n/a 39
Residential 1,401 264
Civic 223 -44
TOTAL 4,606 -1,460

P:\Projects\220022~1\01\Work\SJW\Output\Report\San Juan Waterfront Masterplan Transport Assessment_5-review.doc
36
TABLE 3.6 REQUIRED PARKING PER BLOCK FOR THE EAST AREA
Use ITE Projected Parking
Requirement Difference between proposed
and required parking
Commercial 968 -728
Residential 1,132 412
Office 344 85
Civic 264 -57
TOTAL 2078 -288
3.32 There is a total deficit in parking provision of 1,749 spaces for the entire San Juan Waterfront development area.
3.33 An additional analysis was undertaken considering the possibility of providing shared parking in the San Juan Waterfront development area. Shared parking refers to a technique of allowing the same parking space to be used by multiple developments at different times of the day. An example of shared parking is a parking space being used by an office worker during the day and a restaurant goer in the evening.
3.34 The shared parking analysis was prepared for the west and east areas of the San Juan Waterfront. As shown in Table 3.7, there is a deficit of 315 parking spaces for the west area considering the peak accumulation period at 7:00 PM. On the eastern development area, an excess of 557 spaces is expected during the peak accumulation period at 4:00 PM as shown in Table 3.8.

P:\Projects\220022~1\01\Work\SJW\Output\Report\San Juan Waterfront Masterplan Transport Assessment_5-review.doc
37
TABLE 3.7 SHARED PARKING REQUIREMENT ANALYSIS FOR THE WEST AREA; TYPICAL WEEKDAY
Time Period (hour starting) Commercial Hotel Casino Port Residential Civic Total
12:00 - 4:00 AM 0 0 33 0 1,401 1434
05:00 AM 0 0 0 0 1,345 56 1401
06:00 AM 0 883 0 0 1,289 105 2277
07:00 AM 102 839 0 0 1,037 107 2085
08:00 AM 367 803 0 0 897 112 2179
09:00 AM 776 768 0 0 0 98 1642
10:00 AM 1,082 724 0 0 0 112 1917
11:00 AM 1,755 883 33 0 0 116 2786
12:00 PM 2,041 865 38 0 0 123 3067
01:00 PM 2,000 794 38 0 0 141 2973
02:00 PM 1,857 724 38 0 0 172 2791
03:00 PM 1,755 618 37 0 0 214 2624
04:00 PM 1,653 618 39 0 617 223 3150
05:00 PM 1,163 583 42 0 827 199 2814
06:00 PM 1,408 644 48 0 967 154 3221
07:00 PM 1,674 715 51 0 925 96 3461
08:00 PM 1,429 697 56 0 1,051 3233
09:00 PM 857 706 58 0 1,079 2701
10:00 PM 204 706 54 0 1,289 2254
11:00 PM 38 0 1,317 1356
Maximum Required 3461
Proposed 3146
Difference -315

P:\Projects\220022~1\01\Work\SJW\Output\Report\San Juan Waterfront Masterplan Transport Assessment_5-review.doc
38
TABLE 3.8 SHARED PARKING REQUIREMENT ANALYSIS FOR THE EAST AREA; TYPICAL WEEKDAY
Time Period (hour starting) Commercial Residential Civic Office Total
12:00 - 4:00 AM 0 1132 0 0 1132
05:00 AM 0 1087 66 0 1153
06:00 AM 0 1042 124 0 1166
07:00 AM 48 838 127 69 1082
08:00 AM 174 725 132 234 1265
09:00 AM 368 0 116 309 793
10:00 AM 513 0 132 330 975
11:00 AM 832 0 137 327 1296
12:00 PM 968 0 145 323 1436
01:00 PM 948 0 166 330 1445
02:00 PM 880 0 203 344 1428
03:00 PM 832 0 254 340 1426
04:00 PM 784 498 264 316 1862
05:00 PM 552 668 235 213 1668
06:00 PM 668 781 182 0 1631 07:00 PM 793 747 114 0 1654 08:00 PM 677 849 0 0 1526 09:00 PM 406 872 0 0 1278 10:00 PM 97 1042 0 0 1138 11:00 PM 0 1064 0 0 1064
Maximum
Required 1862
Proposed 2419 Difference 557
Intersection 5
3.35 In order to improve the access through I5, Steer Davies Gleave has studied a series of roadway alignment and configuration design alternatives on behalf of the PRHTA. The analysis has been undertaken using S-Paramics microsimulation software.
3.36 The stated goal by the PRHTA was to achieve an operational design that will improve the I5 intersection for the current traffic conditions. From the assessment, a recommended alternative was defined. In general terms, this design consists of (Refer to Figure 3.9):
• Two-way operation of San Antonio & Esteves bridges
• At grade signalised intersection south of I5 linking Baldorioty de Castro Exp. & Blvd (PR-26 with PR-16).
• Single bridge structure for Muñoz Rivera expressway over passing Baldorioty de Castro Blvd. and connecting with San Antonio Bridge.

P:\Projects\220022~1\01\Work\SJW\Output\Report\San Juan Waterfront Masterplan Transport Assessment_5-review.doc
39
• Southbound operation and widening of Calle 5 (signal with Fernández Juncos Ave. and Constitución Ave.)
• Two-way operation of Constitución Ave. from Muñoz Rivera Ave. to Calle 5
• Extension and widening of Fernández Street joining northbound Fernández Juncos and Constitución avenues
• Bus lane along Muñoz Rivera Ave. continues up to intersection with Constitución Avenue
• Extension of Fernández Street from Fernández Juncos Ave. to San Agustin St. and widening of the section from San Agustin St. to Constitución Avenue (signalization of Fernández Street intersections with Del Tren St. and Fernández Juncos Ave.)
3.37 The Intersection 5 design includes the recommendations of the San Juan Waterfront Masterplan to convert Del Tren Street in a one-way westbound traffic road and to turn Fernández Juncos Ave. into a one-way street eastbound.
3.38 The recommended alternative comprises the following advantages:
• Eliminates the weaving north of Esteves Bridge
• Eliminates redundant traffic6 (reduction of volume to/from the Isleta)
• Reduces the traffic signal phasing, signals to the north have 3 phases
• Increase distance between intersections
• An expressway exit from the Isleta is maintained
• Improvement of the pedestrian access
• The special events traffic management is simplified
• Improvement of safety and disaster management
• New development parcel is created (Parcel U in the San Juan Waterfront Masterplan)
3.39 The conclusions for the I5 model analysis showed that for the 2025 traffic (Refer to Chapter 6 for more details) the model queues the main roadways that lead to I5 collapsing the model. The network is able to handle about 80% of the future traffic without major queuing. The recommendations to attend this expected congestion are to implement traffic reduction measures for the San Juan Isleta (Refer to Chapter 10 for more details).
6 Redundant traffic refers to vehicles that, due to the existing intersection design, are forces to cross to the Isleta and back out in order to reach a destination (i.e. traffic on Baldorioty Expressway westbound going to the Convention Center)

P:\P
rojects\220022~1\01\Work\S
JW\O
utput\R
eport\San Juan W
aterfront Masterplan T
ransport Assessm
ent_5-review.doc
40
FIG
UR
E 3.9
INT
ER
SE
CT
ION
5 PR
OP
OS
ED
DE
SIG
N
Sig
nals
N

P:\Projects\220022~1\01\Work\SJW\Output\Report\San Juan Waterfront Masterplan Transport Assessment_5-review.doc
41
4. IMPACT ANALISYS ALTERNATIVES
Introduction
4.1 As part of the traffic study for the San Juan Waterfront, other alternatives were assessed in order to determine the impact of the development against other proposed development options in the area. This Chapter discusses the Proposed Action Alternative 2, the Modified No Action and the No Action alternative.
Development Proposal: Proposed Action Alternative 2
4.2 The San Juan Waterfront Alternative 2 presents a variation in both the Marina facilities and Parque de la Bahía locations, as it proposes filling the water docking area between Pier 9 and Pier 10. In terms of traffic, this posse a change in the west part of the road network as access to the Marina changes location up to San Andrés Street (Figure 4.1). The remaining road components will be constructed as described in the Proposed Action Alternative 1.
4.3 It is important to note that what is identify as Parcel C for this Alternative is no longer part of the San Juan Waterfront as a private developer is proposing a residential and office development in it. Chapter 5 describes this proposed development in mode detail.
4.4 The land-use breakdown for this Alternative 2 is divided in the eastern and western areas defined by Fernández Street Figure 4.1, Table 4.1 and Table 4.2 summarizes the proposed development program for these areas of the San Juan Waterfront Alt. 2.
TABLE 4.1 WESTERN AREA DEVELOPMENT PROGRAM: ALTERNATIVE 2
Block Commercial (Sq.ft.)
Hotel (Keys)
Casino (Sq.ft.)
Marina Facilities (Berths)
Residential (units)
Civic (Sq.ft.)
A+B 27,000 210 10,000 11,800 D 19,879 65 E1 21,042 65 E2 10,864 200 45 F1 16,204 77 F2 90 50 G1 40,631 86 G2 23,480 211 44 H1 11,563 31 H2 144 17 i1 23,101 103 i2 15,967 95 47 J1 18,617 71 J2 60,000
Lebrón 20,750 100

P:\Projects\220022~1\01\Work\SJW\Output\Report\San Juan Waterfront Masterplan Transport Assessment_5-review.doc
42
TABLE 4.2 EASTERN AREA DEVELOPMENT PROGRAM: ALTERNATIVE 2
Block Commercial (Sq.ft.)
Residential (units)
K 4,471 82 L 8,541 61 M 82 N 84 O 82 P 89 Q 73 R 87,000 20 S 114,000

P:\P
rojects\220022~1\01\Work\S
JW\O
utput\R
eport\San Juan W
aterfront Masterplan T
ransport Assessm
ent_5-review.doc
43
FIG
UR
E 4.1
ALT
ER
NA
TIV
E 2 D
EV
ELO
PM
EN
T BLO
CK
S
N

P:\Projects\220022~1\01\Work\SJW\Output\Report\San Juan Waterfront Masterplan Transport Assessment_5-review.doc
44
Parking
4.5 Since the proposed development program for Alternative 2 of the San Juan Waterfront varies, the parking analysis will be affected.
4.6 Table 4.3 and Table 4.4 summarizes the proposed Alternative 2 parking provision for the west and east area of the San Juan Waterfront development.
4.7 On street parallel parking spaces are proposed along Fernández Juncos Avenue and the north-south and east-west roads along the Waterfront development area. A total of 501 on-street parking are provided as part of the proposed parking for the west area of the San Juan Waterfront and are included in the numbers presented in the tables below.
TABLE 4.3 ALTERNATIVE 2 PARKING PER BLOCK FOR THE WEST AREA
Use Proposed Parking Provision
Commercial 885
Hotel 542
Casino 33
Port 35
Residential 2137
Civic 192
TOTAL 3823
TABLE 4.4 ALTERNATIVE 2 PARKING PER BLOCK FOR THE EAST AREA
Use Proposed Parking Provision
Commercial 679
Residential 1389
TOTAL 2068
Parking Provision Analysis
4.8 Using the Institute of Transport Engineers (ITE) Parking Generation 3rd Edition, projections of the maximum parking requirement were made based on each of the San Juan Waterfront proposed uses. Table 4.5 and Table 4.6 present the results of these projections.

P:\Projects\220022~1\01\Work\SJW\Output\Report\San Juan Waterfront Masterplan Transport Assessment_5-review.doc
45
TABLE 4.5 REQUIRED PARKING PER BLOCK FOR THE WEST AREA; ALT2
Use ITE Projected Parking
Requirement Difference between proposed
and required parking
Commercial 2219 -1334 Hotel 865 -323
Casino 58 -25
Port and Terminal 0 35
Residential 1546 590
Civic 140 -140
TOTAL 4827 -1196
TABLE 4.6 REQUIRED PARKING PER BLOCK FOR THE EAST AREA; ALT2
Use ITE Projected Parking
Requirement Difference between proposed
and required parking
Commercial 902 -224
Residential 1070 319
TOTAL 1973 95
4.9 There is deficit in parking provision of 1101 spaces for the entire San Juan Waterfront development area.
4.10 An additional analysis was undertaken considering the possibility of providing shared parking in the San Juan Waterfront development area. The shared parking analysis was prepared for the west and east areas of the San Juan Waterfront. As shown in Table 4.7, there is an excess of 172 parking spaces for the west area considering the peak accumulation period at 7:00 PM. On the eastern development area, an excess of 620 spaces is expected on a typical weekday at 7:00 PM as shown in Table 4.8.

P:\Projects\220022~1\01\Work\SJW\Output\Report\San Juan Waterfront Masterplan Transport Assessment_5-review.doc
46
TABLE 4.7 SHARED PARKING REQUIREMENT ANALYSIS FOR THE WEST AREA; TYPICAL WEEKDAY; ALT2
Time Period Commercial Hotel Casino Residential Civic Total
12:00 - 4:00 AM 0 0 33 1546 0 1579 05:00 AM 0 0 0 1484 35 1519 06:00 AM 0 865 0 1423 66 2353 07:00 AM 111 821 0 1144 67 2144 08:00 AM 399 787 0 990 70 2246 09:00 AM 843 752 0 0 62 1657 10:00 AM 1176 709 0 0 70 1955 11:00 AM 1908 865 33 0 73 2878 12:00 PM 2219 847 38 0 77 3181 01:00 PM 2174 778 38 0 88 3079 02:00 PM 2019 709 38 0 108 2873 03:00 PM 1908 605 37 0 134 2685 04:00 PM 1797 605 39 680 140 3261 05:00 PM 1265 571 42 912 125 2914 06:00 PM 1531 631 48 1067 97 3373 07:00 PM 1819 700 51 1020 60 3651 08:00 PM 1553 683 56 1160 0 3451 09:00 PM 932 692 58 1191 0 2872 10:00 PM 222 692 54 1423 0 2390 11:00 PM 0 0 38 1453 0 1492
Maximum Required 3,651
Proposed 3,823
Difference 172

P:\Projects\220022~1\01\Work\SJW\Output\Report\San Juan Waterfront Masterplan Transport Assessment_5-review.doc
47
TABLE 4.8 SHARED PARKING REQUIREMENT ANALYSIS FOR THE EAST AREA; TYPICAL WEEKDAY; ALT2
Time Period Commercial Residential Total
12:00 - 4:00 AM 0 1070 1070 05:00 AM 0 1028 1028 06:00 AM 0 985 985 07:00 AM 45 792 837 08:00 AM 162 685 848 09:00 AM 343 0 343 10:00 AM 478 0 479 11:00 AM 776 0 777 12:00 PM 902 0 903 01:00 PM 884 0 885 02:00 PM 821 0 822 03:00 PM 776 0 777 04:00 PM 731 471 1203 05:00 PM 514 632 1147
06:00 PM 623 739 1362 07:00 PM 740 706 1447 08:00 PM 632 803 1435 09:00 PM 379 824 1204 10:00 PM 90 985 1076 11:00 PM 0 1006 1007
Maximum Required 1447
Proposed 2,068 Difference 620

P:\Projects\220022~1\01\Work\SJW\Output\Report\San Juan Waterfront Masterplan Transport Assessment_5-review.doc
48
Alternative 3 - Modified No Action
4.11 The Modified No Action Alternative assumes that the San Juan Waterfront Development will not occur, but that the PRPA would repair and remediate the portions of the project area under their ownership and will develop them as currently Zoned (mostly CT3).
4.12 The road network is considered to undergo the changes proposed by the I5 re-design and by the introduction of the tramway. The changes will include the conversion of Fernández Juncos Ave. to one-way and the opening of Del Tren St. to westbound general traffic. The accesses to the development area will be provided through the existing accesses along:
• San Andrés St.
• Tadeo Rivera St.
• Matías Ledesma St.
• San Juan Bautista St.
• Fernández St.
4.13 New signals are proposed for San Juan Bautista Street and Fernández Street due to the introduction of the tramway.
Alternative 4 - No Action
4.14 The No Action Alternative represents the existing conditions in the future. It assumes that the San Juan Waterfront development will not occur, and that the existing uses along the project area will remain and no further actions will be taken.
4.15 The road network is considered to undergo the changes proposed by the I5 re-design and by the introduction of the tramway. The changes will include the conversion of Fernández Juncos Ave to one-way and the opening of Del Tren St. to westbound general traffic. The accesses to the development area will be provided through the existing accesses along:
• San Andrés St.
• Tadeo Rivera St.
• Matías Ledesma St.
• San Juan Bautista St.
• Fernández St.
4.16 New signals are proposed for San Juan Bautista Street and Fernández Street due to the introduction of the tramway.

P:\Projects\220022~1\01\Work\SJW\Output\Report\San Juan Waterfront Masterplan Transport Assessment_5-review.doc
49
5. PARAMICS MODELING FOR ALTERNATIVES
5.1 In order to analyze the existing and future traffic conditions through the project area, a Paramics microsimulation model was built for the San Juan Isleta. The model prepared was an extension of the Intersection 5 (I5) model developed for the PRHTA. The San Juan Waterfront model extends from I5 west to Old San Juan up to JA Corretjer Street where the current AMA Bus station at Covadonga is located.
5.2 The projections of future traffic were based on proposed developments in the area. The projections did not considered annual traffic growth since the San Juan Isleta has been experiencing a decrease in traffic in the last years. The decrease in traffic is based on the Average Annual Daily Traffic (AADT) of the main road in the Isleta7 (Appendix C). Projections made for the I5 model as part of the work undertaken for PRHTA found that the increment in traffic in the area will congest furthermore the roadway network and will not encourage or support increases in traffic beyond those attracted by new developments.
Base Model
5.3 Using the traffic count data, the signal timings and the AMA bus surveys, the Base San Juan Waterfront model was prepared. Figure 5.1 shows the extent of the highway network. The model was prepared for the main peak daily traffic periods AM (7:30-8:30) and PM (4:00-5:00).
5.4 The Base model consists of 44 zones and 14 matrices with a total volume of 14,811 vehicles during the AM peak and 15,070 during the PM peak.
5.5 In order to validate/calibrate the base AM and PM peak models Steer Davies Gleave personnel undertook surveys to obtain peak hour journey time data for the modeled Fernández Juncos, Muñoz Rivera and Constitución avenues’ corridors. The base model validated with acceptable margins against the obtained journey time data. Table 5.1 displays the journey time data results.
7 AADT data gathered on 28 June 2007 from http://www.dtop.gov.pr/act/analisis_trans.htm

P:\Projects\220022~1\01\Work\SJW\Output\Report\San Juan Waterfront Masterplan Transport Assessment_5-review.doc
50
TABLE 5.1 JOURNEY TIME DATA VALIDATION
AM Peak (seconds)
Fernández Juncos Ave. Muñoz Rivera Ave.
Constitución Ave. Eastbound Westbound
Journey Time Data
142 207 155 180
Base PARAMICS Model
141 206 149 167
GEH 3 1.5 0 4.7
AM Peak (seconds)
Fernández Juncos Ave. Muñoz Rivera Ave.
Constitución Ave. Eastbound Westbound
Journey Time Data
151 317 237 161
Base PARAMICS Model
138 259 209 152
GEH 5 0.5 2 6
5.6 The GEH-statistic included in the bottom of he table, is a measurement that has been derived to overcome the inability of either the absolute difference or the relative difference to cope satisfactorily over a wide range of flows. For example, an absolute difference of 100 vehicles would be considered a big difference if both flows are in the order of 100, but would be unimportant for flows in the order of several thousand. Equally, a 10% error in 100 vehicles would not be important but a 10% error in 3000 may mean the difference between requiring an extra lane or not.
5.7 Design Manual for Roads and Bridges (DMRB) Volume 12a includes ‘assignment validation acceptability guidelines’ for highway traffic models.
TABLE 5.2 DMRB VALIDATION GUIDELINES
Criteria and Measures Acceptability
Guideline
Assigned hourly flows compared with observed flows
1. Individual flows within 100 for flows <700vph > 85%
2. Individual flows within 15% for flows 700-2,700vph > 85%
3. Individual flows within 400 for flows >2,700vph > 85%
4. Total screen line flows (normally >5 links) to be within 5%
All (or nearly all) screen lines
GEH statistic:
(i) individual flows: GEH < 5 > 85% of cases
(ii) screen line totals : GEH < 4 All (or nearly all) screen lines

P:\Projects\220022~1\01\Work\SJW\Output\Report\San Juan Waterfront Masterplan Transport Assessment_5-review.doc
51
5.8 Both the AM and PM observed traffic count data and modelled flow data meets the validation guidelines. All journey times (JT) sections through the modelled network have observed/modelled data with a GEH statistic value of <5.0 (a GEH of <5.0 is considered a good match). The only JT sections that does not meet the <5.0 criteria was the PM Fernández Juncos Ave. westbound. This difference was due mainly to the fact that the intersection with G. Concepción de Gracia had the signal off during the surveys.

P:\P
rojects\220
022~1
\01\W
ork\SJW
\Ou
tput\Report\S
an Juan Waterfront M
asterplan T
ransport Assessm
ent_5
-review.doc
52
FIG
UR
E 5.1
BA
SE
MO
DE
LLED
; MO
DE
LED
HIG
HW
AY
NE
TW
OR
K

P:\Projects\220022~1\01\Work\SJW\Output\Report\San Juan Waterfront Masterplan Transport Assessment_5-review.doc
53
FIGURE 5.2 BASE AM TURNING MOVEMENTS; INTERSECTION 1
FIGURE 5.3 BASE AM TURNING MOVEMENTS; INTERSECTIONS 2
FIGURE 5.4 BASE AM TURNING MOVEMENTS; INTERSECTIONS4, 5A 8, 6
8 Called Intersection 5A to avoid confusion with Intersection 5 (I5-main entrance to San Juan)

P:\Projects\220022~1\01\Work\SJW\Output\Report\San Juan Waterfront Masterplan Transport Assessment_5-review.doc
54
FIGURE 5.5 BASE AM TURNING MOVEMENTS; INTERSECTIONS 8, 9, 10, 11
FIGURE 5.6 BASE AM TURNING MOVEMENTS; INTERSECTIONS 12, 13, 14, 15, 16, 17
FIGURE 5.7 BASE AM TURNING MOVEMENTS; INTERSECTIONS 18, 19, 20, 21

P:\Projects\220022~1\01\Work\SJW\Output\Report\San Juan Waterfront Masterplan Transport Assessment_5-review.doc
55
FIGURE 5.8 BASE PM TURNING MOVEMENTS; INTERSECTION 1
FIGURE 5.9 BASE PM TURNING MOVEMENTS; INTERSECTION 2
FIGURE 5.10 BASE PM TURNING MOVEMENTS; INTERSECTIONS 4, 5A, 6

P:\Projects\220022~1\01\Work\SJW\Output\Report\San Juan Waterfront Masterplan Transport Assessment_5-review.doc
56
FIGURE 5.11 BASE PM TURNING MOVEMENTS; INTERSECTIONS 8, 9, 10, 11
FIGURE 5.12 BASE PM TURNING MOVEMENTS; INTERSECTIONS 12, 13, 14, 15, 16, 17
FIGURE 5.13 BASE PM TURNING MOVEMENTS; INTERSECTIONS 18, 19, 20, 21

P:\Projects\220022~1\01\Work\SJW\Output\Report\San Juan Waterfront Masterplan Transport Assessment_5-review.doc
57
Proposed Action Alternative 1
5.9 The Proposed Action (PA_Alt1) Alternative 1 model was prepared based on the proposed San Juan Waterfront Masterplan and considering a future year of 2025. This is the year when this development is expected to be fully operational. This model includes the addition of new roads, signals, proposed I5 design and tramline as explained in Chapter 3 (Figure 5.14).
5.10 In order to project the traffic expected in the study area for year 2025, this model includes the base traffic plus the projected traffic to be generated by the San Juan Waterfront Proposed Action development program (Chapter 6). Also, additional traffic was added from other projects that are expected to occur in the vicinity of the project site, including the completion of the Puerto Rico Convention Center District (PRCCD), and various proposed development in the San Juan Isleta and Miramar. An investigation of other proposed developments in the area was undertaken in order to determine the expected traffic volumes in the area (Refer to Chapter 6).
5.11 The PA_Alt 1 model consists of 64 zones and 22 matrices with a total volume of 22,932 vehicles during the AM peak and 22,055 during the PM peak.
5.12 Figure 5.15 to Figure 5.28 show the turning movements on the network for the PA_Alt 1 model along Fernández Juncos Avenue and Del Tren Street.

P:\P
rojects\220
022~1
\01\W
ork\SJW
\Ou
tput\Report\S
an Juan Waterfront M
asterplan T
ransport Assessm
ent_5
-review.doc
58
FIG
UR
E 5.14
PR
OP
OS
ED
AC
TION
ALT
ER
NA
TIV
E 1; M
OD
ELE
D H
IGH
WA
Y N
ET
WO
RK

P:\Projects\220022~1\01\Work\SJW\Output\Report\San Juan Waterfront Masterplan Transport Assessment_5-review.doc
59
FIGURE 5.15 PA_ALT1 AM TURNING MOVEMENTS; INTERSECTION 1
FIGURE 5.16 PA_ALT1 AM TURNING MOVEMENTS; INTERSECTIONS 2, 3
FIGURE 5.17 PA_ALT1 AM TURNING MOVEMENTS; INTERSECTIONS 4, 5A, 6, 7, 8, 9, 22, 23

P:\Projects\220022~1\01\Work\SJW\Output\Report\San Juan Waterfront Masterplan Transport Assessment_5-review.doc
60
FIGURE 5.18 PA_ALT1 AM TURNING MOVEMENTS; INTERSECTIONS 10, 11, 12, 13, 24
FIGURE 5.19 PA_ALT1 AM TURNING MOVEMENTS; INTERSECTIONS 14, 15

P:\Projects\220022~1\01\Work\SJW\Output\Report\San Juan Waterfront Masterplan Transport Assessment_5-review.doc
61
FIGURE 5.20 PA_ALT1 AM TURNING MOVEMENTS; INTERSECTIONS 16, 17, 18, 19, 25, 26
FIGURE 5.21 PA_ALT1 AM TURNING MOVEMENTS; INTERSECTIONS 21, 27, 28

P:\Projects\220022~1\01\Work\SJW\Output\Report\San Juan Waterfront Masterplan Transport Assessment_5-review.doc
62
FIGURE 5.22 PA_ALT1 PM TURNING MOVEMENTS; INTERSECTION 1
FIGURE 5.23 PA_ALT1 PM TURNING MOVEMENTS; INTERSECTIONS 2, 3, 4, 5A

P:\Projects\220022~1\01\Work\SJW\Output\Report\San Juan Waterfront Masterplan Transport Assessment_5-review.doc
63
FIGURE 5.24 PA_ALT1 PM TURNING MOVEMENTS; INTERSECTIONS 4, 5A, 6, 7, 8, 9, 22, 23
FIGURE 5.25 PA_ALT1 PM TURNING MOVEMENTS; INTERSECTIONS 10, 11, 12, 13, 24

P:\Projects\220022~1\01\Work\SJW\Output\Report\San Juan Waterfront Masterplan Transport Assessment_5-review.doc
64
FIGURE 5.26 PA_ALT1 PM TURNING MOVEMENTS; INTERSECTIONS 14, 15
FIGURE 5.27 PA_ALT1 PM TURNING MOVEMENTS; INTERSECTIONS 16, 17, 18, 19, 25, 26
FIGURE 5.28 PA_ALT1 PM TURNING MOVEMENTS; INTERSECTIONS 21, 27, 28

P:\Projects\220022~1\01\Work\SJW\Output\Report\San Juan Waterfront Masterplan Transport Assessment_5-review.doc
65
Proposed Action-Alternative 2
5.13 The Proposed Action Alternative 2 (PA_Alt2) model was prepared based on the proposed San Juan Waterfront Masterplan Alternative 2 and considering a future year of 2025. This model includes the addition of new roads, signals, proposed I5 design and tramline as explained in Chapter 3 (Figure 5.29).
5.14 In order to project the traffic expected in the study area for year 2025, this model includes the base traffic plus the projected traffic to be generated by the San Juan Waterfront Proposed Action Alternative 2 development program. Also, additional traffic was added from other projects that are expected to occur in the vicinity of the project site including the completion of the Puerto Rico Convention Center District, and various proposed development in the San Juan (Refer to Chapter 6).
5.15 The PA_Alt2 model consists of 64 zones and 22 matrices with a total volume of 22,952 vehicles during the AM peak and 21,967 during the PM peak.
5.16 Figure 5.30 to Figure 5.45 show the turning movements on the network for the PA_Alt2 model along Fernández Juncos Avenue and Del Tren Street.

P:\P
rojects\220
022~1
\01\W
ork\SJW
\Ou
tput\Report\S
an Juan Waterfront M
asterplan T
ransport Assessm
ent_5
-review.doc
66
FIG
UR
E 5.29
PR
OP
OS
ED
AC
TION
ALT
ER
NA
TIV
E 2; M
OD
ELE
D H
IGH
WA
Y N
ET
WO
RK

P:\Projects\220022~1\01\Work\SJW\Output\Report\San Juan Waterfront Masterplan Transport Assessment_5-review.doc
67
FIGURE 5.30 PA_ALT2 AM TURNING MOVEMENTS; INTERSECTION 1
FIGURE 5.31 PA_ALT2 AM TURNING MOVEMENTS; INTERSECTION 2
FIGURE 5.32 PA_ALT2 AM TURNING MOVEMENTS; INTERSECTIONS 3, 4, 5A, 6, 7, 22

P:\Projects\220022~1\01\Work\SJW\Output\Report\San Juan Waterfront Masterplan Transport Assessment_5-review.doc
68
FIGURE 5.33 PA_ALT2 AM TURNING MOVEMENTS; INTERSECTIONS 8, 9, 10, 11, 23
FIGURE 5.34 PA_ALT2 AM TURNING MOVEMENTS; INTERSECTIONS 12, 13, 15

P:\Projects\220022~1\01\Work\SJW\Output\Report\San Juan Waterfront Masterplan Transport Assessment_5-review.doc
69
FIGURE 5.35 PA_ALT2 AM TURNING MOVEMENTS; INTERSECTION 14
FIGURE 5.36 PA_ALT2 AM TURNING MOVEMENTS; INTERSECTIONS 16, 17, 18, 19, 25
FIGURE 5.37 PA_ALT2 AM TURNING MOVEMENTS; INTERSECTIONS 21, 26, 27, 28

P:\Projects\220022~1\01\Work\SJW\Output\Report\San Juan Waterfront Masterplan Transport Assessment_5-review.doc
70
FIGURE 5.38 PA_ALT2 PM TURNING MOVEMENTS; INTERSECTION 1
FIGURE 5.39 PA_ALT2 PM TURNING MOVEMENTS; INTERSECTION 2
FIGURE 5.40 PA_ALT2 PM TURNING MOVEMENTS; INTERSECTIONS 3, 4, 5A, 6, 7, 22

P:\Projects\220022~1\01\Work\SJW\Output\Report\San Juan Waterfront Masterplan Transport Assessment_5-review.doc
71
FIGURE 5.41 PA_ALT2 PM TURNING MOVEMENTS; INTERSECTIONS 8, 9, 10, 11, 23
FIGURE 5.42 PA_ALT2 PM TURNING MOVEMENTS; INTERSECTIONS 12, 13, 15

P:\Projects\220022~1\01\Work\SJW\Output\Report\San Juan Waterfront Masterplan Transport Assessment_5-review.doc
72
FIGURE 5.43 PA_ALT2 PM TURNING MOVEMENTS; INTERSECTION 14
FIGURE 5.44 PA_ALT2 PM TURNING MOVEMENTS; INTERSECTIONS 16, 17, 18, 19, 25
FIGURE 5.45 PA_ALT2 PM TURNING MOVEMENTS; INTERSECTIONS 21, 26, 27, 28

P:\Projects\220022~1\01\Work\SJW\Output\Report\San Juan Waterfront Masterplan Transport Assessment_5-review.doc
73
Modified No Action-Alternative 3
5.17 The Modified No Action (MNA_Alt3) model was prepared based on the existing conditions model, but considering the proposed I5 design and the tramline as explained in Chapter 3 (Figure 5.46). This model was also prepared for future year 2025.
5.18 In order to project the traffic expected in the study area for year 2025, this model includes the base traffic plus the projected traffic to be generated by the development of the project area as currently zoned. Also, additional traffic was added from other projects that are expected to occur in the vicinity of the project site including the completion of the Puerto Rico Convention Center District, and various proposed development in the San Juan (Refer to Chapter 6 for the detail of trip generation and proposed projects).
5.19 The MNA_Alt3 model consists of 47 zones and 22 matrices with a total volume of 22,815 vehicles during the AM peak and 23,226 during the PM peak.
5.20 Figure 5.47 to Figure 5.58 show the turning movements on the network for the MNA_Alt3 model along Fernández Juncos Avenue and Del Tren Street.

P:\P
rojects\220
022~1
\01\W
ork\SJW
\Ou
tput\Report\S
an Juan Waterfront M
asterplan T
ransport Assessm
ent_5
-review.doc
74
FIG
UR
E 5.46
MO
DIFIE
D N
O A
CTIO
N A
ND
NO
AC
TION
(ALT
ER
AN
TIV
ES
3 & 4); M
OD
ELE
D H
IGH
WA
Y N
ET
WO
RK

P:\Projects\220022~1\01\Work\SJW\Output\Report\San Juan Waterfront Masterplan Transport Assessment_5-review.doc
75
FIGURE 5.47 MNA_ALT3 AM TURNING MOVEMENTS; INTERSECTION 1
FIGURE 5.48 MNA_ALT3 AM TURNING MOVEMENTS; INTERSECTION 2
FIGURE 5.49 MNA_ALT3 AM TURNING MOVEMENTS; INTERSECTIONS 4, 5A, 6

P:\Projects\220022~1\01\Work\SJW\Output\Report\San Juan Waterfront Masterplan Transport Assessment_5-review.doc
76
FIGURE 5.50 MNA_ALT3 AM TURNING MOVEMENTS; INTERSECTIONS 8, 9, 10, 11
FIGURE 5.51 MNA_ALT3 AM TURNING MOVEMENTS; INTERSECTIONS 12, 13, 14, 15, 16, 17
FIGURE 5.52 MNA_ALT3 AM TURNING MOVEMENTS; INTERSECTION 18, 19, 21

P:\Projects\220022~1\01\Work\SJW\Output\Report\San Juan Waterfront Masterplan Transport Assessment_5-review.doc
77
FIGURE 5.53 MNA_ALT3 PM TURNING MOVEMENTS; INTERSECTION 1
FIGURE 5.54 MNA_ALT3 PM TURNING MOVEMENTS; INTERSECTION 2
FIGURE 5.55 MNA_ALT3 PM TURNING MOVEMENTS; INTERSECTIONS 4, 5A, 6

P:\Projects\220022~1\01\Work\SJW\Output\Report\San Juan Waterfront Masterplan Transport Assessment_5-review.doc
78
FIGURE 5.56 MNA_ALT3 PM TURNING MOVEMENTS; INTERSECTIONS 8, 9, 10, 11
FIGURE 5.57 MNA_ALT3 PM TURNING MOVEMENTS; INTERSECTIONS 12, 13, 14, 15, 16, 17
FIGURE 5.58 MNA_ALT3 AM TURNING MOVEMENTS; INTERSECTION 18, 19, 21

P:\Projects\220022~1\01\Work\SJW\Output\Report\San Juan Waterfront Masterplan Transport Assessment_5-review.doc
79
No Action-Alternative 4
5.21 The No Action (NA_Alt4) model was prepared based on the existing conditions model, but considering the proposed I5 design and the tramline as explained in Chapter 3 (Figure 5.46). This model was also prepared for future year 2025.
5.22 In order to project the traffic expected in the project area for year 2025, this model considers current land uses (base model), the Puerto Rico Convention Center District and other proposed developments for the San Juan area other than those from the SJW (Refer to Chapter 6).
5.23 The NA_Alt4 model consists of 47 zones and 22 matrices with a total volume of 19,227 vehicles during the AM peak and 17,479 during the PM peak.
5.24 Figure 5.59 to Figure 5.70 show the turning movements on the network for the NA model along Fernández Juncos Avenue and Del Tren Street.
FIGURE 5.59 NA_ALT4 AM TURNING MOVEMENTS; INTERSECTION 1
FIGURE 5.60 NA_ALT4 AM TURNING MOVEMENTS; INTERSECTION 2

P:\Projects\220022~1\01\Work\SJW\Output\Report\San Juan Waterfront Masterplan Transport Assessment_5-review.doc
80
FIGURE 5.61 NA_ALT4 AM TURNING MOVEMENTS; INTERSECTIONS 4, 5A, 6
FIGURE 5.62 NA_ALT4 AM TURNING MOVEMENTS; INTERSECTIONS 8, 9, 10, 11
FIGURE 5.63 NA_ALT4 AM TURNING MOVEMENTS; INTERSECTIONS 12, 13, 14, 15, 16, 17

P:\Projects\220022~1\01\Work\SJW\Output\Report\San Juan Waterfront Masterplan Transport Assessment_5-review.doc
81
FIGURE 5.64 NA_ALT4 AM TURNING MOVEMENTS; INTERSECTION 18, 19, 21
FIGURE 5.65 NA_ALT4 PM TURNING MOVEMENTS; INTERSECTION 1
FIGURE 5.66 NA_ALT4 PM TURNING MOVEMENTS; INTERSECTION 2

P:\Projects\220022~1\01\Work\SJW\Output\Report\San Juan Waterfront Masterplan Transport Assessment_5-review.doc
82
FIGURE 5.67 NA_ALT4 PM TURNING MOVEMENTS; INTERSECTIONS 4, 5A, 6
FIGURE 5.68 NA_ALT4 PM TURNING MOVEMENTS; INTERSECTIONS 8, 9, 10, 11
FIGURE 5.69 NA_ALT4 PM TURNING MOVEMENTS; INTERSECTIONS 12, 13, 14, 15, 16, 17

P:\Projects\220022~1\01\Work\SJW\Output\Report\San Juan Waterfront Masterplan Transport Assessment_5-review.doc
83
FIGURE 5.70 NA_ALT4 AM TURNING MOVEMENTS; INTERSECTION 18, 19, 21
P:\Projects\220022~1\01\Work\SJW\Output\Report\San Juan Waterfront Masterplan Transport Assessment_5-review.doc
84
6. TRIP GENERATION
Introduction
6.1 Trip generation data is used to estimate future traffic volumes for different land uses. In this chapter the expected vehicular trip generation for the new developments affecting the San Juan Waterfront project area were calculated. Calculations are based on the United States Institute of Transportation Engineers (ITE) Trip Generation Manual (TGM) (7th Ed.).
6.2 Proportions were adjusted to better reflect the local conditions prevalent in Puerto Rico. This methodology is explained in detail in the following sections.
Trip Generation Manual
6.3 The ITE Trip Generation Manual contains a large amount of information regarding trip generation rates for many different types of land use. This data is based on actual observations on trip generation studies undertaken across the country for similar land use development. The land description from the TGM that closest matches the land uses proposed for each development was selected. The Trip Generation Manuals presents correlation formulas and/or trip rates to estimate the proposed development traffic volume production.
6.4 The TGM provides for making adjustments/reductions to the projected traffic for multi-use facilities. This adjustment is applicable to projects that have mixed-uses including residential, office and/or commercial. Due to the fact that some of the proposed developments are multi-use facilities, certain trips will happen within the development itself (for example resident using the commercial uses within the development).
6.5 Additional adjustments were made to consider reductions due to pass-by trips. These are trips made by traffic already using the adjacent road and enter the site as an intermediate stop. Therefore it is not a new trip produced due to the development.
6.6 Also, since the area is currently served by mass transport and a tramway is proposed in the area, adjustments for mass transit were applied when possible. Mass transport adjustment cannot be combined with multi-use adjustments.
6.7 Appendix D includes the trip generation spreadsheets.
San Juan: Other Developments
6.8 There are several projects planned for San Juan, besides those from the San Juan Waterfront and the Puerto Rico Convention Center District. The required information for proposed projects and/or ongoing developments was obtained by visiting the websites of the Puerto Rico Planning Board (Junta de Planificación-JP) and the Administration of Ruling and Permits (ARPE), and contacting the Municipality of San Juan Planning Office and the PRHTA Access Control Office.

P:\Projects\220022~1\01\Work\SJW\Output\Report\San Juan Waterfront Masterplan Transport Assessment_5-review.doc
85
6.9 A total of 13 developments were found near the influence area and are expected to generate traffic within the San Juan Isleta and/or I5. A list of these developments and their proposed development programs is shown on Table 6.1. Figure 6.1 shows their locations.
TABLE 6.1 EXPECTED DEVELOPMENTS WITHIN THE STUDY INFLUENCE AREA
Name of Development
Res
iden
tial
(uni
ts)
Com
mer
cial
(S
q.ft.
)
Por
t
(B
erth
s)
Lodg
ing
(Key
s)
Offi
ce
(Sq.
ft.)
Res
taur
ants
(S
q.ft.
)
Rec
reat
iona
l (S
q.ft.
)
Inst
itutio
nal
(Sq.
ft.)
Bayside 531 30,000 7
Atlantis 169
Portal de Miramar 17
Aquamar 120
Royal Bay Club 180
Capitolio Plaza 153 12,000
Hotel Cervantes 18
Smallwood Place 52 85,474
Atlantic Executive Hotel 28
Torre Brentanos 106,896
Paseo Caribe 92 99,131 337 6,000 23,384
Biblioteca Tribunal Supremo
94,207
San Agustín 134 300 20,000

P:\P
rojects\220022~1\01\Work\S
JW\O
utput\R
eport\San Juan W
aterfront Masterplan T
ransport Assessm
ent_5-review.doc
86
FIG
UR
E 6.1
LOC
AT
ION
S O
F D
EV
ELO
PM
EN
TS
WIT
HIN
TH
E S
TU
DY
INF
LUE
NC
E A
RE
A
N

P:\Projects\220022~1\01\Work\SJW\Output\Report\San Juan Waterfront Masterplan Transport Assessment_5-review.doc
87
6.10 To estimate the traffic generation for each development, applicable trip rates are employed according to the respective land uses identified on the ITE Trip Generation Manual (7th Ed.).
6.11 Trip generation projections were prepared for AM and PM adjacent road peak hours. The applicable adjustments were applied to each development. The results are shown on Table 6.2.
TABLE 6.2 TOTAL ADJUSTED TRIP GENERATION OF EXPECTED DEVELOPMENTS WITHIN THE STUDY INFLUENCE AREA
AM PM
Land Use Entering Exiting Entering Exiting
Bayside 182 340 200 152
Atlantis 14 59 42 26
Portal de Miramar 6 25 12 8
Aquamar 11 48 32 20
Royal Bay Club 13 56 40 25
Capitolio Plaza 58 101 48 37
Hotel Cervantes 3 2 6 5
Smallwood Place 37 157 114 70
Atlantic Executive Hotel 5 3 9 8
Torre Brentano 174 24 34 165
Paseo Caribe 267 273 361 211
Biblioteca Tribunal Supremo 86 33 27 29
San Agustín 153 95 93 175
TOTAL 1009 1216 1018 931

P:\Projects\220022~1\01\Work\SJW\Output\Report\San Juan Waterfront Masterplan Transport Assessment_5-review.doc
88
Convention Center District (PRCCD)
6.12 Table 6.3 shows the proposed land uses and their respective proposed areas.
TABLE 6.3 CONVENTION CENTER DISTRICT LAND USES
Use Total Area (sq ft)
Hotel 1,243,051
Commercial 245,000
Office 477,035
Residential 1,081,758
Aquarium 152,592
TOTAL 3,199,436
6.13 Trip generation projections were made for the AM and PM peak hours based on TGM. The uses from the TGM were selected based on their fit with the proposed development uses:
• Hotel – Use 310 “Hotel”
• Commercial – Use 814 “Specialty Retail Center”
• Office - Use 710 “General Office Building”
• Residential – Use 230 “Residential Condominium”
• Aquarium - Use 481 “Zoo”
6.14 The total adjusted trip generation for the PRCCD, considering the pass-by trips and multi-use reductions are shown on Table 6.4.
TABLE 6.4 CONVENTION CENTER DISTRICT TOTAL ADJUSTED TRIP GENERATION
Land Use Entering
AM Exiting
AM
Entering
PM
Exiting
PM
Hotel 508 368 512 533
Commercial 586 680 199 242
Office 666 72 132 695
Residential 37 162 114 73
Aquarium 2 1 7 10
TOTAL 1799 1283 964 1554
San Juan Waterfront, Proposed Alternative 1
6.15 The San Juan Waterfront proposed development area is 2,326,474 sq. ft for the west side and 1,579,737 sq. ft for the east end, resulting in a total development area of 3,906,211 sq ft. The proposed uses and areas for each use are as follows:

P:\Projects\220022~1\01\Work\SJW\Output\Report\San Juan Waterfront Masterplan Transport Assessment_5-review.doc
89
TABLE 6.5 PROPOSED ALTERNATIVE 1 AREAS PER LAND USE; WEST END
Land Use Total Area (sq. ft.)
Commercial 225,574
Hotel 648,946
Casino 10,000
Marina Facilities 10,000
Residential 1,373,689
Civic 58,265
TOTAL 2,326,474
TABLE 6.6 PROPOSED ALTERNATIVE 1 AREAS PER LAND USE; EAST END
Land Use Total Area (sq. ft.)
Commercial 79,718
Residential 1,287,861
Civic 68,952
Office 143,206
TOTAL 1,579,737
6.16 Trip generation projections were made for the AM and PM peak hours. The uses from the TGM were selected based on their fit with the proposed development uses:
• Commercial – Use 814 “Specialty Retail Center”
• Residential – Use 230 “Residential Condominium”
• Hotel – Use 310 “Hotel”
• Casino – (ITE Journal, May 1992, page 35)
• Port and Terminal – Use 010 “Waterport/ Marine Terminal”
• Civic – Use 495 “Recreational Community Center”
• Office – Use 710 “General Office Building”
6.17 Trip generation calculations were made for each parcel within the proposed scheme based on its land use.
6.18 Table 6.7 and Table 6.8 show the trip generation after applying the corresponding multi-use, pass by and mass transit adjustments (Appendix D) for the San Juan Waterfront Alternative 1 west and east ends.

P:\Projects\220022~1\01\Work\SJW\Output\Report\San Juan Waterfront Masterplan Transport Assessment_5-review.doc
90
TABLE 6.7 PORPOSED ALTERNATIVE 1 ADJUSTED TRIP GENERATION; WEST END
Land Use Entering
AM
Exiting
AM
Entering
PM
Exiting
PM
Commercial 708 828 208 256
Residential 47 231 263 124
Hotel 235 152 282 246
Casino 63 52 100 72
Port and Terminal 37 44 42 30
Civic 58 37 28 68
TOTAL 1148 1344 922 796
TABLE 6.8 PROPOSED ALTERNATIVE 1 ADJUSTED TRIP GENERATION; EAST END
Land Use Entering
AM
Exiting
AM
Entering
PM
Exiting
PM
Commercial 304 343 82 99
Residential 39 245 250 123
Civic 45 37 30 73
Office 179 20 31 171
TOTAL 568 645 392 465

P:\Projects\220022~1\01\Work\SJW\Output\Report\San Juan Waterfront Masterplan Transport Assessment_5-review.doc
91
San Juan Waterfront, Proposed Alternative 2
6.19 The San Juan Waterfront Alternative 2 presents a variation in both the Marina facilities and Parque de la Bahِía locations. The remaining components will be constructed as described in the Proposed Action Alternative 1, except for the Office Land Use, which is not included in this scheme. The total development area is of 3,734,246 sq. ft., of which 2,467,086 sq. ft. is in the west end and 1,267,160 sq. ft. in the east end. The proposed areas per land use are as follows:
TABLE 6.9 PROPOSED ALTERNATIVE 2 AREAS PER LAND USE; WEST END
Land Use Total Area (sq. ft.)
Commercial 249,098
Hotel 590,680
Casino 10,000
Marina Facilities 11,800
Residential 1,545,508
Civic 60,000
TOTAL 2,467,086
TABLE 6.10 PORPOSED ALTERNATIVE 2 AREAS PER LAND USE; EAST END
Land Use Total Area (sq. ft.)
Commercial 214,012
Residential 1,053,148
TOTAL 1,267,160
6.20 Traffic projections were based on the proposed land uses for each parcel within the scheme. One of these parcels (parcel C) is already being redeveloped by a private developer and therefore, it was not taken into account for the San Juan Waterfront traffic projections. The name of the project to be developed in this parcel is San Agustín 134 and it is included in the Other Developments section in this Chapter. The remaining land uses are:
• Commercial – Use 814 “Specialty Retail Center”
• Hotel – Use 310 “Hotel”
• Casino – (ITE Journal, May 1992, page 35)
• Port and Terminal – Use 010 “Waterport/ Marine Terminal”
• Residential – Use 230 “Residential Condominium”
• Civic – Use 495 “Recreational Community Center”
6.21 Trip generation for each land use was calculated and adjusted. Table 6.11 and Table

P:\Projects\220022~1\01\Work\SJW\Output\Report\San Juan Waterfront Masterplan Transport Assessment_5-review.doc
92
6.12.show the adjusted trip generation for the Alternative 2 San Juan Waterfront west and east ends respectively.
TABLE 6.11 PROPOSED ALTERNATIVE 2 ADJUSTED TRIP GENERATION; WEST END
Land Use Entering
AM
Exiting
AM
Entering
PM
Exiting
PM
Commercial 692 750 208 265
Hotel 269 172 297 263
Casino 63 52 100 72
Marina Facilities 37 44 42 30
Residential 66 322 300 148
Civic 59 38 29 70
TOTAL 1187 1378 976 848
TABLE 6.12 PROPOSED ALTERNATIVE 2 ADJUSTED TRIP GENERATION; EAST END
Land Use Entering
AM
Exiting
AM
Entering
PM
Exiting
PM
Commercial 429 465 157 200
Residential 45 221 206 102
TOTAL 474 686 363 301
San Juan Waterfront: CT-3 Zoning (Alternative 3)
6.22 The development of the San Juan Waterfront area as a CT-3 zone was evaluated as part of the Modified No Action Alternative 3. The trip generation for this scenario was calculated based on CT-3 zoning restrictions for land use and maximum occupation area.
6.23 CT-3 zoning regulation allows for commercial and residential uses. Assuming buildings in the area would have a ground level floor for commercial use and two additional upper levels for residential use, the following data was obtained:

P:\Projects\220022~1\01\Work\SJW\Output\Report\San Juan Waterfront Masterplan Transport Assessment_5-review.doc
93
TABLE 6.13 SAN JUAN WATERFRONT DEVELOPMENT UNDER CT-3 ZONING
Total Development Area
[sq ft]
Gross Leasable Area (Max. Land Occupancy)
[sq ft]
Max. No. Residential Units
[Units]
2,261,093 1,695,820 3,939
6.24 The maximum number of residential units was obtained based on the total project area zoned as CT3 (approximately 2,261,088 sq.ft.) and on the restriction of one residential unit per 861 sq ft. The gross leasable area for commercial use was assumed to be equal to the maximum occupation area of the lot (75%).
6.25 Table 6.14 shows the trip generation calculations for this scenario with the corresponding adjustments.
TABLE 6.14 SAN JUAN WATERFRONT CT-3 ZONING ADJUSTED TRIP GENERATION
Land Use Entering
AM Exiting
AM Entering
PM Exiting
PM
Commercial 141 688 696 343
Residential 1324 1435 1224 1558
TOTAL 1465 2123 1876 1871

P:\Projects\220022~1\01\Work\SJW\Output\Report\San Juan Waterfront Masterplan Transport Assessment_5-review.doc
94
7. PARAMICS MODELING RESULTS
Introduction
7.1 The results from the models were obtained from an average of outputs from running each model up to 30 times. The modeling was undertaken using a dynamic routing approach were the model defines each minute into the 1 hour modeling the best route for each Origen-Destination to be loaded to the model. This approach results in a more realistic modeling since vehicles will use alternate routes when traffic queuing occurs. Appendices E and F include some input and output files of all the models.
7.2 The outputs from Paramics are given in form of journey times, queuing and number of vehicles. In order to comply with the Puerto Rico Traffic Studies Guides9, free flow operations for each model were ran in order to express the simulation results in terms of queue length (maximum number of vehicles in queue), average delay (seconds per vehicle) and Level of Service (LOS).
7.3 Level of Service is a quality measure that describes the traffic operational conditions in terms of speed, travel time, freedom to maneuver, traffic interruption, comfort and convenient. There area six (6) LOS defined by letters A to F, with LOS A representing the best operation and LOS F the worst. The LOS grades used for signalized and un-signalized intersections are included in Table 7.1.
TABLE 7.1 GRADES OF LEVEL OF SERVICE
LOS Signalized
Delay (sec/veh)
Unsignalized
Delay (sec/veh)
A ≤10 0-10
B > 10 – 20 > 10 – 15
C >20 – 35 >15 – 25
D >35 – 55 >25 – 35
E >55 – 80 >35 – 50
F >80 >50
9 Estado Libre Asociado de Puerto Rico, Departamento de Transportación y Obras Públicas, Autoridad de Carreteras y Transportación. (22 de diciembre de 2004). Guías para la Preparación de Estudios Operacionales de Acceso y de Tránsito para Puerto Rico; Versión 1.0;

P:\Projects\220022~1\01\Work\SJW\Output\Report\San Juan Waterfront Masterplan Transport Assessment_5-review.doc
95
Base Model
7.4 Figure 7.1and Figure 7.2 show the results of the AM and PM Paramics models for the Base model (2007) for the intersections with Fernández Juncos Ave. and Del Tren Street. Table 7.2 shows the average journey time (JT) and delay for Fernández Juncos Ave. and Del Tren Street.
TABLE 7.2 TRAVEL TIMES ALONG FERNÁNDEZ JUNCOS AVE AND DEL TREN STREET; BASE MODEL
AM PM
Journey Time
(sec)
Delay
(sec/veh)
Journey Time
(sec)
Delay
(sec/veh)
Del Tren St. Eastbound (from G. Concepción de Gracia St. to Calle 5)/MT
199 1.8 207 3.3
Del Tren St. Westbound (from Calle 5 to G. Concepción de Gracia St.)/MT
387 0.0 393 0.0
Fernández Juncos Avenue Eastbound (from G. Concepción de Gracia St. to Calle 5)
146 10.4 218 25.2
Fernández Juncos Avenue Westbound (from Calle 5 to G. Concepción de Gracia St.)
173 20.9 157 8.0
MT-Mass Transit corridor

P:\Projects\220022~1\01\Work\SJW\Output\Report\San Juan Waterfront Masterplan Transport Assessment_5-review.doc
96
FIGURE 7.1 AM RESULTS; BASE MODEL
(Intersection 1) AM Peak - Gilberto Concepcion de Gracia and Fernandez Juncos Intersection (Intersection 11) AM Peak - Matias Ledesma and Fernandez Juncos Intersection
Calle Concepción de Gracia (NB) TR A 0.00 2 Calle Matias Ledesma (NB) LTR B 10.54 0
Calle Concepción de Gracia (SB) LTR A 0.00 8 Calle Matias Ledesma (SB) LTR B 17.92 3
Ave. Fernandez Juncos (WB) TR A 2.03 12 Ave. Fernandez Juncos (EB) LTR A 3.84 6
Intersection A 1.18 12 Ave. Fernandez Juncos (WB) LTR A 4.40 10
Intersection A 4.46 10
(Intersection 2) AM Peak - Valdes and Fernandez Juncos/Del Tren Intersection
(Intersection 12) AM Peak - San Juan Bautista and Del Tren Intersection
Calle Vales (SB) LR A 0.13 7
Calle Del Tren (WB)/MT T A 0.00 - Calle San Juan Bautista (NB) T A 0.16 0
Ave. Fernandez Juncos (EB) LT A 5.18 7 Calle San Juan Bautista (SB) T A 0.74 0
Ave. Fernandez Juncos (WB) TR A 4.89 12 Calle Del Tren (EB)/MT T A 0.01 0
Intersection A 4.60 12 Calle Del Tren (WB)/MT T A 0.00 0
Intersection A 0.20 0
(Intersection 3) AM Peak - Marina Access and Fernandez Juncos Intersection
(Intersection 13) AM Peak - San Juan Bautista and Fernandez Juncos Intersection
Calle San Juan Bautista (NB) LTR A 7.32 0
Calle San Juan Bautista (SB) LTR B 13.56 0
Intersection Ave. Fernandez Juncos (EB) LTR A 0.17 0
Ave. Fernandez Juncos (WB) LTR A 0.33 5
(Intersection 4) AM Peak - San Andres and Del Tren Intersection Intersection A 0.42 5
(Intersection 14) AM Peak - M. Fernandez and Del Tren IntersectionCalle San Andres (NB) T A 4.52 0
Calle San Andres (SB) T C 28.50 0
Calle Del Tren (EB)/MT T A 0.04 0 Calle Fernandez (NB) L A 0.00 0
Calle Del Tren (WB)/MT T A 0.00 0 Calle Fernandez (SB) N/A / / /
Intersection A 3.69 - Calle Del Tren (EB)/MT T A 0.00 0
Calle Del Tren (WB)/MT T A 0.03 0
(Intersection 5A) AM Peak - San Andres and Fernandez Jucnos Intersection Intersection A 0.01 0
(Intersection 15) AM Peak - M Feranandez and Fernandez Juncos IntersectionCalle San Andres (NB) LTR A 5.71 0
Calle San Andres (SB) LTR A 9.17 0
Ave. Fernandez Juncos (EB) LTR A 0.58 4 Calle Fernandez (NB) N/A / / /
Ave. Fernandez Juncos (WB) LTR A 9.02 18 Calle Fernandez (SB) LR A 0.00 0
Intersection A 6.60 18 Ave. Fernandez Juncos (EB) LT A 0.05 0
Ave. Fernandez Juncos (WB) TR A 0.02 0
(Intersection 6) AM Peak - Pelayo and Del Tren Intersection Intersection A 0.03 0
(Intersection 16) AM Peak - Ramon Power and Del Tren IntersectionCalle Pelayo (NB) N/A / / /
Calle Pelayo (SB) LR A 0.00 0
Calle Del Tren (EB)/MT T A 0.00 0 Calle Ramon Power (NB) T A 0.00 4
Calle Del Tren (WB)/MT T A 0.00 0 Calle Ramon Power (SB) T A 2.54 2
Intersection A 0.00 0 Calle Del Tren (EB)/MT T A 0.00 0
Calle Del Tren (WB)/MT T A 0.00 0
(Intersection 7) AM Peak - Pelayo and Fernandez Juncos Intersection Intersection A 0.26 4
(Intersection 17) AM Peak - Ramon Power and Fernandez Juncos Intersection
Calle Ramon Power (NB) N/A / / /
Calle Ramon Power (SB) LR A 7.41 2
Intersection Ave. Fernandez Juncos (EB) LT A 7.42 5
Ave. Fernandez Juncos (WB) TR A 0.16 0
(Intersection 8) AM Peak - Tadeo Rivera and Del Tren Intersection Intersection A 2.12 5
(Intersection 18) AM Peak - Calle 3 and Del Tren IntersectionCalle Tadeo Rivera (NB) N/A / / /
Calle Tadeo Rivera (SB) LR A 0.00 0
Calle Del Tren (EB)/MT T A 0.13 0 Calle 3 (NB) LR A 0.00 0
Calle Del Tren (WB)/MT T A 0.00 0 Calle Del Tren (EB)/MT T A 0.00 0
Intersection A 0.04 0 Calle Del Tren (WB)/MT T A 0.00 0
Intersection A 0.00 0
(Intersection 9) AM Peak - Tadeo Rivera and Fernandez Juncos Intersection
(Intersection 19) AM Peak - Calle 3 and Fernandez Juncos Intersection
Calle Tadeo Rivera (NB) LR A 8.70 4.20
Calle Tadeo Rivera (SB) N/A / / / Calle 3 (NB) N/A / / /
Ave. Fernandez Juncos (EB) TR A 0.10 0 Calle 3 (SB) LR A 7.77 4
Ave. Fernandez Juncos (WB) LT A 0.00 0 Ave. Fernandez Juncos (EB) LT A 0.24 3
Intersection A 0.05 0 Ave. Fernandez Juncos (WB) TR A 0.22 4
Intersection A 0.51 4
(Intersection 10) AM Peak - Matias Ledesma and Del Tren Intersection
(Intersection 20) AM Peak - Calle 5 and Del Tren Intersection
Calle Matias Ledesma (NB) T A 0.00 0
Calle Matias Ledesma (SB) T C 21.47 2 Calle 5 (NB) T A 0.00 0
Calle Del Tren (EB)/MT T A 1.36 0 Calle 5 (SB) T E 57.66 2
Calle Del Tren (WB)/MT T A 0.51 0 Calle Del Tren (EB)/MT T A 0.67 0
Intersection A 9.88 2 Calle Del Tren (WB)/MT T A 0.48 0
Intersection A 6.03 2
(Intersection 21) AM Peak - Calle 5 and Fernandez Juncos Intersection
Calle 5 (SB) TR A 5.10 0
Ave. Fernandez Juncos (EB) LT A 0.39 0
Ave. Fernandez Juncos (WB) TR A 0.71 0
Intersection A 0.68 0
Year
2007
Year
2007
Year
2007
Year
2007
Year
2007
Year
2007
Year
2007
Year
2007
Year
2007
Year
2007
Year
2007
Scenario Access
Base
Scenario Access
Base
Scenario Access
MovementLevel of
Service (LOS)Delay
(sec/veh) Queue Length
(no. of veh)
MovementLevel of
Service (LOS)Delay
(sec/veh) Queue Length
(no. of veh)
MovementLevel of
Service (LOS)Delay
(sec/veh) Queue Length
(no. of veh)
Delay (sec/veh)
Queue Length (no. of veh)
Base
Base
Scenario Access Movement
Access MovementLevel of
Service (LOS)
Level of Service (LOS)
Delay (sec/veh)
Queue Length (no. of veh)
Base
Scenario Access MovementLevel of
Service (LOS)Delay
(sec/veh) Queue Length
(no. of veh)
Scenario
Delay (sec/veh)
Queue Length (no. of veh)
Base
Base
Scenario Access Movement
Access MovementLevel of
Service (LOS)
Level of Service (LOS)
Delay (sec/veh)
Queue Length (no. of veh)
Base
Scenario Access MovementLevel of
Service (LOS)Delay
(sec/veh) Queue Length
(no. of veh)
Scenario
Base
Scenario Access MovementLevel of
Service (LOS)Delay
(sec/veh) Queue Length
(no. of veh)
Base
Scenario Access MovementLevel of
Service (LOS)Delay
(sec/veh) Queue Length
(no. of veh)
Base
Year Scenario Access MovementLevel of
Service (LOS)Delay
(sec/veh) Queue Length
(no. of veh)
2007 Base
Year Scenario Access MovementLevel of
Service (LOS)Delay
(sec/veh) Queue Length
(no. of veh)
2007 Base
Year Scenario Access MovementLevel of
Service (LOS)Delay
(sec/veh) Queue Length
(no. of veh)
2007 BaseN/A
Year Scenario Access MovementLevel of
Service (LOS)Delay
(sec/veh) Queue Length
(no. of veh)
2007 Base
Year Scenario Access MovementLevel of
Service (LOS)Delay
(sec/veh) Queue Length
(no. of veh)
2007 Base
Year Scenario Access MovementLevel of
Service (LOS)Delay
(sec/veh) Queue Length
(no. of veh)
2007 Base
Year Scenario Queue Length
(no. of veh)
2007 BaseN/A
Access MovementLevel of
Service (LOS)Delay
(sec/veh)
Level of Service (LOS)
Delay (sec/veh)
Queue Length (no. of veh)
2007 Base
Year Scenario Access Movement
Level of Service (LOS)
Delay (sec/veh)
Queue Length (no. of veh)
2007 Base
Year Scenario Access Movement
Level of Service (LOS)
Delay (sec/veh)
Queue Length (no. of veh)
2007 Base
Year Scenario Access Movement

P:\Projects\220022~1\01\Work\SJW\Output\Report\San Juan Waterfront Masterplan Transport Assessment_5-review.doc
97
FIGURE 7.2 PM RESULTS; BASE MODEL
(Intersection 1) PM Peak - Gilberto Concepcion de Gracia and Fernandez Juncos Intersection (Intersection 11) PM Peak - Matias Ledesma and Fernandez Juncos Intersection
Calle Concepción de Gracia (NB) TR A 6.26 22 Calle Matias Ledesma (NB) LTR B 14.00 0
Calle Concepción de Gracia (SB) LTR A 0.00 8 Calle Matias Ledesma (SB) LTR A 0.00 4
Ave. Fernandez Juncos (WB) TR A 3.31 14 Ave. Fernandez Juncos (EB) LTR B 13.18 49
Intersection A 4.87 22 Ave. Fernandez Juncos (WB) LTR A 0.62 10
Intersection A 10.04 49
(Intersection 2) PM Peak - Valdes and Del Tren Intersection
(Intersection 12) PM Peak - San Juan Bautista and Del Tren Intersection
Calle Vales (SB) LR A 9.52 6
Calle Del Tren (WB)/MT T A 0.00 - Calle San Juan Bautista (NB) T A 0.40 0
Ave. Fernandez Juncos (EB) LT A 2.61 20 Calle San Juan Bautista (SB) T A 1.97 0
Ave. Fernandez Juncos (WB) TR A 1.56 11 Calle Del Tren (EB)/MT T A 0.06 0
Intersection A 2.72 20 Calle Del Tren (WB)/MT T A 0.06 0
Intersection A 0.86 0
(Intersection 3) PM Peak - Marina Access and Fernandez Juncos Intersection
(Intersection 13) PM Peak - San Juan Bautista and Fernandez Juncos Intersection
Calle San Juan Bautista (NB) LTR A 7.89 0
Calle San Juan Bautista (SB) LTR A 9.79 3
Intersection Ave. Fernandez Juncos (EB) LTR A 0.00 0
Ave. Fernandez Juncos (WB) LTR A 0.30 0
(Intersection 4) PM Peak - San Andres and Del Tren Intersection Intersection A 0.31 3
(Intersection 14) PM Peak - M. Fernandez and Del Tren IntersectionCalle San Andres (NB) T A 0.00 0
Calle San Andres (SB) T D 47.39 0
Calle Del Tren (EB)/MT T A 0.00 0 Calle Fernandez (NB) L A 0.00 0
Calle Del Tren (WB)/MT T A 0.00 0 Calle Fernandez (SB) N/A / / /
Intersection B 14.01 - Calle Del Tren (EB)/MT T A 0.00 -1
Calle Del Tren (WB)/MT T A 0.01 0
(Intersection 5A) PM Peak - San Andres and Fernandez Jucnos Intersection Intersection A 0.01 0
(Intersection 15) PM Peak - M Feranandez and Fernandez Juncos IntersectionCalle San Andres (NB) LTR B 17.58 2
Calle San Andres (SB) LTR B 13.88 0
Ave. Fernandez Juncos (EB) LTR A 2.32 31 Calle Fernandez (NB) N/A / / /
Ave. Fernandez Juncos (WB) LTR A 0.00 0 Calle Fernandez (SB) LR A 0.00 0
Intersection A 2.66 31 Ave. Fernandez Juncos (EB) LT A 0.00 0
Ave. Fernandez Juncos (WB) TR A 0.05 1
(Intersection 6) PM Peak - Pelayo and Del Tren Intersection Intersection A 0.01 1
(Intersection 16) PM Peak - RPMon Power and Del Tren IntersectionCalle Pelayo (NB) N/A / / /
Calle Pelayo (SB) LR A 0.00 0
Calle Del Tren (EB)/MT T A 1.00 0 Calle Ramon Power (NB) T A 0.00 4
Calle Del Tren (WB)/MT T A 0.03 0 Calle Ramon Power (SB) T A 0.00 4
Intersection A 0.03 0 Calle Del Tren (EB)/MT T A 0.14 0
Calle Del Tren (WB)/MT T A 0.00 0
(Intersection 7) PM Peak - Pelayo and Fernandez Juncos Intersection Intersection A 0.01 4
(Intersection 17) PM Peak - RPMon Power and Fernandez Juncos Intersection
Calle Ramon Power (NB) N/A / / /
Calle Ramon Power (SB) LR A 3.18 2
Intersection Ave. Fernandez Juncos (EB) LT A 1.62 10
Ave. Fernandez Juncos (WB) TR A 0.00 0
(Intersection 8) PM Peak - Tadeo Rivera and Del Tren Intersection Intersection A 1.73 10
(Intersection 18) PM Peak - Calle 3 and Del Tren IntersectionCalle Tadeo Rivera (NB) N/A / / 0
Calle Tadeo Rivera (SB) LR A 0.00 0
Calle Del Tren (EB)/MT T A 0.00 0 Calle 3 (NB) LR A 0.00 0
Calle Del Tren (WB)/MT T A 0.00 0 Calle Del Tren (EB)/MT T A 0.03 0
Intersection A 0.57 3 Calle Del Tren (WB)/MT T A 0.00 0
Intersection A 0.02 0
(Intersection 9) PM Peak - Tadeo Rivera and Fernandez Juncos Intersection
(Intersection 19) PM Peak - Calle 3 and Fernandez Juncos Intersection
Calle Tadeo Rivera (NB) LR C 18.65 0
Calle Tadeo Rivera (SB) N/A / / / Calle 3 (NB) N/A / / /
Ave. Fernandez Juncos (EB) TR A 1.29 9 Calle 3 (SB) LR A 1.76 5
Ave. Fernandez Juncos (WB) LT A 0.09 0 Ave. Fernandez Juncos (EB) LT A 4.34 15
Intersection A 1.11 9 Ave. Fernandez Juncos (WB) TR A 0.00 0
Intersection A 4.23 15
(Intersection 10) PM Peak - Matias Ledesma and Del Tren Intersection
(Intersection 20) PM Peak - Calle 5 and Del Tren Intersection
Calle Matias Ledesma (NB) T A 0.00 0
Calle Matias Ledesma (SB) T A 0.00 5 Calle 5 (NB) T A 0.00 0
Calle Del Tren (EB)/MT T A 0.81 0 Calle 5 (SB) T A 0.00 0
Calle Del Tren (WB)/MT T A 0.00 0 Calle Del Tren (EB)/MT T A 0.33 0
Intersection A 0.13 5 Calle Del Tren (WB)/MT T A 0.00 0
Intersection A 0.03 0.00
(Intersection 21) PM Peak - Calle 5 and Fernandez Juncos/Del Tren Intersection
Calle 5 (SB) TR A 0.00 0
Ave. Fernandez Juncos (EB) LT A 0.00 0
Ave. Fernandez Juncos (WB) TR A 0.14 0
Intersection A 0.04 0
Year
Year
Year
Level of Service (LOS)
Delay (sec/veh)
Queue Length (no. of veh)
2007 Base
Year Scenario Access Movement
Level of Service (LOS)
Delay (sec/veh)
Queue Length (no. of veh)
2007 Base
Year Scenario Access Movement
Level of Service (LOS)
Delay (sec/veh)
Queue Length (no. of veh)
2007 BaseN/A
Year Scenario Access Movement
Level of Service (LOS)
Delay (sec/veh)
Queue Length (no. of veh)
2007 Base
Year Scenario Access Movement
Level of Service (LOS)
Delay (sec/veh)
Queue Length (no. of veh)
2007 Base
Year Scenario Access Movement
Level of Service (LOS)
Delay (sec/veh)
Queue Length (no. of veh)
2007 Base
Year Scenario Access Movement
Level of Service (LOS)
Delay (sec/veh)
Queue Length (no. of veh)
2007 BaseN/A
Year Scenario Access Movement
Level of Service (LOS)
Delay (sec/veh)
Queue Length (no. of veh)
2007 Base
Year Scenario Access Movement
Level of Service (LOS)
Delay (sec/veh)
Queue Length (no. of veh)
2007 Base
Year Scenario Access Movement
Level of Service (LOS)
Delay (sec/veh)
Queue Length (no. of veh)
2007 Base
Year Scenario Access Movement
Delay (sec/veh)
Queue Length (no. of veh)
2007 Base
Scenario Access MovementLevel of
Service (LOS)
Delay (sec/veh)
Queue Length (no. of veh)
2007 Base
Scenario Access MovementLevel of
Service (LOS)Year
Delay (sec/veh)
Queue Length (no. of veh)
2007 Base
Scenario Access MovementLevel of
Service (LOS)Year
Delay (sec/veh)
Queue Length (no. of veh)
2007 Base
Scenario Access MovementLevel of
Service (LOS)Year
Delay (sec/veh)
Queue Length (no. of veh)
2007 Base
Scenario Access MovementLevel of
Service (LOS)Year
Delay (sec/veh)
Queue Length (no. of veh)
2007 Base
Scenario Access MovementLevel of
Service (LOS)Year
Delay (sec/veh)
Queue Length (no. of veh)
2007 Base
Scenario Access MovementLevel of
Service (LOS)Year
Delay (sec/veh)
Queue Length (no. of veh)
2007 Base
Scenario Access MovementLevel of
Service (LOS)Year
Delay (sec/veh)
Queue Length (no. of veh)
2007 Base
Scenario Access MovementLevel of
Service (LOS)Year
Delay (sec/veh)
Queue Length (no. of veh)
2007 Base
Scenario Access MovementLevel of
Service (LOS)
Delay (sec/veh)
Queue Length (no. of veh)
2007 Base
Scenario Access MovementLevel of
Service (LOS)

P:\Projects\220022~1\01\Work\SJW\Output\Report\San Juan Waterfront Masterplan Transport Assessment_5-review.doc
98
Proposed Action-Alternative 1
7.5 Figure 7.3 and Figure 7.4 show the results for the AM and PM PA_Alt 1 year 2025 models for the intersections with Fernández Juncos Ave. and Del Tren Street.
7.6 Table 7.3 includes the travel times recorded for Fernández Juncos Ave. and Del Tren Street for the PA Alt 1 model.
TABLE 7.3 TRAVEL TIMES ALONG FERNÁNDEZ JUNCOS AVE AND DEL TREN STREET; PA ALT 1 MODEL
AM PM Journey
Time (sec)
Delay (sec/veh)
Journey Time (sec)
Delay (sec/veh)
Del Tren St. Eastbound (from G. Concepción de Gracia St. to Calle 5)
N/A N/A N/A N/A
Del Tren St. Westbound (from Calle 5 to G. Concepción de Gracia St.)
210 34 233 70
Fernández Juncos Avenue Eastbound (from G. Concepción de Gracia St. to Calle 5)
212 82 232 183
Fernández Juncos Avenue Westbound (from Calle 5 to G. Concepción de Gracia St.)/MT
TRAM
MT-Mass Transit corridor
Proposed Action-Alternative 2
7.7 Figure 7.5 and Figure 7.6 show the results for the AM and PM PA_Alt2 year 2025 models for the intersections with Fernández Juncos Ave. and Del Tren Street.
7.8 Table 7.4 show the average travel times for the PA_Alt 2 along Fernández Juncos Ave. and Del Tren Street.
TABLE 7.4 TRAVEL TIMES ALONG FERNÁNDEZ JUNCOS AVE AND DEL TREN STREET; PA_ALT2 MODEL
AM PM
Journey Time (sec)
Delay (sec/veh)
Journey Time (sec)
Delay (sec/veh)
Del Tren St. Eastbound (from G. Concepción de Gracia St. to Calle 5)
N/A N/A N/A N/A
Del Tren St. Westbound (from Calle 5 to G. Concepción de Gracia St.)
213 26.0 225 68.6
Fernández Juncos Avenue Eastbound (from G. Concepción de Gracia St. to Calle 5)
237 108.7 305 179.5
Fernández Juncos Avenue Westbound (from Calle 5 to G. Concepción de Gracia St.)/MT
TRAM
MT-Mass Transit corridor

P:\Projects\220022~1\01\Work\SJW\Output\Report\San Juan Waterfront Masterplan Transport Assessment_5-review.doc
99
FIGURE 7.3 AM RESULTS; PA_ALT 1 MODELS
(Intersection 1) AM Peak - Gerardo Concepcion de Gracia and Fernandez Juncos Intersection (Intersection 15) AM Peak - M Feranandez and Fernandez Juncos Intersection
Calle Concepción de Gracia (NB) TR A 7.26 13 Calle Fernandez (NB) TR B 16.22 17
Calle Concepción de Gracia (SB) LTR F 214.09 12 Calle Fernandez (SB) LT C 34.03 13
Ave. Fernandez Juncos (WB) TR B 16.59 34 Ave. Fernandez Juncos (EB) LTR A 9.18 22
Intersection B 14.52 34 Ave. Fernandez Juncos (WB)/MT T A 0.00 0
Intersection B 10.52 22
(Intersection 2) AM Peak - Valdes and Del Tren Intersection
(Intersection 16) AM Peak - Ramon Power and Del Tren Intersection
Calle Vales (SB) R D 33.47 9
Ave. Del Tren (EB) N/A / / / Calle Ramon Power (NB) LT A 5.90 2
Ave. Del Tren (WB) TR A 6.67 9 Calle Ramon Power (SB) TR F 281.37 12
Intersection A 8.76 9 Calle Del Tren (EB) N/A / / /
Calle Del Tren (WB) LTR A 5.65 20
(Intersection 3) AM Peak - Valdes, Marina Access and Fernandez Juncos Intersection Intersection A 7.87 20
(Intersection 17) AM Peak - Ramon Power and Fernandez Juncos Intersection
Marina Access (NB) T B 16.51 12.40
Valdes Street (SB) TL A 0.00 -
Ave. Fernandez Juncos (EB) TR A 0.00 14.27 Calle Ramon Power (NB) TR A 5.42 12
Ave. Fernandez Juncos (WB)/MT T A 0.00 - Calle Ramon Power (SB) LT B 17.51 13
Intersection A 2.59 14 Ave. Fernandez Juncos (EB) LTR B 17.24 26
Ave. Fernandez Juncos (WB)/MT T A 0.00 0
(Intersection 4) AM Peak - San Andres and Del Tren Intersection Intersection B 16.78 26
(Intersection 18) AM Peak - Calle 3 and Del Tren IntersectionCalle San Andres (NB) LT A 7.92 14
Calle San Andres (SB) TR C 20.94 4
Calle Del Tren (EB) N/A / / / Calle 3 (NB) L F 102.80 14
Calle Del Tren (WB) LTR A 3.18 16 Calle Del Tren (EB) N/A / / /
Intersection A 3.95 16 Calle Del Tren (WB) LT A 4.99 21
Intersection A 8.05 21
(Intersection 5) AM Peak - San Andres and Fernandez Jucnos Intersection
(Intersection 19) AM Peak - Calle 3 and Fernandez Juncos Intersection
Calle San Andres (NB) N/A / / /
Calle San Andres (SB) LT / / / Calle 3 (NB) TR D 45.94 25
Ave. Fernandez Juncos (EB) T A 3.38 11 Calle 3 (SB) LT A 3.72 13
Ave. Fernandez Juncos (WB)/MT T A 0.00 0 Ave. Fernandez Juncos (EB) LTR B 10.72 16
Intersection A 3.38 11 Ave. Fernandez Juncos (WB)/MT T A 0.00 0
Intersection B 12.70 25
(Intersection 6) AM Peak - Pelayo and Del Tren Intersection
(Intersection 21) AM Peak - Calle 5 and Fernandez Juncos/Del Tren Intersection
Calle Pelayo (NB) LT C 19.61 11
Calle Pelayo (SB) TR D 31.51 8 Calle 5 (SB) L D 38.94 23
Calle Del Tren (EB) N/A / / / Ave. Fernandez Juncos (EB) T A 2.75 16
Calle Del Tren (WB) LTR A 1.32 10 Ave. Fernandez Juncos (WB) T A 9.28 25
Intersection A 3.18 11 Intersection B 13.91 25
(Intersection 7) AM Peak - Pelayo and Fernandez Juncos Intersection (Intersection 22) AM Peak - Padre Hoff Fernandez Juncos Intersection
Calle Pelayo (NB) TR C 32.17 18 Calle Padre Hoff (NB) TR A 9.77 9
Calle Pelayo (SB) LT B 11.87 19 Ave. Fernandez Juncos (EB) LT A 4.14 14
Ave. Fernandez Juncos (EB) LTR A 3.99 12 Ave. Fernandez Juncos (WB)/MT T A 0.00 0
Ave. Fernandez Juncos (WB)/MT T A 0.00 0 Intersection A 4.62 14
Intersection B 10.48 19
(Intersection 23) AM Peak - SJW Access A and Fernandez Juncos Intersection
(Intersection 8) AM Peak - Tadeo Rivera and Del Tren Intersection
Ave. Fernandez Juncos (EB) TR A 0.13 6
Calle Tadeo Rivera (NB) Ave. Fernandez Juncos (WB)/MT T A 0.00 0
Calle Tadeo Rivera (SB) R A 6.15 4 Intersection A 0.13 6
Calle Del Tren (EB) N/A / / /
Calle Del Tren (WB) TR A 1.11 5 (Intersection 24) AM Peak - SJW Access B and Fernandez Juncos Intersection
Intersection A 1.25 5
(Intersection 9) AM Peak - Tadeo Rivera and Fernandez Juncos Intersection Ave. Fernandez Juncos (EB) TR A 1.39 9
Ave. Fernandez Juncos (WB)/MT T A 0.00 0
Intersection A 1.39 9
Calle Tadeo Rivera (NB)
Calle Tadeo Rivera (SB) (Intersection 25) AM Peak - SJW Access C and Fernandez Juncos IntersectionAve. Fernandez Juncos (EB) T A 0.41 5
Ave. Fernandez Juncos (WB)/MT T A 0.00 0
Intersection A 0.41 5 Ave. Fernandez Juncos (EB) TR B 11.03 16
Ave. Fernandez Juncos (WB)/MT T A 0.00 0
(Intersection 10) AM Peak - Matias Ledesma and Del Tren Intersection Intersection B 11.03 16
(Intersection 26) AM Peak - SJW Access D and Fernandez Juncos IntersectionCalle Matias Ledesma (NB) LT A 8.22 7
Calle Matias Ledesma (SB) TR C 31.18 11
Calle Del Tren (EB) N/A / / / Access D (NB) R F 75.77 10
Calle Del Tren (WB) LTR A 7.69 20 Ave. Fernandez Juncos (EB) T A 8.77 16
Intersection A 8.60 20 Ave. Fernandez Juncos (WB)/MT T A 0.00 0
Intersection B 11.10 16
(Intersection 11) AM Peak - Matias Ledesma and Fernandez Juncos Intersection
(Intersection 27) AM Peak - SJW Access E and Fernandez Juncos Intersection
Calle Matias Ledesma (NB) TR A 4.56 13
Calle Matias Ledesma (SB) LT B 17.05 18 Access E (NB) R D 31.53 3
Ave. Fernandez Juncos (EB) LTR A 1.93 10 Ave. Fernandez Juncos (EB) T A 2.60 20
Ave. Fernandez Juncos (WB)/MT T A 0.00 0 Ave. Fernandez Juncos (WB)/MT T A 0.00 0
Intersection A 3.42 18 Intersection A 2.90 20
(Intersection 12) AM Peak - San Juan Bautista and Del Tren Intersection (Intersection 28) AM Peak - SJW Access F and Fernandez Juncos Intersection
Calle San Juan Bautista (NB) LT F 79.27 11 Access E (NB) R A 0.13 4
Calle San Juan Bautista (SB) TR F 65.81 10 Ave. Fernandez Juncos (EB) TR A 4.28 16
Calle Del Tren (EB) N/A / / / Ave. Fernandez Juncos (WB)/MT T A 0.00 0
Calle Del Tren (WB) LTR A 3.87 12 Intersection A 4.05 16
Intersection A 7.01 12
(Intersection 13) AM Peak - San Juan Bautista and Fernandez Juncos Intersection
Calle San Juan Bautista (NB) TR C 20.76 13
Calle San Juan Bautista (SB) LT B 17.29 17
Ave. Fernandez Juncos (EB) LTR A 4.16 14
Ave. Fernandez Juncos (WB)/MT T A 0.00 0
Intersection A 6.67 17
(Intersection 14) AM Peak - M. Fernandez and Del Tren Intersection
Calle Fernandez (NB) LT F 384.96 20
Calle Fernandez (SB) TR F 128.36 10
Calle Del Tren (EB) N/A / / /
Calle Del Tren (WB) LTR A 2.50 7
Intersection B 17.78 20
Delay (sec/veh)
Queue Length (no. of veh)
2025Proposed
Action
Scenario Access MovementLevel of
Service (LOS)
Delay (sec/veh)
Queue Length (no. of veh)
2025Proposed
Action
Scenario Access MovementLevel of
Service (LOS)
Level of Service (LOS)
Delay (sec/veh)
Queue Length (no. of veh)
2025Proposed
Action
Proposed Action
Year Scenario Access
Queue Length (no. of veh)
2025Proposed
Action
Year Scenario Access MovementLevel of
Service (LOS)Delay
(sec/veh) Queue Length
(no. of veh)
Access MovementLevel of
Service (LOS)Delay
(sec/veh)
Level of Service (LOS)
Delay (sec/veh)
Queue Length (no. of veh)
2025Proposed
Action
Peddestrian Only
Level of Service (LOS)
Delay (sec/veh)
Queue Length (no. of veh)
2025Proposed
Action
Peddestrian Only
Year Scenario Access Movement
Delay (sec/veh)
Queue Length (no. of veh)
2025Proposed
Action
Scenario Access MovementLevel of
Service (LOS)
Delay (sec/veh)
Queue Length (no. of veh)
2025Proposed
Action
Scenario Access MovementLevel of
Service (LOS)
Delay (sec/veh)
Queue Length (no. of veh)
2025Proposed
Action
Scenario Access MovementLevel of
Service (LOS)
Level of Service (LOS)
Delay (sec/veh)
Queue Length (no. of veh)
2025Proposed
Action
Proposed Action
Year Scenario Access
Level of Service (LOS)
Delay (sec/veh)
Queue Length (no. of veh)
2025Proposed
Action
Year Scenario Access Movement
Level of Service (LOS)
Delay (sec/veh)
Queue Length (no. of veh)
2025Proposed
Action
Year Scenario Access Movement
Level of Service (LOS)
Delay (sec/veh)
Queue Length (no. of veh)
Year Scenario Access Movement
2025
Movement
Year
Year
Year
Year Scenario Access
Peddestrian Only
Movement
Year Scenario
2025
Movement
Year
Year
Level of Service (LOS)
Delay (sec/veh)
Queue Length (no. of veh)
2025Proposed
Action
Year Scenario Access Movement
Level of Service (LOS)
Delay (sec/veh)
Queue Length (no. of veh)
2025Proposed
Action
Year Scenario Access Movement
Level of Service (LOS)
Delay (sec/veh)
Queue Length (no. of veh)
2025Proposed
Action
Year Scenario Access Movement
Level of Service (LOS)
Delay (sec/veh)
Queue Length (no. of veh)
2025Proposed
Action
Year Scenario Access Movement
Level of Service (LOS)
Delay (sec/veh)
Queue Length (no. of veh)
2025Proposed
Action
Year Scenario Access Movement
Level of Service (LOS)
Delay (sec/veh)
Queue Length (no. of veh)
2025Proposed
Action
Year Scenario Access Movement
Level of Service (LOS)
Delay (sec/veh)
Queue Length (no. of veh)
2025Proposed
Action
Year Scenario Access Movement
Level of Service (LOS)
Delay (sec/veh)
Queue Length (no. of veh)
2025Proposed
Action
Year Scenario Access Movement
Level of Service (LOS)
Delay (sec/veh)
Queue Length (no. of veh)
2025Proposed
Action
Year Scenario Access Movement
Level of Service (LOS)
Delay (sec/veh)
Queue Length (no. of veh)
2025Proposed
Action
Year Scenario Access Movement
Level of Service (LOS)
Delay (sec/veh)
Queue Length (no. of veh)
2025Proposed
Action
Year Scenario Access Movement
Level of Service (LOS)
Delay (sec/veh)
Queue Length (no. of veh)
2025Proposed
Action
Year Scenario Access Movement
Level of Service (LOS)
Delay (sec/veh)
Queue Length (no. of veh)
2025Proposed
Action
Year Scenario Access Movement

P:\Projects\220022~1\01\Work\SJW\Output\Report\San Juan Waterfront Masterplan Transport Assessment_5-review.doc
100
FIGURE 7.4 PM RESUTS; PA_ALT 1 MODEL
(Intersection 1) PM Peak - Gerardo Concepcion de Gracia and Fernandez Juncos Intersection (Intersection 15) PM Peak - M Feranandez and Fernandez Juncos Intersection
Calle Concepción de Gracia (NB) TR D 36.04 224 Calle Fernandez (NB) TR E 77.43 26
Calle Concepción de Gracia (SB) LTR F 152.26 17 Calle Fernandez (SB) LT E 59.26 24
Ave. Fernandez Juncos (WB) TR C 30.95 183 Ave. Fernandez Juncos (EB) LTR C 21.44 135
Intersection D 35.81 224 Ave. Fernandez Juncos (WB)/MT T A 0.00 0
Intersection C 26.21 135
(Intersection 2) PM Peak - Valdes and Del Tren Intersection
(Intersection 16) PM Peak - RPMon Power and Del Tren Intersection
Calle Vales (SB) R B 12.47 13
Ave. Del Tren (EB) N/A / / / Calle Ramon Power (NB) LT D 45.98 3
Ave. Del Tren (WB) TR A 6.91 25 Calle Ramon Power (SB) TR F 173.95 11
Intersection A 8.24 25 Calle Del Tren (EB) N/A / / /
Calle Del Tren (WB) LTR A 9.02 122
(Intersection 3) PM Peak - Valdes, Marina Access and Fernandez Juncos Intersection Intersection B 10.51 122
(Intersection 17) PM Peak - RPMon Power and Fernandez Juncos Intersection
Marina Access (NB) T B 10.60 22
Valdes Street (SB) TL A 0.00 -
Ave. Fernandez Juncos (EB) TR A 0.00 282 Calle Ramon Power (NB) TR B 14.38 4
Ave. Fernandez Juncos (WB)/MT T A 0.00 - Calle Ramon Power (SB) LT F 129.79 15
Intersection A 0.96 282 Ave. Fernandez Juncos (EB) LTR C 21.27 172
Ave. Fernandez Juncos (WB)/MT T A 0.00 0
(Intersection 4) PM Peak - San Andres and Del Tren Intersection Intersection C 23.54 172
(Intersection 18) PM Peak - Calle 3 and Del Tren IntersectionCalle San Andres (NB) LT B 12.04 16
Calle San Andres (SB) TR C 22.36 4
Calle Del Tren (EB) N/A / / / Calle 3 (NB) L F 54.08 16
Calle Del Tren (WB) LTR A 2.44 52 Calle Del Tren (EB) N/A / / /
Intersection A 4.49 52 Calle Del Tren (WB) LT B 13.80 156
Intersection C 15.36 156
(Intersection 5) PM Peak - San Andres and Fernandez Jucnos Intersection
(Intersection 19) PM Peak - Calle 3 and Fernandez Juncos Intersection
Calle San Andres (NB) N/A / / /
Calle San Andres (SB) LT / / / Calle 3 (NB) TR B 11.50 9
Ave. Fernandez Juncos (EB) T B 13.29 304 Calle 3 (SB) LT C 31.42 21
Ave. Fernandez Juncos (WB)/MT T A 0.00 0 Ave. Fernandez Juncos (EB) LTR B 17.19 97
Intersection B 13.29 304 Ave. Fernandez Juncos (WB)/MT T A 0.00 0
Intersection B 18.73 97
(Intersection 6) PM Peak - Pelayo and Del Tren Intersection
(Intersection 21) PM Peak - Calle 5 and Fernandez Juncos/Del Tren Intersection
Calle Pelayo (NB) LT B 13.26 12
Calle Pelayo (SB) TR F 50.25 22 Calle 5 (SB) LT C 34.26 313
Calle Del Tren (EB) N/A / / / Ave. Fernandez Juncos (EB) T B 10.44 78
Calle Del Tren (WB) LTR A 3.42 55 Ave. Fernandez Juncos (WB)/MT T B 10.16 124
Intersection A 7.09 55 Intersection B 16.66 313
(Intersection 7) PM Peak - Pelayo and Fernandez Juncos Intersection (Intersection 22) PM Peak - Padre Hoff Fernandez Juncos Intersection
Calle Pelayo (NB) TR A 2.49 14 Calle Padre Hoff (NB) TR A 5.43 23
Calle Pelayo (SB) LT C 21.08 40 Ave. Fernandez Juncos (EB) LT B 15.28 112
Ave. Fernandez Juncos (EB) LTR A 6.45 140 Ave. Fernandez Juncos (WB)/MT T A 0.00 0
Ave. Fernandez Juncos (WB)/MT T A 0.00 0 Intersection B 14.24 112
Intersection A 7.93 140
(Intersection 23) PM Peak - SJW Access A and Fernandez Juncos Intersection
(Intersection 8) PM Peak - Tadeo Rivera and Del Tren Intersection
Ave. Fernandez Juncos (EB) TR A 8.96 62
Calle Tadeo Rivera (NB) Ave. Fernandez Juncos (WB)/MT T A 0.00 0
Calle Tadeo Rivera (SB) R A 5.74 6 Intersection A 8.96 62
Calle Del Tren (EB) N/A / / /
Calle Del Tren (WB) TR A 0.42 0 (Intersection 24) PM Peak - SJW Access B and Fernandez Juncos Intersection
Intersection A 0.71 6
(Intersection 9) PM Peak - Tadeo Rivera and Fernandez Juncos Intersection Ave. Fernandez Juncos (EB) TR B 10.72 50
Ave. Fernandez Juncos (WB)/MT T A 0.00 0
Intersection B 10.72 50
Calle Tadeo Rivera (NB)
Calle Tadeo Rivera (SB) (Intersection 25) PM Peak - SJW Access C and Fernandez Juncos IntersectionAve. Fernandez Juncos (EB) T A 6.51 73
Ave. Fernandez Juncos (WB)/MT T A 0.00 0
Intersection A 6.51 73 Ave. Fernandez Juncos (EB) TR C 15.85 69
Ave. Fernandez Juncos (WB)/MT T A 0.00 0
(Intersection 10) PM Peak - Matias Ledesma and Del Tren Intersection Intersection C 15.85 69
(Intersection 26) PM Peak - SJW Access D and Fernandez Juncos IntersectionCalle Matias Ledesma (NB) LT C 23.25 10
Calle Matias Ledesma (SB) TR D 37.77 21
Calle Del Tren (EB) N/A / / / Access D (NB) R F 77.94 6
Calle Del Tren (WB) LTR A 5.02 0 Ave. Fernandez Juncos (EB) T B 11.65 61
Intersection A 8.02 21 Ave. Fernandez Juncos (WB)/MT T A 0.00 0
Intersection B 12.68 61
(Intersection 11) PM Peak - Matias Ledesma and Fernandez Juncos Intersection
(Intersection 27) PM Peak - SJW Access E and Fernandez Juncos Intersection
Calle Matias Ledesma (NB) TR B 15.12 10
Calle Matias Ledesma (SB) LT D 50.69 35 Access E (NB) R F 53.03 3
Ave. Fernandez Juncos (EB) LTR B 17.05 87 Ave. Fernandez Juncos (EB) T A 3.36 98
Ave. Fernandez Juncos (WB)/MT T A 0.00 0 Ave. Fernandez Juncos (WB)/MT T A 0.00 0
Intersection B 19.02 87 Intersection A 3.72 98
(Intersection 12) PM Peak - San Juan Bautista and Del Tren Intersection (Intersection 28) PM Peak - SJW Access F and Fernandez Juncos Intersection
Calle San Juan Bautista (NB) LT E 37.51 9 Access E (NB) R A 0.36 0
Calle San Juan Bautista (SB) TR E 44.86 15 Ave. Fernandez Juncos (EB) TR A 3.89 64
Calle Del Tren (EB) N/A / / / Ave. Fernandez Juncos (WB)/MT T A 0.00 0
Calle Del Tren (WB) LTR A 2.71 33 Intersection A 3.76 64
Intersection A 6.94 33
(Intersection 13) PM Peak - San Juan Bautista and Fernandez Juncos Intersection
Calle San Juan Bautista (NB) TR C 20.46 18
Calle San Juan Bautista (SB) LT E 73.63 37
Ave. Fernandez Juncos (EB) LTR B 15.62 79
Ave. Fernandez Juncos (WB)/MT T A 0.00 0
Intersection C 20.66 79
(Intersection 14) PM Peak - M. Fernandez and Del Tren Intersection
Calle Fernandez (NB) LT A 0.00 64
Calle Fernandez (SB) TR D 38.94 16
Calle Del Tren (EB) N/A / / /
Calle Del Tren (WB) LTR A 1.35 57
Intersection A 2.90 64
Delay (sec/veh)
Queue Length (no. of veh)
2025Proposed
Action
Scenario Access MovementLevel of
Service (LOS)
Delay (sec/veh)
Queue Length (no. of veh)
2025Proposed
Action
Scenario Access MovementLevel of
Service (LOS)
Level of Service (LOS)
Delay (sec/veh)
Queue Length (no. of veh)
2025Proposed
Action
Proposed Action
Year Scenario Access
2025Proposed
Action
Year Scenario Access MovementLevel of
Service (LOS)Delay
(sec/veh) Queue Length
(no. of veh)
2025Proposed
Action
Year Scenario Access MovementLevel of
Service (LOS)Delay
(sec/veh) Queue Length
(no. of veh)
2025Proposed
Action
Year Scenario Access MovementLevel of
Service (LOS)Delay
(sec/veh) Queue Length
(no. of veh)
2025Proposed
Action
Year Scenario Access MovementLevel of
Service (LOS)Delay
(sec/veh) Queue Length
(no. of veh)
2025Proposed
Action
Year Scenario Access MovementLevel of
Service (LOS)Delay
(sec/veh) Queue Length
(no. of veh)
2025Proposed
Action
Peddestrian Only
Year Scenario Access MovementLevel of
Service (LOS)Delay
(sec/veh) Queue Length
(no. of veh)
2025Proposed
Action
Peddestrian Only
Year Scenario Access MovementLevel of
Service (LOS)Delay
(sec/veh) Queue Length
(no. of veh)
2025Proposed
Action
Year Scenario Access MovementLevel of
Service (LOS)Delay
(sec/veh) Queue Length
(no. of veh)
Level of Service (LOS)
Delay (sec/veh)
Queue Length (no. of veh)
2025Proposed
Action
Year Scenario Access Movement
Level of Service (LOS)
Delay (sec/veh)
Queue Length (no. of veh)
2025Proposed
Action
Year Scenario Access Movement
Level of Service (LOS)
Delay (sec/veh)
Queue Length (no. of veh)
Year Scenario Access Movement
Peddestrian Only
2025
Movement
Year
Year
Level of Service (LOS)
Delay (sec/veh)
Queue Length (no. of veh)
2025Proposed
Action
Year Scenario Access Movement
Level of Service (LOS)
Delay (sec/veh)
Queue Length (no. of veh)
2025Proposed
Action
Year Scenario Access Movement
Level of Service (LOS)
Delay (sec/veh)
Queue Length (no. of veh)
2025Proposed
Action
Year Scenario Access Movement
Level of Service (LOS)
Delay (sec/veh)
Queue Length (no. of veh)
2025Proposed
Action
Year Scenario Access Movement
Level of Service (LOS)
Delay (sec/veh)
Queue Length (no. of veh)
2025Proposed
Action
Year Scenario Access Movement
Level of Service (LOS)
Delay (sec/veh)
Queue Length (no. of veh)
2025Proposed
Action
Year Scenario Access Movement
Level of Service (LOS)
Delay (sec/veh)
Queue Length (no. of veh)
2025Proposed
Action
Year Scenario Access Movement
Level of Service (LOS)
Delay (sec/veh)
Queue Length (no. of veh)
2025Proposed
Action
Year Scenario Access Movement
Level of Service (LOS)
Delay (sec/veh)
Queue Length (no. of veh)
2025Proposed
Action
Year Scenario Access Movement
Level of Service (LOS)
Delay (sec/veh)
Queue Length (no. of veh)
2025Proposed
Action
Year Scenario Access Movement
Level of Service (LOS)
Delay (sec/veh)
Queue Length (no. of veh)
2025Proposed
Action
Year Scenario Access Movement
Level of Service (LOS)
Delay (sec/veh)
Queue Length (no. of veh)
2025Proposed
Action
Year Scenario Access Movement
Level of Service (LOS)
Delay (sec/veh)
Queue Length (no. of veh)
2025Proposed
Action
Year Scenario Access Movement

P:\Projects\220022~1\01\Work\SJW\Output\Report\San Juan Waterfront Masterplan Transport Assessment_5-review.doc
101
FIGURE 7.5 AM RESULTS; PA_ALT2 MODEL
(Intersection 1) AM Peak - Gilberto Concepcion de Gracia and Fernandez Juncos Intersection (Intersection 15) AM Peak - M Feranandez and Fernandez Juncos Intersection
Calle Concepción de Gracia (NB) TR A 5.10 11 Calle Fernandez (NB) TR D 43.46 13
Calle Concepción de Gracia (SB) LTR F 244.80 8 Calle Fernandez (SB) LT F 106.38 11
Ave. Fernandez Juncos (WB) TR C 22.08 19 Ave. Fernandez Juncos (EB) LTR B 17.04 16
Intersection B 17.34 19 Ave. Fernandez Juncos (WB)/MT T A 0.00 0
Intersection C 21.81 16
(Intersection 2) AM Peak - Valdes and Del Tren Intersection
(Intersection 16) AM Peak - Ramon Power and Del Tren Intersection
Calle Vales (SB) R A 1.01 4
Ave. Del Tren (EB) N/A / / / Calle Ramon Power (NB) LT B 10.41 2
Ave. Del Tren (WB) TR A 1.84 6 Calle Ramon Power (SB) TR F 615.38 17
Intersection A 1.77 6 Calle Del Tren (EB) N/A / / /
Calle Del Tren (WB) LTR A 5.39 13
(Intersection 3) AM Peak - Marina Access and Fernandez Juncos Intersection Intersection B 13.98 17
(Intersection 17) AM Peak - Ramon Power and Fernandez Juncos Intersection
Marina Access (NB) R A 5.94 11
Ave. Fernandez Juncos (EB) TR A 0.05 -
Ave. Fernandez Juncos (WB)/MT T A 0.00 - Calle Ramon Power (NB) TR A 0.00 5
Intersection A 1.53 11 Calle Ramon Power (SB) LT A 8.32 11
Ave. Fernandez Juncos (EB) LTR C 23.86 16
(Intersection 4) AM Peak - San Andres and Del Tren Intersection Ave. Fernandez Juncos (WB)/MT T A 0.00 0
Intersection C 22.25 16
Calle San Andres (NB) N/A / / / (Intersection 18) AM Peak - Calle 3 and Del Tren IntersectionCalle San Andres (SB) TR C 21.53 5
Calle Del Tren (EB) N/A / / /
Calle Del Tren (WB) LTR A 0.76 5 Calle 3 (NB) L F 127.73 15
Intersection A 1.74 5 Calle Del Tren (EB) N/A / / /
Calle Del Tren (WB) LT A 4.58 9
(Intersection 5A) AM Peak - San Andres and Fernandez Jucnos Intersection Intersection A 8.80 15
(Intersection 19) AM Peak - Calle 3 and Fernandez Juncos IntersectionCalle San Andres (NB) N/A / / /
Calle San Andres (SB) LT A 0.00 13
Ave. Fernandez Juncos (EB) T A 0.00 12 Calle 3 (NB) TR A 7.47 13
Ave. Fernandez Juncos (WB)/MT T A 0.00 0 Calle 3 (SB) LT B 14.02 13
Intersection A 0.00 13 Ave. Fernandez Juncos (EB) LTR B 14.31 16
Ave. Fernandez Juncos (WB)/MT T A 0.00 0
(Intersection 6) AM Peak - Pelayo and Del Tren Intersection Intersection B 13.95 16
(Intersection 21) AM Peak - Calle 5 and Fernandez Juncos/Del Tren IntersectionCalle Pelayo (NB) LT C 23.11 8
Calle Pelayo (SB) TR C 22.13 9
Calle Del Tren (EB) N/A / / / Calle 5 (SB) LT D 42.94 13
Calle Del Tren (WB) LTR A 0.57 3 Ave. Fernandez Juncos (EB) T A 5.21 9
Intersection A 2.69 9 Ave. Fernandez Juncos (WB)/MT T A 8.10 25
Intersection B 15.10 25
(Intersection 7) AM Peak - Pelayo and Fernandez Juncos Intersection
(Intersection 22) AM Peak - Padre Hoff Fernandez Juncos Intersection
Calle Pelayo (NB) TR A 9.55 17
Calle Pelayo (SB) LT B 19.78 18 Calle Padre Hoff (NB) TR A 0.00 9
Ave. Fernandez Juncos (EB) LTR A 2.10 8 Ave. Fernandez Juncos (EB) LT A 5.29 7
Ave. Fernandez Juncos (WB)/MT T A 0.00 0 Ave. Fernandez Juncos (WB)/MT T A 0.00 0
Intersection A 4.33 18 Intersection A 4.80 9
(Intersection 8) AM Peak - Tadeo Rivera and Del Tren Intersection (Intersection 23) AM Peak - SJW Access A and Fernandez Juncos Intersection
Calle Tadeo Rivera (NB) Ave. Fernandez Juncos (EB) TR A 0.05 14
Calle Tadeo Rivera (SB) R A 1.56 2 Ave. Fernandez Juncos (WB)/MT T A 0.00 0
Calle Del Tren (EB) N/A / / / Intersection A 0.05 14
Calle Del Tren (WB) TR A 1.33 3
Intersection A 1.35 4 (Intersection 24) AM Peak - SJW Access B and Fernandez Juncos Intersection
(Intersection 9) AM Peak - Tadeo Rivera and Fernandez Juncos IntersectionAve. Fernandez Juncos (EB) TR A 2.88 9
Ave. Fernandez Juncos (WB)/MT T A 0.00 0
Calle Tadeo Rivera (NB) Intersection A 2.88 9
Calle Tadeo Rivera (SB)
Ave. Fernandez Juncos (EB) T A 0.06 11 (Intersection 25) AM Peak - SJW Access C and Fernandez Juncos IntersectionAve. Fernandez Juncos (WB)/MT T A 0.00 0
Intersection A 0.06 11
Ave. Fernandez Juncos (EB) TR B 13.13 16
(Intersection 10) AM Peak - Matias Ledesma and Del Tren Intersection Ave. Fernandez Juncos (WB)/MT T A 0.00 0
Intersection B 13.13 16
Calle Matias Ledesma (NB) LT B 16.77 6 (Intersection 26) AM Peak - SJW Access D and Fernandez Juncos IntersectionCalle Matias Ledesma (SB) TR A 9.51 4
Calle Del Tren (EB) N/A / / /
Calle Del Tren (WB) LTR A 8.22 13 Access D (NB) R F 50.11 3
Intersection A 8.54 13 Ave. Fernandez Juncos (EB) T B 10.59 16
Ave. Fernandez Juncos (WB)/MT T A 0.00 0
(Intersection 11) AM Peak - Matias Ledesma and Fernandez Juncos Intersection Intersection B 11.30 16
(Intersection 27) AM Peak - SJW Access E and Fernandez Juncos IntersectionCalle Matias Ledesma (NB) TR A 0.00 12
Calle Matias Ledesma (SB) LT C 23.85 15
Ave. Fernandez Juncos (EB) LTR A 2.78 9 Access E (NB) R D 29.21 2
Ave. Fernandez Juncos (WB)/MT T A 0.00 0 Ave. Fernandez Juncos (EB) T A 4.51 21
Intersection A 3.68 15 Ave. Fernandez Juncos (WB)/MT T A 0.00 0
Intersection A 4.67 21
(Intersection 12) AM Peak - San Juan Bautista and Del Tren Intersection
(Intersection 28) AM Peak - SJW Access F and Fernandez Juncos Intersection
Calle San Juan Bautista (NB) LT F 71.57 6
Calle San Juan Bautista (SB) TR E 49.85 9 Access E (NB) R A 1.12 2
Calle Del Tren (EB) N/A / / / Ave. Fernandez Juncos (EB) TR A 5.88 10
Calle Del Tren (WB) LTR A 5.44 20 Ave. Fernandez Juncos (WB)/MT T A 0.00 0
Intersection A 7.33 20 Intersection A 5.43 10
(Intersection 13) AM Peak - San Juan Bautista and Fernandez Juncos Intersection
Calle San Juan Bautista (NB) TR C 25.16 13
Calle San Juan Bautista (SB) LT B 16.72 15
Ave. Fernandez Juncos (EB) LTR A 4.55 9
Ave. Fernandez Juncos (WB)/MT T A 0.00 0
Intersection A 7.23 15
(Intersection 14) AM Peak - M. Fernandez and Del Tren Intersection
Calle Fernandez (NB) LT F 390.71 16
Calle Fernandez (SB) TR F 183.26 8
Calle Del Tren (EB) N/A / / /
Calle Del Tren (WB) LTR A 2.50 5
Intersection B 15.25 16
Level of Service (LOS)
Delay (sec/veh)
Queue Length (no. of veh)
2025Proposed Action Alt2
Year Scenario Access Movement
Level of Service (LOS)
Delay (sec/veh)
Queue Length (no. of veh)
2025Proposed Action Alt2
Year Scenario Access Movement
Level of Service (LOS)
Delay (sec/veh)
Queue Length (no. of veh)
2025Proposed Action Alt2
Year Scenario Access Movement
Level of Service (LOS)
Delay (sec/veh)
Queue Length (no. of veh)
2025Proposed Action Alt2
Year Scenario Access Movement
Level of Service (LOS)
Delay (sec/veh)
Queue Length (no. of veh)
2025Proposed Action Alt2
Year Scenario Access Movement
Level of Service (LOS)
Delay (sec/veh)
Queue Length (no. of veh)
2025Proposed Action Alt2
Year Scenario Access Movement
Level of Service (LOS)
Delay (sec/veh)
Queue Length (no. of veh)
2025Proposed Action Alt2
Year Scenario Access Movement
2025Proposed Action Alt2
Peddestrian Only
Year Scenario Access MovementLevel of
Service (LOS)Delay
(sec/veh) Queue Length
(no. of veh)
Level of Service (LOS)
Delay (sec/veh)
Queue Length (no. of veh)
Year Scenario Access Movement
Level of Service (LOS)
2025Proposed Action Alt2
Peddestrian Only
Peddestrian Only
Delay (sec/veh)
Queue Length (no. of veh)
Access Movement
2025Proposed Action Alt2
Year Scenario
Level of Service (LOS)
Delay (sec/veh)
Queue Length (no. of veh)
2025Proposed Action Alt2
Year Scenario Access Movement
Level of Service (LOS)
Delay (sec/veh)
Queue Length (no. of veh)
2025Proposed Action Alt2
Year Scenario Access Movement
Level of Service (LOS)
Delay (sec/veh)
Queue Length (no. of veh)
2025Proposed Action Alt2
Year Scenario Access Movement
Level of Service (LOS)
Delay (sec/veh)
Queue Length (no. of veh)
2025Proposed Action Alt2
Year Scenario Access Movement
Level of Service (LOS)
Delay (sec/veh)
Queue Length (no. of veh)
2025Proposed Action Alt2
Year Scenario Access Movement
Level of Service (LOS)
Delay (sec/veh)
Queue Length (no. of veh)
2025Proposed Action Alt2
Year Scenario Access Movement
Level of Service (LOS)
Delay (sec/veh)
Queue Length (no. of veh)
2025Proposed Action Alt2
Year Scenario Access Movement
Level of Service (LOS)
Delay (sec/veh)
Queue Length (no. of veh)
2025Proposed Action Alt2
Year Scenario Access Movement
Level of Service (LOS)
Delay (sec/veh)
Queue Length (no. of veh)
2025Proposed Action Alt2
Year Scenario Access Movement
Level of Service (LOS)
Delay (sec/veh)
Queue Length (no. of veh)
2025Proposed Action Alt2
Year Scenario Access Movement
Level of Service (LOS)
Delay (sec/veh)
Queue Length (no. of veh)
2025Proposed Action Alt2
Year Scenario Access Movement
Level of Service (LOS)
Delay (sec/veh)
Queue Length (no. of veh)
2025Proposed Action Alt2
Year Scenario Access Movement
Level of Service (LOS)
Delay (sec/veh)
Queue Length (no. of veh)
2025Proposed Action Alt2
Year Scenario Access Movement
Level of Service (LOS)
Delay (sec/veh)
Queue Length (no. of veh)
2025Proposed Action Alt2
Year Scenario Access Movement
Level of Service (LOS)
Delay (sec/veh)
Queue Length (no. of veh)
2025Proposed Action Alt2
Year Scenario Access Movement
Level of Service (LOS)
Delay (sec/veh)
Queue Length (no. of veh)
2025Proposed Action Alt2
Year Scenario Access Movement
Level of Service (LOS)
Delay (sec/veh)
Queue Length (no. of veh)
2025Proposed Action Alt2
Year Scenario Access Movement

P:\Projects\220022~1\01\Work\SJW\Output\Report\San Juan Waterfront Masterplan Transport Assessment_5-review.doc
102
FIGURE 7.6 PM RESULTS; PA_ALT2 MODEL
(Intersection 1) PM Peak - Gilberto Concepcion de Gracia and Fernandez Juncos Intersection (Intersection 15) PM Peak - M Feranandez and Fernandez Juncos Intersection
Calle Concepción de Gracia (NB) TR C 29.63 71 Calle Fernandez (NB) TR E 78.40 18
Calle Concepción de Gracia (SB) LTR F 129.51 12 Calle Fernandez (SB) LT E 59.43 18
Ave. Fernandez Juncos (WB) TR D 39.68 70 Ave. Fernandez Juncos (EB) LTR B 16.18 51
Intersection C 34.29 71 Ave. Fernandez Juncos (WB)/MT T A 0.00 0
Intersection C 20.94 51
(Intersection 2) PM Peak - Valdes and Del Tren Intersection
(Intersection 16) PM Peak - RPMon Power and Del Tren Intersection
Calle Vales (SB) R A 0.11 -
Ave. Del Tren (EB) / / / Calle Ramon Power (NB) LT D 47.74 3
Ave. Del Tren (WB) TR A 1.25 12 Calle Ramon Power (SB) TR F 192.29 10
Intersection A 1.00 12 Calle Del Tren (EB) N/A / / /
Calle Del Tren (WB) LTR A 8.06 58
(Intersection 3) PM Peak - Marina Access and Fernandez Juncos Intersection Intersection B 10.30 58
(Intersection 17) PM Peak - RPMon Power and Fernandez Juncos Intersection
Marina Access (NB) R C 16.12 -
Ave. Fernandez Juncos (EB) TR A 5.62 -
Ave. Fernandez Juncos (WB)/MT T A 0.00 - Calle Ramon Power (NB) TR C 20.82 3
Intersection A 6.37 - Calle Ramon Power (SB) LT F 117.43 10
Ave. Fernandez Juncos (EB) LTR B 18.40 65
(Intersection 4) PM Peak - San Andres and Del Tren Intersection Ave. Fernandez Juncos (WB)/MT T A 0.00 0
Intersection C 20.53 65
Calle San Andres (NB) N/A / / / (Intersection 18) PM Peak - Calle 3 and Del Tren IntersectionCalle San Andres (SB) TR D 50.48 14
Calle Del Tren (EB) N/A / / /
Calle Del Tren (WB) LTR A 2.28 39 Calle 3 (NB) L F 52.62 13
Intersection A 4.27 39 Calle Del Tren (EB) N/A / / /
Calle Del Tren (WB) LT A 6.33 58
(Intersection 5A) PM Peak - San Andres and Fernandez Jucnos Intersection Intersection A 8.21 58
(Intersection 19) PM Peak - Calle 3 and Fernandez Juncos IntersectionCalle San Andres (NB) N/A / / /
Calle San Andres (SB) LT B 11.68 19
Ave. Fernandez Juncos (EB) T C 23.00 92 Calle 3 (NB) TR A 5.61 5
Ave. Fernandez Juncos (WB)/MT T A 0.00 0 Calle 3 (SB) LT B 18.95 13
Intersection C 22.35 92 Ave. Fernandez Juncos (EB) LTR B 14.30 42
Ave. Fernandez Juncos (WB)/MT T A 0.00 0
(Intersection 6) PM Peak - Pelayo and Del Tren Intersection Intersection B 14.61 42
(Intersection 21) PM Peak - Calle 5 and Fernandez Juncos/Del Tren IntersectionCalle Pelayo (NB) LT C 21.47 12
Calle Pelayo (SB) TR D 33.67 14
Calle Del Tren (EB) N/A / / / Calle 5 (SB) LT C 33.68 96
Calle Del Tren (WB) LTR A 3.25 30 Ave. Fernandez Juncos (EB) T A 9.38 37
Intersection A 6.68 30 Ave. Fernandez Juncos (WB)/MT T A 9.26 47
Intersection B 15.71 96
(Intersection 7) PM Peak - Pelayo and Fernandez Juncos Intersection
(Intersection 22) PM Peak - Padre Hoff Fernandez Juncos Intersection
Calle Pelayo (NB) TR A 4.88 0
Calle Pelayo (SB) LT B 13.39 0 Calle Padre Hoff (NB) TR A 0.12 17
Ave. Fernandez Juncos (EB) LTR B 16.81 0 Ave. Fernandez Juncos (EB) LT B 18.25 51
Ave. Fernandez Juncos (WB)/MT T A 0.00 0 Ave. Fernandez Juncos (WB)/MT T A 0.00 0
Intersection B 15.96 0 Intersection B 16.08 51
(Intersection 8) PM Peak - Tadeo Rivera and Del Tren Intersection (Intersection 23) PM Peak - SJW Access A and Fernandez Juncos Intersection
Calle Tadeo Rivera (NB) Ave. Fernandez Juncos (EB) TR A 6.98 32
Calle Tadeo Rivera (SB) R A 5.47 7 Ave. Fernandez Juncos (WB)/MT T A 0.00 0
Calle Del Tren (EB) N/A / / / Intersection A 6.98 32
Calle Del Tren (WB) TR A 0.39 0
Intersection A 2.25 8 (Intersection 24) PM Peak - SJW Access B and Fernandez Juncos Intersection
(Intersection 9) PM Peak - Tadeo Rivera and Fernandez Juncos IntersectionAve. Fernandez Juncos (EB) TR A 8.78 28
Ave. Fernandez Juncos (WB)/MT T A 0.00 0
Calle Tadeo Rivera (NB) Intersection A 8.78 28
Calle Tadeo Rivera (SB)
Ave. Fernandez Juncos (EB) T A 5.77 34 (Intersection 25) PM Peak - SJW Access C and Fernandez Juncos IntersectionAve. Fernandez Juncos (WB)/MT T A 0.00 0
Intersection A 5.77 34
Ave. Fernandez Juncos (EB) TR B 13.86 31
(Intersection 10) PM Peak - Matias Ledesma and Del Tren Intersection Ave. Fernandez Juncos (WB)/MT T A 0.00 0
Intersection B 13.86 31
Calle Matias Ledesma (NB) LT D 41.87 10 (Intersection 26) PM Peak - SJW Access D and Fernandez Juncos IntersectionCalle Matias Ledesma (SB) TR B 16.32 14
Calle Del Tren (EB) N/A / / /
Calle Del Tren (WB) LTR A 4.54 0 Access D (NB) R E 44.85 3
Intersection A 6.85 14 Ave. Fernandez Juncos (EB) T B 10.20 30
Ave. Fernandez Juncos (WB)/MT T A 0.00 0
(Intersection 11) PM Peak - Matias Ledesma and Fernandez Juncos Intersection Intersection B 10.55 30
(Intersection 27) PM Peak - SJW Access E and Fernandez Juncos IntersectionCalle Matias Ledesma (NB) TR B 16.93 11
Calle Matias Ledesma (SB) LT D 39.55 22
Ave. Fernandez Juncos (EB) LTR B 11.02 38 Access E (NB) R E 37.94 0
Ave. Fernandez Juncos (WB)/MT T A 0.00 0 Ave. Fernandez Juncos (EB) T A 3.33 38
Intersection B 13.40 38 Ave. Fernandez Juncos (WB)/MT T A 0.00 0
Intersection A 3.43 38
(Intersection 12) PM Peak - San Juan Bautista and Del Tren Intersection
(Intersection 28) PM Peak - SJW Access F and Fernandez Juncos Intersection
Calle San Juan Bautista (NB) LT C 18.43 6
Calle San Juan Bautista (SB) TR F 51.35 11 Access E (NB) R A 0.89 0
Calle Del Tren (EB) N/A / / / Ave. Fernandez Juncos (EB) TR A 3.91 0
Calle Del Tren (WB) LTR A 2.90 26 Ave. Fernandez Juncos (WB)/MT T A 0.00 0
Intersection A 6.96 26 Intersection A 3.79 0
(Intersection 13) PM Peak - San Juan Bautista and Fernandez Juncos Intersection
Calle San Juan Bautista (NB) TR D 37.62 13
Calle San Juan Bautista (SB) LT E 64.03 22
Ave. Fernandez Juncos (EB) LTR A 9.89 37
Ave. Fernandez Juncos (WB)/MT T A 0.00 0
Intersection B 15.44 37
(Intersection 14) PM Peak - M. Fernandez and Del Tren Intersection
Calle Fernandez (NB) LT A 0.00 27
Calle Fernandez (SB) TR D 38.32 11
Calle Del Tren (EB) N/A / / /
Calle Del Tren (WB) LTR A 1.04 32
Intersection A 2.59 32
Level of Service (LOS)
Delay (sec/veh)
Queue Length (no. of veh)
2025Proposed Action Alt2
Year Scenario Access Movement
Level of Service (LOS)
Delay (sec/veh)
Queue Length (no. of veh)
2025Proposed Action Alt2
Year Scenario Access Movement
Level of Service (LOS)
Delay (sec/veh)
Queue Length (no. of veh)
2025Proposed Action Alt2
Year Scenario Access Movement
Level of Service (LOS)
Delay (sec/veh)
Queue Length (no. of veh)
2025Proposed Action Alt2
Year Scenario Access Movement
Level of Service (LOS)
Delay (sec/veh)
Queue Length (no. of veh)
2025Proposed Action Alt2
Year Scenario Access Movement
Level of Service (LOS)
Delay (sec/veh)
Queue Length (no. of veh)
2025Proposed Action Alt2
Year Scenario Access Movement
Level of Service (LOS)
Delay (sec/veh)
Queue Length (no. of veh)
2025Proposed Action Alt2
Year Scenario Access Movement
2025Proposed Action Alt2
Peddestrian Only
Year Scenario Access MovementLevel of
Service (LOS)Delay
(sec/veh) Queue Length
(no. of veh)
Level of Service (LOS)
Delay (sec/veh)
Queue Length (no. of veh)
Year Scenario Access Movement
Level of Service (LOS)
2025Proposed Action Alt2
Peddestrian Only
Peddestrian Only
Delay (sec/veh)
Queue Length (no. of veh)
Access Movement
2025Proposed Action Alt2
Year Scenario
Level of Service (LOS)
Delay (sec/veh)
Queue Length (no. of veh)
2025Proposed Action Alt2
Year Scenario Access Movement
Level of Service (LOS)
Delay (sec/veh)
Queue Length (no. of veh)
2025Proposed Action Alt2
Year Scenario Access Movement
Level of Service (LOS)
Delay (sec/veh)
Queue Length (no. of veh)
2025Proposed Action Alt2
Year Scenario Access Movement
Level of Service (LOS)
Delay (sec/veh)
Queue Length (no. of veh)
2025Proposed Action Alt2
Year Scenario Access Movement
Level of Service (LOS)
Delay (sec/veh)
Queue Length (no. of veh)
2025Proposed Action Alt2
Year Scenario Access Movement
Level of Service (LOS)
Delay (sec/veh)
Queue Length (no. of veh)
2025Proposed Action Alt2
Year Scenario Access Movement
Level of Service (LOS)
Delay (sec/veh)
Queue Length (no. of veh)
2025Proposed Action Alt2
Year Scenario Access Movement
Level of Service (LOS)
Delay (sec/veh)
Queue Length (no. of veh)
2025Proposed Action Alt2
Year Scenario Access Movement
Level of Service (LOS)
Delay (sec/veh)
Queue Length (no. of veh)
2025Proposed Action Alt2
Year Scenario Access Movement
Level of Service (LOS)
Delay (sec/veh)
Queue Length (no. of veh)
2025Proposed Action Alt2
Year Scenario Access Movement
Level of Service (LOS)
Delay (sec/veh)
Queue Length (no. of veh)
2025Proposed Action Alt2
Year Scenario Access Movement
Level of Service (LOS)
Delay (sec/veh)
Queue Length (no. of veh)
2025Proposed Action Alt2
Year Scenario Access Movement
Level of Service (LOS)
Delay (sec/veh)
Queue Length (no. of veh)
2025Proposed Action Alt2
Year Scenario Access Movement
Level of Service (LOS)
Delay (sec/veh)
Queue Length (no. of veh)
2025Proposed Action Alt2
Year Scenario Access Movement
Level of Service (LOS)
Delay (sec/veh)
Queue Length (no. of veh)
2025Proposed Action Alt2
Year Scenario Access Movement
Level of Service (LOS)
Delay (sec/veh)
Queue Length (no. of veh)
2025Proposed Action Alt2
Year Scenario Access Movement
Level of Service (LOS)
Delay (sec/veh)
Queue Length (no. of veh)
2025Proposed Action Alt2
Year Scenario Access Movement

P:\Projects\220022~1\01\Work\SJW\Output\Report\San Juan Waterfront Masterplan Transport Assessment_5-review.doc
103
Modified No Action-Alternative 3
7.9 Figure 7.7 and Figure 7.8 and show the results for the AM and PM MNA_Alt 3 year 2025 models for the intersections with Fernández Juncos Ave. and Del Tren Street.
7.10 Table 7.5 includes the travel times recorded for Fernández Juncos Ave and Del Tren Street for the MNA_Alt 3 model.
TABLE 7.5 TRAVEL TIMES ALONG FERNÁNDEZ JUNCOS AND DEL TREN STREET; MNA_ALT 3 MODEL
AM PM Journey
Time (sec)
Delay (sec/veh)
Journey Time (sec)
Delay (sec/veh)
Del Tren St. Eastbound (from G. Concepción de Gracia St. to Calle 5)
N/A N/A N/A N/A
Del Tren St. Westbound (from Calle 5 to G. Concepción de Gracia St.)
216 54.1 246 86.8
Fernández Juncos Avenue Eastbound (from G. Concepción de Gracia St. to Calle 5)
287 136.9 489 340.4
Fernández Juncos Avenue Westbound (from Calle 5 to G. Concepción de Gracia St.)/MT
TRAM
MT-Mass Transit corridor
No Action-Alternative 4
7.11 Figure 7.9 and Figure 7.10and show the results for the AM and PM NA_Alt4 year 2025 models for the intersections with Fernández Juncos Ave. and Del Tren Street.
7.12 The travel times recorded for this option along Fernández Juncos Ave and Del Tren Street are shown in Table 7.6.
TABLE 7.6 TRAVEL TIMES ALONG FERNÁNDEZ JUNCOS AND DEL TREN STREET; NA_ALT 4 MODEL
AM PM
Journey Time(sec)
Delay (sec/veh)
Journey Time (sec)
Delay (sec/veh)
Del Tren St. Eastbound (from G. Concepción de Gracia St. to Calle 5)
N/A N/A N/A N/A
Del Tren St. Westbound (from Calle 5 to G. Concepción de Gracia St.)
131 0.0 118 0.0
Fernández Juncos Avenue Eastbound (from G. Concepción de Gracia St. to Calle 5)
132 9.6 169 42.5
Fernández Juncos Avenue Westbound (from Calle 5 to G. Concepción de Gracia St.)/MT
TRAM
MT-Mass Transit corridor

P:\Projects\220022~1\01\Work\SJW\Output\Report\San Juan Waterfront Masterplan Transport Assessment_5-review.doc
104
FIGURE 7.7 AM RESULTS; MNA_ALT 3 MODEL
(Intersection 1) AM Peak - Gilberto Concepcion de Gracia and Fernandez Juncos Intersection (Intersection 15) AM Peak - M Feranandez and Fernandez Juncos Intersection
Calle Concepción de Gracia (NB) TR A 5.10 11 Calle Fernandez (NB) TR D 43.46 13
Calle Concepción de Gracia (SB) LTR F 244.80 8 Calle Fernandez (SB) LT F 106.38 11
Ave. Fernandez Juncos (WB) TR C 22.08 19 Ave. Fernandez Juncos (EB) LTR B 17.04 16
Intersection B 17.34 19 Ave. Fernandez Juncos (WB)/MT T A 0.00 0
Intersection C 21.81 16
(Intersection 2) AM Peak - Valdes and Del Tren Intersection(Intersection 16) AM Peak - Ramon Power and Del Tren Intersection
Calle Vales (SB) R A 1.01 4
Ave. Del Tren (EB) N/A / / / Calle Ramon Power (NB) LT B 10.41 2
Ave. Del Tren (WB) TR A 1.84 6 Calle Ramon Power (SB) TR F 615.38 17
Intersection A 1.77 6 Calle Del Tren (EB) N/A / / /
Calle Del Tren (WB) LTR A 5.39 13
(Intersection 3) AM Peak - Marina Access and Fernandez Juncos Intersection Intersection B 13.98 17
(Intersection 17) AM Peak - Ramon Power and Fernandez Juncos Intersection
Marina Access (NB) R A 5.94 11
Ave. Fernandez Juncos (EB) TR A 0.05 -
Ave. Fernandez Juncos (WB)/MT T A 0.00 - Calle Ramon Power (NB) TR A 0.00 5
Intersection A 1.53 11 Calle Ramon Power (SB) LT A 8.32 11
Ave. Fernandez Juncos (EB) LTR C 23.86 16
(Intersection 4) AM Peak - San Andres and Del Tren Intersection Ave. Fernandez Juncos (WB)/MT T A 0.00 0
Intersection C 22.25 16
Calle San Andres (NB) N/A / / / (Intersection 18) AM Peak - Calle 3 and Del Tren IntersectionCalle San Andres (SB) TR C 21.53 5
Calle Del Tren (EB) N/A / / /
Calle Del Tren (WB) LTR A 0.76 5 Calle 3 (NB) L F 127.73 15
Intersection A 1.74 5 Calle Del Tren (EB) N/A / / /
Calle Del Tren (WB) LT A 4.58 9
(Intersection 5A) AM Peak - San Andres and Fernandez Jucnos Intersection Intersection A 8.80 15
(Intersection 19) AM Peak - Calle 3 and Fernandez Juncos IntersectionCalle San Andres (NB) N/A / / /
Calle San Andres (SB) LT A 0.00 13
Ave. Fernandez Juncos (EB) T A 0.00 12 Calle 3 (NB) TR A 7.47 13
Ave. Fernandez Juncos (WB)/MT T A 0.00 0 Calle 3 (SB) LT B 14.02 13
Intersection A 0.00 13 Ave. Fernandez Juncos (EB) LTR B 14.31 16
Ave. Fernandez Juncos (WB)/MT T A 0.00 0
(Intersection 6) AM Peak - Pelayo and Del Tren Intersection Intersection B 13.95 16
(Intersection 21) AM Peak - Calle 5 and Fernandez Juncos/Del Tren IntersectionCalle Pelayo (NB) LT C 23.11 8
Calle Pelayo (SB) TR C 22.13 9
Calle Del Tren (EB) N/A / / / Calle 5 (SB) LT D 42.94 13
Calle Del Tren (WB) LTR A 0.57 3 Ave. Fernandez Juncos (EB) T A 5.21 9
Intersection A 2.69 9 Ave. Fernandez Juncos (WB)/MT T A 8.10 25
Intersection B 15.10 25
(Intersection 7) AM Peak - Pelayo and Fernandez Juncos Intersection
(Intersection 22) AM Peak - Padre Hoff Fernandez Juncos Intersection
Calle Pelayo (NB) TR A 9.55 17
Calle Pelayo (SB) LT B 19.78 18 Calle Padre Hoff (NB) TR A 0.00 9
Ave. Fernandez Juncos (EB) LTR A 2.10 8 Ave. Fernandez Juncos (EB) LT A 5.29 7
Ave. Fernandez Juncos (WB)/MT T A 0.00 0 Ave. Fernandez Juncos (WB)/MT T A 0.00 0
Intersection A 4.33 18 Intersection A 4.80 9
(Intersection 8) AM Peak - Tadeo Rivera and Del Tren Intersection (Intersection 23) AM Peak - SJW Access A and Fernandez Juncos Intersection
Calle Tadeo Rivera (NB) Ave. Fernandez Juncos (EB) TR A 0.05 14
Calle Tadeo Rivera (SB) R A 1.56 2 Ave. Fernandez Juncos (WB)/MT T A 0.00 0
Calle Del Tren (EB) N/A / / / Intersection A 0.05 14
Calle Del Tren (WB) TR A 1.33 3
Intersection A 1.35 4 (Intersection 24) AM Peak - SJW Access B and Fernandez Juncos Intersection
(Intersection 9) AM Peak - Tadeo Rivera and Fernandez Juncos IntersectionAve. Fernandez Juncos (EB) TR A 2.88 9
Ave. Fernandez Juncos (WB)/MT T A 0.00 0
Calle Tadeo Rivera (NB) Intersection A 2.88 9
Calle Tadeo Rivera (SB)
Ave. Fernandez Juncos (EB) T A 0.06 11 (Intersection 25) AM Peak - SJW Access C and Fernandez Juncos IntersectionAve. Fernandez Juncos (WB)/MT T A 0.00 0
Intersection A 0.06 11
Ave. Fernandez Juncos (EB) TR B 13.13 16
(Intersection 10) AM Peak - Matias Ledesma and Del Tren Intersection Ave. Fernandez Juncos (WB)/MT T A 0.00 0
Intersection B 13.13 16
Calle Matias Ledesma (NB) LT B 16.77 6 (Intersection 26) AM Peak - SJW Access D and Fernandez Juncos IntersectionCalle Matias Ledesma (SB) TR A 9.51 4
Calle Del Tren (EB) N/A / / /
Calle Del Tren (WB) LTR A 8.22 13 Access D (NB) R F 50.11 3
Intersection A 8.54 13 Ave. Fernandez Juncos (EB) T B 10.59 16
Ave. Fernandez Juncos (WB)/MT T A 0.00 0
(Intersection 11) AM Peak - Matias Ledesma and Fernandez Juncos Intersection Intersection B 11.30 16
(Intersection 27) AM Peak - SJW Access E and Fernandez Juncos IntersectionCalle Matias Ledesma (NB) TR A 0.00 12
Calle Matias Ledesma (SB) LT C 23.85 15
Ave. Fernandez Juncos (EB) LTR A 2.78 9 Access E (NB) R D 29.21 2
Ave. Fernandez Juncos (WB)/MT T A 0.00 0 Ave. Fernandez Juncos (EB) T A 4.51 21
Intersection A 3.68 15 Ave. Fernandez Juncos (WB)/MT T A 0.00 0
Intersection A 4.67 21
(Intersection 12) AM Peak - San Juan Bautista and Del Tren Intersection
(Intersection 28) AM Peak - SJW Access F and Fernandez Juncos Intersection
Calle San Juan Bautista (NB) LT F 71.57 6
Calle San Juan Bautista (SB) TR E 49.85 9 Access E (NB) R A 1.12 2
Calle Del Tren (EB) N/A / / / Ave. Fernandez Juncos (EB) TR A 5.88 10
Calle Del Tren (WB) LTR A 5.44 20 Ave. Fernandez Juncos (WB)/MT T A 0.00 0
Intersection A 7.33 20 Intersection A 5.43 10
(Intersection 13) AM Peak - San Juan Bautista and Fernandez Juncos Intersection
Calle San Juan Bautista (NB) TR C 25.16 13
Calle San Juan Bautista (SB) LT B 16.72 15
Ave. Fernandez Juncos (EB) LTR A 4.55 9
Ave. Fernandez Juncos (WB)/MT T A 0.00 0
Intersection A 7.23 15
(Intersection 14) AM Peak - M. Fernandez and Del Tren Intersection
Calle Fernandez (NB) LT F 390.71 16
Calle Fernandez (SB) TR F 183.26 8
Calle Del Tren (EB) N/A / / /
Calle Del Tren (WB) LTR A 2.50 5
Intersection B 15.25 16
Level of Service (LOS)
Delay (sec/veh)
Queue Length (no. of veh)
2025Proposed Action Alt2
Year Scenario Access Movement
Level of Service (LOS)
Delay (sec/veh)
Queue Length (no. of veh)
2025Proposed Action Alt2
Year Scenario Access Movement
Level of Service (LOS)
Delay (sec/veh)
Queue Length (no. of veh)
2025Proposed Action Alt2
Year Scenario Access Movement
Level of Service (LOS)
Delay (sec/veh)
Queue Length (no. of veh)
2025Proposed Action Alt2
Year Scenario Access Movement
Level of Service (LOS)
Delay (sec/veh)
Queue Length (no. of veh)
2025Proposed Action Alt2
Year Scenario Access Movement
Level of Service (LOS)
Delay (sec/veh)
Queue Length (no. of veh)
2025Proposed Action Alt2
Year Scenario Access Movement
Level of Service (LOS)
Delay (sec/veh)
Queue Length (no. of veh)
2025Proposed Action Alt2
Year Scenario Access Movement
2025Proposed Action Alt2
Peddestrian Only
Year Scenario Access MovementLevel of
Service (LOS)Delay
(sec/veh) Queue Length
(no. of veh)
Level of Service (LOS)
Delay (sec/veh)
Queue Length (no. of veh)
Year Scenario Access Movement
Level of Service (LOS)
2025Proposed Action Alt2
Peddestrian Only
Peddestrian Only
Delay (sec/veh)
Queue Length (no. of veh)
Access Movement
2025Proposed Action Alt2
Year Scenario
Level of Service (LOS)
Delay (sec/veh)
Queue Length (no. of veh)
2025Proposed Action Alt2
Year Scenario Access Movement
Level of Service (LOS)
Delay (sec/veh)
Queue Length (no. of veh)
2025Proposed Action Alt2
Year Scenario Access Movement
Level of Service (LOS)
Delay (sec/veh)
Queue Length (no. of veh)
2025Proposed Action Alt2
Year Scenario Access Movement
Level of Service (LOS)
Delay (sec/veh)
Queue Length (no. of veh)
2025Proposed Action Alt2
Year Scenario Access Movement
Level of Service (LOS)
Delay (sec/veh)
Queue Length (no. of veh)
2025Proposed Action Alt2
Year Scenario Access Movement
Level of Service (LOS)
Delay (sec/veh)
Queue Length (no. of veh)
2025Proposed Action Alt2
Year Scenario Access Movement
Level of Service (LOS)
Delay (sec/veh)
Queue Length (no. of veh)
2025Proposed Action Alt2
Year Scenario Access Movement
Level of Service (LOS)
Delay (sec/veh)
Queue Length (no. of veh)
2025Proposed Action Alt2
Year Scenario Access Movement
Level of Service (LOS)
Delay (sec/veh)
Queue Length (no. of veh)
2025Proposed Action Alt2
Year Scenario Access Movement
Level of Service (LOS)
Delay (sec/veh)
Queue Length (no. of veh)
2025Proposed Action Alt2
Year Scenario Access Movement
Level of Service (LOS)
Delay (sec/veh)
Queue Length (no. of veh)
2025Proposed Action Alt2
Year Scenario Access Movement
Level of Service (LOS)
Delay (sec/veh)
Queue Length (no. of veh)
2025Proposed Action Alt2
Year Scenario Access Movement
Level of Service (LOS)
Delay (sec/veh)
Queue Length (no. of veh)
2025Proposed Action Alt2
Year Scenario Access Movement
Level of Service (LOS)
Delay (sec/veh)
Queue Length (no. of veh)
2025Proposed Action Alt2
Year Scenario Access Movement
Level of Service (LOS)
Delay (sec/veh)
Queue Length (no. of veh)
2025Proposed Action Alt2
Year Scenario Access Movement
Level of Service (LOS)
Delay (sec/veh)
Queue Length (no. of veh)
2025Proposed Action Alt2
Year Scenario Access Movement
Level of Service (LOS)
Delay (sec/veh)
Queue Length (no. of veh)
2025Proposed Action Alt2
Year Scenario Access Movement

P:\Projects\220022~1\01\Work\SJW\Output\Report\San Juan Waterfront Masterplan Transport Assessment_5-review.doc
105
FIGURE 7.8 PM RESULTS; MNA_ALT 3 MODEL
(Intersection 1) PM Peak - Gilberto Concepcion de Gracia and Fernandez Juncos Intersection (Intersection 14) PM Peak - M. Fernandez and Del Tren Intersection
Calle Concepción de Gracia (NB) TR E 57.90 75 Calle Fernandez (NB) LT F 132.47 47
Calle Concepción de Gracia (SB) LTR E 55.50 14 Calle Fernandez (SB) TR / / /
Ave. Fernandez Juncos (WB) TR A 0.00 35 Calle Del Tren (EB) N/A / / /
Intersection E 57.89 75 Calle Del Tren (WB) LTR B 14.73 36
Intersection C 26.49 47
(Intersection 2) PM Peak - Valdes and Del Tren Intersection
(Intersection 15) PM Peak - M Feranandez and Fernandez Juncos Intersection
Calle Vales (SB) R B 11.16 8
Ave. Del Tren (EB) N/A / / / Calle Fernandez (NB) TR D 48.47 0
Ave. Del Tren (WB) TR A 0.00 - Calle Fernandez (SB) LT / / /
Intersection A 4.64 8 Ave. Fernandez Juncos (EB) LTR C 28.30 57
Ave. Fernandez Juncos (WB)/MT T A 0.00 0
(Intersection 3) PM Peak - Marina Access and Fernandez Juncos Intersection Intersection C 30.30 57
(Intersection 16) PM Peak - Ramon Power and Del Tren Intersection
Calle Ramon Power (NB) LT A 0.00 2
Intersection Calle Ramon Power (SB) TR F 699.56 18
Calle Del Tren (EB) N/A / / /
(Intersection 4) PM Peak - San Andres and Del Tren Intersection Calle Del Tren (WB) LTR C 20.17 64
Intersection C 32.63 64
Calle San Andres (NB) E 66.54 0 (Intersection 17) PM Peak - Ramon Power and Fernandez Juncos IntersectionCalle San Andres (SB) TR F 311.26 23
Calle Del Tren (EB) / / /
Calle Del Tren (WB) LTR E 68.96 52 Calle Ramon Power (NB) TR / / /
Intersection E 77.36 52 Calle Ramon Power (SB) LT F 168.36 14
Ave. Fernandez Juncos (EB) LTR C 22.88 66
(Intersection 5A) PM Peak - San Andres and Fernandez Jucnos Intersection Ave. Fernandez Juncos (WB)/MT T A 0.00 0
Intersection C 28.27 66
Calle San Andres (NB) N/A F 122.62 38 (Intersection 18) PM Peak - Calle 3 and Del Tren IntersectionCalle San Andres (SB) LT D 36.68 17
Ave. Fernandez Juncos (EB) T D 47.65 64
Ave. Fernandez Juncos (WB)/MT T A 0.00 0 Calle 3 (NB) L F 153.45 14
Intersection E 60.73 64 Calle Del Tren (EB) N/A / / /
Calle Del Tren (WB) LT C 18.75 80
(Intersection 6) PM Peak - Pelayo and Del Tren Intersection Intersection D 25.35 80
(Intersection 19) PM Peak - Calle 3 and Fernandez Juncos IntersectionCalle Pelayo (NB) LT / / /
Calle Pelayo (SB) TR C 16.07 2
Calle Del Tren (EB) N/A / / / Calle 3 (NB) TR / / /
Calle Del Tren (WB) LTR D 25.87 28 Calle 3 (SB) LT E 59.52 7
Intersection D 25.70 28 Ave. Fernandez Juncos (EB) LTR C 23.52 48
Ave. Fernandez Juncos (WB)/MT T A 0.00 0
(Intersection 7) PM Peak - Pelayo and Fernandez Juncos Intersection Intersection C 24.57 48
(Intersection 21) PM Peak - Calle 5 and Fernandez Juncos/Del Tren Intersection
Calle 5 (SB) LT D 44.47 102
Ave. Fernandez Juncos (EB) T A 8.34 33
Intersection Ave. Fernandez Juncos (WB)/MT T B 17.26 51
Intersection C 21.78 102
(Intersection 8) PM Peak - Tadeo Rivera and Del Tren Intersection
(Intersection 22) PM Peak - Padre Hoff Fernandez Juncos Intersection
Calle Tadeo Rivera (NB) N/A / / 0
Calle Tadeo Rivera (SB) R B 12.40 0 Calle Padre Hoff (NB) TR / / /
Calle Del Tren (EB) N/A / / / Ave. Fernandez Juncos (EB) LT A 6.92 15
Calle Del Tren (WB) TR A 0.00 0 Ave. Fernandez Juncos (WB)/MT T A 0.00 0
Intersection A 0.47 0 Intersection A 6.92 15
(Intersection 9) PM Peak - Tadeo Rivera and Fernandez Juncos Intersection (Intersection 23) PM Peak - SJW Access A and Fernandez Juncos Intersection
Calle Tadeo Rivera (NB) R F 140.11 0.00 Ave. Fernandez Juncos (EB) TR D 26.76 32
Calle Tadeo Rivera (SB) N/A / / / Ave. Fernandez Juncos (WB)/MT T A 0.00 0
Ave. Fernandez Juncos (EB) TR F 96.39 139.00 Intersection D 26.76 32
Ave. Fernandez Juncos (WB)/MT T A 0.00 0.00
Intersection F 100.76 139.00 (Intersection 24) PM Peak - SJW Access B and Fernandez Juncos Intersection
(Intersection 10) PM Peak - Matias Ledesma and Del Tren IntersectionAve. Fernandez Juncos (EB) TR C 18.30 28
Ave. Fernandez Juncos (WB)/MT T A 0.00 0
Calle Matias Ledesma (NB) LT D 40.71 23 Intersection C 18.30 28
Calle Matias Ledesma (SB) TR F 92.91 13
Calle Del Tren (EB) N/A / / / (Intersection 25) PM Peak - SJW Access C and Fernandez Juncos IntersectionCalle Del Tren (WB) LTR B 17.02 60
Intersection C 25.28 60
Ave. Fernandez Juncos (EB) TR C 15.92 33
(Intersection 11) PM Peak - Matias Ledesma and Fernandez Juncos Intersection Ave. Fernandez Juncos (WB)/MT T A 0.00 0
Intersection C 15.92 33
Calle Matias Ledesma (NB) TR F 91.35 0 (Intersection 26) PM Peak - SJW Access D and Fernandez Juncos IntersectionCalle Matias Ledesma (SB) LT E 59.42 23
Ave. Fernandez Juncos (EB) LTR C 32.46 41
Ave. Fernandez Juncos (WB)/MT T A 0.00 0 Access D (NB) R / / /
Intersection D 41.13 41 Ave. Fernandez Juncos (EB) T A 5.58 32
Ave. Fernandez Juncos (WB)/MT T A 0.00 0
(Intersection 12) PM Peak - San Juan Bautista and Del Tren Intersection Intersection A 5.58 32
(Intersection 27) PM Peak - SJW Access E and Fernandez Juncos IntersectionCalle San Juan Bautista (NB) LT F 163.70 19
Calle San Juan Bautista (SB) TR F 114.77 18
Calle Del Tren (EB) N/A / / / Access E (NB) R / / /
Calle Del Tren (WB) LTR C 16.32 32 Ave. Fernandez Juncos (EB) T A 2.24 42
Intersection D 31.22 32 Ave. Fernandez Juncos (WB)/MT T A 0.00 0
Intersection A 2.24 42
(Intersection 13) PM Peak - San Juan Bautista and Fernandez Juncos Intersection
(Intersection 28) PM Peak - SJW Access F and Fernandez Juncos Intersection
Calle San Juan Bautista (NB) TR D 47.14 0
Calle San Juan Bautista (SB) LT F 90.98 25 Access E (NB) R / / /
Ave. Fernandez Juncos (EB) LTR C 25.45 39 Ave. Fernandez Juncos (EB) TR A 2.94 36
Ave. Fernandez Juncos (WB)/MT T A 0.00 0 Ave. Fernandez Juncos (WB)/MT T A 0.00 0
Intersection D 35.26 39 Intersection A 2.94 36
Level of Service (LOS)
Delay (sec/veh)
Queue Length (no. of veh)
2025Modified No
Action
Year Scenario Access Movement
Level of Service (LOS)
Delay (sec/veh)
Queue Length (no. of veh)
2025Modified No
Action
Year Scenario Access Movement
Level of Service (LOS)
Delay (sec/veh)
Queue Length (no. of veh)
2025Modified No
Action
Year Scenario Access Movement
Level of Service (LOS)
Delay (sec/veh)
Queue Length (no. of veh)
2025Modified No
Action
Year Scenario Access Movement
Level of Service (LOS)
Delay (sec/veh)
Queue Length (no. of veh)
2025Modified No
Action
Year Scenario Access Movement
Level of Service (LOS)
Delay (sec/veh)
Queue Length (no. of veh)
2025Modified No
Action
Year Scenario Access Movement
Level of Service (LOS)
Delay (sec/veh)
Queue Length (no. of veh)
2025Modified No
Action
Year Scenario Access Movement
Level of Service (LOS)
Delay (sec/veh)
Queue Length (no. of veh)
2025Modified No
Action
Year Scenario Access Movement
Level of Service (LOS)
Delay (sec/veh)
Queue Length (no. of veh)
2025Modified No
Action
Year Scenario Access Movement
Level of Service (LOS)
Delay (sec/veh)
Queue Length (no. of veh)
2025Modified No
Action
Year Scenario Access Movement
Level of Service (LOS)
Delay (sec/veh)
Queue Length (no. of veh)
2025Modified No
Action
Year Scenario Access Movement
Level of Service (LOS)
Delay (sec/veh)
Queue Length (no. of veh)
2025Modified No
Action
Year Scenario Access Movement
Level of Service (LOS)
Delay (sec/veh)
Queue Length (no. of veh)
2025Modified No
Action
Year Scenario Access Movement
Level of Service (LOS)
Delay (sec/veh)
Queue Length (no. of veh)
2025Modified No
Action
Year Scenario Access Movement
Level of Service (LOS)
Delay (sec/veh)
Queue Length (no. of veh)
2025Modified No
Action
Year Scenario Access Movement
Level of Service (LOS)
Delay (sec/veh)
Queue Length (no. of veh)
2025Modified No
Action
Year Scenario Access Movement
Level of Service (LOS)
Delay (sec/veh)
Queue Length (no. of veh)
2025Modified No
Action
Year Scenario Access Movement
Level of Service (LOS)
Delay (sec/veh)
Queue Length (no. of veh)
2025Modified No
Action
Year Scenario Access Movement
Level of Service (LOS)
Delay (sec/veh)
Queue Length (no. of veh)
2025Modified No
Action
Year Scenario Access Movement
Level of Service (LOS)
Delay (sec/veh)
Queue Length (no. of veh)
2025Modified No
Action
Year Scenario Access Movement
Level of Service (LOS)
Delay (sec/veh)
Queue Length (no. of veh)
2025Modified No
Action
N/A
Year Scenario Access Movement
Level of Service (LOS)
Delay (sec/veh)
Queue Length (no. of veh)
2025Modified No
Action
Year Scenario Access Movement
Level of Service (LOS)
Delay (sec/veh)
Queue Length (no. of veh)
2025Modified No
Action
Year Scenario Access Movement
Level of Service (LOS)
Delay (sec/veh)
Queue Length (no. of veh)
2025Modified No
Action
Year Scenario Access Movement
Level of Service (LOS)
Delay (sec/veh)
Queue Length (no. of veh)
2025Modified No
Action
N/A
Year Scenario Access Movement
Level of Service (LOS)
Delay (sec/veh)
Queue Length (no. of veh)
2025Modified No
Action
Year Scenario Access Movement
Level of Service (LOS)
Delay (sec/veh)
Queue Length (no. of veh)
2025Modified No
Action
Year Scenario Access Movement

P:\Projects\220022~1\01\Work\SJW\Output\Report\San Juan Waterfront Masterplan Transport Assessment_5-review.doc
106
FIGURE 7.9 AM RESULTS; NA_ALT 4 MODEL
(Intersection 1) AM Peak - Gilberto Concepcion de Gracia and Fernandez Juncos Intersection (Intersection 14) AM Peak - M. Fernandez and Del Tren Intersection
Calle Concepción de Gracia (NB) TR A 2.20 9 Calle Fernandez (NB) LT E 68.77 6
Calle Concepción de Gracia (SB) LTR C 28.39 4 Calle Fernandez (SB) N/A / / /
Ave. Fernandez Juncos (WB) TR A 0.00 16 Calle Del Tren (EB) N/A / / /
Intersection A 5.41 16 Calle Del Tren (WB) TR A 2.70 6
Intersection A 3.88 6
(Intersection 2) AM Peak - Valdes and Del Tren Intersection
(Intersection 15) AM Peak - M Feranandez and Fernandez Juncos Intersection
Calle Vales (SB) R C 18.66 4
Ave. Del Tren (EB) N/A / / / Calle Fernandez (NB) TR B 19.65 0
Ave. Del Tren (WB) TR A 0.00 11 Calle Fernandez (SB) N/A / / /
Intersection A 1.27 11 Ave. Fernandez Juncos (EB) LT A 0.00 5
Ave. Fernandez Juncos (WB)/MT T A 0.00 0
(Intersection 3) AM Peak - Marina Access and Fernandez Juncos Intersection Intersection A 0.08 5
(Intersection 16) AM Peak - Ramon Power and Del Tren Intersection
Calle Ramon Power (NB)/MT LT A 0.00 2
Intersection Calle Ramon Power (SB) TR F 224.43 17
Calle Del Tren (EB) N/A / / /
(Intersection 4) AM Peak - San Andres and Del Tren Intersection Calle Del Tren (WB) LTR A 5.68 17
Intersection A 8.01 17
Calle San Andres (NB) LT B 18.00 2 (Intersection 17) AM Peak - Ramon Power and Fernandez Juncos IntersectionCalle San Andres (SB) TR C 25.54 5
Calle Del Tren (EB) N/A / / /
Calle Del Tren (WB) LTR A 0.18 2 Calle Ramon Power (NB) N/A / / /
Intersection A 0.74 5 Calle Ramon Power (SB) L C 34.86 8
Ave. Fernandez Juncos (EB) LT A 1.28 14
(Intersection 5A) AM Peak - San Andres and Fernandez Jucnos Intersection Ave. Fernandez Juncos (WB)/MT T A 0.00 0
Intersection A 5.44 14
Calle San Andres (NB) TR B 19.20 2 (Intersection 18) AM Peak - Calle 3 and Del Tren Intersection
Calle San Andres (SB) LT D 35.17 16
Ave. Fernandez Juncos (EB) LTR A 0.00 11
Ave. Fernandez Juncos (WB)/MT T A 0.00 0 Calle 3 (NB) L F 70.54 11
Intersection A 4.11 16 Calle Del Tren (EB) N/A / / /
Calle Del Tren (WB) LT A 2.38 7
(Intersection 6) AM Peak - Pelayo and Del Tren Intersection Intersection A 4.25 11
(Intersection 19) AM Peak - Calle 3 and Fernandez Juncos IntersectionCalle Pelayo (NB) N/A / / /
Calle Pelayo (SB) R A 5.96 4
Calle Del Tren (EB) N/A / / / Calle 3 (NB) N/A / / /
Calle Del Tren (WB) TR A 0.47 2 Calle 3 (SB) L C 20.56 5
Intersection A 0.73 4 Ave. Fernandez Juncos (EB) LT A 2.50 6
Ave. Fernandez Juncos (WB)/MT T A 0.00 0
(Intersection 7) AM Peak - Pelayo and Fernandez Juncos Intersection Intersection A 3.50 6
(Intersection 21) AM Peak - Calle 5 and Fernandez Juncos/Del Tren Intersection
Calle 5 (SB) LT C 32.55 12
Ave. Fernandez Juncos (EB) T A 5.28 7
Intersection Ave. Fernandez Juncos (WB) T A 9.86 24
Intersection B 15.84 24
(Intersection 8) AM Peak - Tadeo Rivera and Del Tren Intersection
(Intersection 22) AM Peak - Padre Hoff Fernandez Juncos Intersection
Calle Tadeo Rivera (NB) N/A / / /
Calle Tadeo Rivera (SB) R A 3.89 0 Calle Padre Hoff (NB) N/A / / /
Calle Del Tren (EB) N/A / / / Ave. Fernandez Juncos (EB) T A 0.35 5
Calle Del Tren (WB) TR A 0.01 2 Ave. Fernandez Juncos (WB)/MT T A 0.00 0
Intersection A 0.03 2 Intersection A 0.35 5
(Intersection 9) AM Peak - Tadeo Rivera and Fernandez Juncos Intersection (Intersection 23) AM Peak - SJW Access A and Fernandez Juncos Intersection
Calle Tadeo Rivera (NB) R A 0.00 0.00 Ave. Fernandez Juncos (EB) TR A 0.09 0
Calle Tadeo Rivera (SB) N/A / / / Ave. Fernandez Juncos (WB)/MT T A 0.00 0
Ave. Fernandez Juncos (EB) TR A 0.36 2.00 Intersection A 0.09 0
Ave. Fernandez Juncos (WB)/MT T A 0.00 0.00
Intersection A 0.36 2.00 (Intersection 24) AM Peak - SJW Access B and Fernandez Juncos Intersection
(Intersection 10) AM Peak - Matias Ledesma and Del Tren IntersectionAve. Fernandez Juncos (EB) TR A 0.48 0
Ave. Fernandez Juncos (WB)/MT T A 0.00 0
Calle Matias Ledesma (NB) LT A 0.00 0 Intersection A 0.48 0
Calle Matias Ledesma (SB) TR D 41.64 12
Calle Del Tren (EB) N/A / / / (Intersection 25) AM Peak - SJW Access C and Fernandez Juncos IntersectionCalle Del Tren (WB) LTR A 0.00 8
Intersection A 2.07 12
Ave. Fernandez Juncos (EB) TR A 0.82 0
(Intersection 11) AM Peak - Matias Ledesma and Fernandez Juncos Intersection Ave. Fernandez Juncos (WB)/MT T A 0.00 0
Intersection A 0.82 0
Calle Matias Ledesma (NB) TR A 0.00 0 (Intersection 26) AM Peak - SJW Access D and Fernandez Juncos IntersectionCalle Matias Ledesma (SB) LT B 19.98 21
Ave. Fernandez Juncos (EB) LTR A 0.00 7
Ave. Fernandez Juncos (WB)/MT T A 0.00 0 Access D (NB) N/A / / /
Intersection A 2.66 21 Ave. Fernandez Juncos (EB) T A 3.31 10
Ave. Fernandez Juncos (WB)/MT T A 0.00 0
(Intersection 12) AM Peak - San Juan Bautista and Del Tren Intersection Intersection A 3.31 10
(Intersection 27) AM Peak - SJW Access E and Fernandez Juncos IntersectionCalle San Juan Bautista (NB) LT F 95.72 6
Calle San Juan Bautista (SB) TR E 42.50 12
Calle Del Tren (EB) N/A / / / Access E (NB) N/A / / /
Calle Del Tren (WB) LTR A 2.46 13 Ave. Fernandez Juncos (EB) T A 0.14 0
Intersection A 6.91 13 Ave. Fernandez Juncos (WB)/MT T A 0.00 0
Intersection A 0.14 0
(Intersection 13) AM Peak - San Juan Bautista and Fernandez Juncos Intersection
(Intersection 28) AM Peak - SJW Access F and Fernandez Juncos Intersection
Calle San Juan Bautista (NB) TR A 0.00 0
Calle San Juan Bautista (SB) LT A 4.62 9 Access E (NB) N/A / / /
Ave. Fernandez Juncos (EB) LTR A 1.46 6 Ave. Fernandez Juncos (EB) T A 0.85 8
Ave. Fernandez Juncos (WB)/MT T A 0.00 0 Ave. Fernandez Juncos (WB)/MT T A 0.00 0
Intersection A 1.73 9 Intersection A 0.85 8
Level of Service (LOS)
Delay (sec/veh)
Queue Length (no. of veh)
2025 No Action
Year Scenario Access Movement
Level of Service (LOS)
Delay (sec/veh)
Queue Length (no. of veh)
2025 No Action
Year Scenario Access Movement
Level of Service (LOS)
Delay (sec/veh)
Queue Length (no. of veh)
2025 No Action
Year Scenario Access Movement
Level of Service (LOS)
Delay (sec/veh)
Queue Length (no. of veh)
2025 No Action
Year Scenario Access Movement
Level of Service (LOS)
Delay (sec/veh)
Queue Length (no. of veh)
2025 No Action
Year Scenario Access Movement
Level of Service (LOS)
Delay (sec/veh)
Queue Length (no. of veh)
2025 No Action
Year Scenario Access Movement
Level of Service (LOS)
Delay (sec/veh)
Queue Length (no. of veh)
2025 No Action
Year Scenario Access Movement
Level of Service (LOS)
Delay (sec/veh)
Queue Length (no. of veh)
2025 No Action
Year Scenario Access Movement
Level of Service (LOS)
Delay (sec/veh)
Queue Length (no. of veh)
2025 No Action
Year Scenario Access Movement
Level of Service (LOS)
Delay (sec/veh)
Queue Length (no. of veh)
2025 No Action
Year Scenario Access Movement
Level of Service (LOS)
Delay (sec/veh)
Queue Length (no. of veh)
2025 No Action
Year Scenario Access Movement
Level of Service (LOS)
Delay (sec/veh)
Queue Length (no. of veh)
2025 No Action
Year Scenario Access Movement
Level of Service (LOS)
Delay (sec/veh)
Queue Length (no. of veh)
2025 No Action
Year Scenario Access Movement
Level of Service (LOS)
Delay (sec/veh)
Queue Length (no. of veh)
2025 No Action
Year Scenario Access Movement
Level of Service (LOS)
Delay (sec/veh)
Queue Length (no. of veh)
2025 No Action
Year Scenario Access Movement
Level of Service (LOS)
Delay (sec/veh)
Queue Length (no. of veh)
2025 No Action
Year Scenario Access Movement
Level of Service (LOS)
Delay (sec/veh)
Queue Length (no. of veh)
2025 No Action
Year Scenario Access Movement
Level of Service (LOS)
Delay (sec/veh)
Queue Length (no. of veh)
2025 No Action
Year Scenario Access Movement
Level of Service (LOS)
Delay (sec/veh)
Queue Length (no. of veh)
2025 No Action
Year Scenario Access Movement
Level of Service (LOS)
Delay (sec/veh)
Queue Length (no. of veh)
2025 No Action
Year Scenario Access Movement
Level of Service (LOS)
Delay (sec/veh)
Queue Length (no. of veh)
2025 No ActionN/A
Year Scenario Access Movement
Level of Service (LOS)
Delay (sec/veh)
Queue Length (no. of veh)
2025 No Action
Year Scenario Access Movement
Level of Service (LOS)
Delay (sec/veh)
Queue Length (no. of veh)
2025 No Action
Year Scenario Access Movement
Level of Service (LOS)
Delay (sec/veh)
Queue Length (no. of veh)
2025 No Action
Year Scenario Access Movement
Level of Service (LOS)
Delay (sec/veh)
Queue Length (no. of veh)
2025 No ActionN/A
Year Scenario Access Movement
Level of Service (LOS)
Delay (sec/veh)
Queue Length (no. of veh)
2025 No Action
Year Scenario Access Movement
Level of Service (LOS)
Delay (sec/veh)
Queue Length (no. of veh)
2025 No Action
Year Scenario Access Movement

P:\Projects\220022~1\01\Work\SJW\Output\Report\San Juan Waterfront Masterplan Transport Assessment_5-review.doc
107
FIGURE 7.10 PM RESULTS; NA_ALT 4 MODEL
(Intersection 1) PM Peak - Gilberto Concepcion de Gracia and Fernandez Juncos Intersection (Intersection 14) PM Peak - M. Fernandez and Del Tren Intersection
Calle Concepción de Gracia (NB) TR C 32.26 62 Calle Fernandez (NB) LT A 3.01 12
Calle Concepción de Gracia (SB) LTR E 75.26 9 Calle Fernandez (SB) TR / / /
Ave. Fernandez Juncos (WB) TR A 0.00 33 Calle Del Tren (EB) N/A / / /
Intersection C 33.85 62 Calle Del Tren (WB) LTR A 1.33 31
Intersection A 1.39 31
(Intersection 2) PM Peak - Valdes and Del Tren Intersection
(Intersection 15) PM Peak - M Feranandez and Fernandez Juncos Intersection
Calle Vales (SB) R B 12.35 9
Ave. Del Tren (EB) N/A / / / Calle Fernandez (NB) TR C 31.06 0
Ave. Del Tren (WB) TR A 0.00 - Calle Fernandez (SB) LT / / /
Intersection A 4.55 9 Ave. Fernandez Juncos (EB) LTR A 0.00 39
Ave. Fernandez Juncos (WB)/MT T A 0.00 0
(Intersection 3) PM Peak - Marina Access and Fernandez Juncos Intersection Intersection A 0.14 39
(Intersection 16) PM Peak - RPMon Power and Del Tren Intersection
Calle Ramon Power (NB) LT A 0.00 3
Intersection Calle Ramon Power (SB) TR F 439.97 18
Calle Del Tren (EB) N/A / / /
(Intersection 4) PM Peak - San Andres and Del Tren Intersection Calle Del Tren (WB) LTR A 7.08 42
Intersection B 14.46 42
Calle San Andres (NB) N/A A 0.92 0 (Intersection 17) PM Peak - RPMon Power and Fernandez Juncos IntersectionCalle San Andres (SB) TR F 106.72 17
Calle Del Tren (EB) N/A / / /
Calle Del Tren (WB) LTR C 20.56 33 Calle Ramon Power (NB) TR / / /
Intersection C 29.64 33 Calle Ramon Power (SB) LT E 72.62 11
Ave. Fernandez Juncos (EB) LTR A 0.00 41
(Intersection 5A) PM Peak - San Andres and Fernandez Jucnos Intersection Ave. Fernandez Juncos (WB)/MT T A 0.00 0
Intersection A 2.60 41
Calle San Andres (NB) N/A A 0.00 2 (Intersection 18) PM Peak - Calle 3 and Del Tren Intersection
Calle San Andres (SB) LT D 43.09 20
Ave. Fernandez Juncos (EB) T B 10.78 27
Ave. Fernandez Juncos (WB)/MT T A 0.00 0 Calle 3 (NB) L C 18.41 14
Intersection B 14.17 27 Calle Del Tren (EB) N/A / / /
Calle Del Tren (WB) LT A 1.75 26
(Intersection 6) PM Peak - Pelayo and Del Tren Intersection Intersection A 3.09 26
(Intersection 19) PM Peak - Calle 3 and Fernandez Juncos IntersectionCalle Pelayo (NB) LT / / /
Calle Pelayo (SB) TR C 16.70 3
Calle Del Tren (EB) N/A / / / Calle 3 (NB) TR / / /
Calle Del Tren (WB) LTR A 0.80 2 Calle 3 (SB) LT D 52.55 7
Intersection A 3.81 3 Ave. Fernandez Juncos (EB) LTR A 0.00 49
Ave. Fernandez Juncos (WB)/MT T A 0.00 0
(Intersection 7) PM Peak - Pelayo and Fernandez Juncos Intersection Intersection A 1.56 49
(Intersection 21) PM Peak - Calle 5 and Fernandez Juncos/Del Tren Intersection
Calle 5 (SB) LT D 35.61 78
Ave. Fernandez Juncos (EB) T A 5.98 29
Intersection Ave. Fernandez Juncos (WB)/MT T A 3.86 38
Intersection B 14.50 78
(Intersection 8) PM Peak - Tadeo Rivera and Del Tren Intersection
(Intersection 22) PM Peak - Padre Hoff Fernandez Juncos Intersection
Calle Tadeo Rivera (NB) N/A / / 0
Calle Tadeo Rivera (SB) R B 10.33 2 Calle Padre Hoff (NB) TR / / /
Calle Del Tren (EB) N/A / / / Ave. Fernandez Juncos (EB) LT A 9.60 23
Calle Del Tren (WB) TR A 0.00 0 Ave. Fernandez Juncos (WB)/MT T A 0.00 0
Intersection A 0.92 2 Intersection A 9.60 23
(Intersection 9) PM Peak - Tadeo Rivera and Fernandez Juncos Intersection (Intersection 23) PM Peak - SJW Access A and Fernandez Juncos Intersection
Calle Tadeo Rivera (NB) R A 8.93 0.00 Ave. Fernandez Juncos (EB) TR A 1.99 15
Calle Tadeo Rivera (SB) N/A / / / Ave. Fernandez Juncos (WB)/MT T A 0.00 0
Ave. Fernandez Juncos (EB) TR A 2.74 2.00 Intersection A 1.99 15
Ave. Fernandez Juncos (WB)/MT T A 0.00 0.00
Intersection A 2.77 2.00 (Intersection 24) PM Peak - SJW Access B and Fernandez Juncos Intersection
(Intersection 10) PM Peak - Matias Ledesma and Del Tren IntersectionAve. Fernandez Juncos (EB) TR A 1.04 21
Ave. Fernandez Juncos (WB)/MT T A 0.00 0
Calle Matias Ledesma (NB) LT C 25.41 10 Intersection A 1.04 21
Calle Matias Ledesma (SB) TR F 88.75 14
Calle Del Tren (EB) N/A / / / (Intersection 25) PM Peak - SJW Access C and Fernandez Juncos IntersectionCalle Del Tren (WB) LTR A 0.00 52
Intersection B 14.60 52
Ave. Fernandez Juncos (EB) TR A 1.05 28
(Intersection 11) PM Peak - Matias Ledesma and Fernandez Juncos Intersection Ave. Fernandez Juncos (WB)/MT T A 0.00 0
Intersection A 1.05 28
Calle Matias Ledesma (NB) TR A 0.00 0 (Intersection 26) PM Peak - SJW Access D and Fernandez Juncos IntersectionCalle Matias Ledesma (SB) LT B 15.77 23
Ave. Fernandez Juncos (EB) LTR A 4.66 35
Ave. Fernandez Juncos (WB)/MT T A 0.00 0 Access D (NB) R / / /
Intersection A 5.64 35 Ave. Fernandez Juncos (EB) T A 4.09 28
Ave. Fernandez Juncos (WB)/MT T A 0.00 0
(Intersection 12) PM Peak - San Juan Bautista and Del Tren Intersection Intersection A 4.09 28
(Intersection 27) PM Peak - SJW Access E and Fernandez Juncos IntersectionCalle San Juan Bautista (NB) LT A 9.74 3
Calle San Juan Bautista (SB) TR D 28.09 11
Calle Del Tren (EB) N/A / / / Access E (NB) R / / /
Calle Del Tren (WB) LTR A 0.61 3 Ave. Fernandez Juncos (EB) T A 2.06 39
Intersection A 6.24 11 Ave. Fernandez Juncos (WB)/MT T A 0.00 0
Intersection A 2.06 39
(Intersection 13) PM Peak - San Juan Bautista and Fernandez Juncos Intersection
(Intersection 28) PM Peak - SJW Access F and Fernandez Juncos Intersection
Calle San Juan Bautista (NB) TR A 1.71 0
Calle San Juan Bautista (SB) LT E 76.47 23 Access E (NB) R / / /
Ave. Fernandez Juncos (EB) LTR A 0.00 30 Ave. Fernandez Juncos (EB) TR A 3.39 35
Ave. Fernandez Juncos (WB)/MT T A 0.00 0 Ave. Fernandez Juncos (WB)/MT T A 0.00 0
Intersection A 3.58 30 Intersection A 3.39 35
Level of Service (LOS)
Delay (sec/veh)
Queue Length (no. of veh)
2025 No Action
Year Scenario Access Movement
Level of Service (LOS)
Delay (sec/veh)
Queue Length (no. of veh)
2025 No Action
Year Scenario Access Movement
Level of Service (LOS)
Delay (sec/veh)
Queue Length (no. of veh)
2025 No Action
Year Scenario Access Movement
Level of Service (LOS)
Delay (sec/veh)
Queue Length (no. of veh)
2025 No Action
Year Scenario Access Movement
Level of Service (LOS)
Delay (sec/veh)
Queue Length (no. of veh)
2025 No Action
Year Scenario Access Movement
Level of Service (LOS)
Delay (sec/veh)
Queue Length (no. of veh)
2025 No Action
Year Scenario Access Movement
Level of Service (LOS)
Delay (sec/veh)
Queue Length (no. of veh)
2025 No Action
Year Scenario Access Movement
Level of Service (LOS)
Delay (sec/veh)
Queue Length (no. of veh)
2025 No Action
Year Scenario Access Movement
Level of Service (LOS)
Delay (sec/veh)
Queue Length (no. of veh)
2025 No Action
Year Scenario Access Movement
Level of Service (LOS)
Delay (sec/veh)
Queue Length (no. of veh)
2025 No Action
Year Scenario Access Movement
Level of Service (LOS)
Delay (sec/veh)
Queue Length (no. of veh)
2025 No Action
Year Scenario Access Movement
Level of Service (LOS)
Delay (sec/veh)
Queue Length (no. of veh)
2025 No Action
Year Scenario Access Movement
Level of Service (LOS)
Delay (sec/veh)
Queue Length (no. of veh)
2025 No Action
Year Scenario Access Movement
Level of Service (LOS)
Delay (sec/veh)
Queue Length (no. of veh)
2025 No Action
Year Scenario Access Movement
Level of Service (LOS)
Delay (sec/veh)
Queue Length (no. of veh)
2025 No Action
Year Scenario Access Movement
Level of Service (LOS)
Delay (sec/veh)
Queue Length (no. of veh)
2025 No Action
Year Scenario Access Movement
Level of Service (LOS)
Delay (sec/veh)
Queue Length (no. of veh)
2025 No Action
Year Scenario Access Movement
Level of Service (LOS)
Delay (sec/veh)
Queue Length (no. of veh)
2025 No Action
Year Scenario Access Movement
Level of Service (LOS)
Delay (sec/veh)
Queue Length (no. of veh)
2025 No Action
Year Scenario Access Movement
Level of Service (LOS)
Delay (sec/veh)
Queue Length (no. of veh)
2025 No Action
Year Scenario Access Movement
Level of Service (LOS)
Delay (sec/veh)
Queue Length (no. of veh)
2025 No ActionN/A
Year Scenario Access Movement
Level of Service (LOS)
Delay (sec/veh)
Queue Length (no. of veh)
2025 No Action
Year Scenario Access Movement
Level of Service (LOS)
Delay (sec/veh)
Queue Length (no. of veh)
2025 No Action
Year Scenario Access Movement
Level of Service (LOS)
Delay (sec/veh)
Queue Length (no. of veh)
2025 No Action
Year Scenario Access Movement
Level of Service (LOS)
Delay (sec/veh)
Queue Length (no. of veh)
2025 No ActionN/A
Year Scenario Access Movement
Level of Service (LOS)
Delay (sec/veh)
Queue Length (no. of veh)
2025 No Action
Year Scenario Access Movement
Level of Service (LOS)
Delay (sec/veh)
Queue Length (no. of veh)
2025 No Action
Year Scenario Access Movement

P:\Projects\220022~1\01\Work\SJW\Output\Report\San Juan Waterfront Masterplan Transport Assessment_5-review.doc
108
Results Analysis
7.13 As mentioned in Chapter 5 the results shown in the tables above were prepared based on the journey time and vehicle count outputs from the Paramics models. This was prepared by creating a path in Paramics10 for each access to the main intersections. The overall intersection analysis presented in the results tables, is based on the individual accesses results. The delay calculation for the overall intersection was determined by multiplying the number of vehicles per approach by its corresponding average delay. The addition of this was then divided by the total number of vehicles accessing the intersection and the intersection delay was obtained. The delay results were used to determine the intersection LOS using the parameters displayed in Table 7.1.
7.14 For the intersection analysis, the maximum link queue is used as required by the PRHTA’s Traffic Study Guides11.
Base Model (2007)
7.15 The base model shows an overall free flowing operation along Fernández Juncos Ave and Del Tren Street. The highest average delay is 25.2 seconds per vehicle in the PM Peak period eastbound. All intersections have LOS A for the AM model and a LOS B is observed in the PM model at intersection of San Andrés St. and Del Tren St... The worst approach with LOS E is observed in the AM Peak model for Calle 5 southbound traffic towards Del Tren St.
7.16 The overall microsimulation modeling of the Fernández Juncos Avenue corridor shows that during both the AM and PM peak periods traffic flows through the corridor in a near free flow condition.
7.17 It should be noted that this corridor currently operates in a near free flow state due to the minimal number of vehicle movements into and out of side streets along Fernández Juncos Avenue. Any increase in the number of these vehicle movements would result in an increase in vehicle interactions (i.e. increased vehicle conflicts), which could result in a break down of free flow conditions and an increase in queuing and journey times through the corridor.
Proposed Action-Alternative 1 Model (2025)
7.18 As expected, conditions worsen for the PA_Alt 1 model. Delays of a maximum of 385 seconds are observed during the AM Peak period for traffic along Fernández Street northbound on its intersection with Del Tren Street. The highest delay along the east-west corridor is of 31 seconds, observed at Fernández Juncos westbound at the intersection with Gerardo Concepción de Gracia.
10 Paths are the identification of the links for which outputs are required 11 Estado Libre Asociado de Puerto Rico, Departamento de Transportación y Obras Públicas, Autoridad de Carreteras y
Transportación. (22 de diciembre de 2004). Guías para la Preparación de Estudios Operacionales de Acceso y de Tránsito para Puerto Rico; Versión 1.0;

P:\Projects\220022~1\01\Work\SJW\Output\Report\San Juan Waterfront Masterplan Transport Assessment_5-review.doc
109
7.19 The LOS during the morning period are between LOS A and B for all intersections. Access LOS C, D and F are only observed on some north and south approaches to Del Tren St. and Fernández Juncos Avenues; LOS A and B are always observed for the east-west roads.
7.20 The LOS during the morning period are between LOS A and C for all intersections, except for intersection of G. Concepción de Gracia St with Fernández Juncos Ave. (main southern egress point in the northern part of the Isleta) which has an overall LOS D. This is caused by the high volumes of traffic trying to exit the Isleta during the end of the working day. Access LOS D, E and F are only observed on some north and south approaches to Del Tren St. and Fernández Juncos Avenues; LOS A, B and C are always observed for the east-west roads.
Proposed Action-Alternative 2 Model (2025)
7.21 The maximum delay observed in this alternative is approximately 180 seconds per vehicles for the PM traffic eastbound. The morning peak period results are very similar in terms that the worst overall intersection LOS observed is C. Also, LOS D, E and F are only observed on the minor road approaches and LOS A, B and C on Del Tren St. and Fernández Juncos Ave.
7.22 This overall operation of LOS C or better for the main roads is maintained during the PM Peak period.
Modified No Action-Alternative 3 Model (2025)
7.23 The maximum delay observed on the MNA_Alt 3 is higher than for any other model, 340 sec/veh for the afternoon peak eastbound.
7.24 The operation of the intersections on the AM model maintain the same pattern as the PA_Alt 1 and PA_Alt 2 models with LOS C or better for the overall intersection. The PM situation presents a marked decrease in the network operation since LOS D, E and F are obtained for 10 of the analysed intersections:
• G. Concepción de Gracia St. at Fernández Juncos Ave LOS E
• San Andrés St at Del Tren St LOS E
• San Andrés St at Fernández Juncos Ave. LOS E
• Pelayo St at Del Tren St. LOS D
• Tadeo Rivera at Fernández Juncos Ave LOS F
• Matías Ledesma at Fernández Juncos Ave LOS D
• San Juan Bautista St at Del Tren St LOS D
• San Juan Bautista St at Fernández Juncos Ave LOS D
• Calle 3 at Del Tren St. LOS D
• AJW Access Driveway at Fernández Juncos Ave. LOS D

P:\Projects\220022~1\01\Work\SJW\Output\Report\San Juan Waterfront Masterplan Transport Assessment_5-review.doc
110
No Action – Alternative 4 Model (2025)
7.25 This model presents the best operational condition. The travel time for vehicles in the westbound and eastbound direction is reduced and is lower than for the Base Model. However, this does not mean that the roadway operation is better than in the Base Model. The Free Flow Journey Times for the No Action model are lower than the Free Flow Journey Times for the Base Models due to different roadway networks.
7.26 The roadway capacity and transport network considers the road improvements due to Intersection 5, the introduction of a tramway and the rearrangement of traffic in the southern part of the Isleta (Del Tren St. westbound and Fernández Juncos Ave. eastbound traffic), but no additional development in the project area.
7.27 The results are derived from the comparisons of each model’s free flow Journey Times against its own development scenario during the peak traffic travel times. The peak traffic conditions could generate long travel times, however since the roadway network are different in each model, the free flow journey time will be shorter under the condition with higher roadway capacity (more traffic improvements).
7.28 The difference between free flow journey times to peak traffic journey time is not comparable across models since the conditions (roadway capacity) are different in each one.
7.29 With this clarified, the analysis of the results for the NA_Alt. 4 model included in Figure 7.9 and Figure 7.10 can be retaken. The results show that the maximum delay is of 42.5 sec/veh for the outbound PM Peak.. LOS for the intersections are A and B for the morning peak and up to C in the afternoon. The LOS on the minor roads may go up to F in some cases during both the AM and PM peak periods.

P:\Projects\220022~1\01\Work\SJW\Output\Report\San Juan Waterfront Masterplan Transport Assessment_5-review.doc
111
8. SIGNAL NEED STUDY
Introduction
8.1 This section describes the conditions that justify the introduction of four additional traffic signals along the Fernández Juncos Avenue. As part of the PA_Alt 1 and PA_Alt2, the proposed new traffic signals will be located at:
• Pelayo St.
• Padre Hoff St.
• San Juan Bautista St
• Fernández St. (under the proposed new alignment
8.2 Fernández Juncos Avenue will support a tram or light rail transit (LRT) system alignment consisting of semi-exclusive right or way in the area under consideration. The semi-exclusive right of way implies that at grade crossing by pedestrians and other vehicles is expected to occur at designated areas, such as street intersections or marked pedestrian crossings.
Manual of Uniform Traffic Control Devices
8.3 The Federal Highway Administration (FHWA) publishes the Manual of Uniform Traffic Control Devices (MUTCD), which contains all approved designs, standards and, guidance for traffic control devices. The purpose of the MUTCD is to provide uniformity of these devices among all jurisdictions.
8.4 The MUTCD is adopted by reference in accordance with Title 23, United States Code, Section 109(d) and Title 23, Code of Federal Regulations, Part 655.603, and is approved as the national standard for designing, applying, and planning traffic control devices.
8.5 As provided in Title 23 of the Code of Federal Regulations, Part 655.603 states that the MUTCD is the national standard for all traffic control devices installed on any street, highway, or bicycle trail open to public travel. The MUTCD has been formally adopted as the standard for Puerto Rico by the Department of Transportation and Public Works (DTOP).
Traffic Signal Warrants
8.6 The MUTCD contains eight warrants to evaluate the need for a traffic signal (Part IV of the MUTCD). The warrants are based mostly on issues relating to vehicular and pedestrian volumes. Five of the eight warrants are volume-related while the remaining are for past crash experience and system optimization.
8.7 These eight warrants do not properly consider the conflicts arising of the interaction of transit, in particular Light Rail Transit, with other vehicle movements. Part X of the MUTCD: TRAFFIC CONTROLS FOR HIGHWAY-LIGHT RAIL TRANSIT GRADE CROSSINGS specifically addresses traffic control devices at grade crossings of highway traffic and light rail transit vehicles. Particularly Section 10B.01 states the following

P:\Projects\220022~1\01\Work\SJW\Output\Report\San Juan Waterfront Masterplan Transport Assessment_5-review.doc
112
standard: “Highway-light rail transit grade crossings in semi exclusive alignments shall be equipped with a combination of automatic gates and flashing-light signals, or flashing-light signals only, or traffic control signals, unless an engineering study indicates that the use of STOP, YIELD, or advance warning signs alone would be adequate.”
8.8 Under this standard all four intersections under consideration will require a traffic signal unless further studies can demonstrate adequate operations without the traffic signal.
8.9 Moreover, the introduction of an LRT along the corridor will require traffic signal coordination in order to provide signal progression, priority or even preemption at the intersections. Signal progression is obtained when platooning vehicles cross multiple signalized intersections under a green signal that progresses with the platoon. Signal priority is a method utilized to extend the green signal time in order to allow an incoming transit vehicle to cross the intersection with the current green signal. Signal preemption terminates the current indication and turn to green in order to allow specialty vehicles (emergency or transit) to cross the intersection on green signal. The basic difference between signal priority and signal preemption is that the latter interrupts the signal phasing while signal priority uses the existing phasing to allow vehicle passage. This coordinated signal systems falls within the criteria for Warrant 6 for traffic signals of the MUTCD. In the case of the LRT, the progressive movement of the train will be better managed with a traffic control signal at the selected locations.
8.10 The traffic volume projected for the San Juan Waterfront is creating areas of high occupancy vehicle facilities. The morning and afternoon peak periods traffic is studied to establish traffic volume justification for a traffic signal installation. This is cover under Warrant 3, Peak Hour of the MUTCD. This particular volume warrant is selected as the data is readily available.
8.11 Table 8.1shows the traffic volumes for the morning and afternoon peak periods for the streets under consideration.

P:\Projects\220022~1\01\Work\SJW\Output\Report\San Juan Waterfront Masterplan Transport Assessment_5-review.doc
113
TABLE 8.1 AM AND PM TRAFFIC VOLUMES FOR THE PROPOSED ACTION
AM Period Minor Crossing Street Period Volume (one direction only)
Fernández Juncos Ave. Peak Period Volume
(only thru traffic considered)
Pelayo St. 404 1170
Padre Hoff St. 140 1595
San Juan Bautista St. 215 1844
Fernández St. 151 1939
PM Period
Pelayo St. 294 1764
Padre Hoff St. 249 1894
San Juan Bautista St. 166 2155
Fernández St. 162 2137
8.12 According to Figure 4C-3 of the MUTCD, a minimum of 100 vehicles in the peak hour for the minor crossing street is required on a one lane approach for 1500 vehicles per hour or more on the major street (Fernández Juncos Ave). Under the conditions in the morning and afternoon peak periods shown in Table 8.1, traffic signals will be justified even without the presence of a light rail transit vehicle.
8.13 Steer Davies Gleave collected crash data from the Police Command Station in Puerta de Tierra12 on October 25, 2007 in order to evaluate Warrant 7, Crash Experience for a traffic signal justification. This Command Station has jurisdiction over crashes occurring in Fernández Juncos Ave.
8.14 The crash data revealed 263 Property Damage and Injury incidents from November 2006 to October 2007 (Appendix G). The police filing system did not classified the information in enough detail to determined if the types of crashes reported were susceptible to correction by a traffic control signal. This is a requirement under Section 4C.08 (B) for signal installation due to crash experience.
8.15 Informal reports from police officers interviewed stated that most crashes are due to roadway conditions and vehicles entering Fernández Juncos Ave. from driveways. The latter may be an indication that there are not enough acceptable gaps for vehicles to enter Fernández Juncos Ave. The inclusion of a traffic signal along the corridor will generate consistent breaks in the traffic flow (the gaps) that could reduce crashes due to vehicles entering Fernández Juncos Ave for driveways and minor streets.
12 Information provided by Agent Irizarry.

P:\Projects\220022~1\01\Work\SJW\Output\Report\San Juan Waterfront Masterplan Transport Assessment_5-review.doc
114
9. CONSTRUCTION PHASES
Introduction
9.1 The San Juan Waterfront project proposes major changes to the roadway network in the area. These changes will have to be built while maintaining traffic operations in Fernández Juncos Ave. The construction phases will limit the existing capacity of the roads.
9.2 As part of this study, the traffic impact of construction phases needed for the Fernández Juncos Avenue reconstruction, as part of the San Juan Waterfront development, are presented in this chapter. Generally two main construction phases will be needed to implement the changes in the roadway network. The construction phases are intended as a feasibility analysis on the main action required to achieve the work rather than to produce a detailed maintenance of traffic plan.
Construction Phase 1
9.3 The first construction phase will consist on the works required in the western end of Fernández Juncos Avenue from G. Concepción de Gracia Street to Fernández Street. During this phase, only two lanes of traffic will be available to traffic (one on each direction). This phase is expected to occur on 2011.
9.4 Figure 9.1 shows the Paramics model prepared to analyze Construction Phase 1. The model traffic volumes represent the base traffic plus the projected traffic to be generated by the following San Juan developments expected to be fully operational on 2011 (Refer to Chapter 6):
• Capitolio Plaza
• Atlantis
• Hotel Cervantes
• Bayside
• Biblioteca del Tribunal Supremo
• Paseo Caribe
9.5 Also, some of the proposed Puerto Rico Convention District Center developments are expected to be completed by 2011 including:
• 500 room hotel – 4th quarter 2009
• Parcel C - 90 unit residential – 1st quarter 2007
• 216,000 sq.ft. office – mid 2011
• Parcel D – 170 unit residential – 4th quarter 2011

P:\Projects\220022~1\01\Work\SJW\Output\Report\San Juan Waterfront Masterplan Transport Assessment_5-review.doc
115
9.6 Table 9.1 show the trips to be generated by these developments.
TABLE 9.1 TRIP GENERATION FOR THE PRCCD BY 2011
AM PM Entering Exiting Entering Exiting
853 611 366 620
9.7 The Construction Phase 1 model consists of 47 zones and 22 matrices with a total volume of 16,849 vehicles during the AM peak and 17,164 during the PM peak.
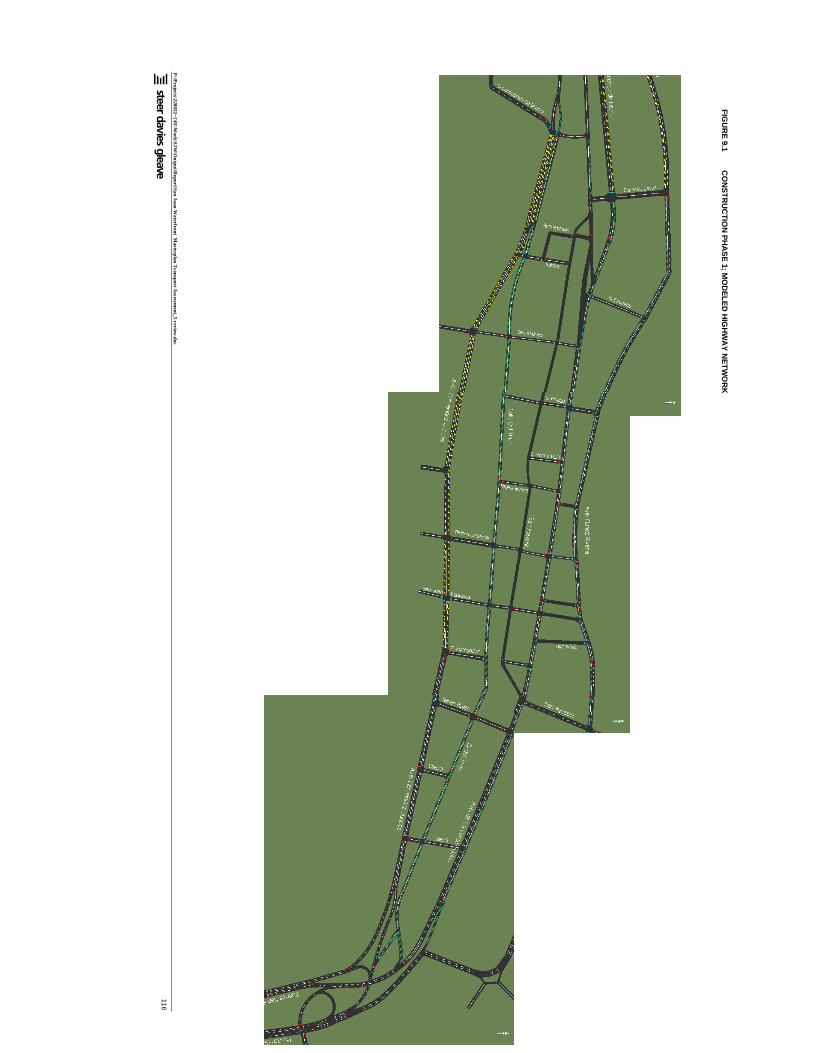
P:\P
rojects\220
022~1
\01\W
ork\SJW
\Ou
tput\Report\S
an Juan Waterfront M
asterplan T
ransport Assessm
ent_5
-review.doc
116
FIG
UR
E 9.1
CO
NS
TR
UC
TION
PH
AS
E 1; M
OD
ELE
D H
IGH
WA
Y N
ET
WO
RK

P:\Projects\220022~1\01\Work\SJW\Output\Report\San Juan Waterfront Masterplan Transport Assessment_5-review.doc
117
Results
9.8 When modeling construction phase 1, it was evident that the traffic queues will be so long that traffic exiting the Isleta will not be able to enter the study area during the peak hour period.
9.9 Table 9.2 shows the travel times for the AM and PM models.
TABLE 9.2 TRAVEL TIMES FOR FERNÁNDEZ JUNCOS DURING CONSTRUCTION PHASE 1
AM PM
Journey Time(sec)
Delay (sec/veh)
Journey Time (sec)
Delay (sec/veh)
Del Tren St. Eastbound (from G. Concepción de Gracia St to Calle 5)/MT
240 0.0 217 0.0
Del Tren St. Westbound (from Calle 5 to G. Concepción de Gracia St)/MT
428 0.0 387 0.0
Fernández Juncos Avenue Eastbound (from G. Concepción de Gracia St to Calle 5)
284 134.6 370 180.6
Fernández Juncos Avenue Westbound (from Calle 5 to G. Concepción de Gracia St.)
512 310.0 259 77.1
MT-Mass Transit corridor
9.10 In order to cater for this and the delays observed in this model (up to 310 seconds), an additional model was prepared (Version 2) considering the use of Del Tren Street as a traffic road westbound during the AM Peak and eastbound during the PM Peak. This will require the addition of a signal at the exit point of Del Tren Street to Constitución Avenue towards the San Antonio Bridge for the morning period.
9.11 Figure 9.2 shows the Paramics model road network for this option.
9.12 The traffic flow dramatically improved with this change as shown in the table below. This alternative reduces the Journey Times on the main traffic direction (westbound in the AM and eastbound in the PM). Nevertheless some delays may be experienced in the westbound traffic in the afternoon

P:\Projects\220022~1\01\Work\SJW\Output\Report\San Juan Waterfront Masterplan Transport Assessment_5-review.doc
118
TABLE 9.3 TRAVEL TIME ALONG FERNÁNDEZ JUNCOS FOR THE CONSTRUCTION PHASE V2 MODELS
AM PM
Journey Time(sec)
Delay (sec/veh)
Journey Time (sec)
Delay (sec/veh)
Del Tren St. Eastbound (from G. Concepción de Gracia St. to Calle 5)
N/A N/A 216 15
Del Tren St. Westbound (from Calle 5 to G. Concepción de Gracia St.)
286 0 N/A N/A
Fernández Juncos Avenue Eastbound (from G. Concepción de Gracia St. to Calle 5)
227 70 244 29
Fernández Juncos Avenue Westbound (from Calle 5 to G. Concepción de Gracia St.)
257 33 579 285
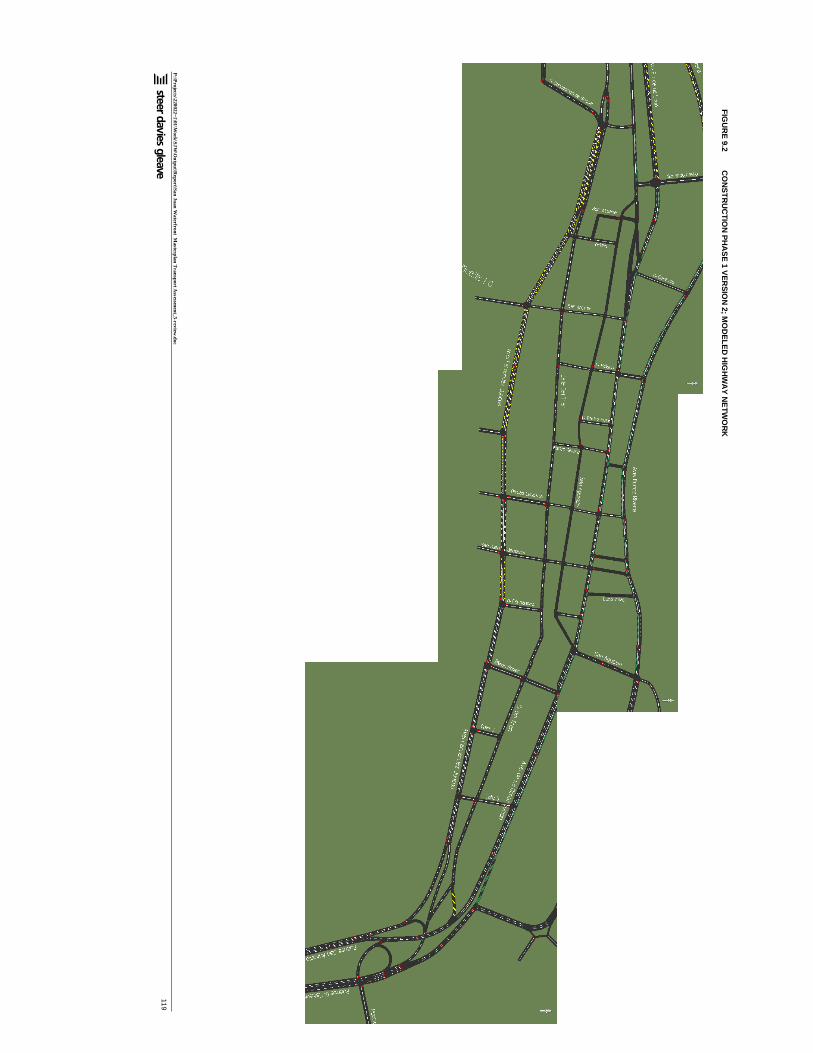
P:\P
rojects\220
022~1
\01\W
ork\SJW
\Ou
tput\Report\S
an Juan Waterfront M
asterplan T
ransport Assessm
ent_5
-review.doc
119
FIG
UR
E 9.2
CO
NS
TR
UC
TION
PH
AS
E 1 V
ER
SIO
N 2; M
OD
ELE
D H
IGH
WA
Y N
ETW
OR
K

P:\Projects\220022~1\01\Work\SJW\Output\Report\San Juan Waterfront Masterplan Transport Assessment_5-review.doc
120
Construction Phase 2
9.13 The second construction phase will consist on the works required in the eastern end of Fernández Juncos Avenue from Fernández Street up to the east edge of the development area. During this phase is expected to happen on 2015, only two lanes of traffic will be opened along this stretch of Fernández Juncos Ave. (both eastbound since the tramway right of way is expected to be in place).
9.14 At this stage it is expected that I5 will be completed and the tramway right of way will be available for mass transit. Also it is expected that the Marina Access, San Andrés Street and Pelayo Street extensions will be built.
9.15 Figure 9.3 shows the Paramics model prepared to analyze Construction Phase 2. The model traffic volumes represent the base traffic plus the projected traffic to be generated by all of the San Juan developments expected to be operational by 2015 (Refer to Chapter 6):
9.16 Also, some additional proposed Puerto Rico Convention Center District developments are expected to be completed by 2015 additional to the 2011 developments mentioned earlier including:
• Parcel B2 – 300 room hotel – late 2012, early 2013
• Parcel B3 – 200,000 SF office – early 2014
9.17 Table 9.4 shows the trips to be generated by these developments.
TABLE 9.4 TRIP GENERATION FOR THE PRCCD BY 2015
AM PM Entering Exiting Entering Exiting
1227 708 504 962
9.18 The San Juan Waterfront Masterplan parcels A+B+C, D and E will also be completed. The traffic expected to be generated by these development blocks is shown in Table 9.5.
TABLE 9.5 TRIP GENERATION FOR THE SAN JUAN WATERFRONT BY 2015
AM PM Entering Exiting Entering Exiting
489 522 412 343
9.19 The Construction Phase 2 model consists of 47 zones and 22 matrices with a total volume of 19,103 vehicles during the AM peak and 19,186 during the PM peak.

P:\Projects\220022~1\01\Work\SJW\Output\Report\San Juan Waterfront Masterplan Transport Assessment_5-review.doc
121
Results
9.20 Table 9.6 shows the travel times for the AM and PM models.
TABLE 9.6 TRAVEL TIMES FOR FERNÁNDEZ JUNCOS DURING CONSTRUCTION PHASE 2
AM PM
Journey Time(sec)
Delay (sec/veh)
Journey Time (sec)
Delay (sec/veh)
Del Tren St. Eastbound (from G. Concepción de Gracia St to Calle 5)
N/A N/A N/A N/A
Del Tren St. Westbound (from Calle 5 to G. Concepción de Gracia St)
319 169 266 98
Fernández Juncos Avenue Eastbound (from G. Concepción de Gracia St. to Calle 5)
425 288 731 601
Fernández Juncos Avenue Westbound (from Calle 5 to G. Concepción de Gracia St)/MT
TRAM
MT-Mass Transit corridor
9.21 Delays of up to 601 seconds are observed during the afternoon eastbound traffic during the PM period. Traffic works during Phase 2 should be undertaken during off peak traffic conditions especially in the afternoon.

P:\P
rojects\220
022~1
\01\W
ork\SJW
\Ou
tput\Report\S
an Juan Waterfront M
asterplan T
ransport Assessm
ent_5
-review.doc
122
FIG
UR
E 9.3
CO
NS
TR
UC
TION
PH
AS
E 2; M
OD
ELE
D H
IGH
WA
Y N
ET
WO
RK

P:\Projects\220022~1\01\Work\SJW\Output\Report\San Juan Waterfront Masterplan Transport Assessment_5-review.doc
123
10. CONCLUSIONS AND RECOMMENDATIONS
Conclusions
Models
10.1 From the extensive analysis undertaken for the four Alternatives analyzed as part of the San Juan Waterfront Masterplan Transport Assessment, it can be concluded that:
• The current traffic operation along Fernández Juncos Avenue and Del Tren Street is near free flow conditions even during peak hours.
• Any development in the area will affect the operation of this corridors, specially if the project area, immediately south of Fernández Juncos Avenue, is developed.
• The proposed development alternatives of the San Juan Waterfront (Alternative 1 and Alternative 2) will have a lesser impact on traffic than the Modified No Action Alternative which considers a full development of the project area based on the existing zoning.
• The main impact of the additional traffic in the Isleta is observed in the afternoon on G. Concepción de Gracia Street where all the southern traffic through and from the Old San Juan merges. The San Juan Waterfront attraction zones are located east of this intersection. This indicates that the queuing is caused by the high volume of future trips from and towards Old San Juan and the additional north-south traffic occurring further east of the Isleta.
• The introduction of a tramline and the change of the operation of Fernández Juncos Avenue and Del Tren Street are positive to the overall operation.
Other Conclusions
10.2 Other important conclusions can be reached by the analysis of the overall traffic scheme proposed as part of the San Juan Waterfront:
• Parking analysis showed a deficiency in parking provision for the San Juan Waterfront. A shared parking strategy will improve these deficiencies. However this could further support the use of a tramline.
• There is a need for the proposed new signals along Fernández Juncos due to the inclusion of a tramline both for safety and operational benefits and, the high traffic volume in the main corridor as compared to the minor streets delays.
• Additional capacity, westbound in the morning and eastbound in the afternoon, will be required during the Construction Phase 1.
• The construction phases will create delays in the peak periods, specially the afternoon.
Recommendations
10.3 The San Juan Isleta is a highly attractive area as a tourist and work destination. This is an area very attractive for future developments directed to tourism, leisure and residence. Due to limited land area of the Isleta and consequently lack of available additional road development, traffic problems will occur as the area develops.
10.4 The Intersection 5 traffic operations modelled showed that main access to the Isleta will create extensive traffic queues along the main roads accessing this area (Muñoz Rivera Ave, Ponce de León Ave., Baldorioty de Castro Ave and Baldorioty Boulevard) with or without the

P:\Projects\220022~1\01\Work\SJW\Output\Report\San Juan Waterfront Masterplan Transport Assessment_5-review.doc
124
development of the San Juan Waterfront.
10.5 Traffic reduction measures are necessary in order to ensure the proper development of this area while reducing the number of vehicles usage. The introduction of a mass transport system will be a good step towards this goal. Water taxis are also a traffic reduction alternative. Given the complexity of this problem other measures will be required, a multi prong approach is recommended:
• Behavioral Change Program – this include personal travel plans13
• Public Policy/Enforcement:
� Only resident vehicles and taxi services allowed at the Isleta – Mass transport required for visitors and employees
� Increase in parking charges
� Limit parking time duration
• Organization of taxi service specially during massive tourist movement such as cruise ships
• Congestion Charging could be a market based approach to reduce vehicles entering the Isleta.
• Include Intelligent Transport Systems (ITS) in order to manage the frequent special events in the area, the construction phases and, to maintain and recover to normal traffic conditions during unexpected incidents.
10.6 It is also recommended to build I5 proposed scenario and to make the operational changes to Ponce de León Ave. and Del Tren Street.
10.7 A parking sharing strategy approach is proposed for the eastern and western areas of the San Juan Waterfront. No further parking is recommended. In order to maximise the use of existing parking facilities, a parking management program could be implemented for the San Juan Waterfront parking facilities and other nearby parking structures. The management program should keep track of available parking spaces and convey this information to drivers. This program could improve the efficiency of parking usage and reduce the vehicles-miles travelled while looking for a parking space.
10.8 During Construction Phase 1 it is proposed to open Del Tren Steet to inbound traffic to Old San Juan in the morning and outbound in the afternoon. Also during both construction phases it is proposed to undertake the construction work during off-peak traffic periods, possibly night work.
10.9 The eastern most access to the Waterfront (Access F) is located in a curve. There are two safety factors that concur at this intersection that need proper sight distance design: one is the vehicle approaching from Fernández Juncos Avenue having limited visibility of the intersecting access; and the second is the visibility constrains of vehicles entering Fernández Juncos Ave. in the curve itself. On both instances it is important to ensure pedestrian safety considering the location of a signalized crossing immediately east of this access. In order to attend this issue, an acceleration lane is provided at this intersection for vehicles leaving the
13 Steer Davies Gleave has successfully completed a number of Behavioral Change Project achieving up to a 11% of car usage reduction

P:\Projects\220022~1\01\Work\SJW\Output\Report\San Juan Waterfront Masterplan Transport Assessment_5-review.doc
125
Waterfront. This lane only addresses the vehicular conflict issues. The pedestrian crossing must be actuated14 to guarantee dedicated pedestrian crossing time.
14 Pedestrian push bottom to request a protected signal phase.

P:\Projects\220022~1\01\Work\SJW\Output\Report\San Juan Waterfront Masterplan Transport Assessment_5-review.doc
Appendix
APPENDIX A
STUDY AREA PHOTOS

P:\Projects\220022~1\01\Work\SJW\Output\Report\San Juan Waterfront Masterplan Transport Assessment_5-review.doc
Appendix
APPENDIX B
TRAFFIC COUNTS, BUS AND JOURNEY TIME SURVEYS

P:\Projects\220022~1\01\Work\SJW\Output\Report\San Juan Waterfront Masterplan Transport Assessment_5-review.doc
Control Appendix
APPENDIX C
AVERAGE ANNUAL DAILY TRAFFIC ON THE PROJECT AREA

P:\Projects\220022~1\01\Work\SJW\Output\Report\San Juan Waterfront Masterplan Transport Assessment_5-review.doc
Appendix
APPENDIX D
TRIP GENERATION SPREADSHEETS

P:\Projects\220022~1\01\Work\SJW\Output\Report\San Juan Waterfront Masterplan Transport Assessment_5-review.doc
Appendix
APPENDIX E
PARAMICS DEMAND INPUTS

P:\Projects\220022~1\01\Work\SJW\Output\Report\San Juan Waterfront Masterplan Transport Assessment_5-review.doc
Appendix
APPENDIX F
PARAMICS OUTPUTS

P:\Projects\220022~1\01\Work\SJW\Output\Report\San Juan Waterfront Masterplan Transport Assessment_5-review.doc
Appendix
APPENDIX G
ACCIDENT DATA FOR THE SAN JUAN ISLETA

P:\Projects\220022~1\01\Work\SJW\Output\Report\San Juan Waterfront Masterplan Transport Assessment_5-review.doc
Control
CONTROL SHEET
Project/Proposal Name: SAN JUAN WATERFRONT MASTERPLAN
Document Title: Transport Assessment
Client Contract/Project Number:
SDG Project/Proposal Number: 22002201
ISSUE HISTORY
REVIEW
Originator: YMB
Other Contributors: MDR, ACM
Review By: Print: LSR, CZC
DISTRIBUTION
Clients: 1 Digital
Steer Davies Gleave: PR Office/Jonny
Issue No. Date Details
1 November 29 Final Draft
2 December 3 Final Draft_2
3 December 17 Final Draft_3
4 February 7 Final Draft_3 review
5 June 25 Final Draft_4
6 November 14 Final Report_5

P:\Projects\207010~1\Work\203554~1\Outputs\Reports\SAD3F5~1.DOC
Appendix
APPENDIX A
STUDY AREA PHOTOS
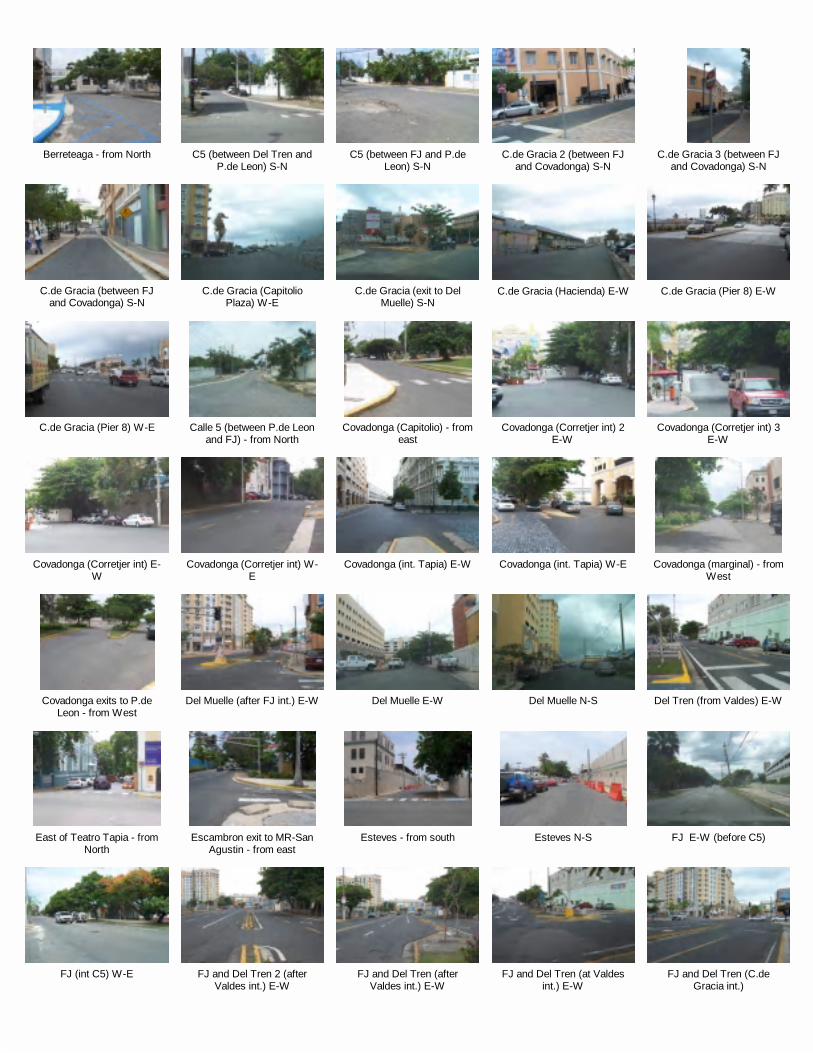
Berreteaga - from North C5 (between Del Tren and P.de Leon) S-N
C5 (between FJ and P.de Leon) S-N
C.de Gracia 2 (between FJ and Covadonga) S-N
C.de Gracia 3 (between FJ and Covadonga) S-N
C.de Gracia (between FJ and Covadonga) S-N
C.de Gracia (Capitolio Plaza) W-E
C.de Gracia (exit to Del Muelle) S-N
C.de Gracia (Hacienda) E-W C.de Gracia (Pier 8) E-W
C.de Gracia (Pier 8) W-E Calle 5 (between P.de Leon and FJ) - from North
Covadonga (Capitolio) - from east
Covadonga (Corretjer int) 2 E-W
Covadonga (Corretjer int) 3 E-W
Covadonga (Corretjer int) E-W
Covadonga (Corretjer int) W-E
Covadonga (int. Tapia) E-W Covadonga (int. Tapia) W-E Covadonga (marginal) - from West
Covadonga exits to P.de Leon - from West
Del Muelle (after FJ int.) E-W Del Muelle E-W Del Muelle N-S Del Tren (from Valdes) E-W
East of Teatro Tapia - from North
Escambron exit to MR-San Agustin - from east
Esteves - from south Esteves N-S FJ E-W (before C5)
FJ (int C5) W-E FJ and Del Tren 2 (after Valdes int.) E-W
FJ and Del Tren (after Valdes int.) E-W
FJ and Del Tren (at Valdes int.) E-W
FJ and Del Tren (C.de Gracia int.)

FJ and Valdes int. (from FJ) E-W
Gerardo Davila - from east Gerardo Davila N-S J.A. Corretjer S-N Matias Ledesma 2 (between FJ and piers) N-S
Matias Ledesma - from east Matias Ledesma (between FJ and P.de Leon) S-N
Matias Ledesma (between FJ and piers) N-S
Matias Ledesma (between P.de Leon and FJ) 2 - fro…
Matias Ledesma (between P.de Leon and FJ) - from …
Matias Ledesma (between P.de Leon and MR) - from …
Matias Ledesma (entre P. de Leon y FJ) - from North
Matias Ledesma (N-S view) MR 3 lanes (San Cristobal) 2 - from west
MR 3 lanes (San Cristobal) 3 - from east
MR 3 lanes (San Cristobal) - from east
MR - from east MR (East of Plaza Colon) S-N
MR (parque) - from west MR access to Escambron - from west
MR approaching Plaza Colon 2 - from East
MR approaching Plaza Colon - from East
MR east of Plaza Colon 3 - from North
MR east of Plaza Colon 2 - from North
MR east of Plaza Colon - from East
MR int. Esteves - from East MR int. Gerardo Davila - from East
MR int. San Agustin - from East
MR north of Plaza Colon - from East
MR U turn to P.de Leon 2 - from West
MR U turn to P.de Leon 3 - from North
MR U turn to P.de Leon - from West
MR-Casa Espana 1 - from West
MR-Casa Espana 2 - from East
P.de Leon 2 - from West

P.de Leon 3 - from West P.de Leon - approaching Gerardo Davila int. - from …
P.de Leon - Covadonga - from West
P.de Leon - from east P.de Leon - from West
P.de Leon - South of Plaza Colon - from east
P.de Leon (after Plaza Colon) 2 - from West
P.de Leon (after Plaza Colon) 3 - from West
P.de Leon (after Plaza Colon) - from West
P.de Leon (Capitolio) - from West
P.de Leon (parque) 2 - from west
P.de Leon (parque) 3 - from west
P.de Leon (parque) - from west
P.de Leon (South of Plaza Colon) W-E
P.de Leon access to MR-2 - from West
P.de Leon access to MR - from West
P.de Leon after Gerardo Davila - from West
P.de Leon approaching Covadonga - from West
P.de Leon int. Gerardo Davila 2 - from West
P.de Leon int. Gerardo Davila - from West
P.de Leon U turn to MR 2 - from North
P.de Leon U turn to MR - from East
P.de leon union con marginal Covadonga - fro…
P.de Leon, union con Covadonga - from west
Pelayo - from East
Pelayo (between P.de Leon and MR) - from south
Pelayo (between P.de Leon and S. Agustin) - from North
Pelayo N-S Pelayo N-S 2 Ramon Power (between FJ and P.de Leon) S-N
Ramon Power (between P.de Leon and FJ) 2 - fro…
Ramon Power (between P.de Leon and FJ) - from …
S. Agustin (between MR and P.de Leon) - from south
S. Agustin (between MR and P.de Leon) - from south 2
S. Andres (between FJ and pier 10) N-S

S. Andres (from FJ) S-N S. Andres and FJ int. (from S. Andres) N-S
S.J. Bautista (entre MR y P. de Leon) - N-S
San Agustin (between MR and P.de Leon) N-S
SJ Bautista 2 (between FJ and S. Agustin) S-N
SJ Bautista (between FJ and piers) N-S
SJ Bautista (between FJ and S. Agustin) S-N
Valdes (int. FJ and Del Tren) S-N
Valdes S-N

Access from Calle 5 to Fernandez Juncos Ave
Access to AMA Exclusive Lane
Access to Del Tren Street Access to Del Tren_AMA Exclusive Lane
Access to San Juan
Access to San Juan _3 Access to San Juan Bautista Street
Access to San Juan_2 Access to Valdes St Access to Valdes Street
Almacen Capitolio - Sign Almacenes Superintendencia Capitolio
AMA Exclusive Del Tren Street
AMA Exclusive Del Tren Street_2
AMA Exclusive Del Tren Street_3
AMA Exclusive Del Tren Street_4
AMA Exclusive Del Tren Street_5
AMA Exclusive Del Tren Street_6_Int Calle 5
AMA Exclusive Del Tren Street_7
AMA Exclusive Del Tren Street_8
AMA Exclusive Del Tren Street_9
AMA Exclusive Del Tren Street_10
AMA Exclusive Del Tren Street_11_Int Ramon Power
AMA Exclusive Del Tren Street_12
AMA Exclusive Del Tren Street_13
AMA Exclusive Del Tren Street_14
AMA Exclusive Del Tren Street_15
AMA Exclusive Del Tren Street_16_Int Matias Lede…
AMA Exclusive Del Tren Street_17
AMA Exclusive Del Tren Street_18
AMA Exclusive Del Tren Street_19
AMA Exclusive Del Tren Street_20
AMA Exclusive Del Tren Street_21
AMA Exclusive Del Tren Street_22
AMA Exclusive Del Tren Street_23_Int Calle Valdes


