SAN ONOFRE NUCLEAR GENERATING STATION
UNITS 2 AND 3
Pressurizer Safety Valve Operability and
Safety Valve Discharge Piping Adequacy Report
June, 1982
8207020352 820629 PDR ADOCK 05000361 P PDR
Pressurizer Safety Valve Operability
and
Safety Valve Discharge Piping Adequacy
for
San Onofre Units 2 and 3
Table of Contents
Page
PART A - INTRODUCTION A-i
1.0 OBJECTIVE A-1
2.0 BACKGROUND A-1
3.0 SUMMARY A-2
4.0 CONCLUSION A-4
5.0 REFERENCES A-4
PART B - SAFETY VALVE OPERABILITY B-i
1.0 PURPOSE B-1
2.0 GENERAL APPROACH B-1
3.0 EPRI/C-E SAFETY VALVE TEST PROGRAM B-1
3.1 Test Facility Description B-1
3.1.1 Introduction B-2
3.1.2 Test Loop Layout B-2
3.1.3 Piping Supports B-2
3.1.4 Instrumentation B-3
3.2 Testing Procedure B-3
3.2.1 Steam Tests With High Pressure Ramp Rate B-4
3.2.2 Steam Tests With Low Pressure Ramp Rate B-4
3.2.3 Water Tests B-4
3.2.4 Steam-Water Transition Tests B-4
ii
Page
3.3 Dresser Safety Valve.Model 31709NA Tests B-5
3.3.1 Introduction B-5
3.3.2 Valve Description B-5
3.3.3 Valve Adjusting Ring Description B-5
3.3.4 Inlet Piping Arrangement B-6
3.3.5 Test Conditions B-6
3.3.5.1 Fluid Conditions B-6
3.3.5.2 Valve Adjusting Ring Settings B-7
3.3.5.3 Test Backpressure B-7
3.3.6 Test Results B-7
3.3.6.1 Introduction B-7
3.3.6.2 Steam Tests B-8
3.3.6.3 Transition Tests B-8
3.3.6.4 Water Tests 8-8
3.3.6.5 Valve Inspection Results B-9
3.3.6.6 Valve Discharge Flange Bending Moments B-10
3.3.7 Discussion of Test Results B-10
3.3.7.1 Valve Adjusting Ring Settings 8-10
3.3.7.2 Blowdown vs. Backpressure B-11
3.3.7.3 Water and Steam-Water Tests B-12
4.0 SAN ONOFRE UNITS 2 AND 3 SAFETY VALVES B-38
4.1 Description B-38
4.2 Valve Adjusting Ring Settings B-38
4.3 Installation B-39
4.4 Inlet Fluid Conditions B-39
4.4.1 FSAR Pressurization Events B-39
4.4.2 High Pressure Injection Events B-39
4.4.3 Cold Overpressurization Events B-40
4.5 Backpressure B-40
111
(0 Page
5.0 APPLICABILITY OF EPRI/C-E TESTS TO SAN ONOFRE UNITS 2 AND 3 VALVES B-43
5.1 Valve Type B-43
5.2 Valve Adjusting Ring Settings B-43
5.3 Inlet Piping Configuration B-43
5.4 Inlet Flud Conditions B-44
5.5 Backpressure 8-45
5.6 Valve Discharge Flange Bending Moment B-46
6.0 ACCEPTABILITY OF SAN ONOFRE UNITS 2 AND 3 SAFETY VALVES' RANGE OF EXPECTED BLOWDOWNS B-47
6.1 High Blowdown B-47
6.2 Low Blowdown B-48
r 7.0 SUMMARY B-48
8.0 CONCLUSION B-50
9.0 REFERENCES 8-50
Appendix B-1 Comparison of the San Onofre Units 2 and 3 Safety Valve
Inlet Piping and EPRI/C-E Test Valve Inlet Piping B-1-1
Appendix B-2 Justification for Increased San Onofre Units 2 and 3 Safety
Valve Blowdown B-2-1
PART C - SAN ONOFRE UNITS 2 AND 3 SAFETY VALVE DISCHARGE PIPING ADEQUACY
1.0 PURPOSE C-1
2.0 GENERAL APPROACH C-1
2.1 Thermal-Hydraulic Analysis C-1
2.2 Piping Structural Analysis C-1
iv
Page
3.0 EPRI TEST PROGRAM C-5
4.0 SAN ONOFRE UNITS 2 AND 3 SAFETY VALVE DISCHARGE PIPING ARRANGEMENT C-11
4.1 Physical Description C-11 4.2 Function of System C-11
5.0 APPLICABILITY OF EPRI TESTS TO SAN ONOFRE UNITS 2 AND 3 SAFETY VALVE C-17
DISCHARGE PIPING
5.1 Comparisons of RELAP 4/ANSYR, RELAP 5 and Test Results C-18
5.2 Summary of the Comparison Results C-19
6.0 EVALUATION OF SAN ONOFRE UNITS 2 AND 3 SAFETY VALVE DISCHARGE PIPING C-28
6.1 Forcing Functions Obtained from RELAP 4/ANSYR C-28
6.2 Structural Response Analysis of San Onofre Units 2 and 3 C-30 Safety Valve Discharge Piping System
6.2.1 Mathematic Model C-30
6.2.2 Loading Conditions C-31
6.2.3 Loading Combinations and Applicable Codes C-32
6.2.4 Results of Piping Structural Analysis C-33
7.0 SUMMARY C-61
8.0 CONCLUSIONS C-62
9.0 REFERENCES C-63
V
Part A - INTRODUCTION
Table of Contents
Page
1.0 OBJECTIVE A-1
2.0 BACKGROUND A-1
3.0 SUMMARY A-2
4.0 CONCLUSION A-4
5.0 REFERENCES A-4
A-ii
PRESSURIZER SAFETY VALVE OPERABILITY AND SAFETY VALVE
DISCHARGE PIPING ADEQUACY FOR SAN ONOFRE UNITS 2 AND 3
PART A - INTRODUCTION
1.0 OBJECTIVE
A preliminary evaluation supporting pressurizer safety valve
operability for San Onofre Generating Station Units 2 and 3 was
submitted to the Nuclear Regulatory Commission on April 1, 1982. That submittal committed to provide a final evaluation
regarding both safety valves and discharge piping adequacy by
July 1, 1982. The objective of the report is to provide a
detailed evaluation demonstrating the operability of San Onofre
Units 2 and 3 as-installed pressurizer safety valves and the
adequacy of the safety valve discharge piping consistent with
the July 1, 1982 commitment. The evaluation is based on applying
results from the EPRI/C-E Safety and Relief Valve Test Program.
Safety valve operability is discussed in Part B of this report
and the adequacy of safety valve discharge piping and supports
is treated in Part C.
2.0 BACKGROUND
In the aftermath of the Three Mile Island (TMI) accident, the
Nuclear Regulatory Commission issued requirements that utilities
operating and constructing pressurized water reactor (PWR)
power plants demonstratethe operability of pressurizer safety
and relief valves and the structural adequacy of the discharge
piping and supports. These requirements were promulgated in
NUREG-0578 (Reference 1) and NUREG 0660 (Reference 2), and
further clarified in NUREG-0737 (Reference 3). At the request
of utilities with PWRs, EPRI developed and implemented a generic
test program for pressurizer power operated relief valves and
safety valves (Reference 4). Southern California.Edison Company
was one of the utilities sponsoring the EPRI Valve Test Program.
One phase of the test program, the testing of safety valves,
A-1
was implemented at a test facility at the Windsor, Connecticut
site of Combustion Engineering, Inc., (C-E). The facility was
specifically erected for the safety valve tests. The portion
of the EPRI Valve Test Program performed at the C-E site is
herein designated as the EPRI/C-E Safety Valve Test Program.
3.0 SUMMARY
In this report, the EPRI/C-E Safety Valve Test Program is
described (including a brief description of the test facility),
tests of the Dresser Model 31709NA safety valve are detailed,
and a summary of the test results is provided. The San Onofre
Units 2 and 3 safety valves and safety valve discharge piping
installation.were compared to the EPRI/C-E test results and
evaluated relative to applicability to the San Onofre Units 2
and 3 system.
Demonstration of safety valve operability is based on the
following:
1. The same model safety valve (Dresser 31709NA), as provided
for San Onofre Units 2 and 3 was tested in the EPRI/C-E
Safety Valve Test Program.
2. The identical safety valve adjusting ring settings used
for the San Onofre Units 2 and 3 safety valves were tested.
3. Based on a combination of test data and analysis, the San
Onofre Units 2 and 3 valve inlet piping configuration was
shown to enhance the stability of valve operation relative
to the EPRI/C-E test valve inlet configuration.
4. The range of valve inlet fluid conditions used in the
testing either enveloped or were basically equivalent to
the corresponding conditions estimated for the San Onofre
Units 2 and 3 safety valves.
A-2
5. The maximum calculated bending moment at the San Onofre
Units 2 and 3 valve discharge flange was significantly
lower than the maximum measured value for the test valve.
6. The range of blowdowns expected for San Onofre Units 2 and
3 was based on the EPRI/C-E test backpressure vs. blowdown
data. This range included a +2% valve manufacturer's
recommended tolerance and was shown to be compatible with
steam fluid conditions at the valves' inlets and with
stable valve operation.
The structural adequacy of the San Onofre Units 2 and 3 safety
valve discharge piping installation was evaluated as follows:
1. The RELAP 4/ANSYR Code was used to generate fluid transient
responses and piping dynamic forcing functions during
safety valve operation for a model of an EPRI/C-E test
sample.
2. The RELAP 4/ANSYR results were compared with those of a
RELAP 5/MOD 1 analysis of the same EPRI/C-E test. The
comparison showed that the transient responses were in
agreement and that the piping dynamic forcing functions
showed the same trends, with the RELAP 4/ANSYR results
being more conservative. Thus,.the validity of the use of
the RELAP 4/ANSYR code for safety valve discharge piping
analyses was established, since the validity of RELAP 5/MOD
1 had been previously demonstrated based on comparisons
with EPRI/C-E test results.
3. The RELAP 4/ANSYR Code was then used to analyze a model of
the San Onofre Units 2 and 3 safety valve discharge piping
system to generate dynamic forcing functions during safety
valve discharge. Three cases with different valve operating
sequences were analyzed.
A-3
4. Using the calculated dynamic forcing functions as input,
the ANSYS piping code was used to determine the resulting
stress levels.
4.0 CONCLUSION
The EPRI/C-E Test Results for the Dresser 31709NA Safety Valve, in
conjunction with the Part B evaluation, demonstrate the satisfactory
operability of the San Onofre Units 2 and 3 safety valves.
The results of the analysis of the San Onofre Units 2 and 3 discharge
piping and supports, discussed in Part C of this report, demonstrate
that the installation is structurally adequate.
5.0 REFERENCES
1. NUREG-0578, TMI-2 Lessons Learned Task Force Status Report and Short
Term Recommendations, Nuclear Regulatory Commission, July 1979.
2. NUREG-0660, Nuclear Regulatory Commission Action Plan Developed as a
Result of the TMI-2 Accident, May 1980.
3. NUREG-0737, Clarification of TMI Action Plan Requirements, Nuclear
Regulatory Commission, November 1980.
4. Program Plan for the Performance Testing of PWR Safety and Relief
Valves, Revision 1, July 1, 1980, by Electric Power Research Institute,
Nuclear Power Division.
A-4
Part B - SAFETY VALVE OPERABILITY
Table of Contents
Page
1.0 PURPOSE B-1
2.0 GENERAL APPROACH B-1
3.0 EPRI/C-E SAFETY VALVE TEST PROGRAM B-1
3.1 Test Facility Description B-1
3.1.1 Introduction B-2
3.1.2 Test Loop Layout B-2
3.1.3 Piping Supports B-2
3.1.4 Instrumentation B-3
3.2 Testing Procedure B-3
3.2.1 Steam Tests With High Pressure Ramp Rate B-4
3.2.2 Steam Tests With Low Pressure Ramp Rate B-4
3.2.3 Water Tests B-4
3.2.4 Steam-Water Transition Tests B-4
3.3 Dresser Safety Valve Model 31709NA Tests B-5
3.3.1 Introduction B-5
3.3.2 Valve Description B-5
3.3.3 Valve Adjusting Ring Description B-5
3.3.4 Inlet Piping Arrangement B-6
3.3.5 Test Conditions B-6
3.3.5.1 Fluid Conditions B-6
3.3.5.2 Valve Adjusting Ring Settings B-7
3.3.5.3 Test Backpressure B-7
3.3.6 Test Results B-7
3.3.6.1 Introduction B-7
3.3.6.2 Steam Tests B-8
3.3.6.3 Transition Tests B-8
3.3.6.4 Water Tests B-8
3.3.6.5 Valve Inspection Results B-9
3.3.6.6 Valve Discharge Flange Bending Moments B-10
B-ii
Page
3.3.7 Discussion of Test Results B-10
3.3.7.1 Valve Adjusting Ring Settings B-10
3.3.7.2 Blowdown vs Backpressure B-11
3.3.7.3 Water and Steam-Water Tests B-12
4.0 SAN ONOFRE UNITS 2 AND 3 SAFETY VALVES B-38
4.1 Description B-38
4.2 Valve Adjusting Ring Settings B-38
4.3 Installation B-39
4.4 Inlet Fluid Conditions B-39
4.4.1 FSAR Pressurization Events B-39
4.4.2 High Pressure Injection Events B-39
4.4.3 Cold Overpressurization Events B-40
4.5 Backpressure B-40
5.0 APPLICABILITY OF EPRI/C-E TESTS TO SAN ONOFRE UNITS 2 AND 3 VALVES B-43
5.1 Valve Type B-43
5.2 Valve Adjusting Ring Settings B-43
5.3 Inlet Piping Configuration B-43
5.4 Inlet Fluid Conditions B-44
5.5 Backpressure B-45
5.6 Valve Discharge Flange Bending Moment B-46
6.0 ACCEPTABILITY OF SAN ONOFRE UNITS 2 AND 3 SAFETY VALVES RANGE OF EXPECTED BLOWDOWNS B-47
6.1 High Blowdown B-47
6.2 Low Blowdown B-48
7.0 SUMMARY B-48
8.0 CONCLUSION B-50
B-i4i
Page
9.0 REFERENCES B-50
Appendix B-1 Comparison of the San Onofre Units 2 and 3 Safety Valve
Piping and EPRI/C-E Test Valve Inlet Piping B-1-1
Appendix B-2 Justification for Increased San Onofre Units 2 and 3 Safety
Valve Blowdown 8-2-1
B-iv
List of Tables
Page
3.1 Instrumentation List - EPRI Safety/Relief Valve B-13 thru
Test Project B-17
3.2 Summary of Instrumentation Characteristics B-18 thru
B-19
3.3 Dresser Model 31709NA Safety Valve Parameters B-20
3.4 Dresser Model 31709NA Safety Valve Test Inlet
Piping Data B-21
3.5 EPRI/C-E Safety Valve Test Data B-22 thru
B-24
B-v
List of Figures
Page
3.1 EPRI/C-E Test Loop Isometric B-25
3.2 Base Loop and Short Vertical Inlet Configuration B-26
3.3 Test Valve Support Stand B-27
3.4 Test Loop Support at Second Discharge Elbow B-28
3.5 Test Loop Support at Third Discharge Elbow B-29
3.6 Test Instrumentation Diagram - EPRI/C-E Safety and Relief
Valve Test Facility B-30
3.7 Test Valve Instrumentation B-31
3.8 Piping Response Instruments B-32
3.9 Dresser Model 31709NA Safety Valve B-33
3.10 Dresser Model 31709NA Safety Valve Adjusting Rings B-34
3.11 EPRI/C-E Test Facility Inlet Piping Configuration
for the Dresser 31709NA Safety Valve B-35
3.12 EPRI/Dresser 31709NA Test Results - Blowdown vs Builtup
Backpressure B-36
3.13 EPRI/Dresser 31739A Test Results - Blowdown vs
Builtup Backpressure B-37
4.1 San Onofre Units 2 and 3 Safety Valve Ring Adjustments B-41
4.2 San Onofre Units 2 and 3 Pressurizer Safety Valve
Inlet Piping Configuration B-42
B -vA*
PART B - SAFETY VALVE OPERABILITY
1.0 PURPOSE
The purpose of this section of the report is to demonstrate the
operability of the San Onofre Units 2 and 3 pressurizer safety
valves based on test results from the EPRI/CE Safety Valve Test
Program.
2.0 GENERAL APPROACH
A general review of the as-installed San Onofre Units 2 and 3
pressurizer safety valves, including the geometry of the inlet
and discharge piping, was conducted. The valve model and type
were identified and.compared with the valves tested in the
EPRI/CE test program to determine that one of the test valves
was representative of the San Onofre Units 2 and 3 valves. The
fluid conditions under which the representative valve design
was tested were reviewed to ensure that the test fluid conditions
were representative of the conditions prescribed in the San
Onofre Units 2 and 3 FSAR as well as conditions resulting from
Extended High Pressure Injection and Cold Overpressurization
events. The San Onofre Units 2 and 3 safety valve inlet and
discharge piping arrangement was compared to the arrangement of
the test valve piping arrangement. The test data were evaluated
and their applicability to the San Onofre Units 2 and 3 project
was assessed. Based on this assessment, conclusions regarding
San Onofre Units 2 and 3 safety valve operability were developed.
3.0 EPRI/CE SAFETY VALVE TEST PROGRAM
3.1 Test Facility Description
B-1
3.1.1 Introduction
The test facility for the EPRI/C-E PWR Safety Valve Test Program
is located at C-E's Kreisinger Development Laboratory in Windsor,
Connecticut. Reference 1 provides a detailed description of
the facility. A summary description is provided below.
3.1.2 Test Loop Layout
The layout of the test loop is shown in Figures 3.1 and 3.2.
The valve inlet piping configuration was varied, depending upon
the specific valve being tested. The valve inlet piping config
uration shown (the short vertical inlet) is the configuration
used for testing the Dresser Model 31709NA safety valve. A
loop seal inlet configuration could be installed for use in
other tests. This test loop is capable of steam, water and
transition (steam-to-water) flow tests. Tank 1 (500 ft 3
serves as a surge vessel where liquid and/or steam inventory
can simulate the thermal-hydraulic conditions in a PWR pres
surizer. Tank 2 (1150 ft 3) serves as the driver vessel through
expansion or evaporation of its contained fluid. A recirculation
pump and heaters are provided for each tank to maintain thermo
dynamic conditions in the tanks. Additional flow capacity is
available by supplementing accumulator capacity with that of
the test facility boiler rated at 150,000 lb/hr. This steam
flow can be used either directly, or as a driving head, to push
water through the test valve. Valve SW-3 permits variation of
the backpressure up to 1000 psig during testing. A line contain
ing a rupture disc is provided to prevent overpressurization of
the discharge piping should the leak check isolation valve,
SW-2, be inadvertently left closed during a test.
3.1.3 Piping Supports
The test loop piping supports were designed to limit the peak
dynamic response amplification to 110% of the hydraulic forcing
B-2
function peak value, so that extremely rigid dynamic support
structures were designed for the test valve stand and test
valve discharge piping. The test valve stand (Figure 3.3) allows
most of the shear and moment at the test valve inlet flange to
be transmitted through a pair of linkage assemblies. In addition
to the test valve stand, discharge pipes supports were provided
at the second discharge elbow, midway between the second and
third discharge elbows, and at the third discharge elbow.
Figures 3.4 and 3.5 show the structural support at the second
and third discharge elbows, respectively. At the second dis
charge elbow, the pipe is restrained vertically and horizontally
using hydraulic snubbers. In the course of the test program,
the hydraulic snubbers were replaced by solid members to facili
tate interpretation of the pipe response data. The support
structure midway between the second and third discharge elbows
includes hydraulic snubbers and the support restricts out-of-plane
vibration of this relatively long section of pipe. The support
at the third elbow allows free in-plane horizontal motion but
is rigid vertically.
3.1.4 Instrumentation
The test instrumentation provided in the valve test facility is
listed in Tables 3.1 and 3.2. The test instrumentation provided
the basic data for assessing valve operability and determining
valve and piping reaction forces. Necessary process instru
mentation was also provided to aid in loop operation and in
monitoring equipment performance. The location of the test
instrumentation in the test loop is shown on Figures 3.6, 3.7
and 3.8. A detailed description of the test loop instrumen
tation is provided.in Reference 1
3.2 Testing Procedure
The general procedure for valve testing was to raise the pres
sure at a prescribed rate to lift the valve, starting from a
valve inlet pressure below the valve opening setpoint.
B-3
The installed instrumentation recorded the valve behavior as it
lifted, discharged, and closed. For each valve tested, runs
were made with different valve adjusting ring settings, pressure
ramp rates, backpressures, and inlet fluid conditions. The
inlet fluid conditions tested were steam, water, and steam-to-water
transition. The detailed procedure varied, depending upon the
inlet fluid conditions being tested.
A valve leakage test was run prior and subsequent to each valve
lift test. Safety valve opening set points were checked frequently
throughout the test.
3.2.1 Steam Tests with High Pressure Ramp Rate
Tanks 1 and 2 were filled with steam and isolated from each
other. Tank 1 pressure was about 2300 psia while Tank 2 was at
about 2950 psia. Valve lift was initiated by opening the
isolation valve between the tanks.
3.2.2 Steam Tests with Low Pressure Ramp Rate
Tank 1 was isolated from Tank 2 and filled with steam at about
2300 psia. Steam from the boiler was fed to Tank 1 to raise
pressure at the desired low ramp rate to lift the valve.
3.2.3 Water Tests
Tank 1 was filled and Tank 2 partially filled with water at the
required test temperature. With the isolation valve between
the tanks open, steam from the boiler was supplied to Tank 2 to
raise the pressure to lift the safety valve on water.
3.2.4 Steam - Water Transition Tests
Tanks 1 and 2 were partially filled with saturated water at
2300 psia. The isolation valve between the tanks was in the
B-4
open position. Boiler steam was fed to Tank 2 to raise the
pressure to lift the safety valve on steam. Safety valve lift
resulted in the flow of water from Tank 2 to Tank 1. Eventually, Tank 1 filled with water and the safety valve inlet fluid
changed from steam to water.
3.3 Dresser Safety Valve Model 31709NA Tests
3.3.1 Introduction
Since Dresser safety valves are provided in a number of PWRs, two different models (Dresser Models 31709NA and 31739A) were
included in the EPRI/C-E Safety Valve Test Program. The tests
on Model 31709NA are particularly relevant to San Onofre Units
2 and 3 since this particular model is provided on San Onofre
Units 2 and 3.
3.3.2 Valve Description
The Dresser Model 31709NA safety valve is a direct-acting
spring-loaded valve, with an enclosed bonnet and a balanced
bellows to minimize the effect of the superimposed back pressure.
The valve is provided with valve adjusting rings, described in
the next section, which allow adjustments in valve performance
characteristics. Valve parameters are listed in Table 3.3 and
an illustration of the valve is provided in Figure 3.9.
3.3.3 Valve Adjusting Ring Description
The valve is equipped with three adjusting rings; lower, middle,
and upper (Figure 3.10). The flow distribution,and the static
and dynamic pressures in the valve, and thus, valve performance
characteristics, can be changed by adjustment of these rings.
The position of the lower adjusting rings defines the huddle
chamber and the size of the secondary orifice. The appropriate
lower ring setting serves to eliminate valve simmer and causes
B-5
the valve to pop open quickly at the popping pressure. The
lower ring also provides a cushioning effect to preclude seat
damage when the valve closes. The middle ring setting, in
conjunction with that of the lower ring, affects the amount of
valve lift achieved as well as the closing pressure. The upper
ring provides a capability for adjustment to assure valve lift
and capacity are obtained even at high back pressure.
The positions of the adjusting rings are locked by means of
adjusting ring pins. These pins are threaded into the valve
body. The pins engage notches which are cut into the rings.
To adjust a ring, the corresponding ring pin is removed and a
screwdriver is used to turn the rings. The detailed procedure
for valve ring adjustment is described in Reference 2.
3.3.4 Inlet Piping Arrangement
Information on the inlet piping arrangement used in the tests
of the Dresser Model 31739NA safety valve is provided in Figure
3.11 and Table 3.4.
3.3.5 Test Conditions
The basis for the selection of the test conditions for the
EPRI/C-E safety valve tests is described in Reference 3.
3.3.5.1 Fluid Conditions
The Model 31709NA safety valve was tested under various fluid
conditions as follows:
Fluid Condition Test Numbers
Steam 603, 606, 611, 614, 615, 618, 620, 1305
Steam-to-Water Transition 623, 628
Subcooled Water (4290 F - 5890 F) 625, 630, 1308, 1311
B-6
A detailed tabulation of the test fluid conditions is included
in Table 3.5. Table 3.5 is a test summary obtained from Reference
4. However, it should be noted that only steam conditions are
applicable to the San Onofre Units 2 and 3 valves, as described
in Section 5.4.
3.3.5.2 Valve Adjusting Ring Settings
Analysis of the results of a preliminary valve test led to the
conclusion that increased valve blowdown was associated with
improved valve behavior. The testing of the Dresser 31709NA
safety valve was performed using valve adjusting ring settings
which resulted in blowdowns somewhat greater than 5%. The
various adjusting ring settings used for the Dresser Model
31709NA valve tests are included in Table 3.5.
3.3.5.3 Test Backpressure
Since the backpressure developed at the safety valve outlet is
considered a primary parameter affecting valve performance,
safety valves were tested over a range of backpressures expected
at PWR plants.
The Dresser 31709NA safety valves was tested at backpressures
ranging between 174 psia and 530 psia. Refer to Table 3.5 for
the detailed data.
3.3.6 Test Results
3.3.6.1 Introduction
The results of the Dresser Model 31709NA valve tests are sum
marized in Table 3.5. The percent blowdown listed in the table
was calculated based on the design setpoint pressure of 2500
psig. Alternatively, the percent blowdown calculation could
have been based on the actual valve opening pressure. Fourteen
tests were performed using the short inlet pipe configuration
(Figure 3.11). Each of the tests was performed with the valve
B-7
adjusting ring positions established by Dresser based on pre
vious EPRI/C-E test experience obtained on the smaller Dresser
31739A safety valve. Test results are summarized in the fol
lowing sections.
3.3.6.2 Steam Tests
A total of eight steam tests was performed with high and low
ramp rates, varying back pressures from 174 to 530 psia and
three different middle ring positions. Neither the valve upper
or lower ring position was changed during these tests. For all
of these tests, the valve opened within +3% of the valve design
set pressure and exhibited stable performance. In tests where
the inlet pressure accumulated to 6% above the valve design set
pressure, the valve achieved rated lift. Valve blowdown varied, depending on the position of the middle ring and the back
pressure. Generally, the valve blowdown decreased as the back
pressure increased and as the middle ring was adjusted to
higher test positions. Blowdown ranged from a maximum of 14.2%
(at low backpressures) to a minimum of 7.5% (at high backpres
sures).
3.3.6.3 Transition Tests
Two steam-to-water transition tests with an intermediate back
pressure (approximately 400 psia) were performed using the
highest and lowest middle ring positions of the steam tests.
For both tests, the valve opened within +3% of the valve design
set pressure and exhibited stable performance. The valve
blowdown ranged from 17.0% to 18.5%.
3.3.6.4 Water Tests
Four water tests were performed with an intermediate back
pressure at nominal water temperatures of 650, 550 and 400 0F.
B-8
During the two 650'F water tests performed, which used the
highest and lowest middle ring positions of the steam tests,
the valve opened at system pressures of 2393 to 2412 psia and
exhibited stable performance. Valve blowdowns ranged from 16.3
to 22.6%.
The two subsequent water tests (550 0 F and 400 0F) were performed
using the highest middle ring position. For both tests, the
valve opened at a system pressure within +3% of the valve
design set pressure. During the 550 0 F water test, the valve
opened, showed stable behavior, and closed with 4.0% blowdown.
During the 4000 F water test, the valve opened at 2558 psia and
exhibited five partial lift cycles over a period of three
seconds. The valve then opened fully and chattered. Three
seconds later in the transient, the valve stopped chattering
without manual actuation and then closed. After the transient,
a steam leakage test was attempted. The valve partially opened
at which point the leak test was terminated.
3.3.6.5 Valve Inspection Results
The valve was disassembled and inspected five times in the
course of the test.series. Even though the following observa
tions were detected upon inspection, the valve operations were
not impaired. Excessive post-test leakage was the reason for
the inspection in two cases, both after high pressurization
rate steam tests. In the first case, at the beginning of the
series, the leakage was due to an elongation of the bellows
nose which eliminated the clearance between the valve disc and
disc holder. According to the manufacturer it was a normal
occurrence for a new bellows. The thickness of the disc holder
was reduced to reestablish the clearance. In the second case,
light scratches were found across the seals. In the third
case, also after a high pressurization rate steam test, the
thrust bearing and adapter were found to be galled. The apparent
B-9
reason for the galling was that the outer surface of the spacer
was allowed to come in contact with the inner surface of the
adapter. The thrust bearing adapter was remachined. The lower
lip of the disc holder was also machined to reestablish the gap
between the disc and disc holder.
After the 6500 F water test, the valve condition was found to be
acceptable. In all the cases, the seat surfaces were lapped
prior the valve reassembly. After the 4000 F test, galled
guiding surfaces and several damaged internal parts were found;
the bellows assembly was ruptured, the seating area of the disc
was collapsed, the disc holder was fused inside the guide and
the bushing seating surface had deformed.
3.3.6.6 Valve Discharge Flange Bending Moments
During the valve testing program, the induced bending moments
at the valve discharge flange during valve opening and closing
were measured. These measurements were used to evaluate the
effect of discharge piping on value operability (see Section
5.6). The maximum bending moment measured during the steam
tests of the Dresser 31709NA safety valve was 200,200 inch-lbs.
For the water and steam-water transition tests, the maximum
bending moment measured was 473,200 inch-lbs. The test results
(see Table 3.5) indicated that these loadings did not impair
the operability of the valve.
3.3.7 Discussion of Test Results
3.3.7.1 Valve Adjusting Ring Settings
In a preliminary valve test in which a long inlet pipe was
used, unstable valve operation (chattering) was noted. The
measured valve opening time (16 milliseconds) was considerably
shorter than expected (40 to 60 milliseconds) by the valve
manufacturer, and a sharp drop in valve inlet pressure occurred
B-10
as the valve opened. Factors which were considered as contri
buting to the valve instability were the long length of the
inlet piping, the rapid valve opening time, and a valve ring
adjustment to provide a relatively short blowdown (i.e., less
than 5%). To avoid the instability problem, all further tests
were performed using the shortest practical inlet line and
valve ring adjustments to produce increased blowdown.
Table 3.5 includes the different ring settings used in the
tests. The shorter inlet piping minimized the drop in valve
inlet pressure as the valve opened while the valve ring ad
justment for increased blowdown served to de-sensitize the
valve response to a drop in valve inlet pressure. However, excessive safety valve blowdown in the plant may result in a
transition from steam flow to water flow through the valves.
Since the safety valves, inlet piping, discharge piping and
supports are designed for steam discharge only, the magnitude
of the blowdown must be bounded to maintain the original design
fluid condition at the valve inlet. Therefore, one of the
objectives of the valve testing was to determine optimum valve
ring adjustments which provided stable valve operation without
excessive blowdown.
3.3.7.2 Blowdown vs. Backpressure
The EPRI tests of the Dresser 31709NA safety valves showed that
blowdown increased with decreasing builtup backpressure. The
data for the steam tests for different ring settings is plotted
in Figure 3.12 . Figure 3.13 is an analogous plot of test
results for the smaller Dresser 31739A valve, which shows a
similar backpressure - blowdown relationship. It can be con
cluded that (at least in the range tested) the blowdown de
creases as the middle adjusting ring is raised to a higher
position, provided the other adjustment rings remain fixed.
B-11
3.3.7.3 Water and Steam-Water Tests
Since the San Onofre Units 2 and 3 safety valves are not expected
to be exposed to water or steam-water transition conditions,
the test data for these conditions are .not evaluated in this
report.
B-12
Instrumentation List EPRI Safety/Relief Valve lest Project
DAS INSIR. CHAN. DESCRIPTION CLASSIFICATION RANGE MAX fREQUENCY 111z)
PDT 01 01 Differential Pressure Drum I Inlet to Drum 2 Inlet Test 0-1500 psid 20 POT 02 02 Differential Pressure Drum 1 to Upstream of lest Valve lest 0-100 psid 20 PDT 03 03 Differential Pressure Test Valve Discharge to 2nd Discharge Elbow Test 0-150 psid 20 PDT 04 04 Differential Pressure 2nd Discharge Elbow to Upstream of SW-2 lest 0-100 psid 20 PDT 05 05 Differential Pressure Across Back Pressure Valves(SW-34 SI-2) Test 0-1000 psid 20 PDT 06 06 Differential Pressure Downstream SW-3 to Atmosphere Test 0-300 psid 20 PDT 07 07 Differential Pressure Discharge Pipe Exit Nozzle to Atmosphere Test 0-100 psid 200 PT 08 08 Pressure Valve Exit lest 0-1500 psia 20 PT 09 09 Pressure First Horizontal Run Discharge Pipe lest 0-1500 psia 200 PT 10 10 Pressure Vertical Discharge Run (inlet 2nd elbow) Test 0-1500 psia 200 PT 11 12 Pressure Upstream of SW-2 Test 0-1500 psia 200 PT 12 12 Pressure lest Valve Inlet lest 0-3500 psis 500 E 13 13 Surface Temperature st m C- Test 0-00 F 2 oo ID 14 14 Surface Temperature Tpstp Vev xTC-2 Test 0-Ams f 2 TE 15 15 Surface Temperature Test Valve ETCx3 Test 0-800 F 2 TE 16 16 Surface Temperature lest Valve (iC-4 Test 0-800 f 2 ZE 17 17 Position Test Valve Stem LVT-1 Test 0-4 inches ( 2 Inch 200 PT 18 18 Position Test Valve Stem (LVDT-2) Test 0-4 inches Q 2 Inch) 200 TE 19 19 Temperature Test Valve Inlet IC Test 0-800 F 2 TE 20 20 Te eperature Test Valve Inlet (TC-2) (loop seal only) Test 0-800 F 2 XE 21 21 Acceleration Test Valve T-Axis lest 0-0g 200 XE 22 22 Acceleration Test Valve V-Axis Test 0-(VT 200 XE 23 *23 Acceleration Test Valve 2-Axis Test 0-Ste 200 FT 24 24 flow Venturi Duff. Press. ITest 0-40psd 20 FT 25 25 Flow Venturi Diff. Press. 12) est 0-40 psid 20 PT 26 26 Pressure Flow Venturi Test 0-3500 pss 20 If 27 27 Temperature Flow Venturi (TC) lest 0-800 f 2 WE 28 28 Load (+ X-Axis) into Support Test Valve Inlet flange (upper) Test + 25 klns,.* 100 kips 200 WE 29 29 Load (t X-Axis) into Support Test Valve Inlet Flange (lower) lest 25 kips. T 100 kips 200 WE 30 30 Load (X X-Axis) at End of Ist Vertical Run Discharge Pipe Test 25 kips. i 100 kips 200 WE 31 31 Load (+ X-Axis) at End of 1st Vertical Run Discharge Pipe Test i 25 kips, -100 kips 200 WE 32 32 Load (+ V-Axis) at End of Ist Vertical Run Discharge Pipe Test # 25 kips, T 100 kips 200 WE 33 33 Load (R Y-Axis) at End of Ist Vertical Run Discharge Pipe Test * 25 kips, i 100 kips 200 WE 34 34 Load (i Y-Axis) into Support at Exterior Elbow Test 4 25 kips i 100 kips 200 WE 35 35 Load ( Y-Axis) into Support at Exterior Elbow lest f 25 kips. 100 kips 200 ZE 36 36 Position (Displacement) (+ Y-Axis) Test Valve lest i 5 Inches 200 ZE 37 37 Position (Displacement) (t X-Axis) 2nd.Discharge Elbow Test 5 Inches 200 E 38 38 Position (Displacement) (V-Axis) 2nd Discharge Elbow Test 15 Inches 200
Table 3.1
Instrumentation List EPRI Safety/Relief Valve lest Project
DAS INSIR. CHAN. DESCRIPTION CLASSIFICATION RANGE MAX fREQUENCY 111z)
ZE 39 39 Position (Displacement) (+ X-Axis) External Discharge Elbow Test + 5 inches 200 TE 40 40 Temperature Test Valve Outlet fluid (IC-1) Test 5-800 F 2 TE 41 41 Temperature Test Valve Outlet Fluid (iTC-2) Test 0-800 F 2 TE 42 42 Temperature Downstream of Back Pressure Valve (SW-3) (TC) Test 0-800 F 2 TE 43 43 Temperature Inlet to 2nd Discharge Elbow (TC) lest 0-800 F 2 IE 44 44 Temperature Between SW-2 and SW-3 (TC) Test 0-800 F 2 TE 45 45 Temperature Exit Nozzle Fuid (TC) lest 0-800 F 2 TE 46 46 Temperature Inside Pipe Wall Ist Horizontal Run Discharge Pipe (TC) Test 0-800 F 2 TE 47 47 Temperature Inside Pipe. Wall Vertical Run Discharge Pipe (IC) Test 0-800 F 2 TE.48 48 Temperature Inside Pipe Wall 2nd Horizontal Run Dischare Pipe (TC) Test 0-800 F 2
LT 49 49 Level DP, Drum I (Rosenount) Test 0-17 psid 20
LT 50 50 Level OP. Drum 2 (Rosemount) lest 6-17 psid 20 Co ZE 51 51 Position W-6 Stem (LVDT) Test 0-4 Inches(* 2 Inches) 200
IPT 52 52 Pressure Drum I lest 0-3500 psIs 20 4 TE 53 53 Temperature Drum #1 Fluid TC-1 Test 0-800 F 2
TE 54 54 Temperature Drum 01 Fluid TC-2 Test 0-800 F 2 TE 55 55 Temperature Drum #I Fluid IC-3 lest 0-800 F 2 TE 56 56 Temperature Drum 11 Fluid (TC-4 Test 0-800 F 2 LT 57 57 Differential Pressure Drum #1 Level (Radial Taps) Test 0-15 psid 20 LT 58 58 Differential Pressure Drum I1 Level Pipe Taps) lest 0-15 psid 20 PT 59 59 Pressure Drum 12 Test 0-3500 psis 20 IC 60 60 Temperature Drum 02 Fluid TC-1 lest 0-800 F 2 TE 61 61 Temperature Drum 92 Fluid TC-2 lest 0-800 F 2 IC 62 62 Temperature Drum 92 Fluid IC-3 Test 0-800 F 2 TE 63 63 Temperature Drum 02 Fluid TC-4 Test 0-800 F 2 TE 64 64 Temperature Drum 12 Fluid TC-5 Test 0-800 F 2 IC 65 65 Temperature Drum 92 fluid TC-6 Test 0-800 f 2 LT 66 66 Differential Pressure Drum #2 Level (Radial Taps) Test 0-15 psid 20 LT 67 67 Differential Pressure Drum 92 Level (Pipe Taps) est 0-15 rsid 20 SE 68 68 Strain Tank 2 Support Skirt (y.0o) lest 0 -5UU miicro inch/inch SE 69 69 Strain Tank 2 Support Skirt +vy Test I1no500 micro inch/inch 2 SE 70 70 Strain,0ischarge Downcomer (Axial) # est 0-500 micro Inch/inch SE 71 71 Strain.Cischarge Downcomer (Hoop) 0I lest 0-500 micro Inch/inch 200 SE 72 72 Strain Discharge Downcomer 45 a l)est 0-500 micro inch/inch 200 SE 73 73 Strain.Discharge Downcomer Axial) 12 Test 1-500 micro inch/inch 200 SE 74 74 Strain.Discharge Dokincoier (Hoop) 92 Test u-uu micro inch/Inch 200
Table 3.1 (cont'd)
Instrumentation List EPRI Safety/Relief Valve Test Project
DAS INSIR. CIAN. DESCRIPTION CLASSIFICATION RANGE MAX FR1QUENCY (liz)
SE 75 75 Strain. Test 0-500 micro inch/inch 200 TE 76 76 Thermocouple. Ambient Terperature Test 0-800of 2 TE 77 77 Temperature lank I (RTD) Test 0-8000 F 0.1 IE 78 78 Thermocouple. .(Strain Gage) Disch. Downcomer 1 lest 0-800 F 2 IE 79 79 Thermocouple. (Strain Gage) Disch. Downcomer 12 lest 0-800 F 2
ZE 84 84 Position (Displacement) + X-Axis Vertical Discharge Run Pipe (LVOT) lest 3 Inches 200 SE 85 85 Strain Upstream TV Axial) 1 lest 0-500 micro Inch/inch 200 SE 86 86 Strain Upstream TV Hoop) 9l lest 0-500 micro Ich/inch 200 SE 87 87 Strain Upstream TV Axial) 12 lest 0-500 micro inch/inch 200 SE 88 88 Strain Upstream TV (Hoop) 92 Test 0-500 micro Inch/inch 200 TE 89 89 Thermocouple Upstream TV Strain Gage II lest 0-800 F 2 TE 90 90 Thermocouple. upstream TV Strain Gage 92 Test 0-800 F 2 TE 91 91 Thermocouple, Upstream TV Discharge Strain Gage 1 lest 0-800 F 2 TE 92 92 Thermocouple. Upstream TV Discharge Strain Gage 12 Test 0-800 F 2 ZE 93 93 Position (Displacement) ( X-Axis) ist Discharge Elbow Test * 3 Inches 200 ZE 94 94 Position (Displacement)+ Y-Axis) ist Discharge Elbow Test + 3 Inches 200 ZE 95 95 Position (Displacement)F V-Axis) Lower Horizontal Pipe Run (Midpoint) lest T 3 Inches 200 SE 96 96 Strain Tank 1 Support Skirt (!Y. 0 Test 0-5n0 micro Inch/inch 200 Hz SE 97 97 Strain Tank 1 Support Skirt (!y. 800) lest 0-500 micro inch/inch 200 liz SE 98 98 Strain Tank 1 Support Skirt (!y. 90 ) lest 0 500 micro inch/inch 200 llz SE 99 99 Strain Tank 1 Sgnooort Skirt (y 2700) lest 00 micro inch/inch 200 liz PT 109 100 lest Valve Preloader Cylinder 01 Pressure lest 0I00 sig 200 liz SE 100 100 Strain, TV Discharge (Axial) 1 lest 0-500 micro Inch/inch 200 liz PT 101 101 Upstream Pressure Upstream Spoolpiece 0-3500 psis ?W TE 102 102 Upstream Temperature (TC) . Upstream Spoolece 1-800- - 20 IT 103 103 Upstream Temperature (RTO) Upstream Spoolpiece 0-89OF
DET 104 104 Upstream Density (I-D beam A-1) (Single Beam Densitometer) Upstream Spoolpiece 0-62.4 lIm/ft3 200
Table 3.1 (cont'd)
4
Instrumentation List EPRI Safety/Relief Valve lest Project
OASMAFRQEC00 INSTR. CHAN. DESCRIPTION CLASSIFICATION RANGE .[XFU[NCY (z
TE 214 140 Temperature Drum 02 Recirc. Flow Orifice (TC) Process Instrument 0-800 F FT 215 141 Differential Pressure Drum 02 Recirc. Flow Orifice Process Instrument 0-2opsid PT 216 142 Roof Vent Pressure Process Instrument 0-3500 psis PT 217 143 Boiler Drum Pressure Process Instrument 0-3500 psis TE 218 144 Boiler Drum Fluid Temperature (TC) Process Instrument 0-800 F LT 219 145 Differential Pressure Boiler Drum Level Process Instrument 0-3.2 psid JT 220 146 Wattmeter Drum #1 Heaters Process Instrument 0-60 kw JT 221 147 Wattmeter Drum 12 Zone I Heaters Process Instrument 0-60 kw JT 222 148 Wattmeter Drum 12 Zone 2 Heaters Process Instrument 0-60 kw PT 301 N/A Roof Steam Vent Pressure Control Loop Instr. 0-3500 psig PDT 302 N/A feedwater to Loop Differential Pressure Control Loop Instr. 0-300 psid TE 303 N/A Circ. Pump I Cooling Water IC Control Loop Instr. TE 304 tI/A Circ. Pump 2 Cooling Water TC Control Loop Instr.
'TE 300N/A Rupture Disk D.S. Piping TC Alarm Only
Total Test Instruments 107 500 iz-1, 200 Hz- 48 20 Hz-19, Total Spoolpiece Instruments 20 200 Hz- 9 20 Hz-10. Total Process Instruments 22
Total Instruments on DAS 149
Note: 00 for Tank Support Skirt Strain Gages is the direction of the discharge pipe.
Note: Hydraulic PRELOAD Cylinder Pressures PT 100.105.106,111.112,110,126.149 are not installed initially, and channels
are assigned to other sensors for PT 100.105.106.110,112.112 (100.110.1,11112 are strain gages; 105.106 are
assigned to other pressure as indicated on the Instrument List)
Table 3.1 (cont'd)
Instrumentation List EPRI Safety/Relief Valve Test Project
DAS MAX. INSTIR. CHAN. DESCRIPTION CLASSIFICATION RANGE FREQUENCY(IZ)
PT 105 105 Test Valve Preloader Cinder 02 Pressure (Used as Inlet flange Pres.) Test O-IO.Oflpsig (0-3500 psis) 200 PT 106 106 Test Valve Preloader Cylinder 02 Pressure (Used as IV Bowl Pressure) lest O-IO.Oflpsig (0-1000 psis) 200 FE 107 107 Upstream fluid Velocity (full flow Turbine Meter) Upstream Spoolpiece 0-Z00 ft/sec 20 FE 108 108 Upstream fluid Velocity Turbine Meter Probe I Upstream Spoolplece 0-200 ft/sec 20 FE 109 109 Upstream Fluid Velocity Turbine Meter Probe 2 Upstream Spoolpiece 0-200 ft/sec 20 PT 110 110 Test Valve Preloader Cylinder 94 Pressure Test 0-10.000 psi 20 SE 110 110 Strain, TV Discharge (hoop) #1 lest 0-500 micro ich/inch 200 PT Ill III Test Valve Preloader Cylinder 5 Pressure est 0-10.000 pug 200 PT 112 112 lest Valve Preloader Cylinder #6 Pressure Test 0-10.600 psig 2 200 FE 113 113 Upstream Momentum flux Drag Disc I IE 114 114 Upstream Temperature Drag Disc I (IC) Upstream Spoolpiece 0-000 lf e 20 FE 115 115 Upstream Momentum flux Drag Disc 2 Upstream Spoolplece 0-200.000 lb/ft-sec 200 TE 116 116 Upstream Temperature Drag Disc 2 (IC) Upstream Spoolpiece 0-800 F 20 DET 117 117 Downstream Density (i-D Beam A-2 Downstream Spoolpiece 0-62.4 Ibm/ft3 200 OET 118 118 Downstream Density (.-0 Beam 6-2 Downstream Spoolpiece 0-62.4 i/It3 200 DET 119. 119 Downstream Density (-D Beam C-2) Downstream Spoolpiece 0-62.4 ibm/It 200
cc FE 120 120 Downstream Fluid Velocity Turbine Meter Probe 3 Downstream Spoolpiece 0-200 ft/sec 20 FE 121 121 Downstream fluid Velocity Turbine Meter Prote 4 Downstream Spoolpiece 0-200 ft/sec 20 FE 122 122 Downstream Momentum flux Drag Disc 3 Downstream Spoolpiece 0-200.000 lb/ft-sec 200 TE 123 123 Downstream Temperature Drag Disc 3 (IC) Downstream Spoolpiece 0-800 F 2 20 FE 124 124 Downstream Momentum flux Drag Disc 4 Downstream Spoolpiece 0-200,000 lb/ft-sec 200 TE 125 125 Downstream Temperature Drag Disc 4 (IC) Downstream Spoolpiece 0-800 f 20 PT 126 126 Test Valve Preloader Cylinder 07 Pressure Test 0-10.000 psig 200 SE 126 126 Strain, IV Discharge (Axial) 02 lest 0-500 micro inch/inch 200 PT 149 149 Test Valve Preloader Cylinder 17 Pressure lest 0-10.000 psig 200 SE 149 149 Strain, TV Discharge (hoop) 92 lest 0-500 micro Inch/inch 200 PT 201 121 Pressure Stream flow Orifice Process Instrument 0-3500 psis TE 202 128 Temperature Steam Flow Orifice (IC) Process Instrument 0-800 F TE 203 129 Temperature Steam Flow Orifice (RID) Process Instrument 0-800 F FT 204 130 Differential Pressure Steam flow Orifice (igh) Process Instruient 0-25 psid FT 205 131 Differential Pressure Steam flow Orifice (Low) Process Instrument 0-3.2 psid TE 206 132 Temperature Drum 51 Inside Wall (TC) Process Instrument 0-800 F TE 207 133 Temperature Drum 01 Outside Wall (IC) Process Instrument 0-800 F TE 208 134 Temperature Drum 02 InsideWall (IC) Process Instrument 0-8(10 F TE 209 135 Temperature Drum 02 Outside Wall (IC) Process Instrument 0-800 F PT 210 136 Pressure Drum 01 Recirc. flow Orifice Process Instrument 0-3500 psis TE 211 137 Temperature Drum 01 Recirc. flow Orifice (TC) Process Instrument 0-800 F FT 212 138 Differential Pressure Drum #1 Recirc. flow Orifice Process Instruient 0-20 id PT 213 139 Pressure Drum e2 Recirc. Flow Orifice Process Instrument 0-3500psis
Table 3.1 (cont'd)
Table 3.2
SUMMARY OF INSTRUMENTATION CHARACTERISTICS
Test and Spoolpiece Instruments)
Parameter Type Manufacturer/ Type Signal Manufacturer System Accuracy System Full Scale Measured Transducer Model No. Conditioner Model No. % Full Scale Freq. Response Range (s)
Pressure Strain Gage BLH Electronics Strain Gage Bell & Howell ±0.27% >1 KHz 0-3500 psis Diaphram Model DHF Amplifier 1-183
Strain Gage Sensotec Strain Gage Rell & Howell ±0.27% >1 KHz 0-1500 psia Diaphram Z-Series Amplifier 1-183
Strain Gage Sensotec Strain Gage Bell & Howell ±0.14% >1 KHz 0-10,000 psi Diaphram TJE Series Amplifier 1-183
Differential Variable Reluctance Validyne Carrier Validyne ±0.5% 300 Hz t40 psid thru Magnetic Diaphram DP 22 Demodulator CD-19 ±1500 psid
Validyne Carrier Validyne ±0.5% 300 Hz ±3.2 psid DP 303 Demodulator CD-19 thru 25 psid
Capacitance Rosemount Built in Trans- Rosemount 10.25% 20 Hz 0-25 psid Diaphram 1151 HP mitter 4-20 ma 0-17 psid
(2-10 VCD thru 50OJ1)
Temperature Type K Thermoelectric Thermocouple Rochester Instr. 13.4% of Reading 10 Hz 0-800.F Thermocouples & Multicable Signal Transmitter SC1326W or 14*F
(whichever larger)
Platinum RTD Rosemount RTO Transmitter Rochester Instr. 1o.1% < 1 Hz 0-800"F Series 78 SC 1372
Acceleration Piezoelectric PCB Piezotronics Voltage/Amplifier PCB Piezotronics 11% Reading 1-1KHz 0-lOg Crystal Accelero- Model 306MIO Power Supply Model 494A06 meter (Built in (Triaxial) Charge Amplifier)
Force Strain Gage Lebow Strain Gage Bell & Howell ±0.5% > 1 KHz 0-100,000 lb Load Cells 3156 Amplifier 1-183 0- 25,000 lb
Table 3.2 (cont'd)
SUMMARY OF INSTRUMENTATION CHARACTERISTICS
Parameter Type Hanufacturer/ Type Signal Manufacturer System Accuracy System Full Scale Measured Transducer Model No. Conditioner Model No. % Full Scale Freq. Response Range (s)
Position LVDT Schaevitz Carrier Demodulator Schaevitz ±0.25% 250 Hz t2". 14", t5" (Displacement) 2000 HCA
3000 HCA 4000 HCA
Strain Strain Gage BLH Electronics Strain Gage Bell & Howell tO5% >1 KHz Ot20004E (Weldable) Amplifier 1-183
Strain Gage BLH Electronics Strain Gage Bell & Howell ±0.5% >1 KHz Ot2O000/E (Adhesive, Amplifier 1y183 0±400 PE J Bridge) 0700 PE
Fluid Density 3 Beam Gamma Measurements, Inc. Photomultiplier Measurements. Inc. 10.5% Water Density I KHz 0-62.4 lbm/ft3
Densitometer FM-6 and Amplifiers 11.0% Vapor Density
Fluid Momentum Drag Disc Ramapo Instruments Strain Gage Ramapo Instruments 10.54% 20 Hz 0-200,000 lbm/ft Flux (Strain Gage) V5300-6RBDQ Amplifier SGA-300 RMB
Fluid Velocity Turbine Meter Flow Technology Frequency to DC ANADEX ±0.64% 10 Hz 20-200 ft/sec Probe FTP-16S 12,000 lb Converter PI-608
16-12S
Full Flow Flow Technology Frequency to OC ANADEX ±0.64% ? 20-200 ft/sec Turbine Meter FT-128G x 5500LJC(s) Converter PI-608
Table 3.3
Dresser Model 31709NA Safety Valve Parameters
Manufacturer Dresser
Type Spring-loaded,
balanced bellows, and
enclosed bonnet
Model Number Dresser 31709NA
Design pressure, psia 2500
Design Temperature, oF 700
Set pressure (nominal), psia 2500
Minimum required capacity at 3% accumulation, lb/hr. 460,000
ASME rated capacity at 3% accumulation, lb/hr. 504,874
Inlet Diameter, in. 6
Outlet Diameter, in. 8 .. 2 Orifice area, in. 4.34
Accumulation, (nominal), % 3
Backpressure, nominal, psig 500
Blowdown, (nominal), % 10
Inlet Flange Rating 2500
Outlet Flange Rating 600
B-20
Table 3.4
Dresser Model 31709NA Safety Valve Test
Inlet Piping Data
Length, in. I.D., in.
Nozzle 17 6.813
Venturi 38 6.813
Pipe 6 6.813
Reducer 6 6.813/4.897
Inlet Flange 11 4.897
B-21
e0
EPRI/CE SAFETY VAlVE TEST DATA
Table 3.5 "AS TESTED" COMBUSTION ENGINEERING TEST MATRIX FOR III
DRESSER 31109NA SAfETY VALVE
CONDITIONS AT VALVE OPENING TRANSIENT CONDITIONS
TEST TIST VALVE RING INLET IN TANK I AT VALVE INLET PEAK PEAK INDUCED (2) MAX. SHADY 10. IVPE SETTINGS PIPING TANK I PACK- BENDING WMMENT LIQIiI 1111IW
UPPELR MIDDLE LOWER CONIGI. FLUIO PRES. TEMP7 PRESS. RATE FUD TEW. PRESS. PRESS. OPENING/CIISING (GPH I (PSIA) ("F) (PSI/SEC) I(F) (PSIA) (PSIA) (In. IRS.)
?IIll 51AM -48 *34 -20 A STEAM 2486 () 400 STEAM (1) 2680 (3) 131.500 N/A
"603 STEAM -48 -60 0 6 STEAM 2505 (1) 2.9 STEAM (1) 2505 174 q1.00 N/A '606 STEAM -48 -60 0 8 STEAM 2503 (1) 296 STEAM (1) 2695 195 91.000 N/A
611 S1LAM -48 -60 0 a STEAM 2530 (1) 322 STEAM (I) 2697 358 95.550 N/A b14 SHAH -48 -40 0 a STEAM 2546 (1) 317 STEAM (1) 2686 354 100.100 N/A 615 SI(AM -48 -20 0 B STEAM 2568' (1) 317 STEAM (1) 2639 326 100.100 N/A 6111 SILAM -40 -60 0 B STEAM 2536 (1) 288 STEAM (1) 2680 530 91,000 N/A '620 511AM -40 -20 0 6 STEAM 2540 (1) 311 STEAM (1) 2667 194 95.550 N/A 613 IlANS -48 -60 0 8 SHEAM/ 2545 (1) 3.0 STEAM (1) 2545 418 100.100 3an1
WATER
615 WATER -40 -60 0 8 WATER 2412 603 3.0 WATER 573 2420 338 91.000 7715 6211 TRANS -48 -20 0 8 STEA/ 2530 (1) 2.1 SEAM (1) 2530 386 81,900 3305
WATER
f1.30 AILIR -48 -20 0 B WATER 2393 625 2.5 WATER 589 2393 336 100.100 3735
1w) SI IAM -48 -20 0 8 STEAM 2530 (1) 308 STEAM (1) 2652 345 200.200 N/A 13011 WATER -48 -20 0 B WATER 2487 562 1.6 WATER 535 2513 145 473.?00 1436
61311 WAlER -48 -20 0 0 WATER 2558 415 2.6 WATER 429 2558 100 445.900 (3)
N/A Not aipil icable 140115:
(1) All tests were initiated at a nominal pressure of 2300 PSIA. For steam tests and steam/water transition tests, the initiation lemIperature was the saturation temperature.
(2) 11 reported values are the maximum bending moments on the valve discharge flange during opening-or closing. (3) U.%table conditions precluded reliable measurement.
* the valve was disassembled. insiiected. and refurbished as required for representative test performance.
* 0
FPRI1CE SAFIV VALVE IFS1 IIATA
Table 3.5 (cont'd)
VALVE IRANSICNI AND LEAKAGE PIRFORMANCE IIAIA fOR IEI
01ESSER 31109NA SAflIV VALVE
P-- -TIST VALVE LEAKAGE VALVE OPLNING AND CLOSING POSI-lEST VAIVI IIALA&L
VALVE VAL VE LEAKAGE INITIAL OPENING OPINING OPENING 1PRESS. VAi VF VAI Vt I I AIA;E ILSI ItSI HLDIA INLET INLET RATE OPEIIlNG 'POP" SIMMER "P'OP" AI VALVE % BLOWNI)WN VALVE MEDIA INIl I 1 if I Il NO. IVPE PRESS. ItEMP. (GPH) PRESS. PRC55. IIME TIuE CLOSURE SIABILIIV PillSS. I (IInN) A--- .. PIA .oiL . LA.(.S5A1- (VSIA) (1o1 i " I ISI -- *_,--- *. _ _r[* - **" ..
201 SILAN STAH 2300 660 0.1 2486 2489 0.011 0.013 2010 20.2 chatter STEAM 2091 646 '1.54
603 SiTAM STEAH 2298 Sat 0.9 2605 2505 0.004 0.012 2160 14.2 stable STEAM 2206 Sat 1.0 606 SIEAM SI[MI 2283 Sat 0.0 2503 2509 0.005 0.015 2166 14.0 stable ATEAM 2200 Sat 1.1 1111 SLAh STEAM 2285 Sat 0.0 2530 2538 0.001 0.023 2290 9.0 stable STEAM 2290 Sat 1.0 614 Sl M STEAM 2293 sat 0.0 2546 2551 0.001 0.016 2294 8.6 stable STEAM 2300 Sat 1.11 61l STEAN SIAM 2294 Sa 0.0 2568 255 0.006 0.018 2321 (.5 stable STEAM 02205 Sat 1.5 618 SItAI STEAM 2300 Sat 0.0 2486 2486 0.001 0.015 2211 9.51 stable SlEA14 22115 Sat 2.1 620 SAM STEAM 2300 sat 0.0 2540 2540 0.005 0.011 2221 11.5 stable STEAM 2310 Sat .1 623 IRNS STI1 2286 sat 0.0 2545 2545 0.006 0.015 2052 18.5 stable STEAM 2285 Sat 0.61 626 MAIER HATER 2300 sat 0.31 2412 2412 0.010 0.035 2108 16.3 stable HATER 2300 sat 0.11 6211 TRANS 511AM 2281 Sat 0.1 2530 2530 0.006 0.011 2090 .17.0 stable MATER 2290 sat 0.41 6301 WAIR MAIER 2296 sat 0.36 2393 2393 0.011 0.031 1950 22.6 stable MI1111 2300 Sat 0.119
IN~ jit) 1IAM ShJAM 22110 Sat 0.0 2530 h253 0.008 0.023 2301 8.6 stable STEAM I11100 S.1t 01.66 131; WAILH WAlER 2300 644 0.0 2481 2487 0.011 0.059 2398 4.7 stable IlIER 2300 544 0l.0 1311 MAHII MAIERI 2300 429 0.0 2558 2558 <0.01 (1) (2) (2) chatter 13) 12) (2) 1?) 12)
N/A Blot apicbl~e WhIlES: (1) Unstable conditions precluded reliable measurement. (2) Iliese data were not available (3) I6e valve opened. chattered for approximately 3 seconds and then stopped chattering for the remainder of the test.
(PRI/CE SAFEIV VALVE IfI DAIA
Table 3.5 (cont'd)
VALVE FloW RATE P(IFORMANCE GAIA (O lilt
DRESSER 31709NA SAFEIV VALVE
CONOIlIONS Al 3% ACCUMULAION (1) CONDIlIONS AT 6% ACCUMIII.AiON (I) LJIUJO flow MIARintMINI
BASEU-lili BASEDi.------BAS[D ON MAX.
IANK PRESSURE VAIVE INIT PRESSURE TANK PRESSURE VALVE INLEI PRESSURE ANK CONDIIONS SILADY
lit 151 RT~ AD IT(lfSI~$iXE STATEjD-jTTATTD -jTAlfi TAATE[D PRHE S- -itP W, tiIll %NAITO
Nil. IYPE LifI 51EAM LIfI SI[AM4 LIFt STEAM LifI 51EAM (PSIA) (o [low III
,0I STEAM (2) (2) (2) (?) (2) (2) (2) (2) N/A i/WA N/A N/A
603 STLAN N/A N/A N/A N/A N/A N/A N/A N/A N/A Hi/A N/A N/A
606 STEAM 109 125 109 125 109 130 109 131 N/A N/A N/A N/A
S611 STEAM 104 124 105 124 107 130 101 130 N/A f/A N/A N/A
614 SIAN 98 123 99 124 107 130 107 132 N/A i/A N/A N/A
615 SILAN 83 Ill 84 119 (3) (3) (3) (3) N/A N/A N/A N/A
il SItAM 101 123 100 123 108 130 108 130 N/A iH/A N/A N/A
620 SILAM 107 124 107 126 101 330 (3) (3) N/A N/A N/A N/A
623 TRANS N/A N/A N/A N/A N/A N/A N/A N/A 2372 653 3801 105
62t, WAIll N/A N/A N/A N/A N/A Il/A f/A N/A 2320 603 2715 38
6281 TRANS N/A N/A N/A N/A N/A N/A N/A N/A 2343 647 3304 73
630 WATER N/A N/A N/A N/A N/A N/A N/A N/A 2335 625 3735 6?
I su' S1LAM 79 114 81 116 (3) (3) (3) (3) li/A N/A N/A N/A
131111 WAJt N/A N/A N/A N/A N/A N/A N/A N/A 2429 562 1436 26
li1 WAlIR N/A N/A N/A N/A N/A N/A N/A N/A (2) (2) (2) (2)
N/A Not applicable NO1 5: (1) liurinig Lte valve closing cycle. The valve inlet pressure corresponds to stagnation pressure. (2) Ulnstable conditions preclude reliable measureaent. (3) lte appropriate smeasurement conditions were not achieved.
DISCH. INST. SPOOL ATM
TEST VALVE S-7
8" ATM. 6"
S-10 STEAM
8" 12, SUPPLY
12"1 S-9 6"22"
12" 12"
S-6
No. 1 4"
STEAM No. 2 SUPPLY S-12
4"
3"s S11 4"#
W-4 12"
W-7
12" FIGURE 3.1 RC UT EPRI/CE W-1 RECIRCULATION
W-6 FLOW TEST LOOP ISOMETRIC 4' 12" ORIFICES
3"#
4"s 3"
CIRCULATION PUMPS
B-25
TO ATM FIGURE 3.2 BASE LOOP
S-10 AND SHORT VERTICAL INLET S-7 CONFIGURATION
STM SUPPLY
/S -9
S-6/ TEST VALVE T 6"or
8"Sch.40
6
TANK 2 8"Sch.160
\VENTURI
TANK 2I
) 8'
W-IT
eW-6
15'
12"Sch.80 SW-2
RUPTURE DISC. ASSEMBLY
SW-3 23'
.6"Sch.80
24
B-26
0A C FLOW
;i 6jBQRE SNUBBER
8" BORE LA EL SNUBBER
8"BORE SNUBBER
III LOAD CELL
'3'LOAD CELL
00
I71
B AI
SSECTION A-A SECOND ELBOW PIPE SUPPORT ASS'Y
FIGURE 3.4 TEST LOOP SUPPORT AT SECOND DISCHARGE ELBOW
12 Sch. SO PIPE
PIN JOINT r *
LOAD CELL ,
( PIN JOINT
FIGURE 3.5 TEST LOOP SUPPORT AT THIRD DISCHARGE ELBOW
B-29
TEST VALVE PRELOADING DEVICE HYDRAULIC CYLINDER PRESSURES
ATM -T Q 4 p PT p PT
TEST 4I VALVE
TE T
M S-r SE TE 80
to To
STEAM To isoT SUPPLYPT VNUIs
asI
745
TT
As
ATM
as
SII
FIUR 3.63
STEMl POSITIO.N SKIN TEMP. TC's
XE X E X E TRIAXIAL ACCELEROMETER I TE TE 21 22 23
TE SE STRAIN GAGE 92 Co
TE
-- FLOW
TEnS STrAIN GAGE St S7
TET VALV
FLANE
TEST VALVE INSTRU ETTO
FIUR 3.7
B-31
XE21) Y XE22)
(XE23) g X, Z By8(ZE94)
(SE73) C (S E8 8) 7 I 0
(ZE36) 8X - --- * 7 - -+-- X(ZE93)
(WE28) F II-E(SE75) X - -(SE 87) 1 fl E 86) 6 (SE74) Z
(WE29)F E( &5) -- e(SE72)
Sg-ACCELERATION e(S E71) - -(SE70) 8-DISPLACEMENT
8X F- FORCE e-STRAIN
(ZE84)
TANK NQ1 (WE32) (WE33) 8y(ZE95)
FX
S (ZE38)(ZE39) BX
(ZE 37) FY ( 3 I E *(3E30)5)
WIGE 3 1) (E(WE34 E96
(WE 35
PIPING RESPONSE INSTRUMENTS
FIGURE 3.8
FIGURE 3.9 DRESSER MODEL 31709NA SAFETY VALVE
Release Nut
Laver Shaft A
Liftirng Fork Cap'
Cap Stud
cap Stud Nut Compression Screw Nut
Cap Sasket
Spinrdle Compression Screw
Top Spring Washer Assembly
3/4 NPTYn Sonnet
Bottom Spring Washer
Retainer Cap Screw Bonnet Su .Support Plate Stud Nu
Support Plate Gasket Support Plate Gasket
Guide Gasket
Suide Gaskee
Disc H oId e r Top Adj. Ring Pin & Gasket
Top Adj. Ring .
Bellows Assembly -- at Upper Adj. Ring Pin & Sasket
GUo RI6-+Upper Adj. Ring Lower Adj. Ring Pin & Gasket
Disc Lower Adj. Ring
1/2 NPT Drain Base '
Nozzle
Nozzle Gasket
B-33
0 00
L IFT STOP FIGURE 3.10
DRESSER MODEL 31709NA SAFETY VALVE ADJUSTING RINGS
Al~GUI IDE
DISC HOLDER
UPPER ADJ. RING
VALVE OUTLET
MIDDLE
AJ. RING
VALVE BODY BOWL
LOWER ADJ.RING
NOZZLE
Figure 3. J EPRI/CE TEST FACILITY INLET PIPING CONFIGURATION
FOR THE DRESSER 31.709NA SAFETY VALVE
TEST VALVE
1.17' PRESSURE TRANSDUCER
8" SCH 160 x 6" SCH XX REDUCER
VENTURI 5.25'
TANK NOZZLE
TANK No. 1
B-35
FIGURE 3.19
EPRI/DRESSER 31709NA TEST RESULTS
BLOWDOWN VS BUILTUP BACKPRESSURE
(STEAM TESTS ONLY)
16
15
14 7
13
12
117
10
z9
C.D
07M
5 Mi _dle_ noi i nn
Relative to Nozzle Seat_,
4 L
C)( ns) U -C)7
a M uis) 40
:1 -
100 200 300 400 500 600
BUILTUP BACKPRESSURE, PSIG
B-36
FIGURE 3.13
EPRI/DRESSER 31739A TEST RESULTS
BLOWDOWN VS BUILTUP BACKPRESSURE
(STEAM TESTS ONLY)
17
16
15
14
13
Z: 12 I 1711
10
9 -8 -7
6
200 300 400 500 600 700 800 900
BUILTUP BACKPRESSURE, PSIG
4.0 SAN ONOFRE UNITS 2 AND 3 SAFETY VALVES
4.1 Description
The San Onofre Units 2 and 3 reactor coolant system (RCS) is
provided with two Dresser Industries Model No. 31709NA safety
valves for overpressure protection. Table 3.3 lists the safety
valve and design parameters. The safety valve is illustrated
in Figure 3.9. These valves are connected by piping to the top
of the pressurizer, as shown in Fig. 4.2. They are direct
acting, spring-loaded safety valves meeting ASME Code require
ments. They have an enclosed bonnet and have a balanced bellows
for superimposed backpressure. The safety valves pass sufficient
pressurizer steam to limit the reactor coolant system pressure
to below 110% of design pressure following a complete loss of
turbine generator load without simultaneous reactor trip. A
delayed reactor trip is assumed on a high-pressurizer pressure
signal.
4.2 Valve Adjusting Ring Settings
The valve manufacturer was requested to recommend, based on the
EPRI/C-E test results, an appropriate combination of valve ring
adjustments for San Onofre Units 2 and 3. The scope of the
EPRI/C-E test program did not allow the establishment of a
comprehensive definition of the interrelationship between the
various combinations of ring settings and valve behavior.
Therefore, it was considered prudent to select a combination of
ring settings which were identical to one of the configurations
tested, and which provided a blowdown which was not excessive.
The recommended ring settings were as follows:
Upper Ring Position: 48 Notches Below Top of Holes in Guide
Middle Ring Position: 20 Notches Below Nozzle Seat
Lower Ring Position: Zero Notches Below Nozzle Seat
B-38
The above ring adjustments were used in EPRI/C-E Test Numbers
615, 620, 628, 630, 1305, 1308, and 1311. Figure 4.1 provides
a sketch illustrating these ring adjustments.
4.3 Installation
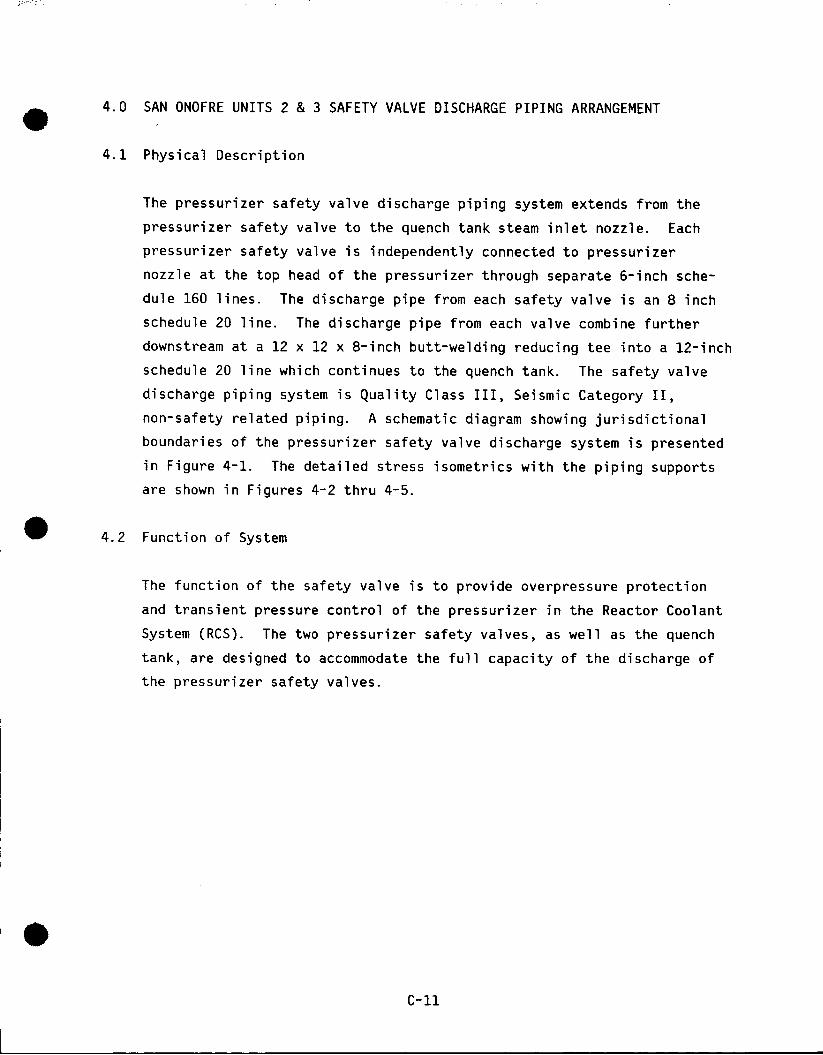
The San Onofre Units 2 and 3 safety valves are piped to provide
the shortest inlet piping which is feasible. Figure 4.2 illus
trates the current safety valve inlet piping arrangement.
4.4 Inlet Fluid Conditions
4.4.1 FSAR Pressurization Events
The San Onofre Units 2 and 3 safety.valve fluid inlet conditions
prescribed by the FSAR for various design basis events are
summarized in Reference 5. Reference 5 indicates that for all
events which result in safety valve lift, the safety valves
will discharge only steam. That is, it is not expected that
the safety valves will be required to pass liquid or two-phase
fluid. The peak pressurizer pressure calculated for FSAR
events was 2760 psia. The range of calculated pressurizer ramp
rates was 45 to 93 psi/sec.
4.4.2 High Pressure Injection Events
The High Pressure Injection event is the chaRging of water into
the RCS by the high pressure safety injection (HPSI) pumps due
to a safety injection actuation signal (SIAS). However, the
shutoff head of the San Onofre Units 2 and 3 HPSI pumps (approx
imately 1500 psia) is below the nominal safety valve setpoint
(2500 psia), as well as below normal operating pressure'(2250
psia). Therefore, the HPSI pumps are incapable of causing the
safety valves to lift. Further, the HP$I pumps are incapable
of injecting coolant into the RCS during normal power operation.
The lifting of safety valves due to uncontrolled charging by
the charging pumps was not considered. This event was not
B-39
considered because more than adequate time is available for the
operator to take corrective action. The High Pressure Injection
event is, therefore, not relevant in a consideration of San
Onofre Units 2 and 3 safety valve fluid inlet conditions.
4.4.3 Cold Overpressurization Events
For protection against brittle failure when the RCS is at low
temperature, and possibly in a water-solid condition, San
Onofre Units 2 and 3 is provided with a spring-loaded relief
valve located in the Shutdown Cooling System at the suction of
the low pressure safety injection pumps. Cold overpressure
protection is therefore not a function of the San Onofre Units
2 and 3 pressurizer safety valves.
4.5 Backpressure
The EPRI/C-E valve tests showed that the Dresser 31709NA valve
blowdown was dependent on the discharge backpressure. Based on
the current San Onofre Units 2 and 3 safety valve discharge
piping arrangement shown in Part C, (Figures 4.1 through 4.5),
the calculated backpressure was 427 psig for two safety valves
discharging and 245 psig for a single valve discharging. These
backpressures are within the range for acceptable valve perfor
mance.
B-40
Notes:
(1) Vertical displaceMent of Lower
Ring moved 16 notches is equal to Middle Ring dis- V placement when moved 25 notches. For further reference relative to nozzle seat or bottom surface of disk holder, see Section 3.1 and Table 1 (Test 615).
(2) This figure not to scale.
Top of holes in DISC HOLDER guide ----
Upper Ring Adjustment -48 Notches
OUTLET Lower Ring Adjustment = 16 notches.
(see Note 1) MIDDLE AOL RING
Bottom Surface of Disk Holder
Plane of Nozzle Seat Top of Lower Ring DOL Bottom of Middle Ring
20 NotchesLOE Middle Ring Adjustment 20 othe
(45 Notches FIG. 4.1 San Onofre Units 2 & 3
Safety Valve Ring Adjustments N NZL
PRESSURIZER SAFETY VALVE INLET FLANGE MATING SURFACE
10 3/4" TYP
6" TYP
9" TYP
-a8" TYP e
PRESSURIZER WALL
NOTES:
1. ALL PIPING IS 6" SCH 160 2. TOTAL LENGTH OF INLET PIPING FROM ID OF PRESSURIZER TO
VALVE INLET FLANGE MATING SURFACE= 4.3 FT.
Figure 4.2 SAN ONOFRE UNITS 2 & 3 PRESSURIZER SAFETY VALVES
INLET PIPING CONFIGURATION
B-42
5.0 APPLICABILITY OF EPRI/C-E TESTS TO SAN ONOFRE UNITS 2 AND 3
VALVES
The applicability of the EPRI/C-E test results to the San
Onofre Units 2 and 3 safety valves is justified below.
5.1 Valve Type
A Dresser Model 31709NA safety valve, the same valve model as
used on San Onofre Units 2 and 3, was tested in the EPRI/C-E
test program. Test data on the San Onofre Units 2 and 3 valve
model was obtained.
5.2 Valve Adjusting Ring Settings
The current ring adjustments for the Model 31709NA San Onofre
Units 2 and 3 valves (see Section 4.2) were tested in the
EPRI/C-E program in Test Numbers 615, 620, 628, 630, 1305, 1308, and 1311. The results of these tests are directly ap
plicable to.the San Onofre Units 2 and 3 valves.
5.3 Inlet Piping Configuration
The EPRI/C-E valve test program showed that safety valve perfor
mance was strongly influenced by the length and configuration
of the valve inlet piping. The inlet piping to the San Onofre
Units 2 and 3 safety valves and to the EPRI/C-E test valve were
both relatively short, but the configurations were somewhat
different (see Figures 3.11 and 4.2). The San Onofre Units 2
and 3 inlet piping is 6" Schedule 160 and has a single 90'
bend. The EPRI/C-E test piping was straight and contained an
8" nominal diameter Venturi and an 8" x 6" reducer. In order
to show that EPRI/C-E test results on the Model 31709NA valves
could be applied to San Onofre Units 2 and 3, it was necessary
to demonstrate that the in-plant inlet piping transient pressure
drop (at which occurs valve opening) is not greater than that
B-43
for the EPRI/C-E test configuration.
In order to demonstrate the applicability, the EPRI/C-E test
inlet piping was modelled and analyzed using the PIPES computer
code. Calculated inlet pressure drop vs. time was then compared
with the test data from Test No. 615. The calculated pressure
drop vs. time from the PIPES model was in excellent agreement
with the test data, with the calculated maximum value-being
about 94% of the test value. These results established the
validity of the PIPES analysis. The PIPES code was then used
to analyze the San Onofre Units 2 and 3 safety valve inlet
piping. The calculated maximum drop in pressure at the San
Onofre Units 2 and 3 safety valve inlet was less than that
calculated for the EPRI/C-E test configuration. This implies
that safety valves with the San Onofre Units 2 and 3 inlet
piping configuration would operate more stably, with less
potential for chatter, when compared with operation with the
EPRI/C-E test inlet configuration. Appendix B-1 describes the
details of the San Onofre Units 2 and 3 and EPRI/C-E test inlet
piping pressure drop analyses.
5.4 Inlet Fluid Conditions
The San Onofre Units 2 and 3 safety valves are required to lift
on steam only. The specific EPRI/C-E tests on valve Model
31709NA, with the current San Onofre Units 2 and 3 ring adjust
ments, and with steam inlet conditions were Test Numbers 615, 620 and 1305. The range of peak pressures during these runs
(2639 to 2667 psia) approximated the calculated San Onofre
Units 2 and 3 peak pressure of 2760 psia (Section 4.4). The
range of inlet pressure ramp rates calculated for the San
Onofre Units 2 and 3 safety valves was 45 to 93 psi/sec, while
the EPRI/C-E steam test pressure ramp rates had a range of 308
to 317 psi/sec. Also, an EPRI/C-E steam-water transition test
(Test No. 628), with the same ring settings, was run with a low
2.5 psi/sec pressure ramp rate. This ramp rate provided a
B-44
lower bound on pressurization rate. Although the test was a
steam-water transition test that in total is not applicable to
San Onofre Units 2 and 3, the steam condition at the valve
opening would apply. The test results, therefore, indicated
that the valve stem position response during the lift on steam
is not significantly affected by a full range of the pressure
ramp rates (i.e., 2.5 to 317 psi/sec). Thus, the inlet fluid
conditions for Test Numbers 615, 620, and 1305 were considered
to be representative of the range of the calculated San Onofre
Units 2 and 3 conditions.
5.5 Backpressure
Since the EPRI/C-E tests showed that the blowdown of the Dresser
safety valves decreases with increased builtup backpressure,
the backpressure against which the San Onofre Units 2 and 3
safety valves are required to operate governs the magnitude of
the system blowdown. The builtup backpressure is a function of
the flow rate and the flow resistance of the discharge piping.
At a specified flow rate, the backpressure is a measure of
valve discharge piping resistance. In a given discharge piping
system, the backpressure is a function of the flow rate.
Although the San Onofre Units 2 and 3 safety valves have a
nominal opening setpoint of 2500 psia, as a result of the +1%
setpoint tolerance, the actual opening setpoint pressures could
differ by as much as 50 psi. Therefore, it is possible that
during some transients only one of the two safety valves would
be challenged. The lower steam flow associated with one safety
valve discharging would result in a lower builtup backpressure,
and-therefore a greater blowdown than when both safety valves
were discharging. Even if both safety valves opened simultane
ously they would not necessarily close simultaneously. For the
case of staggered valve closing, when the first valve closed
under a relatively high backpressure, the steam flow would
decrease, causing a reduction in the backpressure against which
B-45
the second valve was discharging. As a result, the second
valve would close at the lower pressure corresponding to the
lower backpressure. Therefore, operation of the San Onofre
Units 2 and 3 safety valves at the backpressures corresponding
to one and two safety valves opening must be considered.
The expected San Onofre Units 2 and 3 safety valve backpressures
for one and two safety valves discharging at rated flow are 245
psig and 427 psig respectively. The EPRI/C-E steam tests of
the Dresser 31709NA valve with the current San Onofre Units 2
and 3 adjusting ring settings, (Test Numbers 615, 620, and
1305) were performed with maximum backpressures of 311 psig,
179 psig, and 330 psig, respectively. In order to determine
the expected blowdowns for the San Onofre Units 2 and 3 safety
valve, linear interpolation and extrapolation of the test data
(Figure 3.12) was performed. From Figure 3.12, it was estimated
the San Onofre Units 2 and 3 safety valve blowdowns would be
approximately 10% and 5.5% for one and two safety valves dischar
ging, respectively. Including a +2% blowdown tolerance recom
mended by the valve manufacturer to account for uncertainties
in achieving a required blowdown, the maximum blowdowns of 12%
and 7.5%, respectively, for one and two San Onofre Units 2 and
3 safety valves discharging were derived. A minimum blowdown
of 3.5% was estimated for two safety valves discharging.
The acceptability of the range of expected blowdowns for the
San Onofre Units 2 and 3 safety valves is discussed in Section
6.0.
5.6 Valve Discharge Flange Bending Moment
In the EPRI/C-E tests of the Dresser 31709NA safety valve, satisfactory valve operability was obtained with bending mo
ments at the valve discharge flange as high as 473,200 inch-lbs
during valve operation. In the analysis of the structural
adequacy of the San Onofre Units 2 and 3 safety valve discharge
B-46
piping (Part C) the calculated maximum piping end load on the
valve discharge flange was 92,080 inch-lbs. Thus, the San
Onofre Units 2 and 3 safety valve discharge flange will be
subjected to loadings which are less than its tested loading
capability (Part C, Table 6.2-6).
6.0 ACCEPTABILITY OF SAN ONOFRE UNITS 2 AND 3 SAFETY VALVES RANGE
OF EXPECTED BLOWDOWNS
6.1 High Blowdown
With the current valve ring settings for the San Onofre Units 2
and 3 safety valves, blowdowns in excess of 5% are expected.
The 1974 ASME Code, to which the.San Onofre Units 2 and 3
safety valves were designed and built, required that blowdown
not exceed 5%. However, beginning with the Summer 1975 Addenda
to the 1974 ASME Code (paragraph NB-7614.2) blowdowns in
excess of 5% are permitted if appropriate justification is
provided.
The concern with an extended blowdown of the San Onofre Units 2
and 3 safety valves is that the pressurizer pressure might
decrease sufficiently below the pressure corresponding to the
pressurizer liquid saturation temperature to cause flashing and
an increase in the pressurizer two phase level. If the two-phase
level reaches the elevation of the safety valve nozzles, the
safety valves could discharge a steam-water mixture or water.
The San Onofre Units 2 and 3 safety valves were not designed to
operate with these fluid conditions.
Analyses which show that the extended blowdowns expected for
the San Onofre Units 2 and 3 safety valves will not result in
the pressurizer two-phase level reaching the safety valve
nozzles are described in Appendix B-2. Based on these analyses,
it is concluded that following valve actuation, the steam fluid
conditions at the San Onofre Units 2 and 3 safety valves'
inlets will be maintained, despite the extended blowdown.
B-47
6.2 Low Blowdown
Based on the extrapolation of results of the EPRI/C-E test
program, it was estimated that the San Onofre Units 2 and 3
safety valves might have a blowdown as low as 3.5% (i.e., 5.5%
+ 2%) due to the high backpressure when both valves operated in unison. The EPRI/C-E tests indicated that valve instability
might be associated with short valve blowdowns. An evaluation
used to justify that the San Onofre Units 2 and 3 safety valves
would operate stably when operating in unison is given below.
A 3.5% blowdown of the San Onofre Units 2 and 3 safety valves
corresponds to a valve closing pressure of 87.5 psi below the
opening pressure. The analysis in Appendix B-1 shows that the
maximum expected drop in pressure at the valve inlet as the
valve opens is 66 psi so that valve inlet pressure remains
above the valve closing pressure. Thus, the valve tends to
stay open.
The argument above assumes that the maximum backpressure occurs
when the transient valve inlet pressure drop is at a maximum.
A further contribution to stability is expected when it is
considered that, due to the extremely rapid valve opening time
(<20 ms), the backpressure has not built up to its maximum
value at the time the valve transient inlet pressure drop is at
its maximum. (Refer to Figure 5.2 of Part C). At the time of
minimum valve inlet pressure, the backpressure has not builtup
to its maximum value. Hence, the effective blowdown pressure
is lower, increasing the margin between minimum valve inlet
pressure and effective blowdown pressure. Based on these
arguments, valve instability due to the transient inlet pressure
drop is not anticipated for the San Onofre Units 2 and 3 system.
7.0 SUMMARY
The preceeding sections provided a description of the EPRI/C-E
Safety Valve Test Program. Tests of the Dresser Model 31709NA
B-48
safety valve and a summary of the test results were detailed.
The EPRI/C-E test results were then evaluated for their appli
cability to the San Onofre Units 2 and 3 safety valves. Demon
stration of safety valve operability was based on the following:
1. The same model safety valve as provided for San Onofre
Units 2 and 3 was tested in the EPRI/C-E Safety Valve Test
Program.
2. The identical safety valve adjusting ring settings used
for the San Onofre Units 2 and 3 safety valves were tested.
3. Based on a combination of test data and analysis, the San
Onofre Units 2 and 3 valve inlet piping configuration was
shown to enhance the stability of valve operation relative
to the EPRI/C-E test valve inlet configuration.
4. The range of valve inlet fluid conditions used in the
testing either enveloped or were basically equivalent to
the corresponding conditions estimated for the San Onofre
Units 2 and 3 safety valves.
5. The maximum measured bending moment at the test valve
discharge flange significantly exceeded the maximum calcu
lated value for the San Onofre Units 2 and 3 valves.
6. The range of blowdowns expected for San Onofre Units 2 and
3 were based on the EPRI/C-E test backpressure vs. blowdown
data. This range included a +2% valve manufacturer's
recommended tolerance and was shown to be compatible with
steam inlet fluid conditions and with stable valve operation.
B-49
8.0 CONCLUSION
The EPRI/C-E test results for the Dresser 31709NA Safety valve, in
conjunction with the evaluation discussed in Part B, demonstrate the
satisfactory operability of the San Onofre Units 2 and 3 safety
valves.
9.0 REFERENCES
1. EPRI/C-E Valve Test Facility Summary Description, Internal Combustion
Engineering Report.
2. Dresser Industries Service Manual MA-NCOO7, Rev. 1, October 1978,
Consolidated Closed Bonnet Maxflow Safety Valves Type 31700.
3. EPRI PWR Safety and Relief Valve Test Program-Test Condition Justifi
cation Report, Research Project V102, Interim Report, April 1982.
4. EPRI PWR Safety and Relief Valve Test ProgramSafety and Relief Valve
Test Report, Research Project V102, Interim Report, April 1982.
5. Valve Inlet Fluid Conditions for Pressurizer Safety and Relief
Valves in Combustion Engineering-Designed Plants, NP-Research Project
V102-20 (Phase B), Interim Report, March 1982, prepared by Combustion
Engineering, Inc. for EPRI.
B-50
PART B
Appendix B-1
Comparison of the San Onofre Units 2 and 3 Safety Valve Inlet
Piping and The EPRI/C-E Test Valve Inlet Piping
PART B
Appendix B-1
Comparison of the San Onofre Units 2 and 3 Safety
Valve Inlet Piping and the EPRI/C-E Test Valve
Inlet Piping
The purpose of this evaluation is to evaluate the difference, with respect to
valve inlet transient pressure drop at valve opening, of the San Onofre Units
2 and 3 pressurizer safety valve inlet piping configuration and the inlet
piping configuration used for the EPRI/C-E Dresser Valve Model 31709NA tests.
Figures B-1-1 and B-1-3 show the inlet piping configurations for the EPRI/C-E
test valve and for the San Onofre Units 2 and 3 safety valves, respectively.
The EPRI/C-E test program experimental results, generated during testing of
the Dresser safety valve with a vertical inlet piping configuration, along
with the PIPES 1 computer code, are used for this purpose. Test measurements
are used to verify the adequacy of the analytical method.
The PIPES computer code employs the method of characteristics to solve the
equations of conservation of mass, momentum, and energy. Computations of
fluid conditions are made for a large number of discrete points within the
piping system. The code can track the propagation of pressure waves in a
complex piping network following a system perturbation such as a valve opening.
Selected test measurements from EPRI/C-E Test No. 615 are compared with the
simulated results to demonstrate the validity of the analytical method. The
EPRI/C-E test data provide the valve opening function necessary for the analy
tical simulation of the EPRI/C-E test program safety valve inlet piping and
the San Onofre Units 2 and 3 safety valve inlet piping pressure transients.
It is assumed that the small differences between the two piping configurations
being analyzed would have negligible effects on the valve opening characteristics
(which occurs over an approximate 20 millisecond period). The simulated
safety valve mass flow rate is matched to the experimentally measured mass
flow rate. The primary test measurement used to verify the analytical method
is the valve inlet piping pressure response, since it is a dominant factor in
controlling valve performance. Specifically, if the initial transient pressure
drop which occurs upon actuation is less than the drop in pressure corresponding
to the blowdown pressure, the propensity for stable performance is increased.
It is noted that this is a conservative approach since the buildup of backpressure
to its maximum value is not instantaneous, so that at the time of minimum
valve inlet pressure, the valve is not subjected to the maximum backpressure.
The blowdown pressure corresponding to the lower transient backpressure is
lower, which tends to stabilize valve operation.
Figure B-1-2 compares the valve inlet analytical static pressure response with
the experimental static pressure response for EPRI/C-E Test No. 615. A minor
offset between the initiation of the valve inlet pressure ramp for the experi
mental and analytical data plots was provided in Figure B-1-2 for reasons of
clarity.
The sudden drop in pressure occurs when the valve opens. It can be seen that
the analytical and experimental pressure transients are quite similar and thus
the validity of the analytical method is demonstrated. The analytical pressure
response slightly underpredicts (by 11 psi) the maximum experimental transient
B-1-3
pressure drop. Overall, good comparison between the two pressure responses is
evident and provides justification for simulating inlet piping pressure responses
for other piping configurations during steam discharge.
The pressurizer safety valve inlet piping configuration for the San Onofre
Units 2 and 3 is illustrated in Figure B-1-3. This configuration was evaluated
with the same physical conditions (steam discharge, 317 psi/sec inlet pressuriza
tion rate, experimentally determined 6 x 8 Dresser valve stem position response)
that were recorded for Test No. 615. The calculated inlet piping static
pressure transient for San Onofre Units 2 and 3 and Test No. 615 experimental
test results are illustrated in Figure B-1-4. For reasons of clarity, the
experimental and analytical plots were offset as for Figure B-1-2. The transient
pressure drop calculated for the San Onofre Units 2 and 3 safety valve inlet
piping configuration is less than that calculated for the EPRI/C-E test inlet
configuration. Therefore, San Onofre Units 2 and 3 safet valve inlet piping
can be viewed as contributing to an increased level of stability in safety
valve operation relative to the EPRI/C-E test inlet configuration. This is
primarily due to the fact that the San Onofre Units 2 and 3 inlet piping is
shorter than the EPRI/C-E test facility inlet piping configuration, which
enables a greater pressure to be sustained at the valve inlet.
It is concluded that the San Onofre Units 2 and 3 safety valve inlet piping
configuration provides a lower valve inlet transient pressure drop upon valve
actuation than the EPRI/C-E test valve inlet configuration. Therefore, it is
considered that the San Onofre Units 2 and 3 configuration is more favorable
with respect to stable valve operation than the EPRI/C-E test configuration.
B-1- 4
REFERENCES:
1 PIPES, "A Program for Calculating Dynamic Hydraulic Forces in Piping
Systems," Trans. Am. Nucl. Soc., Pg. 300, (November 1980).
2 Research Project, V102, "EPRI PWR Safety Valve and Relief Valve Test
Program," Interim Report, April 1982, Table 3.2.1.
3 Research Project V102-20, "Valve Inlet Fluid Conditions for Pressurizer
Safety and Relief Valves In C-E Designed Plants," Interim Report,
March 1982, Table 5-15.
B-1-5
Figure B-1-1 EPRI!CE TEST FACITY INLET PtPING CONFIGURATION
FOR THE DRESSER 31.709NA SAFETY VALVE
TEST VALVE
1.17' PRESSURE TRANSDUCER
8" SCH 160 x 6" SCH XX REDUCER
VENTURI 5.25'
TANK NOZZLE
TANK No. 1
B-1-6
Figure 8-L-2 COMPARISON OF ANALYTICAL AND EXPERIMENTAL SAFETY VALVE INLET PIPING
PRESSURE TRANSIENT FOR THE EPRI/C-E TEST FACILITY
2720.0
2640.0- EXPERIMENTAL PRESSURE RESPONSE
a 2560.0
ANALYTICAL PRESSURE RESPONSE
2480.0
2400.0 0 0.400 0.800 1.200 1.600 2.000 2.400 2.800
TIME, SECONDS
PRESSURIZER SAFETY VALVE INLET FLANGE MATING SURFACE
10 3/4" TYP
6" TYP
9" TYP
-*8" TYP
PRESSURIZER WALL
NOTES:
1. ALL PIPING IS 6" SCH 160 2. TOTAL LENGTH OF INLET PIPING FROM ID OF PRESSURIZER TO
VALVE INLET FLANGE MATING SURFACE = 4.3 FT.
Figure 13- 1-3 SAN ONOFRE UNITS 2 & 3 PRESSURIZER SAFETY VALVES
INLET PIPING CONFIGURATION
B-1-8
Figure D- t COMPARISON OF ANALYTICAL INLET PIPING PRESSURE RESPONSE FOR THE SAN ONOFRE
CONFIGURATION WITH THE EPRI/C-E TEST FACILITY EXPERIMENTAL RESULTS
2720.0
EXPERIMENTAL PRESSURE 2640.0 RESPONSE
C,,
2560.0
Lu RESPONSE
2480.0
2400.0 0 0.400 0.800 1.200 1.600 2.000 2.400 2.800
TIME. SECONDS
PART B
APPENDIX B-2
JUSTIFICATION FOR INCREASED SAN ONOFRE UNITS 2 AND 3 SAFETY VALVE BLOWDOWN
1.0 PURPOSE
The purpose of this appendix is to provide the justification for the extended
blowdown of the San Onofre Units 2 and 3 safety valves (). The safety valve
ring settings(2) recommended by the valve manufacturer are expected to result
in blowdown in excess of the 5% required by the 1974 ASME Code, to which the
San Onofre Units 2 and 3 safety valves were designed and built. Beginning
with the Summer 1975 Addenda to the 1974 ASME Code, paragraph NB-7614.2,
blowdowns in excess of 5% were permitted if appropriate justification was
provided.
2.0 SCOPE
The scope of this justification is limited to the pressurizer safety valves
supplied to San Onofre Units 2 and 3.
3.0 ANALYSIS
3.1 Method
This analysis is to demonstrate that for the plant transient producing the
highest liquid level in the pressurizer, the superimposition of a liquid level
swell due to the flashing resulting from a 12% blowdown does not result in the
pressurizer two-phase level reaching the safety valve nozzle elevation.
(1) Dresser Type 31709NA.
(2) Recommended Valve Ring Settings:
Upper Ring Position, 48 notches below top of holes in guide.
Middle Ring Position, 20 notches below nozzle seat.
Lower Ring Position, Zero notches below nozzle seat.
B-2-2
Of all the FSAR pressurization transients considered for San Onofre Units 2
and 3, the Feedwater Line Break (FWLB) transient (a faulted event) has been
found to cause the greatest increase in pressurizer level. Therefore, this
transient was selected as the basis of the study of the extended safety valve
blowdown. The conservative FSAR Feedwater Line Break with Loss of Offsite
Power analysis was reanalyzed using initial conditions and assumptions which
would specifically tend to maximize the volume of insurge into the pressurizer.
The volume increase due to level swell (resulting from flashing of saturated
pressurizer liquid) as a function of the blowdown pressure was determined and
added to the maximum insurge volume to determine the maximum two-phase pressurizer
level. This level was compared to the elevation of the safety valve nozzles
to determine whether two-phase liquid would reach the safety valve inlet.
A similar calculation was performed based on the Loss of Condenser Vacuum
(LOCV) analysis in the FSAR, which is similar to (but more adverse than) the
Loss of Load transient. The Loss of Load transient is a moderate frequency
event, and as such, was considered as the design basis event for the sizing of
the safety valves.
3.2 Assumptions
In the rerun of the Feedwater Line Break with Loss of Offsite Power analysis,
the same conservative licensing assumptions used in the FSAR were applied,
with the following changes in order to maximize the pressurizer two-phase
level:
(a) Initial pressurizer liquid volume was increased from 800 ft3 to 860 ft3
the pressurizer high level alarm setpoint, to maximize the initial pres
surizer liquid inventory.
(b) Initial pressurizer pressure was increased from the normal operating
value (2250 psia) to 2300 psia in order to maximize the flashing in the
pressurizer during the extended blowdown.
B-2-3
(c) The feedwater line break size was increased from 0.2 ft to 0.3 ft to
maximize the volume of insurge into the pressurizer.
In the calculation of the pressurizer level swell due to steam bubble
formation the following assumptions were made:
(d) The volume of insurge water into the pressurizer was taken as the
maximum calculated value during the entire transient with no credit
being taken for any outsurge prior to the closing of the safety valves.
(e) The subcooled reactor coolant insurge into the pressurizer does not
mix with the saturated water initially present.
(f) The water initially in the pressurizer remains saturated and the steam
bubbles that are flashed from the pressurizer liquid remain in the
body of the liquid, effectively raisingthe liquid level. No flashed
steam enters the steam space from the liquid.
For the Loss of Load analysis (considered to be conservatively represented
by the more adverse Loss of Condenser Vacuum event) the maximum insurge
volume was taken from the FSAR analysis of the LOCV event. In addition,
the above assumptions were applied with the exception of Assumption (c),
which is not applicable.
4.0 DISCUSSION OF RESULTS
The results of the Feedwater Line Break With Loss of Offsite Power Analysis
indicates that a blowdown of 12% would not result in the liquid level
exceeding the elevation of the safety valve nozzles. Since the maximum
blowdown with two safety valves operating simultaneously is expected to be
about 7 1/2% (5 1/2% + 2% tolerance), the conservative analysis indicates
that liquid would not reach the valves under these conditions.
If, during the blowdown, there is a significant difference between the
closing pressures of the two safety valves, then, after the first valve
closes, the steam discharge rate would decrease, causing a reduction in the
B-2-4
backpressure against which the second valve was dischargin-g. As a result
of the reduced backpressure, the second valve blowdown could increase to
12% (10% + 2% at 245 psig backpressure), based on the EPRI/C-E valve test results.
Thus, the calculations show that, for the FWLB event, operation of the
safety valve(s) against the lower backpressure corresponding to single
valve discharge results in the pressurizer two-phase level not exceeding
the level of the bottom of the safety valve nozzles. Considering the very
conservative assumptions made with respect to mixing in the pressurizer and
the disengagement of steam bubbles from within the liquid, as well as the
numerous conservatisms inherent in the basic FWLB analysis in the FSAR, the
potential for liquid level swell approaching the safety valve inlet is
further reduced.
The conservative Loss of Condenser Vacuum analysis indicates that the
pressurizer liquid level would remain below the safety valve nozzles for
blowdowns up to about 15%, compared with the maximum expected blowdowns of
7 1/2% and 12% for two valve and single valve discharge, respectively. By
applying these results to the less severe, moderate frequency Loss of Load
Event, which is the design basis for safety valve sizing, it can be concluded
that a considerable margin exists between the maximum pressurizer liquid
level and the safety valve nozzle elevation for this transient.
5.0 CONCLUSIONS
The increased blowdown resulting from the safety valve ring settings speci
fied herein will ensure steam conditions at the valve when discharging.
The increased blowdown will not result in the introduction of liquid water
into the valves during the design basis events considered in the plant
design.
B-2-5
Part C - SAN ONOFRE UNITS 2 & 3 SAFETY VALVE DISCHARGE PIPING ADEQUACY
Table of Contents
PAGE
1.0 PURPOSE C-1
2.0 GENERAL APPROACH C-1
2.1 Thermal-Hydraulic Analysis
2.2 Piping Structural Analysis
3.0 EPRI TEST PROGRAM C-5
4.0 SAN ONOFRE UNITS 2 & 3 SAFETY VALVE DISCHARGE PIPING ARRANGEMENT C-11
4.1 Physical Description
4.2 Function of System
5.0 APPLICABILITY OF EPRI TESTS TO SAN ONOFRE UNITS 2 & 3 SAFETY VALVE C-17
DISCHARGE PIPE MODELING
5.1 Comparison of RELAP 4/ANSYR and RELAP 5/MOD 1
5.2 Summary of the Comparison Results
6.0 EVALUATION OF SAN ONOFRE UNITS 2 & 3 SAFETY VALVE DISCHARGE PIPING C-28
6.1 Forcing Functions Obtained from RELAP 4/ANSYR
6.2 Structural Response Analysis of SAN ONOFRE UNITS 2 & 3 Safety
Valve Discharge Piping System
6.2.1 Mathematic Model
6.2.2 Loading Conditions
6.2.3 Loading Combinations and Applicable
Codes
6.2.4 Results of Piping Structural Analysis
7.0 SUMMARY C-61
C-ii
PART C
SAN ONOFRE UNITS 2 & 3 SAFETY VALVE DISCHARGE PIPING ADEQUACY
1.0 PURPOSE
The purpose of this analysis is to review the design adequacy of San
Onofre Units 2 & 3 pressurizer safety valve discharge piping using analy
tical methods based on the EPRI test program. The valves, discharge
piping, and associated piping supports are evaluated during safety valve
discharge transient operation.
The analytical method involves a two-step process:
1) Using a thermal-hydraulic code to generate the input forcing func
tion for the piping structural analysis.
2) Perform the piping structural analysis to obtain the piping struc
tural dynamic response solutions.
2.0 GENERAL APPROACH
The general approach used in both thermal-hydraulic and piping structural
analyses is described in this Section. A brief description of the com
puter codes used, together with their modeling technique, is also pre
sented.
2.1 Thermal-Hydraulic Analysis
The purpose of the thermal hydraulic analysis is to generate input forc
ing functions for the piping structural analysis. Each of these piping
forces has three components: pressure force (PA), momentum force
(pV 2 A/g) and wave force (L- ). In order to calculate these component c g d
forces, the system transienE thermal-hydraulic properties such as pres
sure (P), density (p), fluid flow velocity (V), and fluid mass flow rate
(w) during the transient are required. The geometrical data such as pipe
flow area (A) and pipe length (L) are also required. The term gc is the
C-1
gravitation constant. Two computer codes, RELAP4 and ANSYR, are used.
RELAP4 calculates the system transient response while ANSYR, a
post-processor of RELAP4, calculates the force vs. time history.
RELAP4 (Reference 1) is a thermal-hydraulic code designed to perform
transient analysis of nuclear power plant piping. It solves the three
basic conservation equations, conservation of mass, momentum, and energy.
In using RELAP4, the system is divided into volumes called control
volumes. The flow paths between the control volumes are called junc
tions. The user identifies the system initial conditions such as pres
sure, temperature, quality, --- etc. at the volumes and the mass flow
rate at the junctions. The code calculates the system transient response
after the initiation of an upset condition. Figure 2-1 shows the RELAP4
nodalization diagram for modeling the San Onofre Units 2 & 3 pressurizer
safety valve discharge piping system. It has a total of 49 volumes and
51 junctions.
ANSYR (Reference 2) is an interface computer code designed to couple
RELAP4 with the structural analysis code, ANSYS, which is used in this
analysis. ANSYR retrieves relevant data from RELAP4 to calculate pres
sure force (PA), momentum force (pV 2A/ge) and wave force ( c ) at specified structural support locations. The output force from ANSYR
is the sum of the above three component forces referencing the Cartesian
global coordinates. Also, the output format is compatible with the input
requirements of the ANSYS structural analysis code.
In this analysis, one structural node is used at each reducer, tee, and
nozzle while two structural nodes are used at each elbow. One node is
used at the beginning of the elbow and the other node at the downstream
end of the elbow. A total of 31 structural nodes are used as shown in
Figure 2.1.
RELAP4 Code has been assessed in the EPRI report (Reference 3) as appli
cable to safety valve discharge piping with saturated steam, which is the
case for San Onofre Units 2 & 3 safety valve discharge. The RELAP4/
ANSYR package was also used to model the EPRI safety valve dis
C-2
charge sample case. Comparisons between calculated results obtained from
RELAP4 and those obtained from RELAP5 using the EPRI sample case showed
favorable agreement. Details of this comparison are presented in
Section 5.
2.2 Piping Structural Analysis
In order to evaluate the dynamic response of San Onofre Nuclear
Units 2 & 3 safety valve discharge piping due to the transient discharge
forces, a three dimensional finite element beam model was developed.
Time-history analysis using the step-by-step direct integration procedure
was performed using the ANSYS code (Reference 4). The reduced linear
dynamic analysis version of ANSYS was used. Lumped masses were located
at carefully selected master degrees of freedom in order to adequately
represent the dynamic behavior of the system. In general, the master
degrees of freedom in the axial direction along the pipe run are kept to
a minimum, since the axial movements of the masses are restrained by the
axial rigidity of the pipe. Also, the axial degree of freedom is
released if the axial direction movement is directly restrained by an
anchor. If a nodal point is near a restraint, the master degree of
freedom in the direction of the restraint can also be released.
The time varying forcing functions, representing the safety valve dis
charge forces as described in the previous section were applied at loca
tions of direction or area changes-typically at the begining and end of
elbows, Tee intersection points and at reducers. Such locations are
illustrated schematically in figure 6.2-3.
A description of the analytical method of solving the governing equations
is presented in Reference 4.
Results of the piping structural analysis are presented in section 6.2.
C-3
LANCn B BRANCH A
so '+
@@3 (D635 41 17 2BRANCH A
, 34
BRANCH B Pressurizer
Control volume
Q Junction number
ZL Structural nodes (at vhich forcing, function is generoted) 1,
@If
Figure 2-1 Nodalization Diagram Of
San Onofre Units 2 & 3 Safety Valve
Quench Tank Discharge System
C-4
3.0 EPRI TEST PROGRAM
One objective of the EPRI/CE test program was to obtain test data suit
able to verify analytical models used to evaluate discharge piping sys
tems. Full flow tests of selected valves were performed under a wide
range of fluid conditions. Each test was to demonstrate the operability
of the valves as well as obtain data such as valve capacity and fluid
flow reaction force. The valve types tested included essentially all
generic safety valve types used by power plant designers and included
models supplied by each of the major safety valve suppliers. The piping
configuration used in the tests are described in Reference 6.
3.1 Inlet piping: Two inlet piping configurations were used - one repre
senting a short vertical inlet pipe and one representing a piping loop
seal configuration.
3.2 Outlet piping: A four-segment piping in a vertical plane was used.
Pipes and fittings used are typical of those used in PWR plants. Figure
3.1 and 3.2 depicts the test configuration used in Reference 6.
3.3 Pipe supports: Extremely rigid support structures were designed for the
test valve stand and the test valve discharge piping to limit the peak
dynamic response to 1.1 of the hydraulic forcing function peak value. In
addition to the test valve stand, the discharge pipe was supported at the
second discharge elbow, midway between the second and the third discharge
elbows, and at the third discharge elbow. The piping support structures
at the second and third discharge elbows are shown in Figures 3.3 and 3.4
respectively. At the second discharge elbow the pipe is restrained in
both the horizontal and vertical directions. The structure midway
between the second and third discharge elbows includes hydraulic snubbers
and is installed to restrict the out-of-plane vibrations of this rela
tively long section of piping. The third elbow support allows for free
in-plane horizontal motion but is rigid vertically.
C-5
Upstream fluid conditions include single phase steam (representing the
normal design condition and the majority of postulated plant transient
and accidents), single-phase sub-cooled water, and a transition flow test
in which the test valve opens and discharge steam followed by a transi
tion to subcooled water flow. Strain gages, load cells and displacement
transducers are used for measurement of valve and piping reaction forces.
Only EPRI tests using saturated steam followed by steam discharge are
related to San Onofre Units 2 & 3 safety valve discharge piping. See
Section 5 for a discussion of applicability of EPRI tests to San Onofre
Units 2 & 3 safety valve discharge piping.
C-6
Note: This isometric depicts
the EPRI Test Facility configuration
used to obtain discharge pipe response
data. There is no U bend (liquid loop
seal) in San Onofre Units 2 & 3 TEST VALVE Pressurizer Safety valve piping arragnement. VALV E
s Ch. x x
8" Sch.160 V'Sch.40
RUPTURE DISC.
Figure 3-1. Isometric of the Test Facility Piping
d(See above note)
C- 7
Test Valve PT 9Elbow 1
Loop Seal
'Venturi --..
-Area Change
Accul atot Tank I
Segiment 1
PT 10
Orifice
Segaent 3 PT II
Elbow 2 Segment 2
Elbow 3
Figure 3-2 Simplified Schematic of the C-E Test Facility
ow
I - SUPPORT LINKS
*SUPPORT UNSUPPORT
LINKS
.* use ega
.~~~~~" *.7 ,,. q*
SECTION 8-8 SECTION A-A SECOND ELBOW PIPE SUPPORT ASS'Y
Figure 3-3 Diagram of the Second Elbow Pipe upport Assembly
f2 ScA. g0 PIPE
PIN JOINT
LWA CELL
PIN JORNT
Figure 3-4. Diagram of the Third Elbow Pipe Support Assembly
C-10
4.0 SAN ONOFRE UNITS 2 & 3 SAFETY VALVE DISCHARGE PIPING ARRANGEMENT
4.1 Physical Description
The pressurizer safety valve discharge piping system extends from the
pressurizer safety valve to the quench tank steam inlet nozzle. Each
pressurizer safety valve is independently connected to pressurizer
nozzle at the top head of the pressurizer through separate 6-inch sche
dule 160 lines. The discharge pipe from each safety valve is an 8 inch
schedule 20 line. The discharge pipe from each valve combine further
downstream at a 12 x 12 x 8-inch butt-welding reducing tee into a 12-inch
schedule 20 line which continues to the quench tank. The safety valve
discharge piping system is Quality Class III, Seismic Category II, non-safety related piping. A schematic diagram showing jurisdictional
boundaries of the pressurizer safety valve discharge system is presented
in Figure 4-1. The detailed stress isometrics with the piping supports
are shown in Figures 4-2 thru 4-5.
4.2 Function of System
The function of the safety valve is to provide overpressure protection
and transient pressure control of the pressurizer in the Reactor Coolant
System (RCS). The two pressurizer safety valves, as well as the quench
tank, are designed to accommodate the full capacity of the discharge of
the pressurizer safety valves.
C-11
A: Quality Class I, 2psy 2.Seismic Category I, o2o c'200 ASME Class 1
Piping
J: Quality Class III
Seismic Category II
ANSI B33.1 Piping
E- 08-7
/12r/2)e6 RED. TEE
0-5- /2- J Eo
T-- O / /
Figure 4-1. Schematic of Jurisdictional Boundaries of
Pressurizer Relief System for San Onofte
Units 2 and 3
C-12
DWU. WO. 2 -74a/- 35 -/
BECHTEL POWER CORPORAT'N ISOMETRIC SKETCH SHEET PIPE STRESS CALCULATION NO
PROJECT S0Ao6S UNITS 2 13 SUIJECT (120/) 035-6-- kEO ;49- /Z-J-KA' SHEET OF IADOITIONAL IfOMMATION O uN TCDATIAftDITAILS$IET, CONVENTION BY DATE
EE, COMP. S Ey. NO.
REF DWGSAREA() REF DWG (1) al MAXIMUMSTRLz 40421 '3 Nodal Point"
40422-8 40394- 9
GONI TA/N /ff &r REACTO0R COOLANT
P & ID 40111- 04
0o- 0 1 40r
misuL -.AVA -i
035-8" O0 0 0
P 31430 3%
2P o 6
Se 2o 4
LINE NO kIj 1 E
5CH 2se1 t
011.6 W 37Z.333 0%
H N af UPDA TED PER DCP 24 P/ID 26 'lI REV/5ED AS NOTED
me D eV DATE CmID DArI DESCRETCNa SCHTIL JOM.
REVISIONS REVISIONS If
Figure 4-2 San Onofre Units 2 & 3 Pressurizer Safety Relief Piping Layout Drawing
fwd. NO. ?-120/-024 -I BECHTEL POwER CORPORATION ISOMETRIC SKETCH SHEET PIPE STRESS CALCULATION NO
PROJECT pf45 UA//TrS Z 3SUWECT 40/ 024-"-11d960 _ SHEET / OF
tADDITIONAL IMSDMMATION NmiAm DATA .0 DETAI OMIT CNVENTION DY tSD4(MIATE /DT /D8D
p"COMP. SERV. NO.__
REEAFSDNGS
M ORSTRESS
SUBJEC / / g fHEE OFW'
__________ CONrMPEV. A NT
40421-7 < CO 0-1
REF IAREASS)e4cTO
*N5L* N/A"- N el u
P& ID0Noa it
00111 0
IMAX OPR
POESS
--
00o50
o
TEMP 470 43&
I . W372.333 C-) IT~~ 7lI
He A 2 4 1-10 UPDATED PER DCP 24 /V F e8 * 1 REV/6E9 AS A.TEDSLP /L < UPDATEo PER CN 0// E /- E D1UPD47E
ReW T DATE C DATS Pg v DATE CUED DATS DSCalm I STILDGNO.
REVISIONS REVISIONS
Figure 4-3 San Onofre Units 2 & 3 Pressurizer Safety Relief Pipini Layout Drawing
DW. NO.-2-/0/-033-1 BECHTEL POWER CORPORATION ISOMETRIC SKETCH SHEET PIPE STRESS CALCULATION NO,
PROJECT SjG UT,5 ? 3 SUBECT (/20/ O3-"A-EES
ADD IT IONALDEIL 1 CONVENTION ey.iyZATE //
REF DWGS 4042/-7 EEO IFps
'~ CONTAINMENT
P & ID 40///*$
,92A1 16&f~4 0 _Q---Nodal Point
Isut UL 46 CHC
**o CV 0'
PP.15E 2485 2235
nor 700 t53
C)
RENFRMAT ION~ D aiM RCATA ND E AILS ETai muV m aE C D TE. ceI i
0 04:
0 080
REVISIONS CEVONIOTO B 007-003
Figure 4-4 San Onofre Units 2 & 3 Pressurizer Safety Relief Piping Layout Drawing
4- BECHTEL POWER CORPORAI I UN ISOME ;RIC Sus-Tr4 SHEET PIPE STRESS CALCULATION NO.
PROJECT SOA-_ 1 UA/ TS 2 03 sUjEC r/ / )._-___S S-EET / OF
ADoefDmAL INORMATION 004 tDNM DATA AN .L .1IT CNVENTION BYT4eC DATA a1D-I6S
REF DWGS AREA(S)
404 f/-7 00MAXIUUMSTRES ) q PIT -W 'to A 0 Q 0 IS0 N '
P&ID ?/rW eAcToS C00AAIT P & ID 04 o 4 L-*9
/AJSUL*4.5 eoCDO
a on WAW
Q) -0Nodal Point
OW2. No--Td-S
IN c LSP TE MN 'SS,C UPALCTEU v i 01 DATE (-O D At OfSCRITIONO C DArEj UECCRrPy O NV N N Y D T
REVISIE REVISIONS
Figure 4-5 San Onofre Units 2 & 3 Pressurizer Safety Relief Piping Layout Drawing
5.0 APPLICABILITY OF EPRI TESTS TO SAN ONOFRE UNITS 2 & 3 SAFETY
VALVE DISCHARGE PIPE MODELING
One of the objectives of the EPRI tests included the verification of
the RELAP5 (Reference 5) computer code by comparing analytical results
with test data using benchmark problems. The tests were conducted
using the following fluid conditions:
1. Steam only
2. Steam with Loop seal
3. Saturated liquid
4. Transition: Steam to saturated liquid.
Most of the test cases performed by EPRI utilized long inlet configu
ration piping with either Crosby 3K6 or 6M6 valves. Of these tests,
five were selected for RELAP5/MOD1 verification (Reference 6). These
five sample cases utilized different fluid conditions including steam
discharge (Test 1411), hot water loop seal discharge (Test 917), cold
water loop seal discharge (Test 908 & Test 1017), and water discharge
(Test 1027). In all cases, it was demonstrated that RELAP5/MOD1
satisfactorily predicted discharge piping support loads observed
during the testing. It has been concluded that RELAP5/MOD1 is a
suitable tool for the prediction of discharge piping hydrodynamic
loads in pressurizer safety valve discharge piping system.
RELAP4/ANSYR was used for the thermal-hydraulic analysis of the San
Onofre Units 2 & 3 safety valve piping system. RELAP4/ANSYR has been
determined applicable for safety valve analysis (Reference 3).
Additional verification using the EPRI tests further confirms its
applicability. For San Onofre Units 2 & 3, the valve inlet piping is
C-17
less than 4 feet long and does not contain the U-bend (liquid loop
seal). The fluid condition is steam only. The fluid flow transients
through the valve for the EPRI sample case, Test 1411, also includes
steam only. Therefore, comparisons are made between the calculations
obtained from RELAP5/MOD1 and RELAP4/ANSYR using the EPRI sample
case, Test 1411.
5.1 Comparison of RELAP4/ANSYR and RELAP5/MOD1
The schematic diagram of the EPRI test facility is shown in Figure
3-2. The corresponding isometric drawing is shown in Figure 3-1.
The test facility consists of an accumulator tank, U-bend, safety
valve and discharge piping. Initially, the safety valve is closed.
When the valve set pressure is reached, the valve opens and discharges
the fluid upstream of the valve into the atmosphere through the
discharge piping.
Figure 5-1 shows the RELAP4 nodalization diagram used to model the
test facility. It consists of 33 volumes and 33 junctions.
To simulate the condition of Test 1411 closely, RELAP4 follows the
same modeling approach used in RELAP5. These conditions are as
follows:
1) In the test, the accumulator pressure was ramped from 2410 psia
at t=0.0 seconds to 2540 psia at t=0.5 seconds. This pressure
ramp was modeled both in RELAP5 and RELAP4.
2) The valve flow area was reduced to 88% of the manufacturer's
stated flow area (i.e. 0.0232x0.88=0.0204 ft 2). This achieved
the measured steady-state flow rate in the RELAP5 calculation.
In the RELAP4 calculation, the reduced area yielded a valve flow
rate of 119 bm/sec which is close to the test data, 116 bm/sec.
C-18
3) On the test facility, the fluid condition downstream of
the valve prior to valve opening shows the fluid temperature
at 2120 F, indicating valve leakage prior to the transient.
Accordingly, it was assumed that the discharge pipe
initially contained steam. Since its quality cannot be
determined from experimental tests, a wet steam with
quality of 0.9 was used in both RELAP5 and RELAP4
modeling.
4) For the steam only discharge test, the valve opening
characteristic has a major effect on the resultant
loads generated on the downstream pipe segments.
Therefore, it was necessary to accurately represent the
valve opening characteristic in the calculation. A
linearly valve opening characteristic over 20 milliseconds
was used in both RELAP5 and RELAP4 calculation. The
valve set pressure was 2410 psia. The valve is actuated
to open at the initiation of the transient calculation.
Figures 5-2 thru 5-7 show the comparisons of calculated
results between RELAP5 and RELAP4. Figures 5-2, 5-3 and 5-4
are the system pressure comparisons at measurement locations P9,
P10 and P11 as shown in Figure 3-2. It can be seen that all
results at measurement locations indicate acceptable agreement
between RELAP5 and RELAP4.
Figures 5-5 thru 5-7 show the forcing function comparisons
at segment 1, 2 and 3 respectively in the discharge piping.
It shows RELAP5/MOD1 and RELAP4/ANSYR have the same trend in
the force vs. time history. With respect to magnitude,
RELAP4/ANSYR yields more conservative results than RELAP5/MOD1.
5.2 Summary of the Comparision Results
The following conclusions are drawn from the verification
comparison discussed above:
C-19
1) The system pressure comparison shows acceptable agreement between
RELAP4 and RELAP5.
2) The force vs. time-history obtained from RELAP4/ANSYR package
follows the same trend as that shown for RELAP5/MOD1.
3) The forcing function obtained from RELAP4/ANSYR is more conservative
than that of RELAP5/MOD1.
These conclusions confirm the applicablilty of RELAP4/ANSYR package
for use in modeling the San Onofre Units 2 & 3 safety valve discharge
piping system.
C-20
Test Valve
11
4 12 Control volume
3 7 Junction number
[15
Ib
Tank
IB
3322
Figure 5-1. RELAP/ANSYR Nodalization Diagram of EPRI Test 1411
C-21
D1
---ELAP5/MD
I~~~1 1.::~ ~1t*
_i I. A
N)-. CI E
, &-__ _ __ _ _ _--_ _ _
F eI .5 CoiaioID, YIe I6sud''' Ig 0 i _ __ _ - 1, it...
1 I o'1 - 1I rr
0 , , I i i ~ i _ __OD
IA OAN,1
A ---- ---
LII
I, JI SEK w -u i:
Fi, 4 ioinarisn O.Syb~mPressure @ Mealsurement Location 11I
6.0 EVALUATION OF SAN ONOFRE UNITS 2 & 3 SAFETY VALVE DISCHARGE PIPING
The input forcing function for the piping structural analysis was
obtained from the RELAP4/ANSYR Code. The ANSYS code was used to
perform the piping structural analysis. Three cases were evaluated
with different safety valve opening times.
6.1 Forcing Function Obtained From RELAP4/ANSYR
The San Onofre Units 2 & 3 safety valve discharge piping system was
modeled with 49 volumes linked together by 51 junctions. A total of
31 structural nodes were used. The valve volumes upstream and down
stream of the orifice were also modeled. The system forcing functions
were calculated at each change in the piping direction. As shown in
Figure 2-1, each elbow has two structural nodal points to take the
direction change into account.
The following conditions were used in calculating the force vs. time
history:
1) Upstream of the valve, including the pressurizer, the initial
condition is conservatively assumed to be saturated steam at
2600 psia. This pressure condition is used to generate higher
flowrate to match Test Case 1305 (Reference 7) of the Dresser
valve. The recorded flow rate is 640,000 lbs/hr at an inlet
pressure of 2651 psia. The rated flow of San Onofre Units 2 & 3
safety valve at 2500 psia is 504,875 lb/hr. At 2600 psia the
discharge flow rate is 626,400 lbs/hr by calculation.
2) Downsteam of the valve, including the quench tank, the initial
condition is conservatively assumed to be saturated steam at
14.7 psia.
C-28
3) The valve opens linearly in 16 msec.
4) The quench tank has a disc which ruputures open to atmosphere when
the pressure inside the tank reaches 100 psia.
Condition 1 represents the final ramped pressurizer pressure prior to
safety valve opening. Conditions 1 and 2 together represent a steam
blowdown case. Since this is a single phase phenomenon, the application
of RELAP4 is valid. Condition 3 is a conservative simplification made to
model the valve three-dimensional discharge pattern and a parabolic
flow-vs-time curve with a variable opening time. The opening time of 16
msec. was obtained from experimental tests. Since the flow through the
valve is choked, the valve discharge rate is controlled by the flow area
rather than the downstream pressure. Consequently, the usual parabolic
flow-vs-time curve was conservatively replaced by the linear area vs.
time curve during the 16 milliseconds opening time.
Three transient cases were run using RELAP4:
Case 1) Both valves open simultaneously
Case 2) One valve (valve mark No. 2PSV 0200) opens first. When the
system reaches steady state, the other valve opens. (See
Figure 4-1 for valve mark No.)
Case 3) One valve (valve mark No. 2PSV 0200) opens first. When this
valve is half-open, the other valve opens.
The case of both valves opening simultaneously is reasonable in that both
safety valves have the same set pressure.
Samples of force vs. time history plots applied to each structural nodal
point for each transient case are shown in Figures 6.1-1 thru 6.1-6. The
forces presented in these plots are the total force, i.e. the sum of
pressure, momentum and wave forces.
C-29
6.2 Structural Response Analysis of San Onofre Units 2 & 3 Safety Valve
Discharge Piping System
6.2.1 Mathematic Model
Four types of elements of the ANSYS Code: STIF 9 for straight
pipe, STIF 29 for curved pipe, STIF 14 for support restraint and
STIF 21 for 3-dimensional mass were used. Figure 6.2-1 shows
the full finite element model with the nodal and element num
bering system. Figure 6.2-2 shows the reduced model with the
assigned master degrees of freedom. The master degrees of
freedom were selected to give a reasonable range of the modes
which characterize the motion of the subject system. Knowledge
of the natural frequencies of the discharge piping system is
helpful in choosing the integration time-step "At" size and the
number of time steps required in a time-history dynamic analysis.
The natural frequencies of the San Onofre Units 2 & 3 safety valve
discharge piping system are obtained from Bechtel's in-house
verified computer program, ME101 (Reference 9). The results are
shown as follows:
Mode Natural Frequencies Mode Natural Frequencies
1 14.36 13 42.94
2 14.38 14 47.32
3 17.05 15 48.70
4 17.13 16 48.77
5 17.46 17 49.24
6 20.67 18 57.05
7 28.51 19 57.07
8 28.54 20 62.26
9 33.27 21 67.62
10 33.75 22 82.26
11 33.77 23 88.83
12 33.96 24 95.52
C-30
The integration time-step size must be small to characterize the
input thermal-hydraulic force curve. At = 0.0005 seconds was selected in the displacement pass of the ANSYS run. The integration time
step "At" is calculated using the equation At = 1/Nf, where N is integration points per cycle and f is the highest frequency of
interest. From ANSYS code, N is approximately equal to 25 based on
1% equivalent damping ratio. Therefore, the time step of 0.0005
seconds represents a cut-off frequency, "f" approximately equal to
80 Hz. The integration time "At" was maintained constant throughout
the entire analysis.
6.2.2 Loading Conditions
As stated in Section 6.1, the forcing functions due to the three
cases have been analyzed.
The forcing functions were obtained from a post-processor, ANSYR,
with time interval equal to 1 millisecond. The forcing functions
are in ANSYS input format which was stored in the file, "Tape 23."
However, the time interval of 0.5 millisecond was used in the dis
placement pass of piping structural analysis by using the linearly
interpolated option available in the ANSYS code. The forcing func
tions applied to the piping were calculated at each piping direction
change and any change in cross section of the subject piping system
in the global coordinate. Figure 6.2-3 shows the nodes at which
forces are applied.
C-31
6.2.3 Loading Combinations and Applicable Codes
6.2.3.1 Safety Valve Discharge Piping
As noted previously, the discharge piping from the outlet of the
safety valves to the pressure relief tank (nodal points 65 and
130 through 5) is classified as Quality Class III, Seismic
Category II non-safety related piping. The applicable code for
this piping is ANSI 831.1, 1974. The valve discharge transient
loads are included in the following loading combination:
Loading combination: Po +IDWI+IRVCI(See next section for
explanation)
Allowable stress: 1.8 S h
The allowable stress is selected as 1.8 Sh which is 50% increased
over 1.2 Sh (Equation 12 of ANSI 831.1 piping). The reasons
are; 1) the discharge piping is not safety related, 2) the
probability of actual safety valve actuation is extremely low.
A meeting of the S/RV Piping Subcommittee held in EPRI on
October 29, 1981 (Reference 8) recommended that a service level
C be used for the safety valve discharge transient loads based
on the extremely low probability of actual safety valve actuation.
Therefore, the allowable stress of 1.8 Sh is compatible with
EPRI's recommendations. The safety valves operability will be
demonstrated by considering the loads imposed from the discharge
piping (safety valve operability is discussed in Part B of this
report).
6.2.3.2 Piping Support Design Loads
Load combination sets used to obtain maximum pipe support design
loads for ANSI 831.1 piping in each direction that the support
acts are:
C-32
TH + DW + DBE
whichever is larger
TH + DW + RVC I
TH: Thermal load
DW: Deadweight
Po: Internal pressure
RVC: Safety valve discharge load for closed system
DBE: Design Basis earthquake
6.2.4 Results of Discharge Piping Structural Analysis
6.2.4.1 Displacement Solution
The three cases of loading conditions given in Section 6.1 were
analyzed to determine the displacement response. Approximately
670 total iterations were applied for Case 1, 1800 iterations
for Case 2 and 1200 iterations for Case 3. The time interval
(At) between two iterations was selected as 0.5 milliseconds for
all three cases. The maximum displacement occurs at the common
joint (12" x 12" x 8" tee), nodal point 30, in the discharge
piping. The results are shown in the following table.
Displacement at nodal point 30
Case Time sec Direction Displacement in.
1 0.4930E-01 X 0.3276
2 0.6475 X 0.3083
3 0.1140 X 0.3496
C-33
A typical displacement vs. time plot at nodal point 30 for
case 1 is shown in Figure 6.2-4.
6.2.4.2 Stress Solution
The time interval selected for the stress solution was At =1.0
millisecond. The stress solution from the ANSYS run results in
stress intensities, 2Tmax, at each element. Also printed are
the forces and moments at each element and their corresponding
stresses. However, Paragraph 104.8 of the ANSI B31.1 Code uses
the simplified method for calculating stress using stress indices.
Therefore, the stresses obtained from ANSYS run were recalculated
to comply with the applicable code. The moments were obtained
from the ANSYS printout at the time of iteration based on the
highest values of the stress intensity, (2T ), shown in the max Post 24 run for elements of interest.
The maximum stresses in the safety valve discharge pipe were
calculated by hand for B31.1 piping with the moments obtained
from ANSYS run. The maximum stress occurs at the common joint,
nodal point 30. Case 1 and Case 3 are the critical cases. The
results are shown in Tables 6.2-1 through 6.2-2a. Only those
nodal points having higher stress levels are shown in Tables
6.2-1 and 6.2-2a. All the piping components of the ANSI B31.1
piping meet the design allowable stress of 1.8 Sh (28,620 psi).
Maximum combined pipe support design loads are shown in Tables
6.2-7a.thru 6.2-7d. All existing pipe supports, including
snubbers and their structures, have been checked against the
design loads listed in Tables 6.2-7a thru 6.2-7d. The results
indicated that one snubber, a "Y" snubber at nodal point 60, was
found to have loads exceeding the manufacturer's load rating due
to dynamic loads resulting from the discharge transients. The
snubber was rated at 10,380 lbs consistent with the requirements
of the original design static load calculations. The calculated
C-34
discharge load at this node, as a result of the dynamic load
analysis based on the EPRI/C-E test data, was approximately 18,000
lbs. As a result of this increase over the manufacturer's
recommended load rating of the "Y" snubber at nodal point 60 due
to the dynamic analysis, alternatives which included removal or
replacement of this snubber were evaluated.
When the system was reanalyzed using Case 3 (the most limiting
case) without the "Y" snubber at nodal point 60, the results
indicated that the piping and its associated supports could
safely withstand safety valve operation for this most limiting
case.
The analysis without the "Y" snubber at nodal point 60 showed
that:
1). An increase in the calculated bending moments on one of the
two safety valve discharge flanges by approximately 15%.
The loading on the other safety valve flange decreased
slightly. Table 6.2-5 shows the bending moments on the
flanges with "Y" snubber at nodal point 60 and Table 6.2-6
shows the moments on the flanges without "Y" snubber at
nodal point 60. A comparison of the two tables shows that
the bending moments for one of the two flanges increased
from 80,446 in-lb to 92,280 in-lbs, while the bending
moments on the other flange decreased from 17,822 in-lbs to
17,670 in-lbs. In the EPRI/C-E test of the Dresser 31709 NA
safety valve, satisfactory safety valve operability was
obtained with bending moments at the valve discharge flange
as high as 473,200 in-lbs during valve operation. Thus it
can be concluded that the flange can safely withstand the
bending moment of 92,080 in-lbs which has been calculated
without the "Y" snubber at nodal point 60.
C-35
2). The stress calculated at nodal point 30 (the maximum
stress point in the discharge piping) without the "Y" snubber
at nodal point 60 as shown in Table 6.2-2b, is approximately
the same as that of the values shown in Table 6.2-2a (stress
a calculated with the "Y" snubber at nodal point 60), and is
below the allowable design stress of 1.8 Sh*
3). The pipe support design loads with the "Y" snubber at nodal
point 60 are shown in Tables 6.2-7a thru 6.2-7d. The pipe
support design loads without the "Y" snubber at nodal point
60 are shown in Tables 6.2-8a thru 6.2-8d. The capability
of the safety valve discharge piping including pipe supports,
snubbers, and their structures to withstand the revised
loadings without the "Y" snubber at nodal point 60 has been verified.
A seismic analysis of the subject system was also performed without
the "Y" snubber at nodal point 60. The results of the analysis con
firmed the structural adequacy of the San Onofre Units 2 & 3 pressurizer safety valve discharge piping without this snubber.
Accordingly, the "Y" snubber at nodal point 60 has been deleted from
the San Onofre Units 2 & 3 safety valve discharge piping configuration.
6.2.4.3 Maximum Loads on the Safety Valve Discharge Flange
Loads applied to the discharge flange of the pressurizer safety
valves with "Y" snubber at nodal point 60 in the system are
shown in Table 6.2-3. These values are the extreme values which
envelop Cases 1 and 3. The combined bending moments are shown
in Table 6.2-5. Loads applied to the discharge flanges of the
safety valves that were caculated using Case 3 (the most limiting
case), without the "Y" snubber at nodal point 60 are presented
S C-36
in Tables 6.2-4 and the combined bending moments are shown in
Table 6.2-6. As discussed previously, these loads without the
"Y" snubber are well within the 473,200 in-lbs loading which was
encountered by the safety valve discharge flange during the test
program.
C-37
TABLE 6.2-1. Maximum Stresses for Discharge Piping with "Y" Snubber at Nodal Point 60, (Eq. 12 of ANSI B31.1) - Case 1
Nodal Point Moments, in-lb 0.75i Mrpsi @ Time Sec z Element I J Component Z* in3 Max. S.I. Occurs Mx My Mz Mr i +(psi
18 28 S W Tee, 12"0 30.68 0.0420 -25692 -12180 -161190 163678 2.866 11467 4078 15,545
19 143 W Tee, 12"0 30.68 0.0495 27739 27055 277417 280110 2.866 19625 4003 23,628
21 3 40 Red, 8"0 13.77 0.0470 26642 18378 70164 77269 2.0 8417 2822 11,239
25 S 50 Elbow, 8"0 13.77 .110 28823 27782 32478 51550 2.92 8198 3045 11,243
25 49 ( Elbow, 8"O 13.77 .1665 -40742 12042 20650 47237 2.92 7512 2838 10,350
50 9 115 Elbow, 8"0 13.77 0.0495 4108 40859 2099 41118 2.92 6539 2648 9,187
43 0 99 W Tee, 8"0 13.77 0.0525 -2790 -6662 -133049 133244 2.866 20799 2745 23,544
21 35 BRA, 8"0 13.77 0.0470 -26642 -16443 -23385 39077 3.05 6491 2850 9,341
00
P = 325 psi at discharge piping obtained from RELAP4 run.
Allowable = 1.8 Sh = 1.8 x 15900 = 28,620 psi @ 700aF for SA-312 Grad. TP304.
*where Z = 7r T2 t
* 6w' p Stress due to pressure and weight obtained from Bechtel in-house computer program, HE101 (Reference 6)
indicates stress value @ node N.
TABLE 6.2-2a. Maximum Stresses for Discharge Piping with "Y" Snubber at Nodal Point 60, (Eq. 12 of ANSI B31.1) - Case 3
Nodal Point Moments, in-lb 0.75i pai * @ Time Sec z wp Eq. (12)
Element I J Component Z* in Max. S.I. Occurs Mx My Hz Mr i ) + (opsi
18 28 @ W Tee, 12"0 30.68 0.045 -18669 -3655 -162883 163990 2.866 11489 4078 15,567
19 143 W Tee, 12"0 30.68 0.053 28547 28734 283810 286685 2.866 20085 4003 24,088
43 99 W Tee, 8") 13.77 0.058 -2570 -9118 -154567 154857 2.866 24173 2745 26,918
I
TABLE 6.2-2b. Maximum Stresses for Discharge Piping without the "Y" snubber at Nodal Point 60, (Eq. 12 of ANSI B31.1) - Case 3
Nodal Point Moments, in-lb 0.75i Mr psi E*
3 @ Time Sec z wp Eq. (12) Element I J Component Z* in Max. S.I. Occurs Mx My Mz Mr i ) () psi
18 28 W Tee, 12"0 30.68 0.045 -19537 -3206 -164855 166039 2.866 11633 4078 15,710
19 143 W Tee, 12"0 30.68 0.053 30069 27037 284772 287628 2.866 20151 4003 24,154
43 99 W Tee, 8"P 13.77 0.058 -2160 -8217 -152139 152376 2.866 23785 2745 26,530
P = 325 psi at discharge piping obtained from RELAP4 run.
Allowable = 1.8 Sh = 1.8 x 15900 = 28,620 psi @ 700*F for SA-312 Grad. TP304.
*where Z = n r2 t
* 5 wtp = Stress due to pressure and weight obtained from Bechtel in-house computer program, ME101 (Reference 6)
N indicates stress value @ node N.
Table 6.2-3 Maximum Piping Loads On Safety Valve Discharge Flange With "Y" Snubber At Nodal Point 60.
Force lbs Moment in-lb Valve Mark Nodal
No. Pt. Fx y z x M
max mm max min max min max mm max mn max min
65 2PSVO200 Outlet 2192 -5244 10595 0 2189 -1501 47858 -10915 0 -14912 79052 0
130 2PSVO201 Outlet 233 -8881 0 -552 726 -687 4580 -484 5344 -9074 15409 -616
where:
X, Y, Z: Global Coordinates
0 x,y,z: Element Coordinates
Y Y
zx 150 85,
Y 329' (s &r&
Table 6.2-4 Maximum Piping Loads On Safety Valve Discharge Flange Without "Y" Snubber At Nodal Point 60.
Force lbs Moment in-lb Valve Mark Nodal
No. Pt. Fx F z x y
max mm max min max min max min max min max min
65 2PSVO200 Outlet 0 -14242 371 -5007 2150 -1540 49303 -10360 3308 -10011 91534 -9471
130 2PSVO201 Outlet 231 -8889 0 -546 723 -695 4533 -522 5568 -8910 15259 -815
where: X, Y, Z: Global Coordinates
x,y,z: Element Coordinates Y Y
(so
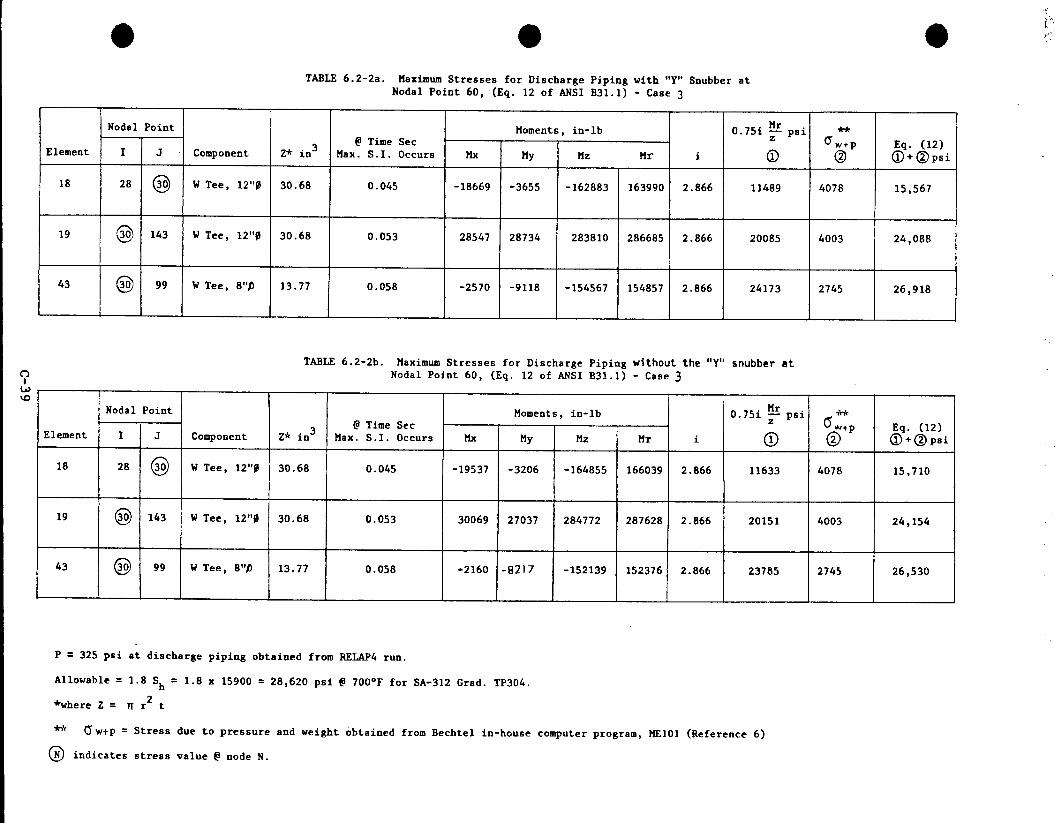
Table 6.2-5 Bending Moments Applied to Safety Valve Discharge Flange with "Y" Snubber at Nodal Point 60
Valve Mark No. Nodal Pt. Bending Moments in-lb*
2PSVO200 65 Outlet 80446
2PSVO201 130 Outlet 17882
Table 6.2-6 Bending Moments Applied to Safety Valve Discharge Flange without "Y" Snubber at Nodal Point 60
Valve Mark No. Nodal Pt. Bending Moments in-lb*
2PSVO200 65 Outlet 92080
2PSVO201 130 Outlet 17670
* M 2 2 M M +M b y Z
C-42
SAN ONOPRE NUCLEAR GENERATING STATION UNITS I & 3 4 I2 PIPE SUPPORT DESCRIPTION LIST 1P* OLEMN o. - Zo suI -O -A13 JOB NO. 10079 -2
TITL. ?t<4 UKF RLLIC VILV6 LI,)C x .ao-w-1 .I...I... o -sA- W_,__ HT
OYIGINATORDO P .....-..
AADAT T
SUPPORT LOCATION WRIGHT TEST DE THERM OTHER DOE THERM 8SA.M. OTHER SoTO. ONPIPR PLOADW LLOADS O OADS LOAS MOVT MOVT Dat MOVT TYPE N-a P PEs 2 LOADS TEST DESIGN
OATA PT No. P LN No. ons mov cours:ATE
PooR SYD2 TAG NO.
I
____ ir___ __ &t .3 49 3
1q, 34-72 3 -16.19 3-7Z . 331_ .302. 722_ -&i '14 OL
.Jo0.I0 ZW9 __SO 9 IIl
34735
~L0II.S H__l.___P ___r____ _Au .o7ot.A:ML 'I4~ Alf . &4Ab_*_1- - _"_
.1
-f%73I
_____ '47"4 .3o2
CE0 10-t A409 2* 45~rscL.). sueo A
(4I) 1i __4 _1.767
6 - - ---- - 7 .7
1. 71- §71
*SUPPORT LOCATIONS AR GIVEN IN me OVERALL PLANT COORDINATE SYSTEM , THERM ON PIPE SUPPLIED My STRESS INCLUDLS A 12- TOLERANCE OR AS NOTED. I I ,j WRIGHT- -es PSO Is LOCATION SHOWN ON PIPE SUPPORT DETAIL SHEET. IreALTitJ LL,6 k113 14 * A.M. SEISMIC ANCHOR MOVEMENT ANALYSIS or LEjanOjI O_ x____
O o Z SUMMARY_________ _______
/i rvISCO tiytyO- ot AL. Lob C*. 3
Table 6.2-7a Pipe Support Design Loads With A "Y" Snubber At Nodal Point 60
SAN ONOFRE NUCLEAR GENERATING STATION UNITS 2 &1
PIPE SUPPORT DESCRIPTION LIST A 2 l- - InLEMN. JOB NO. 10079 -OL 1 .
-- -5 - STRIKSe so owea o 4 I - O S2 -/ pma - or
TITLE VAL UkL falLf oFLUL LIKJF. 00 1 G. STEI N A NO1hhtA , I PATE OF____1
- ~CHECER. ~~ ATEI411REV ATE____
-SUPPORT LOCATION WEIGHT HYDRO DUE THERM I OTHER DaE THERM ISAM. OTHER
S I SUPPORT ON PIPE PER P.Sg LOADS TEST LOADS LOADS LOADS MOVT MOV D V MOVT TP "-,x L OAD Z E ___ A, Ec DESIGN
N-a X LAS p tal t 5 INCH LTIOU P APPR'L COMMENTS:
DATA PTNO . ELEV y Lb) v LOADS MOv-TS
TAG NO. EG-W I A - -INCHES)
5 715 M4.05 M
-ZDoL- 33 .5
ILSF i.2, z4 .c l 197b
____374__ 31L _ _ _ ___ ___ .015- N:3U .
18 201.2315 2-mo-85.olI7o __000.___ ___5_ __-.z919
x
IL2 ;; -i gI,z34 .001 1.L11.1
571 .111_ 5n00 .35e
SL2UVill. 21-234 r.7tPzT
_______ - .3ZL50 -in01 - L.A lb
_______Y1 YI 05t1 ____ ;1~__ 400 __ _350
201(.Dl1 .325
IiI- .. .S1 LL' ___ __ 7 _ _u s s alc__.s um o.o
*SUPPORT LOCATIONS ARE GIVEN IN THE OVERALL PLANT COORDINATE SYSTEM 8 THR R A
*ON PIPE-SUPPLIED BY STRESS INCLUDES A 1 12 TOLERANCE OR AS NOTED. 1.1m( AL)I) WOMIGHTICa Pse' I LOCATION SHOWN N PIPES SUPPORT DETAIL SHEET. e s. mN._L__ _ _ _ _ O S
S.A.M. - SEISMIC ANCHOR MOVEMENT ANALYSIS p t "UT4 2 / x e W WiNe Dldt _ _I__ 1_4_ _O__I
a..,,....;,e sen'. %nn-ruMaLSUMMARY________________*u____v en-a i Y1"SueANolPn
Table 6.2-7b Pipe Support Design Loads With A "Y" Snubber At Nodal Point 60
SAN ONOPRE NUCLEAR GENERATING STATION UNITS 1 & 3 PIPE SUPPORT DESCRIPTION LIST 110 54 PROBLEMNO. P5G -2V3
JOB NO. 10079 ISO D3 1 N
TITLE PRM5u~ GTuKF IS DIj OIING N2.J runs >Ul I F OCRIGINATOR- UA DE
'SUPPORT LOCATION WEIGHT HYDRO D'E THERM OTHER DE THERM IS.A.M. OTHER
UPPRT ONPE pit"P.S..LA LOODS LOADS LOADS LOADS MOVT MOVT MOV
N-a X LOS x INCH
'~f1~J. ~L.......... ________ AP*RL COMMENTS: DATA PT NO FORM No. ELEV Y V LOADS DATE
TAG NO. Ef-W I Lat INCNEKSI
1 e% 51 ,417 -110 -Z313
57t 331),Ff r upot. _____ _-1._ 5471 91 b___ _ ___ -I5' 4tI-i__,
-A 5,44' -0 - -. 001__-.5
_______ 3260 4___d 3-!0-11
______ _____37gS5 ____ ___ - - -1-_70_1__-_ _)_ -. 4
I -165411
I__ ____ ____11 L4 4 I~~
ar__e esow no 7rs - O.2- Pae-........o
. O7.NTO 351 J nays -(,0
CHEKE *qATE REV DATE uTHERM ___A.MOTHER
____________ 0 -ZI3 -0L~7
LOAD S MOV TBC DATEAT
.PS7P'UPI9 VSRS NLDE A fg 11 TOLEANC ORA-OTDN
(LABY INCHES
Y .RE CAC.rO..N MUN . DAoTE
P16 LOCATION SHOWN ON PIPE SUPPORT DETAIL SHEET. j1--**- ___0___4 . ± a 0 $.A.M. - SEISMIC ANCHOR MOVEMENT ANALYSIS LOCI6r~jsI.t~ COA'; ftB 1014,1a. Iz&....l. J 2 Li 1*# I.1'\Ur oil. M-ls o. PI. SUMMARY _
-Table 6.2-7c Pipe Support Design Loads With A "Y" Snubber At Nodal Point 60
#' lI -f)31z-1I SAN ONOFRK NUCLEAR GENERATING STATION UNITS I &A 120 - 0 5I - I
PIPE SUPPORT DESCRIPTION LIST ___-0_ __5-1_________NO._G___;_ JOe NO. 10079I
STRESS ISO DING NO. 1I0,; 0 1- Ps o
TITLE ORIGINATOgL D:% A ) _ ATE t 2_,- &
SUPPORT LOCATION WEIGHT HYDRO D BE THERM OTHER DEC THERM e.A.M OTHER CHECSS i tO 11 N O . A TK* .. PCo: op_
SUPRT N PIPE rP.S. LOADS LOADS LOD DE MO_ CHMOVT De__ MOV DESleN
N-S "0 TP L OASD9 S' DSG _____________ LEE____ x___ IN__ H______ ______ _____ _____ APPE'L COMMEN4TO
DATA FT NO. ELEV Y NY LOADS MOV*TS DATE
PER STOS TAG NO. E-w Z2 \ Z (LeS) (INCHES)
2tIfY7.67 -12) 049
.iOia AB llZL ____ __ _ 4_ __ -_
;077. 01 lom 111 e
i'A*A LW.
S1I AJI3 521
7(le7 3 OIo ~ y
-4__ __ --~ - Ibi7
/~-19 GO I-___ ___ ___ __ __ __ _ _ -0
372.ssi.07.2. HI).1L itLVD TO M
*ON PPE SUPLIE AVSREsICLDES A _I __TLEACEOA_ OTD / V SiLJJL SE 15*e, -w-so
_ s_ sLoo o o s o o sur4A s -_s
_51 _ 491, 3(1.29.1-44 37Z.:YS~~ I Ir h23-.9
a s... _suc _no u - 50
o
Tabl B A 7-7A -7na Runn0r7 -T T Th "AN021 _ _ _ -2~ - .01 3 Z1 1k_ _
I 'jI C A C " 0 F )'s , _ E T
-SPOROCTON___GVN __TH VCAL LN COO DT -1b57M __3__52 - - KIM k, p __ _-- _ _ __I_.' SUPIE 1T-. NCUE AtII"TLRAC R SNTE.I
PSG' _ _ __LOCAT- - - - - --N-ON- - - - - - - - --RT DTAIL-$MEET
_ _ - -J _ _4 _ __ - - -- __ STRESS) SUM.MARYSUM
*SUPPOTab LO.ATION AREe SuIVEN Ieig THEd OVERAL PLN COODIAT SYSTEMr At Noa Point 60
SAN ONOFRE NUCLEAR GENERATING STATIO S 2 & 3 - 5(, - . -, PIPE SUPPORT DESCRIPTI IST 4;\, PROBLEM NO.
0 JOBE3NO. 10079 ph*A- y TIL NO. 007 - STRESS ISO DWG NO. 17-v ' - I PA r OF - _
TITLE______________________L________t________L___ ORIGINTORDATE~ Z2 z
*SUPPORT LOCATION WEIGHT HYDRO DBE THERM OTHER DBE THERM IS.A.M. OTHER
SUPPORT ON PIPE PER P.S.G. LOADS TES LOADS LOADS LOADS MOVT MOVT MOT MOV'T SUPOR NO._ LOADLODS S LOAD_ LOD OS OD VI O' DBE _ __DESIGN
PS NO. TYPE N-S x LBS x INCH N-SX BSVri c rLiLtL' APPR'L COMMENTS:
DATA PT NO. FORM NO ELEV Y Y LOADS MOVTS
PER STDS TAG NO. E-W z (LBSI (INCHESP
L A MOV TS
TAGNO.3E-w.3oZ (LBS (INCHES ;_1u
572. 535 -12
3o .. 3__0 . . 39
09 144 .
&151
O P SP BS S A 12TL AN OIA NOTED~~~~~c~~~ .A __ _ ;'4. AL-.-__ _W
STRESSCALCN. SNUMB NO. DATE
THERM
:ON BY S E I U A I T.WEIGHT
PSG'IS OCAIONSHO N O POE SPPOR DEAILSHET. LI'l kJ.'SEIS. INT, as.A .M. - SEISMIC A NCHOR MOVEMENT ANALYSIS LIt;0 4ol. x SAM
J-T CSUMMARY
Tahle 6.2-8a P-ipe Sunnortnesion TLoals Without A "Y" Snubber At Nodal Point 60
SAN ONOFRE NUCLEAR GENERATING STATI S & 3
PIPE SUPPORT DESCRIPTI I ST 2l -)PROBLEMNO.- 2&
JOB NO. 10079 k 3' - A
TITE ~F~S'~ki L&.- VL\i-.L~~.- STRESS ISO DWNGN 1 0'2 3 -12- PAGE-OF____ TITLE ORIGINATOR DATE
-SUPPORT LOCATION WEIGHT HYDRO DBE THERM OTHER DBE THERM 4S.A.M. OTHER
SUPPORT ON PIPE PER P.S.G. LOADS LTOADS LOADS LOADS LOADS MOV'T MOV'T D MOVT PS NO. TYPE LOADS QS.E DESIGN
N-S x LBS P x INCH ___________ ________________ 1,1tiOU4 . _____ APPR'L COMMENTS:
DATA PT NO. FORM NO. ELEV V b- E) v LOADS MOVT ATE
PER STDS w TAG NO. E W 4 ZLBS) (INCHES)
ZocQZ. 333 ____5__1 ___ L!32
372. 33, .015 . 13
7,002,. 333 .215
37Z.-331 .05 513 6
;600,25 7-_7o -. 2_19
3717. t5 .n350
41 S234i -to__ _ _211 ___1P *Oci L
0000 L7)".7 _______3__ 71 o-6 35o__ ____D ____- 10N_____ __ __ X21,23S -__o_ _ o -____. - -I.7to2.' &IJL
S, 00 1 .- 7650
S ,0A Y1/ 2400.5 :506~~ 524-0 ILI0
20II~c- . I .32
'SUPPORT LOCATIONS ARE GIVEN IN THE OVERALL PLANT COORDINATE SYSTEMTHR
ON- PIPE SUPPL.IED BY STR.SS..NCLUDES At 12"Z* TOLERANCE OR AS NOTED. PSG' IS LOCATION SHOWN ON PIPE SUPPORT DETAIL SHEET.
SEGT
SS.A.M. SEISMIC ANCHOR MOVEMENT ANALYSIS
STRESSI ISO, DWG NPGE OF
TaOGA 6ATE Pipe Support DW
~~. ~~ CHECERSCLC O ATEM NO. DATE
ms~-~, n-rciSTRESBCALC.SUMMARNUM__ NO._DATE
P~IS2 1107*)I ~ ELe-& FO "r'. 4WD~if (P' DTA
Table 6.2-8b Pipe Support Design Loads Without A "Y" Snubber At Nodal Point 60
u .. ou.LL.rULNLHAIINGSrATION UNITS-& 3 I - 0 3, PIPE SUPPORT DESCRIPTIO ST I 314- PROBLEM
JOB NO. 10079 No. 2 W ~~~~STRESS 6SO DWG N04N.ZIA 2jPAEO
TITLE PRESSI, E EELIEF YT4-VEL( .Ltu- e2k AE o T I L P ~ S i ~ 7 L ~ L t ~O R IG IN A T O R 1 D~_ _ _ _ _ _ _ _ __7 2
CHECKER- Vi' 1 A..Z DATE 2)IaREV tDATE__ SUPPORT LOCATION WEIGHT HYDRO LBE THERM SAM. OTHER D E THERM IS.A.M. OTHER SUPPORT ON PIPE PER P.SG LODS TEST D LOADS LOG LOADS MOVET MOW-T MOV.T f PS NO. TYPE LOADS LOAD .V_ re DESIT
NS LOS A, Z o INCH
DATA PT NO. O ELV ATE COMMENTS PORM NO. AZLOADS MOVYTS *
TAG NO. E-W Z z
.020I , 2 1
Spa $1.L7 -- lO -77 1. -&
15.73 t 4
l_0 ____5_ _
69.7417 6_ lP
STZS ISIW o A E O
ORTI
5DES IGN
.01-.o
o0Is 59 4 7 _4co_
1 3 sm _ -807 -2 _ I'/ .0 .ss 0
SUPPORT LOCATIONS ARE GIVEN IN THE OVERALL PLANT COORDINATE SYSTEM A SE6 SkUt WS - STRESS CA.C. NO. SNUM. NO. DATE :0ON PIPE'OSUPPLIED BY STRESS INCLUDES A i I V TOLERANCIE OR AS NOTED,
WEIGHT________________ PSG LOCATION SHOWN ON PIPE SUPPORT DETAIL SHEET. oRLEVISED 6 4EIS TS__C SAM. SEISMIC ANCHOR MOVEMENT ANALYSIS SIORCIP.i6 FuucTfo,)S INT
Pj~jSr~.~ O~-~PML Lo~ ~SUMMARY !SN P&Le-o Y" sw. re a cP, powZ- 9 o
Table 6-2-8C Pipe Support Design Loads Without A "Y" Snubber At Nodal Point 60
SAN ONOFRE NUCLEAR GENERATING STATION & 3 I1 1 - O 0 -I
PIPE SUPPORT DESCRIPTION IST I o -OI*5 PROBLEMNO. ,
JOB NO. 10079 STRESS ISO DING NO. tcA- PAGE _ OF__ __
TITLE " lt -'- ORIGINATOR , -Z.DATELL
_____ _____ CHECKER2Z. DATE&Z- - LREVtDATE_
SUPPORT LOCATION WEIGHT HYDRO DBE THERM OTHER DBE THERM 4S.A.M. OTHER
SUPPORT ONPIPE PERP.S.G. LOADS LOASA DDOAS LOADS LOADS MOV'T MOV*T MDE MOV*T PS NO. TYPE N-S x LBS X INCH DESIGN
_______C + wvk___________ ______ APPR'L CME S
DATE
DATA PT NO. FORM NO ELEV Y
PER STDS TAG NO. E-W z Z (LOS) (INCHES)
1W,07 ,1270
CA/0ALLEL.
_7Z._S__.r_ ,/23 _
S78. o7 7 -1 1,00 _1;1,,120 0
.ILJI -,/2
oi ___I,7I
372,331 01.z
~~tX)-IIIJ .353QC __ __ ___ ____ )LCAD'/6 N_
_ _ _ _ _ _ Us_ Lo,[ -- :5 7
'OPPESPPEYTRSSINLUE A __12" _OLERANC ORAS NOTED._ _____ IJ1. ____
~~i_ __ __ __ __ __ _ ____7
_________ ___ I _____ 22q&' _ _____ A OW., +__.LS
I-I ISTRESS CA LC. NO. SNUMB NO. DATE
-SUPPORT LOCATIONS ARE GIVEN IN THE OVERALL PLANT COORDINATE SYSTEM .(. ,'. e YTEM_ _ _ _ _ _
ON PI PE SUPPLIED BY STRESS INCLUDES A t 12" TOLERANCE OR AS NOTED.. g. WEIGHT_________
'PSG' IS LOCATION SHOWN ON PIPE SUPPORT DETAIL SHEET. SEIS. NT. * 5A.M. -SEISMIC ANCHOR MOVEMENT ANALYSIS A4 I.2 S.' .ZXA.M._ ________
LN -S TRESS L-IS DWG NO Jb k:5
.r SUMMARY
Table 6.2-8d Pipe Support Design Loads Without A "Y" Snubber At Nodal Point 60
ANSRPLT g NSYS NODE 20 TIME VS FORCE
9 0
C
0
O
AD
8
%.00 0.086 0.J2 O18a 0 .24 0. 30 0. 36 0. Y2 0.48 0.54 0. XTIME
Figure 6.1-1 FORCE-TIME HISTORY PLOT (CASE 1)
ANSRPLT TIME VS FORCE
8 ANSYS NODE 24
S
0
C
WI
8
co
C)z
U,,
00 0.06 0.12 0.38 0.2Y 0.30 0.36 0.42 0.8 0.54 0.60 TIME
Figure 6.1-2 FORCE-TIME HISTORY PLOT (CASE 1)
RNSRPLT 9 RNSYS NODE 20 TIME VS FORCE 40
0 ,a
a
LnI -o
r4
0
a 10 0.12 0.211 0.36 0.10 O.60 O.7? 0.801 0.96 1.06 1. 0
_j
m TI ME
Figure 6.1-3 FORCE-TIME HISTORY PLOT (CASE 2)
RNSRPLT TIME VS FORCE
8 ANSYS NOOE 24
O
0
9
9
ac O'
O
Ii. a
0
0
x0.00 0.12 0-.24 0. 36 0.48 0.60 0-.72 0.8 0%o.96 1.08 1.20 TIME
Figure 6.1-4 FORCE-TIME HISTORY PLOT (CASE 2)
RNSRPLT TIME VS FORCE
9 RNSYS NODE 20 oan
a
C
OU
co' 00 0'.06 0. 12 0.18 0. 24 0. 30 0.36 0.142 0.40 0.54 TIME
Figure 6.1-5 FORCE-TIME HISTORY PLOT (CASE 3)
RNSRPLT TIME VS FORCE
g ANSYS NODE 24
a
0 C2
_j0
'O
TI
CF
a
io
0.00 0.06 0 .12 0.19 0. 24 0.30 0.36 0. 42 0'.48a 0.5w 0.60 TI NE
Figure 6.1-6 FORCE-TIME HISTORY PLOT (CASE 3)
598
62
2553
O2. Eemen Numbe
K%727
G ~~" 6 5..6 0 -0G
Fiur 6.- 9iit-7~mn Moe
42~ 20 2
I oS
225
Joo
3c
e ----NVodal Point 2
O --Element Number 25
05
C-57
36 Y
ox
YY *y
L 9 7 yr - s
112
9S- Lt.
98
I t4- xy
Nodal Point 7 o
225
Y
227X
9
72
x 4
2s
7
- ( Io19 0 I
to
y Figure 6.2-2 Finite - Element model with Master Degrees Of Freedom
C-58
44
-2 J
Fy .5 .265 :
49~
X
F
LoctinIn lobl oodiat
05
e od-- Nodal Point
22-7
10 35
26
25
5~1 is I //20 Figure 6.2-3 Forcing Function
1r: Location In Global Coordinate 10\
C-59
DISP 150
.100
.050
.0003
-. 050 30LI
-.100
-.150
-. 200
-. 250
-. 300
-. 350 ITME
.00 .0140 .060 .120 .160 .200 .240 .250 .320 .330 .400
SONG5 2 A 3 SRFETY RELIEF VALVE----DISPLACEMENT PLOT FOR CASE 1 Sec. A NSS
Figure 6.2-4 Displacement vs. Time Plot At Modal Point 30 For Case 1
C-60
7.0 SUMMARY
The dynamic forcing functions on the San Onofre Units 2&3 discharge piping
system during the safety valve discharge event were generated by RELAP4/ANSYR
under a saturated steam condition. These dynamic forcing functions were
used as input loads for the dynamic structural analysis using the ANSYS
code. Three (3) cases (see section 6.1) with different valve operating
sequences were analyzed. Case 3 and Case 1 represent the critical cases.
Although the results due to Case 3 were used as the design base in this
report, it is noted that: i) Case 3 is only marginally more conservative
than Case 1, ii) Case 3 is not probable due to short time frame for occurrence
(i.e., 16 msec safety valve opening time). The results of the evaluation
are summarized as follows:
a. The RELAP4/ANSYR Code was used to model the EPRI sample case,
test number 1411. The comparison of results between RELAP4/ANSYR
and RELAP5/MOD1 show that the safety valve discharge dynamic
loads obtained from the RELAP4/ANSYR run are conservative based
upon a saturated steam condition.
b. The analysis showed that the highest displacement and maximum
stress occurred at nodal point 30. The highest support reaction
loads occurred at nodal points 60 and 143. However, the analysis
also showed that loads experienced by a vertical snubber at
nodal point 60 exceeded the manufacturer's recommended load
rating.
c. A reanalysis showed that removal of the "Y" snubber at nodal point
60 did not jeopardize the capability of the safety valve discharge
piping to withstand the safety valve operation. Accordingly, this
snubber has been deleted from the San Onofre Units 2 and 3 Safety
Valve discharge piping configuration.
C-61
8.0 CONCLUSION
All components of the pressurizer safety valve discharge piping, when
subjected to dynamic loads due to safety valve discharge, satisfy the
requirements of Power Piping Code ANSI B31.1. The safety valve
discharge piping system including pipe supports, snubbers, and their
structures can safely withstand safety valve operation.
C-62
REFERENCES
1. RELAP4, "Calculation and Output of Hydrodynamic Forces during a
Reactor Transient", Version EIl5P, Energy Incorporated. 1980.
2. ANSYR, "An Interface Computer Code between the RELAP4 Thermal
Hydraulic Code and the ANSYS Code", Energy Incorporated. Nov., 1980.
3. "Assessment of Analysis Methods for PWR Safety/Relief Valve Discharge
Piping", EPRI Report, NP-80-9-LD, Dec., 1980.
4. "ANSYS Engineering Analysis System", Rev. 3, Swanson Analysis Systems,
Inc. Houston, Pa. July 1979.
5. RELAP5/MOD1 Codes Manual" EG&G, Idaho, November, 1980.
6. "Application of RELAP5/MOD1 for Calculation of Safety and Relief
Valve Discharge Piping Hydrodynamic Loads", Intermountain Technologies,
Inc. March, 1982.
7. EPRI letter to Utility Technical and Licensing Contracts, PWR NSSS
primary contracts and Dresser Industries, dated Feb. 18, 1982,
attachments 1 and 2.
8. EPRI letter to Utility Technical Contacts Piping subcommittee members
dated Nov. 5, 1981, attached Note 2.
9. ME101, "Linear Elastic Analysis of Piping Systems" Ver. H3, Bechtel
Power Corporation, Jan., 1981.
C-63