SAN TAN VALLEY ADMIN COMPLEX PARCEL NO. 210-15-004A County Project No. SPR-014-19 Dibble Engineering Project No. 1018127 Traffic Impact Assessment September 2019 Prepared for: Pinal County Community Development 31 North Pinal Street, Building F Florence, AZ 85132 Approved by Pinal County Traffic Engineer 7878 North 16 th Street Suite 300 Phoenix, AZ 85020-4669 P. 602.957.1155 F. 602.957.2838 www.dibblecorp.com
Transcript
SAN TAN VALLEY ADMIN COMPLEX
PARCEL NO. 210-15-004A
County Project No. SPR-014-19
Dibble Engineering Project No. 1018127
Traffic Impact Assessment
September 2019
Prepared for:
Pinal County Community Development 31 North Pinal Street, Building F
Florence, AZ 85132
Approved by Pinal County Traffic Engineer
7878 North 16th Street Suite 300 Phoenix, AZ 85020-4669 P. 602.957.1155 F. 602.957.2838 www.dibblecorp.com
Dibble Engineering September 2019
i San Tan Valley Complex SPR-014-19 Traffic Impact Assessment
Table of Contents I. Background ....................................................................................................................................................... 1
II. Purpose of Study ............................................................................................................................................ 3 III. Study Methodology........................................................................................................................................ 4 IV. Summary of Proposed STV Complex ...................................................................................................... 4 V. Study References ............................................................................................................................................ 4 VI. Projected Traffic ............................................................................................................................................. 5
A. Site Traffic Forecasting ................................................................................................................ 5 1. Trip Generation ..................................................................................................................... 5 2. Trip Distribution .................................................................................................................... 6 3. Trip Assignment .................................................................................................................... 6
B. Background Traffic Forecasting .................................................................................................... 6 C. Adjacent Traffic Forecasting......................................................................................................... 7
VII. Traffic and Improvement Analysis ......................................................................................................... 8 A. Site Forecasting ........................................................................................................................... 8
VIII. Study Conclusions ......................................................................................................................................... 8 IX. Study Recommendations............................................................................................................................. 8
List of Figures Figure 1 – Vicinity Map ............................................................................................................... 2
List of Tables Table 1- STV Complex Information ............................................................................................ 4 Table 1- Weekday Trip Generation ............................................................................................. 5 Table 2- AM Peak Hour Trip Generation ..................................................................................... 5 Table 3- PM Peak Hour Trip Generation ..................................................................................... 6 Table 4- Bella Vista Farms Traffic for Units 1 & 2 ....................................................................... 6 Table 5- Bella Vista Road & Schnepf Road Intersection Volumes with STV Complex ................... 7 Table 6- STV Driveways and Schnepf Road Intersection Traffic Volumes .................................... 7 Table 7 – LOS and Delay for Phase 1a with the STV Complex ..................................................... 8 Table 8 – LOS and Delay for Phases 1a+1b+1c+1d with the STV Complex ................................ 8
Dibble Engineering September 2019
1 San Tan Valley Complex SPR-014-19 Traffic Impact Assessment
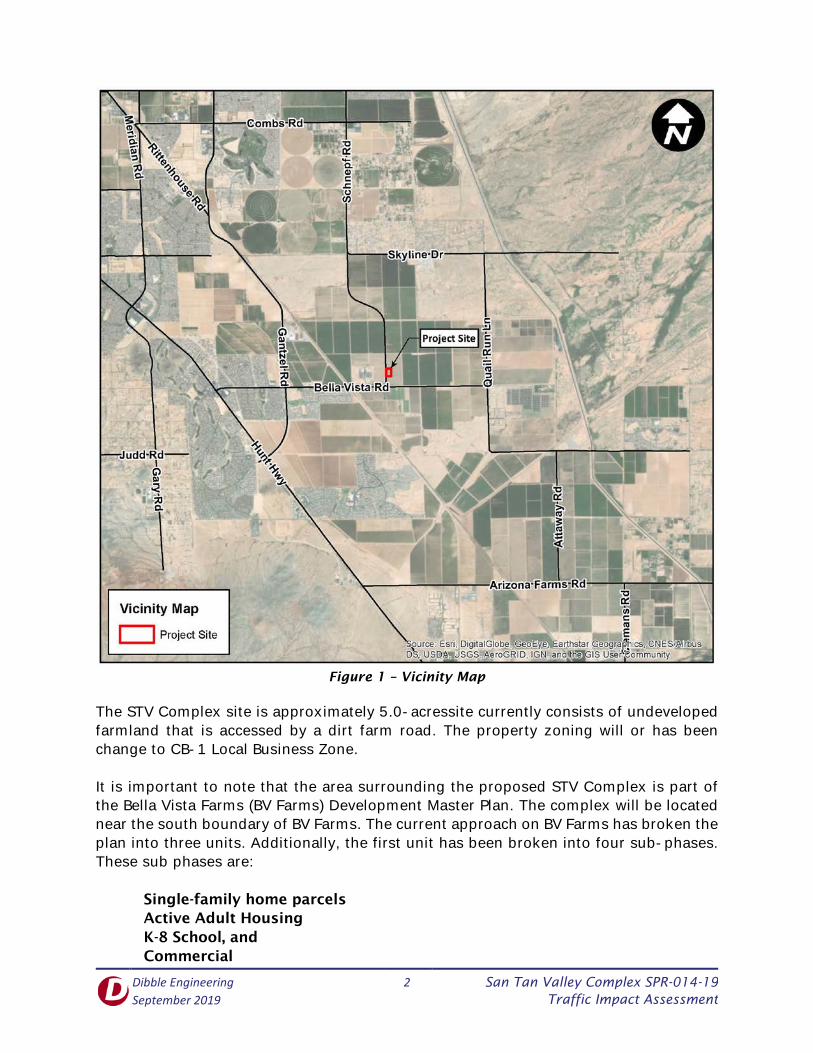
I. Background The site for the proposed San Tan Valley Complex (STV Complex or complex) is located in San Tan Valley, Arizona 85143 within Section 15, of Township 3 South, Range 8 East. San Tan Valley is an unincorporated area within Pinal County. The San Tan Valley Complex, which will be two buildings, will be owned and operated by Pinal County. It is anticipated that a full variety of County services will be provided out of this complex. Therefore, the TIA for this proposed complex is fairly straight forward. However, what makes this simple project complex is how the streets around it will be built in phases and in pieces. Additional information on this is presented in the body of this report. The complex, when it becomes fully operational is anticipated to generate over 100 vehicle trips in a peak hour, but less than 500. Therefore, according to the 2007 version of the Pinal County Traffic Impact Assessment Guidelines & Procedures this Traffic Impact Analysis (TIA) is a Category I. This small category classification requires that the study horizon be the opening year and minimum study area limits to be the access driveways and the nearest signalized or un-signalized intersection within ½ mile boundary of the site. The project is positioned 830 feet north of Bella Vista Road along the alignment of the “future” Schnepf Road. The future Schnepf Road intersection will be located approximately a quarter mile east of the entrance of the Center Arizona College’s San Tan Campus. See Figure 1.
Dibble Engineering September 2019
2 San Tan Valley Complex SPR-014-19 Traffic Impact Assessment
Figure 1 – Vicinity Map
The STV Complex site is approximately 5.0-acressite currently consists of undeveloped farmland that is accessed by a dirt farm road. The property zoning will or has been change to CB-1 Local Business Zone. It is important to note that the area surrounding the proposed STV Complex is part of the Bella Vista Farms (BV Farms) Development Master Plan. The complex will be located near the south boundary of BV Farms. The current approach on BV Farms has broken the plan into three units. Additionally, the first unit has been broken into four sub-phases. These sub phases are:
Single-family home parcels Active Adult Housing K-8 School, and Commercial
Dibble Engineering September 2019
3 San Tan Valley Complex SPR-014-19 Traffic Impact Assessment
Therefore, the construction of infrastructure and the traffic impact of this development will be strung out over many years. This includes the building of the future Schnepf Road and the upgrade of Bella Vista Road. Just exacting how this phasing will be done and how much traffic it will generate and when this traffic will be generated is very difficult to define. Especially, in conducting this study and developing off-site improvements recommendations such as turn lanes and intersection control. BV Farms, in terms of the residential and commercial, will mostly be built from north to south. The future Schnepf Road will not be completed as a through street to the north until the last unit is underway. This might be sometime after 2024. Given that the STV Complex is going to be built now either necessitates interim access arrangements or for the Complex to set empty until enough of Schnepf Road is built to it so it can be accessed. Therefore, the assumed plan to achieve access to the STV Complex during this period of construction and growth (or interim condition) will be to build enough of the new Schnepf Road to provide access to Bella Vista Road. Bella Vista Road will be improved as a half street roughly from the Union Pacific Railroad to its new intersection with the half of the new Schnepf Road. The STV Complex driveways will connect to a half-street Schnepf Road configuration. Private development will build the western half-street improvements of the future Schnepf Road that will provide paved access to the site. Future development will build the full Schnepf Road improvements from Bella Vista Road to the north. This project will include the eastern half-street design (but not the construction) of Schnepf Road along the property frontage. It is anticipated that future private development in the area will design and construct the remainder of the improvements along future Schnepf Road and the existing Bella Vista Road. It is noted that Bella Vista Road is an arterial on Pinal County’s Regionally Significant Route. The portion of Schnepf Road involved with the STV Complex is currently not on the RSR. Only that portion of Schnepf Road north of Skyline Drive is listed as an arterial.
II. Purpose of Study The purpose of this study is to first review the traffic impact analysis study that was done for the Bella Vista Farms Development. This work will provide the majority of the context for this study. Then with this information in mind this study was to evaluate what is needed or not needed for the interim condition for the STV Complex. The objective being to determine if additional off-site improvements are required to support the access and traffic impacts of STV Complex. The key elements being the driveways to the Complex itself and then the intersection of the future Schnepf Road and Bella Vista Road.
Dibble Engineering September 2019
4 San Tan Valley Complex SPR-014-19 Traffic Impact Assessment
III. Study Methodology After an initial review of the Bella Vista Farms Traffic Impact Analysis reports (original and Addendum #1) it was determine that this report provided enough traffic volume (counted and generated) information to set the background for the future Schnepf Road and the existing Bella Vista Road to conduct this study. Therefore, the main tasks to be completed for this study was first to develop the anticipated trip generation for STV Complex, distribute those trips and then conduct capacity analysis at both the driveways and then the intersection of Schnepf and Bella Vista.
IV. Summary of Proposed STV Complex Construction of the STV Complex is scheduled to begin 2020. Two full access driveways will be built for in and out access to the future Schnepf Road. The full build out and grown horizon may require these access points to be modified. But that condition is not expected to occur until sometime after 2024. Pedestrian access will be provided to the right-of-way via sidewalks so that future roadway improvements can match and provide connectivity. ADA accessible ramps will be provided, as necessary, within the site. However, significant pedestrian activity is not anticipated until the area is fully built out.
5240 North 16th Street, Suite 101 Phoenix, AZ 85016
Pinal County Facilities 121 West 22nd Street Florence, AZ 85132
General Description of location Current Land Use
San Tan Valley located in Pinal County, Arizona. East of the Central Arizona College San Tan
Campus located along Bella Vista Road
Open land was a farm field prior to urban encroachment
Table 1- STV Complex Information
Type of Development
Building Number 1
Square Feet
Building Number 2
Square Feet
Total Floor Area Square
Feet
Assumed Number of Employees
Number of Parking Spaces
Government Services
Complex Single Story
30,229 17,863 48,092 100 154
V. Study References There is been significant prior traffic impact study work done on this area. This study relies heavy on this prior work. A listing of the prior work used in this study is as follows:
Dibble Engineering September 2019
5 San Tan Valley Complex SPR-014-19 Traffic Impact Assessment
Referenced Work by Others used in this Study Bella Vista Farms – Conceptual Land Use & Open Space Plan Exhibit II-3 by Handley Design
Group Dated May 25, 2012 Bella Vista Farms Development Units 1 & 2 Traffic Impact Analysis Addendum #1 – by CivTech
Date June 19, 2018 and Sealed and Signed by Dawn Cartier Pinal County Access Management Manual, Project No. EV 14-043 Traffic Engineering On-Call,
February, 2017 Michael Baker International
VI. Projected Traffic A. Site Traffic Forecasting
1. Trip Generation The ITE Trip Generation Manual (TGM), 10th Edition was used to calculate the estimated trip generation for the proposed San Tan Valley Complex (STV Complex). The first step in using the ITE TGM is to find a land use that describes the proposed land use that fits the days of the week that are of interest. For the case of this complex ITE has “The Government Office Building Land Use Code 730” (LUC730) data plot and equation would appear to fit this applicable. The next step is to find what variable the selected land use data plot and equation would be used to gain trip generation estimate rates. In this case the gross floor area is used. Note there are also data plot and equations that are based on number of employees. Given that this is a service center, it likely that a fair number of the trips generated will be from visitors seeking governmental services. In fact, this appears to be the case when comparing the trip estimate gained from LUC730 and similar commercial office space land use codes. The commercial office trip generations were about half of what 730 produced. So, this would appear to help validate the use of LUC730 to reflect those visitor trips. Again, it is important to realize that trip generation is an estimation of possible trips that a similar use facility might have based on the overall square footage of that proposed building. Therefore, based on ITE LUC730 the trips generate by STV Complex will be:
Table 2- Weekday Trip Generation Total Weekday Traffic
In Out Total 542 542 1,084
Table 3- AM Peak Hour Trip Generation
AM Peak Hour Weekday Traffic In Out Total 80 80 160
Dibble Engineering September 2019
6 San Tan Valley Complex SPR-014-19 Traffic Impact Assessment
This trip generation will be used for the analysis in this traffic study.
2. Trip Distribution Given that the complex has two driveways (north and south) one would anticipate that these trips would be distributed between the two. However, given for the interim condition the only access to and from the complex will be from the south (from Bella Vista) this will probably not be the case.
3. Trip Assignment Given that south driveway is closer to Bella Vista it is determined to be reasonable that the majority of all of the traffic in and out will use the south driveway. The next step would be to determine what the split on this usage would be. To be conservative and also to account for a possible error in the trip generation estimate it is assumed (for this study) that all of the in and out traffic will use the south driveway.
B. Background Traffic Forecasting Based on the CivTech Report, the traffic anticipated to be generated on the future Schnepf Roads and Bella Vista Road is as shown in the following table.
Table 5- Bella Vista Farms Traffic for Units 1 & 2
Movement Unit 2019
Bella Vista Rd Background
BVF Phase
1a 2019
BVF Phase
1a + 1b 2019
BVF Phase
1a + 1c 2019
BVF Phase 1a+1b+1c
+1d 2019
Eastbound Left – EBL Bella Vista Rd to Schnepf Rd
AM NA 101 143 118 163 PM NA 335 428 339 444
Daily NA 2537 3571 2584 3740
Eastbound Thru – EBT Bella Vista Rd
AM 195 195 195 195 195 PM 273 273 273 273 273
Daily 2,600 2,600 2,600 2,600 2,600 Westbound Right – WBR Bella Vista Rd to Schnepf Rd
AM NA 0 0 8 10 PM NA 0 0 2 8
Daily NA 0 0 24 85
Westbound Thru – WBT Bella Vista Rd
AM 272 272 272 272 272 PM 204 204 204 204 204
Daily 2,644 2,644 2,644 2,644 2,644 Southbound Right – SBR Schnepf Rd to Bella Vista Rd
AM NA 301 385 315 399 PM NA 196 255 200 259
Daily NA 2537 3571 2584 3740 Southbound Left – SBL, Schnepf Rd to Bella Vista Rd
AM NA 0 0 7 9 PM NA 0 0 2 7
Daily NA 0 0 24 86
Dibble Engineering September 2019
7 San Tan Valley Complex SPR-014-19 Traffic Impact Assessment
C. Adjacent Traffic Forecasting Combining the STV Complex into the Bella Vista Farms yields the following volumes used for the Bella Vista Road and Schnepf Road Intersection Capacity Analysis:
Table 6- Bella Vista Road & Schnepf Road Intersection Volumes with STV Complex
Southbound Left – SBL Schnepf Rd to Bella Vista Rd
AM 0 0 7 9 PM 0 0 2 7 Daily 0 0 24 86
In addition to analyzing the Schnepf Road and Bella Vista Road intersection, the STV complex driveways were also analyzed using the traffic volumes summarized in Table 7.
Table 7- STV Driveways and Schnepf Road Intersection Traffic Volumes
8 San Tan Valley Complex SPR-014-19 Traffic Impact Assessment
VII. Traffic and Improvement Analysis A. Site Forecasting
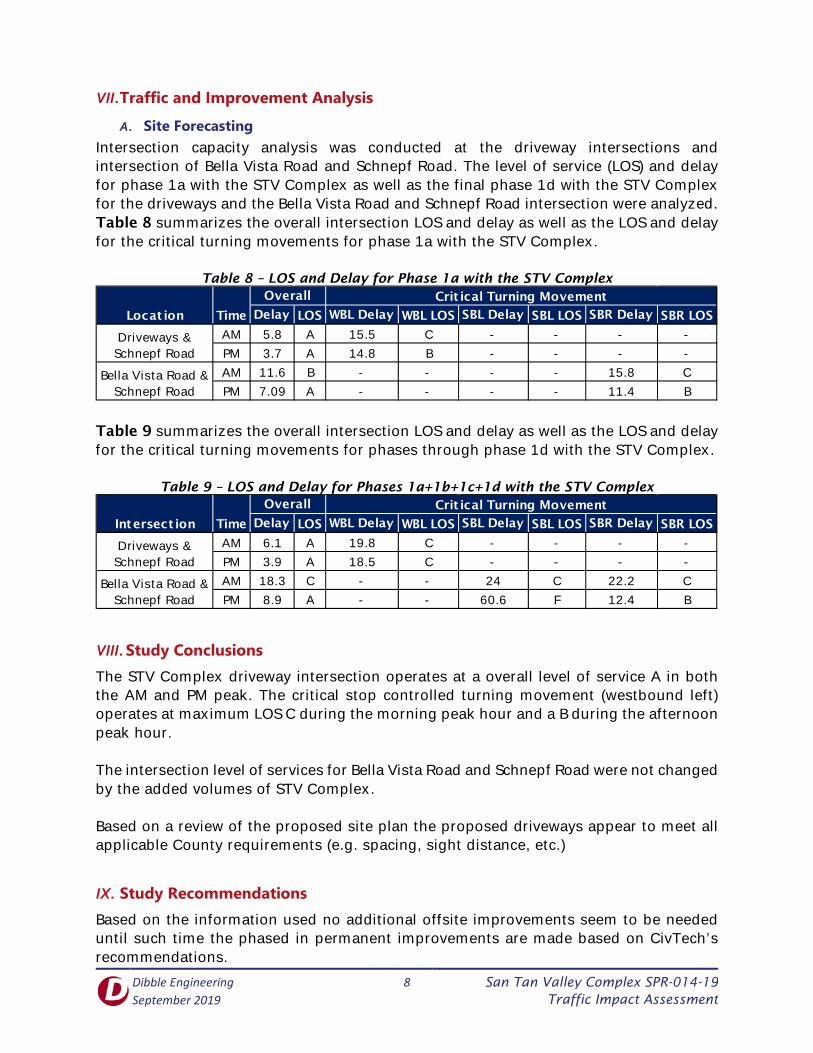
Intersection capacity analysis was conducted at the driveway intersections and intersection of Bella Vista Road and Schnepf Road. The level of service (LOS) and delay for phase 1a with the STV Complex as well as the final phase 1d with the STV Complex for the driveways and the Bella Vista Road and Schnepf Road intersection were analyzed. Table 8 summarizes the overall intersection LOS and delay as well as the LOS and delay for the critical turning movements for phase 1a with the STV Complex.
Table 8 – LOS and Delay for Phase 1a with the STV Complex
Table 9 summarizes the overall intersection LOS and delay as well as the LOS and delay for the critical turning movements for phases through phase 1d with the STV Complex.
Table 9 – LOS and Delay for Phases 1a+1b+1c+1d with the STV Complex
VIII. Study Conclusions The STV Complex driveway intersection operates at a overall level of service A in both the AM and PM peak. The critical stop controlled turning movement (westbound left) operates at maximum LOS C during the morning peak hour and a B during the afternoon peak hour. The intersection level of services for Bella Vista Road and Schnepf Road were not changed by the added volumes of STV Complex. Based on a review of the proposed site plan the proposed driveways appear to meet all applicable County requirements (e.g. spacing, sight distance, etc.)
IX. Study Recommendations Based on the information used no additional offsite improvements seem to be needed until such time the phased in permanent improvements are made based on CivTech’s recommendations.
Delay LOS WBL Delay WBL LOS SBL Delay SBL LOS SBR Delay SBR LOS
AM 5.8 A 15.5 C - - - -PM 3.7 A 14.8 B - - - -AM 11.6 B - - - - 15.8 CPM 7.09 A - - - - 11.4 B
Driveways & Schnepf Road
Bella Vista Road & Schnepf Road
Crit ical Turning MovementOverall
TimeLocat ion
Delay LOS WBL Delay WBL LOS SBL Delay SBL LOS SBR Delay SBR LOS
AM 6.1 A 19.8 C - - - -PM 3.9 A 18.5 C - - - -AM 18.3 C - - 24 C 22.2 CPM 8.9 A - - 60.6 F 12.4 B
Driveways & Schnepf Road
Bella Vista Road & Schnepf Road
Intersect ion Time
Overall Crit ical Turning Movement
Dibble Engineering September 2019
9 San Tan Valley Complex SPR-014-19 Traffic Impact Assessment
Appendix A HCS7 Analysis Reports
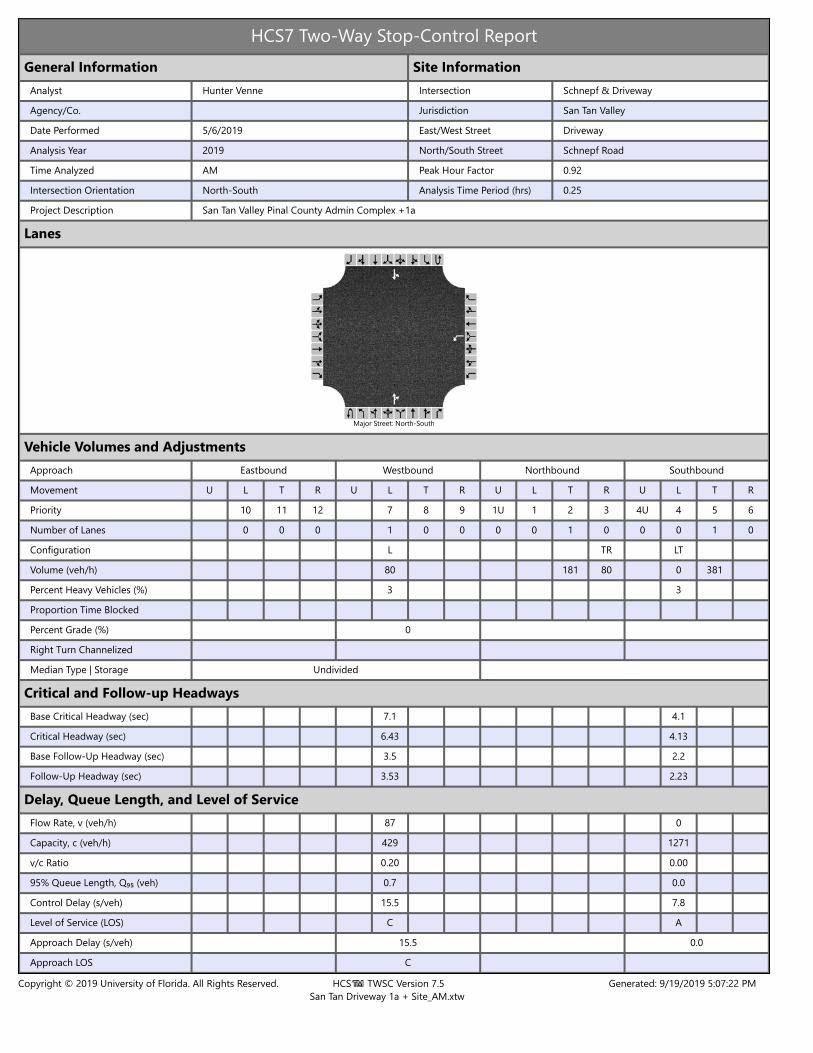
HCS7 Two-Way Stop-Control ReportGeneral Information Site Information
Analyst Hunter Venne Intersection Schnepf & DrivewayAgency/Co. Jurisdiction San Tan ValleyDate Performed 5/6/2019 East/West Street DrivewayAnalysis Year 2019 North/South Street Schnepf RoadTime Analyzed AM Peak Hour Factor 0.92Intersection Orientation North-South Analysis Time Period (hrs) 0.25Project Description San Tan Valley Pinal County Admin Complex +1a
Lanes
Major Street: North-South
Vehicle Volumes and AdjustmentsApproach Eastbound Westbound Northbound SouthboundMovement U L T R U L T R U L T R U L T RPriority 10 11 12 7 8 9 1U 1 2 3 4U 4 5 6Number of Lanes 0 0 0 1 0 0 0 0 1 0 0 0 1 0Configuration L TR LTVolume (veh/h) 80 181 80 0 381Percent Heavy Vehicles (%) 3 3Proportion Time BlockedPercent Grade (%) 0Right Turn ChannelizedMedian Type | Storage Undivided
Delay, Queue Length, and Level of ServiceFlow Rate, v (veh/h) 87 0Capacity, c (veh/h) 429 1271v/c Ratio 0.20 0.0095% Queue Length, Q₉₅ (veh) 0.7 0.0Control Delay (s/veh) 15.5 7.8Level of Service (LOS) C AApproach Delay (s/veh) 15.5 0.0Approach LOS C
HCS7 Two-Way Stop-Control ReportGeneral Information Site Information
Analyst Hunter Venne Intersection Schnepf & DrivewayAgency/Co. Jurisdiction San Tan ValleyDate Performed 5/6/2019 East/West Street DrivewayAnalysis Year 2019 North/South Street Schnepf RoadTime Analyzed PM Peak Hour Factor 0.92Intersection Orientation North-South Analysis Time Period (hrs) 0.25Project Description San Tan Valley Pinal County Admin Complex +1a
Lanes
Major Street: North-South
Vehicle Volumes and AdjustmentsApproach Eastbound Westbound Northbound SouthboundMovement U L T R U L T R U L T R U L T RPriority 10 11 12 7 8 9 1U 1 2 3 4U 4 5 6Number of Lanes 0 0 0 1 0 0 0 0 1 0 0 0 1 0Configuration L TR LTVolume (veh/h) 41 376 41 0 237Percent Heavy Vehicles (%) 3 3Proportion Time BlockedPercent Grade (%) 0Right Turn ChannelizedMedian Type | Storage Undivided
Delay, Queue Length, and Level of ServiceFlow Rate, v (veh/h) 45 0Capacity, c (veh/h) 410 1101v/c Ratio 0.11 0.0095% Queue Length, Q₉₅ (veh) 0.4 0.0Control Delay (s/veh) 14.8 8.3Level of Service (LOS) B AApproach Delay (s/veh) 14.8 0.0Approach LOS B
HCS7 Two-Way Stop-Control ReportGeneral Information Site Information
Analyst Hunter Venne Intersection Bella Vista & SchnepfAgency/Co. Jurisdiction San Tan ValleyDate Performed 5/6/2019 East/West Street Bella Vista RoadAnalysis Year 2019 North/South Street Schnepf RoadTime Analyzed AM Peak Hour Factor 0.92Intersection Orientation East-West Analysis Time Period (hrs) 0.25Project Description San Tan Valley Pinal County Admin Complex +1a
Lanes
Major Street: East-West
Vehicle Volumes and AdjustmentsApproach Eastbound Westbound Northbound SouthboundMovement U L T R U L T R U L T R U L T RPriority 1U 1 2 3 4U 4 5 6 7 8 9 10 11 12Number of Lanes 0 1 1 0 0 0 1 0 0 0 0 1 0 1Configuration L T TR L RVolume (veh/h) 181 195 272 0 0 381Percent Heavy Vehicles (%) 3 3 3Proportion Time BlockedPercent Grade (%) 0Right Turn Channelized NoMedian Type | Storage Undivided
Delay, Queue Length, and Level of ServiceFlow Rate, v (veh/h) 197 0 414Capacity, c (veh/h) 1259 259 741v/c Ratio 0.16 0.00 0.5695% Queue Length, Q₉₅ (veh) 0.6 0.0 3.5Control Delay (s/veh) 8.4 18.9 15.8Level of Service (LOS) A C CApproach Delay (s/veh) 4.0 15.8Approach LOS C
HCS7 Two-Way Stop-Control ReportGeneral Information Site Information
Analyst Hunter Venne Intersection Bella Vista & SchnepfAgency/Co. Jurisdiction San Tan ValleyDate Performed 5/6/2019 East/West Street Bella Vista RoadAnalysis Year 2019 North/South Street Schnepf RoadTime Analyzed AM Peak Hour Factor 0.92Intersection Orientation East-West Analysis Time Period (hrs) 0.25Project Description San Tan Valley Pinal County Admin Complex +1a
Lanes
Major Street: East-West
Vehicle Volumes and AdjustmentsApproach Eastbound Westbound Northbound SouthboundMovement U L T R U L T R U L T R U L T RPriority 1U 1 2 3 4U 4 5 6 7 8 9 10 11 12Number of Lanes 0 1 1 0 0 0 1 0 0 0 0 1 0 1Configuration L T TR L RVolume (veh/h) 376 273 204 0 0 237Percent Heavy Vehicles (%) 3 3 3Proportion Time BlockedPercent Grade (%) 0Right Turn Channelized NoMedian Type | Storage Undivided
Delay, Queue Length, and Level of ServiceFlow Rate, v (veh/h) 409 0 258Capacity, c (veh/h) 1340 117 815v/c Ratio 0.31 0.00 0.3295% Queue Length, Q₉₅ (veh) 1.3 0.0 1.4Control Delay (s/veh) 8.9 35.8 11.4Level of Service (LOS) A E BApproach Delay (s/veh) 5.1 11.4Approach LOS B
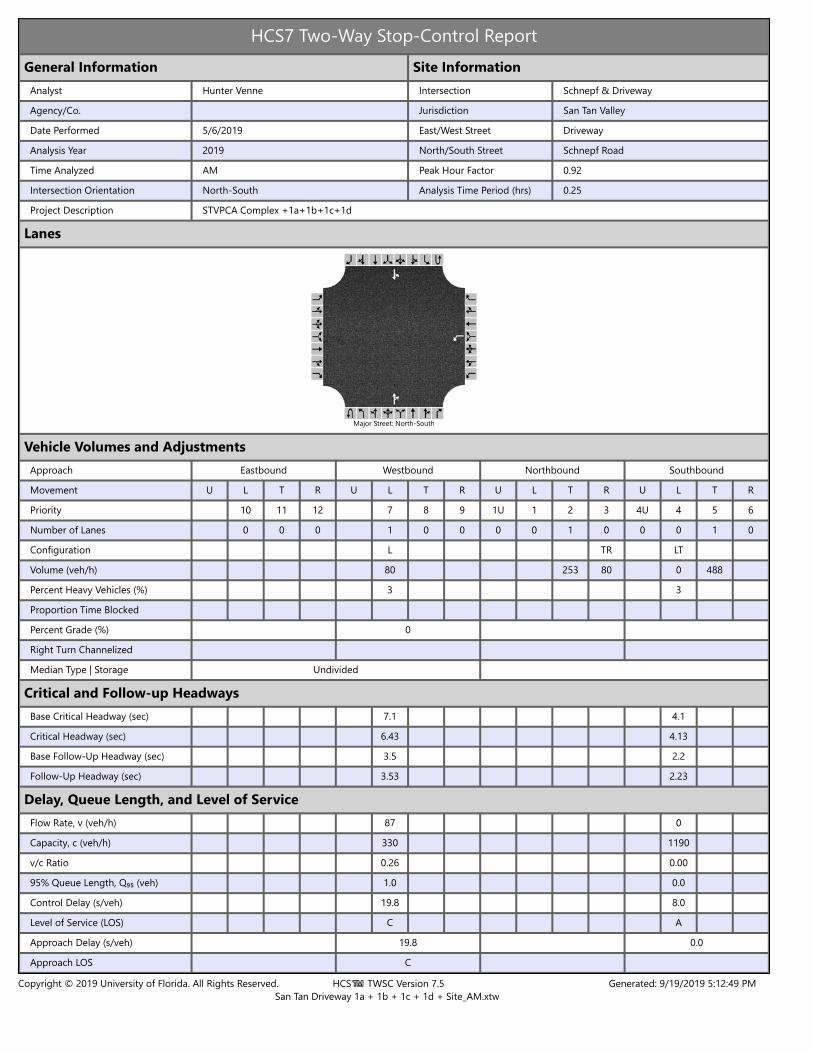
HCS7 Two-Way Stop-Control ReportGeneral Information Site Information
Analyst Hunter Venne Intersection Schnepf & DrivewayAgency/Co. Jurisdiction San Tan ValleyDate Performed 5/6/2019 East/West Street DrivewayAnalysis Year 2019 North/South Street Schnepf RoadTime Analyzed AM Peak Hour Factor 0.92Intersection Orientation North-South Analysis Time Period (hrs) 0.25Project Description STVPCA Complex +1a+1b+1c+1d
Lanes
Major Street: North-South
Vehicle Volumes and AdjustmentsApproach Eastbound Westbound Northbound SouthboundMovement U L T R U L T R U L T R U L T RPriority 10 11 12 7 8 9 1U 1 2 3 4U 4 5 6Number of Lanes 0 0 0 1 0 0 0 0 1 0 0 0 1 0Configuration L TR LTVolume (veh/h) 80 253 80 0 488Percent Heavy Vehicles (%) 3 3Proportion Time BlockedPercent Grade (%) 0Right Turn ChannelizedMedian Type | Storage Undivided
Delay, Queue Length, and Level of ServiceFlow Rate, v (veh/h) 87 0Capacity, c (veh/h) 330 1190v/c Ratio 0.26 0.0095% Queue Length, Q₉₅ (veh) 1.0 0.0Control Delay (s/veh) 19.8 8.0Level of Service (LOS) C AApproach Delay (s/veh) 19.8 0.0Approach LOS C
HCS7 Two-Way Stop-Control ReportGeneral Information Site Information
Analyst Hunter Venne Intersection Schnepf & DrivewayAgency/Co. Jurisdiction San Tan ValleyDate Performed 5/6/2019 East/West Street DrivewayAnalysis Year 2019 North/South Street Schnepf RoadTime Analyzed PM Peak Hour Factor 0.92Intersection Orientation North-South Analysis Time Period (hrs) 0.25Project Description STVPCA Complex +1a+1b+1c+1d
Lanes
Major Street: North-South
Vehicle Volumes and AdjustmentsApproach Eastbound Westbound Northbound SouthboundMovement U L T R U L T R U L T R U L T RPriority 10 11 12 7 8 9 1U 1 2 3 4U 4 5 6Number of Lanes 0 0 0 1 0 0 0 0 1 0 0 0 1 0Configuration L TR LTVolume (veh/h) 41 493 41 0 307Percent Heavy Vehicles (%) 3 3Proportion Time BlockedPercent Grade (%) 0Right Turn ChannelizedMedian Type | Storage Undivided
Delay, Queue Length, and Level of ServiceFlow Rate, v (veh/h) 45 0Capacity, c (veh/h) 311 988v/c Ratio 0.14 0.0095% Queue Length, Q₉₅ (veh) 0.5 0.0Control Delay (s/veh) 18.5 8.6Level of Service (LOS) C AApproach Delay (s/veh) 18.5 0.0Approach LOS C
HCS7 Two-Way Stop-Control ReportGeneral Information Site Information
Analyst Hunter Venne Intersection Bella Vista & SchnepfAgency/Co. Jurisdiction San Tan ValleyDate Performed 5/6/2019 East/West Street Bella Vista RoadAnalysis Year 2019 North/South Street Schnepf RoadTime Analyzed AM Peak Hour Factor 0.92Intersection Orientation East-West Analysis Time Period (hrs) 0.25Project Description STVPCA Complex +1a+1b+1c+1d
Lanes
Major Street: East-West
Vehicle Volumes and AdjustmentsApproach Eastbound Westbound Northbound SouthboundMovement U L T R U L T R U L T R U L T RPriority 1U 1 2 3 4U 4 5 6 7 8 9 10 11 12Number of Lanes 0 1 1 0 0 0 1 0 0 0 0 1 0 1Configuration L T TR L RVolume (veh/h) 243 195 272 10 9 497Percent Heavy Vehicles (%) 3 3 3Proportion Time BlockedPercent Grade (%) 0Right Turn Channelized NoMedian Type | Storage Undivided
Delay, Queue Length, and Level of ServiceFlow Rate, v (veh/h) 264 10 540Capacity, c (veh/h) 1247 200 736v/c Ratio 0.21 0.05 0.7395% Queue Length, Q₉₅ (veh) 0.8 0.2 6.5Control Delay (s/veh) 8.7 24.0 22.2Level of Service (LOS) A C CApproach Delay (s/veh) 4.8 22.2Approach LOS C
HCS7 Two-Way Stop-Control ReportGeneral Information Site Information
Analyst Hunter Venne Intersection Bella Vista & SchnepfAgency/Co. Jurisdiction San Tan ValleyDate Performed 5/6/2019 East/West Street Bella Vista RoadAnalysis Year 2019 North/South Street Schnepf RoadTime Analyzed AM Peak Hour Factor 0.92Intersection Orientation East-West Analysis Time Period (hrs) 0.25Project Description STVPCA Complex +1a+1b+1c+1d
Lanes
Major Street: East-West
Vehicle Volumes and AdjustmentsApproach Eastbound Westbound Northbound SouthboundMovement U L T R U L T R U L T R U L T RPriority 1U 1 2 3 4U 4 5 6 7 8 9 10 11 12Number of Lanes 0 1 1 0 0 0 1 0 0 0 0 1 0 1Configuration L T TR L RVolume (veh/h) 485 273 204 8 7 300Percent Heavy Vehicles (%) 3 3 3Proportion Time BlockedPercent Grade (%) 0Right Turn Channelized NoMedian Type | Storage Undivided
Delay, Queue Length, and Level of ServiceFlow Rate, v (veh/h) 527 8 326Capacity, c (veh/h) 1330 72 810v/c Ratio 0.40 0.11 0.4095% Queue Length, Q₉₅ (veh) 1.9 0.3 2.0Control Delay (s/veh) 9.5 60.6 12.4Level of Service (LOS) A F BApproach Delay (s/veh) 6.1 13.5Approach LOS B