Sand petrography and U/Pb detrital zircon geochronology of late Quaternary tills from the Byrd Glacier and central/western Ross Sea, Antarctica E.F. Palmer and K. Licht Department of Earth Sciences, Indiana University~Purdue University Indianapolis, 723 W. Michigan St., Indianapolis, IN 46202 USA ([email protected], [email protected]) Summary Petrography of the sand fraction and detrital zircon U/Pb isotope data were collected from Byrd Glacier moraines and central/western Ross Sea till in order to trace material transported from the Byrd Glacier into the Ross embayment. Petrographic analysis of Byrd Glacier samples show a wide variety of mineral and lithic fragments. Quartz, feldspar, greywacke, igneous (mafic, intermediate, and felsic), and metamorphic fragments were observed in different percentages among the sites. The U/Pb ages of zircons from Byrd Glacier show a dominant population of Ross to Pan-African ages with varying populations of older (Grenville to Archean) zircons. The Ross Sea samples have a variety of mineral and lithic fragments as well and include a dominant population of greywacke lithic fragments. Whereas most Ross Sea till samples contain a complex mix of mineral and lithic fragments, one depth interval from each of the three cores is dominated (>85%) by greywacke. Citation: Palmer, E.F., and K. Licht, (2007), Sand petrography and U/Pb detrital zircon geochronology of late Quaternary tills from the Byrd Glacier and central/western Ross Sea, Antarctica, in Antarctica: A Keystone in a Changing World – Online Proceedings of the 10 th ISAES X, edited by A. K. Cooper and C. R. Raymond et al., USGS Open-File Report 2007-1047, Extended Abstract 134, 4 p. Introduction Licht et al. (2005) and Farmer et al. (2006) studied tills from the East and West Antarctic and the Ross Sea in an attempt to assess West and East Antarctic Ice Sheet dynamics in the Ross embayment during the last glacial maximum (LGM). The Licht et al. (2005) study used coarse sand petrography (0.5 – 2.0 mm) to determine provenance of terrestrial and Ross Sea tills. The Farmer et al. (2006) provenance study used trace elements, Nd, Sr, and Pb isotopes of the <0.63 μm fraction from the Licht et al. (2005) study samples. Both studies concluded that tills from East and West Antarctic are compositionally unique, that till from the western and eastern Ross Sea are compositionally unique and derived from East and West Antarctic sources respectively, and that central Ross Sea till is the result of a confluence of material from both East and West Antarctica. Synthesis of this data offers some constraint on the paleo ice-flow paths of material flowing from both the WAIS and the EAIS into the Ross Sea during the LGM. However, the study only had one sample from the Byrd Glacier. The Byrd Glacier is the largest of the East Antarctic outlet glaciers and has the highest ice discharge of any glacier in the Transantarctic Mountains (TAM). This study expands upon the previous work of Licht et al. (2005) by analyzing sand petrography, pebble composition, particle size, and detrital zircon U/Pb isotopes to determine the paleo ice-flow path of the Byrd Glacier during the LGM and to learn more about the sub-glacial geology of the East Antarctic craton. The Byrd Glacier overlies a discontinuity in the trend of the Ross Orogen in the TAM (Stump et al., 2004). Outcrops along the southern margin of the Byrd Glacier expose the Lower Cambrian to Ordovician Shackleton Limestone and Starshot Group siliciclastic rocks (Goodge et al., 2004). Bedrock along the northern margin of the Byrd Glacier mostly comprises crystalline rocks which Grindley and Laird (1969) mapped using aerial photo interpretation as Cambro-Ordovician Granite Harbour Intrusives. A reconnaissance survey of the Byrd Glacier by Borg (1989) found U.S. Geological Survey and The National Academies; USGS OF-2007-1047, Extended Abstract 134 Figure 1. RadarSat map of Antarctica overlain by Ross Sea bathymetry (Davey, 2005) with locations of Byrd Glacier sample sites and Ross Sea piston cores. Cool colors represent deeper bathymetry while red is above sea level. Byrd Glacier Ross Island Ross Ice Shelf
Transcript
Sand petrography and U/Pb detrital zircon geochronology of late Quaternary tills from the Byrd Glacier and central/western Ross Sea, AntarcticaE.F. Palmer and K. LichtDepartment of Earth Sciences, Indiana University~Purdue University Indianapolis, 723 W. Michigan St., Indianapolis, IN 46202 USA ([email protected], [email protected])
Summary Petrography of the sand fraction and detrital zircon U/Pb isotope data were collected from Byrd Glacier moraines and central/western Ross Sea till in order to trace material transported from the Byrd Glacier into the Ross embayment. Petrographic analysis of Byrd Glacier samples show a wide variety of mineral and lithic fragments. Quartz, feldspar, greywacke, igneous (mafic, intermediate, and felsic), and metamorphic fragments were observed in different percentages among the sites. The U/Pb ages of zircons from Byrd Glacier show a dominant population of Ross to Pan-African ages with varying populations of older (Grenville to Archean) zircons. The Ross Sea samples have a variety of mineral and lithic fragments as well and include a dominant population of greywacke lithic fragments. Whereas most Ross Sea till samples contain a complex mix of mineral and lithic fragments, one depth interval from each of the three cores is dominated (>85%) by greywacke. Citation: Palmer, E.F., and K. Licht, (2007), Sand petrography and U/Pb detrital zircon geochronology of late Quaternary tills from the Byrd Glacier and central/western Ross Sea, Antarctica, in Antarctica: A Keystone in a Changing World – Online Proceedings of the 10th ISAES X, edited by A. K. Cooper and C. R. Raymond et al., USGS Open-File Report 2007-1047, Extended Abstract 134, 4 p.
IntroductionLicht et al. (2005) and Farmer et al. (2006)
studied tills from the East and West Antarctic and the Ross Sea in an attempt to assess West and East Antarctic Ice Sheet dynamics in the Ross embayment during the last glacial maximum (LGM). The Licht et al. (2005) study used coarse sand petrography (0.5 – 2.0 mm) to determine provenance of terrestrial and Ross Sea tills. The Farmer et al. (2006) provenance study used trace elements, Nd, Sr, and Pb isotopes of the <0.63 µm fraction from the Licht et al. (2005) study samples. Both studies concluded that tills from East and West Antarctic are compositionally unique, that till from the western and eastern Ross Sea are compositionally unique and derived from East and West Antarctic sources respectively, and that central Ross Sea till is the result of a confluence of material from both East and West Antarctica. Synthesis of this data offers some constraint on the paleo ice-flow paths of material flowing from both the WAIS and the EAIS into the Ross Sea during the LGM. However, the study only had one sample from the Byrd Glacier.
The Byrd Glacier is the largest of the East Antarctic outlet glaciers and has the highest ice discharge of any glacier in the Transantarctic Mountains (TAM). This study expands upon the previous work of Licht et al. (2005) by analyzing sand petrography, pebble composition, particle size, and detrital zircon U/Pb isotopes to determine the paleo ice-flow path of the Byrd Glacier during the LGM and to learn more about
the sub-glacial geology of the East Antarctic craton. The Byrd Glacier overlies a discontinuity in the trend of the Ross Orogen in the TAM (Stump et al., 2004).
Outcrops along the southern margin of the Byrd Glacier expose the Lower Cambrian to Ordovician Shackleton Limestone and Starshot Group siliciclastic rocks (Goodge et al., 2004). Bedrock along the northern margin of the Byrd Glacier mostly comprises crystalline rocks which Grindley and Laird (1969) mapped using aerial photo interpretation as Cambro-Ordovician Granite Harbour Intrusives. A reconnaissance survey of the Byrd Glacier by Borg (1989) found
U.S. Geological Survey and The National Academies; USGS OF-2007-1047, Extended Abstract 134
Figure 1. RadarSat map of Antarctica overlain by Ross Sea bathymetry (Davey, 2005) with locations of Byrd Glacier sample sites and Ross Sea piston cores. Cool colors represent deeper bathymetry while red is above sea level.
amphibolite-grade schist and gneiss, which were named the Horney Formation. The nunataks at the head of the Byrd Glacier are mapped as Beacon Supergroup, but little else is known of the bedrock geology of this area (Stump et al., 2004).
MethodsDuring the 2005 Antarctic field season samples of
glacial till were collected from seven moraines along the margins and head of the Byrd Glacier. These sites included the Lone Wolf Nunataks (LW/LW2), Bates Nunatak (BN), Britannia Range (BR), and three sites along the margins of the Byrd Glacier near Horney Bluff (HB), upstream from Horney Bluff (CJ), and near Mt. Tuatara (MT) (figure 1).
Three sub-samples of till and pebbles were collected from moraines at seven localities along the margins and head of the Byrd Glacier. At each sample site except Lonewolf (LW), three individual samples were collected and assigned a designation of A, B, and C. For each sub-sample, a one to two square meter area was chosen where approximately 100 pebbles, one to four inches in diameter, were collected. Approximately one liter of till was also collected after first discarding the top 2 -3 centimeters of surface material. Additionally, four intervals of central/western Ross Sea cores were obtained from Florida State University’s Antarctic Marine Geology Research Center.
The 0.063 – 0.149 mm fraction was sent to Iowa State University for zircon separation using heavy liquids. The zircon separates were taken to the University of Arizona’s Laserchron Center for analysis using a GVI Isoprobe Multicollector Inductively Coupled Plasma Mass Spectrometer coupled with a New Wave Instruments 193 nm Eximer laser ablation system. A total of 70 – 100 unknowns were ablated per sample using a 25 – 35 µm spot size depending on the average size range in each sample population. The laser was set at ~40 mJ output energy with an 8 pulse repetition rate per second.
For the sand petrography each sample was sieved to isolate the 0.5 – 2 mm fraction, which were then mounted in epoxy and point-counted using the Indiana point counting method (Suttner, 1974; Suttner et al., 1981). Each grain within the thin section was counted to determine each sample’s total content of mineral and lithic fragments.
Preliminary ResultsThe preliminary results include bar graphs showing the
sand petrography data from samples at the head of Byrd Glacier (fig. 2 and 3). All petrologic categories ≥5% are included in the graphs. In addition to the petrography data, detrital zircon U/Pb age probability plots (fig. 4) are
shown.Spider diagrams are used to display the sand petrography of three Ross Sea piston cores (fig. 5). The data within the
individual graphs are ordered by depth. All petrographic categories ≥5% are included with the exception of limestone and extrusive igneous fragments, which in some samples were <5%. These were included due to provenance implications. The Ross Sea geochronology data was not added to this abstract due to limited space but will be published in the future.
10th International Symposium on Antarctic Earth Sciences
quartz silt/sand stone mafic igneous metaPetrographic Catagory
0%
10%
20%
30%
40%
50%
60%
70%
80%
90%
100%
BR
BN
Figure 2. Sand petrography data from the Bates Nunataks (BN), and Britannia Ridge (BR) sample sites. Mafic igneous lithic fragments dominate the sand fraction for both BN and BR. A small amount (~6%) of metamorphic fragments are also found in the BR samples. This is likely reflected in the older ages displayed in the U/Pb age plots in figure 4.
Figure 3. Sand petrography data from the Lone Wolf Nuntaks (LW, LW2) sample sites. Both Lone Wolf sites show a high percentage of greywacke lithic fragments with almost 60% at LW. LW2 contains a higher percentage of quartz grains than LW.
Figure 4. Detrital zircon U/Pb age probability plot from the Bates Nuntaks (BN) and Lone Wolf Nuntaks (LW, LW2) sample sites.
0200
400
600
800
1000
1200
1400
1600
1800
2000
2200
2400
2600
2800
3000
3200
3400
3600
Age (Ma)
LW2-A, B, C
BNn = 91
n = 211
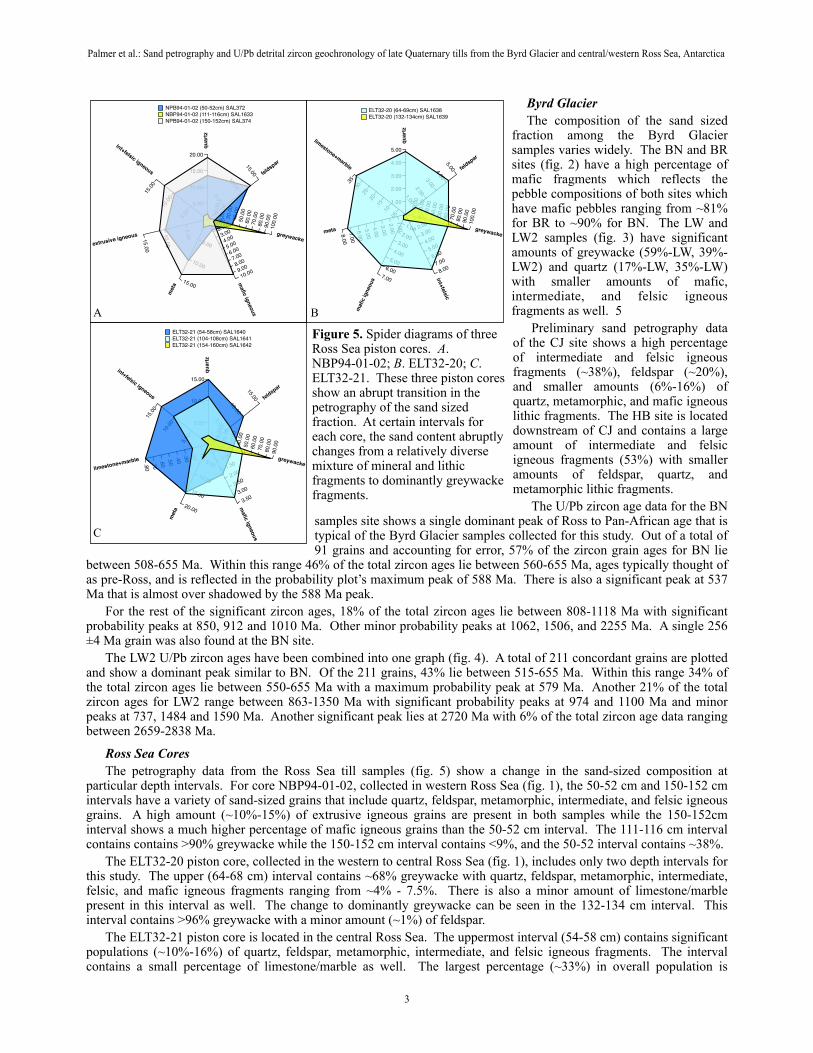
Byrd GlacierThe composition of the sand sized
fraction among the Byrd Glacier samples varies widely. The BN and BR sites (fig. 2) have a high percentage of mafic fragments which reflects the pebble compositions of both sites which have mafic pebbles ranging from ~81% for BR to ~90% for BN. The LW and LW2 samples (fig. 3) have significant amounts of greywacke (59%-LW, 39%-LW2) and quartz (17%-LW, 35%-LW) with smaller amounts of mafic, intermediate, and felsic igneous fragments as well. 5
Preliminary sand petrography data of the CJ site shows a high percentage of intermediate and felsic igneous fragments (~38%), feldspar (~20%), and smaller amounts (6%-16%) of quartz, metamorphic, and mafic igneous lithic fragments. The HB site is located downstream of CJ and contains a large amount of intermediate and felsic igneous fragments (53%) with smaller amounts of feldspar, quartz, and metamorphic lithic fragments.
The U/Pb zircon age data for the BN samples site shows a single dominant peak of Ross to Pan-African age that is typical of the Byrd Glacier samples collected for this study. Out of a total of 91 grains and accounting for error, 57% of the zircon grain ages for BN lie
between 508-655 Ma. Within this range 46% of the total zircon ages lie between 560-655 Ma, ages typically thought of as pre-Ross, and is reflected in the probability plot’s maximum peak of 588 Ma. There is also a significant peak at 537 Ma that is almost over shadowed by the 588 Ma peak.
For the rest of the significant zircon ages, 18% of the total zircon ages lie between 808-1118 Ma with significant probability peaks at 850, 912 and 1010 Ma. Other minor probability peaks at 1062, 1506, and 2255 Ma. A single 256±4 Ma grain was also found at the BN site.
The LW2 U/Pb zircon ages have been combined into one graph (fig. 4). A total of 211 concordant grains are plotted and show a dominant peak similar to BN. Of the 211 grains, 43% lie between 515-655 Ma. Within this range 34% of the total zircon ages lie between 550-655 Ma with a maximum probability peak at 579 Ma. Another 21% of the total zircon ages for LW2 range between 863-1350 Ma with significant probability peaks at 974 and 1100 Ma and minor peaks at 737, 1484 and 1590 Ma. Another significant peak lies at 2720 Ma with 6% of the total zircon age data ranging between 2659-2838 Ma.
Ross Sea CoresThe petrography data from the Ross Sea till samples (fig. 5) show a change in the sand-sized composition at
particular depth intervals. For core NBP94-01-02, collected in western Ross Sea (fig. 1), the 50-52 cm and 150-152 cm intervals have a variety of sand-sized grains that include quartz, feldspar, metamorphic, intermediate, and felsic igneous grains. A high amount (~10%-15%) of extrusive igneous grains are present in both samples while the 150-152cm interval shows a much higher percentage of mafic igneous grains than the 50-52 cm interval. The 111-116 cm interval contains contains >90% greywacke while the 150-152 cm interval contains <9%, and the 50-52 interval contains ~38%.
The ELT32-20 piston core, collected in the western to central Ross Sea (fig. 1), includes only two depth intervals for this study. The upper (64-68 cm) interval contains ~68% greywacke with quartz, feldspar, metamorphic, intermediate, felsic, and mafic igneous fragments ranging from ~4% - 7.5%. There is also a minor amount of limestone/marble present in this interval as well. The change to dominantly greywacke can be seen in the 132-134 cm interval. This interval contains >96% greywacke with a minor amount (~1%) of feldspar.
The ELT32-21 piston core is located in the central Ross Sea. The uppermost interval (54-58 cm) contains significant populations (~10%-16%) of quartz, feldspar, metamorphic, intermediate, and felsic igneous fragments. The interval contains a small percentage of limestone/marble as well. The largest percentage (~33%) in overall population is
Palmer et al.: Sand petrography and U/Pb detrital zircon geochronology of late Quaternary tills from the Byrd Glacier and central/western Ross Sea, Antarctica
3
1.00
2.00
3.00
4.00
5.00
qu
art
z1.00
2.003.00
4.005.00 fe
ldspar
10.0
020.0
030.0
040.0
050.0
060.0
070.0
080.0
090.0
0100.0
0
greywacke
1.00
2.00
3.00
4.00
5.00
6.00
7.00
8.00
int+
fels
ic
1.002.00
3.004.00
5.006.00
7.00
mafic igneous
1.0
0
2.0
0
3.0
0
4.0
0
5.0
0
6.0
0
7.0
0
8.0
0
meta
.05.1
0.15.2
0.25.3
0.35
limestone+m
arble
ELT32-20 (64-69cm) SAL1638
ELT32-20 (132-134cm) SAL1639
5.00
10.00
15.00
20.00
qu
art
z
5.00
10.00
15.00 feld
spar
10.0
020.0
030.0
040.0
050.0
060.0
070.0
080.0
090.0
0100.0
0
greywacke
1.00
2.00
3.00
4.00
5.00
6.00
7.00
8.00
9.00
10.00
mafic ig
neous
5.00
10.00
15.00
meta
5.0
010.0
0
15.0
0
extrusive igneous
5.00
10.0
0
15.0
0int+felsic igneous
NPB94-01-02 (50-52cm) SAL372
NBP94-01-02 (111-116cm) SAL1633
NPB94-01-02 (150-152cm) SAL374
5.00
10.00
15.00
qu
art
z
5.00
10.00
15.00 feld
spar
10.0
020.0
030.0
040.0
050.0
060.0
070.0
080.0
090.0
0
greywacke
.50
1.00
1.50
2.00
2.50
3.00
3.50
mafic ig
neous
5.00
10.00
15.00
20.00
meta
.10
.20
.30
.40
.50
.60
.70
.80limestone+marble
5.00
10.0
0
15.0
0
int+felsic igneous
ELT32-21 (54-58cm) SAL1640
ELT32-21 (104-108cm) SAL1641
ELT32-21 (154-160cm) SAL1642
Figure 5. Spider diagrams of three Ross Sea piston cores. A. NBP94-01-02; B. ELT32-20; C. ELT32-21. These three piston cores show an abrupt transition in the petrography of the sand sized fraction. At certain intervals for each core, the sand content abruptly changes from a relatively diverse mixture of mineral and lithic fragments to dominantly greywacke fragments.
A B
C
greywacke grains. The 104-108 cm interval is similar to the previous with a greater percentage of greywacke and a fairly even reduction of all other grains. The 154-160 cm interval again shows a change in composition with a dominant greywacke population ~ 87%. The interval also contains minor percentages of intermediate, felsic, and metamorphic grains ranging from ~2% - 4.5% respectively.
DiscussionThe Bates and Lonewolf nunataks are the last vestiges of exposed bedrock to be found at the head of the Byrd
Glacier. Both are mapped as Beacon Supergroup and Ferrar Group. Yet the till at these sites (BN, LW/LW2) contain strong differences in their pebble and sand content as well as their U/Pb detrital zircon ages..
The material contributing to these sites is likely a combination of both subglacial and local sources. Whereas BN is dominated by mafic igneous fragments, consistent with mapped geology, the LW tills contain lithic fragments and pebbles not derived from local nunataks. Thus the Lonewolf Nunataks likely contain a high percentage of material that originates from underneath the East Antarctic Ice Sheet due to the subglacial particle size signatures of both the LW and LW2 samples (Licht et al., 2006).
The U/Pb detrital zircon ages from the BN and LW/LW2 moraines show a similar dominant probability peak. LW2’s largest probability peak is 579 Ma and BN’s is 588 Ma displaying a slight shift from older to younger pan-African ages between the two sites. The contrast in older (>800 Ma) zircon ages between the two sites likely mirrors compositional differences of their sand fractions. The older zircon ages for LW2 are quite different from BN with the exception of a few small age peaks and therefore it is likely that a portion of the till from these two areas share similar provenance, with the LW2 area gaining additional material from another locale. The presence of Grenville aged (~975 and 1100 Ma) and late Archean (~2720 Ma) zircons for LW2 may reflect ages of bedrock from underneath the EAIS and possibly material derived from the Gamburtzev Mountains.
The Ross Sea petrography data displays changes in the flux of glacial material flowing into the Ross Sea. From the limited amount of data it appears that at a certain period in time glacial material from an, as of now, unknown source flowed into the central and western Ross Sea depositing material dominated by greywacke in the 0.5-2.0 mm fraction. Further study of this greywacke material will be done in the future in an attempt to determine provenance.
SummarySand petrography and detrital zircon U/Pb isotope data were collected from tills along the margins and head of the
Byrd Glacier and the central and western Ross Sea. The Byrd Glacier tills show a variety of mineral and lithic compositions in the sand fraction that reflect the diverse assemblages of bedrock along the Byrd Glacier. Foreign sand grains in certain samples also suggest material is being transported from other locales and then deposited within these moraines. U/Pb ages of the detrital zircons also reflect this variability of the sand fraction. A strong Ross to Pan-African age signature is present within the Byrd Glacier’s till along with smaller amounts of Grenville to Archean aged grains. The sand petrography data of the Ross Sea cores show an increase of greywacke fragments at certain intervals suggesting a potential change in the flux of glacially-derived material to the central/western Ross Sea. Acknowledgments. A special thanks to our field party for the 2005 Antarctic season including Andy Barth, Peter Braddock, Devon Brecke, and John Goodge; our pilots Jim Haffey and Chuck Slade, the Crary Science Laboratory staff and McMurdo Station staff. Thanks to Jason Lederer for leading the way for this project by the contributions of his previous work on the Ross Sea, and above all, the National Science Foundation for supporting this project.
ReferencesBorg, S., 1989, Studies of granites and metamorphic rocks, Byrd Glacier area: Antarctic Journal of the United States, 24, 19-21Davey, F.J., 2004, Ross Sea Bathymetry, 1:2,000,000, version 1.0, Institute of Geological & Nuclear Sciences geophysical map 16, Institute of
Geological & Sciences Limited, Lower Hutt, New ZealandFarmer, G.L., Licht, K., Swope, R.J., and Andrews, J., 2006, Isotopic constraints on the provenance of fine-grained sediment in LGM tills from the
Ross Embayment, Antarctica: Earth and Planetary Science Letters, 249, 90-107Grindley, G.W., and Laird, M.G., 1969, Geology of the Shackleton Coast, Antarctica, in Bushnell, V.C., and Craddock,C., eds., Geologic map of
Antarctica: New York, American Geographical Society, Antarctica Map Folio Series, folio 12, sheet 15, scale 1:1000000Goodge, J.W., Williams, I. S., and Myrow, P., 2004, Provenance of Neoproterozoic and lower Paleozoic siliciclastic rocks of the central Ross orogen,
Antarctica: Detrital record of rift-, passive-, and active-margin sedimentation. G.S.A. Bulletin, 116, 9/10, 1253 - 1279Licht, K. J., Lederer, J. R., and Swope, R. J., 2005, Provenance of LGM glacial till (sand fraction) across the Ross Embayment, Antarctica, Quaternary Science Reviews, 24, 1499-1520Licht, K., Swope, R.J., and Palmer, E.F., 2006, Evolution of till during transport down the Byrd and Nimrod Glaciers, Antarctica, Geological Society
of America Abstracts with Programs, 38, 7Stump, E., Gootee, B.F., Talarico, F., Van Schmus, W.R., Brand, P.K., Foland, K.A., and Fanning, C.M., 2004, Correlation of Byrd and Selborne
Groups, with implications for the Byrd Glacier discontinuity, central Transantarctic Mountains, Antarctica, New Zealand Journal of Geology & Geophysics, 47, 157-171
Suttner, L.J., 1974, Sedimentary petrographic provinces: an evaluation, in Ross, C.A., ed., Paleogeographic Provinces and Provinciality, SEPM Special Publication, 21, 1486-1516
Suttner, L.J., Basu, A., and Mack, G.H., 1981, Climate and the origin of quartz arenites, Journal of Sedimentary Petrology, 51, 4, 1235-1246
10th International Symposium on Antarctic Earth Sciences