Page 1
SANDIA REPORT SAND2015-6187 R Unlimited Release June 2015
Sandia Third-Party Witness Test of UniEnergy Technologies 1 MW / 3.2 MWh Uni.SystemTM
Benjamin L. Schenkman Dan R. Borneo
Prepared by Sandia National Laboratories Albuquerque, New Mexico 87185 and Livermore, California 94550
Sandia National Laboratories is a multi-program laboratory managed and operated by Sandia Corporation, a wholly owned subsidiary of Lockheed Martin Corporation, for the U.S. Department of Energy's National Nuclear Security Administration under contract DE-AC04-94AL85000. Approved for public release; further dissemination unlimited.
Page 3
3
Issued by Sandia National Laboratories, operated for the United States Department of Energy
by Sandia Corporation.
NOTICE: This report was prepared as an account of work sponsored by an agency of the
United States Government. Neither the United States Government, nor any agency thereof,
nor any of their employees, nor any of their contractors, subcontractors, or their employees,
make any warranty, express or implied, or assume any legal liability or responsibility for the
accuracy, completeness, or usefulness of any information, apparatus, product, or process
disclosed, or represent that its use would not infringe privately owned rights. Reference herein
to any specific commercial product, process, or service by trade name, trademark,
manufacturer, or otherwise, does not necessarily constitute or imply its endorsement,
recommendation, or favoring by the United States Government, any agency thereof, or any of
their contractors or subcontractors. The views and opinions expressed herein do not
necessarily state or reflect those of the United States Government, any agency thereof, or any
of their contractors.
Printed in the United States of America. This report has been reproduced directly from the best
available copy.
Available to DOE and DOE contractors from
U.S. Department of Energy
Office of Scientific and Technical Information
P.O. Box 62
Oak Ridge, TN 37831
Telephone: (865) 576-8401
Facsimile: (865) 576-5728
E-Mail: [email protected]
Online ordering: http://www.osti.gov/scitech
Available to the public from
U.S. Department of Commerce
National Technical Information Service
5301 Shawnee Rd
Alexandria, VA 22312
Telephone: (800) 553-6847
Facsimile: (703) 605-6900
E-Mail: [email protected]
Online order: http://www.ntis.gov/search
Page 4
4
SAND200X-XXXX
Unlimited Release
June 2015
Sandia Third-Party Witness Test of UniEnergy Technologies 1 MW / 3.2 MWh Uni.SystemTM
Benjamin L. Schenkman
Dan R. Borneo
Department Names
Sandia National Laboratories
P.O. Box 5800
Albuquerque, New Mexico 87185-MS1188
Sandia National Laboratories performs third-party witness testing for energy storage systems
installed on the electrical grid. Witness testing verifies that the energy storage system that is
installed can meet its performance specifications through a thorough evaluation which includes
testing, document review, and physical inspection. This document contains the results for the
Sandia National Laboratories witness test on the UniEnergy Technologies 1 MW / 3.2 MWh
vanadium flow battery known as the Uni.SystemTM.
Page 5
5
ACKNOWLEDGMENTS
This work was funded by the Department of Energy Office of Electricity Energy Storage Sandia
would like to acknowledge UniEnergy Technologies for performing all the test on the
Uni.SystemTM and providing all the data to Sandia.
Page 6
6
CONTENTS
1. Introduction .................................................................................................................... 9 1.1. Scope ............................................................................................................................... 9 1.2. Technology ................................................................................................................... 10 1.3. Review Test Plan .......................................................................................................... 12
1.4. Review Testing Activity At Site ................................................................................... 12
2. Safety Controls Logic Tests ......................................................................................... 14
3. System Capacity Test ................................................................................................... 15 3.1. System Capacity Test Procedure .................................................................................. 17 3.2. System Capacity Test Results ....................................................................................... 18
4. Use Case Test Protocol ................................................................................................. 21
5. THD Testing ................................................................................................................. 29
6. Conclusion .................................................................................................................... 33
7. References .................................................................................................................... 35
FIGURES
Figure 1 - 1 MW / 3.2 MWh UET Uni.SystemTM at Pullman, Washington ................................. 10
Figure 2 - Nameplate for single Uni.SystemTM battery container ................................................ 11 Figure 3 - Uni.SystemTM battery management system HMI......................................................... 11
Figure 4 - Hioki 9624-50 meter installed at one Uni.SystemTM battery string ............................. 13 Figure 5 - Test 1 520 kW charge-discharge profile ...................................................................... 16
Figure 6 - Test 2 640 kW charge-discharge profile ...................................................................... 16 Figure 7 - Test 3 1000 kW charge-discharge profile .................................................................... 17
Figure 8 - 520 kW @ 6.2 hr Voltage Total Harmonic Distortion for Single String ..................... 19 Figure 9 - 640 kW @ 4 hr Voltage Total Harmonic Distortion for Single String ........................ 19 Figure 10 - 1000 kW @ 2 hr Voltage Total Harmonic Distortion for Single String .................... 20
Figure 11 - Dynamic PJM Regulation Signal used in the PNNL/SNL Test Protocol .................. 21 Figure 12 - Peak Shaving 520 kW Duty Cycle ............................................................................. 22 Figure 13 - Peak Shaving 640 kW Duty Cycle ............................................................................. 22
Figure 14 - Peak Shaving 1000 kW Duty Cycle ........................................................................... 23 Figure 15 - Frequency Regulation and Recharge ......................................................................... 25
Figure 16 - Frequency Regulation Signal vs. Uni.SystemTM Power Output ................................ 26 Figure 17 - 520 kW Duty Cycle Power Output ............................................................................ 27 Figure 18 - 640 kW Duty Cycle Power Output ............................................................................ 28 Figure 19 - 1000 kW Duty Cycle Power Output .......................................................................... 28 Figure 20 - IEEE 519-1992 Harmonic Current Limits [1] ........................................................... 29
Figure 21 - Power Output during THD Testing for One Uni.SystemTM String ............................ 31 Figure 22 - Voltage Total Harmonic Distortion for THD Testing................................................ 31 Figure 23 - Total Current Demand Distortion for THD Testing .................................................. 32
Page 7
7
TABLES
Table 1 - UET Uni.SystemTM Performance Specifications ............................................................ 9 Table 2 - Safety Control Logic Test Matrix.................................................................................. 14 Table 3 - System Capacity Test Parameters ................................................................................. 15
Table 4 - System Capacity Test Results ....................................................................................... 18 Table 5 - Frequency Regulation Test Results ............................................................................... 25 Table 6 - Peak Shaving Management Test Results ....................................................................... 27 Table 7 - Result Matrix for THD Testing for String 2 .................................................................. 30
Page 8
8
NOMENCLATURE
UET UniEnergy Technologies
SOW Statement of Work
SEL Schweitzer Engineering Laboratories
PCS Power Conditioning System
HMI Human Machine Interface
PPE Personal Protective Equipment
PCC Point of Common Coupling
THD Total Harmonic Distortion
ISC Short Circuit Current
Page 9
9
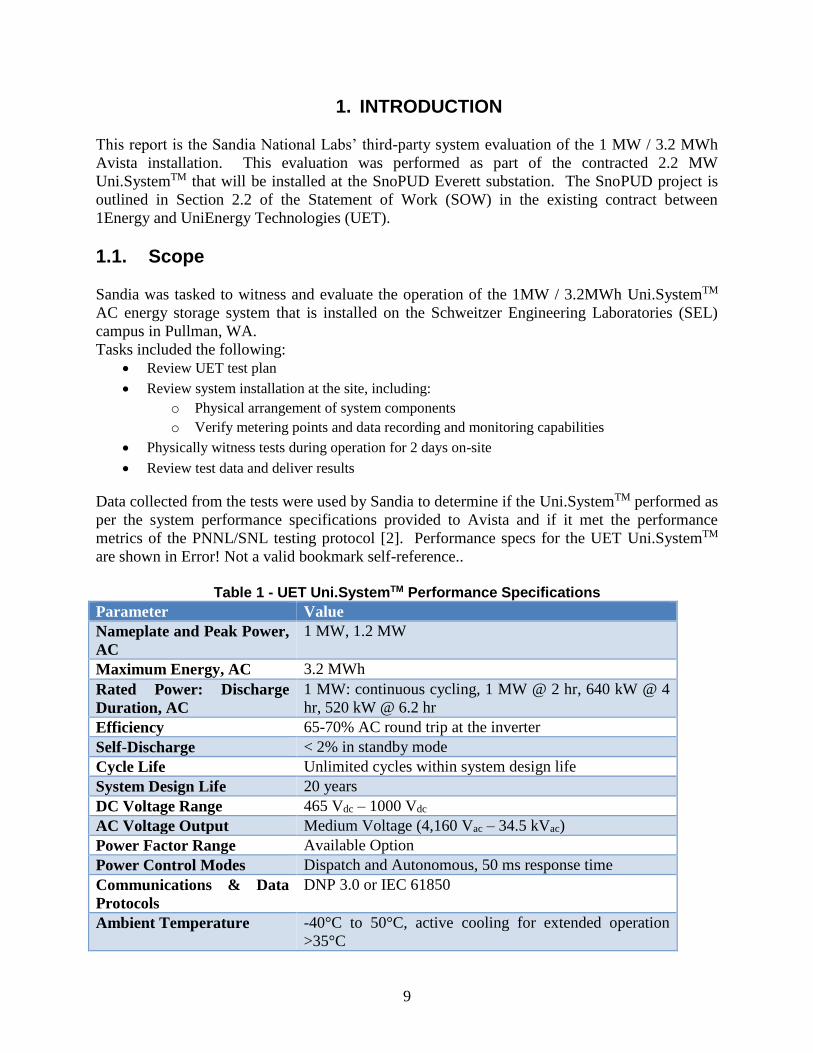
1. INTRODUCTION
This report is the Sandia National Labs’ third-party system evaluation of the 1 MW / 3.2 MWh
Avista installation. This evaluation was performed as part of the contracted 2.2 MW
Uni.SystemTM that will be installed at the SnoPUD Everett substation. The SnoPUD project is
outlined in Section 2.2 of the Statement of Work (SOW) in the existing contract between
1Energy and UniEnergy Technologies (UET).
1.1. Scope
Sandia was tasked to witness and evaluate the operation of the 1MW / 3.2MWh Uni.SystemTM
AC energy storage system that is installed on the Schweitzer Engineering Laboratories (SEL)
campus in Pullman, WA.
Tasks included the following:
Review UET test plan
Review system installation at the site, including:
o Physical arrangement of system components
o Verify metering points and data recording and monitoring capabilities
Physically witness tests during operation for 2 days on-site
Review test data and deliver results
Data collected from the tests were used by Sandia to determine if the Uni.SystemTM performed as
per the system performance specifications provided to Avista and if it met the performance
metrics of the PNNL/SNL testing protocol [2]. Performance specs for the UET Uni.SystemTM
are shown in Error! Not a valid bookmark self-reference..
Table 1 - UET Uni.SystemTM Performance Specifications
Parameter Value
Nameplate and Peak Power,
AC
1 MW, 1.2 MW
Maximum Energy, AC 3.2 MWh
Rated Power: Discharge
Duration, AC
1 MW: continuous cycling, 1 MW @ 2 hr, 640 kW @ 4
hr, 520 kW @ 6.2 hr
Efficiency 65-70% AC round trip at the inverter
Self-Discharge < 2% in standby mode
Cycle Life Unlimited cycles within system design life
System Design Life 20 years
DC Voltage Range 465 Vdc – 1000 Vdc
AC Voltage Output Medium Voltage (4,160 Vac – 34.5 kVac)
Power Factor Range Available Option
Power Control Modes Dispatch and Autonomous, 50 ms response time
Communications & Data
Protocols
DNP 3.0 or IEC 61850
Ambient Temperature -40°C to 50°C, active cooling for extended operation
>35°C
Page 10
10
System Footprint 2,173 ft2 (assuming 2 rows of 5 containers with doors
facing a common 13 ft aisle)
1.2. Technology
Figure 1 - 1 MW / 3.2 MWh UET Uni.SystemTM at Pullman, Washington
The Uni.SystemTM is a vanadium flow battery that is rated for 1.2 MW / 3.2 MWh. The system
consists of two battery strings. Each string is housed in four 20 ft shipping containers with a
fifth container on each string that contains the 600 kW power conditioning system (PCS). The
DC input of the PCS has a nominal Vdc operating range of 465 Vdc – 1000 Vdc. Each PCS
outputs 283 Vac which is then stepped up 13.8 kV through a 600 kVA transformer. The 13.8 kV
output from the transformers is then electrically connected to a Trayer automatic transfer switch
which is part of the Avista 13.8 kV electrical distribution system.
Each of the 20 ft containers has three stacks connected in series. The battery management
system for each battery string is located in the PCS container and is controlled locally through a
human machine interface (HMI) or remotely through a UET site controller. The site controller is
located in a small building known as the panel house approximately 20 ft from the Uni.SystemTM
PCS containers.
Page 11
11
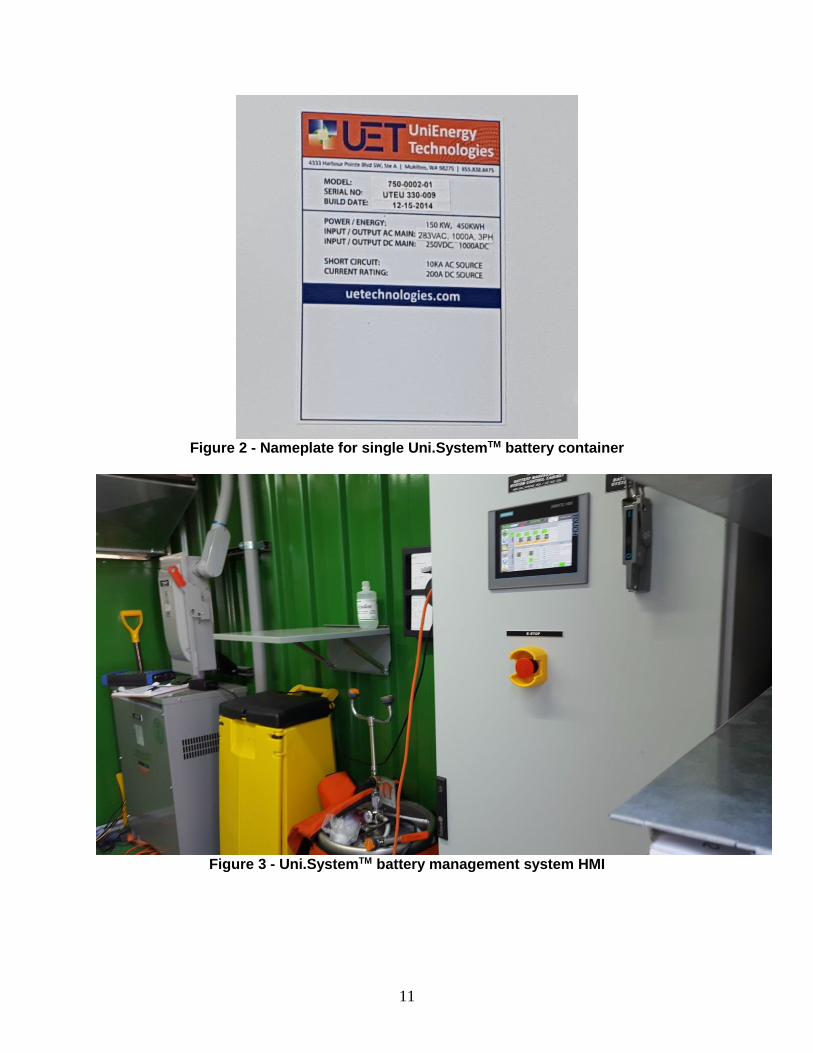
Figure 2 - Nameplate for single Uni.SystemTM battery container
Figure 3 - Uni.SystemTM battery management system HMI
Page 12
12
1.3. Review Test Plan
Sandia reviewed the witness test document (Witness Test – REV 1.2.pdf) developed by UET.
Tests outlined in the witness test document were determined to adequately evaluate the physical
operation of the Uni.SystemTM, including safety control logic and component functionality.
Parameters that Sandia was not able to verify in the Uni.SystemTM performance specification
(Sandia was tasked to witness and evaluate the operation of the 1MW / 3.2MWh Uni.SystemTM
AC energy storage system that is installed on the Schweitzer Engineering Laboratories (SEL)
campus in Pullman, WA.
Tasks included the following:
Review UET test plan
Review system installation at the site, including:
o Physical arrangement of system components
o Verify metering points and data recording and monitoring capabilities
Physically witness tests during operation for 2 days on-site
Review test data and deliver results
Data collected from the tests were used by Sandia to determine if the Uni.SystemTM performed as
per the system performance specifications provided to Avista and if it met the performance
metrics of the PNNL/SNL testing protocol [2]. Performance specs for the UET Uni.SystemTM
are shown in Error! Not a valid bookmark self-reference..
Table 1) included Self-Discharge, System Design Life and Power Control Mode response time.
These parameters were not verified due to either the tests outlined in the witness test did not
address these parameters, or data recording equipment was not at a high enough sampling rate.
Also, it should be noted that Self-Discharge as well as the Power Control Mode response time of
50 ms is usually verified during factory acceptance testing. However, the Self-Discharge of less
than 2% is calculated by UET as the solution in the stack discharged through the membrane.
Since the solution in the tanks maintains a constant level, the Self-Discharge is calculated by the
electrolyte in each stack multiplied by number of stacks and then divided by the total volume of
electrolyte per container. There are three stacks per container and each can hold up to 150 L of
electrolyte while the container itself has a total volume of 23,000 L. Calculation for the Self-
Discharge is shown in Equation 1.
𝑺𝑫 =𝑺𝒕𝒂𝒄𝒌𝑵𝑼𝑴∗𝑺𝒕𝒂𝒄𝒌𝑽𝑶𝑳
𝑪𝒐𝒏𝒕𝒂𝒊𝒏𝒆𝒓𝑽𝑶𝑳∗ 𝟏𝟎𝟎% =
𝟑∗𝟏𝟓𝟎
𝟐𝟑𝟎𝟎𝟎∗ 𝟏𝟎𝟎% = 𝟏. 𝟗% Equation 1
Parameters:
StackNUM = total number of stacks in one Uni.SystemTM container
StackVOL = volume of electrolyte in one stack within a Uni.SystemTM container, (L)
ContainerVOL = total volume of electrolyte in one Uni.SystemTM container, (L)
SD = Self Discharge,(%)
1.4. Review Testing Activity At Site
During the Sandia site visit, the physical arrangement of system components were verified
through visual inspection and compared to the Uni.SystemTM construction drawings. Proper
Page 13
13
personal protective equipment (PPE), safety documents (Uni.SystemTM Hazard Awareness and
Response), hazard signs, hazard mitigation and emergency response equipment were verified by
Sandia through physical inspection. Hazard items verified included installed hazard mitigation
barriers, hazard signs, emergency response equipment (spill kit, fire extinguisher and eye wash
station) and PPE.
Data recording was accomplished through OSI software, which collects data every second, and
stores it on a PI server at UET headquarters. On the Uni.SystemTM battery string 2, a Hioki
9624-50 power quality meter with harmonic recording capability was hooked up to the PCS at
the point of common coupling (PCC). Harmonics were recorded for the duration of the witness
test. Sandia was not tasked to verify total harmonic distortion (THD) during the witness test, but
results are presented in this report.
Figure 4 - Hioki 9624-50 meter installed at one Uni.SystemTM battery string
Page 14
14
2. SAFETY CONTROLS LOGIC TESTS
Safety control logic was tested and verified to ensure all the alarms and events that can cause the
Uni.SystemTM to shutdown were working properly. The checklist from UET for available
control logic is shown in Table 2. In each test the Uni.SystemTM was turned on and placed either
in charge, discharge or idle mode. When a fault or an alarm occurred, the Uni.SystemTM opened
up the series contactors, disabled pumps and placed pumps at zero speed. The testing verified
that a fault instantaneously disconnected the Uni.SystemTM from the electrical grid through a
breaker located in the PCS container and disabled all pumps.
Most of the alarms are based on sensor inputs, which have a maximum and minimum tolerance
set in the battery management system. To simulate most of the safety control logic tests, the
parameters were set to a value that was within the system specification which would be triggered
while the Uni.SystemTM was in normal operation. For example, if the Uni.SystemTM would fault
on a high temperature of 100°F, this value would be lowered in the tolerance settings to 80°F so
the alarm would be triggered and the Uni.SystemTM would fault. Safety control logic tests that
were simulated are denoted as such in the Test Method section of Table 2.
Sandia was only present during the Liquid Leak test and the E-Stop; the other tests were
performed before the Sandia site visit. Tests performed by UET without Sandia presence were
documented by UET, and are not part of this report.
Table 2 - Safety Control Logic Test Matrix
No. Alarm or Fault Test Method Test Result
1 Liquid Leak Physically place water at the 3 leak sensors per container
System performed a successful fault
2 Pressure Mismatch Not tested at site. Was tested at factory
None
3 Overcharged Shutdown (High SOC)
Simulated Successful Test documented by UET
4 High Temperature Simulated Successful Test documented by UET
5 High Pressure Simulated Successful Test documented by UET
6 High Cell Voltage Simulated Successful Test documented by UET
7 High Flow Rate Simulated Successful Test documented by UET
8 PCS Trip Simulated Successful Test documented by UET
9 High Cl2 Level Simulated Successful Test documented by UET
10 High H2 Level Simulated Successful Test documented
Page 15
15
by UET
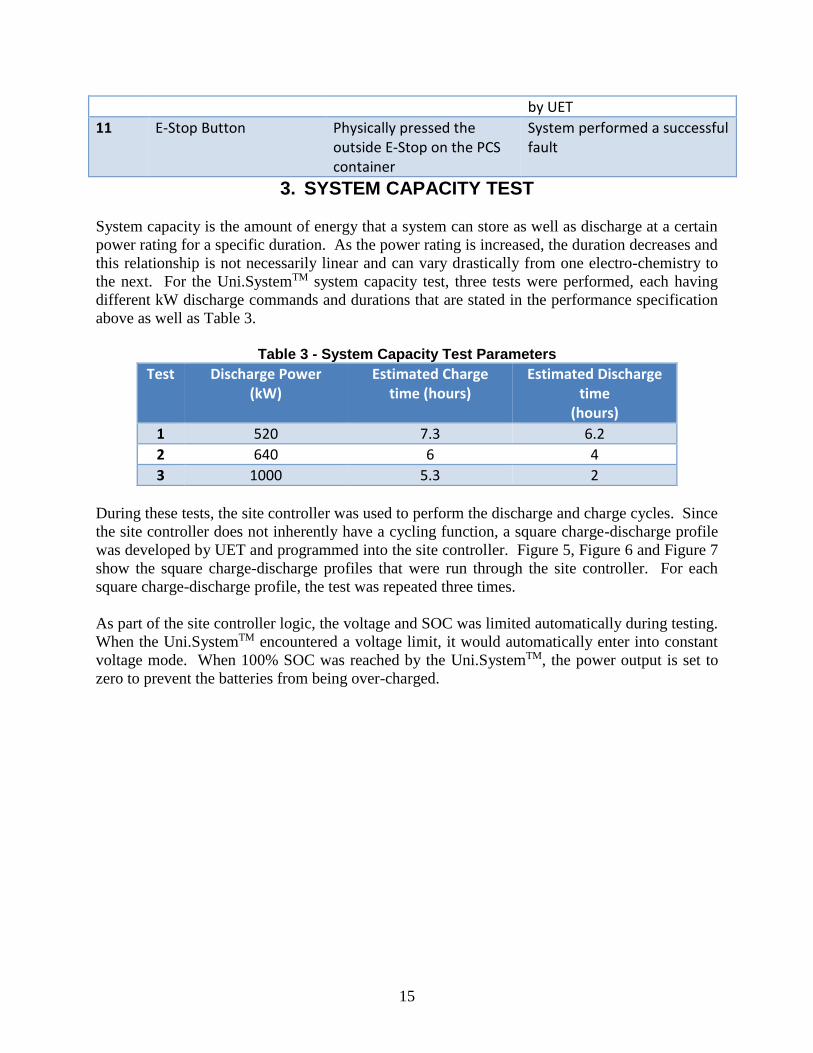
11 E-Stop Button Physically pressed the outside E-Stop on the PCS container
System performed a successful fault
3. SYSTEM CAPACITY TEST
System capacity is the amount of energy that a system can store as well as discharge at a certain
power rating for a specific duration. As the power rating is increased, the duration decreases and
this relationship is not necessarily linear and can vary drastically from one electro-chemistry to
the next. For the Uni.SystemTM system capacity test, three tests were performed, each having
different kW discharge commands and durations that are stated in the performance specification
above as well as Table 3.
Table 3 - System Capacity Test Parameters
Test Discharge Power (kW)
Estimated Charge time (hours)
Estimated Discharge time
(hours)
1 520 7.3 6.2
2 640 6 4
3 1000 5.3 2
During these tests, the site controller was used to perform the discharge and charge cycles. Since
the site controller does not inherently have a cycling function, a square charge-discharge profile
was developed by UET and programmed into the site controller. Figure 5, Figure 6 and Figure 7
show the square charge-discharge profiles that were run through the site controller. For each
square charge-discharge profile, the test was repeated three times.
As part of the site controller logic, the voltage and SOC was limited automatically during testing.
When the Uni.SystemTM encountered a voltage limit, it would automatically enter into constant
voltage mode. When 100% SOC was reached by the Uni.SystemTM, the power output is set to
zero to prevent the batteries from being over-charged.
Page 16
16
Figure 5 - Test 1 520 kW charge-discharge profile
Figure 6 - Test 2 640 kW charge-discharge profile
Page 17
17
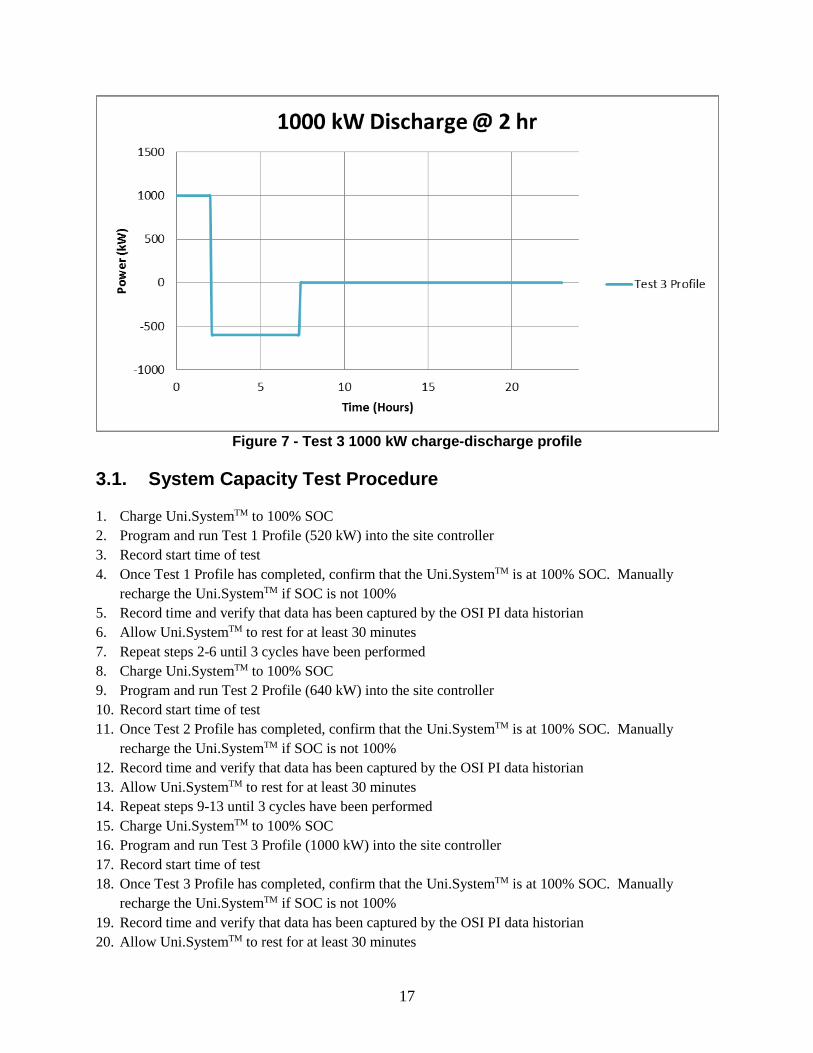
Figure 7 - Test 3 1000 kW charge-discharge profile
3.1. System Capacity Test Procedure 1. Charge Uni.SystemTM to 100% SOC
2. Program and run Test 1 Profile (520 kW) into the site controller
3. Record start time of test
4. Once Test 1 Profile has completed, confirm that the Uni.SystemTM is at 100% SOC. Manually
recharge the Uni.SystemTM if SOC is not 100%
5. Record time and verify that data has been captured by the OSI PI data historian
6. Allow Uni.SystemTM to rest for at least 30 minutes
7. Repeat steps 2-6 until 3 cycles have been performed
8. Charge Uni.SystemTM to 100% SOC
9. Program and run Test 2 Profile (640 kW) into the site controller
10. Record start time of test
11. Once Test 2 Profile has completed, confirm that the Uni.SystemTM is at 100% SOC. Manually
recharge the Uni.SystemTM if SOC is not 100%
12. Record time and verify that data has been captured by the OSI PI data historian
13. Allow Uni.SystemTM to rest for at least 30 minutes
14. Repeat steps 9-13 until 3 cycles have been performed
15. Charge Uni.SystemTM to 100% SOC
16. Program and run Test 3 Profile (1000 kW) into the site controller
17. Record start time of test
18. Once Test 3 Profile has completed, confirm that the Uni.SystemTM is at 100% SOC. Manually
recharge the Uni.SystemTM if SOC is not 100%
19. Record time and verify that data has been captured by the OSI PI data historian
20. Allow Uni.SystemTM to rest for at least 30 minutes
Page 18
18
21. Repeat steps 16-20 until 3 cycles have been performed
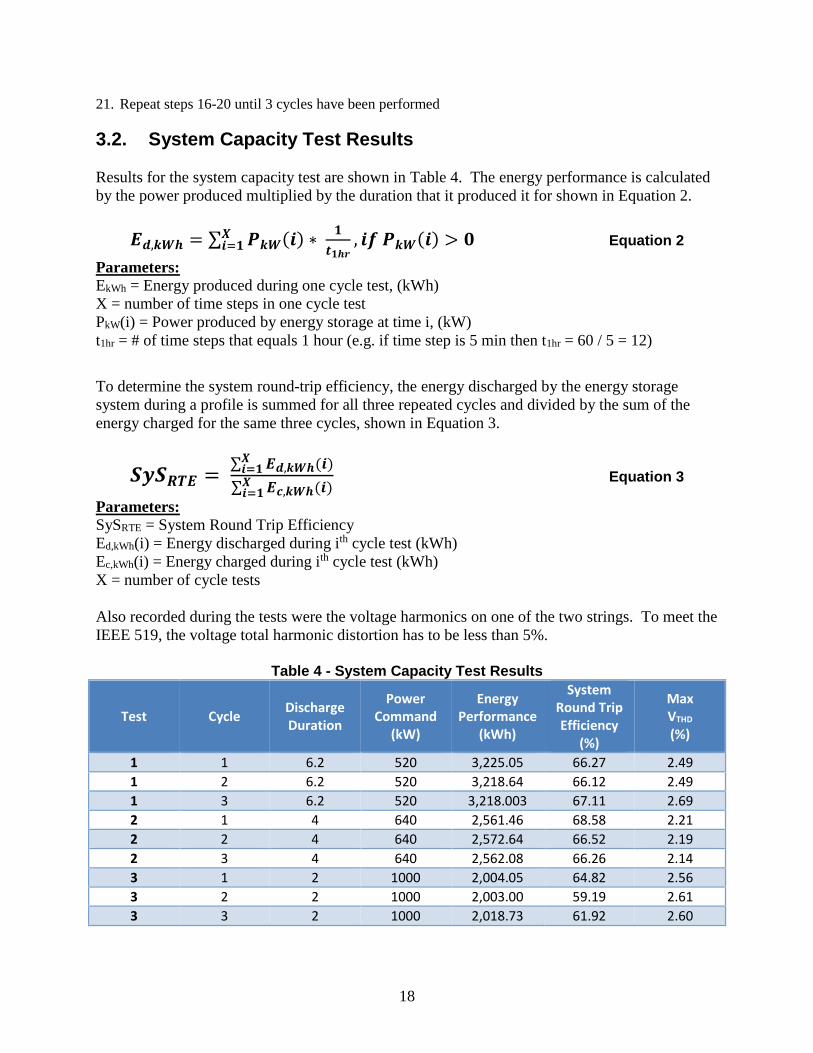
3.2. System Capacity Test Results
Results for the system capacity test are shown in Table 4. The energy performance is calculated
by the power produced multiplied by the duration that it produced it for shown in Equation 2.
𝑬𝒅,𝒌𝑾𝒉 = ∑ 𝑷𝒌𝑾(𝒊) ∗ 𝟏
𝒕𝟏𝒉𝒓, 𝒊𝒇 𝑷𝒌𝑾(𝒊) > 𝟎𝑿
𝒊=𝟏 Equation 2
Parameters:
EkWh = Energy produced during one cycle test, (kWh)
X = number of time steps in one cycle test
PkW(i) = Power produced by energy storage at time i, (kW)
t1hr = # of time steps that equals 1 hour (e.g. if time step is 5 min then t1hr = 60 / 5 = 12)
To determine the system round-trip efficiency, the energy discharged by the energy storage
system during a profile is summed for all three repeated cycles and divided by the sum of the
energy charged for the same three cycles, shown in Equation 3.
𝑺𝒚𝑺𝑹𝑻𝑬 = ∑ 𝑬𝒅,𝒌𝑾𝒉(𝒊)𝑿
𝒊=𝟏
∑ 𝑬𝒄,𝒌𝑾𝒉(𝒊)𝑿𝒊=𝟏
Equation 3
Parameters:
SySRTE = System Round Trip Efficiency
Ed,kWh(i) = Energy discharged during ith cycle test (kWh)
Ec,kWh(i) = Energy charged during ith cycle test (kWh)
X = number of cycle tests
Also recorded during the tests were the voltage harmonics on one of the two strings. To meet the
IEEE 519, the voltage total harmonic distortion has to be less than 5%.
Table 4 - System Capacity Test Results
Test Cycle Discharge Duration
Power Command
(kW)
Energy Performance
(kWh)
System Round Trip Efficiency
(%)
Max VTHD (%)
1 1 6.2 520 3,225.05 66.27 2.49
1 2 6.2 520 3,218.64 66.12 2.49
1 3 6.2 520 3,218.003 67.11 2.69
2 1 4 640 2,561.46 68.58 2.21
2 2 4 640 2,572.64 66.52 2.19
2 3 4 640 2,562.08 66.26 2.14
3 1 2 1000 2,004.05 64.82 2.56
3 2 2 1000 2,003.00 59.19 2.61
3 3 2 1000 2,018.73 61.92 2.60
Page 19
19
Figure 8 - 520 kW @ 6.2 hr Voltage Total Harmonic Distortion for Single String
Figure 9 - 640 kW @ 4 hr Voltage Total Harmonic Distortion for Single String
Page 20
20
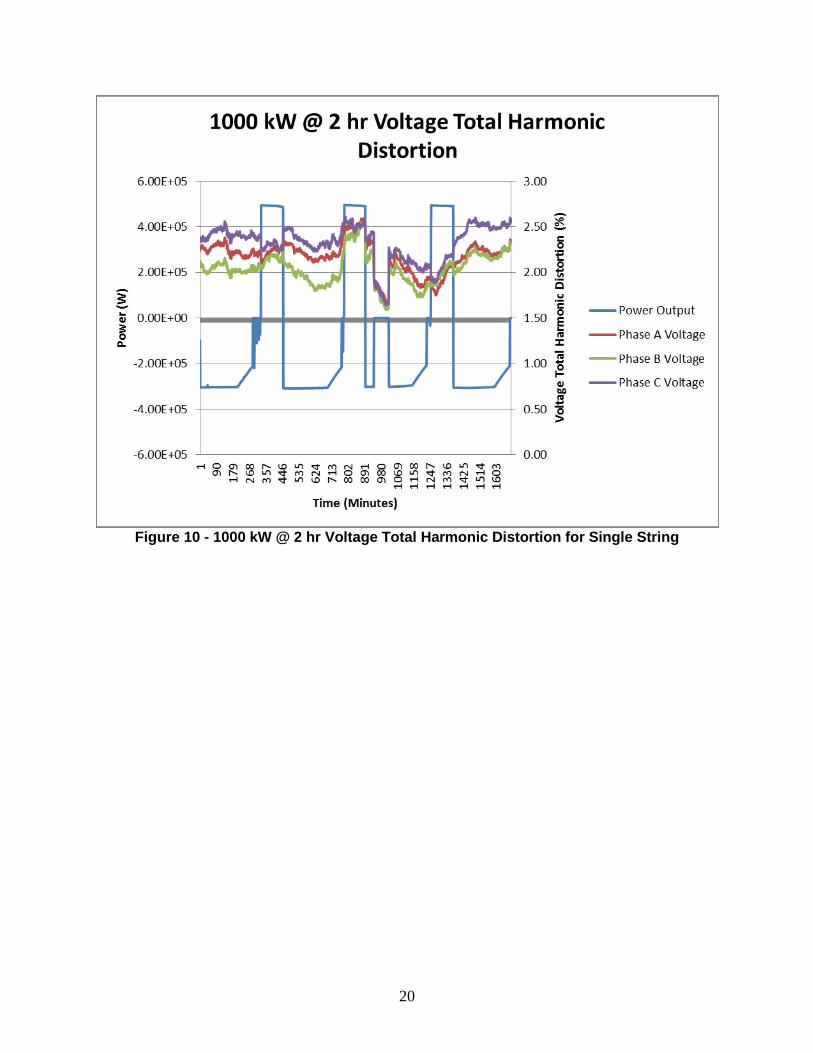
Figure 10 - 1000 kW @ 2 hr Voltage Total Harmonic Distortion for Single String
Page 21
21
4. USE CASE TEST PROTOCOL
There were two Use Case tests performed; frequency regulation and peak shaving management. In the
frequency regulation Use Case, the duty cycle for the energy storage ranges from -100% kW rated
discharge of the system to 100% kW rated charge of the system and the change of power command is
done every 4 seconds. This is based on the dynamic regulation signal from PJM for April 2011 to March
2012, shown in
Figure 11, used in the PNNL/SNL test protocol. The Uni.SystemTM has a maximum charge rate that is
limited to approximately 960 kW, therefore, the system will experience a slight increase in the time the
balance signal is not tracked. The UET has stated that the Uni.SystemTM power tracking has a +/- 0.5% at
rated power of 600 kW per battery string which is +/- 3 kW.
Figure 11 - Dynamic PJM Regulation Signal used in the PNNL/SNL Test Protocol
The second Use Case is peak shaving management, which is when the energy storage is applied
for one or more of the following: energy time shift (arbitrage), electric supply capacity, load
following, transmission congestion relief, distribution system upgrade deferral, transmission
system upgrade deferral, retail demand charge management, wind energy time shift (arbitrage),
base load time shift, photovoltaic energy time shift (arbitrage) and renewable capacity firming.
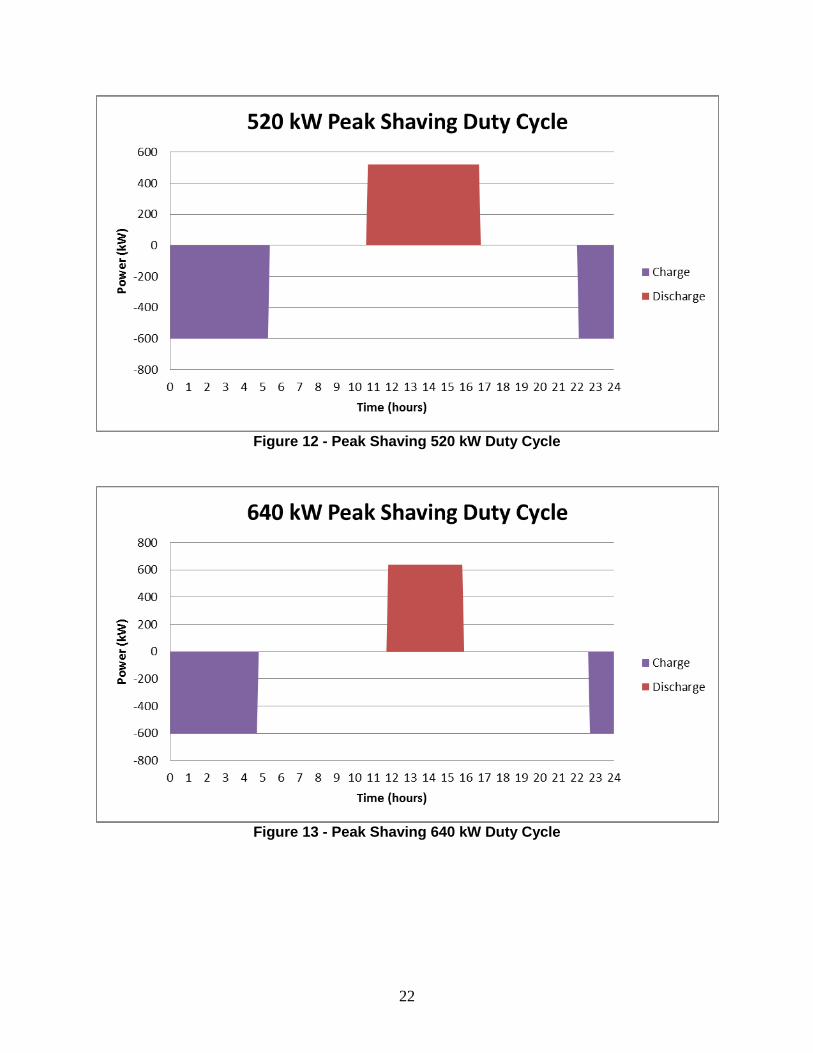
For this Use Case, the energy storage is to follow the PNNL/SNL test protocol by cycling the
energy storage with each cycle having a 12-hour charge window, a variable duration discharge
window and two equal float windows that bring the total cycle duration to one 24-hour period.
Based on system specification, an 8-hour charge time is sufficient so the cycle tests will have
longer rest periods between. The three cycles tested are shown in the figures below.
Page 22
22
Figure 12 - Peak Shaving 520 kW Duty Cycle
Figure 13 - Peak Shaving 640 kW Duty Cycle
Page 23
23
Figure 14 - Peak Shaving 1000 kW Duty Cycle
For both use cases, the test procedures along with the results are reported.
4.1. Frequency Regulation Test Procedure 1. Charge or discharge Uni.SystemTM to a certain SOC determined by UET and hold for 15 minutes
before frequency regulation signal begins
2. Program and start the frequency regulation signal shown in Figure 11 using the site controller
3. Record Start time of test
4. After following the frequency regulation signal for 24 hours, recharge the Uni.SystemTM back to
original SOC to provide data for a roundtrip efficiency calculation
5. Record time and verify that data has been captured by the OSI PI data historian
4.2. Frequency Regulation Test Results
To calculate the system round trip efficiency for the frequency regulation test the total energy
discharged is divided by the total energy charged. Energy calculations are shown in Equations 4
and 5 and then substituted into Equation 3.
𝑬𝒅,𝒌𝑾𝒉 = ∑ 𝑷𝒌𝑾(𝒊) ∗ 𝟏
𝒕𝟏𝒉𝒓, 𝒊𝒇 𝑷𝒌𝑾(𝒊) > 𝟎𝑿
𝒊=𝟏 Equation 4
Parameters:
Ed,kWh = energy produced during discharge
X = number of time steps in frequency regulation test (24 hours * 3600 second = 86,400
seconds)
PkW(i) = power produced by energy storage at time i, (kW)
t1hr = # of time steps that equals 1 hour (3600 seconds / 4 seconds = 900)
Page 24
24
𝑬𝒄,𝒌𝑾𝒉 = ∑ |𝑷𝒌𝑾(𝒊)| ∗ 𝟏
𝒕𝟏𝒉𝒓, 𝒊𝒇 𝑷𝒌𝑾 < 𝟎𝑿
𝒊=𝟏 Equation 5
Parameters:
Ec,kWh = energy consumed during charge
X = number of time steps in frequency regulation test
PkW(i) = power consumed by energy storage at time i, (kW)
t1hr = # of time steps that equals 1 hour (3600 seconds / 4 seconds = 900)
As part of the frequency regulation, the energy storage ability to respond to the reference signal
during the 24-hour period is calculated using the squared sum of the residual between the signal
command and energy storage output shown in Equation 6. Also calculated is the magnitude
error between the reference signal and energy storage output in terms of power, discharge energy
in a cycle and the charge energy in a cycle shown in Equations 7 and 8. To also determine how
often the system is tracking the reference signal, the total time the system cannot follow the
reference signal and percentage tracked is reported shown in Equation 9.
𝑷𝑬𝑹𝑹 = ∑ (𝑷𝑺𝑰𝑮𝑵𝑨𝑳(𝒊) − 𝑷𝑬𝑺𝑺(𝒊))𝟐𝑿𝒊=𝟏 Equation 6
Parameters:
PERR = sum of the square of errors between the balancing signal and the power delivered or
absorbed by the ESS
X = number of time steps in frequency regulation test
PSIGNAL(i) = power command from balancing signal (kW)
PESS(i) = power delivered or absorbed by the energy storage (kW)
𝑷𝑬𝑹𝑹,𝑴𝑨𝑮 = ∑ |𝑷𝑺𝑰𝑮𝑵𝑨𝑳(𝒊) − 𝑷𝑬𝑺𝑺(𝒊)|𝑿𝒊=𝟏 Equation 7
Parameters:
PERR,MAG = sum of the absolute magnitude of the difference between the balancing signal and the
power delivered or absorbed by the ESS (kW)
X = number of time steps in frequency regulation test
PSIGNAL(i) = power command from balancing signal (kW)
PESS(i) = power delivered or absorbed by the energy storage (kW)
𝑬𝑬𝑹𝑹,𝑴𝑨𝑮 = ∑ |𝑬𝑺𝑰𝑮𝑵𝑨𝑳(𝒊) − 𝑬𝑬𝑺𝑺(𝒊)|𝑿𝒊=𝟏 Equation 8
Parameters:
EERR,MAG = sum of the absolute magnitude of the difference between the balancing signal and the
power delivered or absorbed by the ESS (kWh)
X = number of time steps in frequency regulation test
ESIGNAL(i) = balance signal energy for a half cycle, with half cycle being the signal of the same
sign (above or below the x-asis)
EESS(i) = energy delivered or absorbed by the energy storage (kWh) for each half cycle
𝑺𝒊𝒈𝑻𝑹𝑨𝑪𝑲 = (𝟏 −𝒕𝑶𝑭𝑭
𝟐𝟒) ∗ 𝟏𝟎𝟎 Equation 9
Page 25
25
𝑻𝒓𝒂𝒄𝒌 = |𝑷𝑺𝑰𝑮𝑵𝑨𝑳(𝒊)−𝑷𝑬𝑺𝑺(𝒊)
𝑷𝑺𝑰𝑮𝑵𝑨𝑳(𝒊)| ∗
𝟏𝟎𝟎∗𝑷𝑬𝑺𝑺(𝒊)
𝑷𝟏𝟎𝟎% Equation 10
𝒕𝑶𝑭𝑭 = {𝟎, 𝒊𝒇 𝑻𝒓𝒂𝒄𝒌 ≤ 𝟐%
∑ 𝒕(𝒊), 𝒐𝒕𝒉𝒆𝒓𝒘𝒊𝒔𝒆𝑿𝒊=𝟏
Equation 11
Parameters:
SigTRACK = portion of the balance signal that was tracked by the energy storage system (%)
Toff(i) = total time the system cannot follow the signal (hours)
Track = error percent between the balance signal and the power delivered or absorbed
normalized to the max power rating of the energy storage system
PSIGNAL(i) = power command from balancing signal (kW)
PESS(i) = power delivered or absorbed by the energy storage (kW)
P100% = rated max power of the system (kW)
t(i) = time when Track is greater than 2% error in terms of hours
Table 5 - Frequency Regulation Test Results
Discharge Energy (kWh)
Charge Energy (kWh)
Recharge Energy to charge back to SOC (kWh)
Round Trip Efficiency (%)
3,860.02 -4,650.92 -1,977.23 58.24
TOFF (hours)
PERR PERR,MAG
(kW)
EERR,MAG
(kWh)
SigTRACK(%)
0.24 1,510,453,673 881,394.02 184.00 99.01
Figure 15 - Frequency Regulation and Recharge
-1500
-1000
-500
0
500
1000
1500
9:3
3
10
:41
11
:50
12
:58
14
:07
15
:15
16
:24
17
:33
18
:41
19
:50
20
:58
22
:07
23
:16
0:2
4
1:3
3
2:4
1
3:5
0
4:5
8
6:0
7
7:1
6
8:2
4
9:3
3
10
:41
11
:50
Po
we
r (k
W)
Frequency Regulation Test and Recharge
Power Output
Page 26
26
Figure 16 - Frequency Regulation Signal vs. Uni.SystemTM Power Output
4.3. Peak Shaving Test Procedure 1. Charge Uni.SystemTM to 100% SOC
2. Program and start the 520 kW duty cycle shown in Figure 12 using the site controller
3. Record Start time of test
4. After 520 kW duty cycle, recharge the Uni.SystemTM back to 100% SOC to provide data for a
roundtrip efficiency calculation
5. Record time and verify that data has been captured by the OSI PI data historian
6. Program and start the 640 kW duty cycle shown in Figure 13 using the site controller
7. Record Start time of test
8. After 640 kW duty cycle, recharge the Uni.SystemTM back to 100% SOC to provide data for a
roundtrip efficiency calculation
9. Record time and verify that data has been captured by the OSI PI data historian
10. Program and start the 1000 kW duty cycle shown in Figure 14 using the site controller
11. Record Start time of test
12. After 640 kW duty cycle, recharge the Uni.SystemTM back to 100% SOC to provide data for a
roundtrip efficiency calculation
13. Record time and verify that data has been captured by the OSI PI data historian
Page 27
27
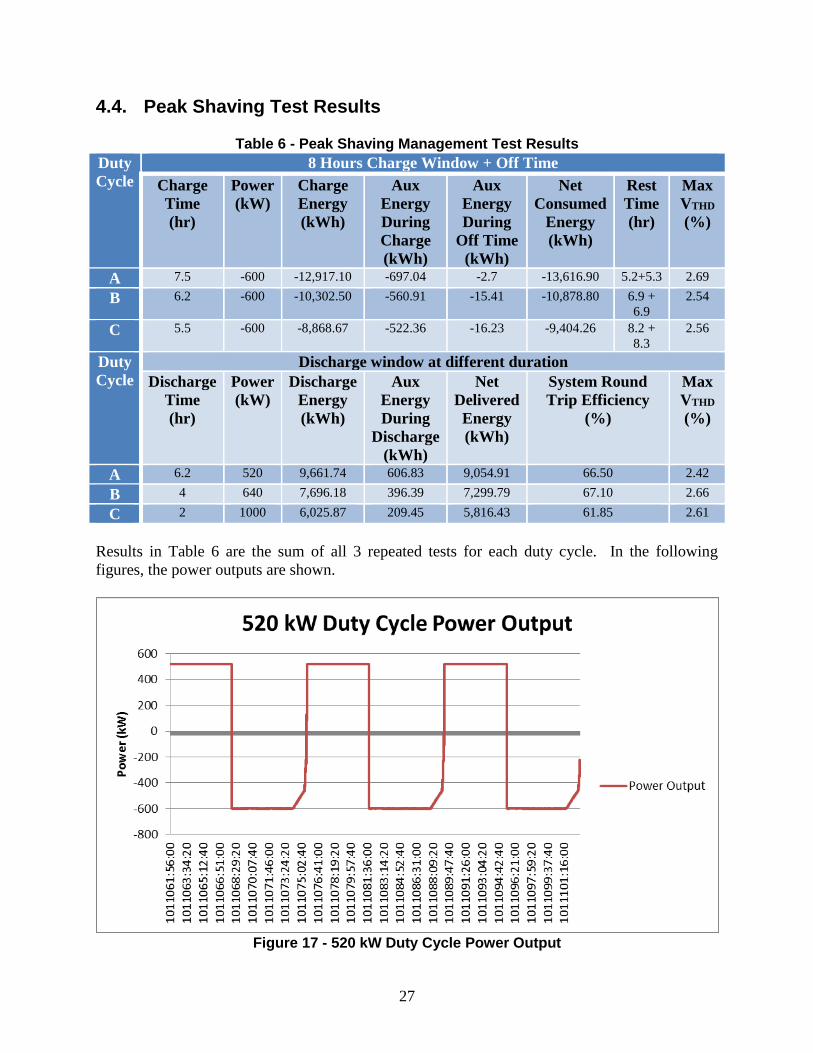
4.4. Peak Shaving Test Results
Table 6 - Peak Shaving Management Test Results
Duty
Cycle
8 Hours Charge Window + Off Time
Charge
Time
(hr)
Power
(kW)
Charge
Energy
(kWh)
Aux
Energy
During
Charge
(kWh)
Aux
Energy
During
Off Time
(kWh)
Net
Consumed
Energy
(kWh)
Rest
Time
(hr)
Max
VTHD
(%)
A 7.5 -600 -12,917.10 -697.04 -2.7 -13,616.90 5.2+5.3 2.69
B 6.2 -600 -10,302.50 -560.91 -15.41 -10,878.80 6.9 +
6.9
2.54
C 5.5 -600 -8,868.67 -522.36 -16.23 -9,404.26 8.2 +
8.3
2.56
Duty
Cycle
Discharge window at different duration
Discharge
Time
(hr)
Power
(kW)
Discharge
Energy
(kWh)
Aux
Energy
During
Discharge
(kWh)
Net
Delivered
Energy
(kWh)
System Round
Trip Efficiency
(%)
Max
VTHD
(%)
A 6.2 520 9,661.74 606.83 9,054.91 66.50 2.42
B 4 640 7,696.18 396.39 7,299.79 67.10 2.66
C 2 1000 6,025.87 209.45 5,816.43 61.85 2.61
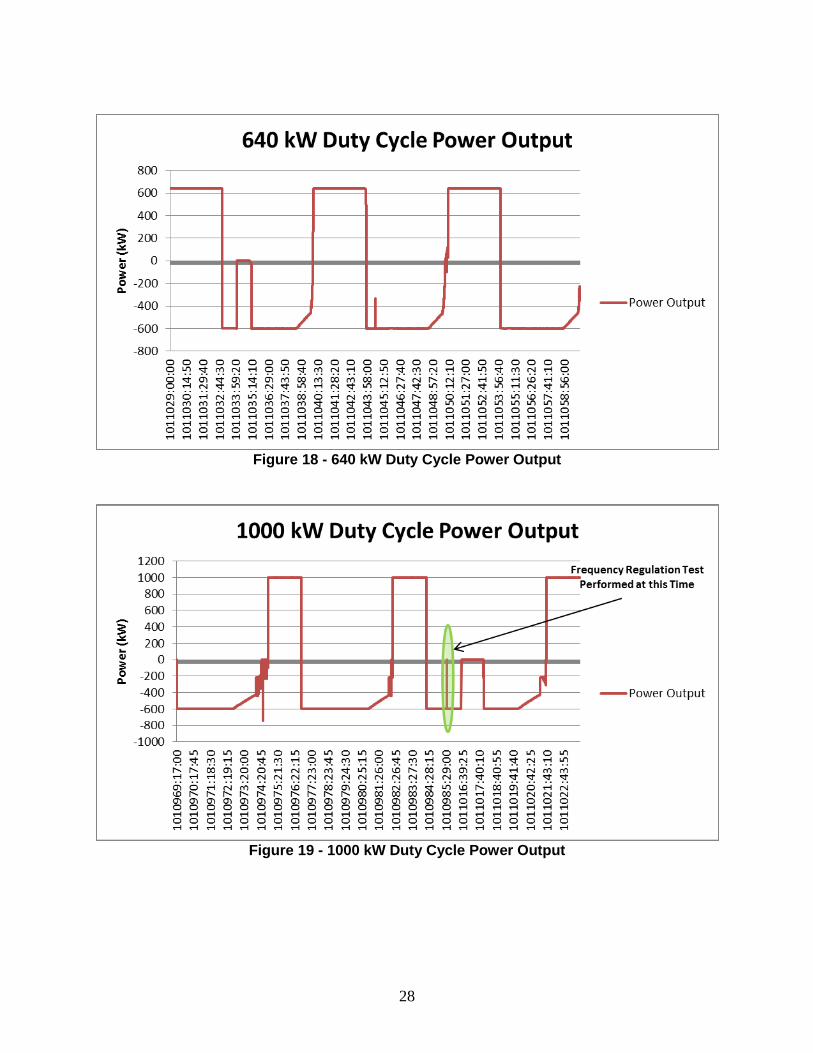
Results in Table 6 are the sum of all 3 repeated tests for each duty cycle. In the following
figures, the power outputs are shown.
Figure 17 - 520 kW Duty Cycle Power Output
Page 28
28
Figure 18 - 640 kW Duty Cycle Power Output
Figure 19 - 1000 kW Duty Cycle Power Output
Page 29
29
5. THD TESTING
THD testing was not a requirement of the witness testing but was added since testing was ahead
of schedule and a power quality meter was available. In order to capture the harmonic output of
the Uni.SystemTM, an additional test was performed in which different charge and discharge rates
were performed. The power ratings for the charge cycles were 800 kW, 600 kW and 300kW.
Power ratings for the discharge cycles were 1200 kW, 900 kW, 600 kW and 300 kW. These
ratings were selected based on the maximum charge and discharge limits as well as performing
at a low power output which is 25% of nameplate rating. Since there was only one Hioki 9624-
50 meter available, only one string was measured.
In order to calculate the Total Demand Distortion, the short circuit current (Isc) is needed as
stated in IEEE 519-1992 table shown in Figure 20. Since the Isc for the Uni.SystemTM has not
been determined by UET at this time, a value of 2 p.u. of the rated PCS current will be used.
The PCS rated current is 1200A so the Isc is calculated to be 2400A. If the Isc is calculated to be
higher than 2 p.u. of the rated current, the allowable TDD will increase.
Figure 20 - IEEE 519-1992 Harmonic Current Limits [1]
The lowest power output during the test is 25% of the rated power of one string which is 150kW.
Voltage for the PCS is 283 Vac and calculating the current for 150 kW using the PCS voltage is
306 A. The largest Isc/IL is 7.84 which the first row in the IEEE 519-1992 Harmonic Current
Limits will be used which the TDD needs to be less than 5%. Also in accordance to the IEEE
519-1992 standard, the total voltage harmonic distortion has to be less than or equal to 5%.
Page 30
30
5.1. THD Testing Procedure 1. Discharge or charge Uni.SystemTM to a certain SOC determined by UET which allows the system to
operate both directions
2. Using the Site Controller, set the power command to -66.67%
3. Record Start time of test
4. After at least 5 minutes with the Uni.SystemTM charging at -66.67%, change the power command in
the Site Controller to -50%
5. After at least 5 minutes with the Uni.SystemTM charging at -50%, change the power command in the
Site Controller to -25%
6. After at least 5 minutes with the Uni.SystemTM charging at -25%, change the power command in the
Site Controller to 100% placing the Uni.SystemTM into discharge mode
7. After at least 5 minutes with the Uni.SystemTM discharging at 100%, change the power command in
the Site Controller to 75%
8. After at least 5 minutes with the Uni.SystemTM discharging at 75%, change the power command in
the Site Controller to 50%
9. After at least 5 minutes with the Uni.SystemTM discharging at 50%, change the power command in
the Site Controller to 25%
10. Record time and verify that data has been captured by the Hioki 9624-50
5.2. THD Testing Results
As seen in Table 7, all the harmonics created by the Uni.SystemTM are well below the IEEE 519-
1992 limits. Figure 21, Figure 22 and Figure 23 show the power output, total voltage harmonic
distortion and total current demand distortion for the entire THD test.
Table 7 - Result Matrix for THD Testing for String 2
% of Max Power (%)
Average Power Output (kW)
Maximum VTHD (%)
Maximum ITDD (%)
-66.67 -394 2.48 3.29
-50 -302 2.41 3.16
-25 -151 2.4 3.18
100 593 2.68 3.33
75 447 2.69 2.94
50 298 2.69 2.94
25 149 2.53 3.30
Page 31
31
Figure 21 - Power Output during THD Testing for One Uni.SystemTM String
Figure 22 - Voltage Total Harmonic Distortion for THD Testing
Page 32
32
Figure 23 - Total Current Demand Distortion for THD Testing
Page 33
33
6. CONCLUSION
The Uni.SystemTM installation at Pullman, WA has proper personal protective equipment, safety
documentation, hazard signs, hazard mitigation and emergency response equipment for a safe
environment for personnel working around the site, which was physically verified by Sandia.
There are also alarms in place with constant monitoring of multiple sensors that allow Avista and
UET to be informed of the status of the Uni.SystemTM and any problems 24 hours, 7 days a
week. Besides the monitoring equipment, all data recording equipment including meters and
communication back to UET headquarters was verified by Sandia and is adequate to provide
accurate and sufficient data to calculate the Uni.SystemTM performance.
Sandia has verified that the Uni.SystemTM can produce up to at least 3.2 MWh which was
achieved when the 520 kW continuous power output during the cycle test was performed. Cycle
and peak shaving test performed also verified that the rated power can produce 1 MW for 2
hours, 640 kW for 4 hours and 520 kW for 6.2 hours with energy capacity still available in the
Uni.SystemTM. The 65-70% efficiency was achieved when the Uni.SystemTM was continuously
delivering up to 640 kW, but dropped to approximately 60% when the continuous power
delivered was rated at a power of 1 MW. During the frequency regulation, the efficiency was
58.24%. Since the test revealed low roundtrip efficiency during the frequency regulation test,
UET retested the frequency regulation signal with another method to increase the efficiency
number. The new method added some offset on the charge signal to get rid of the following
recharge at the end of the frequency regulation test. By doing this, UET reports that the
roundtrip efficiency increased to approximately 75%. Sandia did not verify this new method
tested during the frequency regulation test and cannot be confirmed. DC voltage range of 465
Vdc – 1000 Vdc at the PCS was not recorded in this report but was verified through data that was
collected through the OSI software.
Part of the Uni.SystemTM performance specification was that the power control modes of
dispatch and autonomous are available. Dispatch mode was verified as UET set the
Uni.SystemTM to discharge and charge at 50% rated power through the HMI and site controller
performed while Sandia was at the site. Autonomous mode was demonstrated through all the
tests since a programmed power output profile was created in Microsoft Excel and sent to the site
controller. The site controller would automatically change the power set point for the
Uni.SystemTM according to the power output profile with no human interaction.
Performance specifications that still need to be verified are the self-discharge of less than 2 % in
standby mode, response time of 50 ms and operational ambient temperature range of -40°c to
50°c. Self-discharge of less than 2% is a test that needs long durations to verify. However, the
self-discharge is limited only to the residual volume of electrolyte isolated in the stacks and no
self-discharge of energy is happening in the electrolyte remaining in the tanks. As the
Uni.SystemTM continues to provide service for Avista, the data can be collected and self-
discharge calculated. Maximum and minimum operational temperatures are typically verified
during the prototype phase and possibly the factory acceptance utilizing temperature changing
equipment such as temperature chambers. Response time test requires data collection equipment
that is twice as fast as the stated response time and multiple input channels so the power signal
and the power output can be captured. In this case, the data would need to be collected at 25 ms
Page 34
34
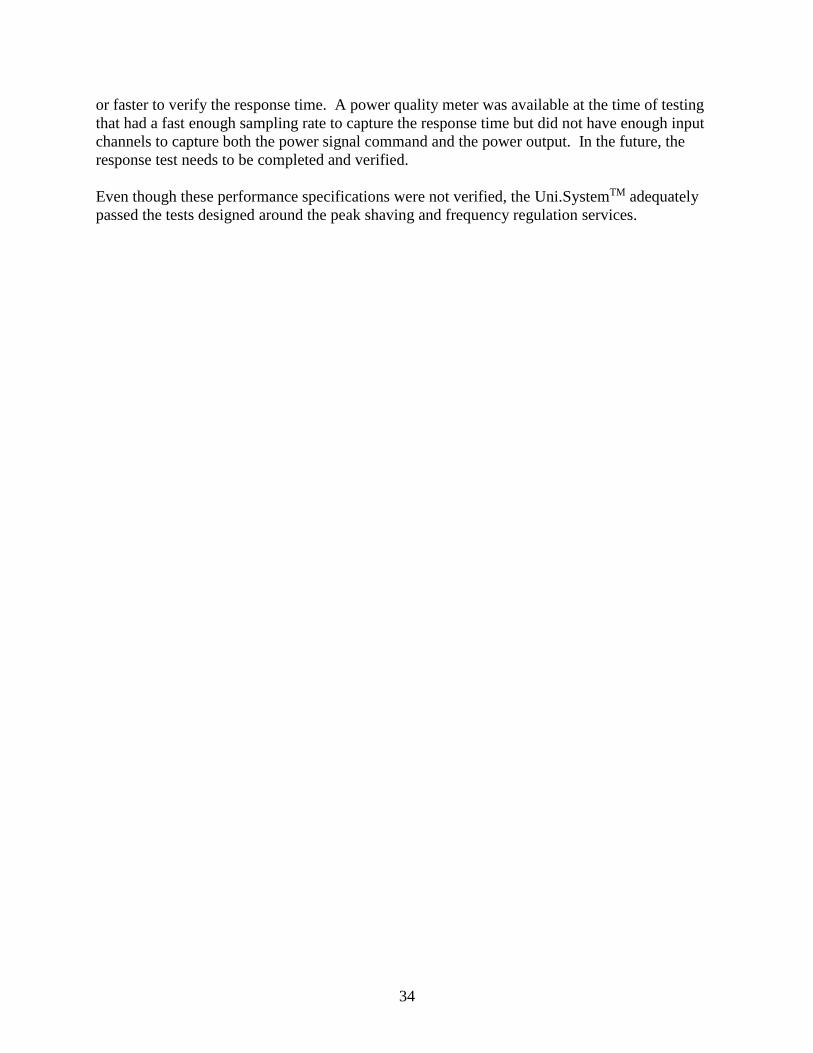
or faster to verify the response time. A power quality meter was available at the time of testing
that had a fast enough sampling rate to capture the response time but did not have enough input
channels to capture both the power signal command and the power output. In the future, the
response test needs to be completed and verified.
Even though these performance specifications were not verified, the Uni.SystemTM adequately
passed the tests designed around the peak shaving and frequency regulation services.
Page 35
35
7. REFERENCES
[1] IEEE , "IEEE Recommended Practices and Requirements for Harmonic Control in Electrical Power
Systems," Vols. ISBN 1-55937-239-7, 1993.
[2] K. Bray, D. Conover, S. Ferreira and D. Rose, "Protocol for Uniformly Measuring and Expressing the
Performance of Energy Storage Systems," Pacific Northwest National Laboratory, October 2012.
Page 36
36
[PAGE LEFT INTENTIONALLY BLANK]
Page 37
37
Distribution
1. UniEnergy Technologies, LLC
Attn: B.Kell, C.Sun, R.Winter
4333 Harbour Pointe Blvd SW
Mukilteo, WA 98275
2. MS0899 Technical Library 9536 (electronic copy)
3. MS1108 Dan Borneo 6111
4. MS1108 Dave Rosewater 6111
5. MS1108 Stanley Atcitty 6111
6. MS1188 Benjamin Schenkman 6114
7. MS1188 Alan Nanco 6114