San Francisco Bay Coastal Management Program Final Assessment and Strategy 2016 to 2020 Enhancement Cycle Photo Credit: Mark Taylor, East Bay Regional Park District Prepared pursuant to the provisions of Section 309 of the federal Coastal Zone Management Act for the Office of Coastal Management National Ocean and Atmospheric Administration U.S. Department of Commerce by: The San Francisco Bay Conservation and Development Commission 455 Golden Gate Avenue, Suite 10600 San Francisco, California 94102 July 2015
Transcript
San Francisco Bay Coastal Management Program Final Assessment and Strategy
2016 to 2020 Enhancement Cycle
Photo Credit: Mark Taylor, East Bay Regional Park District
Prepared pursuant to the provisions of Section 309
of the federal Coastal Zone Management Act for the Office of Coastal Management
National Ocean and Atmospheric Administration U.S. Department of Commerce
by:
The San Francisco Bay Conservation and Development Commission 455 Golden Gate Avenue, Suite 10600
San Francisco, California 94102
July 2015
ii
San Francisco Bay Coastal Management Program
2016-‐2020 Assessment & Strategy
Table of Contents
Section I. Introduction ............................................................................................................................. 1 Section II. Summary of Recent Section 309 Achievements ..................................................................... 3
Wetlands ...................................................................................................................................... 3 Coastal Hazards ............................................................................................................................ 4 Public Access ................................................................................................................................ 8 Marine Debris ............................................................................................................................... 9 Cumulative and Secondary Impacts ........................................................................................... 10 Special Area Management Planning ........................................................................................... 10
Section III. Assessment .......................................................................................................................... 13
A. Phase I Assessment ................................................................................................................ 13 Wetlands ............................................................................................................................ 13 Coastal Hazards .................................................................................................................. 15 Public Access ...................................................................................................................... 19 Marine Debris ..................................................................................................................... 23 Cumulative and Secondary Impacts ................................................................................... 25 Special Area Management Planning .................................................................................. 27 Ocean Resources ................................................................................................................ 29 Energy and Government Facility Siting .............................................................................. 31 Aquaculture ........................................................................................................................ 33
B. Phase II Assessment ............................................................................................................... 34 Wetlands ............................................................................................................................ 34 Coastal Hazards .................................................................................................................. 40
Section IV. Strategy ................................................................................................................................ 51
Strategy 1: Incorporate Best Available Information into Coastal Wetlands Management, Planning, and Decision-‐Making ..................................................................... 51 Strategy 2: Improve the Region’s Capacity to Understand and Address Current and Future Coastal Hazard Risks ........................................................................................... 55 Strategy 3: Evaluate and Update Special Area and Sector Plans to Incorporate Best Available Information about Climate Change, Reflect Current Status and Trends, and Address Other Emerging Issues ........................................................................ 60 5-‐Year Budget by Strategy .......................................................................................................... 65
Section V. Summary of Stakeholder and Public Comment .................................................................... 69
1
SECTION I
INTRODUCTION
Overview of the Section 309 Program. Section 309 of the Coastal Zone Management Act (CZMA), as amended in 1990 and 1996, establishes a voluntary coastal zone enhancement grant program to encourage Coastal Management Programs (CMPs) such as the San Francisco Bay Conservation and Development Commission (“BCDC” or “Commission”) to develop innovative approaches to improving the following nine enhancement areas: (1) wetlands, (2) coastal hazards, (3) public access, (4) marine debris, (5) cumulative and secondary impacts, (6) special area management planning, (7) ocean/great lakes resources, (8) energy and government facility siting, and (9) aquaculture. Under the Section 309 program, the Secretary of Commerce is authorized to make awards to states and territories to develop and submit for federal approval program changes that support attainment of one or more enhancement area objectives.
To be eligible for Section 309 funding, CMPs must successfully complete an Assessment and Strategy for review and approval by the National Oceanic and Atmospheric Administration’s (NOAA) Office for Coastal Management (OCM). The Assessment considers the extent to which problems and opportunities exist with regards to the enhancement area objectives and the effectiveness of current efforts to address those problems. The Assessment provides the factual basis for the CMP and OCM to cooperatively determine priority needs for program improvement.
The Strategy is a comprehensive, multi-‐year statement that identifies program changes and implementation activities needed to address enhancement area objectives identified as high priority in the Assessment. The Strategy is based on priority needs and information gaps identified in the Assessment and covers the 5-‐year period from fiscal year 2016 to fiscal year 2020.
Assessment and Strategy Development and Public Review Processes. This draft report is the culmination of a collaborative process to evaluate BCDC’s CMP. The status of the coastal resources, extent of problems and opportunities, and the effectiveness of existing management efforts were characterized for the nine enhancement areas. Two enhancement areas were designated as high priority: Wetlands and Coastal Hazards.
The priority needs and information gaps to address identified problems and opportunities were evaluated, and strategies that will result in programmatic changes leading to an improvement in the high priority enhancement areas were developed. BCDC staff was actively involved in the development of the draft Assessment and Strategy, providing input both individually and in collaborative team meetings.
Public review and comment are critical to the success of any CMP, and BCDC is committed to incorporating the public’s ideas and opinions to the greatest extent feasible into the Assessment and Strategy. A public review and comment process was held concurrent with the OCM review of the draft report, the draft document was made available in hard copy at the BCDC office and digitally on the BCDC website, and the Commission held a public hearing on the Assessment and Strategy on May 21, 2015.
2
BCDC’s Coastal Management Program. Through the McAteer-‐Petris Act of 1965, BCDC was granted authority by the state to plan and regulate activities and development in and around the Bay through policies adopted in the San Francisco Bay Plan (Bay Plan). The Suisun Marsh Preservation Act of 1977 expanded BCDC’s permit jurisdiction over the 85,000-‐acre Suisun Marsh, the largest remaining wetland in California. Together, these two statutes formed the basis of the management program for the San Francisco Bay Segment of the California Coastal Zone, which was approved by the U.S. Secretary of Commerce on February 16, 1977.
The Commission’s enabling legislation focuses on limiting fill, increasing public access to and along the Bay, and assuring that sufficient land is available for high priority water-‐dependent uses. BCDC administers a regulatory program based on the standards of the Bay Plan, in which permits are required for Bay filling and dredging and for development along a shoreline band extending 100 feet inland from the Bay. The Commission’s Bay jurisdiction includes specified waterways, managed wetlands, salt ponds, and all parts of the Bay that are subject to tidal action, including sloughs, marshlands, tidelands, and submerged lands.
The Bay Plan has dual mandates to (1) protect the Bay as a great natural resource for the benefit of present and future generations; and (2) develop the Bay and its shoreline to their highest potential with a minimum of fill. To achieve these mandates, the Bay Plan includes policies on fish and wildlife, water pollution, water surface area and volume, marshes and mudflats, fresh water inflow, dredging, water-‐related industries, ports, airports, recreation, public access, salt ponds, transportation, project appearance and design, scenic views, and climate change.
The Suisun Marsh Protection Plan (Marsh Plan) is another component of BCDC’s management program. The Marsh Plan is a more specific application of the regional policies of the Bay Plan and supplements such policies to accommodate the unique characteristics of the Suisun Marsh. The Marsh Plan’s objectives are to preserve and enhance the quality and diversity of the area’s 85,000 acres of wetland habitat, and to ensure that uses of adjacent upland areas are compatible with marsh protection. The Commission maintains permit authority over development in the primary management area of the Suisun Marsh, which includes 89,000 acres of tidal marsh, managed wetlands, adjacent grasslands, and waterways. The Marsh Plan requires local governments to prepare and have certified by BCDC local protection plans for a secondary management area of the Suisun Marsh, which includes approximately 22,500 acres of significant buffer land (i.e., uplands surrounding the wetlands). The Commission retains appellate authority over local government decisions within the secondary management area.
In addition to the permit program, BCDC, with the support and cooperation of local governments, develops special area plans containing enforceable policies and use designations. Special area plans are adopted by the Commission as amendments to the Bay Plan, and by local governments as amendments to their general plans and zoning ordinances.
The 27-‐member Commission is composed of one member from each of the nine Bay Area county boards of supervisors; four elected officials representing area municipalities appointed by the Association of Bay Area Governments; five state representatives from the Business and Transportation Agency, Department of Finance, Resources Agency, State Lands Commission, and the San Francisco Regional Water Quality Control Board; two federal representatives of the U.S. Army Corps of Engineers and the U.S. Environmental Protection Agency; and seven members appointed from the public sector. The Commission holds regular meetings and is served by an Executive Director and a staff of approximately 40.
3
SECTION II
SUMMARY OF RECENT SECTION 309 ACHIEVEMENTS
Below is a summary of the Commission’s program changes and major achievements since 2010. The changes and achievements are classified by enhancement area and include efforts identified as program enhancement strategies in the previous assessment (San Francisco Bay Coastal Management Program Assessment and Strategy, November 2010) and other major achievements that were not specifically identified in the previous assessment but help further the program enhancement strategies.
Wetlands
Revise Bayland Ecosystem Habitat Goals. This project was identified in the previous Strategy and was partially funded through Section 309. BCDC participated in a three-‐year effort to update the Bayland Ecosystem Habitat Goals, serving as a member of the steering committee and on two technical working groups. The final update report, which will be released in 2015, will further the original purpose of the Goals Project -‐ to elaborate a long-‐term vision for a healthy and sustainable Baylands ecosystem. Specifically, the update identifies key scientific findings that support recommended actions to sustain diverse and healthy communities of wild plants and animals in the Baylands in the face of climate change and other future changes. The Goals Update provides a biological basis that can help guide a regional planning process for public and private interests seeking to preserve, protect, enhance, and restore the ecological integrity of the Baylands. BCDC’s participation in the update helped to ensure that the information gathered was robust, leveraged BCDC staff knowledge and project outcomes – for example, from the Corte Madera Creek Watershed project – and reflected the agency’s goals and coastal management policy objectives to the greatest extent possible. It is anticipated that the update will be used as the foundation of a program change that will be submitted to NOAA within the next five years (see Strategy section).
Accomplishments
• Worked with numerous partners to develop the Bayland Ecosystem Habitat Goals Update, including the California Department of Fish and Wildlife, SF Bay Regional Water Quality Control Board, US Fish and Wildlife Service, National Marine Fisheries Service, California Coastal Conservancy, California Department of Water Resources, US Environmental Protection Agency, San Francisco Estuary Project, and California Resources Agency, among others. This collaborative, science-‐based effort helped to open channels of communication, allowing for active discussion and information exchange about baylands sustainability, and will serve as a foundation for future coordination and partnership among the agencies and organizations that participated.
• BCDC Chief Planner participated in the Update as a member of the Steering Committee. Additionally, members of the BCDC Planning and Sediment Management units worked collaboratively with other scientists and managers to develop and review the Science Foundation Chapters. BCDC staff’s active participation in the development and review of this regionally critical Update helped to ensure that best available science-‐based information was both incorporated into the Update and translated appropriately into potential management actions.
4
Corte Madera Project. In May 2013, BCDC published the Innovative Wetland Adaptation Techniques in Lower Corte Madera Creek Watershed project, a pioneering effort led by BCDC that examines the resilience of San Francisco Bay tidal marshes and intertidal mudflats to accelerating sea level rise, and considers how the wave attenuation and other ecosystem benefits they provide can be preserved. This collaborative project was conceived to reduce the significant gap in understanding the roles Baylands play as the first line of defense against coastal flooding, and how those roles may change in the future. Results from this project have been applied in the update to the Bayland Ecosystem Habitat Goals (discussed above), the Adapting to Rising Tides Hayward Shoreline Resilience Study, and in a number of partner efforts around the Bay including an EPA water quality funded pilot project to test the ecotone slope (upland transition zone) concept. The Corte Madera project was supported with funding from the San Francisco Estuary Partnership (SFEP) through a Resilient Watersheds for a Changing Climate grant of the San Francisco Bay Water Quality Improvement Fund from the U.S. Environmental Protection Agency, and by the generous contributions of research partners including the U.S. Geological Survey, United Nations Educational, Scientific and Cultural Organization -‐ International Institute for Hydraulic and Environmental Engineering (UNESCO-‐IHE), University of San Francisco, and Marin County.
Accomplishments
• Conceived, led, and obtained funding for the project.
• Led a diverse team of researchers from both the public and private sector, including project team members from the United States Geological Survey (USGS), University of San Francisco, UNESCO-‐IHE, Sea Engineering Inc., and Environmental Science Associates (ESA) in order to describe the flood control benefits that the tidal wetland system at Corte Madera, Marin County provides; assess the sensitivity of the tidal wetlands to sea level rise in order to determine vulnerability of the system and the services it provides; and developed alternative management measures for inclusion in an adaptation strategy that will improve the resiliency of the tidal wetlands to sea level rise in a manner that enhances and retains the ecosystem services of the system.
• Collaborated with project team to synthesize and translate findings from the individual science reports into a report that described the findings and management recommendations as well as other communication materials (4-‐pager, webpage, presentation) that have been shared with a wide audience of Bay Area decision makers. The project has been presented to local flood boards, conservation groups, regional flood managers, and many others in the region. The individual science reports and the management report have been foundational in stimulating a number of pilot feasibility studies to test the application of the nature-‐based management solutions identified. Information about the project and communication materials are available at: http://www.bcdc.ca.gov/planning/climate_change/WetlandAdapt.shtml
Coastal Hazards
Climate Change Strategy. In the 2011 Assessment and Strategy, BCDC identified a comprehensive strategy to begin the process of developing a regional response to climate change. The strategy has five core programmatic areas: research, communication, capacity, governance and policy. Together, these core programs have improved the region’s ability to understand and proactively respond to climate change, and in particular sea level rise. Many of the goals and objectives identified for the core program were intentionally cross-‐cutting, and successes in one area have advanced others. The achievements identified below represent components of this comprehensive climate change strategy, and address one or more of the five core programmatic areas.
5
Revision of the San Francisco Bay Plan to Address Climate Change. This project supports objectives identified in the previous Climate Change Strategy, above, and was partially funded through Section 309. In 2011, BCDC unanimously approved an amendment to the San Francisco Bay Plan to address climate change, as a major component of ongoing work to keep the Bay Plan up-‐to-‐date and based on the best scientific information. The revisions to the Bay Plan, which was submitted to NOAA as a program change in 2012, were based on a staff report released in April 2009 entitled Living With a Rising Bay: Vulnerability and Adaptation in San Francisco Bay and on the Shoreline. BCDC began developing revised Bay Plan climate change policies in 2008 and from 2009 to 2011 held 35 public hearings on the proposed policies. The final findings and policies have been incorporated into the Bay Plan, were submitted and accepted by NOAA as a coastal management program change, and are now in effect.
Accomplishments
• Developed and adopted an amendment to update the 22-‐year-‐old sea level rise findings and policies in the San Francisco Bay Plan and to add a new section dealing more broadly with climate change and adapting to sea level rise. The amendment policies address multiple aspects of climate change related to BCDC’s jurisdiction, including revising outdated language on sea level rise to allow protection from flooding and encourage innovative means of dealing with flood danger, encouraging projects that have regional benefits, maintaining existing levels of protection for the Bay and other valuable natural resources, and protecting and expanding tidal wetlands due to their vital role in reducing greenhouse gases and providing flood protection. The Commission has also committed to work with diverse partners to develop a comprehensive regional strategy that deals with all the impacts of climate change.
• BCDC’s staff revised and refined the amendments multiple times to respond to the ideas advanced by stakeholders, local governments and the general public. In the end, the business community, developers, labor, environmental organizations and local government supported the amended policies.
Adapting to Rising Tides (ART) Program. This program supports objectives identified in the previous Climate Change Strategy, above, and was partially funded through Section 309. In 2010, BCDC launched a collaborative planning effort to identify how sea level rise and storm event impacts will affect Bay Area communities, infrastructure, ecosystems and economy. Since then, the ART Program has led and supported multi-‐sector, cross-‐jurisdictional projects that built local and regional capacity to plan for and implement adaptation responses. These efforts enabled the ART Program to test and refine adaptation planning methods to integrate sustainability and transparent decision-‐making from start to finish, and foster robust collaborations that lead to action on adaptation. ART program team members continue to utilize and share tools and expertise developed through these projects. (More information online at: www.adaptingtorisingtides.org).
Accomplishments
• Completed a pilot adaptation planning project for a portion of the Alameda County shoreline in close collaboration with city, county, regional, state and federal stakeholders and partners. Characterized and developed adaptation responses to sea level rise and storm impacts to assets in twelve categories: airport, community land use, contaminated lands, energy, infrastructure, pipelines and telecommunications, ground transportation, hazardous materials, nonstructural shorelines/natural areas, parks and recreation, seaport, stormwater, structural shorelines and wastewater.
6
• Developed, tested and refined adaptation planning methodologies and approaches as well as communication and decision-‐making strategies through a collaborative process, working with NOAA Office for Coastal Management, regional partners, working group members, and other key stakeholders. Developed and shared findings, tools and expertise with a wide range of local, regional, state and federal agencies and organizations in numerous presentations, workshops and one-‐on-‐one consultations, as well as print materials available at a comprehensive project website: www.adaptingtorisingtides.org.
• Applied modified adaptation planning methods, tools and expertise to lead a collaborative planning project along the Hayward shoreline to improve resilience of bike trails, wetland habitat, utility infrastructure and commercial/industrial land uses to sea level rise and storm impacts. Leading similar, collaborative, multi-‐sector planning efforts in Oakland/Alameda, Contra Costa County and the City of San Rafael.
• Expanded partnerships with NOAA, US EPA, FEMA, FHWA, Metropolitan Transportation Commission (MTC), Association of Bay Area Governments (ABAG), the California Coastal Conservancy, Bay Area Rapid Transit (BART), and the California Department of Transportation (Caltrans) to advance local and regional planning for rising sea level. Completed and ongoing projects include:
a. Analysis of areas in the Bay region where housing and at-‐risk communities may be vulnerable to sea level rise and earthquakes, and development of recommended strategies that incorporate best practices of hazard mitigation, climate adaptation, and smart growth strategies particularly.
b. Assessment of transportation vulnerabilities and adaptation strategies for focus areas within Alameda County, including the Bay Bridge peninsula, the Oakland Coliseum area, and the Highway 92 corridor in Hayward.
c. Support for a regional resilient shorelines partnership with ABAG and the Coastal Conservancy to identify how shoreline flood risk hazards will affect the future of Bay Area shoreline communities, ecosystems and economy, and develop local and regional approaches to reduce and manage these risks and improve resilience.
• Provided staff support and guidance on adaptation planning methods for ongoing local efforts: City of Benicia Adaptation Plan development; Southern Marin County Sea Level Rise Planning; and San Mateo County sea level rise vulnerability assessment.
Outreach, Education, and Capacity Building. These activities supports objectives identified in the previous Climate Change Strategy, above. Efforts are ongoing to increase regional collaboration, improve local capacity for adaptation, and provide effective public education around climate change and sea level rise.
Accomplishments
• Provided training for local governments and organizations on available climate change related planning tools, in partnership with the NOAA Office for Coastal Management, the San Francisco Bay National Estuarine Research Reserve and NatureServe/Ecosystem-‐Based Management Tools Network, with assistance from the Association of Bay Area Governments, the Pacific Institute, ICLEI, and the California Energy Commission PIER Program.
7
• In partnership with the Gulf of the Farallones National Marine Sanctuary, PRBO Conservation Science, the Bay Area Ecosystems Climate Change Consortium and the U.S. Geological Survey, BCDC hosted a symposium entitled Planning for the Bay of the Future: Resources for Coastal Climate Change Adaptation, which provided local governments and organizations information on available climate change related planning tools. Symposium sponsors included the NOAA Office of Ocean and Coastal Resource Management and the San Francisco Bay National Estuarine Research Reserve.
• Continued to participate in multiple important partnerships that leverage our capacity for addressing climate change:
a. BCDC helped write and implement the California Natural Resource Agency’s ocean and coastal resources component of the California Climate Adaptation Strategy Safeguarding California;
b. BCDC spearheaded the formation of the Regional Shoreline Partnership with the California Coastal Conservancy and the Association of Bay Area Governments to coordinate and collaborate on resilience work each agency has underway, and prepare a regional flood management capacity assessment;
c. The Commission has an active partnership with the U.S. Geological Survey, which uses funding provided by the U.S. Army Corps of Engineers to study sediment transport in the Bay, because an adequate supply of sediment is essential for wetlands to adapt to sea level rise;
d. BCDC continues to work with the San Francisco Estuary Institute to study the projected migration of head of tide on tributaries to San Francisco Bay as sea level rises to develop protocols for identifying the head of tide zone and methods for assessing impacts of its migration; and
e. BCDC serves as a voting member of the Bay Area Regional Collaborative (formerly the Joint Policy Committee), which is coordinating efforts of the four Bay Area regional agencies that have responsibility for air quality, transportation and land use planning and Bay management in developing a regional climate change strategy. BCDC is working voluntarily with the other agencies to develop and implement the region’s first Sustainable Communities Strategy (SCS), Plan Bay Area pursuant to S.B. 375, and to prepare a regional sea level rise strategy for inclusion into the second SCS.
San Francisco Bay Area Sentinel Site Cooperative. In 2012 the San Francisco Bay Area was selected as one of NOAA’s five Sentinel Site Cooperatives. Working with staff from NOAA’s Office for Coastal Management, the San Francisco Bay National Estuarine Research Reserve and the Gulf of the Farallones National Marine Sanctuary, BCDC helped develop an Implementation Plan to guide the cooperative’s work. The goal of the Cooperative is to provide information to San Francisco Bay Area communities and resource managers and planners who need to address challenges such as storm flooding, local sea level rise, degraded water quality, and wetland loss. The Cooperative is helping the region address management goals and improve resilience of coastal communities by providing: tools to visualize potential impacts from sea level rise, including inundation, flood frequency, marsh impacts, and socioeconomics; supporting socioeconomic vulnerability analysis that can be used as a model for other regions; creating adaptation plans for a Bay Area community that are transferable to other communities in and around the Bay region, and for protected area coastal habitats; and developing and delivering timely, practical workshops on climate change topics to planners, managers and regulators of coastal area resources.
8
Accomplishments
• Participated in a national Sentinel Site workshop and developed an Implementation Plan that is being used by the Cooperative to advance the vision of a resilient Bay Area.
• Supported a social network analysis conducted by the Sentinel Site Coordination Committee to lay a foundation for assessing the success of the Cooperative in developing non-‐traditional partnerships and strengthening existing collaborations.
• Participated in a series of workshops and trainings developed by the Cooperative partners to advance one of the key objectives identified in the implementation plan: advancing the region’s understanding of sea level rise modeling and mapping. (More information is available at: http://coastaladaptation.org/liftingthefog/)
• Helped develop recruitment material and a statement of work for a Sea Grant Fellow to assist the Cooperative in advancing the goals and objectives of the Implementation Plan. The Fellow will help communicate and grow the Cooperative over the next two years, advancing the goal of connecting NOAA to local decision makers, and locals to NOAA resources.
Head of Tide Project. BCDC is developing a guidance document to assist Bay Area regional planners, flood managers, and local governments in understanding the vulnerabilities flood control channels face due to sea level rise, the consequences that may occur, and the responses that can be taken to improve the resilience of areas at risk of flooding. In the Bay Area, the potential for new or prolonged flooding as sea level rises will not be confined to the shoreline. Sea level rise will also affect every tidal creek and flood control channel that drains into the Bay, causing water levels in these channels to rise and the tide to push further (‘migrate’) upstream. Since these channels are intended to discharge rainfall runoff to prevent flooding of adjacent areas, this increasing zone of tidal influence will challenge flood management assets to function as intended.
Accomplishments
• Working on developing a guidance document to assist flood managers and other coastal decision makers in applying the Adapting to Rising Tides (ART) approach to assessing vulnerabilities and consequences, and developing adaptation responses, to flood control channels, and tidal creeks and streams. The draft guidance document is currently in review. Once finalized it will be available on the ART website (www.adaptingtorisingtides.org) and will be shared broadly with the Bay Area flood management community.
• Worked with the San Francisco Estuary Institute’s (SFEI’s) protocol for locating the current zone of tidal influence and for predicting where this zone may migrate to as sea level rises. SFEI led a technical advisory committee to obtain feedback on the protocol while BCDC staff convened small local working groups to provide feedback on the protocol and validate the outcomes of applying it to local channels and streams they managed. (More information and the project report are available at: http://www.sfei.org/projects/head-‐tide)
Public Access
San Francisco Bay Area Water Trail. Since 2011, BCDC has worked to implement the San Francisco Bay Area Water Trail Enhanced Water Trail Plan in collaboration with the State Coastal Conservancy and other partners. The Plan builds on the draft Water Trail Plan developed by BCDC in 2007. The Enhanced Water Trail Plan aims to create a network of access points for non-‐motorized boats and beachable sail
9
craft around San Francisco Bay. Nine sites have been conditionally designated as part of the Water Trail since 2011. BCDC has been engaged in this effort as part of the Project Management Team for the Water Trail project, along with the State Coastal Conservancy, Association of Bay Area Governments, and the Division of Boating and Waterways, California Department of Parks and Recreation.
Accomplishments
• As a member of the Project Management Team, BCDC staff has participated in regular discussions about the Water Trail and attended quarterly implementation meetings.
• BCDC staff participated on the Accessibility Sub-‐Committee, and provided input towards the development of the San Francisco Bay Area Water Trail Accessibility Plan (January 2015), a guidance document focused on improving the accessibility of launching and landing sites for persons with disabilities using non-‐motorized small boats.
• BCDC staff provided input and participated in the development of the Water Trail logo, website, and signage program.
• BCDC staff has pursued opportunities to include Water Trail improvements as part of public access requirements in BCDC permits where feasible.
Marine Debris
Derelict Vessel and Unauthorized Live-‐aboard Vessel Monitoring and Removal. This program was identified in the previous Strategy. Abandoned, deteriorating and unauthorized vessels adversely impact Bay resources and their removal can have significant and nearly immediate benefits to critical habitats and species. BCDC has continued ongoing efforts to promote the adoption, implementation, and enforcement of policies at the local level that result in the removal of derelict vessels. Removal of vessels improves the health of the Bay ecosystem, eliminates navigational hazards, and reduces pollution entering the Bay.
Accomplishments
• Worked with and supported the Richardson’s Bay Regional Agency (RBRA) application to the California Department of Resources Recycling and Recovery (CalRecycle) for $495,000 to supplement its abandoned vessel removal efforts in Richardson’s Bay, Marin County. On December 5, 2012, CalRecycle approved the RBRA’s application. These funds supported the removal of 133 vessels.
• Participated in quarterly “Abandoned Vessels” meetings hosted by the U.S. Coast Guard and also attended by the U.S. Army Corps of Engineers, State Lands Commission, Regional Water Quality Control Board, County Sheriff departments, local police departments, marine salvagers and non-‐governmental organizations.
• Held two Commission briefings on abandoned vessels and marine debris in San Francisco Bay, in March 2013 and February 2014.
• Assisted with an inter-‐agency, $6 million dollar cleanup process to remove abandoned vessels and marine debris in the Oakland-‐Alameda Estuary. This effort was led by the U.S. Environmental Protection Agency and CalRecycle, in coordination with a number of other partners. This process resulted in the removal of 58 vessels, 17,700 pounds of asbestos containing material, 3,270 pounds of waste paint related material, 1,700 cubic yards of sediments (California Hazardous), over 350 tons of debris, and a variety of other materials and hazardous substances.
10
Cumulative and Secondary Impacts
Bay Dredging and Sediment Management. Efforts are ongoing to understand and improve regional-‐scale management of sediment and dredged material in the Bay. BCDC has continued our partnership with the U.S. Army Corps of Engineers, U.S. Environmental Protection Agency, the San Francisco Regional Water Quality Control Board, and stakeholders, on the Long Term Management Strategy for Placement of Dredged Material in the Bay Region (LTMS) and the Dredged Material Management Office.
Accomplishments
• In June 2013, along with BCDC’s partners in the LTMS, the Commission completed the findings and final report of the LTMS Twelve Year Program Review at a well-‐attended public meeting. The Review determined that the LTMS program has led to beneficial reuse of 44% of sediment dredged in the program’s first twelve years, and the LTMS in-‐Bay disposal limits were not exceeded.
• BCDC partnered with the San Francisco Estuary Partnership, the San Francisco Estuary Institute, the San Francisco Bay Joint Venture and the Bay Area Flood Protection Agencies Association, to examine ways to improve or realign flood protection channels to efficiently transport sediment into wetlands and to the Bay shoreline, and is examining the potential regulatory hurdles that may prevent innovative projects from moving forward.
• BCDC staff developed and implemented a survey examining shoreline erosion in the Bay, targeted to local government and resource managers, and also met with representatives from five of the nine Bay Area counties. Staff anticipates surveying and meeting with the remaining county representatives in the next year. This effort will result in a report on erosional areas, maps of erosion hotspots, and a collection of management issues faced by the local community in regards to sediment.
• BCDC staff continued to work with sediment transport researchers to better understand the most recent sediment science. In particular, the group has focused on sand transport into, within and out of San Francisco Bay to the coastline of California. Staff has written and presented one briefing document on sand transport process and aggregate mining activities within the Bay that affect coastal processes. Staff has worked with a number of resource managers on this issue, and has identified the data gaps that prevent a full understanding of the sand transport system in the Bay and to the coast.
Oil Spill Management
• Expanded the Commission’s Oil Spill Prevention and Response Program by participating in the Golden Guardian Regional Earthquake Exercise, hosted by the California Office of Emergency Services, and helping develop new safe navigation practices in response to the Overseas Reymar collision with the Bay Bridge.
Special Area Management Planning
Suisun Marsh Local Protection Program. This project was identified in the previous Strategy and was partially funded through Section 309. BCDC is partnering with the Suisun Resource Conservation District (SRCD) to update the SRCD’s local protection program (LPP) component, including the individual management plans for diked wetlands in the Suisun Marsh managed as private waterfowl hunting clubs. The update will integrate the finalized Suisun Marsh Habitat Management, Preservation, and Restoration Plan (SMP), describe current scientific understanding of the values of managed wetlands, and incorporate standards to maximize habitat value and minimize adverse environmental impacts.
11
Accomplishments
• Developed a revised draft update of the Suisun Marsh Management Program, Version 2, integrating management objectives and best practices described in the SMP, as modified by the biological opinions from the USFWS and the NMFS (NOAA), in collaboration with SRCD and CDFW.
• Developed a template for updating Individual Duck Club Management Plans that incorporates elements of the 2006 Individual Ownership Adaptive Management Habitat Plan to provide detailed guidance on water and plant management practices suitable for each club, with options to accommodate adaptive management needs.
• Coordinated with the San Francisco Bay Regional Water Board on integrating best management practices (BMPs) for club draining to avoid dissolved oxygen problems, to protect fish in adjacent sloughs, and supported a grant proposal to expand this program to test additional BMPs.
• Participated on the Adaptive Management Advisory Team, convened by the Delta Stewardship Council, to review proposals for wetland restoration on clubs in the Marsh.
Revised San Francisco Waterfront Special Area Plan. This project was identified in the previous Strategy. In 2010, BCDC began a stakeholder process to examine the feasibility and possible content of a more comprehensive Special Area Plan update for the San Francisco Waterfront. The process included interviewing over 20 waterfront stakeholders in a one-‐on-‐one format, the interviews being conducted by a consultant and lasting one to two hours. The issues that were identified by the stakeholders included: conflicts between maritime uses and public access and public spaces, the cost of developing and maintaining public spaces, the challenge and opportunities presented by the historic resources and the historic district, what to do with the dilapidated piers and pier aprons, opportunities for fill removal and the commercialization and privatization of parts of the waterfront. The process was put on hold when the Port of San Francisco applied for two amendments to the San Francisco Waterfront Special Area Plan, the first one to accommodate an international cruise ship terminal on Pier 27 and the second one to allow vessel berthing as part of the 34th America’s Cup races. The process of these amendments, both of which were submitted to NOAA as a program change, allowed for carrying some of the issues and ideas raised during the interview process forward into public benefit ideas to balance the amendment requests.
Accomplishments
• Conducted a series of in-‐depth interviews with diverse stakeholders to gather information and perspectives on the existing Special Area Plan, in partnership with the Port of San Francisco. The primary issues that were identified during this process included limitations on public access, sea level rise impacts, possible changes around fill removal and historical piers, and other issues.
• Convened the San Francisco Waterfront Working Group and facilitated meetings to engage stakeholders to determine the issues, uses and concerns that mattered most to them, in partnership with the Port of San Francisco. This process included working to identify areas of common agreement around San Francisco Waterfront uses and Special Area Plan designations, as well as principles to guide future public discussions where disagreement remained. Stakeholders included neighborhood groups, business interests, environmental organizations, bicycle and pedestrian advocates, and port advisory groups, among others.
12
• Organized walking and bicycling tours of the San Francisco Waterfront with stakeholders, as well as tours of specific project sites, to increase understanding of and participation in San Francisco Waterfront planning, as well as to provide the opportunity for stakeholders to identify what is and is not working along the waterfront’s public spaces, maritime uses, transportation corridors and commercial areas.
• Gained significant public access benefits through two amendments to the San Francisco Waterfront Plan.
a. For the America’s Cup amendment, these new benefits included: fill removal; the development of access sites for water-‐oriented recreation for use both during the America’s Cup events and permanently after the close of the events; the early removal of the restaurant at Pier 2 by March 2015 after the 2013 America’s Cup events to provide new Bay views to the Bay and public access; and the early removal of Pier ½ prior to the 2013 America’s Cup events to bring Bay views closer to Embarcadero and the Promenade, improve Bay ecology and improve the public access experience. Additionally, the permits for the America’s Cup require a number of public access benefits, both long and short term.
b. For the amendment to accommodate an international cruise terminal on Pier 27, BCDC’s policies included the requirement to conduct three future public processes to: (1) determine the location for a new open water basin to replace the one eliminated by the proposed cruise ship terminal, (2) develop a process for managing historic resources along the waterfront; and (3) planning, designing and developing an implementation plan for a new public plaza and new open water basin in Fisherman’s Wharf. These policies were designed to recognize the balance between amending the San Francisco Waterfront Special Area Plan in time to allow the America’s Cup events to move forward without losing sight of the need to take a more comprehensive look at the Plan.
Revised Seaport Plan. In 2012, BCDC amended the San Francisco Bay Plan and the San Francisco Bay Area Seaport Plan. This amendment, which was submitted to NOAA as a program change, eliminated a port priority use designation at Hunters Point in San Francisco, helping to facilitate redevelopment at Hunters Point Naval Shipyard. The designation was changed because: (1) the project’s planned and City-‐approved uses within the area designated for port priority use were not consistent with the port designation; and (2) there was no longer any need to reserve this site for port priority use. The uses approved in the proposed redevelopment project, include but are not limited to a waterfront promenade, multi-‐use lawns, waterfront recreation areas, and a shoreline ecology park comprised of native grasslands, freshwater wetlands, shoreline mudflats and tidal wetlands.
Revised Suisun Marsh Protection Plan. In 2011, BCDC amended the San Francisco Bay Plan and the Suisun Marsh Protection Plan. This amendment, which was submitted to NOAA as a program change, eliminated a water-‐related industry priority use designation in the Collinsville area of Solano County. This amendment reconciled inconsistencies between the BCDC’s and Solano County’s plans. This amendment was the first step of a two-‐step process to reconcile inconsistencies between the Commission’s Bay Plan and the Marsh Plan with the 2008 Solano County General Plan. The second step of the process is underway, with Solano County working to update its component of the Suisun Marsh Local Protection Program and request Commission certification of the updated component.
13
SECTION III
ASSESSMENT
The following is an assessment of the extent to which problems and opportunities exist with regards to the enhancement area objectives, and the effectiveness of current efforts to address those problems. The assessment provides the factual basis for the CMP and OCM to cooperatively determine priority needs for program improvement. The assessment utilizes a variety of tools and data to characterize resources and management approaches; if not otherwise noted, information on trends and changes is based on BCDC staff best professional judgment.
A. PHASE I ASSESSMENT
The following high-‐level assessment is intended to quickly determine which of the nine enhancement areas is a high priority enhancement objective for the CMP that warrants a more in-‐depth assessment.
Wetlands
Objectives. Protection, restoration, or enhancement of the existing coastal wetlands base, or creation of new coastal wetlands.
Resource Characterization. This section describes the extent to which problems and opportunities exist with regard to the wetlands protection and restoration enhancement objectives.
Table 1. Bay Area Wetlands Status and Trends
Current state of wetlands in 2010 237.6 square miles
Net change in total wetlands from 1996-‐2010 from 2006-‐2010
6.2 -‐1.0
Net change in freshwater (palustrine) wetlands from 1996-‐2010 from 2006-‐2010
2.7 -‐0.3
Net change in saltwater (estuarine) wetlands from 1996-‐2010 from 2006-‐2010
-‐2.2 -‐0.6
Net change in unconsolidated shore wetlands from 1996-‐2010 from 2006-‐2010 5.7 -‐0.1
Source: NOAA Land Cover Atlas. Data is a summary of individual county data for the 9 Bay Area Counties. Net change data is reported as square miles gained or lost.
14
Table 2. How Bay Area Wetlands Are Changing
Land Cover Type
Area of Wetlands Transformed to Another Type of Land Cover between 1996-‐2010 (Square
Miles)
Area of Wetlands Transformed to Another Type of Land Cover between 2006-‐2010 (Square
Miles) Development 0.72 0.14 Agriculture 0.41 0.02 Barren Land 0.45 0.18
Water 4.44 0.63 Source: NOAA Land Cover Atlas. Summary of “Distribution of wetland losses by land cover” data for the 9 Bay Area Counties.
Additional Information on the Status of Coastal Wetlands in San Francisco Bay. Distribution of wetlands in the Bay Area varies greatly within the region. This is shown in Figure 1, below, with local data provided through EcoAtlas, a tool created and developed by the San Francisco Estuary Institute’s Aquatic Science Center. EcoAtlas data is regionally explicit and based on best available information on Bay Area wetlands. Therefore, EcoAtlas provides more granular information than the Land Cover Atlas, which is based on remotely sensed data. The current total area of wetlands in the Bay Area based on EcoAtlas is 537,374 acres, and is comprised of 376,920 acres of estuarine and marine wetlands and 160,418 acres of palustrine and riverine wetlands. Solano County has the greatest area of wetlands, with approximately 23% of the total wetlands in the Bay – more than Santa Clara, San Francisco, and Napa Counties combined.
Figure 1. Status of Bay Area Wetlands by County
Source: California Wetlands Monitoring Workgroup (CWMW). EcoAtlas. Accessed 12/22/14. http://www.ecoatlas.org.
0 50,000 100,000 150,000
Sonoma Solano
Santa Clara San Mateo
San Francisco Napa Marin
Contra Costa Alameda
Bay Area Wetlands
Total area of wetlands (acres)
15
Management Characterization:
Table 3. Changes in Wetlands Management Since the Previous Assessment
Management Category Significant Changes Since Last Assessment
(Y or N)
Statutes, regulations, policies, or case law interpreting these No
Wetlands programs (e.g., regulatory, mitigation, restoration, acquisition) No
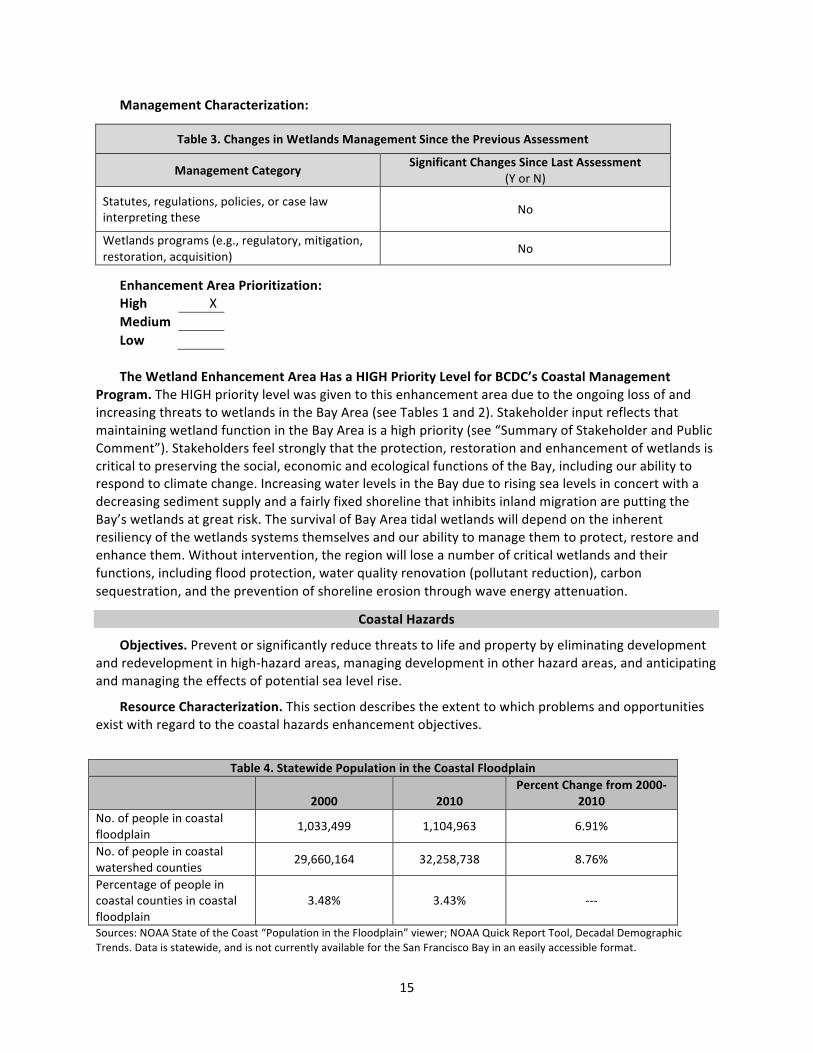
Enhancement Area Prioritization: High X Medium Low
The Wetland Enhancement Area Has a HIGH Priority Level for BCDC’s Coastal Management
Program. The HIGH priority level was given to this enhancement area due to the ongoing loss of and increasing threats to wetlands in the Bay Area (see Tables 1 and 2). Stakeholder input reflects that maintaining wetland function in the Bay Area is a high priority (see “Summary of Stakeholder and Public Comment”). Stakeholders feel strongly that the protection, restoration and enhancement of wetlands is critical to preserving the social, economic and ecological functions of the Bay, including our ability to respond to climate change. Increasing water levels in the Bay due to rising sea levels in concert with a decreasing sediment supply and a fairly fixed shoreline that inhibits inland migration are putting the Bay’s wetlands at great risk. The survival of Bay Area tidal wetlands will depend on the inherent resiliency of the wetlands systems themselves and our ability to manage them to protect, restore and enhance them. Without intervention, the region will lose a number of critical wetlands and their functions, including flood protection, water quality renovation (pollutant reduction), carbon sequestration, and the prevention of shoreline erosion through wave energy attenuation.
Coastal Hazards
Objectives. Prevent or significantly reduce threats to life and property by eliminating development and redevelopment in high-‐hazard areas, managing development in other hazard areas, and anticipating and managing the effects of potential sea level rise.
Resource Characterization. This section describes the extent to which problems and opportunities exist with regard to the coastal hazards enhancement objectives.
Table 4. Statewide Population in the Coastal Floodplain
2000 2010 Percent Change from 2000-‐
2010 No. of people in coastal floodplain
1,033,499 1,104,963 6.91%
No. of people in coastal watershed counties
29,660,164 32,258,738 8.76%
Percentage of people in coastal counties in coastal floodplain
3.48% 3.43% -‐-‐-‐
Sources: NOAA State of the Coast “Population in the Floodplain” viewer; NOAA Quick Report Tool, Decadal Demographic Trends. Data is statewide, and is not currently available for the San Francisco Bay in an easily accessible format.
16
Table 5. Statewide Vulnerability to Shoreline Erosion
Vulnerability Ranking Miles of Shoreline Vulnerable Percent of Coastline Very low
(>2.0m/yr) accretion 54 miles 3%
Low (1.0-‐2.0 m/yr) accretion)
128 miles 8%
Moderate (-‐1.0 to 1.0 m/yr) stable
1,375 miles 88%
High (-‐1.1 to -‐2.0 m/yr) erosion
0 miles -‐-‐
Very high (<-‐2.0 m/yr) erosion
0 miles -‐-‐
Source: NOAA State of the Coast Vulnerability Index. Data is statewide, and is not currently available for the San Francisco Bay in an easily accessible format.
Table 6. Statewide Coastal Vulnerability to Historic Sea Level Rise
Vulnerability Ranking Miles of Shoreline Vulnerable Percent of Coastline Very low 0 miles -‐-‐ Low 374 miles 24%
Moderate 434 miles 27% High 327 miles 20%
Very high 422 miles 27% Source: NOAA State of the Coast Vulnerability Index. Data is statewide, and is not currently available for the San Francisco Bay in an easily accessible format.
Table 7. Risk1 from Coastal Hazards in the Bay Area Type of Hazard General Level of Risk (H, M, L)
Flooding (riverine, stormwater) High Coastal storms (including storm surge) High Geological hazards (e.g., tsunamis, earthquakes) High (earthquakes)
Medium (tsunamis) Shoreline erosion Medium Sea level rise High Great Lake level change N/A Land subsidence Low Saltwater intrusion Unknown Sources: CalEMA State Hazard Mitigation Plan 2013; Association of Bay Area Governments Resilience Program; BCDC Data.
1 Risk is defined as “the estimated impact that a hazard would have on people, services, facilities and structures in a community; the likelihood of a hazard event resulting in an adverse condition that causes injury or damage.” Understanding Your Risks: Identifying Hazards and Estimating Losses. FEMA 386-2. August 2001
17
Additional Information on Risk and Vulnerability to Coastal Hazards. The vulnerability to coastal hazards is likely to increase statewide, as population in coastal areas increases. NOAA’s State of the Coast National Coastal Population Report: Population Trends from 1970 to 2020 reports that California coastal watershed counties have a projected population increase of 11% between 2010-‐2020. That would result in approximately an additional 3.5 million people living in coastal watershed counties by 2020, and would likely expose upwards of 100,000 additional residents to hazards in the coastal floodplain.
In the Bay Area, it is anticipated that the population will grow from about 7 million today to some 9 million by 20402. At the same time, the land area at risk of flooding will increase as sea level rises. There could be as much as a 16-‐fold increase in the land area inundated along the Bay shoreline if the region does not take action (see Table 8 below).
Table 8. Potential Inundation Along the San Francisco Bay Shoreline Sea Level Rise
(MHHW + SLR in feet) Square miles potentially inundated Today’s MHHW 6 MHHW + 1 ft 20 MHHW + 2 ft 30 MHHW + 3 ft 44 MHHW + 4 ft 58 MHHW + 5 ft 74 MHHW + 6 ft 91
Source: Resilient Shorelines Partnership analysis of total land area at risk using the NOAA SLR Viewer inundation layers.
(Y or N) Statutes, regulations, policies, or case law interpreting these that address: elimination of development/redevelopment3
in high-‐hazard areas Yes Yes No
management of development/redevelopment
in other hazard areas Yes Yes No
climate change impacts, including sea level rise or Great Lake level change
Yes Yes Yes
Hazards planning programs or initiatives that address: hazard mitigation Yes Yes Yes
climate change impacts, including sea level rise or Great Lake level change Yes Yes Yes
Hazards mapping or modeling programs or initiatives for: sea level rise or Great Lake level change Yes Yes Yes
other hazards No No No
2 http://planbayarea.org/plan-‐bay-‐area.html 3 New development and redevelopment only, in certain areas
18
Definition of “High-‐Hazard Areas.” Within BCDC’s jurisdiction, high-‐hazard areas are generally
considered to be those areas within the current and future 100-‐year flood zone, taking the impacts of future sea level rise into account. High-‐hazard areas may also have significant seismic risk for ground shaking and liquefaction.
Significant Management Changes
Hazards Planning Programs or Initiatives
• In October 2011, BCDC adopted final Bay Plan amendments to address climate change (outlined in the Achievements section, above). These policy changes were partially funded by 309 and are significant because they improved BCDC’s ability to consider sea level rise and climate change adaptation needs in the Bay Area in the course of ongoing planning, permitting, and enforcement activities.
• In 2011, BCDC initiated the Adapting to Rising Tides (ART) pilot project in Alameda County which assessed coastal hazard risks (current and future flooding and seismic), developed strategies to improve resilience of shoreline communities and assets, and built local capacity to understand and address coastal hazards. This project (outlined in the Achievements section, above) was partially funded by 309.
• BCDC’s ART Program continues to work with local agencies and organizations in Alameda County to further refine the assessment outcomes and adaptation strategies developed in the pilot project and began efforts to assist other coastal communities in developing adaptation plans to address current and future flooding and other climate change impacts (outlined in the Achievements section, above).
• BCDC’s ART Program and ABAG’s Resilience Program completed a study of Bay Area Housing and Community Risks and developed a robust suite of strategies to improve the resilience of the region’s current and future communities. This project is informing the update of the region’s Local Hazard Mitigation Plans as well as an update to Plan Bay Area, the region’s long-‐range integrated transportation and land-‐use/housing strategy. Project background and reports are available on line at: http://resilience.abag.ca.gov/projects/stronger_housing_safer_communities_2015/
• Through the Head of Tide Project (outlined in the Achievements section, above) BCDC is developing guidance on responding to flood control vulnerabilities and changes in the head of tide. This builds on the SFEI study and report, Initial Protocol to Identify and Delineate the Head of Tide Zone in San Francisco Bay, which demonstrates how to integrate flood protection into multi-‐sector adaptation planning.
Hazards Mapping or Modeling Programs
• The Adapting to Rising Tides (ART) pilot project in Alameda County developed coastal mapping of current and future flooding in 2011. This mapping effort was funded by the Federal Highway Administration (FHWA) and served as the foundation for an assessment of coastal community risk and the development of adaptation strategies. This project, and the locally refined mapping it provided, is supporting regional and local transportation agencies and the communities in
19
Alameda County to take action on improving coastal hazards resilience. In 2014, building on the data and methods developed in the ART project, Alameda County Public Works updated the mapping to include additional sea level rise scenarios. These efforts leveraged the California Coastal Mapping Study and FEMA’s SF Bay study.
• BCDC worked with NOAA to launch the NOAA SLR Viewer in the Bay Area in 2012 and to educate coastal managers in the region about the utility of the tool and underlying data. The ART Program and its partners have been using the NOAA SLR Viewer tool and data to assess the future flood risks of shoreline communities and infrastructure. Since 2012 a number of local and regional agencies and organizations have been using the NOAA SLR Viewer to conduct vulnerability and risk assessments. In addition to the ART Program’s assessment of East Bay regional shoreline parks, other agencies including the Capitol Corridor Joint Powers Authority, the Metropolitan Transportation Commission and the Bay Area Rapid Transit Authority have all used the NOAA tool and products to advance sea level rise and coastal storm event planning.
Enhancement Area Prioritization: High X Medium Low
The Coastal Hazards enhancement area has a HIGH priority level for BCDC’s coastal management
program. This HIGH priority level was given to this enhancement area due to the significant impacts that climate change, and in particular sea level rise, coastal storms, and increased shoreline seismic risks will have on the San Francisco Bay Area’s social, economic and ecological systems. Stakeholder input identified Coastal Hazards as the highest priority enhancement area for BCDC’s Coastal Management program (see “Summary of Stakeholder and Public Comment”). Climate change impacts such as warmer water temperatures, increased salinity, temporary flooding, and permanent inundation of low lying areas, including the drowning of tidal marshes, will have widespread impacts on the region. Climate change has the potential to disrupt the Bay Area’s economy and will pose a significant threat to the Bay’s ecology, including the potential recovery or protection of threatened and endangered species.
Public Access
Objectives. Attain increased opportunities for public access, taking into account current and future public access needs, to coastal areas of recreational, historical, aesthetic, ecological, or cultural value.
Resource Characterization. This section describes the extent to which problems and opportunities exist with regard to the public access enhancement objectives.
Table 10. Public Access Status and Trends
Type of Access Current number (approximate)
Changes or Trends Since Last Assessment (↑, ↓, −, unkwn)
Data sources
Beach access sites 67 sites permitted by
BCDC ↑ (approx. +2 sites) BCDC Data
Shoreline (other than beach) access
sites
715 sites permitted by BCDC
↑ (approx. +22 sites; 5.8 miles)
BCDC Data
20
Table 10. Public Access Status and Trends
Type of Access Current number (approximate)
Changes or Trends Since Last Assessment (↑, ↓, −, unkwn)
Data sources
Recreational boat (power or
nonmotorized) access sites
89 existing BCDC-‐permitted sites; More than 135
launch and landing sites total in the Bay
unkwn
BCDC Data; Enhanced San Francisco Bay Area Water Trail Plan, State Coastal
Conservancy
Number of designated scenic vistas or overlook
points
20 − Bay Plan maps
Number of fishing access points (i.e. piers, jetties)
75 fishing access points, including
more than 40 public piers
unkwn
Recreation and San Francisco Bay, BCDC Staff Report, 2006; San Francisco Bay Shoreline Guide, State
Coastal Conservancy, 2012
Miles of coastal trails/ boardwalks
340 miles of SF Bay Trail (planned to be
500)
↑ (approx. +40 miles)
San Francisco Bay Trail Project; BCDC Data
Number of acres parkland/open
space
25,000 acres of waterfront park ↑ (approx. +3 sites; 16 acres)
Recreation and San Francisco Bay, BCDC Staff Report,
2006; BCDC Data
As part of BCDC’s far-‐reaching Strategic Plan adopted in May 2013, BCDC staff will be undertaking an
evaluation of public access within the Commission’s jurisdiction. This will inventory and evaluate the variety of types and uses of BCDC-‐required public access that currently exist in light of current BCDC laws and policies. Information on public access that has not been updated since the previous Assessment and Strategy is planned to undergo evaluation as part of this inventory.
Demand for Coastal Public Access and Process for Assessing Demand. NOAA’s State of the Coast National Coastal Population Report: Population Trends from 1970 to 2020 reports that the population within California’s coastal shoreline counties is projected to increase by 8% between 2010 and 2020. California is ranked as the top state in the U.S. for total population in coastal shoreline counties, and 10th for coastal population density.
The population of the greater San Francisco Bay Area region is projected to increase by 6.28% between 2010 and 2020, with approximately 6.85 million residents by 2020 and as many as 9 million by 20404.
The California Department of Parks and Recreation assesses demand for local parks and outdoor recreation areas, most recently through the Survey on Public Opinions and Attitudes on Outdoor Recreation in California 2012. While this survey is not specific to coastal public access, it characterizes regional outdoor access demands in California – including for the greater San Francisco Bay Area region. The California Department of Parks and Recreation periodically assesses this demand, with previous surveys conducted in 2009, 2002, 1997, and 1992. Within the 9 Bay Area counties, outdoor activities
4 http://planbayarea.org/plan-bay-area.html
21
(e.g. picnicking, playing) are projected to see about a 6% growth rate in participation, with hiking and walking expected to have even greater participation. Many of these activities take place in shoreline parks and trails around San Francisco Bay, and as regional demand for public access and outdoor recreation increases, shoreline-‐specific demand is likely to increase.
Table 11. Current Regional Demand – Greater San Francisco Bay Area
Top Facilities Used % Top Activities % Top Latent Demand for Activities %
Unpaved trail 65 Walking 49 Picnicking in picnic areas (with tables, fire pits, or grills)
55
Paved trail 58 Hiking on unpaved trails
42 Walking for fitness or pleasure on paved surfaces
33
Scenic observation/wildlife viewing area
54 Eating/Picnicking 30 Camping in developed sites with facilities such as toilets and tables (not including backpacking
33
Picnic table, picnic pavilion 53 Playing 27 Day hiking on unpaved trails 33
Open space to play 48 Sedentary Activities 22 Shopping at a farmer’s market 31
Beach or Water Recreation area 44 NA NA
Beach activities (swimming, sunbathing, surf play, wading, playing on beach)
31
Source: Table 12.4.15, Survey on Public Opinions and Attitudes on Outdoor Recreation in California 2012, California Department of Parks and Recreation, page 155.
Table 12. Projected Top Activity Participation through 2060 – Greater San Francisco Bay Area
Source: Table 12.4.16, Survey on Public Opinions and Attitudes on Outdoor Recreation in California 2012, California Department of Parks and Recreation, page 156.
Additional Information on Public Access in San Francisco Bay • As noted in the Achievements section above, BCDC has been working with the State Coastal
Conservancy and other partners since 2011 to implement the Enhanced San Francisco Bay Area Water Trail Plan, which aims to create a network of access points for non-‐motorized boats and beachable sail craft around San Francisco Bay. The Plan states that there are more than 135 launch and landing sites currently in the Bay for recreational, human-‐powered boating, with those sites predominantly (50%) found in waterfront parks. The Plan identifies 112 existing and planned “backbone” sites recommended as part of the Water Trail, which does not include all existing launch and destination sites. Of these 112 sites, there are 88 existing launches and 7 existing destinations in San Francisco Bay, with an additional 12 planned launches and 5 planned destinations. Information about the Water Trail, including an on-‐line map of designated sites is available at: http://sfbaywatertrail.org/explore-‐the-‐water-‐trail/about-‐the-‐water-‐trail/.
22
Management Characterization:
Table 13. Public Access Management Approaches Employed
Management Category Employed by
BCDC (Y or N)
BCDC Provides Assistance to Locals that Employ (Y or N)
Significant Changes Since Last Assessment
(Y or N)
Statutes, regulations, policies, or case law interpreting these
Yes Yes No
Operation/maintenance of existing facilities
No No No
Acquisition/enhancement Programs Noa No No
a Focus of partner organizations, e.g., California Coastal Conservancy, California Coastal Commission, Save the Bay Clean Bay Project and Surfrider Foundation SF Chapter beach cleanups.
Table 14. Publically Available Access Guides for San Francisco Bay
Public Access Guide
Printed Online Mobile App
State or territory has?
(Y or N)
Y Y Y
Web address
(if applicable)
https://store.abag.ca.gov/pubs.asp
baytrail.abag.ca.gov, sfbaywatertrail.org/map
http://baytrail.abag.ca.gov/m.baytrailmap.html
Date of last update
August 2012 2014 April 2013 (Transit & Trails)
Frequency of update
Periodically (1st Edition was published in 1995)
Approximately twice per year Unknown
The Bay Shoreline Access webGuide (baytrail.abag.ca.gov) is a publically available interactive map of
shoreline recreational opportunities. The San Francisco Bay Trail Project manages the webGuide, which was developed by BCDC and the Association of Bay Area Governments (ABAG). Other web-‐based public access resources are available from partners including East Bay Regional Parks, State Parks, State Coastal Conservancy, Golden Gate National Recreation Area, and the Bay Area Open Space Council. The printed San Francisco Bay Shoreline Guide, 2nd Edition was published in 2012 by the State Coastal Conservancy, with assistance from the Bay Trail Project.
The Bay Shoreline Access webGuide has a mobile-‐friendly website. The Bay Trail Project also hosts
downloadable smartphone audio tours for 4 specific portions of the Bay Trail, focusing on human and natural history. In addition, the Bay Area Open Space Council has a mobile app entitled “Transit & Trails: Find, Plan, Share” which allows users to locate parks and trails in the San Francisco Bay Area and gives walking, public transit, and driving directions. While not exclusive to the Coastal Zone, this app does contain information on coastal access sites.
23
The San Francisco Bay Water Trail also has on-‐line maps and many resources for users to find and safely access locations to launch and land non-‐motorized boats and beachable sail craft.
Enhancement Area Prioritization: High Medium X Low
The Public Access Enhancement Area Has a MEDIUM Priority for BCDC’s Coastal Management
Program. The MEDIUM priority level was given to this enhancement area due to ongoing regional efforts to inventory, activate, and create additional public access. These efforts, which include BCDC and its sister agency the State Coastal Conservancy, are continuing to address the growing need from a diverse public for coastal recreation in light of population growth and demographic shifts, uncertainty in the extent and timing of climate change impacts on public access, and the inherent conflict between protecting both coastal infrastructure and public access from the adverse impacts of climate change. Additionally, stakeholder input reflected a medium priority designation for public access (see “Summary of Stakeholder and Public Comment”).
Marine Debris
Objectives. Reducing marine debris entering the nation's coastal and ocean environment by managing uses and activities that contribute to the entry of such debris.
Resource Characterization. This section describes the extent to which problems and opportunities exist with regards to the marine debris enhancement objectives.
Table 15. Existing Status and Trends of Marine Debris in Coastal Zone (San Francisco Bay)
Source of Marine Debris Significance of Source (H, M, L, unknwn)
Type of Impact (aesthetic, resource damage,
user conflicts, other)
Change Since Last Assessment (↑, ↓, −, unkwn)
Land-‐based
Beach/shore litter High
Aesthetic, resource damage, water quality,
user conflicts, navigational hazard
unkwn
Dumping Medium
Aesthetic, resource damage, water quality,
user conflicts, navigational hazard
unkwn
Storm drains and runoff High Resource damage,
water quality unkwn
Fishing (e.g., fishing line, gear) Low
Resource damage, user conflicts, navigational
hazard unkwn
24
Table 15. Existing Status and Trends of Marine Debris in Coastal Zone (San Francisco Bay)
Source of Marine Debris Significance of Source (H, M, L, unknwn)
Type of Impact (aesthetic, resource damage,
user conflicts, other)
Change Since Last Assessment (↑, ↓, −, unkwn)
Ocean-‐based
Fishing (e.g., derelict fishing gear)
Low Resource damage, user conflicts, navigational
hazard unkwn
Derelict vessels High
Aesthetic, resource damage, water quality,
user conflicts, navigational hazard
−
Vessel-‐based (e.g., cruise ship, cargo ship, general
vessel) Medium Aesthetics, resource
damage, user conflicts unkwn
Hurricane/Storm High (storms); low (hurricanes)
Resource damage, water quality,
navigational hazard unkwn
Tsunami Low Resource damage, navigational hazard
−
Additional Information on Marine Debris in San Francisco Bay. BCDC has a limited marine debris
program, however marine debris reduction programs of partner agencies including State and Regional Water Quality Control Boards, EPA and USACE specifically as they relate to improving and maintaining water quality at a level that protects the beneficial uses of the Bay are actively supported.
International Coastal Cleanup data for the 9 Bay Area counties showed that 175,500 pounds of
beach trash were collected on cleanup days in 2011. The five most abundant types of trash were food containers (33,665), plastic bags (19,796), caps and lids (17,216), food dishes (9,398), and glass bottles (8,609). From 2011-‐2014, many Bay Area cities and several counties – including Alameda, Marin, San Mateo, and Santa Clara – adopted local plastic bag ordinances. Additionally, in 2009 the San Francisco Bay Regional Water Quality Control Board modified the Municipal Regional Stormater NPDES Permit for 76 local cities and counties to require measures that reduce trash entering the Bay via storm sewers by 40% before July 1, 2014. These local efforts indicate that marine debris in the form of land-‐based trash will likely continue to decrease in the Bay Area region.
Marine debris statutes, regulations, policies, or case law interpreting these
Yes Yes No
Marine debris removal programs
Yes Yes Yes
25
Significant Management Changes
• There has been more funding and interest around derelict vessel removal in San Francisco Bay since the previous Assessment. As noted in the Achievements section, above, BCDC supported a $495,000 effort to remove derelict vessels in Richardson’s Bay and a $6 million inter-‐agency cleanup effort at the Oakland-‐Alameda Estuary.
Enhancement Area Prioritization: High Medium Low X
The Marine Debris Enhancement Area Aas a LOW Priority Level for BCDC’s Coastal Management
Program. The LOW priority level was given to this enhancement area because BCDC has limited authority over marine debris, particularly as related to land-‐based sources, and has therefore been focusing in a limited manner on issues regarding derelict vessels, derelict pile-‐supported structures, and non-‐authorized live-‐aboard vessels through permitting and enforcement activities. Additionally, stakeholder input ranked this enhancement area as a much lower priority than the five areas ranked as either high or medium priorities in this Assessment (see “Summary of Stakeholder and Public Comment”). Despite the low priority ranking in relation to other coastal management issues, BCDC will continue to work on important marine debris concerns pertaining to its jurisdiction though its regulatory programs, including on issues regarding derelict vessels, derelict pile-‐supported structures, and non-‐authorized live-‐aboard vessels.
Cumulative And Secondary Impacts
Objectives. Development and adoption of procedures to assess, consider, and control cumulative and secondary impacts (CSI) of coastal growth and development, including the collective effect on various individual uses or activities on coastal resources, such as coastal wetlands and fishery resources.
Resource Characterization. This section describes the extent to which problems and opportunities exist with regards to the CSI enhancement objectives.
Table 17. Trends in Bay Area Population and Housing Units
Year Population Housing Total
(# of people) % Change (2007 -‐ 2012)
Total (# of housing units)
% Change (2007 -‐ 2012)
2007 6,958,473 5.6% 2,705,427
3.2% 2012 7,344,695 2,792,480
Source: National Ocean Economics Program county data. Data is a summary for the 9 Bay Area Counties.
Table 18. Distribution of Land Cover Types in Bay Area Counties
Land Cover Type Land Area Coverage in 2010 (Square Miles)
Gain/Loss Since 2006 (Square Miles)
Developed, High/Medium Intensity 662 5.8
Developed, Low Intensity 378 1.6 Developed, Open Space 226 -‐0.4
Grassland 1,742 -‐3.1 Scrub/Shrub 1,017 0.2 Barren Land 34 4.3
26
Table 18. Distribution of Land Cover Types in Bay Area Counties Land Cover Type Land Area Coverage in 2010
(Square Miles) Gain/Loss Since 2006
(Square Miles) Open Water 1,313 -‐10.7 Agriculture 613 -‐0.1 Forested 1,968 -‐0.8
Woody Wetland 33 -‐0.2 Emergent Wetland 205 3.5
Source: NOAA Land Cover Atlas. Summary of data for the 9 Bay Area Counties.
Table 19. Development Status and Trends for California Coastal Counties
2006 2011 Percent Net Change Square acres and percent of land developed 2,678,526 (10%) 2,700,188 (10%) 21,662 (1%) Square acres and percent impervious surface 1,173,187 (4%) 1,184,962 (5%) 11,776 (1%) Source: NOAA Land Cover Atlas. Data is statewide, and is not currently available for the San Francisco Bay in an easily accessible format.
Table 20. How Land Use Is Changing in Bay Area Counties
Land Cover Type Areas Lost to Development Between 2006-‐2010 (Square Miles) Barren Land 2.35
Emergent Wetland 0.11 Woody Wetland 0.03 Open Water 0.11 Agriculture 1.46 Scrub/Shrub 0.11 Grassland 3.61 Forested 0.05
Source: NOAA Land Cover Atlas. Summary of data for the 9 Bay Area Counties.
Table 21. California Shoreline Types Surveyed Shoreline Type Percent of Shoreline
Armored 14 Beaches 22 Flats 34 Rocky 21
Vegetated 8 Source: NOAA State of the Coast Shoreline Type data. Data is statewide, and is from 2010 (south) and 2006 (north, central, and SF Bay). Data is not currently available for the San Francisco Bay in an accessible format.
27
Management Characterization:
Table 22. CSI Management Approaches Employed
Management Category Employed by
BCDC (Y or N)
BCDC Provides Assistance to Locals that
Employ (Y or N)
Significant Changes Since Last Assessment
(Y or N)
Statutes, regulations, policies, or case law interpreting these Yes Yes No
Guidance documents Yes Yes No Management plans (including SAMPs) Yesa Yes No
a The Commission works with federal, state and local partners in the Long Term Management Strategy for the Placement of Dredged Materials in the San Francisco Bay Region (LTMS) to manage dredging and disposal.
Enhancement Area Prioritization: High Medium X Low
The Cumulative and Secondary Impacts (CSI) Enhancement Area Has a MEDIUM Priority Level for
BCDC’s Coastal Management Program. The MEDIUM priority level was given to this enhancement area because of the diversity of critical issues leading to CSIs in the Bay and the management challenges of addressing those issues, as well as stakeholder input reflecting a medium priority designation for this enhancement area (see “Summary of Stakeholder and Public Comment”). While there has been no significant coastal management change since the last assessment, BCDC addresses CSI in part through its participation in the preparation of the region’s state-‐mandated Sustainable Communities Strategy, which identifies areas to accommodate jobs and housing growth and transportation infrastructure investment. BCDC also participated extensively in the recently completed update to the Baylands Ecosystem Habitat Goals that identify restoration targets and approaches for Bayland habitats. These processes or planning efforts are likely to have even greater effects in the Bay region as climate change impacts increase. The resiliency of various systems and sectors to climate change impacts will depend in part on their exposure to existing stressors. Sensitive resources that are already subject to a wide range of stresses will have to be carefully evaluated and managed to protect them from detrimental climate change related impacts. The focus of BCDC’s coastal management program as it relates to CSIs will be on climate change, addressed under the Coastal Hazards enhancement area.
Special Area Management Planning
Objectives. Preparing and implementing special area management plans5 for important coastal areas.
5 The Coastal Zone Management Act (CZMA) defines a Special Area Management Plan (SAMP) as “a comprehensive plan providing for natural resource protection and reasonable coastal-‐dependent economic growth containing a detailed and comprehensive statement of policies; standards and criteria to guide public and private uses of lands and waters; and mechanisms for timely implementation in specific geographic areas within the coastal zone. In addition, SAMPs provide for increased specificity in protecting natural resources, reasonable coastal-‐dependent economic growth, improved protection of life and property in hazardous areas, including those areas likely to be affected by land subsidence, sea level rise, or fluctuating water levels of the Great Lakes, and improved predictability in governmental decision making.”
28
Resource Characterization. This section describes the extent to which problems and opportunities exist with regards to the special area management planning enhancement objectives.
Table 23. Opportunities for New or Updated Special Area Management Plans
Geographic Area Major conflicts/issues Suisun Marsh The Suisun Marsh Protection Plan is in need of revision to incorporate current
best management practices for plant, fish and wildlife conservation; to reflect changes in local land use plans and policies; and to consider climate change impacts including sea level rise and salinity changes.
San Francisco Waterfront The San Francisco Waterfront Special Area Plan is in need of revision to better address issues including fill removal, public access and plazas, changes in land use, preservation of historic resources and Port facilities, and sea level rise.
Seaport (marine terminals and ports in the Bay Area region)
The Seaport Plan is in need of revision to incorporate changes in the marine cargo shipping industry, including forecasts for individual cargo types, linkages to ground transportation networks and other changes in marine terminal and transportation facility operations, as well as impacts of projected sea level rise on Bay Area seaports and the ground transportation system they rely on.
Management Characterization:
Table 24. SAMP Management Approaches Employed
Management Category Employed by BCDC (Y or N)
BCDC Provides Assistance to Locals
that Employ (Y or N)
Significant Changes Since Last Assessment
(Y or N)
SAMP policies, or case law interpreting these Yes Yes No
SAMP plans Yes Yes Yes
Significant Management Changes
• As noted in the Accomplishments section, BCDC began a stakeholder process to examine the feasibility and possible content of a more comprehensive Special Area Plan update for the San Francisco Waterfront, and also amended the San Francisco Waterfront Special Area Plan twice in 2012. One amendment addressed the accommodation of an international cruise ship terminal on Pier 27. The other amendment allowed vessel berthing as part of the 34th America’s Cup races. Both amendments provided significant public access benefits as a condition of the changes. The amendments were part of BCDC’s coastal management program, though were not funded through Section 309. They are important for BCDC’s coastal management goal of increasing public access and will tie into a more comprehensive update of the San Francisco Waterfront Special Area Plan.
Enhancement Area Prioritization: High Medium X Low
29
The Special Area Management Planning Enhancement Area Has a MEDIUM Priority Level for BCDC’s Coastal Management Program. The MEDIUM priority level was given to this enhancement area because many of the resource planning and protection issues in the Bay Area are occurring at a region wide scale. Planning for climate change may be more appropriate at a sub-‐regional scale, and special area management planning will be an important tool for local adaptation to climate change and sea level rise in specific portions of the Bay Area. Addressing habitat, cumulative and secondary impacts, seaport management and development, and public access issues can be undertaken in the context of sub-‐regional sea level rise planning. Stakeholder input also reflected a medium priority designation for this enhancement area (see “Summary of Stakeholder and Public Comment”).
Ocean Resources
Objectives. Planning for the use of ocean resources.
Resource Characterization. This section describes the extent to which problems and opportunities exist with regards to the ocean resources enhancement objectives.
Table 25. Status of Ocean Economy for Bay Area Counties (2011)
Establishments (# of Establishments)
Employment (# of Jobs)
Wages (Millions of Dollars)
GDP (Millions of Dollars)
Living Resources 56 357 11.8 28.7 Marine Construction 72 1,713 144.2 258.9 Marine Transportation
All Ocean Sectors 8,315 149,890 4,705.9 10,837.4 Source: Economics: National Ocean Watch (ENOW). Data is a summary for the 9 Bay Area Counties. NOTE: This summary data does not account for rounding and suppression of data for the individual counties; counties most affected by this are Napa, Contra Costa, and Solano. ENOW notes that: “’Rounding and Suppression,’ … indicates that data for the sector exists, but are suppressed and cannot be released. Economic statistics that are published by government agencies are often derived from data provided by individual business establishments. To protect the confidentiality of these businesses, economic statistics are generally not published when they can be used to learn about an individual establishment.”
Table 26. Change in Ocean Economy for Bay Area Counties (2005-‐2011)
Establishments (% change)
Employment (% change)
Wages (% change)
GDP (% change)
Living Resources -‐5.08% -‐1.11% 2.61% 5.51% Marine Construction -‐14.29% -‐21.71% -‐1.84% -‐10.38% Marine Transportation -‐15.38% -‐27.03% -‐1.33% 20.19%
Offshore Mineral Extraction 0% -‐26.60% -‐10.08% 28.18%
Tourism & Recreation
6.71% 11.38% 26.77% 18.32%
All Ocean Sectors 5.82% 8.66% 22.29% 20.72% Source: Economics: National Ocean Watch (ENOW). Data is a summary for the 9 Bay Area Counties. NOTE: Again, this summary data does not account for rounding and suppression of data for the individual counties (NA data is incorporated as a zero value).
30
Table 27. Significant Changes to Ocean Resources and Uses
Resource/Use Change in the Threat to the Resource or Use Conflict
Living marine resources (fish, shellfish, marine mammals, birds, etc.)
↑
Sand/gravel ↑ Cultural/historic −
Use Transportation/navigation −
Offshore development6 − Energy production unkwn
Fishing (commercial and recreational) ↑ Recreation/tourism ↑
Sand/gravel extraction ↑ Dredge disposal ↑
Aquaculture −
Table 28. Major Contributors to an Increase in Threat or Use Conflict to Ocean and Great Lakes
Resources
Resource
Major Reasons Contributing to Increased Resource Threat or Use Conflict
Land
-‐based
de
velopm
ent
Offsho
re
developm
ent
Polluted runo
ff
Invasiv
e species
Fishing (Com
m
& Rec)
Aqua
cultu
re
Recreatio
n
Marine
Tran
sportatio
n
Dred
ging
Sand
/Mineral
Extractio
n
Ocean
Acidificatio
n
Other
(spe
cify)
Benthic habitat X X X X Living marine resources X X X X X X
Sand/gravel X Fishing X X Recreation/tourism X Sand/gravel extraction X Dredge disposal X
6 Offshore development includes underwater cables and pipelines, although any infrastructure specifically associated with the energy industry should be captured under the “energy production” category.
State comprehensive ocean/Great Lakes management plans No No No
Single-‐sector management plans Yes Yes No
Table 30. Comprehensive Ocean Management Plans Comprehensive Ocean/Great Lakes Management Plan State Plan Regional Plan Bay Area Specific Plan
Completed plan (Y/N) (If yes, specify year completed) No No No
Under development (Y/N) No Yes No Web address (if available)
http://www.cmsp.noaa.gov/activities/wcga.html
Area covered by plan CA, OR, WA
Enhancement Area Prioritization: High Medium Low X The Ocean and Great Lakes Resources enhancement area has a LOW priority level for BCDC’s
coastal management program. BCDC has limited jurisdiction over this enhancement area, and the LOW priority has not changed since the previous assessment. There is, however, a region-‐wide interest in improving the understanding of the sediment dynamics between the Bay and the outer coast.
Energy & Government Facility Siting
Objectives. Adoption of procedures and enforceable policies to help facilitate the siting of energy facilities and Government facilities and energy-‐related activities and Government activities which may be of greater than local significance.
Resource Characterization. This section describes the extent to which problems and opportunities exist with regards to the energy and government facility siting enhancement objectives.
32
Table 31. Status and Trends in Energy Facilities and Activities in the Bay Area Coastal Zone
Type of Energy Facility/Activity
Exists in CZ Proposed in CZ
(# or Y/N) Change Since Last
Assessment (↑, ↓, −, unkwn)
(# or Y/N) Change Since Last Assessment
(↑, ↓, −, unkwn)
Energy Transport Pipelines Yes − No −
Electrical grid (transmission cables) Yes ↑ Yes ↑
Ports 5a − No − Liquid natural gas (LNG) No − No −
Energy Facilities Oil and gas 59b − No −
Coal 5b − No − Nuclear No − No − Wind 43b − No − Wave No − No − Tidal Noc − No −
Current (ocean, lake, river) No − No −
Hydropower 5b − No − Ocean thermal energy
conversion Noc − No −
Solar 4b unkwn No unkwn Biomass 71d unkwn 6d unkwn
a Source: BCDC data. b Source: California Power Plant Database, Energy Almanac, California Energy Commission. Data represents operational power plant facilities for the 9 Bay Area counties. To date, none of the wind facilities are within BCDC’s jurisdiction. C Source: California Energy Commission. d Source: California Biomass Facilities Reporting System Database, California Biomass Collaborative, University of California, Davis. Data for the 9 Bay Area counties as of May 2013. There are 21 landfill gas projects in the Bay Area, 34 wastewater treatment plants with anaerobic digesters, 3 dairies in Marin and Sonoma Counties using manure in anaerobic digesters, 10 facilities that use food processor and/or urban residues, and 3 liquid biofuel projects. There are no solid fuel biomass power plants in the Bay Area. Six landfill gas projects are currently planned in Bay Area counties.
Additional Information on Energy Facilities and Activities. In 2014, BCDC issued a permit to Pacific
Gas and Electric (PG&E) to install a new 230K Volt transmission line via hydroplow within the San Francisco Bay and connect to a new Potrero switchyard along the San Francisco waterfront.
The California Energy Commission is the state’s primary energy policy and planning agency. Further information on energy facilities and activities can be found at www.energy.ca.gov.
Additional Information on Federal Government Facilities and Activities. In 2014, BCDC issued a consistency determination to the Department of Veterans Affairs for acquisition of the U.S. Department of Navy’s property by the VA for purposes of redevelopment and use in part for the construction of a 158,000-‐square-‐foot outpatient clinic, 632-‐vehicle parking lot, an 80-‐acre national cemetery (developed in 10-‐year increments), utility and road infrastructure, a conservation management office, a wildlife management area, and a 100-‐foot-‐wide public access setback located west of the proposed cemetery.
33
Management Characterization:
Table 32. Energy and Government Facility Siting Management Approaches Employed
Management Category Employed by BCDC (Y or N)
BCDC Provides Assistance to Locals
that Employ (Y or N)
Significant Changes Since Last Assessment
(Y or N)
Statutes, regulations, policies, or case law interpreting these
Yes No No
State comprehensive siting plans or procedures
No No No
Enhancement Area Prioritization: High Medium Low X The Energy and Government Facility Siting Enhancement Area Has a LOW Priority Level for BCDC’s
Coastal Management Program. The LOW priority level is due to BCDC’s lack of jurisdiction over energy facility siting, and because the potential for new government facility siting is low. Regional efforts are focused on redevelopment, realignment, or reuse of government facilities, including closed military bases and the regional airports. The focus of BCDC’s coastal management program as it relates to these facilities will be on climate change adaptation, addressed under the Coastal Hazards enhancement area.
Aquaculture
Objectives. Adoption of procedures and policies to evaluate and facilitate the siting of public and private aquaculture facilities in the coastal zone, which will enable states to formulate, administer, and implement strategic plans for marine aquaculture.
Resource Characterization. This section describes the extent to which problems and opportunities exist with regards to the aquaculture enhancement objectives.
Table 33. Status and Trends of California Aquaculture Facilities and Activities Type of Facility/Activity # of Facilities Approximate
Economic Value Change Since Last Assessment
(↑, ↓, −, unkwn) Total Aquaculture 124
$83,583,000 ↑
Food Fish 71 $37,395,000 ↑ Sport Fish 13 D ↑ Baitfish 2 D ↓ Crustaceans 0 0 ↓ Mollusks 27 $16,992,000 ↑ Ornamental Fish 18 D ↓ Misc. Aquaculture 16 $25,033,000 ↑ Source: 2013 Census of Aquaculture, U.S. Department of Agriculture, National Agricultural Statistics Service. Data is statewide, and is not exclusive to the coastal zone. Since BCDC’s previous Assessment and Strategy (2011) did not include any state data on aquaculture, changes are measured since 2005 (the previous Census of Aquaculture). D=data withheld to avoid disclosing data for individual farms.
Aquaculture comprehensive siting plans or procedures No No No
Other aquaculture statutes, regulations, policies, or case law interpreting these
No No No
Enhancement Area Prioritization: High Medium Low X The Aquaculture Enhancement Area Has a LOW Priority Level for BCDC’s Coastal Management
Program. Due to contamination and lingering water quality issues there have not been and are unlikely to be aquaculture facilities in San Francisco Bay, until water quality improves. Because of these issues, the LOW ranking of this enhancement area has not changed since the previous Assessment.
B. PHASE II ASSESSMENT
The following in-‐depth assessment is intended to help the CMP understand key problems and opportunities that exist for program enhancement and determine the effectiveness of existing management efforts to address those problems. This assessment focuses on enhancement areas identified as high priorities in the Phase I Assessment, above.
Wetlands
In-‐Depth Resource Characterization. This section describes key problems and opportunities to improve BCDC’s ability to protect, restore, and enhance wetlands.
Table 35. Three Most Significant Existing Physical Stressors or Threats to Wetlands within San Francisco Bay Stressor/Threat Geographic Scope Stressor 1 Sea level rise Throughout the Bay Area Region Stressor 2 Shoreline development and lack of inland
accommodation space Throughout the Bay Area Region
Stressor 3 Decreasing sediment supply and lack of watershed connection
Throughout the Bay Area Region
35
Explanation of Significant Stressors. The most significant stressors for wetlands within San Francisco Bay are interrelated. Sea level rise, shoreline development, and decreasing sediment supply in combination are reducing the ability of wetlands to persist as our climate changes. The resilience of the Bay’s tidal wetlands to sea level rise depends on their ability to build upward and move landward. Tidal wetlands will drown if they do not keep pace with accelerating sea level rise, and the flood risk reduction and other benefits they provide would be lost. The elevation of wetlands within the tidal frame is maintained by vertical accretion, that is, the accumulation of sediment and the input of organic matter from local plant production, or landward migration to higher ground. Current science indicates that suspended-‐sediment concentrations in the Bay appear to be decreasing, so future sediment supply to support vertical accretion may be limited. If tidal marshes are more frequently flooded because vertical accretion rates are outpaced by sea level rise, vegetation will be stressed, reducing its sediment-‐trapping potential and input of organic matter. This will reduce accretion rates and, relative to rising water levels, lower marsh elevation, which will further stress vegetation. If suspended-‐sediment concentrations do not increase concurrent with rising Bay water levels, tidal marshes will begin to “downshift” from high to mid marsh habitat, from mid to low marsh habitat, and eventually to mudflat.
When sea level rise outpaces vertical accretion, tidal wetlands will need space to migrate, or transgress, inland if they are to survive. However, in the Bay Area there is limited room for tidal wetlands to migrate landward as many are bordered by levees or surrounded by development. Sea level rise may also increase local wave climates that increase scour and erosion of wetlands.
BCDC’s 2011 report, Living With a Rising Bay: Vulnerability and Adaptation in San Francisco Bay and on its Shoreline states that:
“Tidal flats in the Bay are already eroding as a result of insufficient volumes of sediment from tributary watersheds. The area of tidal flats in the North Bay decreased by 68,000 acres (106 square miles) over the period from 1951-‐1983, and 4,500 acres (7 square miles) in the South Bay between 1858 and 2005 (Jaffe et al. 2007, Jaffe and Foxgrover 2006). The decline in sediment flowing into the Bay is the result of dam construction, flood control, water diversions and other management actions in the tributary watersheds. …[H]igher rates of sea level rise may jeopardize efforts to restore tidal wetlands and maintain the current form of the Bay-‐Delta estuary. Erosion of subtidal areas may also expose mercury-‐laden sediment and impact circulation patterns in the Central Bay, possibly contributing to scour of bottom sediment, a primary physical control on habitats in subtidal regions of the Bay (NOAA 2007).”
Additionally, the Corte Madera Baylands Conceptual Sea Level Rise Adaptation Strategy, prepared by BCDC and ESA PWA in 2013, found that “Elevated sediment supply associated with hydraulic mining debris in the late 1800s (Gilbert, 1917) increased sediment transport to the Bay by an order of magnitude and led, in some instances, to rapid progradation of marshes.” This sediment load has, over time, moved through the Bay ecosystem and will not provide an ongoing supply of sediment to sustain Bay Area wetlands in the face of climate change and future conditions.
36
The three most significant stressors for wetlands have high irreversibility. Once lost, tidal wetlands ecosystems cannot be easily recovered, particularly in such a highly urbanized estuary, which will have important consequences on species diversity as they provide refuge to endangered species like the salt marsh harvest mouse and Ridgway’s rail. Other benefits associated with wetlands are also lost as wetlands decrease due to sea level rise, development, and diminished sediment supply, including recreation, water quality, and flood protection. Accelerating rates of sea level rise due to climate change will continue to exacerbate these issues. Additionally, BCDC staff and stakeholders ranked “Future adaptation and transition areas for landward migration of wetlands” and “Sea level rise and storm events” as the top two most critical issues for wetlands.
Table 36, below, identifies emerging issues of concern for wetlands, which lack sufficient information to evaluate the level of the potential threat.
Table 36. Emerging Issues of Concern for Wetlands
Emerging Issue Information Needed
Long-‐term impact of declining sediment supply and sea level rise on Bay tidal wetland local accretion processes
Information on how a changing sediment supply is affecting Bay wetlands’ ability to keep up with sea level rise, the potential for sub-‐regional and local (site-‐specific) differences in this effect, and opportunities for regional sediment management of activities in the Bay and watershed to maximize the amount of sediment that reaches wetlands along the shoreline
Changing watershed dynamics leading to changing sediment and freshwater inputs to the Bay as a result of climate change
Information on wetlands response to changing watershed dynamics as a result of climate change, including reduced freshwater flows, salinity intrusion, sediment inputs and differing frequency and duration of runoff associated with storm events
Wetland transition zones or accommodation space that allow for the natural inland migration of tidal wetlands as sea level rises
Information on the feasibility, efficacy and most appropriate approach to improving or creating upland transition zones that result in the inland migration of tidal wetlands
In-‐Depth Management Characterization. This section helps determine the effectiveness of
management efforts to address identified problems related to the wetlands enhancement objective.
Table 37. Wetlands Management Approaches Employed
Management Category Employed By BCDC (Y or N)
BCDC Provides Assistance to
Locals that Employ (Y or N)
Significant Changes Since Last Assessment
(Y or N)
Wetland assessment methodologies
Yes Yes Yes
Wetland mapping and GIS Yes Yes Yes Watershed or special area management plans addressing wetlands
Yes Yes No
Wetland technical assistance, education, and outreach
Yes Yes Yes
37
Significant Management Changes
Wetland Assessment Methodologies, and Wetlands Technical Assistance, Education, and Outreach
• As noted in the Accomplishments section, above, BCDC published the Innovative Wetland Adaptation Techniques in Lower Corte Madera Creek Watershed (Corte Madera) project in 2013. The Corte Madera project used innovative assessment methodologies to examine the response of tidal marshes to sea level rise. Through this project, BCDC developed a conceptual sea level rise adaptation strategy for the Corte Madera Baylands, in collaboration with a number of partners including USGS, UNESCO-‐IHE, University of San Francisco, and Marin County. Findings and methodologies developed in this study are being used to conduct additional modeling and site assessments, and are helping in the development of decision-‐making tools to better shape adaptation strategies for wetlands in San Francisco Bay. BCDC is providing outreach and technical assistance to local governments and coastal managers to help them apply the findings and methodologies from the Corte Madera project to other efforts. This project was funded by EPA Clean Water Quality funds and not through NOAA Section 309.
• BCDC is a member of the Delta Stewardship Council’s Adaptive Management Advisory Team (AMAT), where state and local agency members review and comment on wetland restoration projects in the Suisun Marsh. The AMAT has met to review four separate restoration projects and has influenced the design and adaptive management of these projects. These efforts were partially funded through Section 309.
Wetland Mapping and GIS, and Wetlands Technical Assistance, Education and Outreach • The Adapting to Rising Tides (ART) Alameda County pilot project and the Hayward Shoreline
Resilience Study, noted in the Achievements section, both leveraged the Point Blue Conservation Science GIS tool, Future San Francisco Bay Marshes, a Climate Smart Planning Tool, as well as the underlying data and modeling to assess wetlands vulnerabilities in Alameda County and the Hayward shoreline and develop potential adaptation strategies. This provides a model for the use of local wetlands assessment tools in developing management actions at the local level, and will provide guidance for future ART efforts in other counties around the Bay. ART has collaborated with city, county, regional, state and federal stakeholders and partners on these efforts, which were partially funded through Section 309.
As noted in the Achievements section, above, the Head of Tide Project developed guidance for determining where the head of tide zone may migrate as sea level rises. The guidance described three protocols to determine the exposure of tidal creeks, flood control channels, and adjacent land areas to sea level rise depending on the purpose, scope, and scale of the adaptation planning effort: 1) Desktop protocol that interprets results from the NOAA SLR Viewer (qualitative; regional, county, or city scale); 2) Field protocol that examines multiple physical and biological indicators (qualitative; watershed scale); and 3) Numerical modeling protocol that adjusts boundary conditions (quantitative; watershed scale). ART Program staff are applying these approaches in projects around the region, including the Contra Costa County Adapting to Rising Tides project where staff is evaluating the vulnerability of flood control channels as well as many other asset categories. The Head of Tide project was funded through the Coastal Impact Assistance Program of the US Fish and Wildlife Service.As noted in the Achievements section, the Baylands Ecosystem Habitat Goals Update will be released in 2015. The update used Point Blue Conservation Science wetlands modeling to develop recommendations for regional action to improve wetlands conservation in light of climate change. This modeling was used to create a variety of sea level rise scenarios to better understand the potential dramatic decline in Bay Area wetlands if no climate change adaptation actions are taken. One of the overarching recommendations of the update is
38
the need to engage the citizenry in advocating for the Baylands. The proposed engagement strategy includes a multi-‐agency push for direct public education and outreach about wetlands sustainability. The mapping scenarios and technical assistance provided by the update will help guide regional decisions about shoreline habitat restoration given sea level rise and storm impacts and provide the scientific basis for updating policies to accommodate adaptation actions, including ongoing adaptive management. The outreach component of the update is critical for gaining broad public support and interest in wetlands protection, as well as advocacy to promote and fund sea level rise adaptation at the local, regional, state, and federal levels. These efforts were not funded through NOAA Section 309.
Effectiveness of Coastal Wetlands Management Efforts. Over the last 50 years BCDC’s coastal management program has been highly effective in protecting, restoring and enhancing coastal wetlands. BCDC’s law and policies were however crafted during an era when the Bay was becoming smaller due to the placement of fill rather than larger due to rising sea levels. Rising Bay water levels are a challenge that will require serious consideration of whether existing plans, policies and management practices will help build wetland resilience to sea level rise. The Adapting to Rising Tides Hayward Shoreline Resilience Study found that there is a concern that “…regulatory agencies will need to adapt their practices and policies in light of climate change” and that these conversations need to be initiated early before wetlands are at risk. Best available science indicates that most tidal wetlands around the Bay shoreline are unlikely to persist over the long term without intervention, therefore it is critical to examine in detail the current regulatory regime to ensure it can provide the framework necessary to successfully meet the challenges ahead. For example, there is a strong interest in evaluating how best to design, permit, build, manage and monitor wetland management projects such as upland transition zone slopes, living levees, and other green infrastructure in a manner that requires fill but also provides multiple benefits, including wave attenuation, recreation, and habitat creation.
Project proponents state that it can be difficult to obtain permits for multi-‐benefit, multi-‐jurisdictional, green infrastructure projects due to the limited number of projects that have been constructed to demonstrate the efficacy of these approaches, the challenge of coordinating different regulatory requirements among local, state and federal agencies, and difficulty in establishing conditions that ensure adequate monitoring and adaptive management occurs. Addressing these issues may require different or expanded relationships with permitting agencies to effectively balance short-‐ and long-‐term impacts to habitat, water quality, flood protection, and recreation. To help address these concerns, BCDC is conducting the Policies for a Rising Bay project, which will examine BCDC’s existing policies on Bay fill and whether and how they may be applied or changed to address current and future issues that may impact wetlands sustainability.
Identification of Priorities. This section identifies the top three management priorities where there is the greatest opportunity for BCDC to improve its ability to more effectively respond to significant wetlands stressors. This section also identifies priority needs and information gaps to help address the management priorities.
• Management Priority 1: Incorporate wetlands management decision-‐making into local and regional shoreline resilience planning to ensure natural systems and solutions are integrated into efforts to address sea level rise and storm events for the built environment.
Description: Diverse efforts are needed to incorporate wetlands resilience into region-‐wide planning for sea level rise and future storm events. Assessment of wetland management strategies to address future conditions needs to be integrated into multi-‐sector and multi-‐jurisdictional efforts to ensure shared, balanced solutions.
39
• Management Priority 2: Investigating, in collaboration with others, the feasibility and efficacy of wetland adaptation measures, including transition areas for landward migration of wetlands.
Description: Research and planning to understand what wetlands adaptation measures will be most successful in which locations around the Bay shoreline. Investigation of regulatory, financing and management hurdles that must be overcome to implement adaptation measures, including understanding the feasibility and constraints of possible approaches, the relationship to BCDC’s policies, and the integration with multi-‐benefit strategies to protect and improve existing communities’ infrastructure as sea level rises.
• Management Priority 3: Addressing decreasing sediment supply to wetlands.
Description: Evaluating issues around fill and sediment management in the Bay, including beneficial reuse of dredged materials, augmenting or replenishing sediment supply for existing and restored wetlands, and response of wetlands to different potential strategies.
Table 38, below, identifies and briefly explains priority needs and information gaps BCDC’s Coastal Management Program has to help it address the management priorities identified above. The needs and gaps identified here are not limited to those items that will be addressed through a Section 309 strategy but include items that will be part of a strategy.
Table 38. Priority Needs and Information Gaps in Addressing Wetlands Management Priorities
Priority Needs Need? (Y or N)
Brief Explanation of Need/Gap
Research Yes
(1) Better understanding of climate change impacts (e.g. sea level rise, salinity and temperature) on tidal wetlands sustainability based on an understanding of current bathymetry, topography, sediment budgets, substrate types, vegetative community, hydrology, wave environment and biological species composition; (2) Understanding how tidal wetlands ecosystems will respond to climate change, including changes in species interactions, sensitivity to invasive species, shifts in species composition, and loss of flood risk reduction benefits; and (3) Understanding tidal wetland existing and historic sediment budgets, transport process, sediment sources, and watershed connections to understand past perturbations and inform how these systems will likely respond in the future.
Mapping/GIS Yes
(1) Methods to determine the most viable, high priority wetlands and adjacent upland transition zones that will be critical to the region’s climate change strategy; and (2) Mapping to help track response of wetlands to management measures, such as the creation of upland transition zones.
40
Table 38. Priority Needs and Information Gaps in Addressing Wetlands Management Priorities
Priority Needs Need? (Y or N)
Brief Explanation of Need/Gap
Data and information management
Yes
An integrated data retrieval and management system that includes information on voluntary and permitted wetland protection, restoration and enhancement efforts to help track required monitoring and allow for adaptive management and resources to support this work.
Training/capacity building Yes Building capacity, training, and funding around wetlands adaptation to climate change, including research and monitoring.
Decision-‐support tools No
Communication and outreach Yes
(1) Public outreach, as well as coordination and communication with other estuarine managers, to improve information and capacity sharing as it relates to statewide and regional habitat conservation efforts; and (2) Improving messaging that communicates the importance and cost effectiveness of nature-‐based (wetland) adaptation.
Policy Changes Yes
(1) Consideration of whether there is new information to update findings and policies to ensure wetlands are protected and enhanced in light of acceleration of sea level rise and declining sediment supplies, and to ensure wetlands sustainability is integrated into local and regional shoreline resilience planning. (2) Consideration of whether new Special Area Plans (SAPs) for specific shoreline areas would be a useful tools to plan for the protection, restoration and enhancement of wetland systems in the face of climate change impacts including sea level rise; and (3) Updated existing SAPs and sector-‐specific policy plans to better address the needs for wetland adaptation to sea level rise including opportunities for landward migration.
Enhancement Area Strategy Development. Will BCDC develop one or more strategies for this enhancement area?
Yes X No
Strategies will be Developed for the Wetlands Enhancement Area. Wetlands sustainability is a high
priority in light of climate change and sea level rise, and BCDC is well positioned to address these critical issues. Many of these efforts will be integrated with, or related to, the Coastal Hazards enhancement area, and therefore the Coastal Hazards strategy for climate change will also address issues regarding wetlands.
Coastal Hazards
In-‐Depth Resource Characterization. This section describes key problems and opportunities to improve BCDC’s ability to prevent or significantly reduce coastal hazard risks by managing development and redevelopment in high-‐hazard areas to address the effects of potential sea level rise, storms, and seismic events.
41
a. Flooding In-‐Depth. Table 39, below, uses data from NOAA’s State of the Coast “Population in
the Floodplain” viewer and summarized by coastal county through NOAA’s Coastal County Snapshots for Flood Exposure, to indicate how many people at potentially elevated risk were located within the state’s coastal floodplain as of 2010. These data only reflect two types of vulnerable populations.
Table 39. 2010 Populations in Bay Area Counties at Potentially Elevated Risk to Coastal Flooding
Under 5 and Over 65 years old In Poverty # of people % Under 5/Over 65 # of people % in Poverty
Sources: NOAA State of the Coast “Population in the Floodplain” viewer; NOAA Coastal County Snapshots for Flood Exposure. Summary of data for the 9 Bay Area counties. Poverty is defined at the federal level, and may not fully represent cost-‐burdened communities most likely to be impacted in the Bay Area.
b. Flooding In-‐Depth. Table 40, below, uses NOAA summary data for critical facilities, derived from FEMA’s HAZUS and displayed by coastal county through NOAA’s Coastal County Snapshots for Flood Exposure, to indicate how many critical facilities are located in the FEMA floodplain.
Table 40. Bay Area Critical Facilities in the FEMA Floodplain
Schools Police Stations
Fire Stations Emergency Centers
Medical Facilities
Communication Towers
Inside Floodplain 114 20 11 1 2 9
Coastal Counties 2581 194 166 6 79 129
Sources: NOAA State of the Coast “Population in the Floodplain” viewer; NOAA Coastal County Snapshots for Flood Exposure; FEMA HAZUS (Methodology for Estimating Potential Losses from Disasters). Data is a summary for the 9 Bay Area counties.
Based on the characterization of coastal hazard risk, Table 41 identifies the three most significant coastal hazards within the coastal zone, and indicates the geographic scope of each hazard, i.e. if it is it prevalent throughout the coastal zone or if specific areas are most at risk.
Table 41. Three Most Significant Coastal Hazards in the San Francisco Bay Area
Type of Hazard Geographic Scope (throughout coastal zone or specific areas most threatened)
Hazard 1 Sea Level Rise Throughout the Bay Area Region Hazard 2 Earthquakes Throughout the Bay Area Region Hazard 3 Coastal Storms Throughout the Bay Area Region
Explanation of Significant Stressors. Climate change is projected to have significant impacts on San
Francisco Bay, with primary issues including sea level rise and increased frequency and severity of coastal storms. The extent of these impacts are discussed further in BCDC’s 2011 report, Living With a Rising Bay: Vulnerability and Adaptation in San Francisco Bay and on its Shoreline.
42
BCDC’s Adapting to Rising Tides (ART) program conducted a vulnerability assessment of how climate change may affect the communities, infrastructure, economy and ecosystems along the Alameda County shoreline, and is undertaking similar assessments at finer, focus area scales and in Contra Costa County, and is supporting climate resilience efforts of local jurisdictions and special districts, regional transportation providers, and regional collaborative planning efforts. Sea level rise and coastal storms are anticipated to have significant impacts, including more injuries and loss of life, inundation of existing private and public infrastructure and critical facilities, disruption of access to goods and services (e.g. water, energy, transportation, healthcare, schools), loss of tidal habitat and shoreline recreation, and decreased seismic stability, in particular where there are current liquefaction risks. Communities that have certain characteristics (such as income, age, transit-‐dependence or other constraints) that live, work, or rely on services and facilities along the shoreline, have the potential to bear a disproportionate burden of the impacts of rising sea levels, coastal storms, and shoreline seismic events.
While storm events and sea level rise will be an issue for all of California, BCDC’s ART program has found that while the Bay Area faces unique challenges, there are also immediate opportunities to advance adaptation as many communities are initiating climate assessments or engaging in regional efforts to understand and improve resilience. A significant proportion of the Bay Area’s critical transportation system is at risk, including the majority of interstates and state highways, rail lines, airports and many of the transit agency assets and services. The highest density development in the Bay Area is built along vulnerable areas of the shoreline, and many of the region’s critical assets are located in low lying areas with ad-‐hoc or no shoreline protection. In some locations roadways or rail line embankments, which are neither constructed nor maintained as flood protection systems, serve as ad-‐hoc protection for these assets that are at risk of damage or disruption due to rising tides and storm events.
Earthquake risk is also an ongoing coastal hazard in the Bay Area, due to the numerous fault lines and past, ongoing and anticipated seismic activity. The risk of damage from earthquakes may increase in conjunction with sea level rise, if rising groundwater increases soil liquefaction during a seismic event. BCDC and the Association of Bay Area Governments (ABAG) recently completed a combined assessment of earthquake and flood risks, entitled Stronger Housing, Safer Communities: Strategies for Seismic and Flood Risks. This report found that:
“Much of the Bay Area is exposed to natural hazards that have the potential to cause significant impacts on the region and its residents. Seismic events may cause ground shaking or liquefaction, and many shoreline areas are vulnerable to existing flooding and may experience increased flooding in the future due to sea level rise.”
As part of this project, BCDC and ABAG conducted a regional assessment of hazards to housing and community risk in order to understand where communities that are likely to be the most impacted are living in fragile housing. The project also worked with local jurisdictions to develop neighborhood-‐scale refined assessments for eight communities. The assessment found that: housing is generally built to life safety rather than shelter-‐in-‐place standards; most foundations cannot withstand liquefaction; most houses cannot withstand any amount of flooding; housing affordability is an existing challenge in the Bay Area that will make recovery more difficult; renters have a limited ability to improve the resilience of the housing they live in; and many community members have limited or inadequate information about the hazards they face.
43
In addition, the top two coastal hazards critical issues identified by BCDC stakeholders and staff were “flooding of shoreline communities and disruption to adjacent infrastructure” and “wetlands sustainability as sea level rises.” Flooding of shoreline communities is a particular concern in areas that flood now, as the impacts may be more extensive and of longer duration. There are some notable examples of areas that currently experience flooding, including Highway 101 in Marin County. In addition, low-‐lying areas that are currently protected from 100-‐year coastal storm surge are likely to begin flooding as sea levels rise. Many shoreline areas either have minimal, or no, freeboard, and have flood infrastructure that is at or under capacity. When the region experiences coastal storm surge events that coincide with rainfall, low-‐lying areas and areas with poor drainage will be impacted. Other issues identified by stakeholders and staff included earthquake vulnerability of communities and infrastructure and shoreline erosion.
Table 42, below, identifies emerging issues of concern related to coastal hazards, which lack sufficient information to evaluate the level of the potential threat.
Table 42. Emerging Issues of Concern Related to Coastal Hazards Emerging Issue Information Needed
Higher groundwater elevations as sea level rises leading to increased seismic risk, salinity intrusion, and decreased storm/flood capacity.
Detailed study of how an increase in Bay water levels will affect coastal groundwater levels.
In-‐Depth Management Characterization. This section helps determine the effectiveness of
management efforts to address identified problems related to the coastal hazards enhancement objective.
Hazards education and outreach Yes Yes Yes *Building setback restrictions apply only if project requires Bay fill **These management categories are the focus of partner agencies and organizations
Significant Management Changes
Climate Change Policies
• In October 2011, BCDC updated the San Francisco Bay Plan to address climate change (discussed in the Achievements section and Phase I). As part of these amendments, shoreline protection projects, such as levees and seawalls, must be designed to withstand the effects of projected sea level rise and to be integrated with adjacent shoreline protection. Whenever feasible, projects must integrate hard shoreline protection structures with natural features that enhance the Bay ecosystem, e.g., by including marsh or upland vegetation in the design. The policies also promote resilient development, encouraging projects if their regional benefits—such as reducing carbon emissions by locating jobs and housing near public transportation—outweigh the risk from flooding. Projects that do not negatively impact the Bay and do not increase risks to public safety, such as repairs, small and interim projects, and parks, are also encouraged. The Bay Plan amendments also require sea level rise risk assessments when planning shoreline areas or designing larger shoreline projects. If sea level rise and storms that are expected to occur during the life of the project would result in public safety risks, the project must be designed to cope with flood levels expected by mid-‐century. If it is likely that the project will remain in place longer than mid-‐century, the applicant must have a plan to address the flood risks expected at the end of the century. Risk assessments must be based on the best estimates of future sea level rise. These Bay Plan amendments were not funded through Section 309, but will significantly affect how projects in BCDC’s jurisdiction take into account coastal hazards including sea level rise.
45
Sea Level Rise Mapping and Modeling
• As noted in the Phase I Assessment, the Adapting to Rising Tides (ART) Alameda County pilot project and a core partner, the Alameda County Public Works Department, developed locally validated sea level rise inundation maps using the California Coastal LiDAR collection and Bay water levels leveraged from FEMA’s SF Bay study. In addition, detailed shoreline delineation and analyses were conducted to identify the shoreline areas that could overtop as sea levels rise, the inland areas that could be impacted, and the flow paths that could result in flooding of low-‐lying inland areas. The mapping and analysis methodology was based on the NOAA SLR Viewer inundation mapping approach and BCDC received critical technical support and input from NOAA Digital Coast staff to complete these efforts.
• As noted in the Phase I Assessment, BCDC worked with NOAA to launch the NOAA Sea Level Rise Viewer in the Bay Area, and has used this tool in a number of efforts including in an assessment of regional shoreline parks, Sacramento to San Jose intercity passenger rail service, the City of Benicia, and in the regional growth plan, Plan Bay Area. NOAA provided BCDC staff with training on how to use the viewer, and BCDC has shared the tool with numerous stakeholders and provides a link to the viewer on the agency’s website. The Sea Level Rise Viewer can be accessed at: http://coast.noaa.gov/digitalcoast/tools/slr
• BCDC was a member of the steering committee for the development of Our Coast Our Future, a sea level rise planning tool for San Francisco Bay. BCDC also participated in trainings and presentations on the OCOF tool and underlying CosMOS model. Our Coast Our Future can be accessed at: http://data.prbo.org/apps/ocof/
Hazards Education and Outreach
• BCDC provided outreach and education to enable local governments and asset managers to actively plan and respond to current and future flooding impacts around the Bay. The Adapting to Rising Tides (ART) Portfolio, an online toolkit of findings, resources, and how-‐to guides to jump start adaptation planning, is a keystone effort of the ART Program to support those in the region that want to engage in coastal hazards and adaptation planning. In addition, BCDC and the ART Program have developed and presented a variety of workshops to build local government capacity to assess sub-‐regional, city-‐level or asset-‐specific vulnerabilities, create effective local partnerships and adaptation actions, and clearly communicate climate risks and responses. Lastly, the ART Program has been supporting project working group members and partners in communicating to their own stakeholders, including educating local decision-‐makers and the public about sea level rise vulnerabilities, consequences, and the actions that can be taken to improve resilience. These efforts were partially funded through Section 309.
• BCDC partnered with the Association of Bay Area Governments (ABAG) on the Stronger Housing, Safer Communities: Strategies for Seismic and Flood Risks planning effort. As a core project partner, BCDC worked with an advisory committee of hazards, housing and community experts to develop the multi-‐hazard indicators and assessment methodology employed. In addition, the assessment findings (regional and local) were shared with a broader stakeholder working group to obtain their input and expertise, and to solicit their feedback on the development of strategies that would be locally and regionally relevant to address the issues identified.
46
Communication materials were developed for the project to support outreach and education about the risks faced, and to support and encourage local governments and community organizations to engage in coastal hazard planning. Information on the assessment and strategies is available at: http://resilience.abag.ca.gov/projects/stronger_housing_safer_communities_2015/. This project was funded by the USGS, USEPA and the California Strategic Growth Council.
Effectiveness of State Coastal Hazards Management Efforts. BCDC's coastal management program sits within the context of state interest and action on coastal management. The following section describes activities conducted by the state that have the goal of improving statewide coastal management and address coastal hazards. Where information is available that illustrates the effectiveness of these efforts it is provided as well.
Statewide, efforts to improve coastal hazards management are underway but often fragmented. In July 2014, the Little Hoover Commission released a report entitled Governing California Through Climate Change. The report states that:
“California’s formidable track record of overcoming adversity has long included recovering and rebuilding after earthquakes, floods, wildfires and landslides. Indeed, the Governor’s Office of Emergency Services views climate change not as a new and unique hazard on California’s horizon, but as a magnifier of its existing natural hazards. The same standardized Incident Command System that governs current emergency responses with local control and backup from state and federal forces also will confront impacts of climate change. Similarly, state government agencies that routinely oversee issues of protecting natural resources, allocating water, building infrastructure, guarding public health and meeting demands for energy also are individually planning for climate change impacts within their existing practices. Yet during its 10-‐month study process, the Commission learned one thing clearly about California’s readiness for climate change. While the state has broadly and successfully assessed its potential vulnerability and often leads other states in its research, the work of climate adaptation is scattered throughout state government and lacks an organization, a leader and a home. Despite a cross-‐agency Climate Action Team in place within state government and a 2009 California Adaptation Strategy report and its Safeguarding California update being finalized in 2014 by the California Natural Resources Agency, the threads, so to speak, still have not been pulled together in a way that helps people on the ground make decisions.”
Despite the concerns raised by the Little Hoover Commission about the effectiveness of statewide coastal hazards management efforts, state coastal management agencies have made significant progress in this area. The Coastal Climate Action Team (CoCAT) includes the California Coastal Commission, BCDC and the State Coastal Conservancy, along with other state agencies who meet regularly to advance state management of coastal hazards. These three coastal agencies that make up the state’s federal coastal management program were instrumental in forging the agreement between Oregon, Washington and California to commission a study from the National Academy of Sciences (NAS) on sea level rise projections. The NAS study was distilled by the California Ocean Protection Council, under the guidance of the CoCAT, into state guidance on sea level rise projections for agencies to use in
47
addressing rising sea level for planning, permitting and constructing in coastal hazard areas. The State Coastal Leadership Group—the Ocean Protection Council, Coastal Commission, Coastal Conservancy, State Lands Commission, and BCDC—was established to improve information exchange, strengthen partnerships and coordinate efforts among the member agencies, particularly regarding climate change adaptation. The Office of Planning and Research will publish general plan guidelines this summer addressing coastal hazards for local governments to use in updating general plans. Finally, in April 2015, Governor Brown issued an executive order that specifically addresses the need for climate adaptation and directs state government to:
• Incorporate climate change impacts into the state's Five-‐Year Infrastructure Plan;
• Update the Safeguarding California Plan -‐ the state climate adaption strategy -‐ to identify how climate change will affect California infrastructure and industry and what actions the state can take to reduce the risks posed by climate change;
• Factor climate change into state agencies' planning and investment decisions; and
• Implement measures under existing agency and departmental authority to reduce greenhouse gas emissions.
Although additional resources need to be dedicated, California continues to make strides towards resilience, particularly in coastal management.
Identification of Priorities. This section identifies the top three management priorities where there is the greatest opportunity for BCDC to improve its ability to more effectively address the most significant hazard risks. This section also identifies priority needs and information gaps to help address the management priorities.
• Management Priority 1: Planning for the Bay-‐wide impacts of sea level rise and coastal storms.
Description: Addressing anticipated impacts of sea level rise and storms in San Francisco Bay, including anticipated flooding of shoreline communities and disruption to adjacent infrastructure, and wetlands sustainability as sea level rises. There are a number of opportunities for BCDC’s CMP to build on and improve its work to address these issues, including increasing regional coordination, improving regulatory programs, and developing regional planning tools and strategies.
• Management Priority 2: Planning for sub-‐regional and sector-‐specific impacts of sea level rise and coastal storms.
Description: Understanding vulnerabilities of sub-‐regional areas and specific sectors likely to be heavily impacted by sea level rise and coastal storms, and developing or refining adaptation tools and management strategies for these areas and sectors.
• Management Priority 3: Integrated planning for multiple coastal hazards.
Description: In coordination with partners, working to integrate region-‐wide hazard planning efforts to address earthquake vulnerability of communities and infrastructure in conjunction with sea level rise and climate change adaptation.
48
Table 44, below, identifies and briefly explains priority needs and information gaps BCDC’s Coastal Management Program has to help it address the management priorities identified above. The needs and gaps identified here are not limited to those items that will be addressed through a Section 309 strategy but include items that will be part of a strategy.
Table 44. Priority Needs and Information Gaps in Addressing Coastal Hazards Management Priorities
Priority Needs Need? (Y or N) Brief Explanation of Need/Gap
Research Yes
Detailed understanding of risks shoreline communities, Bay resources and infrastructure will face and the adaptation responses that will be most appropriate to reduce vulnerability and improve resilience of Bay resources to climate change at different geographic scales; and Information on groundwater response to sea level rise, including the projected effects of rising groundwater levels on liquefaction, building and infrastructure function, and salinity intrusion.
Mapping/GIS/modeling Yes
Modeling and mapping to increase understanding of impacts of sea level rise and coastal storms, including assets most at risk, specific shoreline vulnerabilities, and how groundwater levels may change as sea level rises.
Data and information management Yes
Data and decision-‐support tools, including geospatial tools, to assist with the development of climate change adaptation plans – both area-‐specific and region-‐wide.
Training/Capacity building Yes
(1) Capacity to develop and implement plans that include multi-‐sector, multi-‐system strategies for climate change adaptation and hazard mitigation; (2) Capacity to develop and implement adaptive management processes that can be applied to climate change adaptation planning; and (3) Capacity for monitoring permitted activities to ensure they are constructed and maintained in a manner consistent with approved permit conditions intended to reduce the risk of coastal hazards.
Decision-‐support tools Yes
(1) Ongoing refinement of the ART Portfolio, which provides a comprehensive planning framework and tools to guide the development and implementation of multi-‐sector, multisystem climate change adaptation plans that consider the Bay’s diverse natural, physical and built shoreline environments; and (2) Addition of new resources to the ART Portfolio that increase the understanding of how social, governmental and legal systems are vulnerable to climate change and the planning and policy actions needed to adapt the Bay and shoreline while balancing all aspects of sustainability: economy, environment, society and equity, and governance.
49
Table 44. Priority Needs and Information Gaps in Addressing Coastal Hazards Management Priorities
Priority Needs Need? (Y or N)
Brief Explanation of Need/Gap
Communication and outreach Yes
(1) Outreach to local governments and the public to increase the understanding of, and capacity to address, sea level rise and other shoreline hazards; and (2) Improve ongoing partnerships with regional entities to coordinate and integrate region-‐wide data and resilience planning.
Policy changes Yes
(1) Consideration of whether new SAPs for specific shoreline areas would be a useful tool to plan for coastal hazards; and (2) Updated existing SAPs to better address coastal hazards including sea level rise and coastal storms.
Enhancement Area Strategy Development. Will BCDC develop one or more strategies for this
enhancement area? Yes X No
Strategies will be developed for the Coastal Hazards enhancement area. Coastal hazards due to sea
level rise and climate change have been identified as one of the most important issues of concern in the San Francisco Bay Area, and were ranked as the top coastal management issue by both stakeholders and BCDC staff. BCDC is well positioned to build on existing efforts – both internally and regionally – to continue and enhance ongoing efforts to understand and address sea level rise and climate change impacts on the San Francisco Bay Area.
50
51
SECTION IV
STRATEGY
The following is a comprehensive, multi-‐year strategy that identifies program changes and implementation activities needed to address enhancement area objectives identified as high priority in the Assessment. The strategy is based on the needs identified in the Assessment and covers the 5-‐year period from fiscal year 2016 to fiscal year 2020. The strategy provides a flexible framework, and includes multiple components that will be scaled to available resources and prioritized for initiation based on agency needs and the ability to leverage other funds to help achieve the strategy outcomes.
STRATEGY 1: Incorporate Best Available Information into Coastal
Wetlands Management, Planning, and Decision-‐Making I. Issue Area(s)
The proposed strategy or implementation activities will support the following high-‐priority enhancement areas (check all that apply):
Aquaculture Cumulative and Secondary Impacts Energy & Government Facility Siting Wetlands Coastal Hazards Marine Debris Ocean/Great Lakes Resources Public Access Special Area Management Planning
II. Strategy Description
A. The proposed strategy will lead to, or implement, the following types of program changes (check all that apply):
A change to coastal zone boundaries; New or revised authorities, including statutes, regulations, enforceable policies, administrative decisions, executive orders, and memoranda of agreement/understanding;
New or revised local coastal programs and implementing ordinances; New or revised coastal land acquisition, management, and restoration programs; New or revised special area management plans (SAMP) or plans for areas of particular concern (APC) including enforceable policies and other necessary implementation mechanisms or criteria and procedures for designating and managing APCs; and,
New or revised guidelines, procedures, and policy documents which are formally adopted by a state or territory and provide specific interpretations of enforceable CZM program policies to applicants, local government, and other agencies that will result in meaningful improvements in coastal resource management.
B. Strategy Goal. The goal of this strategy is to integrate best available science-‐based information and findings into BCDC’s findings and policies as needed to enhance coastal management and planning to advance Bay Area wetland resilience.
52
C. Describe the proposed strategy and how the strategy will lead to and/or implement the program changes selected above. In the past five years, there has been substantial advancement in local and regional knowledge, data and information on the sustainability of Bay Area wetlands in light of accelerating sea level rise and declining sediment supplies. There have also been significant collaborative research efforts on how the Bay Area might best manage wetlands to improve their resilience. This strategy will capitalize on the information developed in these efforts to investigate and implement, where needed, new management and decision-‐making processes that better address both current and future wetlands functions and processes.
Where appropriate, BCDC’s findings and policies will be updated to ensure that emerging wetlands issues related to rising sea level and sediment challenges can be addressed when managing these systems, including innovative nature-‐based solutions and adaptation measures to ensure wetlands can either keep up through accretion or migrate inland. Program changes will address using wetlands to protect the built environment, including in combination with traditional flood protection approaches. Integration of new and best available information into BCDC’s findings, policies and practice will ensure that coastal management planning and permitted activities more effectively address wetland sustainability, and in particular, consider the future implications of climate change on the Bay ecosystem. It will also ensure that wetlands management is better integrated into shoreline resilience planning at all scales—from local to regional.
This strategy will focus on updating the San Francisco Bay Plan findings and policies as well as any guidance documents (new or revised) to reflect new information developed in regionally-‐critical projects, including the recent update to the Baylands Ecosystem Habitat Goals, BCDC’s 309-‐funded Policies for a Rising Bay project, the Commission’s Conceptual Sea Level Rise Adaptation Strategy for the Corte Madera Baylands and Head of Tide Study, and other wetlands resilience and shoreline reconfiguration studies. Policy updates will be undertaken within robust, inclusive public processes that openly address issues in the economic, equity, environmental and governance spheres.
The proposed strategy will help to address the top three management priorities identified in the Phase II Assessment including:
• Incorporate wetlands management decision-‐making into local and regional shoreline resilience planning to ensure natural systems and solutions are integrated into efforts to address sea level rise and storm events.
• Investigating, in collaboration with others, the feasibility and efficacy of wetland adaptation measures, including transition areas for landward migration of wetlands.
• Addressing decreasing sediment supply to wetlands.
III. Needs and Gaps Addressed
The Phase II Assessment identified three key stressors and a number of needs and gaps. One primary concern is how the Bay Area’s wetlands will survive as sea level rises in light of declining sediment supplies that are likely to affect local accretion. In addition, the response of coastal wetlands to higher temperature regimes and changing freshwater inputs is not well understood, yet is likely to impact the sustainability of existing wetlands as well as planned wetland restoration or enhancements.
53
As identified in Table 38 (Phase II Assessment) the proposed strategy will address the priority need to update BCDC’s findings and policies to better consider future conditions in determining how to manage wetlands for climate resilience. This strategy addresses this gap by integrating up-‐to-‐date scientific information, research, and mapping into the Bay Plan findings and policies that are applicable to wetlands, and by supporting the development of guidance for how to consider wetlands sustainability in local and regional shoreline resilience planning.
This strategy will leverage current and ongoing research and mapping efforts that are using collaborative, science-‐based decision-‐making models to understand how Bay Area wetlands will respond to climate change. These include, but are not limited to:
• Baylands Goals Update. As noted in the Achievements section and the Assessment, the update to the Baylands Ecosystem Habitat Goals will be released in 2015, which is the result of a comprehensive regional effort led by the State Coastal Conservancy to build a long-‐term vision for a healthy and sustainable baylands ecosystem. The Update integrates climate change considerations, including rising sea level, and acknowledges that watershed processes are inextricably linked to bayland processes. The Update also renews the region’s consensus that baylands need protection and restoration, and helps ensure that future restoration and enhancement efforts are conceived, planned and implemented in the context of the regional vision for the complex and dynamic estuary and bayland system. The revised goals also provide a preliminary roadmap for improving bayland resilience to rising sea level.
• Regional Sediment Management Strategy. There is increasing scientific evidence demonstrating that bayland health is affected by conditions beyond the immediate shoreline, including the condition of contributing drainage areas (i.e., the local watershed). The potential impacts of watershed condition on bayland health, and the recognition that continued urban development of watersheds is occurring, are two reasons to factor watershed processes into the vision for baylands preservation. Wetland restoration efforts underway across the region may be threatened by changes in local watershed condition, not only from land use and development but also from climate change impacts on fluvial processes (i.e., water and sediment regimes). Watershed processes and their effects on baylands are continuing to be examined in an ongoing, collaborative regional effort, the Regional Sediment Management Strategy. The information and knowledge generated by this effort has been used to incorporate ecosystem processes into the Baylands Goals Update to the greatest extent feasible given the complexity of the undertaking, the quality of available information, and the capability of scientists and managers to link watershed changes and processes to baylands health.
• Policies for a Rising Bay Project. Through the Policies for a Rising Bay Project, noted in the Achievements section and the Assessment, BCDC is undertaking an assessment of how its existing policies regarding Bay fill should be applied to both grey and green shoreline infrastructure solutions proposed to address sea level rise and future storm events. BCDC is also identifying potential policy changes that may be needed to allow Bay fill for resilience projects that would be desirable, but may not be consistent with current policy. The Policies for a Rising Bay Project is being conducted collaboratively with agencies and organizations at local, regional, state and federal levels. This collaborative approach will help ensure broad viewpoints are brought to bear on recommendations to update or revise BCDC’s policies to facilitate ecologically sound shoreline reconfiguration that increases resilience and sustainability of the natural and built environments.
54
IV. Benefits to Coastal Management
It is anticipated that this strategy will result in up-‐to-‐date findings and policies that will better protect and enhance wetlands in light of acceleration of sea level rise and declining sediment supplies, integration of wetlands sustainability into local and regional shoreline resilience planning, and the continued ability to allow reasonable water and shoreline dependent economic growth consistent with Bay protection.
V. Likelihood of Success
This strategy is likely to result in a successful revision to Bay Plan findings and policies and BCDC’s coastal management program because there is consensus in the region that protecting and enhancing wetlands to ensure climate resilience of the Bay’s ecosystem, communities and economy is a desirable objective. While holistic changes in how the Bay Area manages wetlands will ultimately be necessary, BCDC is well positioned to begin advancing policy changes over the next five years. BCDC has a unique role in the region to lead the collaboration and consensus building that will be needed to ensure the continued viability of Bay Area wetlands given climate change and other threats. This strategy is a first step, and BCDC is committed to working with the other agencies in the region that have a role in coastal wetland decision making, local governments and other interested parties to ensure that the region is working together towards wetlands resilience.
VI. Strategy Work Plan
Strategy Goal. Integrate best available science-‐based information and findings into BCDC’s findings and policies and enhance coastal management and planning to ensure Bay Area wetland resilience.
Total Years: 3 Total 309 Budget: $400,000
Year Activities Outcomes 309 Budget Other Funds
FY ‘16
Collaborate with local and regional adaptation planning partners with knowledge and expertise in watershed management, flood protection, habitat restoration, and community planning to: (1) further develop and refine climate change assessments of natural, wetlands shoreline areas; (2) support the development of nature-‐based adaptation solutions; and (3) investigate the feasibility and options for action implementation.
• Updated Adapting to Rising Tides (ART) approach and findings for natural shoreline areas to be included in the ART Portfolio and used in local and regional planning.
• Actionable assessment information for natural shoreline areas.
• Capacity in the region to assess and respond to sea level rise in a manner that builds shoreline resilience and protects both natural and built systems.
$130,000 $25,000
55
Year(s) Activities Outcomes 309 Budget Other Funds
FY ’17
Integrate best available science and information on wetlands sustainability into the Bay Plan by developing a draft background report, working with partners and stakeholders to obtain their review and input, revising the report as necessary, and presenting final recommendation to the Commission for consideration.
• Draft background report with preliminary recommendations for revisions to Bay Plan findings, policies and maps that has received review and input from partner agencies, organizations, stakeholders, and other experts.
$135,000 $25,000
FY ‘18
• Commission consideration of proposed revised Bay Plan findings and policies addressing wetlands management consistent with current McAteer-‐Petris Act authority.
$135,000 $25,000
VII. Fiscal and Technical Needs
A. Fiscal Needs. In addition to 309 funds, the strategy will be supported by State General Funds, and if necessary and available, local, state, federal or private foundation grant funds.
B. Technical Needs. BCDC will continue to work with a broad base of local, regional, state and federal partners to advance this strategy and ensure that changes to the Bay Plan are scientifically sound and based on best available information and knowledge. Over the last 50 years of BCDC’s coastal management work in the region, the agency has fostered numerous partnerships with technical experts and decision makers that will be leveraged to ensure this strategy is successful. This includes local jurisdictions, regional, state, and federal agencies and organizations, academic institutions, the regulated community, private entities, and nonprofit organizations.
STRATEGY 2:
Improve the Region’s Capacity to Understand and Address Current and Future Coastal Hazard Risks
I. Issue Area(s)
The proposed strategy or implementation activities will support the following high-‐priority enhancement areas (check all that apply):
Aquaculture Cumulative and Secondary Impacts Energy & Government Facility Siting Wetlands Coastal Hazards Marine Debris Ocean/Great Lakes Resources Public Access Special Area Management Planning
56
II. Strategy Description
A. The proposed strategy will lead to, or implement, the following types of program changes (check all that apply):
A change to coastal zone boundaries; New or revised authorities, including statutes, regulations, enforceable policies,
administrative decisions, executive orders, and memoranda of agreement/understanding; New or revised local coastal programs and implementing ordinances; New or revised coastal land acquisition, management, and restoration programs; New or revised special area management plans (SAMP) or plans for areas of particular
concern (APC) including enforceable policies and other necessary implementation mechanisms or criteria and procedures for designating and managing APCs; and,
New or revised guidelines, procedures, and policy documents which are formally adopted by a state or territory and provide specific interpretations of enforceable CZM program policies to applicants, local government, and other agencies that will result in meaningful improvements in coastal resource management.
B. Strategy Goal. The goal of this strategy is to improve the region’s capacity to understand and address current and future coastal hazards by incorporating best available information, approaches, and recommendations from current and ongoing hazards and adaptation planning efforts into coastal management planning projects and BCDC findings and policies.
C. Describe the proposed strategy and how the strategy will lead to and/or implement the
program changes selected above. In the past five years the region has made substantial progress on working collaboratively to understand and address current and future coastal hazards. Efforts include revision of the San Francisco Bay Plan to address climate change; completion of the Adapting to Rising Tides (ART) Alameda County project and refined shoreline focus area studies; Stronger Housing, Safer Communities—a regional multi-‐hazard assessment of flood and earthquake risks to housing and communities; and the formation of the Resilient Shoreline Partnership, a collaborative effort among state and regional agencies to work together to integrate resilience planning efforts. These and other planning efforts, either supported or led by BCDC, have generated both processes and findings that can be leveraged to address the coastal hazards priority needs and information gaps identified in the Phase II Assessment.
Climate change has the potential to dramatically alter the Bay Area, in part because critical economic, social, recreational and ecological resources are located along the shoreline in areas that are either currently impacted by coastal hazards or will be impacted in the future. Planning for the unavoidable changes to the Bay and shoreline, including public access areas, from climate change has been, and will continue to be, at the forefront of BCDC’s coastal management efforts.
This strategy would incorporate findings and recommendations from regional adaptation and resilience planning efforts including the Adapting to Rising Tides Program, BCDC’s Policies for a Rising Bay Project, the Resilient Shorelines Partnership, and other relevant regional efforts into BCDC’s coastal management program. This may include revising several Bay Plan findings and policy sections, developing or refining adaptation planning findings, creating process tools and how-‐to guides, and advancing regional collaborative resilience efforts to help to address the top three management priorities identified in the Phase II Assessment including:
57
• Planning for the Bay-‐wide impacts of sea level rise and coastal storms.
• Planning for sub-‐regional and sector-‐specific impacts of sea level rise and coastal storms.
• Integrated planning for multiple coastal hazards.
III. Needs and Gaps Addressed
Sea level rise, coastal storms that result in inland flooding (including coastal influenced riverine flooding and shoreline areas with poor drainage), and increased seismic susceptibility as groundwater levels rise have been identified as high-‐risk coastal hazards in the Assessment portion of this plan. BCDC has been a leader in the region on supporting and leading efforts to understand and address current and future coastal hazards, and was one of the first coastal management agencies. There are, however, significant needs and gaps to be addressed if the region is to become climate resilient. While new research, mapping, modeling, and decision-‐support data, information and tools have become available over the last five years, the needs for these resources and others to support communication, outreach and policy changes continue.
This strategy will help to addresses these gaps by incorporating the most up-‐to-‐date science-‐ and risk-‐based information into BCDC’s Bay Plan findings and policies to improve the region’s capacity to manage current and future coastal hazards as the climate changes in the San Francisco Bay Area. This strategy will also improve coastal management planning by continuing to develop and refine findings, processes, and how-‐to guides to support local and regional climate planning, and by expanding these resources to more fully support integrated multi-‐hazard planning which is needed to ensure the region considers all risks when determining how to adapt and mitigate current and future hazards.
IV. Benefits to Coastal Management
It is anticipated that this strategy will advance the region’s understanding and capacity to address both current and future coastal hazards that result from climate change. This strategy will both build on and improve efforts to promote regional collaboration and coordination on shoreline resilience, integrate adaptation and hazard planning efforts locally and regionally to better understand and address earthquake and flooding impacts on communities and infrastructure, and continue to develop tested assessment and adaptation findings, tools and processes that will lead to improved coastal hazard management.
V. Likelihood of Success
It is likely that this strategy will be successful and result in a program change. The potential impacts from coastal hazards related to climate change will be significant for the region, and the cost of inaction will be high. Over the last five years, representatives from all sectors and at all scales have become engaged in planning for current and future coastal hazards. Local, regional, and state agencies, organizations and jurisdictions are beginning to initiate climate adaptation efforts, and interest continues to grow, particularly for technical support and leadership to assist efforts that are considering sea level rise and coastal flooding.
In addition, as noted in the Accomplishments and Assessment, BCDC’s Adapting to Rising Tides (ART) Program has gained regional recognition for its efforts to increase the Bay Area’s coastal hazard preparedness and resilience. The ART Program is leading and supporting efforts to assess and respond to current and future hazards in a manner that protects ecosystem and community services, encourages local and regional economic sustainability, and promotes social equity. The program continues to develop, test, and refine processes and tools to help the region address sea level rise at scales
58
appropriate for local and regional implementation. Additionally, there are a number of findings from ART Program projects that can inform BCDC’s coastal hazards management planning, including updating Bay Plan findings and policies with information developed both in Alameda County and regionally through coastal engineering and shoreline analyses that better inform an understanding of local, place-‐based risks and potential responses to sea level rise and coastal storms.
Lastly, BCDC’s Policies for a Rising Bay Project is anticipated to result in recommendations for how to improve coastal hazards management and planning, as noted in the Accomplishments and Assessment. In part, the project is assessing BCDC’s policies on fill related to shoreline protection -‐-‐ both structural and green infrastructure -‐-‐ which will be important to support improved decision-‐making that will help ensure sea level rise and future coastal storms are fully considered.
VI. Strategy Work Plan
Strategy Goal. Incorporate best available information, methodologies, and recommendations from current and ongoing hazards and adaptation planning efforts into coastal management planning projects and BCDC findings and policies.
Total Years: 4 Total 309 Budget: $535,000
Year Activities Outcomes 309 Budget Other Funds
FY ‘16
Expand the content, and support the use of, the ART Portfolio – a comprehensive planning framework and tools to guide the development and implementation of multi-‐sector, multisystem climate change adaptation plans that consider the Bay’s diverse natural, physical and built shoreline environments.
• Maintained ART Portfolio that supports and builds capacity for local and regional coastal hazards planning.
• Addition of new resources to the ART Portfolio that increase the region’s understanding of the actions needed to address social, governmental and legal systems vulnerabilities.
• Technical assistance and support to those using the ART Portfolio to improve resilience to coastal hazards.
$130,000 $25,000
FY ’17
Lead collaborative adaptation planning at the sub-‐regional (county-‐scale), local (city-‐scale), focus-‐area (neighborhood) or sector-‐specific scale to improve the region’s understanding of specific vulnerabilities and consequences that different geographies and sectors will have to sea level rise, coastal storms and shoreline seismic hazards. Develop locally and regionally actionable adaptation actions and implementation options for the areas and sectors evaluated.
• Multi-‐hazard, multi-‐sector assessment at one or more geographic scales.
• Increased local and regional capacity to understand and address multiple hazards in an integrated manner.
• Implementable actions to improve coastal resilience, manage current and future coastal hazards, and balance all frames of sustainability in natural and built environments.
$135,000 $50,000
59
Year Activities Outcomes 309 Budget Other Funds
FY ’18
Integrate resilience findings into the Bay Plan to improve coastal hazards management by drafting a background report, obtaining stakeholder review and input, and providing to the Commission for their consideration a recommendation for updating Bay Plan findings and policies.
• Draft background report with preliminary recommendations for integrating the findings of BCDC’s ART Program, Policies for a Rising Bay Project, Stronger Housing, Safer Communities, and other relevant regional resilience-‐focused efforts into the Bay Plan to more effectively address and improve coastal hazards management.
• Review and input on recommendations by partner agencies, organizations and stakeholders and other experts.
$135,000 $25,000
FY ‘19
• Commission consideration of updated Bay Plan findings and policies addressing coastal hazards management consistent with current McAteer-‐Petris Act authority.
$135,000 $100,000
VII. Fiscal and Technical Needs
A. Fiscal Needs. In addition to 309 funds, the strategy will be supported by State General Funds, partner resources, and if necessary and available, local, state, federal or private foundation grant funds.
B. Technical Needs. BCDC will continue to work with a broad base of local, regional, state and federal partners to advance this strategy and ensure that changes to the Bay Plan are scientifically sound and based on best available information and knowledge. Over the last 50 years of BCDC’s coastal management work in the region, the agency has fostered numerous partnerships with technical experts and decision makers that will be leveraged to ensure this strategy is successful. This includes local jurisdictions, regional, state, and federal agencies and organizations, academic institutions, the regulated community, private entities, and nonprofit organizations.
60
STRATEGY 3: Evaluate and Update Special Area and Sector Plans to Incorporate Best Available Information about
Climate Change, Reflect Current Status and Trends, and Address Other Emerging Issues
I. Issue Area(s)
The proposed strategy or implementation activities will support the following high-‐priority enhancement areas (check all that apply):
Aquaculture Cumulative and Secondary Impacts Energy & Government Facility Siting Wetlands Coastal Hazards Marine Debris Ocean/Great Lakes Resources Public Access Special Area Management Planning
II. Strategy Description A. The proposed strategy will lead to, or implement, the following types of program changes (check
all that apply):
A change to coastal zone boundaries; New or revised authorities, including statutes, regulations, enforceable policies,
administrative decisions, executive orders, and memoranda of agreement/understanding; New or revised local coastal programs and implementing ordinances; New or revised coastal land acquisition, management, and restoration programs; New or revised special area management plans (SAMP) or plans for areas of particular
concern (APC) including enforceable policies and other necessary implementation mechanisms or criteria and procedures for designating and managing APCs; and,
New or revised guidelines, procedures, and policy documents which are formally adopted by a state or territory and provide specific interpretations of enforceable CZM program policies to applicants, local government, and other agencies that will result in meaningful improvements in coastal resource management.
B. Strategy Goal. The goal of this strategy is to evaluate, improve, or update BCDC’s existing Special Area Plans (SAPs) and the San Francisco Bay Area Seaport Plan (Seaport Plan) to address climate change, incorporate new information, reconcile overlapping jurisdictions, and improve consistency with the Bay Plan. The strategies included will update SAPs to reflect current knowledge and incorporate where feasible policies that establish a framework for comprehensive detailed planning processes going forward, that could develop detailed strategies, if necessary. In addition, this strategy will investigate the feasibility and practicality of using SAPs as a tool to address emerging wetlands and coastal hazards management issues and to coordinate the management of these issues with local jurisdictions and other authorities.
C. Describe the proposed strategy and how the strategy will lead to and/or implement the program changes selected above. Currently, BCDC has SAPs for six specific areas (Benicia, Richardson’s Bay, South Richmond Shoreline, White Slough, San Francisco Waterfront, and the Suisun Marsh) and a sector plan for Seaports. This strategy will address the need to periodically review and update these plans to improve consistency with the Bay Plan, address emerging issues such as climate change, and incorporate best available information specific to each area. The strategy will also evaluate the use of
61
SAPs as an appropriate tool for future coastal management planning to address climate change and shoreline governance. The evaluation will provide BCDC with a basis for determining, in partnership with local governments and stakeholders, whether to develop alternative shoreline management governance models that consider watersheds and sub-‐ecosystems to help address coastal hazards, wetlands sustainability, and other emerging challenges.
BCDC’s existing SAPs to be evaluated and possibly updated include:
San Francisco Bay Area Seaport Plan. The Seaport Plan is a regionwide plan, developed in
partnership with the Metropolitan Transportation Commission, that guides decision-‐making regarding marine terminals and port priority use designations. The last major plan revision in 2003 incorporated bulk cargo throughput projected through 2020. Since 2003, there have been fairly significant changes in the marine cargo shipping industry, and an increased understanding that future impacts of sea level rise on the seaports should be addressed sooner rather than later. Revision of the Seaport Plan to address climate change vulnerabilities is necessary if the plan is to remain current and act as a functional tool for future planning. As part of this, a revision would take into account the anticipated economic impacts of climate change on port operations, as well as identifying key vulnerabilities to sea level rise. In addition, revision of the Seaport Plan would also address other issues including up-‐to-‐date forecasts for individual cargo modes and modifications, as needed, to port priority use area designations to address changes in global and regional markets and reflect regional needs for marine terminal and related transportation facilities.
Suisun Marsh Planning. The Suisun Marsh is protected through shared authority with local governments and the Delta Stewardship Council. The Suisun Marsh Protection Plan (Marsh Plan), administered by BCDC, protects a primary management area comprised of tidal marsh, managed wetlands, adjacent grasslands, and waterways; while the Local Protection Program (LPP) protects a secondary management area comprised of significant upland buffer lands. Two of the six LPP components are undergoing revision to incorporate current best management practices for plant, fish and wildlife conservation, and to reflect changes in local land use plans and policies. Additionally, duck club management plans, which are included in the Suisun Resource Conservation District’s component of the LPP, are in the process of being updated to improve consistency with state and federal law and to incorporate best management practices to improve resource conservation. Management efforts in the Suisun Marsh are being coordinated with the Delta Stewardship Council, which also has jurisdiction over the Suisun Marsh.
Evaluation of how the Marsh Plan and the LPP could be improved to address climate change impacts
for wetlands may be needed, and could potentially build on the work that is underway. Possible updates might include the incorporation of new information on wetland response to sea level rise into the GIS data under development for duck clubs in Suisun Marsh.
San Francisco Waterfront Special Area Plan. The San Francisco Waterfront Special Area Plan
facilitates maritime, non–maritime, and other commercial and recreational shoreline development along the San Francisco Waterfront. The plan, which was developed cooperatively with the City and County of San Francisco and the Port of San Francisco, does not take coastal hazards such as sea level rise and coastal storms into account, although the San Francisco Waterfront is likely to be heavily impacted. Additionally, the plan does not adequately address a variety of issues currently impacting the land managed by the Port of San Francisco and regulated by the policies of the plan. As described in the Achievements section, BCDC collaborated with the Port of San Francisco on a public process to receive
62
input on issues including fill removal; public access and plazas; changes in land use; and preservation of historic resources and Port facilities. The SAP may be in need of revision to better address these issues, particularly as viewed in the context of sea level rise vulnerabilities that are likely to affect all types of use along the waterfront. To ensure the continued protection and use of the San Francisco Waterfront, the SAP will need to include an assessment of future coastal hazards resulting from climate change, integrate best practices for adaptation and mitigation and lay the groundwork for developing a strategy for long-‐term adaptation and resilience.
The proposed strategy will help to address top management priorities for both Wetlands and
Coastal Hazards identified in the Phase II Assessment including:
• Planning for sub-‐regional and sector-‐specific impacts of sea level rise and coastal storms.
• Incorporate wetlands management decision-‐making into local and regional shoreline resilience planning to ensure natural systems and solutions are integrated into efforts to address sea level rise and storm events.
III. Needs and Gaps Addressed
This strategy addresses the need to ensure SAPs are responsive to climate change considerations and to improve their use as a tool to address coastal management in the San Francisco Bay Area. Evaluation of existing SAPs allows for the identification of gaps and opportunities for improvement, and updating SAPs where needed ensures they reflect current status and trends, address emerging issues, and use best available information. Maintaining up-‐to-‐date SAPs helps to improve the coordination of policy development and land use planning for the Bay and shoreline with actions of local jurisdictions and other authorities.
The Phase II Assessment identified multiple needs and gaps for both the Wetlands and Coastal Hazards enhancement areas. This proposed strategy would address the priority needs identified in Tables 38 and 44 to consider whether new SAPs for specific shoreline areas would be useful tools in planning for coastal hazards and improving wetlands resilience in light of climate change impacts, and to update existing SAPs to better respond to these issues.
IV. Benefits to Coastal Management
It is anticipated that this strategy will result in stronger, more up-‐to-‐date SAPs that will better address wetlands sustainability and sea level rise adaptation as well as other emerging or current issues, improving natural resource protection while allowing reasonable water and shoreline dependent economic growth into the future. The evaluation of existing SAPs will also assess the feasibility and practicality of developing new SAPs to better address climate change impacts, or whether an alternative model should be pursued. This will be important for the development or refinement of future management and governance approaches for improving shoreline resilience and addressing current and future coastal hazards locally and regionally.
V. Likelihood of Success
It is likely that this strategy will successfully result in a program change since it is expected to receive wide support from the local governments and authorities that may be affected by the proposed revisions and updates.
63
VI. Strategy Work Plan
Strategy Goal. Evaluate and update BCDC’s existing Special Area Plans (SAPs) to address climate change, incorporate new information, reconcile overlapping jurisdictions, and improve consistency with the Bay Plan. Investigate the feasibility of developing new or revising existing SAPs as a tool to address emerging wetlands and coastal hazards management issues.
Total Years: 4 Total 309 Budget: $990,000
Year Activities Outcomes 309 Budget
Other Funds
FY ‘17
Evaluate existing SAPs to determine consistency with the Bay Plan, determine if they address climate change, and evaluate if there is new information or overlapping jurisdictions to be reconciled.
• Recommendation for updating BCDC’s SAPs, including the extent of the update needed and the timing for the update to occur.
$130,000 $50,000
FY ‘18
Evaluate the suitability of Special Area Plans as a policy tool and as an alternative shoreline management model for addressing emerging wetlands and coastal management issues.
• Collaborative effort that engages local and regional governments, partner agencies, organizations and stakeholders and other experts to evaluate the use of SAPs as an alternative shoreline management model.
• Draft background report and preliminary recommendations for the use of SAPs to address emerging wetlands and coastal hazards management issues.
$135,000 $100,000
FY ’18 Update Suisun Marsh Protection Plan and Solano County Local Protection Program.
• Draft background report with preliminary recommendations for revisions to findings, policies and map designations that has received review and input from partner agencies, organizations and stakeholders and other experts.
$0 $185,000
FY ‘19
• Commission consideration of final, revised background report, and recommendations to update findings and policies, and map designations for Marsh Plan.
$135,000 $150,000
64
VII. Fiscal and Technical Needs
A. Fiscal Needs. In addition to 309 funds, the strategy will be supported by State General Funds, and if necessary and available, local, state, federal or private foundation grant funds.
B. Technical Needs. BCDC will work with local governments, regional authorities, partner agencies and interested parties to ensure that changes to the SAPs are technically sound and based on best available information and knowledge, and to evaluate the feasibility and practicality of using SAPs to manage shoreline coastal hazards and address current shoreline management governance challenges.
Year Activities Outcomes 309
Budget Other Funds
FY ‘18
Revise San Francisco Waterfront Special Area Plan.
• Draft background report with preliminary recommendations for revisions to findings, policies and map designations that has received review and input from partner agencies, organizations and stakeholders and other experts.
$135,000 $125,000
FY ’19
• Commission consideration of final, revised background report, and recommendations for revision to findings and policies, and map designations for San Francisco Waterfront Plan.
$135,000 $100,000
FY ’18
Revise Seaport Plan.
• Research of sea level rise impacts on marine terminal development and operation, including relevant economic impacts, current cargo forecasts and allocations by port.
$50,000 $0
FY ’19
• Draft background report and preliminary recommendations for revisions to findings and policies, and port priority use area designations that has received review and input from partner agencies, organizations and stakeholders and other experts.
$135,000 $100,000
FY ’20
• Commission consideration of final, revised background report, recommended revised findings and policies, and port priority use area designations.
$135,000 $100,000
65
5-‐Year Budget Summary by Strategy
Strategy Title Activities Outcomes Funding Type
Year 1 Funding (FY ’16)
Year 2 Funding (FY ’17)
Year 3 Funding (FY ’18)
Year 4 Funding (FY ’19)
Year 5 Funding (FY ’20)
Total Funding
Strategy 1: Incorporate Best Available Information into Coastal Wetlands
Management, Planning, and Decision-‐Making
Collaborate with adaptation
planning partners
Updated approach, assessment
information, and capacity for natural shoreline planning
Section 309 $130,000 -‐-‐ -‐-‐ -‐-‐ -‐-‐
$155,000 Other $25,000 -‐-‐ -‐-‐ -‐-‐ -‐-‐
Integrate best available
information on wetlands
sustainability into the Bay Plan
Develop draft background report
Section 309
-‐-‐ $135,000 -‐-‐ -‐-‐ -‐-‐
$320,000 Other -‐-‐ $25,000 -‐-‐ -‐-‐ -‐-‐
Commission consideration of updated Bay Plan
findings and policies
Section 309 -‐-‐ -‐-‐ $135,000 -‐-‐ -‐-‐
Other -‐-‐ -‐-‐ $25,000 -‐-‐ -‐-‐
Strategy 2: Improve the Region’s
Capacity to Understand and Address Current and
Future Coastal Hazard Risks
Expand the ART Portfolio
Maintained ART Portfolio and new
resources
Section 309 $130,000 -‐-‐ -‐-‐ -‐-‐ -‐-‐
$155,000 Other $25,000 -‐-‐ -‐-‐ -‐-‐ -‐-‐
Lead collaborative adaptation planning
Technical assistance, assessment, capacity, and actions to improve
coastal resilience
Section 309
-‐-‐ $135,000 -‐-‐ -‐-‐ -‐-‐ $185,000
Other -‐-‐ $50,000 -‐-‐ -‐-‐ -‐-‐
Integrate resilience findings into the Bay Plan
Develop draft background report
Section 309
-‐-‐ -‐-‐ $135,000 -‐-‐ -‐-‐
$320,000 Other -‐-‐ -‐-‐ $25,000 -‐-‐ -‐-‐
Commission consideration of updated Bay Plan
findings and policies
Section 309
-‐-‐ -‐-‐ -‐-‐ $135,000 -‐-‐
Other -‐-‐ -‐-‐ -‐-‐ $100,000 -‐-‐
66
Strategy Title Activities Outcomes Funding Type
Year 1 Funding (FY ’16)
Year 2 Funding (FY ’17)
Year 3 Funding (FY ’18)
Year 4 Funding (FY ’19)
Year 5 Funding (FY ’20)
Total Funding
Strategy 3: Evaluate and Update Special
Area and Sector Plans to Incorporate Best Available Information about Climate
Change, Reflect Current Status and Trends, and
Address Other Emerging Issues
Evaluate existing SAPs
Recommendation for updating BCDC’s SAPs
Section 309 -‐-‐ $130,000 -‐-‐ -‐-‐ -‐-‐
$180,000 Other -‐-‐ $50,000 -‐-‐ -‐-‐ -‐-‐
Evaluate SAP suitability as a policy tool for alternative shoreline
management models
Collaborative effort and draft background
report on use of SAPs for shoreline management
Section 309 -‐-‐ -‐-‐ $135,000 -‐-‐ -‐-‐
$235,000 Other -‐-‐ -‐-‐ $100,000 -‐-‐ -‐-‐
Update Suisun Marsh Protection Plan and Solano County LPP
Develop draft background report
Section 309 -‐-‐ -‐-‐ $0 -‐-‐ -‐-‐
$470,000 Other -‐-‐ -‐-‐ $185,000 -‐-‐ -‐-‐
Commission consideration of
updated Marsh Plan
Section 309 -‐-‐ -‐-‐ -‐-‐ $135,000 -‐-‐
Other -‐-‐ -‐-‐ -‐-‐ $150,000 -‐-‐
Revise San Francisco
Waterfront SAP
Develop draft background report
Section 309 -‐-‐ -‐-‐ $135,000 -‐-‐ -‐-‐
$495,000
Other -‐-‐ -‐-‐ $125,000 -‐-‐ -‐-‐
Commission consideration of
updated SF Waterfront SAP
Section 309
-‐-‐ -‐-‐ -‐-‐ $135,000 -‐-‐
Other -‐-‐ -‐-‐ -‐-‐ $100,000 -‐-‐
67
Strategy Title Activities Outcomes Funding Type
Year 1 Funding (FY ’16)
Year 2 Funding (FY ’17)
Year 3 Funding (FY ’18)
Year 4 Funding (FY ’19)
Year 5 Funding (FY ’20)
Total Funding
Revise Seaport Plan
Research on SLR impacts on terminal development and
operation
Section 309 -‐-‐ -‐-‐ $50,000 -‐-‐ -‐-‐
$520,000
Other -‐-‐ -‐-‐ $0 -‐-‐ -‐-‐
Develop draft background report
Section 309 -‐-‐ -‐-‐ -‐-‐ $135,000 -‐-‐
Other -‐-‐ -‐-‐ -‐-‐ $100,000 -‐-‐
Commission consideration of
updated Seaport Plan
Section 309 -‐-‐ -‐-‐ -‐-‐ -‐-‐ $135,000
Other -‐-‐ -‐-‐ -‐-‐ -‐-‐ $100,000
Funding by Fiscal Year $310,000 $525,000 $1,050,000 $990,000 $235,000 $3,110,000
68
69
SECTION V
SUMMARY OF STAKEHOLDER AND PUBLIC COMMENT
Stakeholder Outreach. In February 2015, BCDC distributed an online survey to gather stakeholder feedback on enhancement area priorities, the critical problems related to those enhancement areas, and opportunities for improvement of BCDC’s coastal management program. The survey was sent to approximately 500 stakeholders, including individuals that are part of BCDC’s Bay Fill Advisory Group, Long Term Management Strategy for Placement of Dredged Material in the Bay Region (LTMS), Regional Airport Planning Committee, Seaport Planning Advisory Committee, San Francisco Waterfront Working Group, Adapting to Rising Tides Project, and other interested parties. The survey was also sent to BCDC’s Commissioners and Alternates, Design Review Board, and Engineering Criteria Review Board. Additionally, the survey was distributed internally to BCDC staff.
Seventy-‐nine individuals responded to the survey questions regarding sector and enhancement area
priorities. Of those, 67 completed additional questions on critical issues, management challenges, and suggestions for improvement of BCDC’s coastal management program. The stakeholders surveyed represented diverse interests (see Figure 2). In addition, 22 staff members completed the survey. Figure 2. Assessment and Strategy Stakeholder Survey Response by Sector
21%
15%
14% 11%
9%
9%
8%
8% 5%
Survey Response by Sector
State Government
Municipal/City Government
Private Entity
Non-‐Governmental Organization
Federal Government
AfGiliated with BCDC
Regional Agency
Environmental Consultant
Other
70
Enhancement Area Priorities. Generally, survey responses identified a need to focus on Coastal Hazards and Wetlands as high priority enhancement areas (see Figure 3). Coastal Hazards ranked highest, with 73% of stakeholders and 95% of staff identifying this enhancement area as a top priority. Wetlands received similar responses, with 67% of stakeholders and 86% of staff identifying this enhancement area as a priority. Overall, 91% of stakeholders and 95% of staff members chose Coastal Hazards and/or Wetlands as a top priority enhancement area.
Three other enhancement areas received moderate response rates: Cumulative and Secondary
Impacts, Special Area Management Planning, and Public Access. Responses ranged from 27-‐45% of staff members and 41-‐53% of stakeholders identifying each of these enhancement areas as a top priority. The final enhancement area, Marine Debris, was a top priority for only 9% of staff and 25% of stakeholders surveyed. Only the six enhancement areas identified in Figure 3 were surveyed, as these are the most relevant to the Commission’s Coastal Management Program.
Figure 3. Percent of staff and stakeholders identifying each enhancement area as a top priority
Critical Issues
• Wetlands. Stakeholders and staff identified wetlands issues related to climate change as the most critical, and in particular wetland sustainability as sea levels rise and the need for upland transition areas to allow wetlands to migrate inland. The impact of decreasing sediment supply – including the need for beneficial reuse of dredged material – and water quality impacts were identified as secondary concerns.
0%
20%
40%
60%
80%
100%
Wetlands
Coastal Hazards
Cumulative & Secondary
Impacts
Special Area
Managem
ent Planning
Public Access
Marine Debris
Enhancement Area Priorities
Staff (22)
Stakeholders (79)
71
• Coastal Hazards. Generally, staff and stakeholders felt that the most critical issues for coastal hazards were related to climate change, including flooding of communities and infrastructure and wetlands sustainability as sea level rises. Issues regarding shoreline erosion and accretion and shoreline seismic susceptibility were also identified as important, but not as high priority.
• Cumulative and Secondary Impacts. Staff and stakeholders did not identify a clear priority for
Cumulative and Secondary Impacts. A wide variety of issues were identified as important, including concerns about aging public infrastructure, flooding of low-‐lying development, collective impacts of Bay fill, sand mining, maintaining freshwater flows into the Bay, and others.
• Special Area Management Planning. Generally, staff and stakeholders identified as a priority the
need to understand whether Special Area Management Plans could be used to improve shoreline management to address sea level rise as well as specific habitat and wildlife conservation.
• Public Access. Two key issues were identified for public access: public access sustainability as sea
level rises and the diversity of access options. Other issues identified included the need for comprehensive planning of public access improvements and how to best incorporate public access with shoreline adaptation.
• Marine Debris. Stakeholders did not identify a clear priority for marine debris, selecting issues
ranging from removal of derelict vessels to reduction of trash from local watersheds. Responses from BCDC staff were more narrowly focused on removal of derelict vessels and pile-‐supported structures as BCDC has limited jurisdiction over other marine debris issues.
Management Challenges. In general, stakeholders and staff identified funding, regional
coordination, and local capacity for planning and management of climate impacts as the top three management challenges when considering the critical issues above. Broad-‐based permitting and regulatory concerns were also frequently mentioned as an “Other” category response.
Suggested BCDC Improvements. There were a number of areas in which stakeholders and staff felt
BCDC could improve its Coastal Management Program. Generally, these aligned with the top management challenges identified above, including increasing regional coordination on coastal planning and adaptation strategies and working to facilitate funding for planning and response to current and future conditions. Additionally, the improvement of regulatory programs and policies to better address key issues and emerging challenges was strongly identified as a need by staff and stakeholders, as well as coordination with other resource agencies on regulatory and planning issues. Advancing research and providing resources such as tools or trainings were identified as important, but secondary issues.
Public Comments Received. BCDC held a noticed 30-‐day public comment period on the Draft
Assessment and Strategy from May 8 to June 7, 2015. No comments from the public were received on the draft document; comments from the NOAA Office for Coastal Management were incorporated into the Final Assessment and Strategy.