208
Sanitation and Hygiene in Africa: Where do We Stand? Analysis from the AfricaSan Conference, Kigali, Rwanda Edited by Piers Cross and Yolande Coombes

Sanitation and Hygiene in Africa: Where do We Stand?Analysis from the AfricaSan Conference, Kigali, Rwanda
Edited by Piers Cross and Yolande Coombes
The Third African Sanitation and Hygiene Conference was held in Kigali, Rwanda in July 2011. It was hosted by the Government of the Republic of Rwanda, and the African Minister s Council on Water. The meeting attracted extraordinary interest: over 1000 people registered and nearly 900 people attended from a total of 67 countries, including representatives of 42 African countries.
The content of AfricaSan 3 was aligned with the needs of countries as defined in country preparation meetings which took place in advance. AfricaSan 3 looked to address the country needs and to commitments and country action planning. Different groups (ministers, civil society, local government, utilities, and donors) committed to actions to support the goals of AfricaSan. The goal of the AfricaSan process is to support countries to achieve the Millennium Development Goal, (MDG) for sanitation and hygiene.
Sanitation and Hygiene in Africa: Where do We Stand? takes stock of progress made by African countries through the AfricaSan process since 2008 and the progress needed to meet the MDG on sanitation by 2015 and beyond. This book addresses priorities which have been identified by African countries as the key elements which need to be addressed in order to accelerate progress.
•ReviewsprogressonimplementingtheeThekwiniDeclarationtomeettheMDGforsanitationand progress generally in Africa. It analyses what is needed to accelerate the rate of access to sanitation in Africa.
•SharesadvancesintheevidencebaseonsanitationandhygieneinAfricatobeableto assist decision-makers to overcome key blockages in implementing large-scale sanitation and hygiene programs.
•Raisestheprofileofsanitationandhygieneasadeterminantofsustainabledevelopmentinorder to strengthen leadership and advocacy for sustained sanitation and behavior changes.
This book is essential reading for government staff from Ministries responsible for sanitation, sector stakeholders working in NGOs, CSOs and agencies with a focus on sanitation and hygiene and water and Sanitation specialists. It is also suitable for Masters courses in water and sanitation and for researchers and the donor community.
Sanitation and H
ygiene in Africa: W
here do We S
tand?Edited by P
iers Cross and Yolande Coombes
www.iwapublishing.com
ISBN: 9781780405414 (Paperback)ISBN: 9781780405421 (eBook)
Sanitation and Hygiene in Africa: Where do We Stand?Analysis from the AfricaSan Conference, Kigali, RwandaEdited by Piers Cross and Yolande Coombes
Sanitation and Hygiene in Africa_layout_2.0.indd 1 19/09/2013 13:13

Sanitation and Hygiene in Africa

Sanitation and Hygiene in AfricaWhere do We Stand?Analysis from the AfricaSan Conference, Kigali, Rwanda
Edited byPiers Cross and Yolande Coombes

Published by IWA PublishingAlliance House12 Caxton StreetLondon SW1H 0QS, UKTelephone: +44 (0)20 7654 5500Fax: +44 (0)20 7654 5555Email: [email protected]: www.iwapublishing.com
First published 2014© 2014 IWA Publishing
Apart from any fair dealing for the purposes of research or private study, or criticism or review, as permitted under the UK Copyright, Designs andPatents Act (1998), no part of this publicationmay be reproduced, stored or transmitted in any form or by any means, without the prior permission inwriting of the publisher, or, in the case of photographic reproduction, in accordance with the terms of licenses issued by the Copyright LicensingAgency in the UK, or in accordance with the terms of licenses issued by the appropriate reproduction rights organization outside the UK.Enquiries concerning reproduction outside the terms stated here should be sent to IWA Publishing at the address printed above.
The publisher makes no representation, express or implied, with regard to the accuracy of the information contained in this book and cannot acceptany legal responsibility or liability for errors or omissions that may be made.
DisclaimerThe information provided and the opinions given in this publication are not necessarily those of IWA and should not be acted upon withoutindependent consideration and professional advice. IWA and the Author will not accept responsibility for any loss or damage suffered by anyperson acting or refraining from acting upon any material contained in this publication.
British Library Cataloguing in Publication DataA CIP catalogue record for this book is available from the British Library
Library of Congress Cataloging-in-Publication DataA catalog record for this book is available from the Library of Congress
ISBN: 9781780405414 (Paperback)ISBN: 9781780405421 (eBook)
Cover image credits.Front Cover: Top left – © UNICEF/Olivier Asselinm. Top right – © UNICEF/Giacomo Pirozzi.Bottom far left – © Mimi Jenkins. Bottom left - © UNICEF/Christine Nesbitt. Bottom right – Water and Sanitation Program – Africa. Bottom farright – © UNICEF/Christine Nesbitt.Back cover: Left – © UNICEF/Giacomo Pirozzi. Middle © - UNICEF/Giacomo Pirozzi. Right - © Mimi Jenkins

Contents
Foreword . . . . . . . . . . . . . . . . . . . . . . . . . . . . . . . . . . . . . . . . . . . . . . . . . . . . . . . . . . . . . . . . . . . . . . . . . xiii
Overview . . . . . . . . . . . . . . . . . . . . . . . . . . . . . . . . . . . . . . . . . . . 1
Chapter 1AfricaSan: From conference to movement . . . . . . . . . . . . . . . . . . . . . . . . . . . . . . . . . . . . . . . . . . . . 3Piers Cross1.1 Looking Back . . . . . . . . . . . . . . . . . . . . . . . . . . . . . . . . . . . . . . . . . . . . . . . . . . . . . . . . . . . . . . . . . . . . . . . . . . . . . . . 3
1.1.1 Where did the idea of AfricaSan come from? . . . . . . . . . . . . . . . . . . . . . . . . . . . . . . . . . . . . . . . . . . . . . . 31.1.2 What was the vision of the first AfricaSan meeting? . . . . . . . . . . . . . . . . . . . . . . . . . . . . . . . . . . . . . . . . 31.1.3 Regional expansion . . . . . . . . . . . . . . . . . . . . . . . . . . . . . . . . . . . . . . . . . . . . . . . . . . . . . . . . . . . . . . . . . . . . 41.1.4 Who has led the SANs? . . . . . . . . . . . . . . . . . . . . . . . . . . . . . . . . . . . . . . . . . . . . . . . . . . . . . . . . . . . . . . . . 41.1.5 Civil society engagement . . . . . . . . . . . . . . . . . . . . . . . . . . . . . . . . . . . . . . . . . . . . . . . . . . . . . . . . . . . . . . . 51.1.6 What have been the SAN meeting products? . . . . . . . . . . . . . . . . . . . . . . . . . . . . . . . . . . . . . . . . . . . . . . 51.1.7 AfricaSan’s distinctive approaches . . . . . . . . . . . . . . . . . . . . . . . . . . . . . . . . . . . . . . . . . . . . . . . . . . . . . . . 6
1.2 Looking Forward . . . . . . . . . . . . . . . . . . . . . . . . . . . . . . . . . . . . . . . . . . . . . . . . . . . . . . . . . . . . . . . . . . . . . . . . . . . . . 61.3 Recommendations for the Future of AfricaSan . . . . . . . . . . . . . . . . . . . . . . . . . . . . . . . . . . . . . . . . . . . . . . . . . . . 6
Chapter 2Status of sanitation and hygiene in Africa . . . . . . . . . . . . . . . . . . . . . . . . . . . . . . . . . . . . . . . . . . . 11Sophie Hickling2.1 Status Update for Africa . . . . . . . . . . . . . . . . . . . . . . . . . . . . . . . . . . . . . . . . . . . . . . . . . . . . . . . . . . . . . . . . . . . . . 11
2.1.1 Current progress . . . . . . . . . . . . . . . . . . . . . . . . . . . . . . . . . . . . . . . . . . . . . . . . . . . . . . . . . . . . . . . . . . . . . 112.1.2 Open defecation . . . . . . . . . . . . . . . . . . . . . . . . . . . . . . . . . . . . . . . . . . . . . . . . . . . . . . . . . . . . . . . . . . . . . 132.1.3 The equity imperative . . . . . . . . . . . . . . . . . . . . . . . . . . . . . . . . . . . . . . . . . . . . . . . . . . . . . . . . . . . . . . . . . 142.1.4 Aid environment for sanitation . . . . . . . . . . . . . . . . . . . . . . . . . . . . . . . . . . . . . . . . . . . . . . . . . . . . . . . . . . 152.1.5 eThekwini commitments . . . . . . . . . . . . . . . . . . . . . . . . . . . . . . . . . . . . . . . . . . . . . . . . . . . . . . . . . . . . . . . 152.1.6 Sustainable sanitation: The drive to 2015 . . . . . . . . . . . . . . . . . . . . . . . . . . . . . . . . . . . . . . . . . . . . . . . . 16
2.2 Addressing the Sanitation Gap . . . . . . . . . . . . . . . . . . . . . . . . . . . . . . . . . . . . . . . . . . . . . . . . . . . . . . . . . . . . . . . . 162.2.1 Country priorities and actions . . . . . . . . . . . . . . . . . . . . . . . . . . . . . . . . . . . . . . . . . . . . . . . . . . . . . . . . . . 162.2.2 High-level commitments . . . . . . . . . . . . . . . . . . . . . . . . . . . . . . . . . . . . . . . . . . . . . . . . . . . . . . . . . . . . . . . 17

2.3 Conclusions . . . . . . . . . . . . . . . . . . . . . . . . . . . . . . . . . . . . . . . . . . . . . . . . . . . . . . . . . . . . . . . . . . . . . . . . . . . . . . . . 172.4 References . . . . . . . . . . . . . . . . . . . . . . . . . . . . . . . . . . . . . . . . . . . . . . . . . . . . . . . . . . . . . . . . . . . . . . . . . . . . . . . . 17
Understanding the Impacts of Poor Sanitation and Hygiene . . . . . . . . . . . . . . . . 19
Chapter 3Health impacts of sanitation and hygiene. . . . . . . . . . . . . . . . . . . . . . . . . . . . . . . . . . . . . . . . . . . . 21Sandy Cairncross, Oliver Cumming, Lisa Schechtman, Yael Velleman and Hugh Waddington3.1 Introduction . . . . . . . . . . . . . . . . . . . . . . . . . . . . . . . . . . . . . . . . . . . . . . . . . . . . . . . . . . . . . . . . . . . . . . . . . . . . . . . . 213.2 Sanitation and Diarrhoea . . . . . . . . . . . . . . . . . . . . . . . . . . . . . . . . . . . . . . . . . . . . . . . . . . . . . . . . . . . . . . . . . . . . 233.3 The Wider Health Impact of Sanitation . . . . . . . . . . . . . . . . . . . . . . . . . . . . . . . . . . . . . . . . . . . . . . . . . . . . . . . . . 253.4 Conclusion . . . . . . . . . . . . . . . . . . . . . . . . . . . . . . . . . . . . . . . . . . . . . . . . . . . . . . . . . . . . . . . . . . . . . . . . . . . . . . . . . 263.5 References . . . . . . . . . . . . . . . . . . . . . . . . . . . . . . . . . . . . . . . . . . . . . . . . . . . . . . . . . . . . . . . . . . . . . . . . . . . . . . . . 27
Chapter 4Economics of inadequate sanitation in Africa . . . . . . . . . . . . . . . . . . . . . . . . . . . . . . . . . . . . . . . . 29Sophie Hickling and Guy Hutton4.1 Methodology . . . . . . . . . . . . . . . . . . . . . . . . . . . . . . . . . . . . . . . . . . . . . . . . . . . . . . . . . . . . . . . . . . . . . . . . . . . . . . . 294.2 Results . . . . . . . . . . . . . . . . . . . . . . . . . . . . . . . . . . . . . . . . . . . . . . . . . . . . . . . . . . . . . . . . . . . . . . . . . . . . . . . . . . . . 30
4.2.1 Use of study results . . . . . . . . . . . . . . . . . . . . . . . . . . . . . . . . . . . . . . . . . . . . . . . . . . . . . . . . . . . . . . . . . . . 334.3 Next Steps . . . . . . . . . . . . . . . . . . . . . . . . . . . . . . . . . . . . . . . . . . . . . . . . . . . . . . . . . . . . . . . . . . . . . . . . . . . . . . . . . 344.4 References . . . . . . . . . . . . . . . . . . . . . . . . . . . . . . . . . . . . . . . . . . . . . . . . . . . . . . . . . . . . . . . . . . . . . . . . . . . . . . . . 34
Chapter 5Equity and inclusion in sanitation and hygiene in Africa . . . . . . . . . . . . . . . . . . . . . . . . . . . . . . . 35Archana Patkar and Louisa Gosling5.1 The Problem . . . . . . . . . . . . . . . . . . . . . . . . . . . . . . . . . . . . . . . . . . . . . . . . . . . . . . . . . . . . . . . . . . . . . . . . . . . . . . . 355.2 The Way Forward . . . . . . . . . . . . . . . . . . . . . . . . . . . . . . . . . . . . . . . . . . . . . . . . . . . . . . . . . . . . . . . . . . . . . . . . . . . 375.3 Case Studies . . . . . . . . . . . . . . . . . . . . . . . . . . . . . . . . . . . . . . . . . . . . . . . . . . . . . . . . . . . . . . . . . . . . . . . . . . . . . . . 38
5.3.1 Case study 1: Menstrual Hygiene – initiatives in Zimbabwe, Rwanda and other countries . . . . . . . 385.3.2 Case study 2: People living with HIV/Aids . . . . . . . . . . . . . . . . . . . . . . . . . . . . . . . . . . . . . . . . . . . . . . . 385.3.3 Case study 3: Hope out of conflict – How sanitation plays a vital role in protecting
women and children from sexual violence in DRC . . . . . . . . . . . . . . . . . . . . . . . . . . . . . . . . . . . . . . . . . 385.4 Mainstreaming Equity and Inclusion: What have we Learned from Case Studies in Africa . . . . . . . . . . . . . 39
5.4.1 Political commitment . . . . . . . . . . . . . . . . . . . . . . . . . . . . . . . . . . . . . . . . . . . . . . . . . . . . . . . . . . . . . . . . . . 395.4.2 Monitoring . . . . . . . . . . . . . . . . . . . . . . . . . . . . . . . . . . . . . . . . . . . . . . . . . . . . . . . . . . . . . . . . . . . . . . . . . . . 395.4.3 Institutional structure and capacity . . . . . . . . . . . . . . . . . . . . . . . . . . . . . . . . . . . . . . . . . . . . . . . . . . . . . . 395.4.4 Approach to creating demand and scaling up . . . . . . . . . . . . . . . . . . . . . . . . . . . . . . . . . . . . . . . . . . . . . 395.4.5 Technology promotion and supply chain . . . . . . . . . . . . . . . . . . . . . . . . . . . . . . . . . . . . . . . . . . . . . . . . . 405.4.6 Finance and incentives . . . . . . . . . . . . . . . . . . . . . . . . . . . . . . . . . . . . . . . . . . . . . . . . . . . . . . . . . . . . . . . . 40
5.5 Roles and Responsibilities . . . . . . . . . . . . . . . . . . . . . . . . . . . . . . . . . . . . . . . . . . . . . . . . . . . . . . . . . . . . . . . . . . . 405.5.1 None of these steps will be effective or sustainable unless they are driven by committed
leadership at the highest level in each country in Africa and then put into action drawingon our collective strengths . . . . . . . . . . . . . . . . . . . . . . . . . . . . . . . . . . . . . . . . . . . . . . . . . . . . . . . . . . . . . 40
5.5.2 A shared challenge but we have different role and responsibilities . . . . . . . . . . . . . . . . . . . . . . . . . . . 405.6 Recommendations . . . . . . . . . . . . . . . . . . . . . . . . . . . . . . . . . . . . . . . . . . . . . . . . . . . . . . . . . . . . . . . . . . . . . . . . . . 40
5.6.1 Looking at services with an equity lens . . . . . . . . . . . . . . . . . . . . . . . . . . . . . . . . . . . . . . . . . . . . . . . . . . 415.6.2 Applying human rights to sanitation in practice . . . . . . . . . . . . . . . . . . . . . . . . . . . . . . . . . . . . . . . . . . . . 415.6.3 Applying an equity lens to the eThekwini framework . . . . . . . . . . . . . . . . . . . . . . . . . . . . . . . . . . . . . . . 415.6.4 Advocating for an equity approach – key issues for Africa . . . . . . . . . . . . . . . . . . . . . . . . . . . . . . . . . . 41
5.7 References . . . . . . . . . . . . . . . . . . . . . . . . . . . . . . . . . . . . . . . . . . . . . . . . . . . . . . . . . . . . . . . . . . . . . . . . . . . . . . . . 42
Sanitation and Hygiene in Africavi

Understanding Demand and Behaviour Change . . . . . . . . . . . . . . . . . . . . . . . 43
Chapter 6Changing WASH behaviour . . . . . . . . . . . . . . . . . . . . . . . . . . . . . . . . . . . . . . . . . . . . . . . . . . . . . . . 45Robert Aunger, Yolande Coombes, Val Curtis, Hans Mosler and Helen Trevaskis6.1 The Importance of Behaviour in WASH . . . . . . . . . . . . . . . . . . . . . . . . . . . . . . . . . . . . . . . . . . . . . . . . . . . . . . . . 456.2 Key Predictors of Behaviour Change . . . . . . . . . . . . . . . . . . . . . . . . . . . . . . . . . . . . . . . . . . . . . . . . . . . . . . . . . . 456.3 The Intervention Design Process . . . . . . . . . . . . . . . . . . . . . . . . . . . . . . . . . . . . . . . . . . . . . . . . . . . . . . . . . . . . . . 47
6.3.1 Spotlight on formative research . . . . . . . . . . . . . . . . . . . . . . . . . . . . . . . . . . . . . . . . . . . . . . . . . . . . . . . . . 496.3.2 Spotlight on design . . . . . . . . . . . . . . . . . . . . . . . . . . . . . . . . . . . . . . . . . . . . . . . . . . . . . . . . . . . . . . . . . . . 496.3.3 Spotlight on measuring behaviour . . . . . . . . . . . . . . . . . . . . . . . . . . . . . . . . . . . . . . . . . . . . . . . . . . . . . . 50
6.4 What We Still Need to Know . . . . . . . . . . . . . . . . . . . . . . . . . . . . . . . . . . . . . . . . . . . . . . . . . . . . . . . . . . . . . . . . . 506.5 References . . . . . . . . . . . . . . . . . . . . . . . . . . . . . . . . . . . . . . . . . . . . . . . . . . . . . . . . . . . . . . . . . . . . . . . . . . . . . . . . 50
Chapter 7Integrating handwashing into other programs – A strategy for governmentsto reach scale . . . . . . . . . . . . . . . . . . . . . . . . . . . . . . . . . . . . . . . . . . . . . . . . . . . . . . . . . . . . . . . . . . 53Katie Carroll7.1 Why Handwashing with Soap? . . . . . . . . . . . . . . . . . . . . . . . . . . . . . . . . . . . . . . . . . . . . . . . . . . . . . . . . . . . . . . . 537.2 The Challenge of Reaching Scale . . . . . . . . . . . . . . . . . . . . . . . . . . . . . . . . . . . . . . . . . . . . . . . . . . . . . . . . . . . . . 53
7.2.1 The role of government . . . . . . . . . . . . . . . . . . . . . . . . . . . . . . . . . . . . . . . . . . . . . . . . . . . . . . . . . . . . . . . 547.3 Integrating HWWS – Case Studies . . . . . . . . . . . . . . . . . . . . . . . . . . . . . . . . . . . . . . . . . . . . . . . . . . . . . . . . . . . . 54
7.3.1 Case Study 1 – integration with sanitation . . . . . . . . . . . . . . . . . . . . . . . . . . . . . . . . . . . . . . . . . . . . . . . 547.3.2 Case Study 2 – integration with education . . . . . . . . . . . . . . . . . . . . . . . . . . . . . . . . . . . . . . . . . . . . . . . 55
7.4 Measuring Handwashing Behaviour . . . . . . . . . . . . . . . . . . . . . . . . . . . . . . . . . . . . . . . . . . . . . . . . . . . . . . . . . . . 557.5 Summary . . . . . . . . . . . . . . . . . . . . . . . . . . . . . . . . . . . . . . . . . . . . . . . . . . . . . . . . . . . . . . . . . . . . . . . . . . . . . . . . . . 56
Matching Supply and Demand . . . . . . . . . . . . . . . . . . . . . . . . . . . . . . . . . . 57
Chapter 8Moving households up the sanitation ladder through sanitation marketing. . . . . . . . . . . . . . . . 59Jacqueline Devine8.1 What is Sanitation Marketing? . . . . . . . . . . . . . . . . . . . . . . . . . . . . . . . . . . . . . . . . . . . . . . . . . . . . . . . . . . . . . . . . 598.2 Why is Sanitation Marketing Needed? . . . . . . . . . . . . . . . . . . . . . . . . . . . . . . . . . . . . . . . . . . . . . . . . . . . . . . . . . 598.3 What Are The Key Principles Involved? . . . . . . . . . . . . . . . . . . . . . . . . . . . . . . . . . . . . . . . . . . . . . . . . . . . . . . . . 608.4 Emergent Learning . . . . . . . . . . . . . . . . . . . . . . . . . . . . . . . . . . . . . . . . . . . . . . . . . . . . . . . . . . . . . . . . . . . . . . . . . . 608.5 Roles of Various Sectors . . . . . . . . . . . . . . . . . . . . . . . . . . . . . . . . . . . . . . . . . . . . . . . . . . . . . . . . . . . . . . . . . . . . . 638.6 Enabling Further Uptake and Scaling Up of Sanitation Marketing in Africa . . . . . . . . . . . . . . . . . . . . . . . . . . 65
Chapter 9Food security in Sub-Saharan Africa – What could be the contributionof productive sanitation? . . . . . . . . . . . . . . . . . . . . . . . . . . . . . . . . . . . . . . . . . . . . . . . . . . . . . . . . . 67Linus Dagerskog, Peter Morgan, Dave Still, Brenda Ochiro, Nelson Ekane, Lucia Henry andKate Harawa9.1 The Link Between Sanitation and Agriculture . . . . . . . . . . . . . . . . . . . . . . . . . . . . . . . . . . . . . . . . . . . . . . . . . . . 67
9.1.1 Food security and sanitation coverage in SSA . . . . . . . . . . . . . . . . . . . . . . . . . . . . . . . . . . . . . . . . . . . . 679.1.2 Productive/ecological sanitation . . . . . . . . . . . . . . . . . . . . . . . . . . . . . . . . . . . . . . . . . . . . . . . . . . . . . . . . 689.1.3 Soil fertility in SSA and the potential of productive sanitation . . . . . . . . . . . . . . . . . . . . . . . . . . . . . . . . 689.1.4 Relative nutrient quantities – comparing human excreta to chemical fertilizer inputs,
manure and erosion in SSA . . . . . . . . . . . . . . . . . . . . . . . . . . . . . . . . . . . . . . . . . . . . . . . . . . . . . . . . . . . . 69
Contents vii

9.2 Rural and Urban Productive Sanitation in SSA . . . . . . . . . . . . . . . . . . . . . . . . . . . . . . . . . . . . . . . . . . . . . . . . . . 719.2.1 Rural recycling . . . . . . . . . . . . . . . . . . . . . . . . . . . . . . . . . . . . . . . . . . . . . . . . . . . . . . . . . . . . . . . . . . . . . . . 719.2.2 Urban recycling . . . . . . . . . . . . . . . . . . . . . . . . . . . . . . . . . . . . . . . . . . . . . . . . . . . . . . . . . . . . . . . . . . . . . . 72
9.3 Enabling Environment for Ecological Sanitation . . . . . . . . . . . . . . . . . . . . . . . . . . . . . . . . . . . . . . . . . . . . . . . . . 729.3.1 Research . . . . . . . . . . . . . . . . . . . . . . . . . . . . . . . . . . . . . . . . . . . . . . . . . . . . . . . . . . . . . . . . . . . . . . . . . . . 73
9.4 Looking Forward . . . . . . . . . . . . . . . . . . . . . . . . . . . . . . . . . . . . . . . . . . . . . . . . . . . . . . . . . . . . . . . . . . . . . . . . . . . . 739.5 References . . . . . . . . . . . . . . . . . . . . . . . . . . . . . . . . . . . . . . . . . . . . . . . . . . . . . . . . . . . . . . . . . . . . . . . . . . . . . . . . 75
Chapter 10Profitability of private fecal sludge emptying businesses in Africa and Asia . . . . . . . . . . . . . . . 77Doulaye Kone and Sangeeta Chowdhry10.1 The Study . . . . . . . . . . . . . . . . . . . . . . . . . . . . . . . . . . . . . . . . . . . . . . . . . . . . . . . . . . . . . . . . . . . . . . . . . . . . . . . . 7710.2 Key Results . . . . . . . . . . . . . . . . . . . . . . . . . . . . . . . . . . . . . . . . . . . . . . . . . . . . . . . . . . . . . . . . . . . . . . . . . . . . . . . 78
10.2.1 Trucks used for FSM emptying . . . . . . . . . . . . . . . . . . . . . . . . . . . . . . . . . . . . . . . . . . . . . . . . . . . . . . . 7910.2.2 Access to finance . . . . . . . . . . . . . . . . . . . . . . . . . . . . . . . . . . . . . . . . . . . . . . . . . . . . . . . . . . . . . . . . . . 8010.2.3 Financial performance . . . . . . . . . . . . . . . . . . . . . . . . . . . . . . . . . . . . . . . . . . . . . . . . . . . . . . . . . . . . . . 81
10.3 Why is Africa More Expensive? . . . . . . . . . . . . . . . . . . . . . . . . . . . . . . . . . . . . . . . . . . . . . . . . . . . . . . . . . . . . . . 8310.3.1 Profile of profitable FSM businesses . . . . . . . . . . . . . . . . . . . . . . . . . . . . . . . . . . . . . . . . . . . . . . . . . . 8410.3.2 Growing profitable FSM businesses . . . . . . . . . . . . . . . . . . . . . . . . . . . . . . . . . . . . . . . . . . . . . . . . . . . 85
10.4 Conclusions . . . . . . . . . . . . . . . . . . . . . . . . . . . . . . . . . . . . . . . . . . . . . . . . . . . . . . . . . . . . . . . . . . . . . . . . . . . . . . 8610.5 Appendix 1 . . . . . . . . . . . . . . . . . . . . . . . . . . . . . . . . . . . . . . . . . . . . . . . . . . . . . . . . . . . . . . . . . . . . . . . . . . . . . . . 8710.6 References . . . . . . . . . . . . . . . . . . . . . . . . . . . . . . . . . . . . . . . . . . . . . . . . . . . . . . . . . . . . . . . . . . . . . . . . . . . . . . . 88
Chapter 11Advancing health, learning and participation through WASH in schools in Africa . . . . . . . . . . 89Therese Dooley11.1 Introduction to WinS . . . . . . . . . . . . . . . . . . . . . . . . . . . . . . . . . . . . . . . . . . . . . . . . . . . . . . . . . . . . . . . . . . . . . . . . 8911.2 Access to WASH in Schools . . . . . . . . . . . . . . . . . . . . . . . . . . . . . . . . . . . . . . . . . . . . . . . . . . . . . . . . . . . . . . . . . 89
11.2.1 WASH in schools in Africa . . . . . . . . . . . . . . . . . . . . . . . . . . . . . . . . . . . . . . . . . . . . . . . . . . . . . . . . . . . 9011.2.2 WASH in schools is effective in Africa . . . . . . . . . . . . . . . . . . . . . . . . . . . . . . . . . . . . . . . . . . . . . . . . . 9111.2.3 WinS reaches communities across Africa . . . . . . . . . . . . . . . . . . . . . . . . . . . . . . . . . . . . . . . . . . . . . . 92
11.3 Key Actions to Improve WinS . . . . . . . . . . . . . . . . . . . . . . . . . . . . . . . . . . . . . . . . . . . . . . . . . . . . . . . . . . . . . . . . 9211.4 References . . . . . . . . . . . . . . . . . . . . . . . . . . . . . . . . . . . . . . . . . . . . . . . . . . . . . . . . . . . . . . . . . . . . . . . . . . . . . . . 93
Chapter 12Unleash the sanitation marketplace . . . . . . . . . . . . . . . . . . . . . . . . . . . . . . . . . . . . . . . . . . . . . . . . 95Muthi Nhlema, John Sauer, Steve Sugden and Frank Millsopp12.1 The Changing Landscape . . . . . . . . . . . . . . . . . . . . . . . . . . . . . . . . . . . . . . . . . . . . . . . . . . . . . . . . . . . . . . . . . . . 9512.2 Emergence of Market-Based Approaches . . . . . . . . . . . . . . . . . . . . . . . . . . . . . . . . . . . . . . . . . . . . . . . . . . . . . 96
12.2.1 Case study – sanitation marketing failure in Chikhwawa: Were market-basedapproaches followed? . . . . . . . . . . . . . . . . . . . . . . . . . . . . . . . . . . . . . . . . . . . . . . . . . . . . . . . . . . . . . . . 96
12.3 Lessons Learned from the RMA . . . . . . . . . . . . . . . . . . . . . . . . . . . . . . . . . . . . . . . . . . . . . . . . . . . . . . . . . . . . . 9812.3.1 Masons are not entrepreneurs . . . . . . . . . . . . . . . . . . . . . . . . . . . . . . . . . . . . . . . . . . . . . . . . . . . . . . . 9812.3.2 The need to complement household financing . . . . . . . . . . . . . . . . . . . . . . . . . . . . . . . . . . . . . . . . . . 9812.3.3 The market area was limited by the program . . . . . . . . . . . . . . . . . . . . . . . . . . . . . . . . . . . . . . . . . . . 9812.3.4 Previous subsidies hurt the program . . . . . . . . . . . . . . . . . . . . . . . . . . . . . . . . . . . . . . . . . . . . . . . . . . 9912.3.5 Humanure was not a viable payment option . . . . . . . . . . . . . . . . . . . . . . . . . . . . . . . . . . . . . . . . . . . . 9912.3.6 Readjusting the approach . . . . . . . . . . . . . . . . . . . . . . . . . . . . . . . . . . . . . . . . . . . . . . . . . . . . . . . . . . . 99
12.4 Next Generation Market-Based Approaches – Business Development Services . . . . . . . . . . . . . . . . . . . 10012.5 References . . . . . . . . . . . . . . . . . . . . . . . . . . . . . . . . . . . . . . . . . . . . . . . . . . . . . . . . . . . . . . . . . . . . . . . . . . . . . . 101
Sanitation and Hygiene in Africaviii
Putting it all Together . . . . . . . . . . . . . . . . . . . . . . . . . . . . . . . . . . . . . . . 103
Chapter 13Lessons from Rwanda . . . . . . . . . . . . . . . . . . . . . . . . . . . . . . . . . . . . . . . . . . . . . . . . . . . . . . . . . . 105Nitin Jain13.1 Introduction . . . . . . . . . . . . . . . . . . . . . . . . . . . . . . . . . . . . . . . . . . . . . . . . . . . . . . . . . . . . . . . . . . . . . . . . . . . . . . 10513.2 Traditional and Cultural Factors, Historical – 1994 . . . . . . . . . . . . . . . . . . . . . . . . . . . . . . . . . . . . . . . . . . . . . 106
13.2.1 Drawing on traditional factors . . . . . . . . . . . . . . . . . . . . . . . . . . . . . . . . . . . . . . . . . . . . . . . . . . . . . . . 10613.3 Reconstruction and Reconciliation, 1995–2000 . . . . . . . . . . . . . . . . . . . . . . . . . . . . . . . . . . . . . . . . . . . . . . . 106
13.3.1 Housing reconstruction and villagization . . . . . . . . . . . . . . . . . . . . . . . . . . . . . . . . . . . . . . . . . . . . . . 10613.3.2 Land reform . . . . . . . . . . . . . . . . . . . . . . . . . . . . . . . . . . . . . . . . . . . . . . . . . . . . . . . . . . . . . . . . . . . . . . 10613.3.3 Linkages with health sector reform: community health workers . . . . . . . . . . . . . . . . . . . . . . . . . . . 10713.3.4 Shifting from emergency relief to a development path: vision 2020 . . . . . . . . . . . . . . . . . . . . . . . 107
13.4 Consolidating the Strategy, 2001–2005 . . . . . . . . . . . . . . . . . . . . . . . . . . . . . . . . . . . . . . . . . . . . . . . . . . . . . . 10713.4.1 Placing sanitation at the center of poverty reduction strategies . . . . . . . . . . . . . . . . . . . . . . . . . . . 10713.4.2 Increasing productivity because of better health . . . . . . . . . . . . . . . . . . . . . . . . . . . . . . . . . . . . . . . 10813.4.3 Decentralization and donor harmonization . . . . . . . . . . . . . . . . . . . . . . . . . . . . . . . . . . . . . . . . . . . . 108
13.5 2005 –Present: Accelerating Progress . . . . . . . . . . . . . . . . . . . . . . . . . . . . . . . . . . . . . . . . . . . . . . . . . . . . . . . 10813.5.1 Community based health promotion . . . . . . . . . . . . . . . . . . . . . . . . . . . . . . . . . . . . . . . . . . . . . . . . . . 10913.5.2 Strengthening decentralized service delivery . . . . . . . . . . . . . . . . . . . . . . . . . . . . . . . . . . . . . . . . . . 109
13.6 Looking ahead: Evaluating Sector Performance . . . . . . . . . . . . . . . . . . . . . . . . . . . . . . . . . . . . . . . . . . . . . . . 10913.7 Conclusions . . . . . . . . . . . . . . . . . . . . . . . . . . . . . . . . . . . . . . . . . . . . . . . . . . . . . . . . . . . . . . . . . . . . . . . . . . . . . 11013.8 References . . . . . . . . . . . . . . . . . . . . . . . . . . . . . . . . . . . . . . . . . . . . . . . . . . . . . . . . . . . . . . . . . . . . . . . . . . . . . . 111
Chapter 14Sanitation in urban areas . . . . . . . . . . . . . . . . . . . . . . . . . . . . . . . . . . . . . . . . . . . . . . . . . . . . . . . . 113Peter Hawkins, Isabel Blackett, Christiaan Heymans and Jeremy Colin14.1 Scale of the Challenge . . . . . . . . . . . . . . . . . . . . . . . . . . . . . . . . . . . . . . . . . . . . . . . . . . . . . . . . . . . . . . . . . . . . 11314.2 Meeting the Challenge: What we Know . . . . . . . . . . . . . . . . . . . . . . . . . . . . . . . . . . . . . . . . . . . . . . . . . . . . . . 114
14.2.1 Focus on service delivery . . . . . . . . . . . . . . . . . . . . . . . . . . . . . . . . . . . . . . . . . . . . . . . . . . . . . . . . . . 11414.2.2 Existing urban services and infrastructure . . . . . . . . . . . . . . . . . . . . . . . . . . . . . . . . . . . . . . . . . . . . . 11414.2.3 Conceptual frameworks, tools and resources . . . . . . . . . . . . . . . . . . . . . . . . . . . . . . . . . . . . . . . . . . 11514.2.4 Creating an enabling environment . . . . . . . . . . . . . . . . . . . . . . . . . . . . . . . . . . . . . . . . . . . . . . . . . . . 11514.2.5 Infrastructure development . . . . . . . . . . . . . . . . . . . . . . . . . . . . . . . . . . . . . . . . . . . . . . . . . . . . . . . . . 116
14.3 The Way Forward . . . . . . . . . . . . . . . . . . . . . . . . . . . . . . . . . . . . . . . . . . . . . . . . . . . . . . . . . . . . . . . . . . . . . . . . . 11814.3.1 Service delivery framework . . . . . . . . . . . . . . . . . . . . . . . . . . . . . . . . . . . . . . . . . . . . . . . . . . . . . . . . . 11814.3.2 Drivers of change . . . . . . . . . . . . . . . . . . . . . . . . . . . . . . . . . . . . . . . . . . . . . . . . . . . . . . . . . . . . . . . . . 11914.3.3 Key technical challenges . . . . . . . . . . . . . . . . . . . . . . . . . . . . . . . . . . . . . . . . . . . . . . . . . . . . . . . . . . . 12014.3.4 Partnerships . . . . . . . . . . . . . . . . . . . . . . . . . . . . . . . . . . . . . . . . . . . . . . . . . . . . . . . . . . . . . . . . . . . . . . 120
14.4 Some Examples of Successful Interventions . . . . . . . . . . . . . . . . . . . . . . . . . . . . . . . . . . . . . . . . . . . . . . . . . . 12014.4.1 PAQPUD, Dakar . . . . . . . . . . . . . . . . . . . . . . . . . . . . . . . . . . . . . . . . . . . . . . . . . . . . . . . . . . . . . . . . . . 12014.4.2 PSAO, Ouagadougou . . . . . . . . . . . . . . . . . . . . . . . . . . . . . . . . . . . . . . . . . . . . . . . . . . . . . . . . . . . . . . 12214.4.3 Shared and community toilets in Mukuru, Nairobi . . . . . . . . . . . . . . . . . . . . . . . . . . . . . . . . . . . . . . 123
14.5 References . . . . . . . . . . . . . . . . . . . . . . . . . . . . . . . . . . . . . . . . . . . . . . . . . . . . . . . . . . . . . . . . . . . . . . . . . . . . . . 124
Chapter 15What does it take to scale up rural sanitation? . . . . . . . . . . . . . . . . . . . . . . . . . . . . . . . . . . . . . . 125Craig Kullmann and Eddy Perez15.1 Introduction . . . . . . . . . . . . . . . . . . . . . . . . . . . . . . . . . . . . . . . . . . . . . . . . . . . . . . . . . . . . . . . . . . . . . . . . . . . . . . 125
15.1.1 Status and challenges of rural sanitation in Africa . . . . . . . . . . . . . . . . . . . . . . . . . . . . . . . . . . . . . . 125
Contents ix

15.2 What It Takes to Go to Scale . . . . . . . . . . . . . . . . . . . . . . . . . . . . . . . . . . . . . . . . . . . . . . . . . . . . . . . . . . . . . . . 12615.2.1 The enabling environment . . . . . . . . . . . . . . . . . . . . . . . . . . . . . . . . . . . . . . . . . . . . . . . . . . . . . . . . . . 12715.2.2 Country examples of going to scale . . . . . . . . . . . . . . . . . . . . . . . . . . . . . . . . . . . . . . . . . . . . . . . . . . 12815.2.3 Tanzania – at scale rural sanitation programming . . . . . . . . . . . . . . . . . . . . . . . . . . . . . . . . . . . . . . 12815.2.4 Benin – national scale up of rural sanitation . . . . . . . . . . . . . . . . . . . . . . . . . . . . . . . . . . . . . . . . . . . 130
15.3 Conclusions . . . . . . . . . . . . . . . . . . . . . . . . . . . . . . . . . . . . . . . . . . . . . . . . . . . . . . . . . . . . . . . . . . . . . . . . . . . . . 13215.4 What Do We Still Need to Know? . . . . . . . . . . . . . . . . . . . . . . . . . . . . . . . . . . . . . . . . . . . . . . . . . . . . . . . . . . . 13215.5 References . . . . . . . . . . . . . . . . . . . . . . . . . . . . . . . . . . . . . . . . . . . . . . . . . . . . . . . . . . . . . . . . . . . . . . . . . . . . . . 132
Chapter 16CLTS in Africa: Trajectories, challenges and moving to scale . . . . . . . . . . . . . . . . . . . . . . . . . . 133Petra Bongartz16.1 A New Era . . . . . . . . . . . . . . . . . . . . . . . . . . . . . . . . . . . . . . . . . . . . . . . . . . . . . . . . . . . . . . . . . . . . . . . . . . . . . . . 13316.2 What We have Learned: Challenges and Key Elements of Success . . . . . . . . . . . . . . . . . . . . . . . . . . . . . 134
16.2.1 Government leadership . . . . . . . . . . . . . . . . . . . . . . . . . . . . . . . . . . . . . . . . . . . . . . . . . . . . . . . . . . . . 13416.2.2 Networking, partnerships and peer support . . . . . . . . . . . . . . . . . . . . . . . . . . . . . . . . . . . . . . . . . . . 13416.2.3 Supporting champions at all levels . . . . . . . . . . . . . . . . . . . . . . . . . . . . . . . . . . . . . . . . . . . . . . . . . . . 13416.2.4 Follow-up, monitoring, verification and certification . . . . . . . . . . . . . . . . . . . . . . . . . . . . . . . . . . . . . 13516.2.5 Reflection, documentation, sharing and learning, research . . . . . . . . . . . . . . . . . . . . . . . . . . . . . . 135
16.3 Innovations: UCLTS, New Technologies and SLTS . . . . . . . . . . . . . . . . . . . . . . . . . . . . . . . . . . . . . . . . . . . . 13616.3.1 Urban CLTS . . . . . . . . . . . . . . . . . . . . . . . . . . . . . . . . . . . . . . . . . . . . . . . . . . . . . . . . . . . . . . . . . . . . . . 13616.3.2 Technological innovations . . . . . . . . . . . . . . . . . . . . . . . . . . . . . . . . . . . . . . . . . . . . . . . . . . . . . . . . . . 13716.3.3 SLTS . . . . . . . . . . . . . . . . . . . . . . . . . . . . . . . . . . . . . . . . . . . . . . . . . . . . . . . . . . . . . . . . . . . . . . . . . . . . 13916.3.4 Post-emergency/conflict . . . . . . . . . . . . . . . . . . . . . . . . . . . . . . . . . . . . . . . . . . . . . . . . . . . . . . . . . . . 13916.3.5 Beyond ODF . . . . . . . . . . . . . . . . . . . . . . . . . . . . . . . . . . . . . . . . . . . . . . . . . . . . . . . . . . . . . . . . . . . . . 139
16.4 Conclusion: Transforming at Scale . . . . . . . . . . . . . . . . . . . . . . . . . . . . . . . . . . . . . . . . . . . . . . . . . . . . . . . . . . 14016.5 References . . . . . . . . . . . . . . . . . . . . . . . . . . . . . . . . . . . . . . . . . . . . . . . . . . . . . . . . . . . . . . . . . . . . . . . . . . . . . . 141
Chapter 17Sanitation services in towns . . . . . . . . . . . . . . . . . . . . . . . . . . . . . . . . . . . . . . . . . . . . . . . . . . . . . 143Robert Roche and Letitia A Obeng17.1 What is a Town? . . . . . . . . . . . . . . . . . . . . . . . . . . . . . . . . . . . . . . . . . . . . . . . . . . . . . . . . . . . . . . . . . . . . . . . . . . 14317.2 Decentralization and the Implication for Service Delivery in Towns . . . . . . . . . . . . . . . . . . . . . . . . . . . . . . . 14417.3 The Water Supply and Sanitation Link . . . . . . . . . . . . . . . . . . . . . . . . . . . . . . . . . . . . . . . . . . . . . . . . . . . . . . . 14517.4 Strategic Planning for Sanitation in Towns . . . . . . . . . . . . . . . . . . . . . . . . . . . . . . . . . . . . . . . . . . . . . . . . . . . . 14717.5 Evolving Considerations for Towns . . . . . . . . . . . . . . . . . . . . . . . . . . . . . . . . . . . . . . . . . . . . . . . . . . . . . . . . . . 14817.6 Summary and Conclusions . . . . . . . . . . . . . . . . . . . . . . . . . . . . . . . . . . . . . . . . . . . . . . . . . . . . . . . . . . . . . . . . . 14817.7 References . . . . . . . . . . . . . . . . . . . . . . . . . . . . . . . . . . . . . . . . . . . . . . . . . . . . . . . . . . . . . . . . . . . . . . . . . . . . . . 149
Sector Management and Financing . . . . . . . . . . . . . . . . . . . . . . . . . . . . . . . 151
Chapter 18eThekwini commitments monitoring and national sanitation action plans . . . . . . . . . . . . . . . . 153Sophie Hickling and Yolande Coombes18.1 The eThekwini Commitments on Sanitation . . . . . . . . . . . . . . . . . . . . . . . . . . . . . . . . . . . . . . . . . . . . . . . . . . . 15318.2 From Commitments to Action . . . . . . . . . . . . . . . . . . . . . . . . . . . . . . . . . . . . . . . . . . . . . . . . . . . . . . . . . . . . . . . 15418.3 Monitoring the eThekwini Commitments . . . . . . . . . . . . . . . . . . . . . . . . . . . . . . . . . . . . . . . . . . . . . . . . . . . . . . 15618.4 AfricaSan3 Ministers Statement and Implications . . . . . . . . . . . . . . . . . . . . . . . . . . . . . . . . . . . . . . . . . . . . . . 15618.5 References . . . . . . . . . . . . . . . . . . . . . . . . . . . . . . . . . . . . . . . . . . . . . . . . . . . . . . . . . . . . . . . . . . . . . . . . . . . . . . 157
Sanitation and Hygiene in Africax

Chapter 19Sustainable financing . . . . . . . . . . . . . . . . . . . . . . . . . . . . . . . . . . . . . . . . . . . . . . . . . . . . . . . . . . . 159Catarina Fonseca, Kwabena Nyarko, André Uandela and Guy Norman19.1 The Challenge . . . . . . . . . . . . . . . . . . . . . . . . . . . . . . . . . . . . . . . . . . . . . . . . . . . . . . . . . . . . . . . . . . . . . . . . . . . 15919.2 What Needs to be Financed? . . . . . . . . . . . . . . . . . . . . . . . . . . . . . . . . . . . . . . . . . . . . . . . . . . . . . . . . . . . . . . . 16019.3 What is Being Financed by Whom? . . . . . . . . . . . . . . . . . . . . . . . . . . . . . . . . . . . . . . . . . . . . . . . . . . . . . . . . . 16219.4 How to Meet the Financing Gap? . . . . . . . . . . . . . . . . . . . . . . . . . . . . . . . . . . . . . . . . . . . . . . . . . . . . . . . . . . . 16219.5 Looking Forward . . . . . . . . . . . . . . . . . . . . . . . . . . . . . . . . . . . . . . . . . . . . . . . . . . . . . . . . . . . . . . . . . . . . . . . . . . 16319.6 References . . . . . . . . . . . . . . . . . . . . . . . . . . . . . . . . . . . . . . . . . . . . . . . . . . . . . . . . . . . . . . . . . . . . . . . . . . . . . . 164
Chapter 20Monitoring sanitation in Africa Ongoing initiatives and lessons from the field . . . . . . . . . . . . 165Abdou-Salam Savadogo20.1 The African Region: Long Road to the Sanitation MDG . . . . . . . . . . . . . . . . . . . . . . . . . . . . . . . . . . . . . . . . 16520.2 Reconciling JMP and Country Sanitation Coverage Data . . . . . . . . . . . . . . . . . . . . . . . . . . . . . . . . . . . . . . . 16520.3 Country Monitoring Capacities are Weak . . . . . . . . . . . . . . . . . . . . . . . . . . . . . . . . . . . . . . . . . . . . . . . . . . . . . 16620.4 Sub-National Monitoring and the Challenge of National Alignment . . . . . . . . . . . . . . . . . . . . . . . . . . . . . . . 16620.5 The Enabling Environment Matters . . . . . . . . . . . . . . . . . . . . . . . . . . . . . . . . . . . . . . . . . . . . . . . . . . . . . . . . . . 167
20.5.1 The UN-Water Global Analysis and Assessment of Sanitation andDrinking-Water (GLAAS) . . . . . . . . . . . . . . . . . . . . . . . . . . . . . . . . . . . . . . . . . . . . . . . . . . . . . . . . . . . 167
20.5.2 The AMCOW country status overview (CSO) . . . . . . . . . . . . . . . . . . . . . . . . . . . . . . . . . . . . . . . . . . 16820.6 Monitoring eThekwini Commitments . . . . . . . . . . . . . . . . . . . . . . . . . . . . . . . . . . . . . . . . . . . . . . . . . . . . . . . . . 16820.7 Ways Forward Monitoring Sanitation and Hygiene in Africa . . . . . . . . . . . . . . . . . . . . . . . . . . . . . . . . . . . . . 169
20.7.1 Global initiatives . . . . . . . . . . . . . . . . . . . . . . . . . . . . . . . . . . . . . . . . . . . . . . . . . . . . . . . . . . . . . . . . . . 16920.7.2 Regional and national initiatives . . . . . . . . . . . . . . . . . . . . . . . . . . . . . . . . . . . . . . . . . . . . . . . . . . . . . 169
20.8 References . . . . . . . . . . . . . . . . . . . . . . . . . . . . . . . . . . . . . . . . . . . . . . . . . . . . . . . . . . . . . . . . . . . . . . . . . . . . . . 170
Chapter 21Capacity building. . . . . . . . . . . . . . . . . . . . . . . . . . . . . . . . . . . . . . . . . . . . . . . . . . . . . . . . . . . . . . . 171Sophie Hickling21.1 Introduction . . . . . . . . . . . . . . . . . . . . . . . . . . . . . . . . . . . . . . . . . . . . . . . . . . . . . . . . . . . . . . . . . . . . . . . . . . . . . . 17121.2 The Capacity Building Challenge . . . . . . . . . . . . . . . . . . . . . . . . . . . . . . . . . . . . . . . . . . . . . . . . . . . . . . . . . . . . 17121.3 Sanitation Capacity Building as a Priority in Africa . . . . . . . . . . . . . . . . . . . . . . . . . . . . . . . . . . . . . . . . . . . . . 17221.4 Action for Capacity Building . . . . . . . . . . . . . . . . . . . . . . . . . . . . . . . . . . . . . . . . . . . . . . . . . . . . . . . . . . . . . . . . 17221.5 Focus for the Future . . . . . . . . . . . . . . . . . . . . . . . . . . . . . . . . . . . . . . . . . . . . . . . . . . . . . . . . . . . . . . . . . . . . . . 17421.6 References . . . . . . . . . . . . . . . . . . . . . . . . . . . . . . . . . . . . . . . . . . . . . . . . . . . . . . . . . . . . . . . . . . . . . . . . . . . . . . 175
Chapter 22Making the case for sanitation and hygiene . . . . . . . . . . . . . . . . . . . . . . . . . . . . . . . . . . . . . . . . . 177Saskia Castelein and Amanda Marlin22.1 Wanted: Leadership for Sanitation and Hygiene . . . . . . . . . . . . . . . . . . . . . . . . . . . . . . . . . . . . . . . . . . . . . . . 17722.2 New Materials and New Ways of Working Together . . . . . . . . . . . . . . . . . . . . . . . . . . . . . . . . . . . . . . . . . . . . 177
22.2.1 New advocacy materials using economic arguments . . . . . . . . . . . . . . . . . . . . . . . . . . . . . . . . . . . 17722.2.2 New global platforms . . . . . . . . . . . . . . . . . . . . . . . . . . . . . . . . . . . . . . . . . . . . . . . . . . . . . . . . . . . . . . 17822.2.3 Sanitation and Water for All . . . . . . . . . . . . . . . . . . . . . . . . . . . . . . . . . . . . . . . . . . . . . . . . . . . . . . . . . 17822.2.4 Drive to 2015 . . . . . . . . . . . . . . . . . . . . . . . . . . . . . . . . . . . . . . . . . . . . . . . . . . . . . . . . . . . . . . . . . . . . . 17922.2.5 Civil society – a growing voice within the Regional Sanitation movement . . . . . . . . . . . . . . . . . . 179
22.3 What Next for WASH Advocacy? . . . . . . . . . . . . . . . . . . . . . . . . . . . . . . . . . . . . . . . . . . . . . . . . . . . . . . . . . . . 17922.4 References . . . . . . . . . . . . . . . . . . . . . . . . . . . . . . . . . . . . . . . . . . . . . . . . . . . . . . . . . . . . . . . . . . . . . . . . . . . . . . 181
Contents xi

Looking Ahead . . . . . . . . . . . . . . . . . . . . . . . . . . . . . . . . . . . . . . . . . . . 183
Chapter 23Conclusions . . . . . . . . . . . . . . . . . . . . . . . . . . . . . . . . . . . . . . . . . . . . . . . . . . . . . . . . . . . . . . . . . . . 185Yolande Coombes23.1 An AfricaSan Book . . . . . . . . . . . . . . . . . . . . . . . . . . . . . . . . . . . . . . . . . . . . . . . . . . . . . . . . . . . . . . . . . . . . . . . . 18523.2 What Have We Learned? . . . . . . . . . . . . . . . . . . . . . . . . . . . . . . . . . . . . . . . . . . . . . . . . . . . . . . . . . . . . . . . . . . 185
23.2.1 Impacts of poor sanitation . . . . . . . . . . . . . . . . . . . . . . . . . . . . . . . . . . . . . . . . . . . . . . . . . . . . . . . . . . 18523.2.2 Behaviours and market-based approaches to tackle hygiene and sanitation . . . . . . . . . . . . . . . 18623.2.3 Specific Settings . . . . . . . . . . . . . . . . . . . . . . . . . . . . . . . . . . . . . . . . . . . . . . . . . . . . . . . . . . . . . . . . . . 18623.2.4 Core country priority themes . . . . . . . . . . . . . . . . . . . . . . . . . . . . . . . . . . . . . . . . . . . . . . . . . . . . . . . . 186
23.3 Where are We Now? . . . . . . . . . . . . . . . . . . . . . . . . . . . . . . . . . . . . . . . . . . . . . . . . . . . . . . . . . . . . . . . . . . . . . . 18723.4 After the MDGs – Post 2015 targets . . . . . . . . . . . . . . . . . . . . . . . . . . . . . . . . . . . . . . . . . . . . . . . . . . . . . . . . . 189
23.4.1 The Post 2015 Targets for WASH . . . . . . . . . . . . . . . . . . . . . . . . . . . . . . . . . . . . . . . . . . . . . . . . . . . . 18923.4.2 Indicators for the targets include . . . . . . . . . . . . . . . . . . . . . . . . . . . . . . . . . . . . . . . . . . . . . . . . . . . . . 18923.4.3 Sanitation and Hygiene (household/population) sub-targets and indicators . . . . . . . . . . . . . . . . 189
23.5 Looking Ahead . . . . . . . . . . . . . . . . . . . . . . . . . . . . . . . . . . . . . . . . . . . . . . . . . . . . . . . . . . . . . . . . . . . . . . . . . . . 190
Sanitation and Hygiene in Africaxii

Foreword
Ministers responsible for water in 41 African countries met in Abuja, Nigeria, in April 2002, and decided to form AMCOW topromote cooperation, security, socioeconomic development and poverty eradication through the management of water resourcesand the provision of water supply and sanitation services.
Since its inception in 2002 the African Ministers Council on Water (AMCOW) has strived to strengthen intergovernmentalco-operation in order to halt and reverse the water crisis and sanitation problems in Africa. For sanitation, one of the key waysAMCOW has achieved this is through an ‘AfricaSan dialogue’, which since 2002 has become a movement for change andprogress in sanitation and hygiene in Africa.
Through the pan-Africa and regional AfricaSan conferences, AMCOW has been able to facilitate the sharing and adoption ofbest practices in sanitation service development, as well as rewarding success. The AMCOW AfricaSan Awards for sanitationand hygiene were formally launched during the 2nd AfricaSan Conference in 2008. The awards are dedicated to recognizingoutstanding efforts and achievements in sanitation and hygiene in Africa which result in large-scale, sustainable behaviourchanges and tangible impacts.
Also in 2008, AMCOW led the development of the eThekwini commitments. A set of specific commitments, formed duringthe International Year of Sanitation to get Africa back on track to meet the MDGs. Since then, AMCOW has monitored progresstowards these commitments, which is another key element of AMCOWs remit.
The Third Africa Conference on Sanitation and Hygiene (AfricaSan 3) was held from July 19th–21st, 2011 in Kigali,Rwanda. The Government of Rwanda and AMCOW hosted the event which brought together nearly 900 participants fromgovernments, multilateral agencies, development banks, local and international civil society organizations, youth groups,gender interest groups, utilities, local governments and universities from 67 countries.
The conference featured a political dialogue amongst 23 Ministers responsible for sanitation and the launch of theUNSGAB 5-year Drive for Sustainable Sanitation in Africa. Ministers reviewed progress against the 2008 eThekwiniAfricaSan declaration and produced a Kigali Ministerial Statement on Sanitation and Hygiene. Forums for leaders ofutilities, local government and civil society also produced commitments to strengthen performance and impact. A rich arrayof technical sessions was organized on topics prioritized in country preparation meetings held in 37 African countries priorto the conference.
AMCOW felt that documenting these technical papers would bring the knowledge to a wider audience and present a body ofknowledge against which to measure progress in future AfricaSan events. This book presents in depth, much of the learning andknowledge generated at AfricaSan 3. It is a great pleasure to extend our thanks to the agencies (in particular WSP for organizingthis publication) and to the individual authors for taking the time to develop their presentations into chapters. By taking stock of

progress and identifying technical assistance that countries need, we have been able significantly to improve the sanitation statusin Africa. There is a great deal still to do and this book testifies that whilst there is no room for complacency, there is much reasonfor optimism. We hope that this book will be a useful aid to countries in the final push towards achieving the eThekwinicommitments and the Sanitation MDG.
Bai-Mass TaalExecutive Director
African Ministers Council on Water
Sanitation and Hygiene in Africaxiv

Overview


Chapter 1
AfricaSan: From conference to movement1
Piers CrossConference Director
The Third Africa Conference on Sanitation and Hygiene (AfricaSan 3) was held from July 19th–21st, 2011 in Kigali,Rwanda. The Government of Rwanda and the African Ministers’ Council on Water (AMCOW) hosted the event whichbrought together nearly 900 participants from governments, multilateral agencies, development banks, local andinternational civil society organizations, youth groups, gender interest groups, utilities, local governments anduniversities from 67 countries. The conference featured a political dialogue amongst 23 Ministers responsible forsanitation and the launch of the 5-year Drive for Sustainable Sanitation in Africa.
The concept of AfricaSan is to generate political momentum for sanitation and hygiene as well as provide a pan-Africanforum to show-case best practices and support problem-solving. The opening chapter to this book on AfricaSan 3 explores theorigin of the AfricaSan conferences, charts their growth and looks at how they might evolve for the future including thepotential for progression into a social movement. This paper was developed from a review of all the regional sanitationconferences, including AfricaSan.
1.1 LOOKING BACK1.1.1 Where did the idea of AfricaSan come from?The idea of organizing Regional Sanitation Conferences (SAN) was a joint initiative of the management of theWater Supply andSanitation Collaborative Council (WSSCC) and the Water and Sanitation Program (WSP) for Africa in late 2001. Ahead of theWorld Summit on Sustainable Development (WSSD) to be held in 2002, the Executive Director of WSSCC and the PrincipalRegional Team Leader of WSP-Africa met with Minister Ronnie Kasrils, Minister of Water and Forestry in the South Africa, todiscuss how to build political momentum for the neglected topic of sanitation in Africa. This meeting led to the first AfricaSanconference, hosted in Johannesburg in June 2002. One hundred and fifty decision-makers and sanitation experts (including 11Ministers) attended the first AfricaSan meeting. Its main achievement was that it contributed to building political momentumfor the World Summit on Sustainable Development (and subsequently the UN) to adopt a specific MDG target on sanitation.
1.1.2 What was the vision of the first AfricaSan meeting?The vision of the first AfricaSan meeting was: (i) to provide a platform specifically for sanitation leaders in developingcountries – since there was no other; (ii) to generate political momentum for sanitation; and (iii) to provide a forum fortechnical discussion to show-case best practices and support problem-solving.
From the outset, AfricaSan recognized that a blend of political support, technical advance and knowledge exchange wasneeded to develop momentum for sanitation. The vision was that Governments should lead sanitation improvement, whilstengaging the private sector, civil society, consumer/community bodies, the research community, finance institutions anddevelopment agencies. AfricaSan was never meant to be purely technical exchanges between practitioners. They recognized
1This chapter is based on ‘A Synthesis of Regional Assessments’ a paper commissioned by WSSCC for the Global Sanitation Forum in 2012.

that to reach the goal of safe, sustainable sanitation services for all, broad dialogue should accommodate the diversity ofapproaches needed to resolve sanitation problems.
AfricaSan obtained political leadership with the formation of the African Minister’s Council on Water in 2002, now aspecialized technical committee of the AU on water and sanitation. In 2008, AMCOW set up an AfricaSan Task Force tomanage the AfricaSan process, drawing membership from support agencies and civil society organizations.
1.1.3 Regional expansionFrom this start in Africa, the concept was quickly taken up in other regions, beginning in South Asia. Table 1.1 shows the growthof the SAN movement, across regions. Sanitation leaders from about 80 developing countries have participated in this globaldialogue. The SAN process gained most traction in Africa and South Asia, the regions of the world with the greatestsanitation challenges. AfricaSan has established a 3–5 year meeting frequency. In 2004, 2005, 2010 and 2012 sub-regionalAfricaSan events were held. In South Asia SACOSAN has a consistent track record of meetings every couple of years andhas consistently attracted over 500 participants, except at SACOSAN II, a huge event in Delhi with 1600 participants andhigh-level political participation. South Asia has consistently attracted a strong civil society attendance. East Asia and LatinAmerica have established a 3-year cycle. Civil society organizations in the newly emergent countries of Central Europe havebeen building momentum to host their own regional SAN dialogue.
1.1.4 Who has led the SANs?From the outset governments, with the participation of Ministers responsible for sanitation, have led the SANs. The SANshave attracted increasingly high-level political interest. The early meetings were led by visionary Ministers. In Africa, thecreation of AMCOW gave AfricaSan an organized political leadership and the organizational capacity from the AMCOWSecretariat. To retain the engagement of support agencies the AMCOW Secretariat created a Sanitation Task Force whichamongst its responsibilities was the organization of AfricaSan activities.
SAN leadership has been at an increasingly high level. The President of Sri Lanka opened SACOSAN IV and the President ofRwanda addressed AFRICASAN 3. Senior international agency leadership has generally matched local leadership: the Chair ofUNSGAB, HRH Prince Willem Alexander of Orange, has consistently supported the movement. Regional governmental
Table 1.1 Regional SAN Meetings Held from 2002 to 2012.
Year Africa South Asia East Asia Latin America
2002 AfricaSan 1, Johannesburg, 150/112
2003 SACOSAN I,Dhaka, 500/8
2004 AfricaSan South, Gaborone
2005 AfricaSan East, Addis AbabaAfricaSan West, Ouagadougou
2006 SACOSAN II,Islamabad, 550/7
2007 EASAN-1,Beppu, 135/15
LATINOSAN 1,Cali, 900/22
2008 AfricaSan+ 5, Durban, 800/23 SACOSAN III,Delhi, 1600/6
2009
2010 AfricaSan East, Kampala SACOSAN IV,Colombo, 500/7
EASAN-2,Manila, 160/13
LATINOSAN 2,Foz de Igaucu, notknown/22
2011 AfricaSan 3, Kigali, 900/38
2012 AfricaSan East, Addis Ababa
2Number of participants/number of regional countries represented.
Sanitation and Hygiene in Africa4

authorities, are playing an increasing role in the regional SAN dialogues. Leading international agencies working in sanitation: inparticular: IWA, UNICEF, UNSGAB, Water Aid, WHO, World Bank, WSP and WSSCC have played strong support roles inrealizing SAN meetings, including support for the preparatory process and financing of participants to attend. Whilst someorganizations have made greater contributions in different regions, it has been no accident that the four regions to haveconsistently delivered SAN meetings have been the regions where WSP and UNICEF have regional programs and full-timecountry staff in place. Donor agencies and development banks including the ADB, AfDB, Aus Aid, BMGF, DFID, IDB,SIDA and the World Bank have given generous support to the SANs. Governments have also made significant financialcontributions to hosting SAN meetings. The research community has also increased its engagement in SANs.
1.1.5 Civil society engagementThe participation of civil society organizations (CSO) has been strong and critical to the growth of the SANs, Overall, CSOengagement has been both strategic and opportunistic: levels of engagement sometimes being limited by the hostingarrangements. The emergence of CSO WASH networks helped to mobilize and articulate a civil society perspective. AtSACOSAN I, a session for grassroots people to share their experiences, chaired by a minister, was included in the formalprogramme and a CSO rep was invited to give an address in the inaugural session. FANSA, WSSCC and WaterAid joinedforces well in advance of SACOSAN IV to bring in the voices of CSOs that contributed to the final outcome. The idea of apre-meeting, held well in advance, to provide a strategic space for community leaders and NGOs to review governmentcommitments, and agree on issues that should be highlighted, has added to the quality of the dialogue. In Africa ANEW (theCSO African Network) gave key-note addresses in plenary sessions at AFRICASANs in Durban and Kigali, but were lessengaged in a preparatory process than the CSOs in South Asia. In transitional states in Central/Eastern Europe and CentralAsia civil society started the regional dialogue. EASAN and LATINOSAN have offered fewer opportunities for large-scaleCSO engagement.
1.1.6 What have been the SAN meeting products?SAN products have focused on regional and country political commitments and knowledge exchange: the eThekwini(AfricaSan+ 5) and Cali declarations (LATINOSAN 1) are examples of political commitments endorsed by a range ofcountry Ministers. Since the eThekwini Declaration, there has been an attempt to make commitments easily measurable andtrackable. SAN meetings have sought to achieve binding resolutions, which are followed up in post meeting actions.Leading up to AfricaSan 3, 38 countries analyzed progress against the eThekwini declaration score, the Country StatusOverview scorecard and undertook a multi-stakeholder dialogue to identify priority areas for action.
Learning products have ranged widely according to current demands and concerns. Significant focus has been given toservices targeted towards the poor. In Africa the launch of the AfricaSan awards has tried to stimulate a continuousstream of innovation by different stakeholders. In South Asia there has been a focus on lessons from large-scale CLTSapproaches. Financing is a theme that has attracted increasing attention, such as in LATINOSAN 2. The documentationof success stories, for example on the experience of Rwanda, Thailand and Malaysia and the achievements of CLTS, hasbeen a source of inspiration to many and given confidence that sanitation problems can be addressed. SANs havestimulated UNICEF and WHO to produce attractive and easy to read regional snapshots that summarize the status and theevidence behind key sector challenges. A clear understanding of regional status and challenges has improved the qualityof SAN dialogue.
Regional commitments may help frame solutions, but sanitation and hygiene are local concerns and the main product soughtfrom SANs has been action on the ground. The real SAN achievements have been specific country follow-up actions to: createbudget lines for sanitation, increase budget and donor allocations to sanitation, adopt new policies, initiate CLTS programs, andheighten sanitation awareness or adopt new approaches to hygiene promotion. Examples of specific changes are documented inSAN meeting documents, but have not yet been captured in a formal global assessment.
SANs have also played a significant role in creating and extending a global sanitation community. SANmeetings provided anideal platform to promote the objectives of the 2008 International Year of Sanitation. SANs provide a platform for many globalsanitation initiatives launched by international agencies. SANs have, for example, influenced the focus (and title) of Sanitationand Water for All (SWA). SWA is seeking to bring coherence to the global architecture of the WASH sector. Follow updiscussions to SAN meetings have been hosted at the Stockholm World Water Week, World Bank Water Week and WSSCCGlobal Forums: the SANs provide a mechanism for rapid take up of ideas from one region to another and processing theirrelevance within regions.
AfricaSan: From conference to movement 5

1.1.7 AfricaSan’s distinctive approachesAfricaSan set out to stimulate dialogue across sub-Saharan Africa. A common colonial history and common political frameworkof the African Union bind sub-Saharan Africa and the AfricaSan dialogue benefitted from the fact that countries can draw on arich set of similar experiences. The meetings have all been bilingual (French/English) and the vision is to make them tri-lingual(French, English, Portuguese). Successive meetings each increased the number of participating countries.
In the early years, with two meetings in South Africa, AfricaSan drew on the impressive early advances made inpost-apartheid South Africa. The site for AfricaSan 3 was competitively selected and held in Rwanda, one of only fourcountries in Africa on track to meet the sanitation MDG.
Without reducing the significance of regional conferences, an early idea was that, given the scale of the continent,AfricaSan might be more effective through sub-regional meetings. Sub-regional meetings are more cost-effective, arguablyhave more country relevance and impact, and can better sustain the AfricaSan brand and have the support of AMCOW.But support agencies have not had the capacity to sustain this considerable increase in meetings, nor shown the ability tofollow-up on these, as well as continental meetings. Sub-regional meetings need to be driven by sub-regional political andeconomic bodies.
WSP has played a leading role in driving AfricaSan from the outset serving as Chair of the AMCOW AfricaSan Taskforce.WSP has recently signaled to AMCOW that after a decade of its support, and following the successful conclusion of AfricaSan 3,there is need for change. AMCOW Secretariat has elected to take over the Chair of the AfricaSan Taskforce while WSP willcontinue to follow up on commitments and country actions plans made at AfricaSan 3.
1.2 LOOKING FORWARDWhat has been learnt from a decade of AfricaSan and SAN meetings? The SAN meetings have been a highly successful brand,bridging global and country dialogue on sanitation at a time when the costs of the neglect of sanitation – on economic growth,health, the environment and human rights – have becomemore evident. Large groupings of countries remain off track to meet thesanitation MDGs and, given the diversity in the global sanitation debate, regional SANs have played an important role instimulating a relevant regional discussion for improving sanitation and hygiene.
Plans are well in hand in all four of the major regions facing large-scale sanitation challenges to continue this momentum,especially seeking to stimulate progress as the world closes in on the target date for achievement of the MDGs. Yet, at thesame time, partly as a result of the SAN meetings and initiatives such as SWA and the International Year of Sanitation,many more global conferences are also giving greater attention to sanitation: this is evident at Stockholm World WaterWeek, the World Water Forum, and the recent WEDC conference. Legitimate questions are asked whether there is a need tocontinue the SAN meetings in the face of this increased global engagement with sanitation in a world where resources forlarge conferences are more difficult to justify.
SAN meetings fill a niche that is not filled by other sanitation events and processes in at least three ways:
(i) The discrete focus on sanitation and hygiene is a great strength of the SANmeetings. The world is off-track to meet thesanitation MDG target and an effort well beyond 2015 will undoubtedly be needed to sustain momentum to improvethe global state of sanitation. A lesson of sector efforts since the International Drinking Water and Sanitation Decade isthat without specific sanitation-focused initiatives, sanitation is neglected. SAN meetings help retain this focus.
(ii) The SANmeetings have developed a successful approach which responds to the complexity of the sanitation challengeby blending political considerations, technical exchange and advocacy in a dialogue with a large range of sectorstakeholders.
(iii) SANs provide a useful bridge for integrating global ideas into regional and country policies and approaches and enablerelevant and meaningful country level comparisons for what is essentially an area of country and local action.
1.3 RECOMMENDATIONS FOR THE FUTURE OF AFRICASAN1. Importance of country preparatory work and post conference follow upA key lesson from the SANs is that meetings should be both the culmination and initiation of actions on the ground takenbefore and after meetings. The meetings themselves are not the main SAN products, but a milestone in the SAN process andmovement. Sustaining interest between meetings requires a strong and accountable country organization team forpreparatory (planning, implementing, monitoring, documenting) and follow-up work (implementing specific actions onwhich commitments were made at SAN meetings). In this, SANs serve to strengthen country level sector processes. Early
Sanitation and Hygiene in Africa6

preparation by large constituencies like CSOs, such as has happened in South Asia, brings greater quality and structure to theSAN dialogue.
2. A strong, accountable regional body with a specific interest in sanitation is neededto undertake follow-up and preparation between meetingsA critical success factor for inter-meeting activity is having a legitimate and resourced team to support countries undertakefollow-up activity, monitor progress, liaise with partners and assist with conference preparation ahead of each SAN meeting.Getting a strong, regional, accountable, politically body to take this on is a stretch target in most regions, but it is anessential long-term step to imbed SANs into regional or sub-regional political processes and have the capacity needed toundertake follow-up activities. Of all the SANSs AMCOW is the best model of regional leadership, since it provides Africawith a legitimate, representative body embodying the views of the continent’s ministers of water. A challenge for AMCOWin managing AfricaSan is that in several countries in the region, water ministers do not necessarily have the mandate forsanitation and hygiene issues. Creation of an African Sanitation Ministerial Council, reporting to AMCOW, mightsignificantly improve this representation.
3. Making political commitments measurable and extending commitmentsto different stakeholder groupsA clear lesson is that political commitments made in SANs need to be realistic and clearly and easily measurable. For example,the powerful eThekwini resolution of making a 0.5% GDP allocation to sanitation has not been able to be monitored. One goodset of commitments that can be followed up in successive meetings, to be able to benchmark progress, is more powerful than achanging set of commitments that are not tracked.
An advance made in AfricaSan 3 was to obtain commitments for internal behavior change from different stakeholder groups.For example, associations of utilities and local governments made commitments to increasing prioritization to sanitation by theirmembers. More preparatory work needs to be done to prepare for these resolutions, but the idea of mobilizing utilities, localgovernment, civil society, development banks and donors all to make measurable commitments on prioritizing sanitation andtracking performance in their own constituencies, should be further tested in forthcoming meetings.
4. Improving governanceThere are several important steps to improve the governance of SAN meetings. These include:
• Retaining government leadership, yet getting balanced participation: Government leadership is essential, but continuing astrong civil society presence, alongside other stakeholders fully integrated into one forum process (though not excludingseparate consultations) is necessary to achieve mutually accountable commitments. In some situation, where there arewide divisions between government and civil society opinions, special attention needs to be made in seeking toachieve balanced dialogue and participation.
• Agencies to play a supportive role: SANs have benefitted greatly from the support of external agencies. This willundoubtedly be needed to continue in poorer countries, enabling local actors to lead. But support agencies shouldavoid self-promotion or allow the agency competition for donor funds and profile to detract from local ownership.Individual agencies’ web-sites and individual marketing do not always acknowledge the contributions of others andan agreement for credit-sharing between support agencies should be honored. Greater clarity on roles (each agencyfilling complementary niches) might help to avoid unnecessary and distracting competition between agencies. Aconstructive division of labour for lead agency SAN support is emerging: WSSCC to lead on advocacy; WSP onanalytic work; UNICEF (which has the greatest country representation in the sector) lead most country dialogues(supported by WSP and other agencies that have country presence); WHO/UNICEF JMP lead on producingtargeted global data and packaging regional snapshots; WHO package regional finance and process data fromGLAAS; and regional civil society networks, with WSSCC’s support, coordinate local NGO contributions. Thesetypical partnership roles will continue to fluctuate, especially as not all agencies will be able to continue to fillthese roles in all situations. Many agencies will continue to be needed to contribute by funding participants toattend the SANs.
• Stakeholders that need greater presence and engagement: include the private sector, utilities, civil society, localgovernments, the media and the research community.
AfricaSan: From conference to movement 7
5. SAN technical meeting agendas need balanced designs and more evidence-based dialogueWhilst there may be a case for specific foci in some meetings, in general the technical exchange should aim to respond to theconcerns of countries, whilst keeping the region up to date with international thinking in all the relevant topic areas. Presentationsand dialogue should lead with evidence rather than ideology to help knit the different sanitation dialogues into a commonframework. Peer review should be consistently applied to main technical presentations. Tailoring the content of the SANS tocountry needs and having governments monitor that SANs are responsive to country needs might be another way to supportcountry actions. Issues that have not consistently received the attention they deserve are: capacity building, urban sanitation,sustainable financing, leadership, monitoring and evaluation, hygiene promotion and engagement of the private sector.
6. Sanitation development trajectories and sanitation sector performance modelsThe definition of the sanitation problem varies from country to country and within countries. For some countries the immediateproblem is moving from open defecation; in others it is moving neglected populations up the sanitation ladder; for some thecentral problem is grappling with maintaining an expensive sanitation infrastructure. The urban, small town and rural debatealso has different parameters and issues. The sanitation sector needs country analytic tools that can be used across thesedifferent trajectories, to provide country insights on performance and allow cross-country comparisons. Whilst the JMPmonitors global sector trends, more robust data-sets are needed at national and sub-national level to provide the evidence toguide local decision-makers. The AMCOW Country Status Overviews3 provide a model and process which might bedeepened to reflect the main steps in growth trajectories in sanitation development to give strong guidance to countries onhow improve sector performance. Future SANs might consider developing and applying this more rigorous analysis in futurecountry preparations.
7. Fitting SANs into a logical and strategic global architectureWhilst country sector dialogue is increasingly moving to an annual program of Joint Sector Reviews in a great many countries, atthe global level the Sanitation andWater for All (SWA) initiative seeks to establish a regular global platform and regularly updatethe global evidence base (through the Global Assessment and Analysis of Sanitation andWater –GLAAS) for assessing progressand engaging global political leadership. SANs fill the regional gap and provide another important source of comparativeevidence and consensus building to help gear up implementation of sanitation approaches that work.
8. Developing a sustainable SAN business modelA concern for many is the high cost of SANmeetings. Many of the early meetings depended on large and generous support froma few donors. This may be at risk in a more constrained aid environment. Fortunately AMCOW has continued to be highlysuccessful in fund-raising for AfricaSan and recently obtained strong support from the Bill and Melinda Gates Foundation.
AFRICASAN 3, a fee-paying conference, made a significant breakthrough in establishing a more sustainable business modelwhichmight be considered for future SANmeetings.With an attendance of 900 people, a participant fee of an order of magnitude$350 (lower than fees for international conferences – civil society organizations played a lesser fee) can generate a revenuestream of $300 K. This core finance stream might obviate the need for the large grants where these are not available.
9. Measuring impactSAN meetings can rightfully claim a great many impacts. But these are hard to measure and direct attribution to regional SANmeetings is hard to establish. An initiative with the ambition, scale and cost of the regional SANs does need to establish a formalplanning and results frame. It would be wise for the lead agencies jointly to commission an independent external study of theimpact of the SANs to provide the evidence base to guide their future to 2015 and beyond.
10. Competitive selection for the location and topics of future SAN meetingsSAN meetings are by now a known brand that brings many benefits to the host country. Recognizing this, AfricaSan 3 requiredpotential hosts to make a bid and prepare a business case for hosting forthcoming regional meetings. This brought the importantelement of performance into meeting design and the selection of meeting location. Where competition may not be appropriate,host selection should at least reflect countries with marked progress or displaying innovation.
3Known as Service Delivery Assessments in other regions.
Sanitation and Hygiene in Africa8

11. A strong national organizing committeeAnother clear success factor for a SAN meeting is the planning, fund-raising, and advocacy competence of the local organizingcommittee. National organizing committees need to fully represent the main stakeholders, but be a workable size in order todirect meeting preparations. Attention is needed to getting quality documentation out in good time, getting participation fromparticipants outside the sector (e.g. health, education sectors) and maintaining strong communications throughout, includingprofessional simultaneous language translation.
SAN meeting designs should put peer review processes in place, such that technical presentations are clearly evidence-basedand not confused with advocacy issues: solving sanitation questions needs smarter, better researched and better justified ideas.
12. Taking on messages of poor performanceWhilst there has been enthusiasm for setting measurable performance indicators, the analysis of performance and the take-up ofactions by the poorest performers have generally been weak. Peer review processes introduced in AFRICASAN 3 sought tostimulate an analysis of the drivers of good performance, but some of the country presentations in a regional contextremained rather defensive. Many country action plans have been developed, but concern remains that these may not translateinto owned actions to address weak performance. An attempt to develop detailed sanitation scorecards in Africa (a version ofCountry Status Overviews but with in-depth indicators exclusively for sanitation) has been attempted and might bereconsidered as a comprehensive country-level analytical tool. AMCOW monitoring and evaluation processes are beingdeveloped to monitor the Sharm el- Sheikh Declaration which include a component on detailed indicators for measuringsanitation coverage. Overall the sanitation sector still lacks the maturity of an honest public appraisal of weaknesses or theintroduction of performance incentives.
13. Could SANs evolve into a social movement?Building on the growing global recognition of sanitation, the increased political engagement, the strong interest by civil society,and the stronger evidence-base, a future option for SANs, with other global sanitation initiatives, might be to consciously evolveinto a social movement, along the lines of major successful campaigns such as the Campaign for Nuclear Disarmament, the CivilRights Campaign or woman’s right to vote. SAN partners might consider extending their support to create a social movement forhuman dignity, using a human rights-based approach, which has regional SAN meetings as milestones in the build up of apopulist sanitation movement.
AfricaSan: From conference to movement 9


Chapter 2
Status of sanitation and hygiene in Africa
Sophie HicklingWater and Sanitation Program
Africa is off track to meet the sanitation MDG. At the current rate of progress, the sanitation MDG target will be missed by300 million people. This chapter presents a review of the status of sanitation and hygiene in Africa in mid 2012.
2.1 STATUS UPDATE FOR AFRICA1
TheMDG target for sanitation is to halve, by 2015, the proportion of people without access to basic sanitation. For Africa, in theMDG baseline year of 1990, 221 million people or 65% of the population, were without basic sanitation; the MDG target forsanitation calls for halving that proportion to 32% by 2015.
The MDG indicator for access to basic sanitation is the proportion of people using an improved sanitation facility in urbanand rural areas. The definition for improved sanitation is shown in Table 2.1.
2.1.1 Current progressThere are currently 8 African countries on track to meet the sanitation MDG target, four of which are in Northern Africa. Insub-Saharan Africa 70% of the population remain without access to basic sanitation.
Sanitation coverage trends for each region can be seen in Figure 2.1. Northern Africa has already surpassed its MDG target ascan be seen by the very small proportion of the population remaining without improved sanitation. In all other regions progresshas been too slow to remain on track to meet the MDG sanitation target (Figure 2.2).
Table 2.1 Sanitation definitions.
Improved sanitation Unimproved sanitation
Use of the following facilities:
• Flush or pour flush to:○ Piped sewer system○ Septic tank○ Pit latrine
• Ventilated improved pit (VIP) latrine• Pit latrine with slab• Composting toilet
Use of the following facilities:
• Flush of pour flush to elsewhere (i.e., not pipedsewer system, septic tank or pit latrine.
• Pit latrine without slab/open pit• Bucket• Hanging toilet or hanging latrine
Shared facilities of any typeNo facilities, bush or field
1All Figures and data taken from: AMCOW WHO/UNICEF (2012).

Since 1990, 189 million people in Africa have gained access to sanitation. However population growth has outpaced access,200 million more people lack access now than in 1990. In 19 countries in Sub-Saharan Africa, less than a quarter of thepopulation uses an improved sanitation facility.
Improved facilities
Shared facilities
Open Defecation
Unimproved facilities
1990 2010 1990 2010 1990 2010 1990 2010 1990 2010 1990 2010 1990 2010
Western Africa Eastern Africa
Southern Africa
Central Africa
Northern Africa
Sub-Saharan Africa
Africa
42 28
32
34
19
13
17 25
5
36
90
26
35 40
14
18
25
0
24
22
36 35
48
43
26
33
30
13
22
19
21
17
4
6
5
28
72 25
26 26
34 28
21 19
21
14
11
18
11
22
11
14 23
14
19
50
Sub-Saharan Africa comprises of the countries in the AMCOW regions of Central Africa, Eastern Africa, Southern Africa and Western Africa Due to rounding and different ways of aggregating regional data, the sum of the individual regional data does not necessarily match the regional aggregates of sub-Saharan Africa and Africa
Figure 2.1 Sanitation coverage trends 1990–2010, AMCOW regions, Sub-Saharan Africa and all Africa.
26
63
0
20
40
60
80
100
Co
vera
ge
(%)
2015 2010 1990
Northern Africa
Central Africa
Africa
Southern Africa
Western Africa
Eastern Africa
86
59 59
68 72
90
28
40
50
MDG targets
Current trend
Trend needed to meet the MDG target
10
25
Figure 2.2 Coverage trends and projections, AMCOW regions and all Africa.
Sanitation and Hygiene in Africa12

Connection to water-borne sewage remains extremely low across Sub-Saharan Africa. According to Morella et al. (2008),‘among utilities serving the largest cities, only half report operating a sewage network at all’ and in most countries even ifthere is a sewage system only around 10% of the population in the catchment area have access. In view of current urbanpopulation growth affordable alternatives to on-site sanitation will need to be found in the near future.
Increased access to sanitation is only half the battle; consistent use by the entire family is required to maximize potential healthbenefits of sanitation. In Africa, children’s faeces are often not disposed of safely. Unsafe disposal of children’s faeces is moreprevalent in rural areas than urban areas with less than 30% of caregivers ensuring that a child uses a latrine directly or rinses achild’s stools into a latrine (UNICEF, 2012a).
Whereas data for sanitation is available through the MDG monitoring process, comprehensive data on the status of handwashing in Africa is not yet readily available. An analysis of data collected since 2006 by Multiple Indicator Cluster Surveys(MICS) and Demographic and Health Surveys (DHS) from 8 Sub-Saharan African countries reveals a picture of existingpatterns of hand washing with soap (HWWS). Survey indicators measure the proportion of households where a place forhand washing is observed and water and soap (or other locally used cleaning agent) is available as a proxy for HWWS. Ascan be seen from Figure 2.3, data suggest that overall HWWS rates are extremely poor in all countries for which data isavailable. Rates were found to be lowest amongst the poorest household quintile with less than 1% in this group washinghands for three countries. However, in half of the countries, the rate of HWWS is below 20% in even the richest householdquintile (UNICEF, 2012b).
Finally, having sustainable WASH facilities in schools is essential to supporting a healthy learning environment andpromoting attendance, particularly amongst girls. However in 2011, only 52% of the schools in Africa had access to waterand 48% of schools had access to sanitation.2 For more information see Chapter 10 – Advancing Health, Learning andParticipation through WASH in Schools in Africa.
2.1.2 Open defecationOpen defecation in public health terms is the riskiest sanitation practice of all. It also has the greatest negative economic impacton countries and has considerable social costs including loss of dignity, security and privacy (WSP, 2011).
A little over one in 5 people in Africa practice open defecation, an improvement from the 1990 baseline of one inthree. Overall there has been an 11% drop in the number of people practicing open defecation in Sub-Saharan Africa,unfortunately due to population growth the absolute number of open defecators has increased by 33 million (JMP, 2012).Currently 223 million people in Africa still defecate in the open (Figure 2.4).
Open defection is declining in every African sub-region (Figure 2.1) indicating a demand to move onto the sanitation ladder.However, access to improved sanitation has not kept pace, hence the comparative increase in population using shared orunimproved sanitation.
0
20
40
60
80
100 RichestFourthMiddleSecond
Rwan
da
Mal
awi
DRC
Mal
i
Sier
ra L
eone
Sene
gal
Zim
babw
e
waz
iland
%
Figure 2.3 Proportion of households observed hand washing was observed with soap.
2Based on the UNICEF country office annual reports from 51 countries in Africa.
Status of sanitation and hygiene in Africa 13

2.1.3 The equity imperativeWhen looking at global, regional or country figures it is important to be aware that average values can mask significantdisparities. When viewed through the lens of socio-economic status, sanitation is highly correlated with wealth (Figure 2.5).
There is also a correlation between sanitation access and residence of the 223 million open defecators in Africa, 197 millionlive in rural areas. Whereas use of traditional latrines across Africa is common in both rural and urban areas (approximately50% of population), ‘an urban-rural divide emerges when access to improved sanitation is considered. In rural areas, thebulk of the remaining population (41%) continues to practice open defecation, [whilst] in urban areas, the bulk of the
/ - ) ,%( 2"#$%&' ( ": O"I &22&0) "
C0%,?- %) "#$%&' ( "
"P"I &22&0) "
Western Africa86 million
Southern Africa35 million
Eastern Africa78 million
222 million people in Africa practised opendefecation in 2010
Northern Africa7 million Central Africa
15 million
Figure 2.4 Open defecation by region.
Figure 2.5 Access to sanitation by wealth and residence.
Sanitation and Hygiene in Africa14

remaining population (39%) have access to improved [sanitation] with septic tanks much more common than improved latrines’(Morella et al. 2008).
The size of the equity gap is underlined when comparing sanitation access according to both wealth and residence inSub-Saharan Africa (Figure 2.5) – over 90% of the richest quintile in urban areas have access to improved sanitation,whereas in the poorest quintile of rural areas over 60% of the population practise open defecation. Chapter 5 further exploressome of the inequities of sanitation coverage, and what needs to be done to address equity and inclusion in sanitation.
2.1.4 Aid environment for sanitation3
In addition to government financial allocations for sanitation, external assistance in the form of development aid from countries,multilateral organisations, NGOs and private foundations are significant across Africa. Development aid commitments to waterand sanitation made up 4.7% of total reported development aid globally in 2010. At approximately US$ 7.8 billion, aid to waterand sanitation remains significantly below other social sectors such as health (US$ 19.5 billion) and education (US$ 13.3billion).
Only approximately 34% of development aid to water and sanitation goes specifically to sanitation.Africa receives over one third of all sanitation and drinking water aid. Twenty seven per cent of global water and sanitation
development assistance goes to Sub-Saharan Africa – the most of any region in absolute terms.
2.1.5 eThekwini commitmentsThe second AfricaSan conference (AfricaSan +5, 2008) produced a Ministerial statement, the eThekwini Declaration, makingimportant commitments by African Governments to improve sanitation and get African countries on track to meet the sanitationMDG (refer back to Chapter one for more information). The commitments were subsequently endorsed by Heads of Statein the AU Summit, 2008 Sharm el Sheik Declaration and have been reaffirmed through various regional and sub-regionaldeclarations such as the Libreville Declaration on Health and Environment in Africa. Ministers at AfricaSan 3 reaffirmed theeThekwini commitments.
Through in-country reviews and self-validation, the first all-Africa eThekwini monitoring was carried out and reported onat AfricaSan 3. This all-Africa monitoring (Table 2.2) showed that substantial progress has been made across Africa and thatin many cases countries have substantively met the eThekwini commitments (AMCOW et al. 2011b).
However, there are areas where more progress is required. Little improvement has been seen in commitments related tobudget allocations to the sanitation sector and in development and implementation of sanitation information, monitoringsystems and tools to track progress at local and national levels.
The original indicators and criteria were broad and retrofitted to the commitments. As such, some do not adequately measureimplementation of the eThekwini commitments. For example, previous monitoring indicators and criteria captured the existenceof national sanitation plans, but not the second half of the commitment which calls for steps to be taken to ensure nationalsanitation programs are on track. Other commitments were not included in the all-Africa eThekwini monitoring – forexample the commitment to use effective and sustainable approaches or the commitment to build and strengthen capacity forsanitation and hygiene implementation.
At AfricaSan 3 Ministers accepted recommendations for new indicators, proposed for targets for which no indicators exist,and agreed that existing indicators should be refined for those targets which have now largely been met. Progress against thesenew indicators will be reported on at the next AfricaSan conference.
Table 2.2 2011 eThekwini Monitoring – proportionof commitments met by region.
Central 55%
East 71%
South 65%
West 71%
3All information and figures taken from: UN-Water (2012).
Status of sanitation and hygiene in Africa 15
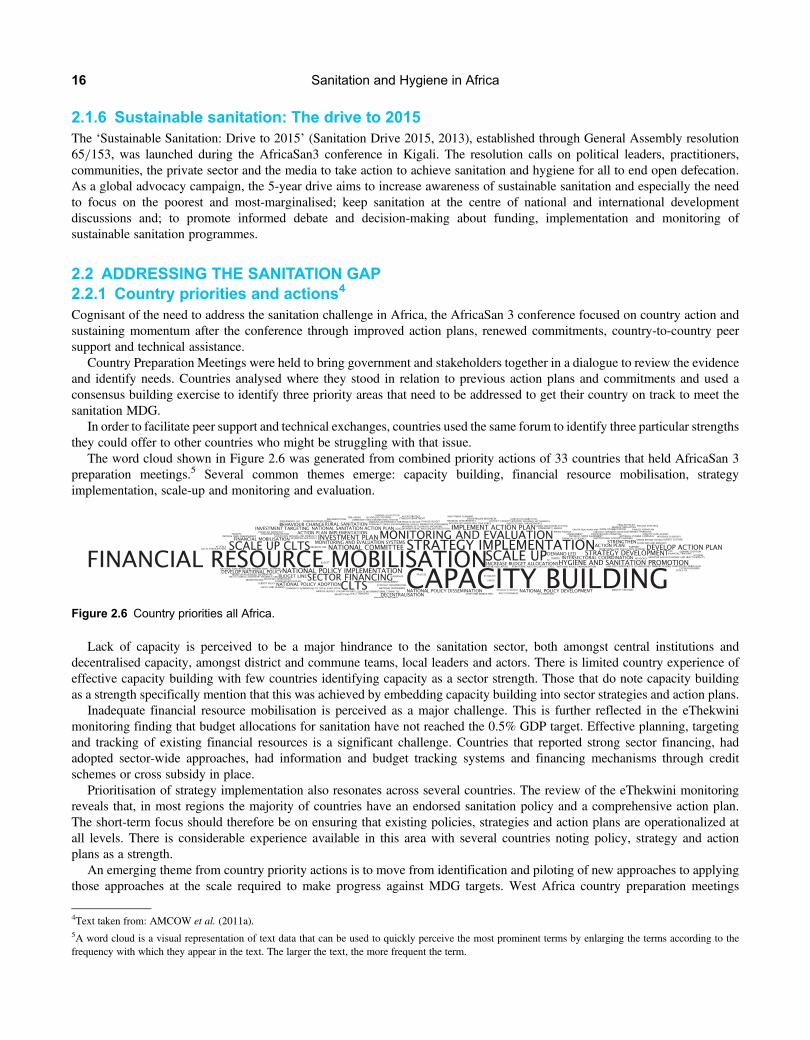
2.1.6 Sustainable sanitation: The drive to 2015The ‘Sustainable Sanitation: Drive to 2015’ (Sanitation Drive 2015, 2013), established through General Assembly resolution65/153, was launched during the AfricaSan3 conference in Kigali. The resolution calls on political leaders, practitioners,communities, the private sector and the media to take action to achieve sanitation and hygiene for all to end open defecation.As a global advocacy campaign, the 5-year drive aims to increase awareness of sustainable sanitation and especially the needto focus on the poorest and most-marginalised; keep sanitation at the centre of national and international developmentdiscussions and; to promote informed debate and decision-making about funding, implementation and monitoring ofsustainable sanitation programmes.
2.2 ADDRESSING THE SANITATION GAP2.2.1 Country priorities and actions4
Cognisant of the need to address the sanitation challenge in Africa, the AfricaSan 3 conference focused on country action andsustaining momentum after the conference through improved action plans, renewed commitments, country-to-country peersupport and technical assistance.
Country Preparation Meetings were held to bring government and stakeholders together in a dialogue to review the evidenceand identify needs. Countries analysed where they stood in relation to previous action plans and commitments and used aconsensus building exercise to identify three priority areas that need to be addressed to get their country on track to meet thesanitation MDG.
In order to facilitate peer support and technical exchanges, countries used the same forum to identify three particular strengthsthey could offer to other countries who might be struggling with that issue.
The word cloud shown in Figure 2.6 was generated from combined priority actions of 33 countries that held AfricaSan 3preparation meetings.5 Several common themes emerge: capacity building, financial resource mobilisation, strategyimplementation, scale-up and monitoring and evaluation.
Lack of capacity is perceived to be a major hindrance to the sanitation sector, both amongst central institutions anddecentralised capacity, amongst district and commune teams, local leaders and actors. There is limited country experience ofeffective capacity building with few countries identifying capacity as a sector strength. Those that do note capacity buildingas a strength specifically mention that this was achieved by embedding capacity building into sector strategies and action plans.
Inadequate financial resource mobilisation is perceived as a major challenge. This is further reflected in the eThekwinimonitoring finding that budget allocations for sanitation have not reached the 0.5% GDP target. Effective planning, targetingand tracking of existing financial resources is a significant challenge. Countries that reported strong sector financing, hadadopted sector-wide approaches, had information and budget tracking systems and financing mechanisms through creditschemes or cross subsidy in place.
Prioritisation of strategy implementation also resonates across several countries. The review of the eThekwini monitoringreveals that, in most regions the majority of countries have an endorsed sanitation policy and a comprehensive action plan.The short-term focus should therefore be on ensuring that existing policies, strategies and action plans are operationalized atall levels. There is considerable experience available in this area with several countries noting policy, strategy and actionplans as a strength.
An emerging theme from country priority actions is to move from identification and piloting of new approaches to applyingthose approaches at the scale required to make progress against MDG targets. West Africa country preparation meetings
Figure 2.6 Country priorities all Africa.
4Text taken from: AMCOW et al. (2011a).5A word cloud is a visual representation of text data that can be used to quickly perceive the most prominent terms by enlarging the terms according to thefrequency with which they appear in the text. The larger the text, the more frequent the term.
Sanitation and Hygiene in Africa16

specifically mention scale up of the CLTS approach and a number of countries note that they have experience in CLTS and CLTSscale-up.
Establishment of effective monitoring and evaluation systems at all levels, and development of tracking tools is another clearpriority action area from both country preparations and eThekwini monitoring. Countries that noted monitoring and evaluation(M&E) amongst strengths that they could share, also mentioned making M&E an important part of strategic planning,reconciliation of national and global data and community involvement in M&E.
Since the AfricaSan 3 conference, 26 countries have developed and submitted Priority Actions Plans to AMCOW whichsystematically address these identified needs. In many countries the Priority Action Plans are living documents being used toguide and monitor sanitation work in country.
2.2.2 High-level commitmentsThrough the Sanitation and Water for All (SWA) partnership, governments from 40 countries (31 of which are in Africa) areworking alongside donors, civil society and multilateral organizations to ensure that all people have access to basicsanitation and safe drinking water. During the 2012 High Level Meeting serious commitments were made to extend accessto sustainable sanitation facilities to 80 million people over the next two years – increasing access to sanitation by 7% anddecreasing open defecation by 15%.
Recognising that current financial flows are inadequate, ministers also committed to bridging sector-financing gaps throughnational budget allocations as well as external sources – increasing water and sanitation budgets by 15% annually and allocatingat least 10% of budgets to hygiene promotion and demand creation. Ministers of finance were requested to create specificbudget lines for sanitation and increase prioritization of the sector in budgets.
During the same meeting donors and development banks were also called on to better target resources and to increase theproportion of development assistance going to sanitation and hygiene from 34% to 45%.
2.3 CONCLUSIONSAlthough greatly off-track to meet the sanitation MDG, there have been advances in sanitation in Africa. Open defecation isdecreasing in all African sub-regions. The fact that the rate of this decrease exceeds the increase in access to improvedfacilities indicates an un-met demand and the potential to reach those people with improved sanitation.
At country level there is evidence that action is taking place; since AfricaSan 3, 26 countries have developed actionplans to address their priority needs and are actively implementing them to address bottlenecks to sanitation progress. Theattention given to sanitation in pledges made at the High Level Meeting of the SWA in 2012 is encouraging.
However, there is still a long way to go to reach the MDG target and further, ensure that universal access to basic sanitationbecomes a reality in Africa. Of paramount importance is that concerted efforts be made to ensure that actions and financingreach the poorest populations who remain the most critically underserved.
2.4 REFERENCESAMCOW/WHO/UNICEF Joint Monitoring Programme for Water Supply and Sanitation (2012). A Snapshot of Drinking Water and
Sanitation in Africa – 2012 Update. AMCOW WHO/UNICEF, Geneva/New York.AMCOW, WSP, UNICEF, WaterAid, CREPA (2011a). Sanitation and Hygiene in Africa at a Glance: A Synthesis of Country Priority
Actions. Available at: http://www.wsp.org/sites/wsp.org/files/publications/WSP-2011-Sanitation-&-Hygiene-in-Africa-at-a-Glance.pdf (accessed 10 September 2013).
AMCOW, WSP, UNICEF, WaterAid, CREPA (2011b). Sanitation and Hygiene in Africa at a Glance: eThekwini Traffic Lights Report.Available at: http://www.wsp.org/sites/wsp.org/files/publications/WSP-2011-eThekwini-Traffic-Lights-Report.pdf (accessed 6September 2013).
Morella E., Foster V. and Banerjee S. (2008). Climbing the Ladder: The State of Sanitation in Sub-Saharan Africa. Background Paper 13,World Bank, Africa Infrastructure Country Diagnostic (AICD).
Sanitation Drive 2015 (2013). Sustainable Sanitation: The Drive to 2015. Available at: http://www.sanitationdrive2015.org/ (accessed 10July 12).
Sanitation and Water for All (2012). Ministerial Statement from SWA/HLM, Global step change for universal access. Available at: http://www.sanitationandwaterforall.org/files/HLM_2012_Sector_Ministers’_Statement.pdf (accessed 21 June 2012).
UNICEF (2012a). Pneumonia and Diarrhoea: Tackling the Deadliest Diseases for the World’s Poorest Children. UNICEF, New York.Available at: http://www.childinfo.org/files/Pneumonia_Diarrhoea_2012.pdf (accessed 10 September 2013).
Status of sanitation and hygiene in Africa 17
UNICEF (2012b). UNICEF special tabulation based on the most recent MICS or DHS survey from Sub-Saharan Africa countries with dataavailable 2006–2010: Rwanda DHS 2010, Malawi DHS 2010, DRC MICS 2010, Mali DHS 2006, Sierra Leone MICS 2010, SenegalDHS 2010–11, Zimbabwe DHS 2010 and Swaziland MICS 2010–11. (shared by email).
UN-Water (2012). Global Analysis and Assessment of Sanitation and Drinking-Water (GLAAS) Report.WHO/UNICEF Joint Monitoring Programme for Water Supply and Sanitation (2012). Progress on Drinking Water and Sanitation 2012
Update. WHO/UNICEF, Geneva/New York.WSP (2011). Economics of Sanitation in Africa. Available at: http://www.wsp.org/wsp/content/africa-economic-impacts-sanitation
(accessed 21 June 2012).
Sanitation and Hygiene in Africa18

Understanding the Impacts of Poor Sanitationand Hygiene


Chapter 3
Health impacts of sanitation and hygiene
Sandy Cairncross1, Oliver Cumming1, Lisa Schechtman2, Yael Velleman2
and Hugh Waddington31London School of Hygiene and Tropical Medicine2WaterAid33ie
This chapter builds on the presentations and discussions of the Health Impacts session held at AfricaSan 3. The authors aregrateful to all presenters –Dr Godfrey Odongo, Dr Frank Rijsberman and Dr Jean Humphrey – for their contributions to thesession and their wider work in this important field, which helped inform this chapter. The primary focus of the chapter issanitation but it also touches on the wider ‘WASH’ literature where it is not possible, or not useful, to separate the water andhygiene components. The chapter covers four parts: (1) the role and usefulness of health impact information; (2) what weknow about sanitation and diarrhoea; (3) other health impacts of sanitation; and lastly, (4) what are the priorities forstrengthening the evidence base and using this information.
3.1 INTRODUCTIONThe heroic achievement of the sanitary campaigners, preventing the disastrous cholera epidemics in nineteenth century Londonand elsewhere, have left many with the impression that sanitation is basically a health intervention. Today, many donor agencieslist health benefits as the primary objectives of the sanitation projects that they fund, and despite the great cost, unreliablefindings and weak diagnostic power of the epidemiological studies involved, they often try to evaluate projects andprogrammes by measuring their impact on health.
Sanitation does have an impact on health (Barreto et al. 2007); indeed, its cost-effectiveness as a diarrhoeal disease controlmeasure compares favourably with more conventional nutritional or clinical interventions (Cairncross & Valdmanis, 2006). InAfrica, where diarrhoea is the leading cause of child deaths (Black et al. 2010; Figure 3.1 below), this alone justifies sanitation asa public health priority. However, its impact on health is substantially more than that on diarrhoea alone, particularly its effecton intestinal worms and other parasites (Feachem et al. 1983; Barreto et al. 2010) which significantly affect children’s growthand cognitive development (Brooker, 2010).
In fact, sanitation is about much more than health, and health considerations rank far down the list of ‘selling points’motivating poor householdes to invest in a latrine or toilet. One study in West Africa, found the most prominent amongthese are usually safety and security, comfort, convenience, privacy and prestige (Jenkins, 2004). Sanitation campaignsbased on these factors have been very successful (Scott et al. 2011), arguably more so than campaigns based on healthawareness. These other factors are significant benefits of sanitation, and since they are sufficient to motivate households toinvest, they clearly have a monetary value.
Non-health benefits do not mean that the health dimension is of no concern. Rather, health impacts are difficult to measure,and so attempts to measure them should be separated from operational programme evaluation and reserved to a few world classresearch studies. Part of the difficulty is the political, ethical and logistical constraints to a randomised intervention trial ofsanitation. Provision of even very basic sanitation to the study population would cost hundreds of dollars per household.Only in recent years has it become clear that promotion of sanitation in a random set of communities could produce similar

results at much less expense by leveraging the investment of individual households. Nevertheless, unless the adoption ofsanitation is ultimately almost universal, then ownership and use of a latrine will mainly depend on a household decisionwhether to install one. In other words, the exposure groups in an epidemiological study will largely be self-selected. This inturn can cause a strong bias, giving the impression of an association with diarrhoea, even where none exists.
For example, data from various countries show that in households with a toilet, people behave more hygienically than themembers of households which do not have one. In Bangladesh for instance, toilet-owning mothers wash their hands morethoroughly after defecation (Hoque et al. 1995) and in Brazil toilet-owning mothers whose child’s dummy falls on the groundare more likely to wash it before reinserting it in the child’s mouth (Strina et al. 2003). In these circumstances, it is impossibleto tell whether sanitation improves people’s health, or if hygiene-minded, healthy people tend to improve their sanitation.
The best way to eliminate such ambiguity in studies of sanitation and health is to consider only randomised interventionstudies, in which the group benefiting from sanitation is chosen at random. It is therefore striking that almost all the studiesin the literature are observational studies, where households that have chosen to install sanitation are compared with thosethat have not. These studies show reductions in diarrhoea incidence associated with sanitation that are fairly consistent ataround 35%, but in the absence of enough intervention studies, we cannot be sure that the reduction is genuine.
Moreover, the outcome contributing most to the burden of disease is diarrhoea mortality, whereas most studies in the literatureexamine diarrhoea morbidity. If sanitation reduces diarrhoea, it still does not follow automatically that it reduces deaths fromdiarrhoea. Few studies have considered mortality as an outcome (Victora et al. 1988), and most of those had majormethodological defects (e.g. Messou et al. 1997).
Focussing the lens exclusively on Africa, the body of evidence becomes even smaller and less reliable, as discussed below. Asdescribed above, the primary outcome of interest in epidemiological studies of sanitation specifically andWASHmore generallyhas been primarily diarrhoeal morbidity. However, sanitation and hygiene influences human health and well-being across arange of outcomes, that extend beyond diarrhoea. Some of these other health impacts, and in particular undernutrition andgender-based violence, are addressed in the next section. Here we consider the best available evidence globally and in Africafor diarrhoea only.
Preterm birth complica�ons
8%
Birth asphyxia 8%
Sepsis 5%
Congenital abnormali�es
2%
Other neonatal 1%
Tetanus 1%
Diarrhoea 19%
Measles 1%
Injury 2%Malaria 16%
AIDS 4%
Pertussis 2%
Meningi�s 2%
Other infec�ons 9%
Other non-communicable
diseases 2%
Pneumonia 18%
Figure 3.1 Estimated causes of child deaths in Africa, 4.2 million/year (Source: after Black et al. 2010).
Sanitation and Hygiene in Africa22

3.2 SANITATION AND DIARRHOEAA large body of systematic reviews exists examining the effect of sanitation interventions on diarrhoea. These include bothinterventions that directly provide ‘hardware’ for excreta disposal, through new or improved latrines or connection ofexisting latrines to the public sewer, and that provide the ‘software’ for hygienic practices, including hygiene and healtheducation and the encouragement of specific behaviours such as hand washing with soap (Esrey et al. 1991; Curtis &Cairncross, 2003; Fewtrell et al. 2005; Clasen et al. 2010).
In the most recent published review, Cairncross and colleagues (2010) summarise the global evidence on sanitation andhygiene as follows: ‘[the] effect of handwashing with soap is most consistent at roughly 47% reduction in diarrhoea…Evidence for sanitation is weakest… but may be 36% reduction’. Sanitation also enhances human dignity and providesalternatives to unsafe places for defecation for women and girls, but very little evidence – and no evidence in Africa –
appears to have been systematically collected on these benefits.1
But what does the evidence from Africa say? The most striking finding is a marked lack of high quality studies conducted inAfrica for the effect of both sanitation and hygiene interventions on diarrhoea, as well as more generally (Clasen et al. 2010).Figure 3.2 depicts results of the four studies we have been able to identify which measure the effect of latrines, hygienepromotion, or a combination of these, on diarrhoeal disease rates in Africa.2
The graph plots the relative reduction in diarrhoeal disease rates and 95 percent confidence intervals, with values of the effectsize less than 1 indicating a proportionate reduction in disease over the control group. The evidence suggests that, if we are tobelieve the findings of these relatively low quality study designs, large reductions in diarrhoeal disease rates of around 50 percenton average, but with wide dispersion of effects in different studies. Unfortunately, none of these studies were conducted usingrigorous intervention study designs such as randomised control trials (RCTs), which seriously undermines the extent to which weare able to trust the causal inferences made.
The lack of high quality studies in Africa examining hygiene promotion is a surprising finding, given the large number ofrigorous studies which have been conducted elsewhere (see Waddington & Snilstveit, 2009), the emergence of innovativeapproaches like community-led total sanitation (CLTS), and especially due to the low costs of the intervention itself(Cairncross & Valdmanis, 2006). It is rather less surprising that high quality studies have not been conducted for sanitationhardware, given the high costs of latrine provision and sewer connection. Moreover, given the potentially substantial
NOTE: Weights are from random effects analysis
Overall
Cote d'Ivoire
Zimbabwe
Study location
Kenya
Zaire
0.53 (0.33, 0.86)
0.70 (0.59, 0.83)
0.32 (0.18, 0.57)
ES (95% CI)
0.31 (0.23, 0.41)
0.94 (0.87, 1.03)
0.53 (0.33, 0.86)
0.70 (0.59, 0.83)
0.32 (0.18, 0.57)
ES (95% CI)
0.31 (0.23, 0.41)
0.94 (0.87, 1.03)
1.1 .25 .5 1 1.5
Figure 3.2 Relative risk reductions in diarrhoeal morbidity reported for sanitation studies conducted in Africa. Abbreviations:ES = Effect Size, or risk ratio; CI = Confidence Interval.
1In a systematic review of WASH impacts, Waddington & Snilstveit (2009) were only able to identify one impact study of improved sanitation which estimatedsavings of 17 minutes per family member per day in walking to defecate (Pattanayak et al. 2007 in rural India).2The studies were found using a systematic literature search and appraisal conducted in 2012, following the methods outlined in Waddington et al. (2009). Coted’Ivoire: Messou et al. 1997. Kenya: Garrett et al. 2008. Zaire: Haggerty et al. 1994. Zimbabwe: Root, 2001.
Health impacts of sanitation and hygiene 23

community environmental health spillovers from sanitation3, adequate measurement in prospective trials requires expensivecommunity cluster study designs. However, due to low rates of sanitation coverage in Africa (WHO/UNICEF, 2012), andthe pressures for continent-wide scale-up, there may well be opportunities for conducting rigorous prospective evaluations ofsanitation provision, including those based on cluster-RCTs in the near future. There are also greater opportunities toconduct low cost evaluations by exploiting existing data such as Demographic and Health Surveys (DHS) than havegenerally been attempted so far (Jalan & Ravallion, 2003; IEG, 2008; Roushdy, 2011).
The famous ‘F- diagram’ (Wagner & Lanoix, 1958; Figure 3.3) of faecal transmission via fluids, fingers, fields, flies and food,provides a useful theoretical depiction of the potential efficacy of sanitation; that is, the primary barriers to disease transmissionwhich occurs when excreta carrying faecal pathogens are removed from the environment. However, the effectiveness ofsanitation technology in preventing death and disease depends on both the efficacy of the technology itself in preventingdisease transmission, and the extent of compliance with the technology – whether people consistently use latrines or washtheir hands, and so on. Distinguishing between these different explanations requires measurement of compliance amongbeneficiaries. Innovative methods have been developed to monitor compliance rates objectively, particularly in the literatureon efficacy of household water treatment devices (Wright et al. 2004). However, compliance with sanitation interventionshas so far largely been measured on a rather more haphazard basis, through measurement of pathogen counts on hands forhygiene interventions, or by observing latrine ownership and use (as conducted in the Garrett and Root studies reportedhere) or looking for evidence of open defecation. Ultimately, however, it remains unclear if interventions appear effective incombating disease because compliance rates are high, or because of unobserved confounding, including due to Hawthorneeffects and courtesy bias since diarrhoea rates are usually measured in efficacy trial settings through self-reporting (Schmidt& Cairncross, 2009). Rigorous studies are needed which are able to measure compliance accurately.4
We also need more evidence to understand how compliance is affected by the methods of implementation and servicedelivery, and therefore how to ensure impacts at scale. Authors of diarrhoea efficacy studies have referred to lack ofconvenience and limited observability of health benefits in explaining why compliance rates may be low for water qualityinterventions (Quick, 2002), arguing for the importance of complementary interventions such as social marketing toaccelerate and sustain community-wide adoption. In an early example from Egypt, Rogers (2005) documented the low levelof use of public spigots which had been installed by the Egyptian government to provide clean water to villages in the1960s, despite government media campaigns warning people of the risks from drinking canal water. Interviews conductedsubsequently found that users complained of a chemical taste of the chlorinated water and reported rumours that the
Fluids
FAECES
Fields
Flies
Fingers
Food New host
Waterquan�ty
Hand-washing
Waterquality
Sanita�on Fluids
FAECES
Fields
Flies
Fingers
Food New host
Waterquan�ty
Hand-washingHand-washing
WaterqualityWaterquality
Sanita�onSanita�on
Figure 3.3 F-diagram showing routes for faecal-oral transmission (Source: Adapted from Wagner & Lanoix, 1958).
3For example, in the Zimbabwe study reported here, households had lower disease rates if their neighbours had a latrine than if they did not (Root, 2001; see alsoIEG, 2008).4Clasen and team are using sophisticated monitoring apparatus to measure latrine use objectively in India: http://clinicaltrials.gov/ct2/show/NCT01214785
Sanitation and Hygiene in Africa24
government’s family planning programme had added chemicals to decrease population growth. Socially, the women preferredgathering water from the canal banks where they also washed their clothes and dishes; and because of long queues and low waterpressure there were reports of fighting in the queues. Ultimately, the piped water was perceived as unreliable. The study alsohighlighted that the government did not enrol village religious leaders in promoting the improved drinking water source.These findings have been echoed more recently in a study on implementation of water and sanitation improvements in Egypt(Roushdy et al. 2011), which suggests firstly that convenience and reliability of service are important for adoption, andsecondly that public awareness messages need to be reinforced by efforts to change behaviour at home.
3.3 THE WIDER HEALTH IMPACT OF SANITATIONWhilst the health impact literature for sanitation and hygiene is dominated by studies that focus on diarrhoea, these interventionsaffect a number of health outcomes. The links to childhood undernutrition and the role of poor access to sanitation ingender-based violence and insecurity are examined here in particular because of increasing interest globally but also becausestudies have been completed in or are underway in Africa now.
Beyond these two specific areas, though, there are a number of important health outcomes related to sanitation and hygienethat should be considered when estimating the full health impact of these interventions. There is an increasing body of evidencearound these wider effects but two in particular stand out: respiratory infections and helminth infections. On respiratoryinfections, which remain the leading cause of child deaths globally (Black et al. 2010), two systematic reviews have beenpublished with meta-analyses. Both reviews reported similar risk reductions of 23% (Rabie & Curtis, 2006) and 21% (Aielloet al. 2008) respectively for the effect of improved hygiene and respiratory infections. Helminth infections are responsiblefor 39 million DALYs which is similar to the combined global morbidity burden for malaria and tuberculosis (Stephensonet al. 2000). A recent systematic review for the effect of sanitation on helminth infections concluded that the availability anduse of latrines reduced the risk of infection by about 50% (Ziegelbauer et al. 2012).
It is estimated that undernutrition causes 2.2 million deaths and 21% of global disease burden for children younger than 5years (Black et al. 2008). There is growing attention to the effects of poor WASH on childhood undernutrition with WHOestimating that repeated bouts of diarrhoea and nematode infections cause up to 50% of childhood under-nutrition (WHO,2008). As diarrhoea causes undernutrition, it also reduces a child’s resistance to subsequent infections creating a viciouscircle (Brown et al. 2003). Further evidence suggests that sustained exposure to excreta-related pathogens – includinghelminths referred to above – in early life limits cognitive development and lowers immunity (Prüss-Üstün & Corvalán,2006) Critically, much of the damage that is done – particularly in the first two years of life – may be irreversible (WorldBank, 2006).
More recently it has been hypothesised that a key cause of child undernutrition is a subclinical disorder of the small intestineknown as tropical enteropathy or environmental enteropathy. This condition is characterised by increased gut permeability andnutrient malabsorption that may be caused by faecal bacteria ingested in large quantities by young children living in unhygienicconditions (Humphrey, 2009). Improved WASH offers the potential to reduce or prevent environmental enteropathy and itsadverse effects on growth through preventing faecal ingestion. Presenting at AfricaSan 3, Humphrey posited thatenvironmental enteropathy rather than diarrhoea may be the primary causal pathway by which sanitation influenceschildhood undernutrition – a hypothesis that is currently being tested in a large trial in Zimbabwe (Humphrey, 2009a).
Whilst there is growing interest in the links between sanitation and hygiene and undernutrition, there are still relatively fewhigh quality studies. A Cochrane systematic review for the effect of sanitation and hygiene, alongside water, on childhoodnutrition was begun in 2011 to review studies in this area (Dangour et al. 2011). This review found few high qualityinterventions studies, with most studies included being ranked as poor quality, and the only randomised controlled trialbeing for point of use water treatment (Du Preez et al. 2011). Partly in response to this lack of evidence, there are studiesunderway that, with the Humphrey study, will shed further light on this (Clasen et al. 2010; Luby et al. 2012).
WHO defines health as ‘a state of complete physical, mental and social well-being and not merely the absence of disease orinfirmity’ (WHO, 1948) yet much of the literature on the health impacts of sanitation is confined to disease transmission. Recentwork has highlighted other important dimensions that effect women specifically may go some way in further explaining why thevalue accorded to safe sanitation by women is often greater than that afforded by men.
UN Women estimates that 150 million under-18 girls suffered some form of sexual violence in 2002 alone5, and the WHOindicates that one in five women will experience rape or attempted rape in her lifetime. In Uganda, a Demographic Household
5UNIFEM, 2012.
Health impacts of sanitation and hygiene 25

Survey in 2006 showed that over 70% of women have experienced physical and or sexual violence (UNIFEM, 2012). Thecontribution of inadequate sanitation to these risks is rarely reported and difficult to quantify.
Quantifying these risks is critical to understanding the specific vulnerabilities and related health issues faced by women inrelation to poor access. Poor sanitation may be a greater concern for women due to wider gender-based discrimination thatincreases the need for privacy and enables sexual violence. While the physical consequences of sexual violence have beenwell-researched, the psychological and behavioural consequences are harder to document and quantify. The extent to whichlack of access to sanitation contributes to this problem has not been quantified but is likely to be more acute in high-densityurban environments as documented by Amnesty International (2011).
In the absence of more rigorous studies in this area, three case studies were completed in 2011 by two post-graduate studentsfrom the London School of Hygiene and Tropical Medicine (Massey, 2011; Lennon, 2011) and WaterAid in India. An analysisdrawing on these case studies conducted in slums in Kampala, Uganda and Delhi and Bhopal in India suggests that poorsanitation compounds existing vulnerabilities faced by women in slums and affects their health and well-being in multiple ways.
Many people living in slums are in rented accommodation, with their right to basic services either ignored by landlords orunacknowledged by authorities. Households rarely have private toilets, leading to reliance on communal toilet facilities,open defecation or methods such as defecating in buckets or in plastic bags. In the studies in Uganda and India, womenreferred to inadequate provision of toilets, poor maintenance and cleanliness of facilities, and the locking of public toilets atnight. Lack of provision for menstrual hygiene management was also mentioned, as well as unaffordable user fees.
Women are particularly vulnerable, in the absence of toilets, to violence and attack. This vulnerability is exacerbated as lackof sanitation leads to a violation of social and cultural expectations that female defecation and urination should not be visible.Women in Kampala emphasised that defecation should be kept secret and private, and it is shameful to be seen on the way to atoilet, especially during menstruation. Shame also prevents women from discussing the issue and its impact with each other. Thepractice of defecating in a bucket or plastic bag was particularly humiliating. Most women also identified the lack of privacy formenstrual hygiene management with changing pads or cloths as a serious problem.
Attempts to quantify the full extent of the health impact of poor sanitation and hygiene are fraught with difficulty but it is clearthat the combined health consequences are profound. Estimating the full health impact must take account of wide range ofdisease outcomes, as well as the effects on an individual’s state of complete physical, mental and social well-being. In turn,the costs of sanitation should be set against the full health, and indeed non-health benefits, associated which extend farbeyond diarrhoea.
3.4 CONCLUSIONPoor sanitation and hygiene are responsible for a large disease burden. Africa is the only region in the world where diarrhoea isthe leading cause of child mortality (Black et al. 2010) and promotion of sanitation and hygiene offers a cost-effective means oftackling this. The health impact of sanitation is far greater than that mediated by diarrhoea alone and affects the health andwell-being of populations through multiple and often overlapping pathways. As highlighted here, it is often vulnerablegroups who suffer most – whether this is children or women – which may explain why greater urgency has not beenattached to these interventions.
Whilst there is sufficient evidence to justify sanitation and hygiene as public health priorities, studies of higher quality are rareand higher quality studies conducted in African settings even rarer. The relative paucity of health impact literature for sanitationand hygiene reflects at least two issues: firstly, rigorous field trials of sanitation are logistically and technically challenging todeliver; and secondly, this area of research has historically been under-resourced. Fortunately in recent years, there has beenmore investment in this area with larger health impact evaluations underway to investigate the effect of sanitation ondiarrhoea as well as other outcomes such as undernutrition.
The WASH sector has traditionally placed greatest emphasis on health impacts for the purposes of advocacy, as a means tocapture political interest and mobilise greater levels of investment. As more studies are conducted in this area as a means to testthe efficacy of different delivery approaches, this evidence can and should also be used to inform the development of betterinterventions. This requires that studies collect more data on intermediary variables – such as the efficacy of technologies orcompliance – that will yield useful information for operational redesign. The information generated should be used to builddialogue with policy and practice audiences on how to maximise the health returns for sanitation and hygiene investments.Beyond the WASH sector, evidence on health impacts provides an important bridge to engage the wider health sector andstrengthen coordination across ministries and cadres.
While studies of the impact of WASH on health should not regularly form part of WASH service delivery, routine health datacan play a useful role in broader programme design and evaluation. National Health Management Information Systems (HMIS)
Sanitation and Hygiene in Africa26

gather routine data on several WASH-related health outcomes, and the identification of areas of high disease burden or frequentdisease outbreaks can help inform both WASH and health sector interventions.
When African ministers came together in 2008 to sign the ambitious eThekwini Declaration they did so ‘mindful that onemillion Africans die every year from sanitation, hygiene and drinking water-related diseases’. Poor sanitation - and theresulting deaths and disease – remain a major public health challenge in many countries in Africa but one that is now firmly onthe political agenda. Overcoming this challenge will require sustained investment and political leadership but the potentialreturns are huge and measured in lives saved. Whilst more evidence will strengthen our response, we have sufficientevidence now to act decisively to realise the potential health gains offered by accelerating progress on sanitation in Africa.
3.5 REFERENCESAiello A. E., Coulborn R. M., Perez V. and Larson E. L. (2008). Effect of hand hygiene on infectious disease risk in the community setting: a
meta-analysis. American Journal of Public Health, 98(8), 1372–1381.Barreto M. L., Genser B., Strina A., Teixeira M. G., Assis A. M. O., Rego R. F., Teles C. A., PradoM. S., Matos S. M. A., dos Santos L. A. and
Cairncross S. (2007). Effect of city-wide sanitation programme on reduction in rate of childhood diarrhoea in northeast Brazil: assessmentby two cohort studies. Lancet, 370, 1622–1628. doi:10.1016/S0140-6736(07)61638-9.
Black R., Cousens S., Johnso H. L., Lawn J. E., Rudan I., Bassani D. G., Jha P., Campbell H., Walker C. F., Cibulskis R., Eisele T., Liu L. andMathers C. (2010). Global, regional, and national causes of child mortality in 2008: a systematic analysis. Lancet, 375(9730), 1969–1987.
Birdthistle I., Dickson K., Freeman M. and Javidi L. (2011). What Impact does the Provision of Separate Toilets for Girls at School have ontheir Primary and Secondary School Enrolment, Attendance and Completion? A Systematic Review of the Evidence. MARCH Centre atLSHTM and EPPI-Centre, University of London, London. http://www.3ieimpact.org/en/evidence/systematic-reviews/details/70/(accessed 28 June 2013).
Brooker S. (2010). Estimating the global distribution and disease burden of intestinal nematode infections: Adding up the numbers –A review.International Journal for Parasitology, 40(2010), 1137–1144.
Cairncross S. and Valdmanis V. (2006). Water supply, sanitation and hygiene promotion. In: Disease Control Priorities in DevelopingCountriesD. Jamison, J. Breman, A. Measham, G. Alleyne, M. Claeson, D. Evans, P. Jha, A. Mills and P. Musgrove (eds), 2nd edn.,Oxford University Press, New York.
Cairncross S., Hunt C., Boisson S., Bostoen K., Curtis V., Fung I. and Schmidt W.-P. (2010). Water, sanitation and hygiene for the preventionof diarrhoea. International Journal of Epidemiology, 39, i193–i205. doi:10.1093/ije/dyq035
Clasen T. F., Bostoen K., Schmidt W. P., Boisson S., Fung I. C. H., Jenkins M.W., Scott B., Sugden S. and Cairncross S. (2010). Interventionsto improve disposal of human excreta for preventing diarrhoea. Cochrane Database of Systematic Reviews, (6). Art. No.: CD007180. doi:10.1002/14651858.CD007180.pub2.
Curtis V. and Cairncross S. (2003). Effect of washing hands with soap on diarrhoea risk in the community: a systematic review. LancetInfectious Diseases, 3, 275–281.
Dangour A. D., Watson L., Cumming O., Boisson S., Velleman Y., Cavill S., Allen E. and Uauy R. (2011). Interventions to improve waterquality and supply, sanitation and hygiene practices, and their effects on the nutritional status of children. Cochrane Database ofSystematic Reviews, (10). Art. No.: CD009382. doi: 10.1002/14651858.CD009382.
Ejemot R. I., Ehiri J. E., Meremikwu M. M. and Critchley J. A. (2008). Hand washing for preventing diarrhoea. Cochrane Database ofSystematic Reviews, (1). Art. No.: CD004265. doi: 10.1002/14651858.CD004265.pub2.
Esrey S. A., Potash J. B., Roberts L. and Schiff C. (1991). Effects of improved water supply and sanitation on ascariasis, diarrhoea,dracunculiasis, hookworm infection, schistosomiasis and trachoma. Bulletin of the World Health Organization, 69, 609–621.
Fewtrell L., Kaufmann R. B., Kay D., Enanoria W., Haller L. and Colford J. (2005). Water, sanitation, and hygiene interventions to reducediarrhoea in less developed countries: a systematic review and metaanalysis. Lancet Infectious Diseases, 5, 42–52.
Garrett V., Ogutu P., Mabonga P., Ombeki S., Mwaki A., Aluoch G., Phelan M. and Quick R. (2008). Diarrhoea prevention in a high-risk ruralKenyan population through point-of-use chlorination, safe water storage, sanitation, and rainwater harvesting. Epidemiology andInfection, 136(11), 1463–1471.
Haggerty P. A., Muladi K., Kirkwood B. R., Ashworth A. andManuneboM. (1994). Community based hygiene education to reduce diarrhoealdisease in rural Zaire: impact of the intervention on diarrhoeal morbidity. International Journal of Epidemiology, 23(5), 1050–1059.
Independent Evaluation Group (IEG) (2008). What Works in Water Supply and Sanitation: Lessons from Impact Evaluation. World Bank,Washington DC.
Jalan J. and Ravallion M. (2003). Does piped water reduce diarrhea for children in rural India? Journal of Econometrics, 112, 153–173.Kawata K. (1978). Water and other environmental interventions – the minimum investment concept. American Journal of Clinical Nutrition,
31, 2114–2123.Lennon S. (2011). Exploring the Link Between a Lack of Access to Water and Sanitation Facilities and Sexual Violence Against Women in
Delhi, India. MSc dissertation, London School of Hygiene and Tropical Medicine, Mimeo.Massey K. (2011). Sanitation, Safety and Shame: A Qualitative Study Examining the Impact of Inadequate Sanitation on Women in the Urban
Slums of Kampala, Uganda. MSc dissertation, London School of Hygiene and Tropical Medicine, Mimeo.
Health impacts of sanitation and hygiene 27

Messou E., Sangaré S. V., Josseran R., Le Corre C. and Guélain J. (1997). Effect of hygiene and water sanitation and oral rehydration ondiarrhoea and mortality of children under five in rural area of Côte d’Ivoire. Bulletin de la Societé de Pathologie Exotique, 90(1), 44–47.
Quick R. E., Kimura A., Thevos A., TemboM., Shamputa I., Hutwagner L. andMintz E. (2002). Diarrhea prevention through household-levelwater disinfection and safe storage in Zambia. American Journal of Tropical Medicine and Hygiene, 66(5), 584–589.
Rabie T. and Curtis V. (2006). Handwashing and risk of respiratory infections: a quantitative systematic review. Tropical Medicine andInternational Health 11(3), 258–67.
Rogers E. M. (2005). Diffusion of Innovations. 5th edn., The Free Press, New York.Root G. P. M. (2001). Sanitation, community environments, and childhood diarrhoea in rural Zimbabwe. Journal of Health, Population and
Nutrition, 19(2), 73–82.Roushdy R., Sieverding M. and Radwan H. (2011). The Impact of Water Supply and Sanitation on Child Health: Evidence from Egypt.
Population Council, Egypt Office. Available at: http://popcouncil.org/publications/wp.asp (accessed 6 September 2013).Schmidt W. P. and Cairncross S. (2009). Household water treatment in poor populations: is there enough evidence for scaling up now?.
Environmental Science & Technology, 43(4), 986–992.UNIFEM (2012). Facts and figures – violence against women. http://www.unifem.org/gender_issues/violence_against_women/facts_
figures.php (accessed 28 June 2013).Waddington H. and Snilstveit B. (2009). Effectiveness and sustainability of water, sanitation and hygiene interventions to combat childhood
diarrhoea in developing countries. Journal of Development Effectiveness, 1(3), 295–330.Wagner E. G. and Lanoix J. N. (1958). Excreta Disposal for Rural Areas and Small Communities, World Health Organization Monograph
Series No. 39, WHO, Geneva.Wright J., Gundry S. and Conroy R. (2004). Household drinking water in developing countries: a systematic review of microbiological
contamination between source and point-of-use. Tropical Medicine and International Health, 9(1), 106–117.WHO (1948). Preamble to the Constitution of the World Health Organization as adopted by the International Health Conference, 19–22 June,
1946, New York. http://www.who.int/about/definition/en/print.html (accessed 28 June 2013).WHO/UNICEF (2012). Progress on Drinking Water and Sanitation: 2012 Update. Available at: www.wssinfo.org (accessed 6 September
2013).
Sanitation and Hygiene in Africa28

Chapter 4
Economics of inadequate sanitation in Africa
Sophie Hickling and Guy HuttonWater and Sanitation Program
The Economics of Sanitation Initiative (ESI) in Africa aims to enhance understanding of the economic impacts and costs tosociety of poor sanitation. Whereas there is a considerable literature on the health benefits of sanitation (see chapter 3) theevidence base supporting the economic arguments for investing in sanitation is weak. Current allocations to sanitation acrossAfrica are low; in most cases less than 0.1% of Gross Domestic Product (GDP) (AMCOW et al. 2011). More funds andbetter-selected and managed programmes are needed to meet the sanitation MDG target. Economic evidence plays a keyrole in advocating for sanitation investments and enabling decision makers to make efficient choices.
This chapter presents the methods used by the ESI in Africa, selected results from 18 African countries1, and adiscussion regarding how economic evidence from ESI is being used and how it can be augmented to deepen its impactin the future.
4.1 METHODOLOGYThe desk study on the total economic cost of poor sanitation was estimated using a list of potential damages drawn up andapplied across all countries specifying the factors that are assumed to have the greatest negative impact on society. Themethodology was similar to that developed by the Water and Sanitation Program for earlier ESI studies in five countries ofSoutheast Asia1 and also used in three South Asian countries.2 Given the large number of African countries in which ESIwas to be applied, a simplified methodology with fewer variables was developed based on the main contributors toeconomic impact found in the Asian studies.
The negative economic impacts of inadequate sanitation included in the total economic impact estimates for Africa werehealth care costs of treating diseases associated with poor sanitation, value of the time lost from productive activities due tothe included diseases, value of premature deaths, and time lost accessing the site of open defecation. Disease cases includediarrheal disease for the entire population, as well as increased vulnerability to malaria and respiratory infection for childrenunder five, via the impact of repeated cases of diarrheal disease on malnutrition and the immune function.3
Rates of disease and treatment seeking, as well as rates of sanitation access, were accessed from Demographic and HealthSurveys (DHS), Multiple Indicator Cluster Surveys (MICS), and the Joint Monitoring Programme for Water Supply andSanitation (JMP). The economic costs of treating cases – both outpatient and inpatient care – were taken from the globaldatabase on health care costs maintained by WHO (using the WHO-CHOICE database for 2012). The value of time wasestimated using 30% of the GDP per capita, valued at an hourly rate, recognizing that people value time savings even if it isnot all used for productive activities and/or actual income earning. The value of life was estimated using the human capitalapproach (HCA), which aggregates the discounted future income stream of a person who dies prematurely at different ages.
1Studies for Cambodia, Indonesia, Lao PDR, Philippines and Vietnam can be downloaded from www.wsp.org2Studies for Bangladesh, India and Pakistan can be downloaded from www.wsp.org3For methodological details and algorithms see Annex A and Annex B of WSP, 2011.

Compared to other methods of valuation of life, such as the value-of-statistical-life (VSL),4 the human capital approach providesmore conservative (i.e., lower) estimates of the value of life. HCA produces value of life estimates of between US$ 1700 and US$62,000 across the 18 countries, variable according to GDP per capita; the VSL methodology produces estimates of over fourtimes the HCA values, of between US$ 8000 to US$ 280,000.
Past global and regional studies indicate a major share of the quantified economic costs are accounted for by lack of access tonearby drinking-water source and sanitation facilities (Hutton & Haller, 2004). However, except for a few national surveysin Africa that collect information on time and distance to water source, there is a lack of information on total watercollection times and sanitation access times. To fill this gap, an informal survey was conducted of 25 sanitation experts inAfrica to estimate the average time per family for a roundtrip to their place of open defecation (experts were mainly thosewho had first hand experience of visiting open defecation sites through CLTS triggering exercises). While the estimates ofthe experts varied based on a range of different country locations and field experiences, the average value of 10 minutes perround trip for open defecation was taken as the loss in time for all countries included in the ESI study. A conservative valueof one trip per day was assumed, thus considering only defecation and not urination.
Additional quantified impacts such as funeral costs, loss of tourism and cholera epidemics were also estimated and presentedseparately from the total economic losses. Although these are likely to be significant, they are difficult to estimate and weretherefore not included in the overall costs of the model.
Underlying data sets to estimate economic impacts are weak; the study therefore used objectively verified data sources andconservative numbers to estimate economic impacts. Other impacts that were partially valued in the Asian country studies, suchas economic losses associated with water pollution and land degradation, were excluded due to lack of data in Africa that couldbe easily compiled from surveys and government records. Welfare impacts such as loss of dignity, privacy, social status, andsecurity were omitted due to difficulties in valuing these impacts in monetary terms. Therefore the total costs of poorsanitation presented in this chapter are likely to be a significant underestimate of the real welfare impacts of poor sanitationon society.
4.2 RESULTSThe key results of the Economics of Sanitation Initiative in Africa can be seen in Table 4.1.5 The 18 African countries studied sofar6 are losing a combined total of almost US$ 5.5 billion each year due to poor sanitation. At national level these economiclosses are equivalent to between 1% and 2.5% of GDP.
The results of the Economics of Poor Sanitation in Africa initiative can be broken down between mortality, health care, accesstime and health-related productivity. The following paragraphs elaborate on the types of costs included in the study, givingcountry examples of each.
Premature death. In all countries, premature death, directly or indirectly attributable to sanitation, constitutes the largest costfound (reflecting between 48%–90% of the total costs of poor sanitation). For example in Burkina Faso the cost of prematuredeath due to poor sanitation is estimated at US$ 136 million each year, 80% of the total costs of poor sanitation. Directlyattributable deaths include the 88% of diarrhoeal deaths attributed to the faecal-oral route. Indirectly attributable deathsinclude those deaths for which poor sanitation is a contributing factor through its impact on malnutrition, for example as aleading cause of child mortality such as malaria, ALRI and measles.7
Health Care. Diarrhoeal disease directly, and indirectly via malnutrition (and its consequences for other diseases such as ALRIand malaria) is a leading cause of morbidity and associated costs. In Ghana health care costs due to poor sanitation areapproximately US$ 54 million annually – placing a heavy burden on households and government spending. For healthcarecosts the study used disease rates and treatment seeking behaviour information to estimate outpatient and inpatient costssuch as consultation, medication, and patient travel costs. These health care estimates present a compelling argument foraddressing sanitation as a priority within the health sector also.
4Due to lack of value-of-statistical-life studies in Africa, a median value of VSL studies from developed countries of US$ 2 million was adjusted to Africancountries based on the ratio difference in GDP per capita.5Although presented together for reporting purposes, the study is not designed to be able to draw direct comparisons between counties.6Accounting for 489 million people, approximately half the total African population.7Indirect deaths were estimated using attributable fractions based on data from WHO (Fishman et al. 2004).
Sanitation and Hygiene in Africa30

Productivity losses. Productive time lost takes into account time absent from work or school due to diseases attributed to poorsanitation, seeking treatment from a health centre or hospital, and time spent caring for children under five years of age sufferingfrom these diseases. As primary caregivers, these costs, which in Kenya amount to US$ 2.7 million per year, fall most heavilyon women.
Access time. Each person practicing open defecation spends almost 2.5 days each year finding a private location to defecate.Valued at 30% of the daily GDP per capita for adults, and 15% of the daily GDP per capita for school-aged children, thisleads to substantial economic losses. For example, in Niger where 79% of the population practice open defecation, accesstime costs an estimated US$ 23 million annually. Again, this costs falls disproportionately on women as caregivers who mayspend additional time accompanying young children or sick or elderly relatives. As noted earlier, urination was not includeddue to the complexity of the issue and absence of data – therefore this cost is likely to be an underestimation as thosewithout toilets, particularly women who will be obliged to find a private location for urination as well as for defecation.
Open defecation emerged clearly as the most costly form of unimproved sanitation, due to the continued high rates of opendefecation practice in Africa. Across the 18 study countries open defecation accounts for US$ 2 billion every year. In mostcountries open defecation costs more per person than any other type of unimproved sanitation as shown in the example fromUganda (Figure 4.1) where open defecation costs US$ 3 more per person practicing open defecation compared with either aprivate but unimproved latrine or a shared latrine. The additional costs for open defecation are mainly due to access timetaken to travel to and find a safe, private location for defecation. In all cases the cost of open defecation as a proportion oftotal costs far exceeds the proportion of people actually practising open defecation – for example in Kenya 15% of the
Table 4.1 Key results from 18 study countries.
Population(millions)
Annual cost of poorsanitation to thenational economy(US$ millions)
Nationaleconomic lossas % GDP
Annual cost ofopen defecation(US$ millions)
Number oflatrines requiredto eliminate opendefecation(approximate)
Benin 8.8 104 1.5 75 1,000,000
Burkina Faso 15.8 171 2.0 124 2,000,000
Central AfricanRepublic
4.7 26 1.2 9.1 200,000
Chad 10.3 156 2.1 114 1,500,000
Congo, Rep of 4.0 144 1.1 20 65,000
Congo, DemRep of
68.7 208 1.6 32 1,500,000
Ghana 23.9 290 1.6 79 1,000,000
Kenya 39.0 324 0.9 88 1,200,000
Liberia 3.6 17.5 2.0 11 350,000
Madagascar 20.7 103 1.0 48 1,500,000
Malawi 15.0 57 1.1 14 300,000
Mauritania 3.1 41 1.2 30 350,000
Mozambique 21.7 124 1.2 70 2,000,000
Niger 15.3 148 2.4 128 2,000,000
Nigeria 149 3,000 1.3 1,000 6,500,000
Tanzania 41.0 206 1.0 46 1,000,000
Uganda 32.4 177 1.1 41 650,000
Zambia 11.9 194 1.3 71 420,000
TOTAL 489 5,500 1.48 2,000 23,500,000
8Average proportion of GDP.
Economics of inadequate sanitation in Africa 31

population practise open defecation but open defecation costs account for 27% of total costs. These findings highlight the urgentneed to address open defecation as a priority.
Open defecation also has considerable social costs. Loss of dignity and privacy, risk of physical attack and sexual violenceare not easily valued in monetary units. However, these are common events and concerns of those who lack privatesanitation facilities.
Costs associated with shared sanitation are likely to be higher if information on time taken to reach and queue at a publiclatrine as well as user-fees were included. As it is not possible to estimate the proportion of public latrine users in the sharedlatrine category, these costs were not included in the model.
Also important to note is that health costs cannot easily be assigned across latrine categories.9 There exists inadequate data onhealth risk differences between open defecation and sanitation technologies or options that are classified as ‘unimproved’.Hence, health costs per capita are estimated as the same, but in reality they may differ, depending on specific practices,defecation locations and environmental factors. Indeed, sanitation is recognized as a public health issue – people are affectedby the sanitation status of their neighbours and community as well as their own and the costs of poor sanitation practices arefelt throughout the community.
An important finding of the study was that the burden of poor sanitation falls disproportionately on the poor. The average costof poor sanitation constitutes a much greater proportion of a poor person’s income than that of a wealthy person, as shown in theexample taken from Liberia (Figure 4.2). Not only that, but there exists considerable inequality in sanitation access: in allcountries the poorest quintile is more likely to practice open defecation than the wealthiest quintile. Poverty is therefore adouble-edged sword, the poorest are not only more likely to have poor sanitation, but they also have to pay proportionatelymore for the negative effects it has. Pro-poor implementation approaches and sanitation solutions need to be developed andapplied to mitigate this inequity.
Figure 4.1 Cost per capita of different types of unimproved sanitation in Uganda.
9There is a lack of scientific evidence to enable distinction between the health impacts of different types of unimproved sanitation, however an attempt to do sowas made through disaggregation of diarrhoea rates by unimproved category.
Sanitation and Hygiene in Africa32
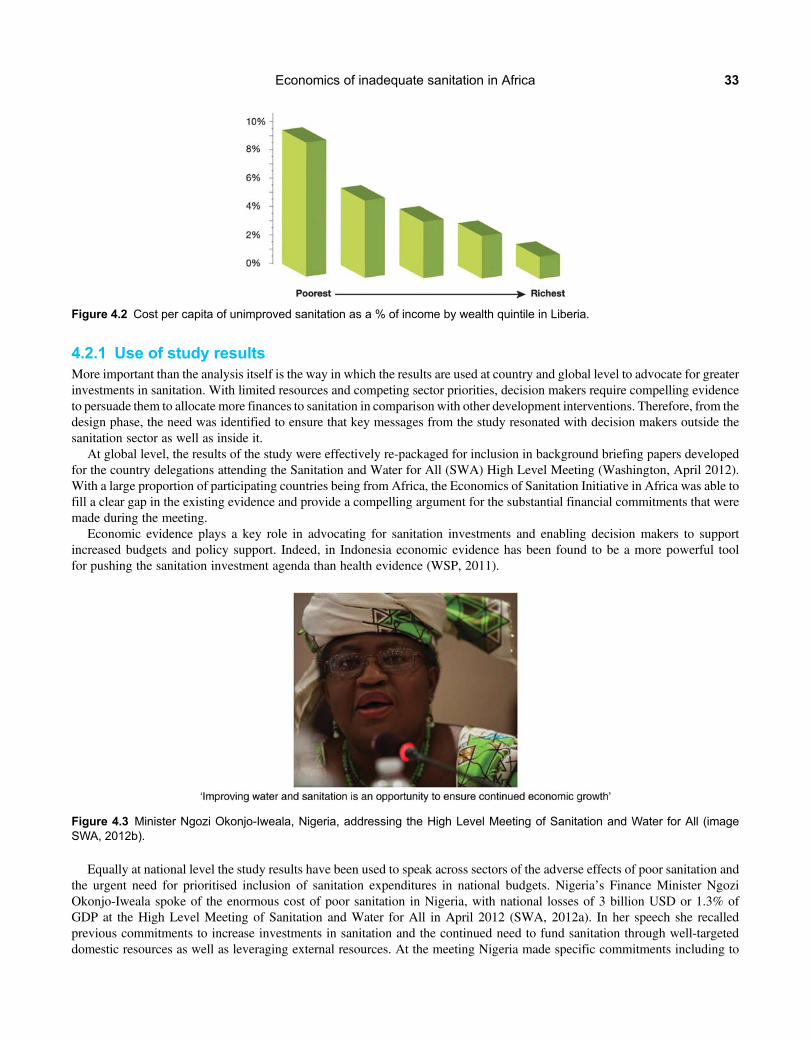
4.2.1 Use of study resultsMore important than the analysis itself is the way in which the results are used at country and global level to advocate for greaterinvestments in sanitation. With limited resources and competing sector priorities, decision makers require compelling evidenceto persuade them to allocate more finances to sanitation in comparison with other development interventions. Therefore, from thedesign phase, the need was identified to ensure that key messages from the study resonated with decision makers outside thesanitation sector as well as inside it.
At global level, the results of the study were effectively re-packaged for inclusion in background briefing papers developedfor the country delegations attending the Sanitation and Water for All (SWA) High Level Meeting (Washington, April 2012).With a large proportion of participating countries being from Africa, the Economics of Sanitation Initiative in Africa was able tofill a clear gap in the existing evidence and provide a compelling argument for the substantial financial commitments that weremade during the meeting.
Economic evidence plays a key role in advocating for sanitation investments and enabling decision makers to supportincreased budgets and policy support. Indeed, in Indonesia economic evidence has been found to be a more powerful toolfor pushing the sanitation investment agenda than health evidence (WSP, 2011).
Equally at national level the study results have been used to speak across sectors of the adverse effects of poor sanitation andthe urgent need for prioritised inclusion of sanitation expenditures in national budgets. Nigeria’s Finance Minister NgoziOkonjo-Iweala spoke of the enormous cost of poor sanitation in Nigeria, with national losses of 3 billion USD or 1.3% ofGDP at the High Level Meeting of Sanitation and Water for All in April 2012 (SWA, 2012a). In her speech she recalledprevious commitments to increase investments in sanitation and the continued need to fund sanitation through well-targeteddomestic resources as well as leveraging external resources. At the meeting Nigeria made specific commitments including to
Figure 4.3 Minister Ngozi Okonjo-Iweala, Nigeria, addressing the High Level Meeting of Sanitation and Water for All (imageSWA, 2012b).
Figure 4.2 Cost per capita of unimproved sanitation as a % of income by wealth quintile in Liberia.
Economics of inadequate sanitation in Africa 33

progressively increase budget allocations for sanitation up to 0.5%GDPwithin the next 3 years targeting rural areas, urban slumsand underserved states (Nigeria, 2012).
4.3 NEXT STEPSThe study has so far raised awareness of the negative consequences of poor sanitation on 18 national economies and furthereconomic impact studies are planned. Once increased financial commitments have been secured the question remains ofwhere finances should be targeted to generate the largest returns. To respond to this need for further economic evidence, andto deepen the impact of the ESI Phase 1 in Africa, a second phase – ‘toolkit’ – is planned. This toolkit will supportGovernments and stakeholders to assess the costs and the benefits of improving sanitation in terms of the technologicaloptions chosen as well as the programmatic approach for delivering sanitation interventions. The toolkit will include detailedassessment of the costs and impacts of different financing, partnership, institutional and marketing approaches in selectedcountries and provide a valuable tool to help decision makers make efficient choices to address the sanitation gap.
4.4 REFERENCESAMCOW, WSP, UNICEF, WaterAid and CREPA (2011). Sanitation and Hygiene in Africa at a Glance: A Synthesis of Country Priority
Actions. Available at: http://www.wsp.org/sites/wsp.org/files/publications/WSP-2011-Sanitation-&-Hygiene-in-Africa-at-a-Glance.pdf (accessed 10 September 2013).
Fishman S., Caulfield L., de Onis M., Blössner M., Hyder A., Mullany L. and Black R. (2004). Childhood and maternal underweight. In:Comparative Quantification of Health Risks: Global and Regional Burden of Disease due to Selected Major Risk Factors, M. Ezzati,A. Rodgers, A. Lopez and C. Murray (eds), WHO, Geneva.
Hutton G. and Haller L. (2004). Evaluation of the Costs and Benefits of Water and Sanitation Improvements at Global Level. WHO, Geneva.Nigeria (2012). High Level Meeting on Sanitation and Water for All: Nigeria Statements of Commitment. Available at: http://www.
sanitationandwaterforall.org/files/Nigeria_Statement_to_2012_HLM_EN.pdf (accessed 9 July 2012).SWA (2012a). Address to Sanitation and Water for All, High Level Meeting. Washington. Available at: http://www.youtube.com/watch?
v=tlMzKY3lelQ (accessed 9 July 2012).SWA (2012b). Second High Level Meeting of Sanitation and Water for All (SWA): PHOTO SUMMARY. Available at: http://www.
sanitationandwaterforall.org/files/2012_SWA_HLM_Photo_Essay_(17_May)_FINAL.pdf (accessed 9 July 2012).WSP (2008). Economic Impacts of Sanitation in Southeast Asia. World Bank, Available at: http://www.wsp.org/sites/wsp.org/files/
publications/Sanitation_Impact_Synthesis_2.pdf (accessed 10 September 2013).WSP (2011). Evaluating the Political Economy for Pro-Poor Sanitation Investments. Research Brief. World Bank, Available at: https://www.
wsp.org/sites/wsp.org/files/publications/WSP-Political-Economy-Sanitation-Brief.pdf (accessed 10 September 2013).
Sanitation and Hygiene in Africa34

Chapter 5
Equity and inclusion in sanitation and hygienein Africa
Archana Patkar1 and Louisa Gosling21Water Supply and Sanitation Collaborative Council2WaterAid
This chapter reviews the scale and scope of inequity and inclusion in sanitation and hygiene Africa and the attitudinal,environmental and institutional barriers preventing access for marginalized groups. It uses case studies on menstrualhygiene, people living with aids and sexual violence to demonstrate how support measures are needed to overcome specificimpediments that stand in the way of excluded groups accessing safe services. It concludes with a discussion of thediscrete roles that need to be played by different agencies within a shared responsibility to apply an equity approach in Africa.
5.1 THE PROBLEMAt the start of the second decade of the 21st century we are faced with the fact that over 200 million men, women and childrendefecate in the open every day in Africa, contributing to poverty, disease and death and to some of the poorest standards ofhygiene in the world. Open defecation, a multi-dimensional problem is the extreme manifestation of a stark sanitation situation.
There are two facets to the problem in Africa, both of which are unacceptable.The first is a problem of scale. Hundreds of millions of people in Africa continue to practice open defecation, especially in
rural areas: a silent sanitation crisis that impairs progress in the region. African countries are most off-track to reach theMillennium Development Goals for sanitation. Only nine countries are on track across the continent. Northern Africa alreadysurpassed its MDG sanitation target – all other regions are set to miss it (See Figure 5.1).
On track:Coverage rate in 2008 >95%, or was within 5 per cent of the 2008 rate required to meet the MDG target
Progress but insufficient:Coverage rate in 2008 was between 5 per cent and 10 per cent below the 2008 rate required to meet the MDG target
Not on track:Coverage rate in 2008 was the same or lower than the rate in 1990 or more than10 per cent below the 2008 rate required to meet the MDG target
No or insufficient data:Data were unavailable or insufficient to estimate trends
Practice of open defecation, 2008
No open defecation
1% – 10%
11% – 25%
26% – 50%
More than 50%
No or insufficient data
Figure 5.1 Maps showing extent of open defecation and progress towards MDGs by country in Africa (2012).

Sanitation programmes face multiple challenges: poverty, weak or corrupt administration, lack of awareness of personalhygiene (specifically hand washing and the link between exposed faeces and transmission of germs) difficult physicalconditions, such as hard rock and high water tables which make the construction, maintenance and use of hygienic toilets,difficult or unsustainable. Sanitation is major challenge in situations of conflict or unrest, or with refugee situations. Theissue is one of breaking the inertia, accelerating and scaling up appropriate sanitation programmes. Changing sanitationbehaviour also involves changing the habits of a lifetime.
The second, and in many ways more pernicious problem, is that of exclusion, where different categories of people are notable to access and use safe sanitation facilities. Those excluded include those the socially and economically marginalized andpeople who cannot use standard designs. For example, women, children, older people, pregnant women, people with disabilitiesor living with HIV/Aids or other chronic illnesses, and geographically marginalized populations in remote areas. The‘excluded’, are not only people who suffer from ‘asset poverty’, but also those who are shut out for social reasons. Data andanalysis from the region show that:
• The gains in sanitation have been primarily concentrated in the richer segments of the population; in Africa, the poorestquintile is 20 times more likely to practice open defecation than the richest quintile (See Figure 5.2).
• The richest 20 per cent of the population in sub-Saharan Africa is almost five times more likely to use an improvedsanitation facility than the poorest 20 per cent.
There is strong evidence of the huge economic costs associated with neglecting sanitation, specifically open defecation, and theresulting burden of disease. Water Aid estimates a yearly 15 billion-dollar economic cost to the continent if the MillenniumDevelopment Goal (MDG) targets for water and sanitation are not met in terms of avoidable household and public healthexpenditure, losses in productivity because of morbidity, and opportunity costs based on loss of time.
Conventional wisdom has been that more lives are saved in poor countries by focusing on the ‘low hanging fruit’ – those mostreadily reached by extending proven interventions through traditional service delivery modes, thus effectively reaching largenumbers of people. To focus on the marginalized, although right in principle, was generally not perceived as being cost-effective.
However, a review of evidence and experience conducted by UNICEF in mid-2010 (UNICEF, 2010) suggests that:
• Excluded populations within countries generally have a larger proportion of children than other groups, owing to higherfertility rates. As their rates of child mortality are also often considerably higher than those of more affluent groups, theirburden of child deaths constitutes a large share of the national total;
• In excluded populations, a higher proportion of children die of preventable or treatable infectious diseases or conditionsthan the children of other groups;
• Most excluded populations have much lower levels of coverage of cost-effective interventions with a proven high impactin reducing major childhood diseases and conditions.
Eastern Africa78 million
Southern Africa35 million
Central Africa15 million
Northern Africa7 million
Western Africa86million
222 million people in Africa practised opendefecation in 2010
8 6
13 13
22 27
57
1990 2010 1990 2010 1990 2010
54
4432
23
26
811
2531
4432
OpenDefecation
Sanitation coverage trends, Africa, 1990 – 2010
Unimprovedfacilities
Sharedfacilities
Improvedfacilities
23
26
811
2531
Urban Rural Total
Figure 5.2 Sanitation status by wealth quintile in Africa (AMCOW, 2012).
Sanitation and Hygiene in Africa36

Consequently, these populations have the greatest scope for gains in survival and development outcomes in the next five years.The study concludes that an equity-focused approach will accelerate progress towards the health MDGs faster and it will beconsiderably more cost-effective and sustainable than the current path. But mere commitment to action will not serve thecause of the excluded, unless policies, investments and actions are based on the principle of equity which is essentially theprinciple of fairness.
Equity involves recognising that people are different and require specific support and measures to overcome the specificimpediments that stand in the way of their being able to access and use services sustainably, in this case safe sanitation andadopting hygiene practices.
• At a local level this would mean examining the context in which people live, work and play, and identifying the immediatebarriers which stand in the way of people using hygienic toilets and washing their hands.
• At higher administrative levels such as provincial, state or national levels, equity would be served by directing moreresources to areas and communities with low sanitation coverage, and approaches that ensure that every individual hasthe means as well as the responsibility to use and maintain sanitation facilities and wash hands with soap, to ensuretheir own as well as their neighbour’s health and well-being.
• Equity principles must also apply in special situations that warrant special attention. Emergencies affect millions of peoplein Africa every year: floods, droughts, earthquakes, landslides and civil strife displace large numbers of people. Often,more than half of those displaced are children under the age of 18 (UNICEF, 2012; Save the Children, 2012; James,2010). With two thirds of Africa’s population practicing open defecation, maintaining camps for the displaced, free ofopen defecation and with adequate safe drinking water and water for hygiene practices is a major challenge. Howeverit is a fundamental right that cannot be denied.
5.2 THE WAY FORWARDAnd so while the case for action cannot be questioned, the action needs to be based on the principle of equity, which requiresclear identification of and effective response around specific barriers in the following three categories:
• Attitudinal barriers arise essentially from a lack of respect, which results in isolation, prejudice, stigma, misinformationand lack of self-confidence of those who are marginalized. Attitudinal barriers are responsible for much of the socialexclusion experienced by people with disabilities or people living with HIV, as well as for the disproportionate burdenplaced on women and girls in the region – as de facto managers of water, toilets, household and communitycleanliness in general, and the teachers of their children and the next generation. These barriers are also responsible fortaboos that prevent us from talking about and then ensuring that sanitation facilities address the practical washing anddisposal needs linked to menstruation for women and girls, imprisoning millions of adolescent girls and women everymonth and keeping them away from school, work and play.
• Environmental barriers impede physical accessibility to infrastructure and to communication; for example, toilet and squatpan designs which are difficult to use for people with disabilities, older people and pregnant women, pans and traps that areimproperly sized anddaunting for young children and the lack of suitable options forwater logged areas, sandy soils or floodprone areas, or communication materials which cannot be deciphered by illiterate people, or those who are blind or deaf.
• Institutional barriers cover a host of issues, acts of omission, such as lack of specific policies for the excluded includingfinance, knowledge, skills and consultation mechanisms, and acts of commission such as administrative and financialcorruption. Poor accountability mechanisms perpetuate weak governance, wherein government and civil societyofficials as well as elected representatives remain systematically blind to the deplorable conditions of the urban andrural poor, especially the most marginalized groups.
All the above barriers are clearly visible in an analysis of excluded minorities. But practitioners at AfricaSan also pointed out theneed to focus on the silent majorities’ that is, youth or the elderly who have particular life cycle needs that are also ignored inservice design and delivery.
Formidable though these barriers may seem, there are examples throughout the world of individuals and organizations thathave overcome these barriers and brought about significant change through their passion, commitment, innovation and systems.There is therefore no reason why committed action, based on the principles of equity and inclusion, cannot work on asignificant scale.
The examples that follow are from different countries with their own governance systems and unique challenges. Theyprovide evidence of exclusion in relation to sanitation and hygiene, and they show how it is possible to address the barriers,attitudinal, environmental and institutional in their own context.
Equity and inclusion in sanitation and hygiene in Africa 37

5.3 CASE STUDIES5.3.1 Case study 1: Menstrual Hygiene – initiatives in Zimbabwe, Rwandaand other countriesZimbabwe is responding in several ways to demands for initiatives in Menstrual Hygiene Management. Aquamor, a local NGO,has produced a guide to menstrual management for school girls. This is based on the guide for school girls to understand andmanage menstrual hygiene problems in Tanzania. The booklet is based on the previous work by produced by Marni Sommer ofColumbia University (USA). Sommer has produced a simple booklet to help school girls in Tanzania to understand and managetheir menstrual management problems. The Zimbabwean version of the booklet covers real stories by girl children on how theymanage their menses. The testing of this booklet in Zimbabwe was conducted with the help of Malaika Mushandu, a former MissZimbabwe and an ambassador for sanitation and hygiene.
Sustainable Health Enterprises (SHE), Rwanda is a social venture using holistic approaches to address social problems inAfrica, Asia, and South America. SHE‘s first initiative, she28, is addressing girls’ and women’s lack of access to affordablemenstrual pads to address the issue of absenteeism from school and/or work – up to 50 days per year – she28 is stemmingthese significant costs by developing a franchise model to manufacture and distribute affordable, eco-friendly menstrual padsfor girls and women by sourcing local, inexpensive raw materials (e.g., banana fibers) and leveraging existing networks.she28’s solution incorporates three components: education, advocacy, and business development. Education equips allmembers of the community with essential information about reproductive, sexual health and menstrual and hygienemanagement. Advocacy mitigates the taboo of menstruation causing improved health status and positive policy change.Local entrepreneurs launch businesses to make and distribute menstrual pads, ensuring that women and girls are able tomanage their menstruation hygienically (Sustainable Health Enterprises, 2012).
5.3.2 Case study 2: People living with HIV/////AidsPeople living with HIV and Aids are the most discriminated against in society, economically, socially and psychologically. Theimmune-compromised status of PLHA renders them more susceptible to opportunistic WASH related infections like diarrhoea,which is experienced by over 90% of patients with AIDS. Easily accessible and sufficient water and sanitation are indispensablefor people living with HIV and AIDS as well as for the provision of home-based care to AIDS-affected persons.
In Malawi, an assessment of water, sanitation, and hygiene in the context of Home-Based Care for PLHIV was carried out byCRS in partnership with the Catholic Development Commission of Malawi (CADECOM) in 2006 as part of a six-country study.The findings showed that HBC clients regularly falling ill due to diarrhoea had unmet water and sanitation needs. In response tothe assessment, CRS with support from WHO and USAID, implemented a pilot project in Malawi to identify household-scalechanges or actions that could improve WASH conditions for PLHIV during 2008–2009. The project focused on practical waysto promote key behaviours including: training and linking with existing HBC and community-based childcare centresat the community level to increase their capacity in WASH and HIV care. Mobilization of community volunteers tonegotiate small, do-able actions, complemented by creative community sensitization activities is an effective strategy forpromoting WASH behaviours in HIV affected communities without creating undue stigma (Lockwood et al. 2006; Seremetet al. 2010).
5.3.3 Case study 3: Hope out of conflict – How sanitation plays a vital role in protectingwomen and children from sexual violence in DRCWorking in the North-Kivu province of DRC, the Programme de Promotion de Soins Santé Primaires (PPSSP) takes aninnovative approach to addressing the needs of women and children. Sexual violence is a common tragedy facing womenand children in eastern Congo. Diseases, such as cholera, diarrhoea and nematode infections resulting from poor water,sanitation and hygiene are also commonplace in the area. The links between sanitation and sexual violence become apparentwhen, due to lack of access to private latrines, women faced no choice but to walk outside of their village, often at night, todefecate – increasing their exposure to sexual violence. Prior to this project, in 2009 only 20% of the local population hadaccess to latrines, 60% had access to clean water, and there was no system for waste management. Victims of rape did nothave access to medical and psychological support and marriage of underage girls was acceptable by all. PPSSP have adopteda CLTS approach working in schools and health clinics. Maternal and child health in the area has improved and women feelsafer with improved sanitation facilities. In addition, through establishing community protection committees, survivors ofsexual violence are able to speak out, receive counseling and seek justice (Tearfund, 2007).
Sanitation and Hygiene in Africa38

5.4 MAINSTREAMING EQUITYAND INCLUSION: WHAT HAVE WE LEARNEDFROM CASE STUDIES IN AFRICA5.4.1 Political commitmentMany countries in the region have ratified the right to water and sanitation in 2010. This is however not reflected in explicitpolicies that recognize exclusion and seek to address it in sanitation. Few people are actually aware of the obligations thatthese rights confer on national and sub-national governments.
5.4.2 MonitoringIn order to identify specific groups who remain without access to sanitation and to understand linked reasons, monitoringsystems need to disaggregate data at local, sub national and national levels. If we can look at success from the lens of thevulnerable, we will make real progress. The analysis of MICS and DHS data by wealth quintile by the WHO/UNICEF JointMonitoring Programme for Water and Sanitation (JMP) is an important first step in this direction. Similarly rewards andsanctions must focus on those who are hardest to reach.
5.4.3 Institutional structure and capacitySanitation remains an institutionally fragmented subject in Africa with limited financial allocations. The benefits of clearresponsibility and better finance for sanitation are bypassing the majority of the poorest and most marginalized.Accountability at corporate and institutional level to ensure that this money reaches those who are usually left out is requiredto ensure that the benefits of increased investment and mandated responsibility reach the poor. This means that institutionsneed to ensure social development and monitoring capacity on equity and performance measurement must focus on whetherthe poorest and most marginalized have been reached.
5.4.4 Approach to creating demand and scaling upAfrica has many examples of approaches to take sanitation to scale. Most recently the community-led total sanitation (CLTS)approach (with different names in different countries) has succeeded in improving access for millions of people across thecontinent. Countries across Africa report exponential growth in the number of open defecation free communities and positivetrends overall in eradicating unsafe practices. They also report the need to integrate inclusive designs, menstrual hygienemanagement and pro-poor financing for access and maintenance in order to ensure that the worst off actually benefit.Explicit attention to voice and difference based on human diversity, gender and age will be needed in order to ensuresustainability and ensure inclusion as these approaches scale up at sub-national levels. This impressive movement and othersuccessful approaches must explicitly articulate the equity dimensions up front and measure benefits and success against useby specific groups such as children, older people, people with disabilities and those living with HIV/AIDS. It must alsomove beyond mere households to whole communities to include spaces where people work, play and live and also includepastoralists, migrant workers, and geologically and geographically marginalized people among others.
5.4.5 Technology promotion and supply chainThe promotion of appropriate technology options to meet the different needs of the excluded should ensure that public sanitationalways includes provision for menstrual hygiene management and disabled access; child friendly taps; pans; urinals;conveniently located and functioning hand washing stations; adequate light and ventilation; and safety and security. Thiswould be a significant step in moving access for the excluded from intention to reality. Inclusive access designed for lifecycle disability including pregnancy, old age or accidents would make facilities accessible for all. The discussions thatbrought together more than 100 CLTS practitioners across AfricaSan unanimously endorsed the importance of indigenousvariations in design for new facilities and the need to make existing facilities inclusive and accessible. A life cycle approachthat includes childhood, puberty, pregnancy, illness and accidents and old age will help us design facilities that areaccessible to all.
5.4.6 Finance and incentivesFinally, all the above steps will remain mere wishes unless there are dedicated financial allocations available for rural and urbansanitation in general and earmarked allocation of funds, for enabling all the above steps in particular. This would need to beaccompanied by a system of incentives for performance, and sanctions to ensure the public responsibility comes hand inhand with rights. Most countries in the region still lack dedicated budgets for sanitation, which must be seen as a
Equity and inclusion in sanitation and hygiene in Africa 39
pre- requisite for tackling sanitation programming required to address the sanitation crisis in the region. Since large sums arelikely to be involved third party monitoring; public scrutiny; independent audits; and adequate steps are required to ensurethat the process of allocation, disbursement and use of funds actually results in better services for those likely to be left out.
5.5 ROLES AND RESPONSIBILITIES5.5.1 None of these steps will be effective or sustainable unless they are driven bycommitted leadership at the highest level in each country in Africa and thenput into action drawing on our collective strengthsThe journey, from recognition and clear articulation of the importance of inclusive sanitation provision, to the translation of thisinto policy followed by adequate, focused and timely financial provision, to using this to develop capacity (for data acquisition,planning, communication, pro-poor strategies for access, inclusive design and human resource development), and then to set inplace an open and transparent monitoring and evaluation system, to ensure accountability… is a long one. Countries in theregion and sub-national administrative units within countries can be positioned at various points on the curve. Whatever thepositioning, there is a role for all those concerned, starting from people (not least the more fortunate citizens in the middleclass) themselves, to governments, civil society organizations, international financial institutions, bilateral donors, externalsupport agencies, the media, academia and the private sector. This is the challenge for all of us. The examples given in thispaper and in the accompanying bibliography show what has been achieved in different contexts. The challenge now, is tobuild on this experience and scale up to an equitable and inclusive approach to sanitation and hygiene across Africa.
5.5.2 A shared challenge but we have different role and responsibilitiesIn taking forward actions to develop more equitable inclusive sanitation strategies, we recognize that we all have roles andresponsibilities to collaborate as stakeholders in the process. The authors of this paper are committed to mainstreamingequity and inclusion in all our work, recognizing our specific role and responsibilities as set out in the framework below.
• People: to promote non-discrimination and active inclusion in sanitation and hygiene.• Government (local, state and national): institutionally responsible as duty bearers for entire framework and in ensuring
that no one is excluded. In many African countries, the role of Government is increasingly one of regulator of standards,quality and inclusion rather than that of providing services.
• NGOs: to support the national effort through influencing, monitoring, capacity building, demand creation anddemonstration of best practice through delivery. To set an example first, by measuring their own achievements froman equity and inclusion lens. As rights advocates, they are duty bound to work in coalition with larger and broaderalliances on health, education and livelihoods, water and sanitation. They also act as independent monitors to ensurethe accountability of standards, norms and systems of Government.
• External Support Agencies: to support the national agenda, collaborate on strategies, offer relevant technical support andlessons from international best practice, and undertake joint monitoring. To earmark initiatives that seek to bring greatertransparency, accountability and innovation to the excluded.
• Financing Institutions and Donors: to support the national agenda and commit to equity and inclusion in their financingand ensure aid effectiveness. Support longer term cross-sectoral research on sustainability and inclusion.
• Media: to promote awareness and advocacy for equitable and inclusive sanitation and hygiene. Also to bring the voicesof the unheard to the fore and act as a watchdog, highlighting gaps and showcasing successes.
• Academia: to promote objective research and analysis on inclusion whilst showing sensitivity to the issues andcontributing their collective influence; for example engineers to improve inclusive design, social scientists andstatisticians to collect and disseminate evidence on different marginalized groups.
• Elected representatives and Judiciary: to support the right to sanitation and hygiene through legislation, advocacy andenforcement with a focus on the excluded and marginalized.
• Private sector and small businesses: to recognize and promote inclusive sanitation and hygiene design and approaches.
5.6 RECOMMENDATIONSThe history, traditions, pace, structure and trajectory of political, social and economic development vary widely across thecountries in Africa. Any set of recommendations will need to be flexible enough to adapt to local situations and context.
Sanitation and Hygiene in Africa40

However, in broad terms one could track the progression to total and complete inclusive sanitation, access and usage, for allgroups along an equity enabled graph as shown below in Figure 5.3.
5.6.1 Looking at services with an equity lensThe Figure 5.3 shows progression in delivering equitable services – starting with policies and commitments, matching these withinstitutions and investments, strengthening of capacity to interpret policies with sensitive approaches and design, appropriate andcost effective hardware to match user needs, information and widespread awareness around rights and how these can beaccessed, and strong demand at every level, every time to eradicate exclusion.
At AfricaSan 3 in Kigali 50 practitioners and policy makers worked on the issues of equity and inclusion and came up with thefollowing concrete recommendations for the way forward:
5.6.2 Applying human rights to sanitation in practice
• Joint Planning & Monitoring – (a) all stakeholder (government partners and users) should be involved in planning forbetter monitoring and equitable allocation of resources, and – (b) involvement of user groups in implementation ofprogrammes to ensure designs are inclusive. One of the participants reminded us that in this meeting–fully-able-bodied people were discussing disabilities in the absence of any people with disabilities.
• Design and technologies should be inclusive, cost effective and affordable for sustainability and training onappropriate technologies.
5.6.3 Applying an equity lens to the eThekwini framework
• The framework is a simple guide to ensure that equity is not seen as separate or additional to overall implementation.• Ensure that there is clear understanding at the conceptual level of basics before we try and apply these principles in practice.• There is the need for routine collection of disaggregated data in order to assess equity in the first place, and to look not only
at data but also at personal reports/voice for an individual response.• Equity/inclusion must be addressed in communal facilities (on the grounds that most domestic ones get adapted to one’s
family’s needs anyway) and in this regard advocacy and awareness raised in the setting (schools, institutions) on the rightto sanitation and what that really means in practical terms.
5.6.4 Advocating for an equity approach – key issues for Africa
• What’s missing from the E&I narrative? To convince ministers of finance and donors we needmore evidence and statisticson the cost and benefits of investing in E&I and in particular the economic costs of inaction. There should be a stronger
Sustainable services for all people
Quality, Inclusion, Participation, Voice
Appropriate technologies
Capacity to translate this into practice
Awareness of and respect for difference
Adequate Financial Resources
Responsible Institutions
Policy / strategies on inclusion
Focus of EquityWork
Figure 5.3 Key Steps to Equity.
Equity and inclusion in sanitation and hygiene in Africa 41

focus on awareness- raising, training and educational aspects (including school curricula). We should not focus only onminorities and should not forget silent majorities (e.g., youth, adolescents or elderly).
• How should we approach our advocacy?Wherever possible our messaging should be positive and uplifting. We want tosee women and girls, people with disabilities, pastoralists, and so on speaking up for themselves with dignity and pride.We should identify positive role models (maybe celebrities). We should learn lessons from other sectors (e.g., HIV andAids) and employ communications professionals in order to ensure that our advocacy materials are creative and effectivelytargeted towards different audiences.
• What should be the focus of future narratives on E&I within the sector?We need to shift the narrative beyond achievingtheMDGs and focus on the targeting of investment and equity of access (i.e. not just off-track but off-target). The narrativeshould focus on dignity and pride (for communities) and cost of inaction (for policy makers). The argument is not justabout providing new services for those without but also making existing services more accessible (huge potentialgains here). Overall we are winning the argument that inequity in access to WASH is unacceptable (many wouldagree), but we still have some way to go to convince others that it is also avoidable and that equitable and inclusiveservices are within our reach.
AcknowledgementsWe would like to express sincere thanks to everyone who provided input, background materials and case studies: Ina Jurga(WSSCC), WaterAid Madagascar, WaterAid Uganda, WaterAid Tanzania, Annie Shangwa and Peter Morgan, NomaNeseni, Tear Fund, Sheena Crawford and Mary Ann Brocklesby, UNICEF NY and JMP team: Rolf Luyendijk, AnnThomas, Julian Kayibanda (SHE), CREPA Cameroon, Prince Kreplah, Baba Coulibaly.
For materials and references on equity and inclusion see: www.wsscc.org and www.wateraid.org
5.7 REFERENCESAMCOW (2012). A Snapshot of Drinking Water and Sanitation in Africa – 2012. Abuja, Nigeria.James P. (2010). To Help Haiti’s Children Heal, Build Back Education Better than Before. Available at: http://www.unicef.org/emerg/haiti_
52590.html (accessed 10 September 2013).Lockwood K., Msapato K., Senefeld S., Nogi J., Perrin P. andMtikaM. (2006).Water and Sanitation Assessment of Home-Based Care Clients
in Malawi, CRS/WHO/USAID, Washington, DC.Save the Children (2012). No Child Born to Die. Available at: http://www.savethechildren.org.uk (accessed 10 September 2013).Seremet C., Warner D., Senefeld S., Simpson-Herbert M., Miller C. and Overton J. (2010).Water, Sanitation and Hygiene Considerations in
Home-Based Care for People Living with HIV. Catholic Relief Services, Baltimore, MD, USA.Sustainable Health Enterprises (2012). Available at: http://www.sheinnovates.com/ (accessed 10 September 2013).Tearfund (2007). Project Briefing Paper: Hope out of Conflict. How Sanitation Plays a Vital Role in Protecting Women and Children from
Sexual Violence in DRC. Tearfund/PPSSP, Beni, DRC.UNICEF (2010). Narrowing the Gaps to Meet the Goals. UNICEF, New York.UNICEF (2012). Child Protection from Violence, Exploitation and Abuse. UNICEF, New York.
Sanitation and Hygiene in Africa42
Understanding Demand and Behaviour Change


Chapter 6
Changing WASH behaviour
Robert Aunger1, Yolande Coombes2, Val Curtis1, Hans Mosler3
and Helen Trevaskis41LSHTM2WSP3EAWAG4Consultant
WASH programmes need to pay close attention to behaviour. In this chapter we explore some current approaches tobehaviour change and provide a brief practical guide as to how to develop an effective behaviour change programme.
6.1 THE IMPORTANCE OF BEHAVIOUR IN WASHWhilst much of the focus in WASH programming is on providing water and sanitation infrastructure, taps and toilets alone donot ensure that public health is protected. Key to preventing child deaths from diarrhoea is the safe use of such facilities.Having a toilet but then leaving it unused, or only partially, used allows pathogens into the domestic environment.Having water available, but then not using it for washing hands allows foods, drinks and surfaces to becomecontaminated. Pathogens then find their way to new victims, and cause the deaths of some 800,000 young children everyyear (Liu et al. 2012).
WASH programmes, therefore, need to pay close attention to behaviour; the hygiene practices that are involved in breakingthe chain of transmission of pathogens from one host to another. Key amongst these are handwashing with soap, which could cutdiarrhea risk by almost half (Cairncross et al. 2010). The safe disposal of human and animal stools, whether into a latrine, or atleast away from living areas, is clearly important, potentially reducing diarrhea risk by an estimated 23% (Gil et al. 2004), as isthe safe preparation of foods, especially the weaning foods fed to vulnerable infants (Motarjemi et al. 1993). The hygienicmanagement of water in the household may play an important part in diarrhoeal disease reduction (Clasen et al. 2006), butsurface cleansing, including keeping toilets clean, fly control and the removal of wastes can also contribute to the reductionof disease risk (Curtis et al. 2011).
However, getting people to change their long-held practices is not a simple task. Neither is it easy to get people to decide toinvest in WASH technologies such as a latrine, a handwashing station or a water filter. Until we can find ways of changing suchbehaviours on a large scale we will not have won the battle for WASH.
6.2 KEY PREDICTORS OF BEHAVIOUR CHANGEWASH practitioners have long known that just teaching people about the benefits of this or that behaviour does not automaticallylead to real changes in what people do (though it may change what they say they do!). New approaches are more sophisticated;they tend to start from a hypothetical model or framework of what the likely determinants of behaviour are, and then investigate ifthese are indeed associated with the behaviour in question.

Some of the key determinants with proved predictive values from a range of health behaviours are shown in Box 6.1.Other important determinants of WASH behaviour include:
Risk perception can be divided into perceived susceptibility and severity. Susceptibility is a person’s subjective perception of hisor her risk of contracting a particular condition or illness, and perceived severity as a person’s perception concerning theseriousness of the consequences of contracting a particular condition or illnes. The use of solar water disinfection(SODIS) was modestly increased by a two-hour training session including information about water contamination, thehealth effects of drinking contaminated water, and instruction on how to use SODIS. (Rainey & Harding, 2005)
Social norms are an important social constraint on what kinds of behaviours people adopt. Researchers have shown theusefulness of distinguishing between descriptive and injunctive norms (Conner & Sparks, 1996; Nucifora, Gallois &Kashima, 1993). Descriptive norms express perceptions about which behaviours are typically performed. Injunctivenorms, on the other hand, describe perceptions about which behaviours are typically approved or disapproed. The mostsuccessful strategy to spread SODIS use in Bolivia was shown to be persuasion by promoter house-to-house visits.(Tamas & Mosler, 2009) This finding was confirmed when it was shown that high SODIS consumption in Zimbabwecould be achieved when a promoter intervention was followed by a memory-aiding technique such as prompts or publiccommitment (e.g., pledging) (Kraemer & Mosler, 2011).
Self-efficacy is described as the belief in one’s capabilities to organise and execute the course of action required to manageprospective situations (Bandura, 1997). Action planning is defined as the specification of ‘when’, ‘where’, and ‘how’ theaction will take place, whereas coping planning is defined as the presumption of possible barriers and the invention ofways to overcoming them (Schwarzer, 2008). Such planning is of use as the person plans how to cope with distractionsand barriers. Also, to perform a behaviour continuously, the person has to be committed to doing so and the behaviourneeds to be remembered at critical moments. Several studies have demonstrated that motivational interviewing (expressingempathy, developing discrepancy, avoiding argumentation, rolling with resistance, and supporting self-efficacy) increasedwater disinfection practices in Zambia. (Quick et al. 2002; Thevos, Quick & Yanduli, 2000).
Motivation. Much of human behaviour is motivated, in fact there are in the order of fifteen separate human motives (Aunger &Curtis, submitted). The motives that are most likely to be involved in driving WASH behaviours include Disgust, Nurture,Affiliation and Status (Curtis et al. 2009). Disgust is elicited when contaminating, potentially infective materials or situationsare encountered and is the evolved driver of much of our hygiene behaviour (Curtis, deBarra & Aunger, 2011). ElicitingDisgust of dirty hands has been shown to improve handwashing behaviour (Drummond et al. 2009; Judah et al. 2009) anddisgust of faeces are a key factor in the CLTS process of ‘igniting’ communities to eliminate open defecation (Harvey, 2011).Mothers care deeply about the future of their children and can be encouraged to adopt safe WASH practices via the Nurturemotive. In a recent successful trial of a handwashing campaign in India, a cartoon showed a child rewarding a mother withadmiration and love for her insistence on him washing his hands at key times (Biran et al., forthcoming), a similar approachof ‘thanking mothers’was used in the Asante Mama national handwashing campaign in Tanzania (Coombes & Paynter, 2011).
The Affiliation motive makes people want to behave in the same way as they perceive those around them are doing (asdiscussed in the social norms section, above). Norms based messages such as ‘Is the person beside you washing theirhands with soap?’ worked well to change soap use in a motorway service station (Judah et al. 2009). Status is also an
BOX 6.1 KEY DETERMINANTS WITH PROVEN PREDICTIVE VALUE FROM A RANGE OF MODELS
Susceptibility – probability you can get the health problem (e.g. probability of getting diarrhoea or cholera)Severity – magnitude of the event (e.g. Will cholera kill your child?)Response efficacy – effectiveness of the suggested intervention in preventing or dealing with the event (the rates of
diarrhoea decreasing because you have built a toilet)Self-efficacy – an individual’s perception of their ability to perform the desirable response (how able are you to build a latrine
or a handwashing stationSocial norms – what most people think and do about this (do most people wash their hands after defecation?)Action planning – thinking in advance of exactly how the target behaviour (where to get the cleanest source water, and how to
treat it once it is at home?)Coping planning – finding a way to cope with potential blocks to performing the behaviour (if there is no soap nearby, howwill
the person manage to wash hands with soap anyway?)
Sanitation and Hygiene in Africa46

important, if hard to acknowledge, motive behind WASH behaviour, such as the desire to acquire and display a good lookingwater filter or to build a toilet (Jenkins & Curtis, 2005).
Habit. Because most WASH behaviours concern actions that are repeated daily, they are often neither under the control of theplanning, nor the motivational system, but are automatic, ie habitual. For example, it has been shown that the best predictor ofobserved handwashing behaviour in Kenya is that it is habitual. (Aunger et al. 2010) Understanding habit formation is criticalto creating sustained changes in behaviour. For example, school campaigns for Lifebuoy soap ask children to practice for 21days, as this is thought to be how long it takes to form a habit. As habitual behaviour tends to occur automatically when aparticular cue is present, it is important to identify or create cues. These can be particular behavioural sequences, locationsor objects. For example, it was shown that tooth flossing is more likely to become automatic if it is carried out after,rather than before, toothbrushing, as the prior action acts as a cue to the later one. In the Indian handwashing trial peoplepledged specifically to wash hands at particular times in particular locations in an effort to help make it habitual.
Products. Most approaches to behaviour change neglect the importance of objects, which play a central role in healthybehaviour, from condoms, to seat belts and soap. Marketers, however, know that products have to be designed to bemotivating to use, whether in functionality, sensory reward, aesthetics, ability to symbolise status, convenience or brandappeal (Curtis & Aunger, 2011). WASH products are no exception, where unattractive toilets or tippy taps are unlikely tobe taken up widely (Biran, 2011), and currently available soap products may be ill-designed for use in the context of theoutdoor bathrooms of many developing country households.
Settings. People live in physical, social and biological niches which determine the behaviour that they adopt. Social rules arefollowed and objects and infrastructure guide behaviour into channels that may have far more influence on behaviour thanindividual psychology (Barker, 1968). For example, an easily available water supply makes hygiene behaviour easier(Traoré et al. 1994), and the design of a latrine influences how likely it is to be used. Once a village identifies itself as‘Open Defecation Free’, it becomes harder for any individual to be seen to be practicing open defecation. The perceptionthat there may be disease rife in the environment, such as cholera or Swine flu, enhances protective behaviour such ashandwashing with soap (Curtis et al. 2009; Fleischman et al. 2011).
6.3 THE INTERVENTION DESIGN PROCESSUnderstanding the determinants of behaviour, and knowing what’s worked to change behaviour in the past is only part of what’sneeded to change WASH behaviour. This insight and knowledge has to be channelled into a process which starts with theintention to design an intervention and doesn’t finish until after the intervention has been completed and evaluated, andperhaps revised or expanded to larger scale.
Figure 6.1 shows the processes and people involved in the design of a successful behaviour change intervention. There aretwo types of steps in the process – those that can be cycled between, as shown by the arrows in the diagram – and those that mustbe completed before the next is begun. This distinction matters, as successful creative process and project management demandthat all understand when one part is completed and decisions are ‘locked in’. As important as the process are the people involved.The core team should be small (4–6 people) and relatively stable. This technical team needs to be able to count on the buy in ofthe key stakeholders; decision makers in line-ministries, implementing agencies, private sector partners or funders, perhapsthrough the formation of an advisory group. Even great ideas emerging from great process involving great people can bewatered down or killed if there is no stakeholder buy-in.
Each of the stages in the diagram deserves a quick overview before we spotlight three parts of the intervention designprocess – formative research, design and measuring behaviour – which pose particular challenges.
One: DefineClearly, where you start has an impact on where you end up, therefore a rigorously defined and shared view of the outcomes thatare sought is critical. This should include behavioural outcomes – who will be doing what, where, when and why. Early on itshould be acknowledged what types of solutions – irrespective of potential efficacy, are acceptable or unacceptable to thoseinvolved – for example, will a range of water treatment technologies be acceptable or is only one solution to be promoted?Though it sounds straightforward, agreeing on, and closely defining, the behavioural outcomes and targets requires time andresource and is often one of the toughest parts of programme design.
Two: UnderstandChanging behaviour demands a detailed understanding of what happens now. This means not just understanding thedeterminants of behaviour, as we have outlined above, but also understanding exactly what is happening – who is doing
Changing WASH behaviour 47

what exactly? Why? When? What is the environmental, technological and social context? At this stage the technical team willcommission, or carry out, formative research to answer these questions. Even if an external agency is engaged for the research,it’s important that the design team also spend some time immersing themselves in the lives of the target audience so as toexperience the difficulties of carrying out the desired behaviour first hand.
Three: DesignThe next stage is to engage a creative team to design the programme. Key to a great design is an excellent design brief. The briefincludes both the detailed behavioural objectives as well as key learnings about the current behaviour, its determinants and thelocal context. Even if resources do not allow for the hiring of a creative agency, the design teamwill need to pull in a few creativepeople, media experts, artists, etc and work to a carefully crafted brief.
Four: Pre-testHowever good the intervention ideas look on paper, it is essential that they be pretested in the field before being rolled out at fullscale. Several rounds of pretesting in target settings allow the team to understand if and how the interventions will work, to seekout unintended consequences and to make changes.
Five: Finalise planOnce the final plan for the intervention has been designed it is helpful to write an implementation brief, which lays out preciseinstructions for the deployment of the intervention. A key component is a channel and media plan which ensures that the strategyfor getting messages through to people in meaningful ways, via mass media, or via other channels, is robust. It is also importantto work out how the elements of the intervention can be simplified and commoditized to ensure that they do not become watereddown during implementation.
Figure 6.1 Intervention design process & people.
Sanitation and Hygiene in Africa48

Six: ImplementWhoever implements the intervention, success demands military precision coupled with an attitude of intelligent resourcefulnessand a strong understanding of how the intervention will work to change behaviour. This combination helps a programme flexiblyweather the storms of the real world without losing focus on the target it has set out to achieve.
Seven: Measurement and evaluation (M&E)Though M&E is often mentioned last, it has to have been a topic of conversation from the start. The M&E plan may require abaseline, ongoing process measurement and a final survey. It is not generally a good idea, however, to try to turn an interventioninto a controlled experiment, since this is expensive and requires a lot of scientific input. WASH behaviours are typically difficultto measure; we discuss this particular challenge below.
6.3.1 Spotlight on formative researchThe objective of formative research is to gain insight into the determinants of behavior, as we saw above, and into how it mightchange. There are many methods that can be used in formative research, it is rarely a good idea to just rely on Focus groupdiscussions. The first step is to carefully design the questions. Typically we need to know what people are doing now, when,who is doing them, why they are doing it and how we might reach them and engage them in behaviour change activities. Themethods that are chosen are then fitted to the questions that have been asked. Participant observation is a good fort start asan intensive, insightful method of seeing just how people situate the behaviour in their daily lives. It is often these situatedfactors that hold a behaviour in place, constraining change, but it is typically difficult for people to report on such constraints(as they are subconscious), so identification is most easily achieved by experiencing them for oneself.
Participant observation requires the researcher, as much as possible, to live the life of the target population, twenty-four hoursa day, in their community, going through the same routines and interactions, and taking notes about what they learn. ‘Teach theresearcher’ is a variant of participant observation that can be particularly apropos, as it requires someone in the target populationto explain to the researcher, while the researcher tries to perform the target behaviour under naturalistic conditions, just whatactions are required, and why. Standard methods are focus groups and interviews, as these are relatively easy to conduct.However, they are most productive when very specific questions can be asked, based on a solid background of knowledge.Focus groups require collecting a small (normally 6–10) group of similar people together for a guided discussion that isoften recorded and transcribed to ensure that all potential insights are captured. Behaviour trials are a related formativeresearch technique which requires the researcher to ask target subjects or households to perform the target behaviour (e.g. bygiving them the necessary hardware), with instructions for how to make use of it. After some period, the researcher returnsto the household to ask questions about what difficulties they had incorporating this behaviour into their daily activities andwhat solutions they found.
A group of techniques which derive from consumer research are called ‘projective’ because they ask people to use theirimaginations to project themselves into novel situations that help elicit new kinds of otherwise unrecalled information. Theycan be used in a group or individual context, and range from asking people a question (e.g. how do you feel about your liferight now?) and getting them to select objects or pictures or music to answer – which they then talk through, to gettingpeople to imagine one thing as another (e.g. if this brand was an animal what would it be and why?) or giving the power ofspeech to inanimate objects (e.g. if your soap bar could talk what would it say about it’s day?), or giving people drawings ofscenarios and asking them to fill in speech bubbles for the characters involved or tell stories around them, or getting them tocreate and talk about drawings. Finally surveys can ask about media consumption, contact with health agents, socialnetworks and other channels of communication employed by the targets of the programme.
6.3.2 Spotlight on designA good design brief is pithy, readable and acts as a rudder for the team involved in subsequent steps where it will be used to plan,make decisions, resolve conflicts of opinion, brief others who are becoming involved, etc. The design brief is the springboard fordesigning the intervention. As well as including critical background a design brief should summarise: current behaviour anddesired new behaviour; what will be measured to know change has happened; the design principles and insights the programshould be created around; channels which will be used to touch people’s lives; resource requirements and timings.
The hardest part of writing a brief is arriving at design principles and insights as this involves intelligently and creativelysynthesizing all learning with one question in mind – what must we build into this intervention if we want to increasethe inevitability of it changing behaviour? These principles help to create the intervention and then to check back thatwhat we’ve created is on-brief. Design principles and insights are a mixed bag driven by the challenge faced and may
Changing WASH behaviour 49

include: angles on motivators we believe could help people adopt a new behaviour; pressure points within networks of socialinfluence; infrastructure issues we must resolve or we can exploit; insight into how objects perform within a behaviouralsetting, and so on.
With the brief in hand, the next stage is to assemble a creative team, either an outside agency or a number of creative expertssuch as media people, artists, and so on. A growing number of agencies exist, albeit of varying quality. Selection can be tricky butthose with commercial as well as social experience are usually preferable as their approaches should be more up to date and theywill bring valuable learning and insight from very different worlds that can act as powerful stimulus to help all concerned thinkfrom different angles. The brief should be accompanied with a thorough face-to-face briefing, ideally involving time with thetarget audience, as even the best agency will take time to get up-to-speed and engage with the challenge. Involvement insome of the earlier stages can help with this.
6.3.3 Spotlight on measuring behaviourMost WASH behaviours are difficult to measure. This difficulty manifests itself in various ways. First, the easiest and simplestway is just to ask people their opinions or about their own behaviour. However methods such as self-report through questionnaireand diary are notoriously poor and introduce systematic biases (Klesges et al. 2004; Rose et al. 2009; Stange et al. 1998). It isalso difficult for people to report on the causes of everyday behaviour (such as reliance on environmental cues), because theprocesses are sub-conscious.
Second, structured observation – or use of one individual to watch the behaviour of another – is the current ‘gold standard’.(Cousens et al. 1996; Curtis et al. 1993) However, direct observation is expensive, intrusive, and introduces reactivity – peoplebehave in more normative fashion when being watche.
Third, mechanical systems designed to replace people as observers are increasingly being used to measure wash behavioursuch as handwashing and toilet use, (Biran et al. 2009; Clasen et al. 2012). However, they can be logistically complex to deploy,the results can be hard to decipher and the target population may find them as intrusive as observers. Further, they are not yetdesigned to work robustly for long periods (battery life etc.).
The combined difficulty of all these problems has largely precluded the study of everyday behaviour where it actually occurs,except through participant observation. Nevertheless, any effort to observe behaviour in context is likely to be rewarded in termsof the additional insights that can be gained by observing behaviour in its natural context.
6.4 WHAT WE STILL NEED TO KNOWThough efforts to change people’s behaviour are as old as human interaction, the science of ‘behaviour change’ is a relativelynew arrival on the scene. Progress in learning how best to engender healthy behaviour is hampered by the many and diverse kindsof behaviour that relate to health, the many and diverse settings in which it takes place, and the many and diverse approaches tobehaviour change that exist.
We still have no simple lexicon of behaviour change terms, no agreement as to the roles of different social, physical andpsychological factors, and we do not know which approaches work best for which behaviours in which context at what cost.Though a precise science of behaviour change is possibly beyond our grasp, much more investment not just in behaviourchange programmes, but in behaviour change programmes that are wired up to teach us lessons about what works best areurgently required.
For example, in a review (Parker Fiebelkorn et al. 2012) of behaviour change research on point-of-use water treatmentinterventions only 5 out of 26 studies included in the review specified the details of the interventions applied. Together withone recently published study (Kraemer & Mosler, 2011) we have only a very small basis for determining which behaviourchange techniques work for water treatment. Though there are now a number of successful hygiene promotion programmes(Curtis et al. 2001; Scott et al. 2007; Biran, forthcoming), there are also others that have failed to achieve much behaviourchange (Huda et al. 2011). We need to learn the lessons of both failed and successful programmes to become much smarterat improving WASH behaviour.
6.5 REFERENCESAunger R., Schmidt W.-P., Ranpura A., Coombes Y., Maina P. M., Matiko C. N. and Curtis V. (2010). Three kinds of psychological
determinants for hand-washing behaviour in Kenya. Social Science and Medicine, 70, 383–391.Biran A. (2011). Enabling Technologies for Handwashing with Soap.
Sanitation and Hygiene in Africa50

Biran A., Schmidt W.-P., Wright R., Jones T., Seshadri M., Isaac P., Nathan N. A., Hall P., McKenna J., Granger S., Bidinger P. and Curtis V.(2009). The effect of a soap promotion and hygiene education campaign on handwashing behaviour in rural India: a cluster randomisedtrial. Tropical Medicine and International Health, 14(10), 1303–1314.
Cairncross S., Hunt C., Boisson S., Bostoen K., Curtis V., Fung I. and Schmidt W. P. (2010). Water, sanitation and hygiene for the preventionof diarrhoea. International Journal of Epidemiology, 39(Suppl 1), 193–205.
Cialdini R. B. (2003). Crafting normative messages to protect the environment. Current Directions in Psychological Science, 12,105–109.
Clasen T., Roberts I., Rabie T., Schmidt W. and Cairncross S. (2006). Interventions to improve water quality to prevent diarrhea. CochraneDatabase of Systematic Reviews, 3, CD004794.
Clasen T., Fabini D., Boisson S., Taneja J., Song J., Aichinger E., Bui A., Dadashi S., Schmidt W. P., Burt Z. and Nelson K. L. (2012).Making sanitation count: developing and testing a device for assessing latrine use in low-income settings. Environmental Science &Technology, 46(6), 3295–3303.
Cone J. (1999). Observational assessment: measure development and research issues. In: Handbook of Research Methods in ClinicalPsychology, P. C. Kendall, J. N. Butcher and G. N. Holmbeck (eds), 2nd edn., John Wiley & Sons Inc., New York.
Conner M. and Sparks P. (1996). The theory of planned behaviour and health behaviours. In: Predicting Health Behaviour, M. Conner andP. Norman (eds), Open University Press, Buckingham, UK, pp. 121–162.
Coombes Y. and Paynter N. (2011). Tanzania: A Handwashing Behaviour Change Journey. WSP Learning Note, World Bank.Cousens S., Kanki B., Toure S., Diallo I. and Curtis V. (1996). Reactivity and repeatability of hygiene behaviour: structured observations from
Burkina Faso. Social Science & Medicine, 43(9), 1299–1308.Curtis V. and Aunger R. (2011). Motivational mismatch: evolved motives as the source of – and solution to – global public health problems. In:
Practical Uses of Evolutionary Psychology, C. Roberts (ed.), Oxford University Press, Oxford, UK.Curtis V., Cousens S., Mertens T., Traoré E., Kanki B. and Diallo I. (1993). Structured observations of hygiene in Burkina Faso, validity,
variability and utility. Bulletin of the World Health Organisation, 71(1), 23–32.Curtis V., Kanki B., Cousens S., Diallo I., Kpozehouen A., Sangaré M. et al. (2001). Evidence for behaviour change following a hygiene
promotion programme in West Africa. Bulletin of World Health Organization, 79(6), 518–526.Curtis V., Danquah L. and Aunger R. (2009). Planned, motivated and habitual hygiene behaviour: an eleven country review.Health Education
Research, 24(4), 655–673.Curtis V., deBarraM. and Aunger R. (2011). Disgust as an adaptive system for disease avoidance behaviour. Philosophical Transactions of the
Royal Society B: Biological Sciences, 366, 389–401.Curtis V., Schmidt W., Luby S., Florez R., Touré O. and Biran A. (2011). Hygiene: new hopes, new horizons. The Lancet Infectious Diseases,
11(4), 312–321.Drummond R. P., Stevenson R., Case T. and Oaten M. (2009). Can the emotion of disgust be harnessed to promote hand hygiene?
Experimental and field-based tests. Social Science & Medicine, 68, 1006–1012.Fleischman D., DeBarra M. G. W., Aunger R., Judah G. and Curtis V. (2011). Sensor recorded changes in rates of hand washing with soap in
response to the media reports of the H1N1 pandemic in Britain’. BMJ Open, 1(2): e000127.Judah G., Aunger R., Schmidt W. P., Michie S., Granger S. and Curtis V. (2009). Experimental pretesting of hand-washing interventions in a
natural setting. American Journal of Public Health, 99(S2), S405–411.Gil A., Lanata C., Kleinau E. and Penny M. (2004). Children’s Feces Disposal Practices in Developing Countries and Interventions to Prevent
Diarrheal Diseases. A Literature Review. Instituto de Investigacion Nutricional, Washington DC, Peru.Graf J., Meierhofer R., Wegelin M. and Mosler H. (2008). Water disinfection and hygiene behaviour in an urban slum in Kenya: impact on
childhood diarrhoea and influence of beliefs. International Journal of Environmental Health Research, 18(5), 335–355.Harvey P. (2011). Community-led total sanitation, Zambia: stick, carrot or balloon? Waterlines, 30(2), 95–105.Heri S. and Mosler H.-J. (2008). Factors affecting the diffusion of solar water disinfection: a field study in Bolivia. Health Education &
Behavior, 35(4), 541–560.Huda T. M. N., Unicomb L., Johnston R. B., Halder A. K., Yushuf Sharker M. A. and Luby S. P. (2011). Interim evaluation of a large scale
sanitation, hygiene and water improvement programme on childhood diarrhea and respiratory disease in rural Bangladesh. Social Science& Medicine, 74(1), 1–8.
Jenkins M. and Curtis V. (2005). Achieving the ‘good life’: why some people want latrines in rural Benin. Social Science and Medicine, 61,2446–2459.
Kraemer S. and Mosler H. (2010). Persuasion factors influencing the decision to use sustainable household water treatment. InternationalJournal of Environmental Health Research, 20, 61–79.
Kraemer S. M. and Mosler H.-J. (2011). Factors from the transtheoretical Model differentiating between solar water disinfection (SODIS) usergroups. Journal of Health Psychology, 16(1), 126–136.
Liu L., Johnson H. L., Cousens S., Perin J., Scott S., Lawn J. E., Rudan I., Campbell H., Cibulskis R., Li M., Mathers C., Black R. E., ChildHealth Epidemiology Reference Group ofWHO and UNICEF (2012). Global, regional, and national causes of child mortality: an updatedsystematic analysis for 2010 with time trends since 2000. The Lancet, 379(9832), 2151–2161.
Mosler H.-J. (2012). A systematic approach to behavior change interventions for the water and sanitation sector in developing countries: aconceptual model, a review, and a guideline. International Journal of Environmental Health Research, 22(5), 431–449.
Changing WASH behaviour 51

Motarjemi Y., Käferstein F., Moy G. and Quevedo F. (1993). Contaminated weaning food: a major risk factor for diarrhoea and associatedmalnutrition. Bulletin of the World Health Organization, 71(1), 79.
Parker Fiebelkorn A., Person B., Quick R., Vindigni S., Jhung M., Bowen A. and Riley P. L. (2012). Systematic review of behavior changeresearch on point-of-use water treatment interventions in countries categorized as low- to medium-development on the humandevelopment index. Social Science & Medicine, 75, 622–633.
Quick R., Kimura A., Thevos A., Tembo M., Shamputa I., Hutwagner L. and Mintz E. (2002). Diarrhea prevention through household-levelwater disinfection and safe storage in Zambia. American Journal of Tropical Medicine and Hygiene, 66, 584–589.
Rainey R. and Harding A. (2005). Acceptability of solar disinfection of drinking water treatment in Kathmandu Valley, Nepal. InternationalJournal of Environmental Health Research, 15, 361–372.
Schmidt W. and Cairncross S. (2009). Household water treatment in poor populations: is there enough evidence for scaling up now?Environmental Science and Technology, 43(4), 986–992.
Scott B., Schmidt W., Aunger R., Garbrah-Aidoo N. and Animashaun R. (2007). Marketing hygiene behaviours: the impact of differentcommunications channels on reported handwashing behaviour of women in Ghana. Health Education Research, 22(4), 225–233.
Tamas A. and Mosler H.-J. (2009). SODIS Promotion–Investigating the behavior change process. Paper presented at the Disinfection 2009.Thevos A., Quick R. and Yanduli V. (2000).Motivational Interviewing enhances the adoption of water disinfection practices in Zambia.Health
Promotion International, 15, 207–214.Traoré E., Cousens S., Curtis V., Mertens T., Tall F., Traoré A. et al. (1994). Child defecation behaviour, stool disposal practices and childhood
diarrhoea in Burkina Faso: results from a case-control study. Journal of Epidemiology and Community Health, 48, 270–275
Sanitation and Hygiene in Africa52

Chapter 7
Integrating handwashing into otherprograms – A strategy for governmentsto reach scale
Katie CarrollThe Global Public-Private Partnership for Handwashing – PPPHW
7.1 WHY HANDWASHING WITH SOAP?Today, diarrheal disease and acute respiratory infections are the two biggest killers of children in the developing world. Thesimple act of washing hands with soap can significantly cut the risk of diarrhea from 50 percent to 30 percent, (Fewtrellet al. 2005) and that of respiratory tract infection from 45 percent to 21 percent, (Curtis & Cairncross, 2003). Researchshows that handwashing with soap (HWWS) prevents disease more simply and cost-effectively than vaccination for thesame diseases.
Handwashing helps prevent the spread of disease by interrupting the transmission of pathogens that cause disease. Handsoften act as vectors that carry disease-causing pathogens from person to person through direct contact or indirectly viasurfaces and foods. Together, soap and water form a formidable ally in efforts to combat a host of other illnesses, such ashelminths (worms), eye infections like trachoma, and skin infections like impetigo.
The isolation and safe disposal of feces and the provision of adequate amounts of clean water are essential, but handwashingwith soap is one of the most effective and least expensive ways to prevent diarrheal diseases.
In the past few years, there has been increasing attention and resources devoted to raising the profile of the importance ofhandwashing around the world. Advocacy events like Global Handwashing Day, which is celebrated each year by over 200million people in over 100 countries, in coordination with the long-term handwashing activities of international donors,academic institutions, NGOs, and private sector companies aimed at longer term behaviour change, have helped elevatehandwashing on developing country governments’ priority lists.
The Global Public-Private Partnership for Handwashing (PPPHW), a partnership of 14 key global organizations working onhandwashing behaviour change, serves as a global go-to resource for those working on handwashing. The PPPHW trackshandwashing programs, consolidates and distributes resources, advocates for handwashing at global events, and convenesthose working in handwashing to learn from each other. At AfricaSan3, the PPPHW hosted a session to examinehandwashing behaviour change best practices and challenges in Africa. This chapter focuses on some of the discussion withrespect to integration of handwashing into other government programs to assist governments reach scale with theirhandwashing interventions in Africa.
7.2 THE CHALLENGE OF REACHING SCALEHandwashing with soap, when practiced in small-scale, highly-controlled trials, yields dramatic health benefits, especially in thereduction of diarrhea and acute respiratory infections. When handwashing has been promoted on a large-scale, however,authorities have struggled to achieve the same level of results. This is a challenge not only in Africa, but in countries aroundthe world working to get handwashing behavior change to scale. To address this challenge in Africa and elsewhere, nationaland local governments are stepping up to provide the needed leadership and networks to bring handwashing behaviourchange to scale in their respective countries. A topic that once wasn’t taken seriously, handwashing behavior change is nowa strategic government priority in many places.

7.2.1 The role of governmentGovernments play an important role in ensuring the success and sustainability of at-scale handwashing in their countries.Because of its inherent interest in public health and its large-scale reach to the population, government are uniquelypositioned to help increase the number of people washing hands with soap. In order to scale up HWWS, keygovernment-based handwashing initiatives include:
Policy supporting handwashing at scale. Handwashing-related policies are one of the most common actions that governmentscan take to promote handwashing behavior change. These include stand-alone handwashing policies and policies that integratehandwashing into sanitation, health, or other topics (e.g., school health, nutrition or integrated child health programs).
The importance of having HWWS national policy increases the likelihood of funding specific HWWS activities and byextending a policy into a national strategy it can guide implementation of interventions for HWWA which ill increase thechances of the sustainability of Government efforts. Having a policy and strategy also provides a common direction for theGovernment but also means that the government provides direction and vision of where handwashing with soap should goso that it increases the likelihood that interventions will be coordinated.
Political leadership for handwashing. Establishing a shared vision and ensuring the political will to implement is the startingpoint for scale up.Without political will and a shared vision among stakeholders at all levels, scale up will remain an elusive goal.Developing this shared vision in a collaborative manner is also the foundation for coordination and for creating motivation alllevels. Having clear political leadership and vision helps to bring all the stakeholders together.
The lack of strong program leadership by government may result in a program that risks being disrupted by the agendas ofone or two partners/stakeholders also working in HWWS who are pursuing their own individual organizational agenda.The consequence of this may be that there are conflicting messages or approaches, or even conflicting goals and thismay discourage other stakeholders from participating in the efforts to promote HWWS at scale within the country.
However, on the contrart, where there are political leaders who are handwashing champions they become critical toaccelerating the passage of handwashing-related policies and allocating government resources to the issue. Many times,Global Handwashing Day has served as a catalyst for high-profile events where government leaders have announced a newhandwashing initiative or policy. Without someone to drive the agenda of HWWS forward it is easy for HWWS to getburied amongst other government priorities.
Integration of handwashing into government programs. Handwashing with soap is an important behavior on its own, but it’salso an integral part of successful sanitation, nutrition, education, healthcare, and other programs. Governments most commonlyintegrate handwashing into education and sanitation programs, but are starting to integrate the behavior into other programslike food security and nutrition as its importance is recognized.
With scarce resources for HWWS integration becomes ever more important for HWWS campaigns to succeed in order todeliver large scales HWWS interntions. For Government to integrate HWWS into other programs the roles, responsibilitiesand accountabilities of different Government departments, line ministries and NGOs need to be weel defined, andunderstood. Institutional arragnements need to be defind at national and subnational levels and need to be articulated andcoordinated for the public and private sector actors.
7.3 INTEGRATING HWWS – CASE STUDIESIn the past few years, investments in handwashing behaviour change programs have shifted away from stand-alone handwashingbehaviour change programs to a more integrated approach. Handwashing has been successfully integrated into sanitation,education, nutrition, HIV/AIDS, and other programs that are already working on a large scale. Because handwashing oftenhappens in conjunction with other behaviours such as going to the latrine, cooking, eating, and so on many governments arenow naturally integrating handwashing into these existing programs.
7.3.1 Case Study 1 – integration with sanitationOne popular area of integration is sanitation. Many governments are already investing in community-based total sanitationmethods to bring proper sanitation to communities throughout their countries. As one of the critical times for handwashing isafter defecation, handwashing is a natural component of these sanitation initiatives.
Sanitation and Hygiene in Africa54
In Mali, for example, the Ministries of Health and Environment and Sanitation, along with UNICEF and its partners, haveintegrated handwashing into their Community-Led Total Sanitation (CLTS) program targeting 1500 villages by 2014 andreach 70% of the population through mass media. The government realized early on in implementing its CLTS program thatthey needed to move beyond engineering and sanitation hardware to include hygiene promotion and behaviour change. As aresult, the Ministry of Environment and Sanitation requires communities to commit to the following action in order toachieve official Open Defecation Free (ODF) status:
• All members of the family use the latrine• Each latrine has a cover which limits the proliferation of flies from the pit• Each latrine is equipped with a hand washing device (water with soap or ash)
In addition to community handwashing initiatives, the Government of Mali is also implementing a water, sanitation, and hygiene(WASH) in schools program targeting 510,000 school children and their families. Handwashing with soap in school is anessential piece of the WASH in Schools program. Again, by building on an existing at-scale program (i.e., public educationand schools), they are able to promote handwashing at scale. Similar programs which integrate handwashing componentsinto CLTS can be found in Ethiopia, and Kenya.
7.3.2 Case Study 2 – integration with educationAnother increasingly popular area of integration is handwashing in schools. In 2012, Zambia’s Ministry of Education andUSAID/Zambia launched SPLASH (a multi-year WASH in Schools program – Schools Promoting Learning Achievementthrough Sanitation and Health). SPLASH will work in more than 600 primary schools in four districts of two provinces to:(1) improve water supply and sanitation facilities and provide a comprehensive hygiene improvement program; (2) trainteachers, PTA members, and student leaders in school-led total sanitation; and (3) strengthen the capacity of the localinstitutions tasked with supplying, operating, and maintaining improved WASH facilities in schools.
This WASH in Schools program expects its activities to show measurable improvements in the number of days students missschool due to lack of water, illness from diarrheal diseases, or menstrual hygiene constraints, which in turn will increasestudent-teacher contact time, contributing to improved reading and other basic skills. With a strong focus on gender issues,the program also expects a decrease in girls’ drop-out rates and (female) teacher attrition.
In Kenya, the Government is leveraging the private sector to bring handwashing behaviour change to scale. In April, 2012,the School of Five handwashing promotion program, was launched in Kenya with Unilever, the Ministries of Education andPublic Health and Sanitation, Water and Sanitation for the Urban Poor (WSUP), and Population Services International (PSI).In 2012, the School of Five will be reaching 300,000 children between the ages 6–12 in about 500 schools across Kenyato teach them the importance of handwashing with soap during the five key occasions – Before breakfast, Before Lunch,Before Dinner, after using the toilet and while taking a bath. The program will engage children in handwashing promotionover a period of 21 days, using fun activities like comic books, quizzes, games and mascots.
7.4 MEASURING HANDWASHING BEHAVIOURIntegration may be a solid strategy for reaching a large amount of people with handwashing behaviour change activities andmaterials, but once those populations are reached, how do governments determine if handwashing is actually taking place?Ongoing monitoring of handwashing behaviour is necessary to keep the topic on the national policy agenda and in aditionmonitoroing is needed to ensure that the program stays on track.
Measuring handwashing behaviour is very difficult and often expensive when done on a large scale. For example, structuredobservation, when an individual observes household behaviour over a period of time and records handwashing activity, is oneof the most widely-accepted methods for measuring handwashing with soap at the household level. For small trials or studiesthis may be feasible, but when trying to track handwashing behaviour at large scale structured observation can becomeprohibitively expensive.
To address this challenge, leading organizations working in handwashing behaviour change have suggested indicators ofhandwashing as the best way to determine if handwashing is happening without direct observation. These indicators havebeen integrated into the global household surveys: Demographic and Health Surveys (DHS) and Multiple Indicator ClusterSurvey (MICS) and are:
• Percent of households with a designated place for hand washing where water is present and where soap is present• Percent of households with soap anywhere in the dwelling
Integrating Handwashing into other programs – A strategy for governments to reach scale 55

Many of these surveys have been completed with the handwashing indicators included. They are available at:
• MICS: http://www.childinfo.org/mics_available.html• DHS: http://www.measuredhs.com/Data/
This data could be helpful to governments by not only tracking handwashing behaviour, through the indicators, nationally overtime, but also in targeting interventions. For example, the survey can identify which regions of a country or what segments ofthe population are more or less likely to have a handwashing station with water and soap. This information, along with formativeand other research, can help target the interventions to those who need it most.
Ideally Government monitoring and evaluation systems for HWWS are not parallel systems set up just for HWWS but areincorporated into existing monitoroing systems for other health or WASH related systems. In general, in most counties M&Efor handwashing is poor and so governments need to build capacity in this area. An important function of the M&E systemis the development of HWWS targets, especially if the HWWS is to be integrated into other programs. Having targets canhelp to keep implementors focused on result.
7.5 SUMMARYGovernments have a unique opportunity to help bring handwashing with soap, a simple, cost-effective behaviour with enormoushealth benefits, to scale in their countries. An effective way to do this is by simply integrating handwashing behaviour changeactivities into already existing national programs in sanitation, education, and other related programs. In addition, there are manyinternational donors, NGOs, and private sector companies working on handwashing behaviour change. The case studiespresented in this chapter have shown that cooperation among interested organizations can yield a greater scale andsustainability of handwashing behaviour change. For more information or questions regarding handwashing with soap atscale, please contact us at [email protected] or visit our website at www.globalhandwashing.org.
Sanitation and Hygiene in Africa56

Matching Supply and Demand


Chapter 8
Moving households up the sanitation ladderthrough sanitation marketing
Jacqueline DevineWater and Sanitation Program
This chapter focuses on the value added from a sanitation marketing approach in helping households move up the sanitationladder. Key principles for a large scale sanitation marketing initiative are provided and emergent learning is shared fromprograms in Africa and abroad. The chapter concludes with a discussion of roles and responsibilities and of what itwould take to enable further uptake of this approach in Africa.
8.1 WHAT IS SANITATION MARKETING?One of the earliest documented applications of sanitation marketing worldwide was in Benin where the beginnings can be tracedto 1996 and the PADEAR Program (Project Support to the Development of the Rural Water and Sanitation Sector). The programpiloted a social marketing approach to motivate household demand for sanitation in combination with delivery by small-scaleprivate sector providers (WSP Field Note, April 2011).
Since then, sanitation marketing has continued to receive a considerable amount of attention, both in Africa and abroad.Interestingly though, there is as yet, no broad consensus on what sanitation marketing is. Some sector professionals define itas strengthening supply by building capacity of the local private sector others discuss it in terms of it ‘selling sanitation’ byusing commercial marketing techniques to motivate households to build toilets. Both these approaches were actuallyintegrated in the Benin pilot.
Water and Sanitation Program (WSP) of the World Bank defines sanitation marketing as the application of the best social andcommercial marketing practices to scale up the demand and supply for improved sanitation, particularly among the poor.
8.2 WHY IS SANITATION MARKETING NEEDED?Sanitation marketing can be considered an essential part of any program aimed at increasing access to improved sanitation basedon several reasons as follows:
(1) Potential for scale: By leveraging approaches that have been used by the commercial sector and social marketingorganizations (see Box 8.1 on social marketing in Africa), sanitation marketing has the potential to yield results atthe scale that is needed to meet MDG targets.
(2) Demand-driven approach: Sanitation marketing is a demand-driven approach that is based on the desires and needs ofhouseholds and is consistent with current sector thinking.
(3) Complement to CLTS: Community-led total sanitation (CLTS) is a proven approach to motivate communities andhouseholds to stop open defecation. However, households need affordable and desirable alternatives whichsanitation marketing can help create.
(4) Sustainability through the private sector: Because sanitation marketing involves the private sector, there is a greaterlikelihood of sustainability.

8.3 WHAT ARE THE KEY PRINCIPLES INVOLVED?The key principles for sanitation marketing are as follows:
• Evidence-based: Sanitation marketing initiatives must be founded on sound evidence from the market place that istypically gathered through some form of research, often referred to as formative research. Broadly speaking, formativeresearch helps answer questions such as:
○ What is the current situation in terms of behaviours and availability of products and services and what are theconsequences if nothing changes or if changes are made?
○ What is the goal for change?○ How can the goal be reached?○ How well is the intervention being implemented or delivered?○ What needs to be done differently?
The information to answer these questions might already be available in existing sources such as research reports (e.g.,Demographic and Health Surveys, Multiple Indicator Cluster Surveys or WHO/UNICEF Joint Monitoring Program reports).If secondary data sources are not sufficient or recent, primary research on the demand and supply side may be required.
• Leverages power of the marketing for a social benefit: Marketers’ main working tool is called the marketing mix, oftenreferred to as the ‘4ps’: product (the sanitation product or behaviour), price (the financial and non monetary cost), place(where a product or service is sold and how it is distributed) and promotion (how households learn about a product andhow households are motivated to change their behaviour). Determining the right mix of the 4ps based on best availableevidence allows marketers to reach scale. See Box 8.2 for how the marketing mix has been defined for the rural sanitationprogram in Tanzania.
8.4 EMERGENT LEARNINGSince the Benin program, sanitation marketing has spread to several countries, including Uganda, Ethiopia, Tanzania, Ghana,Malawi and Kenya which presently feature rural or urban sanitation marketing programs. Other countries to cite outside Africainclude Vietnam, Peru, Cambodia, Laos and Indonesia though this list is not meant to be exhaustive. Through studies,monitoring and evaluation and other data sources, there is global emergent learning to be shared which is most relevant toAfrican countries wishing to initiate or scale up sanitation marketing. Key learning is as follows:
• Sanitation marketing outcomes can be sustained: In 2010, WSP and IRC conducted a case study aimed at assessing whathappened in Vietnam since the end of the sanitation marketing project in 2005. The study showed that coverage continuedto grow in the pilot communes studied and that the small scale suppliers continued to operate and thrive. Communitymotivators who had been trained continued to promote hygienic latrines albeit at a lesser intensity and their stock ofpromotional materials had depleted.
• Training masons is not sufficient to strengthen the supply chain: A lesson from Tanzania (see Box 8.2) and other countriesincluding Indonesia is that masons lack working capital to buy equipment or supplies and hence are limited to meet anyincrease in demand generated though CLTS and sanitation marketing. They also tend to be passive sellers, relying onreferrals, rather than actively promoting their products and services. Programs are currently looking to focus capacitybuilding efforts ‘higher up the supply chain’ and are testing different models such as working with hardware stores(Tanzania and Peru), national supplier alliances (Peru), sanitation entrepreneurs (Indonesia) and cement producers(Cambodia). Commercial approaches such as franchising are also being tested in urban Ghana (see Box 8.3).
BOX 8.1 SOCIAL MARKETING IN AFRICA
Organizations such as Population Services International (PSI) use social marketing approaches to stimulate healthbehaviours such as the use of insecticide-treated nets to prevent malaria. Social marketing relies on commercialmarketing techniques but the end goal is social rather than profit. These techniques include the use of ongoingconsumer and supply chain research; the use of branding, advertising and promotion; the distribution of affordable anddesirable products through easily accessible private sector suppliers and the integration of behaviour changecommunication. Brands such as Prudence in West Africa and Trust in East Africa are synonymous with condoms andattest to the power of social marketing.
Sanitation and Hygiene in Africa60

BOX 8.2 MARKETING MIX IN RURAL TANZANIA SANITATION MARKETING PROGRAM
Key formative research insights. Formative research conducted with technical assistance from WSP revealed that mosthouseholds were dissatisfied with their basic pit latrine (around 80% of rural households have such a facility) but felt theywere powerless to do anything about their situation. These findings suggested that the program needed to propose thatgood sanitation can be easily achieved and is not just for the wealthy, as many assumed. In addition, sanitationimprovements needed to be linked with improvements in status, convenience, and safety – especially for children.
Product. Households are encouraged to upgrade their pit by adding a SanPlat slab which is soft-branded as Sungura(rabbit in Swahili). This 2 foot-by-2 foot concrete slab is a consumer favorite – it is smooth, washable, and safe for children.
Price. A Sungura slab is about US$5 to purchase and about US$4 to produce. In some areas, US$5 includes installation; inothers, customers have to pay about US$1 extra.
Place/////distribution. Because villages in Tanzania are separated by large distances, transportation is a major constraint.Sanitation goods and services are not readily or widely available. WSP initially trained approximately 470 masonsresiding in or around priority villages to produce and sell Sungura slabs. Masons purchase raw materials andmanufacture them on-site near village centers, sometimes using makeshift workshops. Orders are taken directly fromhouseholds. Access to capital is a continuing issue for masons who often cannot buy in bulk on their own. Masonsoften rely on the district government to loan them the molds needed for manufacturing. WSP is currently testing adifferent business model to strengthen the supply chain, working with hardware stores who in turn mobilize masons.
Promotion. Based on formative research insights, a communication campaign anchored around the concept Choo Bora(roughly ‘A Good Toilet is Possible’!) was developed to empower households to make a change in their sanitation.Choo Bora messaging is integrated into all aspects of the intervention and the target audience encounters it throughseveral channels as follows:
Massmedia. Initially this was carried out through a soap opera consisting of five 15-minute episodes airing twice a week justbefore the evening news on the popular TBC Taifa station (AM and FM frequencies). The show was supported by spots,songs, and DJ mentions.
Direct Consumer Contact. DCC brings the communication campaign to villages through highly interactive road showspromoting sanitation upgrading though entertainment, contests, and testimonials. (See Figure 8.1 for a photograph ofa DCC event.)
Figure 8.1 Direct Consumer Contact event in rural Tanzania.
Interpersonal Communications (IPC). Initial community engagement comes through CLTS triggering in which thecommunity decides how and when to improve their sanitation facilities. CLTS events are carried out by district or wardfacilitators with coaching from resource agencies. CLTS is ‘unbranded’ and not explicitly linked to the ChooBora campaign.
Sanitation committees and masons. Once the community triggers and establishes an action plan, a mason can beginpromoting upgrades and a CLTS committee is formed to perform day-to-day promotion and monitoring.
Promotional materials. The campaign developed promotional materials (branded with Choo Bora) such as calendars foroffices and public places, T-shirts for sanitation committees, masons, champions, point-of-sale branding for masons,kangas for households, and notebooks and pens for local officials.
Moving households up the sanitation ladder through sanitation marketing 61

• Access to finance needs to be strengthened alongside the supply chain: To ensure that suppliers have the working capital topurchase materials or equipment or extend credit to consumers, access to finance through microfinance institutionsor other organizations needs to be strengthened at the same time as the supply chain is. Strategies to ensurehouseholds who wish to can borrow or pay in installments need to be developed through informal savings schemes ormore formal mechanisms.
• A poor-inclusive strategy needs to developed: Evidence fromCambodia and the Vietnam case study suggest that sanitationmarketing can reach the poor but that a gap in affordability may remain and complementary pro-poor strategies are needed.The use of human-centered design to develop lower cost but desirable products (see Box 8.4) should be considered but inaddition, programs are increasingly examining the use of targeted subsidies delivered based on outputs or outcomes thatwould not hamper the development of a sustainable market place.
• Sanitation marketing alone may not create open-defecation free (ODF) communities: The WSP/IRC case studymentioned earlier revealed that none of the communes where sanitation marketing had been piloted were ODF by theend of the project. The initial piloting of the Easy Latrine revealed a similar finding; cement producers were focusedon sales and not behaviour change. Once a satisfactory level of sales had been achieved in a village, a producer wouldmove to the next even if it is not ODF, reflecting a preference to ‘go wide’ rather than ‘go deep’. Complementaryapproaches such as CLTS are critical for ODF to be achieved.
BOX 8.3 A SERVICED-BASED APPROACH TO IMPROVED ACCESS TO URBAN SANITATION IN GHANA
In Kumasi, Ghana, many households rent their home, have limited space to build a toilet or face affordability constraintsin the market place. Lower cost options available to households without onsite sanitation include the use of flying toilets(plastic bags), open defecation or unimproved toilets (such as bucket or simple pit latrines). To improve coverage,WSUP, Unilever and IDEO are partnering to develop and test a new business model through which households couldpay to use a branded household toilet that would be regularly cleaned and emptied by a local franchised operator (Figure8.2). Plans call for a launch with 10,000 toilets in 2012 and a free-standing Ghanaian commercial enterprise to take overby 2013.
Figure 8.2 Diagram representing the service model used in Kumasi, Ghana.
Sanitation and Hygiene in Africa62

8.5 ROLES OF VARIOUS SECTORSThere is no single model to use when implementing a sanitation marketing initiative; however, most social marketing initiativesare undertaken by the nonprofit sector or government agencies. The role of private sector collaborators is critical on many levels,but their participation is motivated more by sustaining a viable business than by providing a social good. Following are somegeneral guidelines for consideration.
Non-profit or public sector
The role of the non-profit sector, such as the international development community, or the public sector, such as governmentagencies, is to design, coordinate, and monitor a sanitation marketing initiative at scale and engage the private sector whereit has a comparative advantage. In many countries, international organizations such as UNICEF or WSP or non-governmentorganizations such as SNV or Plan International lead the development of the communication campaign andsupply-strengthening strategy, with local governments implementing certain parts but these areas could also be filled byother organizations or a national-level government agency with the appropriate staff. As sanitation programs grow further inscale, it is anticipated that new counterparts within the various ministries might emerge, particularly for the program designphase. A centrally or provincially located counterpart might eventually lead or support the formative research process andanother might lead or support the development of behaviour change communication (BCC) strategy and campaign that willbe implemented and budgeted through local governments. For example, the communications counterpart could be theInformation, Education, and Communication (IEC) cell typically found in the Ministry of Health or the Department of RuralHealth Care within the Ministry of Rural Development. Alternatively, the counterpart could be a working group, across-departmental committee or a task force. Program managers must determine early in the design phase where candidatecounterparts are. Within a given country, it might be instructive to look at the how other large-scale social marketinginitiatives in such areas as HIV/AIDS, malaria, and family planning are managed.
BOX 8.4 USING HUMAN CENTERED DESIGN TO DEVELOPA LOWER COST POUR FLUSHTOILET IN CAMBODIA
In Cambodia, research findings suggested that most households aspire to a pour-flush toilet but cannot afford one. WSP,international NGO iDE, and design firm IDEO teamed up to develop an affordable and simple ‘latrine core’ (see Figure8.3) that would confer the benefits of a pour-flush but cost less than half the normal cost due to smarter use of materials,an improved production method, and a streamlined design. Called Easy Latrine, the toilet is available through localcement producers who are trained in sanitation and hygiene education, production, and basic business and salesmanagement. In addition, buying an Easy Latrine is a one-stop shopping experience. In the past, buying a latrineinvolved engaging a mason and visiting several specialized suppliers.
Figure 8.3 The Easy Latrine ‘latrine core’.
Moving households up the sanitation ladder through sanitation marketing 63

The public sector should play a lead role in setting and monitoring quality standards (e.g., safe disposal of the sludge removedfrom septic tanks) and providing the enabling environment for the sanitation business sector (e.g., reduction of prohibitive tariffson raw materials). Over time, the public sector will likely assume additional responsibilities.
Private sector
The private sector plays a range of critical roles in helping develop and implement a sanitation marketing initiative. There are twocategories of private sector actors:
• Firms involved (usually on a contractual basis) in developing and implementing supporting activities such as conductingresearch, designing communication materials, and implementing capacity-building activities; and
• Firms who deliver services or products that directly contribute to improving rural sanitation (such as microfinanceinstitutions or small-scale entrepreneurs who build latrines). Over time, associations, cooperatives or other types ofnetworks or alliances could emerge as the business sector evolves.
Box 8.5 showcases how various structures partnered to develop an urban sanitation marketing program in Malawi. It shouldbe noted that ‘partnerships’ are often referred to as the 5th p in social marketing.
BOX 8.5 PARTNERSHIPS IN ACTION IN URBAN MALAWI SANITATION MARKETING
In Malawi, the Blantyre and Lilongwe Water Boards secured funding from EU/EIB to improve sanitation and hygienepractices for 400,000 household members in low income areas by 2013 through sanitation marketing approaches. WSPprovided technical assistance by supporting the recruitment of an advertising agency, the development of IEC materialsincluding a low cost technology catalog and the organization of consensus building meetings and workshops onsanitation marketing. NGOs are supporting the Water Boards in implementation. A Technical Working Group was createdunder the SWAp (Sector Wide Approach program) to lead the development of the marketing strategy, as shown in theprocess in Figure 8.4 which also included stakeholder consultations at critical milestones.
Figure 8.4 Diagram summarizing the key milestones leading to the development of an urbansanitation marketing strategy in Malawi.
Sanitation and Hygiene in Africa64

8.6 ENABLING FURTHER UPTAKE AND SCALING UP OF SANITATIONMARKETING IN AFRICAChallenges to introduce or scale up sanitation marketing in Africa, and elsewhere for that matter are numerous. Lack of skills andcapacity in sanitation marketing within the lead institutions, weak coordination of the various implementation partners,households expectations of subsidies and lack of business acumen and access to working capital by suppliers are just a fewthat have been identified in the Malawi for urban sanitation marketing programs. In addition, rural sanitation marketing faceweak or even nonexistent rural distribution chains and dispersed and hard to reach populations mean greater transportationcosts get passed on to consumers, exacerbating affordability constraints.
Despite these challenges, some possible strategies to facilitate the diffusion and quality of sanitation marketing approaches areas follows:
• Capacity-building for lead institutions or partner agencies through online learning (see wsp.org/sanmarketingtoolkit),guidance documents (such as USAID/HIP Sanitation Marketing for Managers Guidance and Tools for ProgramDevelopment or WSP’s Introduction to Sanitation Marketing) or workshops. Such workshops have recently beenconducted in Malawi (led by GSF/MoH in February 2012) and Uganda (led by WSP/MoH in June 2012) and alsooffer the opportunity to discuss coordination and roles.
• Exposure visits and study tours within a country or between countries allow lead institutions and support agencies to getfirst hand understanding of the approach and share lessons learned.
• Learning through national platforms such as working groups or sanitation committees where experiences, study findingsand other knowledge is shared.
• Recruitment of marketing, communication or business development specialists who can apply best practice, effectivelymanage contracted firms (such as advertising agencies) and develop evidence-based strategies.
Moving households up the sanitation ladder through sanitation marketing 65

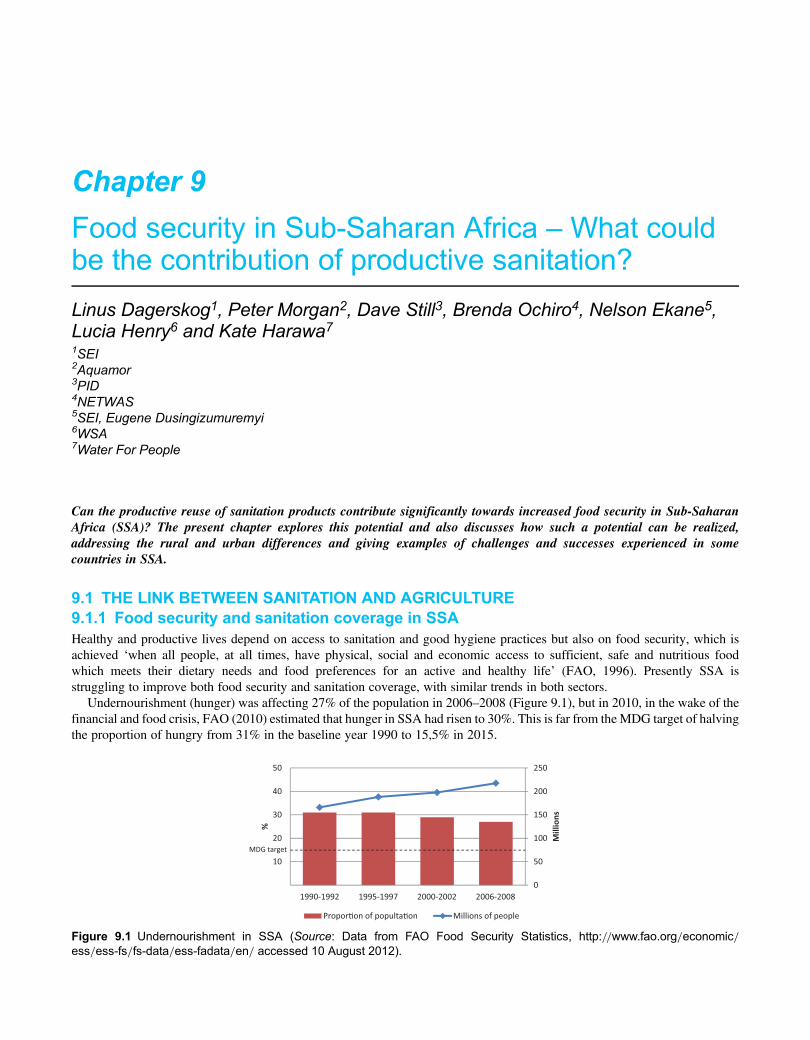
Chapter 9
Food security in Sub-Saharan Africa – What couldbe the contribution of productive sanitation?
Linus Dagerskog1, Peter Morgan2, Dave Still3, Brenda Ochiro4, Nelson Ekane5,Lucia Henry6 and Kate Harawa71SEI2Aquamor3PID4NETWAS5SEI, Eugene Dusingizumuremyi6WSA7Water For People
Can the productive reuse of sanitation products contribute significantly towards increased food security in Sub-SaharanAfrica (SSA)? The present chapter explores this potential and also discusses how such a potential can be realized,addressing the rural and urban differences and giving examples of challenges and successes experienced in somecountries in SSA.
9.1 THE LINK BETWEEN SANITATION AND AGRICULTURE9.1.1 Food security and sanitation coverage in SSAHealthy and productive lives depend on access to sanitation and good hygiene practices but also on food security, which isachieved ‘when all people, at all times, have physical, social and economic access to sufficient, safe and nutritious foodwhich meets their dietary needs and food preferences for an active and healthy life’ (FAO, 1996). Presently SSA isstruggling to improve both food security and sanitation coverage, with similar trends in both sectors.
Undernourishment (hunger) was affecting 27% of the population in 2006–2008 (Figure 9.1), but in 2010, in the wake of thefinancial and food crisis, FAO (2010) estimated that hunger in SSA had risen to 30%. This is far from the MDG target of halvingthe proportion of hungry from 31% in the baseline year 1990 to 15,5% in 2015.
0
50
100
150
200
250
1990-1992 1995-1997 2000-2002 2006-2008
10
20
30
40
50
Mill
ions
%
Propor�on of populta�on Millions of people
MDG target
Figure 9.1 Undernourishment in SSA (Source: Data from FAO Food Security Statistics, http://www.fao.org/economic/ess/ess-fs/fs-data/ess-fadata/en/ accessed 10 August 2012).
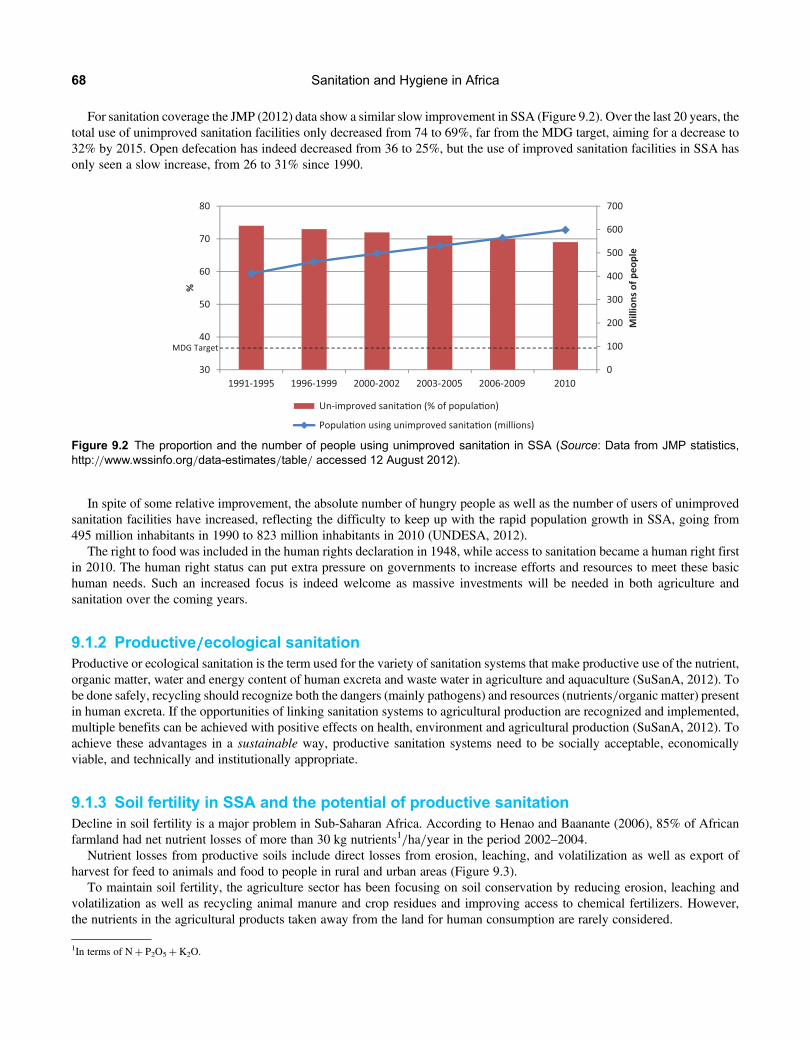
For sanitation coverage the JMP (2012) data show a similar slow improvement in SSA (Figure 9.2). Over the last 20 years, thetotal use of unimproved sanitation facilities only decreased from 74 to 69%, far from the MDG target, aiming for a decrease to32% by 2015. Open defecation has indeed decreased from 36 to 25%, but the use of improved sanitation facilities in SSA hasonly seen a slow increase, from 26 to 31% since 1990.
In spite of some relative improvement, the absolute number of hungry people as well as the number of users of unimprovedsanitation facilities have increased, reflecting the difficulty to keep up with the rapid population growth in SSA, going from495 million inhabitants in 1990 to 823 million inhabitants in 2010 (UNDESA, 2012).
The right to food was included in the human rights declaration in 1948, while access to sanitation became a human right firstin 2010. The human right status can put extra pressure on governments to increase efforts and resources to meet these basichuman needs. Such an increased focus is indeed welcome as massive investments will be needed in both agriculture andsanitation over the coming years.
9.1.2 Productive/////ecological sanitationProductive or ecological sanitation is the term used for the variety of sanitation systems that make productive use of the nutrient,organic matter, water and energy content of human excreta and waste water in agriculture and aquaculture (SuSanA, 2012). Tobe done safely, recycling should recognize both the dangers (mainly pathogens) and resources (nutrients/organic matter) presentin human excreta. If the opportunities of linking sanitation systems to agricultural production are recognized and implemented,multiple benefits can be achieved with positive effects on health, environment and agricultural production (SuSanA, 2012). Toachieve these advantages in a sustainable way, productive sanitation systems need to be socially acceptable, economicallyviable, and technically and institutionally appropriate.
9.1.3 Soil fertility in SSA and the potential of productive sanitationDecline in soil fertility is a major problem in Sub-Saharan Africa. According to Henao and Baanante (2006), 85% of Africanfarmland had net nutrient losses of more than 30 kg nutrients1/ha/year in the period 2002–2004.
Nutrient losses from productive soils include direct losses from erosion, leaching, and volatilization as well as export ofharvest for feed to animals and food to people in rural and urban areas (Figure 9.3).
To maintain soil fertility, the agriculture sector has been focusing on soil conservation by reducing erosion, leaching andvolatilization as well as recycling animal manure and crop residues and improving access to chemical fertilizers. However,the nutrients in the agricultural products taken away from the land for human consumption are rarely considered.
0
100
200
300
400
500
600
700
30
40
50
60
70
80
1991-1995 1996-1999 2000-2002 2003-2005 2006-2009 2010
Mill
ions
of p
eopl
e
%
Un-improved sanita�on (% of popula�on)
Popula�on using unimproved sanita�on (millions)
MDG Target
Figure 9.2 The proportion and the number of people using unimproved sanitation in SSA (Source: Data from JMP statistics,http://www.wssinfo.org/data-estimates/table/ accessed 12 August 2012).
1In terms of N+ P2O5+K2O.
Sanitation and Hygiene in Africa68

Most of the main plant nutrients like nitrogen (N) and phosphorous (P) in our food is found in the proteins. A growing humanbodywill incorporate and accumulate a minor part of the nutrients, but in general there is equilibrium between tissue build up andtissue degradation and essentially the same quantity of plant nutrients present in the food consumed is excreted via urine andfaeces (Jönsson et al. 2004). This implies that N and P in human excreta can be calculated based on protein consumptiondata, which is readily available. It is also worth noting that urine contains the main part of nutrients excreted by the humanbody and urine is normally pathogen free if not cross-contaminated by faeces (Jönsson et al. 2004).
The linear flowof plant nutrients fromproductive land to human settlements is indeed a blind spot in soil fertilitymanagement –but how significant is it compared to other nutrient flows in the agricultural system?
9.1.4 Relative nutrient quantities – comparing human excreta to chemicalfertilizer inputs, manure and erosion in SSAThe quantity of plant nutrients in human excreta in the SSA context can be illustrated in different ways. In this section the flow ofnutrients in human excreta is compared to the other main nutrient flows in the agricultural system (see Figure 9.3).
Chemical fertilizers in SSA. Table 9.1 shows an estimate of the annual quantity of N and P present in human excreta in the SSAregions, followed by a relative comparison to the quantity of N and P applied as chemical fertilizer and to the hectares of arableland in SSA. On average twice as much N and 1, 4 times as much P is excreted per year compared to what is applied as chemicalfertilizer. Complete recycling of human excreta to arable land in SSA would mean an addition of∼12 kg of N and∼4 kg of P2O5
per hectare.
Villages
Livestock Fertilizer
Cities
• Erosion• Leaching• Volatilization
Productive land
Figure 9.3 Major flows of plant nutrients from productive land, with the dotted lines illustrating the lack of return flow of nutrientsfrom human settlements to productive land.
Table 9.1 Relating N and P in human excreta to chemical fertilizer use and to arable land in SSA.
SSA Region Population(millions)1
Estimated annualnutrient flow perperson in human
excreta2
Annual nutrient flowin human excreta2 inrelation to chemicalfertilizer use3 in SSA
Annual plantnutrients in humanexcreta2 related tohectares of arable
land in SSA4
N (kg) P2O5 (kg) N P2O5 N (kg) P2O5 (kg)
Eastern 342 2,5 0,9 2,3 1,3 14,0 5,1
Middle 126 2,6 0,9 7,4 7,0 9,7 3,4
Southern 58 3,7 1,2 0,5 0,3 13,3 4,3
Western 304 2,9 1,1 3,5 3,0 10,7 3,8
Total 830 2,8 1,0 2,0 1,4 11,9 4,2
1. UNDESA (2012).2. N and P in human excreta derived from protein supply (average 2000–2007) using the method proposed by Jönsson et al. (2004).P expressed as P2O5, which is the standard for fertilizers.3. Fertilizer use taken from FAO-STAT (average 2002–2009).4. Data on arable land 2009 from FAO-STAT.
Food security in Sub-Saharan Africa – What could be the contribution of productive sanitation? 69

Comparisons to chemical fertilizers are valuable when communicating to agriculture professionals and can also be used togive a monetary value to nutrients in human excreta. It should be noted that chemical fertilizer use in SSA is very low in aglobal context and would need to increase to boost agricultural production. Sanitized human excreta should therefore be seenas a complement rather than a replacement of existing fertilizers. Recycling human excreta helps reduce losses, but toincrease fertility in degraded soils all available resources are needed: animal manure, crop and food residues, chemicalfertilizers as well as human excreta.
Dagerskog and Bonzi (2010) find that the annual N and P in urine and feces from a family of ten persons in Burkina Fasoroughly corresponds to the quantity of N and P in 50 kg of urea and 50 kg of NPK (14-23-14) which costs about 80 $(Figure 9.4). In this context the excreta nutrient value is about 8 $ per person per year. The value will vary betweencountries depending on protein intake and price of fertilizer. Considering a range of 5–10 $/person/year in excreta nutrientvalue and extrapolating for SSA, there are plant nutrients worth 3,3–6,6 billion $ per year in human excreta. It is worthnoting that this value is only based on the main nutrients (N, P, K), while urine and feces are complete fertilizers, alsocontaining important micro elements and organic matter.
Animal manure. Comparing animal manure and human excreta production in SSA, Drangert (2010) estimated that in total thereis 1–2 times as much nitrogen in the total quantity of manure generated by livestock compared to what is found in the totalquantity of human excreta in SSA. Reuse of animal manure is already a widespread practice and could be complemented bysafe recycling of human excreta.
Erosion. Stoorvogel (1993) has done extensive calculations of nutrient budgets for soils in SSA and estimated the averagenutrient losses due to erosion to be of similar magnitude as the nutrients taken out with harvested products, which afterconsumption mainly end up in excreta.
The above comparisons show that human excreta contain a significant quantity of nutrients, but how much crops could beproduced based on these plant nutrients?
What could excreta recycling mean for food production?Yanggen et al. (1998) compiled output/nutrient ratios (kg of extra yield harvested per kg of nutrient applied) for variouscrops in SSA. Using a moderate output/nutrient ratio of ∼10 from Yanggen et al. (1998), and estimating that human excretaproduced annually per person in SSA contain the equivalent of ∼5 kg of fertilizer nutrient equivalents2, recycling humanexcreta can give on average an extra production of ∼50 kg of cereals per person per year. This would be enough to cover theenergy requirement for a person during 71 days3.
Figure 9.4 Two bags of fertilizer used to illustrate the nutrients in the excreta from an average rural family.
2N and P2O5 from Table 9.1 and K20 estimated to ∼1,5 kg per person based on P/K proportions in Jönsson et al. (2004).3Based on ∼3500 kcal/kg cereal (FAO, 1968) and 2500 kcal as daily energy intake.
Sanitation and Hygiene in Africa70

9.2 RURAL AND URBAN PRODUCTIVE SANITATION IN SSAOver the last decade several projects in SSA have been implemented with the intention to also facilitate reuse of sanitationproducts. The Sustainable Sanitation Alliance (SuSanA) secretariat has listed 84 projects in SSA of which 28 have beendescribed extensively in the SuSanA case study format (http://susana.org/lang-en/case-studies). This section discusseschallenges and opportunities of productive sanitation in the rural and urban contexts using some examples presented duringthe EcoSan workshop at AfricaSan3 in Rwanda 2011.
9.2.1 Rural recyclingProductive sanitation is more straightforward in rural areas compared to urban areas, considering the relatively short distancesbetween households and productive land and the self-interest of farmers to maintain soil fertility. In SSA 64% of the populationis rural, and this rural majority is projected to remain for another 25 years (UNDESA, 2012). 75% of the extremely poor (,1.25 $per day) in SSA live in rural areas and the extremely poor constitute 62% of the rural population (IFAD, 2011). The rural poorhave difficulties affording chemical fertilizers which is reflected in the low use of fertilizer per ha in SSA (12 kg/ha4). In a smallholder farmer environment, the conscious management and use of local natural resources is crucial for sustained crop production.However, the awareness of fertilizer value of human excreta is often low, and sanitation initiatives traditionally focus on healthand hygiene, that is the ‘danger’ aspects of human excreta. Attempts to also include recycling aspects have been made at somescale in SSA, here exemplified with different approaches:
Crop production as a driver for sanitation. WSA (previously CREPA) has in some larger projects in both Burkina Faso, Nigerand Ivory Coast mobilized funding from the agriculture sector to implement productive sanitation contributing to improved cropproduction while also improving sanitary conditions (details in Klutse & Dagerskog, 2009). Sanitized human urine and feceshave been introduced in the communities as liquid and solid fertilizers, and demand for sanitation has been created mainlythrough participative testing of these ‘local fertilizers’. Agriculture professionals have been in the forefront, in closecollaboration with professionals in sanitation/health. The field demonstrations have been carried out in parallel to the use ofadapted PHAST tools that convey the message of the sanitary danger of fresh human excreta as well as the resources intreated excreta and how to achieve this transformation.
This approach has had some success, and in Niger one of the pilot project partners, PPILDA (funded by IFAD), is now scalingout productive sanitation via farmer field schools with the support from the pilot farmers, masons and facilitators. In PPILDA’sintervention zone now more than 2000 households collect and use urine (many times to enrich the composting piles) and 300households use Fossa Alternas latrines with urine diversion to also produce composted feces. In 2012, 18 farmer field schoolswill test the fecal compost as base fertilizer for cereals (pers. comm. M. Adamou, PPILDA). For documentation on the Nigerpilot project from 2009, see www.ecosanres.org/aguie.
In Burkina FasoWSA has coordinated projects with food security focus and∼10,000 double vault UD-toilets that are used as‘fertilizer-factories’, and provide 150,000 people access to sanitation and fertilizers (pers. comm. L. Henry, WSA).
In Ivory-Coast, more than 1000 UD toilets have been implemented in workers villages, in collaboration with the rubber treecompany SAPH, as part of their sustainability work. The urine and treated feces are used nutrient source for composting in thetree nurseries. Several other agro-industrial companies are in the process of starting up similar work (pers. comm. B. Comoe,WSA-CI).
Taking incremental steps towards closing the loop. Dr Peter Morgan from Zimbabwe has popularized simple compostingtoilets like the Arbor-loo and Fossa Alterna. The Arborloo is a refinement of the traditional African technique of plantingtrees in disused toilet pits. The refinement is that soil and ash (and preferably leaves) are regularly added as well as excreta,which reduce odor and fly nuisance and also accelerate the composing process in the pit. The Arbor-loo approach is simpleand very low cost, and can be regarded as the first stage of a series of techniques in which the nutrients in human excretacan be recycled, with the Fossa Alterna using alternating composting pits as the next step, see Morgan (2007). The Arborlooand Fossa Alterna has proved popular in countries like Malawi where, by mid 2006, over 12,000 toilets had been built(World Bank, 2007) and also Ethiopia with at least 70,000 Arbor-loos (pers. comm. Chala, CRS Ethiopia). These toiletshave also been promoted in Mozambique, Kenya and Tanzania and the total number is estimated at 100,000+ serving abouthalf million people at the present time (pers. comm. P. Morgan). These technologies are relatively easy to grasp andimplement for sanitation professionals and households, while providing the opportunity to begin recycling in a safe way.
4FAOSTAT.
Food security in Sub-Saharan Africa – What could be the contribution of productive sanitation? 71

Composting toilets in a rural business approach. To get away from subsidies and stimulate the private sector involvement inrural sanitation, Water For People in Malawi supported local masons to promote and construct slabs for composting toilets. 333slabs were installed with humanure production being the main driver for the households. However, despite different paymentoptions the payback rate to masons was very low. One option was to pay back with the compost produced, but the masonsfaced problems in turn to sell the compost to a reasonable price. With no monetary incentives the masons gave up andsearched for other livelihoods. The experience has been documented (Water For People, 2012) and lessons includeadvocating states and NGOs to stop market distorting subsidies; select masons with entrepreneurial skills; develop messagesaround agricultural benefits of humanure and establish better credit schemes for households.
9.2.2 Urban recyclingUncontrolled reuse of sludge and waste water is common in peri-urban farming around many cities in SSA as few municipalitieshave the financial and human resources to assure the whole sanitation chain from collection and treatment to disposal/reuse.
Closing the nutrient loop from cities to productive land is a challenging task as few urban households grow crops, and asystem of collection, treatment and transport for reuse has to be set up in a complex institutional landscape while being botheconomically sustainable and well monitored.
Presently several initiatives explore the business opportunities in the ‘sanitation value chain’, aiming to use the value of wasteto establish and sustain sanitation services (see for example www.safisana.org in Ghana and www.susan-design.org in Uganda).Entrepreneurs in the chain would make a profit from the sanitation service given to households and as well as from selling theenergy/fertilizer in the sanitation products.
In Ouagadougou in Burkina Faso, a bold project (2006–2009) aimed at implementing a new sanitation system, including∼900 urine diverting toilets in four sectors of the city, with local associations doing collection and treatment of urine andfeces aiming to sell the sanitized products to peri-urban farmers. Theoretically the household fee and the payment by farmersfor fertilizers could cover the running costs, but multiple challenges has threatened the sustainability of the system (seeDagerskog et al. 2010) and the municipality has had to support the main share of the associations costs. In spite of extensiveparticipative trainings with urban farmers, urine has been a challenge to sell, even though in 2010 the associations reported atotal sale of 68 m3 of urine and 11 tons of treated feces (pers. comm. A. Sienou 2011, Ouagadougou Municipality). In anup-scaling scenario, the limit to recycling would be space and water for urban agriculture. The fertilizer use of the existing201 ha of urban agriculture in Ouagadougou would theoretically be satisfied by the nutrients in excreta of ∼50,000 peoplemeaning, that the bulk of the excreta from 1,5 million inhabitants would have to be transported to rural areas, at increasedcosts (Dagerskog et al. 2010).
9.3 ENABLING ENVIRONMENT FOR ECOLOGICAL SANITATIONTo go beyond pilots, it is important that national policies and legislation allow/support both different sanitation technologies andthe safe reuse of sanitation products in crop-production. This may require changes to existing sanitation, environmental andagricultural policies, or enactment of a new policy.
The WHO guidelines for the Safe Use of Wastewater, Excreta and Greywater in Agriculture and Aquaculture (WHO, 2006)can be used as a reference when national policies and legislations are developed. TheWHO guidelines aim to protect the health ofindividuals and communities by recommending safe practice requirements and supporting the development of risk management.It should also be kept in mind that a legal framework that focuses on desired functions of the sanitation system rather than specifictechnologies stimulates innovation and is not outdated as fast as technical prescriptive regulatory frameworks (Kvarnström et al.2011).
In some SSA-countries, sanitation strategies are beginning to acknowledge technologies that facilitate recycling (such asurine diversion toilets) but there is still a lack of policies going beyond technology focus, with a more holistic vision forexcreta recycling. An interesting note is that the coming Agricultural Investment Plan by the Ministry of Agriculture in Côted’Ivoire has included ecological sanitation in the Sustainable Soil Management component (MINAGRI, 2012).
Rwanda. Sustainable waste management is one of the key building blocks in the infrastructure development pillar of Rwanda’sVision 2020. The country’s commitment to attain 100% sanitation coverage by 2020 is clearly shown in the National Policy andStrategy for Water and Sanitation services as well as EDPRS (Economic Development and Poverty Reduction Strategy). TheMinistry of Infrastructure recently prepared a guideline of latrine technologies usable in Rwanda. This document presents arange of sanitation systems and technologies appropriate for different geographical regions of the country. The appropriatesanitation technologies and systems recommended in the guideline include: simple pit latrine; ventilated improved pit latrine
Sanitation and Hygiene in Africa72

(VIP); flush toilet; and eco-toilet (Urine Diversion Toilet). The eco-toilets have been focused on the volcanic region of thecountry where it is difficult to dig pits, and a good number of households have improved their income and livelihoods due tosales of crops fertilized by using human derived nutrients (pers. comm. N. Ekane).
Uganda. In Uganda ecological sanitation is being promoted as an alternative sanitation approach initially in rural areas withdifficult geographical conditions that limit construction of ordinary pit latrines and for urban areas. However, the re-use ofdried substrates, high rate of filling of vaults especially primary schools and public toilets and poor performance in operationand maintenance continue to pose challenges to up scaling. Uganda developed its first ecological sanitation strategy(2008–2018) that focuses on coordination and networking; change of attitudes; concept and technology and political andpolicy support. Clear attempts are made to close the loop here by bringing out strategies and interventions on cross-sectorallinkages with research and agriculture in the re-use of by products. In a review of the strategy facilitated by NETWASUganda, stakeholders explored strategies of promoting the Ecosan as a system and not a facility through linking with othersustainable sanitation approaches like CLTS and San-Mark.
The National Agricultural Research Organization (NARO) has developed local urine guidelines on application of urine infarming and in collaboration with Kampala City Council Authority, the Ministry of Agriculture Animal Industry andFisheries (MAAIF) is in the process of developing a national policy on Urban Agriculture in Uganda which also includes aprovision on sludge reuse.
9.3.1 ResearchLocal research is needed for decision support and policy development. South Africa is particularly active with several researchactivities related to treatment and beneficiation of sanitation products.
For the last three years the Water Research Commission in South Africa has been investigating the suitability of deep rowentrenchment of faecal sludges as a disposal option (Figure 9.5). The topics of interest to the researchers have been the effecton the growth of trees planted over or close to the entrenched sludge, the fate of the pathogens and the effect on the groundwater.
Results show that trees grow very well, that ascaris eggs have been inactivated after 30 months but nutrients leaked to groundwater on a site with shallower soil. One of the topics of further research work is to work out how nutrients such as NO3 and P arestored and migrate within the soil.
In Durban several research initiatives are ongoing, on for example pit sludge treatment methods and different ways totransform urine to make it a more attractive fertilizer. The University of Kwa-Zulu Natal has also received a Gates grant totake part in the quest of designing the 21st century toilet.
9.4 LOOKING FORWARDThis chapter has discussed the potential of excreta recycling in the context of natural resource management, sustainable cropproduction and food security in SSA. Social, technical and institutional landscapes might not yet favour excreta recycling,but situations change and here are some suggestions that could lead towards greener and more productive sanitation in SSA:
Plan for the system not for the technology. Sanitation does not end with a functioning toilet. Sooner or later vaults, septic tanksand pits fill up, and something has to be done with the contents. The ecological sanitation concept addresses this aspect from the
Figure 9.5 Research site near Durban, South Africa, where deep row entrenchment of faecal sludge is being monitored.
Food security in Sub-Saharan Africa – What could be the contribution of productive sanitation? 73

outset, but too often the concept is confounded with a specific toilet technology, for example urine diversion dry toilets. Urinediverting toilets can facilitate treatment and reuse but if there is low user acceptance and only vague plans for maintenanceincluding who should take care of the sanitation products, when to collect them, where to bring them and how to applythem, such a technology probably creates more problem than it solves. This is especially true for public and school toiletsthat depend on a robust technology/system for sustained use. Regardless of the technology the resulting sanitation productsshould be managed in a safe and if possible productive way.
The rural context – link up with the agriculture sector. If there is an intention for safe reuse of sanitation products, it will beimportant to create demand for the end product as much as for the toilet. The awareness and know-how on reuse of such organicfertilizers in crop production is promoted with more credibility by the agriculture sector. It should therefore be high priority toinvolve agriculture professionals in productive sanitation initiatives. With persistently high chemical fertilizer prices, the need toconserve local resources will become more important. If the potential of excreta recycling is recognized, the agriculture sectorcould drive the demand for sanitation products, and the demand for sanitation systems that can deliver them. This could alsochannel funds from agriculture for productive sanitation.
Rural families in SSA should also have the right to know about the resources available in human excreta and how to eliminatedangers and use the nutrients in simple ways. Based on such knowledge they can take an informed decision on how to deal withthis local resource.
The urban context – developing the sanitation value chain. Urban centers can be seen as nutrient mines with business potentialin collecting, treating, transforming and delivering organic fertilizers (and eventually energy). To be done in a safe andsustainable way there is still ample room for development of appropriate technologies, business plans and legal/institutionalframeworks. A high quality and attractive end product is crucial to be able to compete on the fertilizer market, especially tocompensate for bulkiness and more expensive transport which often is a problem for organic fertilizers.
Cost should not be a limiting factor. Productive sanitation solutions do not have to be fancy or expensive. Heavily subsidizedon-site interventions have shown limited sustainability and scalability. The principles of productive sanitation: containment,sanitization and reuse can be achieved in many ways. In rural areas, an Arbor-loo can be complemented with a simple urinaland allow for a very good nutrient recovery to a low cost, risk and complexity. One obstacle has been the handling ofcollected urine. Storing and applying large volumes of urine as a liquid fertilizer is rarely feasible, but using urine to enhancecompost or incorporate it in the field during the off-season can be viable alternatives. The main cost related to productivesanitation will be public investment in awareness raising, research, training, monitoring and policy development.
Turn the present low sanitation coverage into an opportunity. Not yet locked into expensive and unsustainable sanitationsystems, SSA is in a good position to take a lead in productive sanitation systems. The rural majority still has a closerelationship to the land and rapidly grasp the advantages of recycling. The opportunities for recycling and production is apositive message and should be a good complement (pull factor for sanitation) to the ‘danger’-messages often conveyed insanitation programs (push factor for sanitation).
Relatively lowmedical use and few centralized waste water systems minimize problems with medical residues, chemicals andheavy metals encountered when dealing with sludge in developed countries.
Address the need for capacity building and research. To influence policies and induce change, there is a need of raisingawareness among all stakeholders. As a complement research will be vital to inform policy with economical arguments andrisk assessments, as well as new technical and social methods to facilitate the implementation of productive sanitation.Excreta recycling is by nature a multi-stakeholder cross-cutting issue and needs a platform for exchange and dialogue,preferably led by the Ministry of Agriculture.
To conclude, it is clear that productive sanitation has an important role to play in sustaining soil fertility and hence agriculturalproduction. In SSA, we have shown that nutrients in human excreta represent an estimated annual value of 3.3–6.6 billion $.Productive sanitation could produce roughly 50 kg of cereals extra per person per year and hence significantly contribute tofood security.
Sir Albert Howard, one of the founding fathers of organic agriculture, commented the modern lack of recycling in hisAgricultural Testament seventy years ago saying that ‘Man is depriving Mother Earth of her manurial rights’ (Howard,1940). This realization is now gaining ground in many places, and SSA has the potential to play a leading role in thedevelopment and adoption of more productive sanitation systems.
Sanitation and Hygiene in Africa74
9.5 REFERENCESDagerskog L. and BonziM. (2010). Openingminds and closing loops – productive sanitation initiatives in Burkina Faso and Niger, Sustainable
Sanitation Practices no. 3, Use of urine, pp. 4–11. www.ecosan.at/ssp/issue-03-use-of-urine/issue-03Dagerskog L., Coulibaly C. and Ouandaogo I. (2010). The emerging market of treated human excreta, UAMagazine no 23, The Role of Urban
Agriculture in Sustainable Urban Nutrient Management, pp. 45–48. http://www.ruaf.org/node/2217Drangert J-O. (2010). Nutrient and water cycles in biosphere and society. In:Module 4.1, Source Book for Sustainable Sanitation for the 21st
Century. http://www.sustainablesanitation.info/upload/4.1_Nutrient_and_water_cycles_2010-09-08.pdfFAO (1968). Food Composition Table for Africa. http://www.fao.org/docrep/003/X6877E/X6877E05.htm#ch5.1FAO (1996). Rome declaration on world food security and world food summit plan of action. World Food Summit, 13–17 November 1996.
Rome.FAO (2010). The State of Food Insecurity in the World – Addressing Food Security in Protracted Crisis. www.fao.org/
docrep/013/i1683e/i1683e.pdfHenau J. C. and Baanante (2006). Agricultural Production and Soil Nutrient Mining in Africa: Implications for Resource Conservation and
Policy Development. IFDC, Muscle Shoals, AL, USA http://www.africafertilizersummit.org/Background_Papers/03%20Henao%20and%20Baanante–Agricultural%20Production.pdf
Howard A. (1940). An Agricultural Testament. Oxford University Press.IFAD (2011). Rural Poverty Report, http://www.ifad.org/rpr2011/index.htmJönsson H., Richert Stintzing A., Vinneras B. and Salomon E. (2004). Guidelines on the Use of Urine and Faeces in Crop Production,
EcoSanRes Publications Series, Report 2004-2.JMP (2012). Progress on Drinking Water and Sanitation 2012 Update. WHO and UNICEF.Klutsé A. and Dagerskog L. (2009). Agro money for sanitation provision – examples from Niger, Burkina Faso and Côte d’Ivoire, 3rd
International Dry Toilet Conference, 12–15 August 2009, Tempere, Finland. http://huussi.net/tapahtumat/DT2009/pdf/poster_Linus_and_Amah.pdf
Kvarnström E., McConville J., Bracken P., Johansson M. and Fogde M. (2011) The sanitation ladder – a need for a revamp? Journal of WaterSanitation and Hygiene for Development, IWA Publishing, 01,1 2011. http://www.iwaponline.com/washdev/001/0003/0010003.pdf
MINAGRI Côte d’Ivoire (2012). Programme national d’Investissement Agricole (PNIA 2010–2015).Morgan P. (2007). Toilets that make compost, EcoSanRes, SEI. http://www.ecosanres.org/toilets_that_make_compost.htmSuSanA (2012). Productive Sanitation and the Link to Food Security, Factsheet for SuSanA WG5,. http://www.susana.org/lang-en/
library/rm-susana-publications?view=ccbktypeitem&type=2&id=101UNDESA (2012). World Urbanization Prospects: The 2011 Revision. CD-ROM Edition.Water For People (2012). Rural Sanitation Marketing, Proof point 10pp.WHO (2006). WHO Guidelines for the Safe Use of Wastewater, Excreta and Greywater – Volume IV: Excreta and Greywater use in
Agriculture. World Health Organization (WHO), Geneva, Switzerland. www.susana.org/lang-en/library?view=ccbktypeitem&type=2&id=1004
World Bank (2007). Lessons from a low cost ecological approach to sanitation in Malawi, Field Note.Yanggen D., Kelly V., Reardon T. and Naseem A. (1998). Incentives for fertilizer use in sub-Saharan Africa: a review of empirical evidence on
fertilizer response and profitability, Michigan State University Working Paper No. 70.
Food security in Sub-Saharan Africa – What could be the contribution of productive sanitation? 75


Chapter 10
Profitability of private fecal sludge emptyingbusinesses in Africa and Asia
Doulaye Kone1 and Sangeeta Chowdhry21Senior Program Officer, Bill & Melinda Gates Foundation, 500 Fifth Avenue North, Seattle, WA 98102 USA.Email: [email protected] Consultant, San Francisco, California 94115 USA. Email: [email protected]
Public authorities largely ignore fecal-sludge management, emptying and transporting sludge from household on-sitesanitation. At AfricaSan3, participants noted that whilst there is some individual knowledge of those responsible foremptying and transporting waste and some high level rapid assessments of general septage management, there isextremely limited data on the business models of these private emptying businesses. This chapter responds to this need byreporting on the findings of a study examines the profitability of the private fecal sludge emptying business in 119 privatefecal sludge emptying service providers across 30 cities in Africa and Asia. The study demonstrates the high costs inAfrica and concludes that the key to increasing the financial viability of existing FSM businesses lies in finding ways tosupport the expansion of truck fleets, in particular the expansion beyond a single truck.
10.1 THE STUDYAmong the reasons for poor performance in sanitation service provision is an ongoing failure to prioritize and finance thesector. A recent report published by the World Health Organization (WHO) (Hutton, 2012) estimates the capital costs ofachieving the MDG target for sanitation at $23 billion a year. While these costs are undoubtedly high, the economic benefitsof addressing the issue of safe sanitation are equally significant – being estimated at around $54 billion a year globally. A2004 WHO study notes that for every US$1 invested in water and sanitation would, depending on the region, yield aneconomic return of between US$3 and US$34 (Hutton & Haller, 2004). Given these benefits and the costs of not doing so,there has been insufficient investment in safe sanitation. The focus has tended to be on demand creation for latrines and oninfrastructure like sewage networks and wastewater treatment plants. Yet, only 13% of households in Africa are evenconnected to sewer lines (WHO/UNICEF, 2000). In Sub-Saharan Africa, over 80% of large cities and almost 100% ofsecondary towns are served by on-site sanitation (Strauss et al. 2000). In most developing countries, urban sanitation is adecentralized responsibility with no clear roles and responsibility assigned for fecal sludge management. The publicauthorities primarily view sanitation in terms of infrastructure provision like latrine construction, sewerage network andwastewater treatment facilities. Fecal-sludge management related to household on-site sanitation emptying and transportationis, by and large, ignored by the public authorities. The majority of cities in developing countries rely on informal services forexcreta disposal and the business of emptying and transporting fecal sludge is dominated by private entrepreneurs (Jeulandet al. 2004). Despite this fact, the data on this service provision is limited.
At AfricaSan3, participants noted that whilst there is some individual knowledge of those responsible for emptying andtransporting the waste (pit emptiers and truckers), and some high level rapid assessments of general septage management(AECOM, 2010), there is extremely limited data on the business models of these private emptying businesses. Given theprevalence and reliance on these services, this data is needed to provide the necessary information on market needs andchallenges to enable targeted funding by governments, donors, or other development partners.
In order to address these gaps this chapter reports on the findings of a study that compares the profitability of the private fecalsludge emptying business in cities in Africa and Asia.

The countries in which the study took place were selected based on the range of models and approaches to urban sanitation inthese geographically diverse regions. The countries selected in Africa were Burkina Faso, Ethiopia, Kenya, Nigeria and Senegaland in South/Southeast Asia were Bangladesh, Cambodia, India, Malaysia and Vietnam. Within each of these countries, threecities were selected and in-depth case studies conducted in order to better understand the full spectrum of urban-sanitationservice-delivery models for differing market sizes. The cities selected in each country included the capital city, a secondarylarge city and a mid-sized city as shown in Table 10.1.
10.2 KEY RESULTSAcross all cities, 50% of the private fecal sludge emptying businesses surveyed own only one truck, 44% are medium sizedbusinesses with two to four trucks, and the remaining 6% run operations with five or more trucks. The levels of profit (asindicated by monthly cash flows) per truck were much lower for single truck operators than those for multi-truck owners(see Table 10.2). Similar results were also reported in an earlier World Bank study (Collignon & Vezina, 2000).
Table 10.1 List of selected cities.
Capital city City 2 City 3
Burkina Faso Ouagadougou Bobo Dioulasso Fada N’Gourma
Ethiopia Addis Ababa Dire Dawa Hosaena
Kenya Nairobi Kisumu Mombasa
Nigeria Abuja Ibadan Yenagoa
Senegal Dakar Touba Thies
Bangladesh Dhaka Khulna Faridpur
Cambodia Phnom Penh Siem Reap Kampot
India Delhi Jaipur Madurai
Malaysia Kuala Lumpur Melaka Kuala Terengganu
Vietnam Hanoi Ho Chi Minh City Hai Phong
Table 10.2 Monthly cash flows per truck of 56 private businesses in 30 cities.
Small Medium Large
Abuja $1383 $11,164
Addis Ababa $648 $869
Bobo-Dioulasso $244
Dakar $283 $1090 $1629
Dhaka −$58
Delhi $422
Dire Dawa $337
Faridpur −$91
Haiphong $708
Hanoi $684 $474
Ho Chi Minh $715 $999 $903
Ibadan $2457
Jaipur $310
Kampot $93
Khulna $375 $349
Kisumu $353 $438
Madurai $210
Melaka −$1887
(Continued )
Sanitation and Hygiene in Africa78

The business owners surveyed rarely consider depreciation when determining profits, as it is a non-cash transaction. Ifdepreciation were to be included (as it should be), the profit levels drop significantly. As highlighted in Figure 10.1, somesingle-truck operators with a positive monthly cash flow are actually running at a loss when 10-year depreciation costs arefactored in. The impact of not considering depreciation may result in a lack of funds to replace a truck when it is no longeroperational. In the case of the single-truck operators, this can then result in overall business collapse.
Larger fleet sizes are more profitable than single truck operations because of additional efficiency and less susceptibility todowntime, which in the case of a single truck will entirely halt the company’s operation. Amulti-truck fleet is also able to take onnon-domestic emptying contracts. In this study, 100% of the single truck owners engaged in exclusively domestic emptying,whereas only 13% of the companies with a larger fleet did so exclusively. Non-domestic emptying allows for more incomeas the size of septic tanks at commercial sites are larger than residential ones, and thus require a greater number of trips (andthus more fees) for emptying.
A study of emptying companies in Dakar (Mbeguere et al. 2010) reported that it was this diversification of revenuesources – that is, the addition of non-domestic emptying contracts – that was the factor that allowed for increasedprofitability of the fleet.
10.2.1 Trucks used for FSM emptyingThe largest capital expense – and the greatest barrier to market entry – is the cost of the truck itself. The purchase price of thetrucks in the five African countries was, on average, $34,000 per truck and in Asia around $13,000 per truck. This regionaldifference may be explained by the variation in truck capacity between the regions – which is under 4 m3 in Asia and 10 m3
on average in Africa (Figure 10.2). In addition, in Asia these smaller trucks are assembled locally, whereas in Africa thetrucks are usually imported second hand from Europe.
Table 10.2 Monthly cash flows per truck of 56 private businesses in 30 cities (Continued ).
Small Medium Large
Mombassa $353 $3231
Nairobi $836 $300
Ouagadougou $577 $1223
Phnom Penh $650 $333
Siem Reap $92
Thiès $103 $365
Touba −$145 $1199
Yenagoa −$203
Average $356 $1456 $960
-$10,000
-$5000
$0
$5000
$10,000
$15,000
$20,000
Abu
jaN
airo
biH
o C
hi M
inh
Han
oiP
hnom
Pen
hA
ddis
Abe
baO
uaga
doug
ouD
ehli
Khu
lna
Kis
umu
Mom
bass
aJa
ipur
Dak
arB
obo-
Dio
ulas
soM
adur
aiT
hiès
Kam
pot
Sie
m R
eap
Dak
haF
arid
pur
Tou
baY
enag
oa
Profit Before Depreciation Profit After Deprecitation
Figure 10.1 Profitability of small private businesses – with and without depreciation.
Profitability of private fecal sludge emptying businesses in Africa and Asia 79

10.2.2 Access to financeAccess to finance for the purchase of these trucks is a significant barrier to market entry faced by entrepreneurs and compoundsthe barrier presented by the high truck costs. With onerous terms for loans – high interest rates (ranging from 11% to 22%), shortrepayment cycles, and collateral requirements – most of the business owners are unable to qualify for loans and have to rely onpersonal savings or loans from family and friends to finance their business. This lack of access to finance slows down the growthpotential of these businesses. One outcome of this is the dominance in this sector of single truck businesses that are barelyprofitable. Table 10.3 lists the interest rates and repayment terms for each country at the time of study.
In Ethiopia, FSM companies can borrow at a 10.5% interest rate to be repaid in five to ten years. Proof of collateral of up to70% of the investment is required to secure these loans. Although there are some schemes through the Development Bank ofEthiopia that support small businesses and provide soft loans under better conditions, these loans are not available for thepurchase of vacuum trucks.
In Nigeria, loans are, in theory, available on the satisfaction of certain criteria such as the provision of collateral andguarantees but most FSM borrowers are unable to meet these. Banks typically require evidence that the business has regularcustomers, and unless the emptier has contracts with commercial or corporate entities such evidence is hard to provide. Thecommercial banks do not have special concessional loans for small businesses and the high interest rates, short loan periodand collateral requirements make it difficult for small businesses to obtain commercial loans.
In Kenya, most operators are unable to use debt to finance start up operations. Most loans from commercial banks ormicro-finance institutions for small and medium sized entities are only available for a period not exceeding 3 years.Commercial banks do offer longer-term loans but these are for high net-worth individuals and have to be secured by
$0$10,000$20,000$30,000$40,000$50,000$60,000
- 2 4 6 8
10 12 14
Ban
glad
esh
Cam
bodi
a
Indi
a
Mal
aysi
a
Vie
tnam
Bur
kina
Fas
o
Eth
iopi
a
Ken
ya
Nig
eria
Sen
egal
Asia Africa
Tru
ck C
ost
Cap
acit
y (m
3 )
Average Capacity of truck Average Cost per truck
Figure 10.2 Truck capacity and price by country.
Table 10.3 Source of funding for the mechanical truck owners.
Primary sourceof funds
% ownerstaking loans
Bank interest rateand terms
Burkina Faso Self 100% 12% 3 years
Senegal Self 15% 14% 5 years
Ethiopia Self 33% 10.5%, 5–10 years
Nigeria Self 9% 22% 2 years
Kenya Self 40% 18% 3 years
India Self/loan 10% 12%–14% 3–5 years
Bangladesh NGO N/A 17–18% 3–5 years
Cambodia Self 0% 18% 3 years
Malaysia Self/Lease 67% 4.50% 5 years
Vietnam Self 15% 18% 10 years
Sanitation and Hygiene in Africa80

collateral or be based on a salary that has attained a certain threshold. These conditions are unlikely to be met by FSMentrepreneurs. In general secured loans are not available as the banks are not interested in using second-hand motor vehiclesas collateral and operators are unable to have a proven ability to make regular payments.
Under such conditions, the private business owners are effectively left to their own means of accessing funds for starting theirbusiness and purchasing the trucks or other necessary equipment. While financing start-ups and expansion is a critical constraintfor emptying businesses, studies and discussions in literature on on-site sanitation are focused on financing approaches for latrineconstruction, demand generation or financing of conventional sewerage systems. In a comprehensive six-country review offinancing on-site sanitation for the poor, the World Bank identified an urgent need for conducting work on understanding thefinancing mechanisms of other elements of the sanitation value chain like pit emptying and waste reuse (Tremolet et al. 2010).
10.2.3 Financial performanceThe revenues of the fecal-sludge emptying businesses depend on the fees charged and the number of trips made per day.While inMalaysia the fees are regulated by the government, in the other nine countries in this study these fees are set by market forces.These fees range from an average of $26 per service in India to $97 in Kenya (Figure 10.3). In some localities market competitionhas radically affected prices. Roughly one-third of the private FSM entrepreneurs in Phnom Penh, Cambodia entered the marketjust over a year ago. Using aggressive marketing techniques such as flooding the market with leaflets, new entrants have takenover the market. This has resulted in a drop in fees paid by households from between $35–$50 in 2009 to a rate of below $35 atthe time of this study. The increase in competition that would be facilitated by reduced barriers to market entry is also a way toincrease supplier profits while simultaneously reducing costs paid by users (Solo, 1999).
The annual income per truck is higher in the African countries surveyed and reported to be as high as almost $50,000 per truckin Nigeria and Senegal (Figure 10.4).
Table 10.4 summarizes the financial performance of fecal-sludge-emptying businesses at the country level. The onlybusinesses running at a monthly loss are those in Bangladesh and Malaysia. In the case of Dhaka, Bangladesh themechanical emptying is done by two 2 m3 Vacutugs operated by local non-profit organizations. In a city of over 14 millionpeople where manual emptying is the norm these two Vacutugs only emptied around 300 pits and septic tanks in 2010.
$- $20 $40 $60 $80
$100 $120
Cam
bodi
a
Indi
a
Mal
aysi
a
Vie
tnam
Bur
kina
Fas
o
Eth
iopi
a
Ken
ya
Nig
eria
Sen
egal
Figure 10.3 Average emptying fees charged per country.
$0
$10,000
$20,000
$30,000
$40,000
$50,000
$60,000
Ban
glad
esh
Cam
bodi
a
Indi
a
Mal
aysi
a
Vie
tnam
Bur
kina
Fas
o
Eth
iopi
a
Ken
ya
Nig
eria
Sen
egal
Asia Africa
Figure 10.4 Average revenue per truck and for private operators.
Profitability of private fecal sludge emptying businesses in Africa and Asia 81
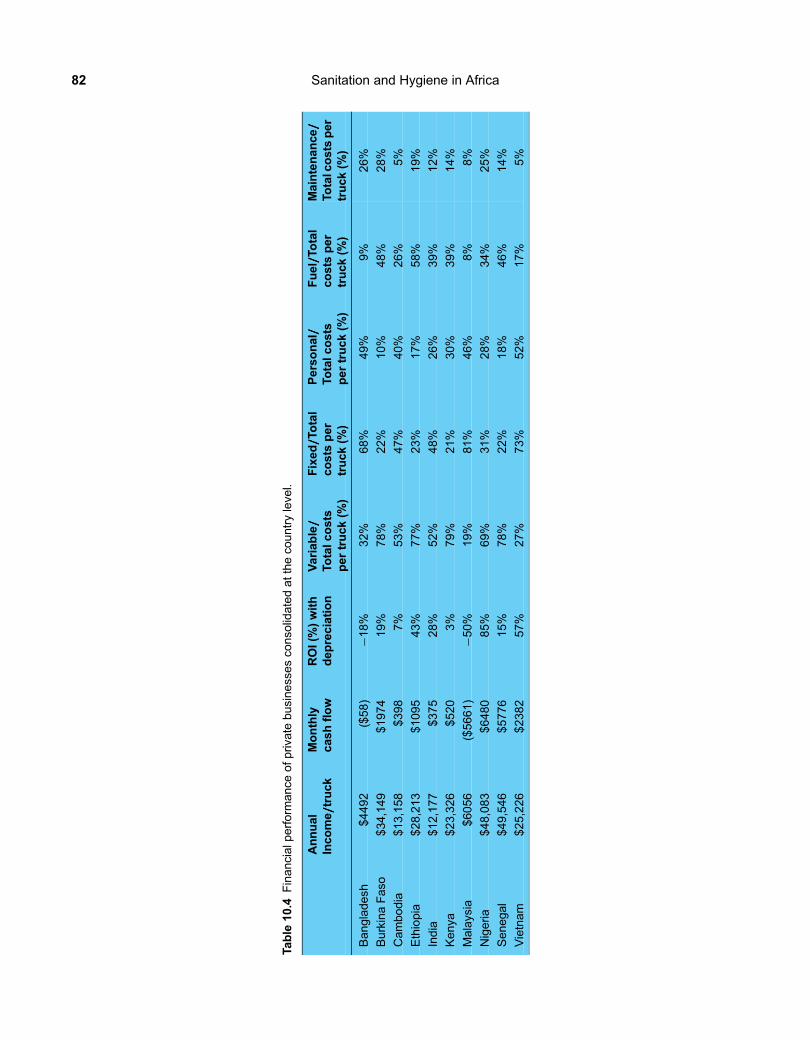
Table
10.4
Financialp
erform
ance
ofp
rivate
businessesco
nso
lidatedattheco
untryleve
l.
Annual
Inco
me/////truck
Monthly
cashflow
ROI(%)with
depreciation
Variable/////
Totalc
osts
per
truck
(%)
Fixed/////To
tal
costs
per
truck
(%)
Personal/////
Totalc
osts
pertruck(%
)
Fuel/////To
tal
costs
per
truck
(%)
Maintenance/////
Totalc
osts
per
truck
(%)
Bangladesh
$4492
($58)
−18%
32%
68%
49%
9%
26%
BurkinaFaso
$34,149
$1974
19%
78%
22%
10%
48%
28%
Cambodia
$13,158
$398
7%
53%
47%
40%
26%
5%
Ethiopia
$28,213
$1095
43%
77%
23%
17%
58%
19%
India
$12,177
$375
28%
52%
48%
26%
39%
12%
Kenya
$23,326
$520
3%
79%
21%
30%
39%
14%
Malaysia
$6056
($5661)
−50%
19%
81%
46%
8%
8%
Nigeria
$48,083
$6480
85%
69%
31%
28%
34%
25%
Senegal
$49,546
$5776
15%
78%
22%
18%
46%
14%
Vietnam
$25,226
$2382
57%
27%
73%
52%
17%
5%
Sanitation and Hygiene in Africa82

The return on investment (ROI) for these businesses is a function both of profits and the cost of the trucks used. As such, whileCambodia and India have comparable profits, the ROI in India is much higher at 28% than the 7% in Cambodia. The keydifference here is the 31% lower average cost of the trucks in India (Figure 10.2). Similarly, in spite of cash flows 15 timesgreater in Senegal than in India, the ROI of businesses in Senegal are only 15%. Again, this is the impact of the much moreexpensive trucks which are on average $44,000 in Senegal, but under $10,000 in India.
10.3 WHY IS AFRICA MORE EXPENSIVE?Besides the cost of investment for trucks, which is three times as high in Africa as in Asia, another key difference between theregions is the distribution of the operating costs themselves, which are much higher in Africa than in Asia. Variable costs includefuel, maintenance and dumping fees and these costs are consistently higher in the countries in Africa than is the case in the Asiancountries. At a unit truck level, it costs about $11,000 annually in Asia to operate a truck. On the other hand, in Africa, the unitoperational expense is three times as high at $31,000 (Figure 10.5).
Not only is the total amount different between the regions, so too is the distribution of the fixed and variable costs. Fixedcosts include personal wages, contributions to staff pension and medical coverage, office rent, office equipment depreciationcosts, overhead costs, phone, electricity, supplies, transportation, marketing, company registration, licensing fees, loanpayments and other fixed miscellaneous charges. Truck depreciation costs are added separately to highlight the impact ofthem to the overall profitability levels. Variable costs include truck maintenance, fuel costs, dumping fees, and daily wagespaid. In Africa, 76% of the operating expenses for FSM emptying businesses are variable costs, while in Asia, fixed costsmake up 62% of the operating expenses. Taking a closer look at the breakdown of these costs, the biggest expense forAfrican operations is in fuel charges and for Asian businesses it is the staff wages (Figure 10.6).
The high fuel costs in Africa could be due to the result of a combination of factors: the age of the trucks (that can be over 30years); the large capacities of these trucks that are typically 10 m3; and the distances that the trucks have to travel to collect thesludge from households and take it to the dumping grounds (in some cases a 25–30 km round trip).
These higher costs translate to higher emptying fees for households, as truck operators charge higher rates for the longerdistances they have to travel per household. In Nairobi, where the longest trip from client to dumpsite to parking bay can beas long as 50 km, charges can vary from $50 for short distances to almost $100 for longer trips.
Despite higher costs, the average profit per truck in Africa is $12,000 compared to Asia where the average profit is only $5600per truck. As seen in Table 10.5, in both regions, profit increases as the size of the business grows. The higher profits in Africa aredue to the significantly higher revenues they capture by having higher fees and making three to four trips per day.
While the profit per truck is lower in Asia, the return on investment (profit/purchase price) for the trucks is actually muchhigher in Asia than in Africa, with an average of 53% vs. 19% after a 10-year straight line depreciation is factored in(Table 10.5). This is due to the fact that even though cash flow per truck is higher in Africa, the cost of investment per truckis even higher, thereby lowering its effective return on investment.
To reduce costs for sludge disposal, some countries in both Africa and Asia are working on reducing the distance that needs tobe travelled for sludge disposal. Transfer stations have been used or tested out in Ethiopia and Malaysia. In Malaysia the publicutility is evaluating the use of the geo-tube as a novel transfer station. The geo-tube is a tube made of a porous membrane with thesludge received through a hose from the truck. Discharge from the tube can be achieved by using a pump or gravity. Leachingthrough the porous membrane gradually dewaters sludge in the geo-tube, and the leachate is treated in the nearby sewage
$3,735
$23,644
$7,268
$7,422
Asia Africa
Fixed Costsper truck
VariableCosts pertruck
Figure 10.5 Regional fixed vs. variable costs.
Profitability of private fecal sludge emptying businesses in Africa and Asia 83

treatment plant, while the solids are retained inside. Exposure to the outdoor heat further dries the remaining sludge, and the geotube is eventually lifted onto a truck and transported out to a landfill or recovery facility. In Abuja, Nigeria the manholes stationedaround the city serve as pseudo transfer stations since the emptiers can discharge into certain manholes connected to the mainsewer trunk lines. In Addis Ababa, there are four transfer stations built by the public utility to reduce, by an average of 12 km, thetravel distance to the treatment sites that are located at the outskirts of the city. However, only the utility trucks are allowed use ofthe transfer stations and capacity limitations are so severe that only 35% of the utility trucks are currently using these stations.
10.3.1 Profile of profitable FSM businessesThe typical profile of a profitable emptying business is evident in a review of the top 15 most profitable operations (ranked bymonthly cash-flows in Table 10.6).
(a) A majority (80%) of these top businesses operate two or more trucks.(b) Private companies dominate fecal sludge service provision.(c) The primary source of funding for FSM service providers is self-funding (Table 10.2).(d) Almost 40% of the operating expenses for the African businesses are fuel costs (Figure 10.6).(e) The larger the fleet size, the greater the profitability achieved per truck and the greater the business’s return on
investment (Table 10.5).
34%
53%60%
25% 27% 22%
27%
23%21%
40% 39%42%
9%
5%8%
18% 17%12%
12%
11%
9%9% 9%
8%
13%5%
1%3% 3%
2%
4% 3% 1% 5% 4%13%
0%
10%
20%
30%
40%
50%
60%
70%
80%
90%
100%
Small Medium Large Small Medium Large
Asia Africa
DumpingFees
Insurance/Taxes/Finance
Rent/Supplies/Electricity/Phone/Safetyequip.
Maintenance
Fuel
Personal
Figure 10.6 Distribution of expenses for different sized businesses.
Table 10.5 Annual profit per truck and Return on Investment.
Annual profitper truck
Return oninvestment
Asia
Small $3722 15%
Medium $5697 51%
Large $7509 92%
Africa
Small $3341 −2%
Medium $13,083 23%
Large $19,549 35%
Sanitation and Hygiene in Africa84

10.3.2 Growing profitable FSM businessesOne of the greatest challenges to efficient and profitable collection and transportation service provision is the lack of access toaffordable, fuel-efficient new trucks – especially in Africa. As the data in this study shows, second-hand trucks imported intoAfrica cost on average more than $30,000 to purchase, are fuel inefficient, costly to maintain and sometimes over 30 yearsold. For these old imported trucks, the maintenance required is not only frequent and therefore costly, but is also challengingdue to the lack of availability of spare parts.
As Table 10.6 demonstrates, supporting the growth from small to large businesses is critical for creating profitable FSMbusinesses. Yet without access to external finance, and with high capital expenses, especially in Africa, financing thisgrowth remains a challenge. Analysis of the income statements of 59 companies in Africa in Table 10.7 highlights thedifficulty in self-financed growth. Data in Table 10.7 is taken from 23 small sized, 31 medium sized and 5 large sizedprivate businesses in Africa. For comparative purposes, the cost per truck is assumed to be $42,000 for all businesses.
The analysis reveals that for a small business with annual profits of $2639, purchasing a second truck from its profits will takealmost 16 years. (The 16 years could actually be significantly longer, if inflation was factored in). The annual profit levels are toolow and the businesses too close to the brink of loss for banks to consider loaning money for expansion. On the other hand, themedium-sized companies with only two trucks have sufficient annual profits to purchase a new truck every 1.1 years. Thisanalysis is based on current sources of trucks in the various geographies. Further investigation is needed to determine theviability of local manufacturing and/or assembly within Africa and exporting across free trade zones within Africa ratherthan importing from Europe.
At present, the only options then for single truck owners looking to expand are to borrow funds from family and friends or toborrow from private lenders at high interest rates. Survey results from ten African countries of hundreds of independent waterand sanitation service providers of all sizes, showed 100% of them had self-financed their start-ups with family funds and thenfunded their expansion costs with profits. (Collignon & Vezin, 2000).
The financial products introduced to address this sector should in the first instance be designed to support the shift from onetruck to two. A multi-truck business is the optimum model, but growing from two trucks to more than five will likely requiregradual growth over time, as there are considerations beyond finance that need to be taken into account. Each additionaltruck will require time and marketing to build demand and there will likely be a time lag before each new truck can beutilized fully even with the addition of further staff. These factors will need to be evaluated to determine the optimal pace ofgrowth but the move beyond one truck is a crucial first step.
Innovative financing solutions are needed and ideas such as output-based-aid financing mechanisms should be looked intofor service providers (Tremolet, 2011). Clear and well-defined output metrics – such as the number of households served
Table 10.6 Top 15 profitable businesses based on cash flow per truck.
LocationCountry City Status No. of
trucksAnnualrevenue
Totalexpenses
Annual profitafterdepreciation
Monthlycash-flowper truck
Nigeria Abuja Private 4 $1,022,581 $303,075 $708,181 $14,990
Malaysia Kuala Lumpur Public 14 $2,249,079 $408,761 $1,759,391 $10,954
Nigeria Abuja Private 4 $499,211 $146,956 $333,382 $7339
Malaysia Melaka Public 8 $1,155,483 $586,673 $494,411 $5925
Kenya Mombasa Private 4 $267,844 $39,015 $209,264 $4767
Nigeria Ibadan Private 3 $226,485 $72,879 $149,712 $4267
Vietnam Ho Chi Minh Private 3 $201,320 $73,388 $123,534 $3554
Malaysia Kuala Treng. Public 19 $1,275,352 $569,834 $594,273 $3094
Vietnam Ho Chi Minh Public 7 $459,211 $199,420 $246,131 $3093
Senegal Dakar Private 6 $489,294 $310,392 $152,656 $2485
Nigeria Ibadan Private 2 $137,295 $78,328 $52,676 $2457
Nigeria Abuja Private 1 $61,151 $32,568 $25,091 $2382
Senegal Dakar Private 7 $612,901 $413,693 $168,551 $2372
Cambodia Phnom Penh Private 1 $42,000 $20,004 $20,496 $1833
Cambodia Phnom Penh Private 1 $43,200 $22,235 $18,965 $1747
Profitability of private fecal sludge emptying businesses in Africa and Asia 85

and evidence of safe disposal – will need to be established for purposes of funding and monitoring. A further idea is fordonors and governments to set up loan guarantees for financing the capital expenditure needed for collection and haulage(Kone et al. 2007).
Another possibility to explore is asset ownership of new trucks by the public sector with operation by private entrepreneurs.This can take shape under different financial arrangements such as straight leasing, or shared profits. State governments couldpurchase new sewage trucks and transfer lease management operations to financially capable and competent managementcompanies with proven track records in leasing operations and fleet management services. Alternatively, state governmentscould partner with leasing companies to handle both the purchase and management of the fleet of sewage vehicles. Anotheroption would be to consolidate the small truck owners into a cooperative entity; effectively creating a large sized businesscomprised of individual owners and shared profits.
10.4 CONCLUSIONSHowever, at least 50% of the entrepreneurs surveyed can afford only one truck. The most significant barrier to expansion, andindeed to market entry, is the high cost of purchasing the truck needed to carry out the emptying services. These costs wereparticularly high in Africa where trucks are imported second hand from Europe. The lack of access to finance to purchasethese trucks compounds this challenge. Most entrepreneurs rely on personal savings or loans from informal sources.
Beyond initial truck purchase, there are also regional differences in business operations that need to be taken into account bythose looking to invest in or fund this sector. While FSM businesses in Africa earn more revenue per truck than their counterpartsin Asia, their return on investment is lower due to the heavy capital expenditure of the imported trucks. In addition, these largecapacity trucks are often over 30 years old at the time of purchase and are extremely fuel inefficient. These costs present not onlyhigh barriers to initial entry but also drive up the operating expenses. Long distances to dump sites further exacerbate the problemof high fuel costs (especially in Africa) and erode profitability and encourage illegal dumping in the environment. In this regardexperiments with transfer stations offer some promise.
The data in the study suggests that the key to increasing the financial viability of existing FSM businesses lies in finding waysto support the expansion of truck fleets, in particular the expansion beyond a single truck. Further in-depth research is needed inthe particular African countries to determine options for local manufacturing or assembly of trucks to reduced dependence onexpensive imports. Overall, innovative financing schemes are needed to reduce the barrier of upfront capital expenditure.
Table 10.7 Income statement of typical small, medium and large private business in Africa.
USD (1 truck) (2 trucks) (7 trucks)
Small Medium Large
Revenue $31,853 $104,311 $489,294
Expenses
Fixed Costs $4553 $9033 $96,443
Variable Costs $16,261 $38,489 $291,015
Depreciation (10yr) $8400 $16,800 $58,800
Total Expenses $29,214 $64,322 $446,258
Profit/////(loss) $2639 $39,990 $43,036
Key Performance Indicators
Average Revenue per truck $31,853 $52,156 $69,899
Variable Expenses per truck $16,261 $19,245 $41,574
Profit $2639 $39,990 $43,036
Annual free cash flow (FCF) $11,039 $56,790 $101,836
Years to new truck* 15.9 1.1 1
*Number of years it will take to save enough to purchase one new truck.
Sanitation and Hygiene in Africa86
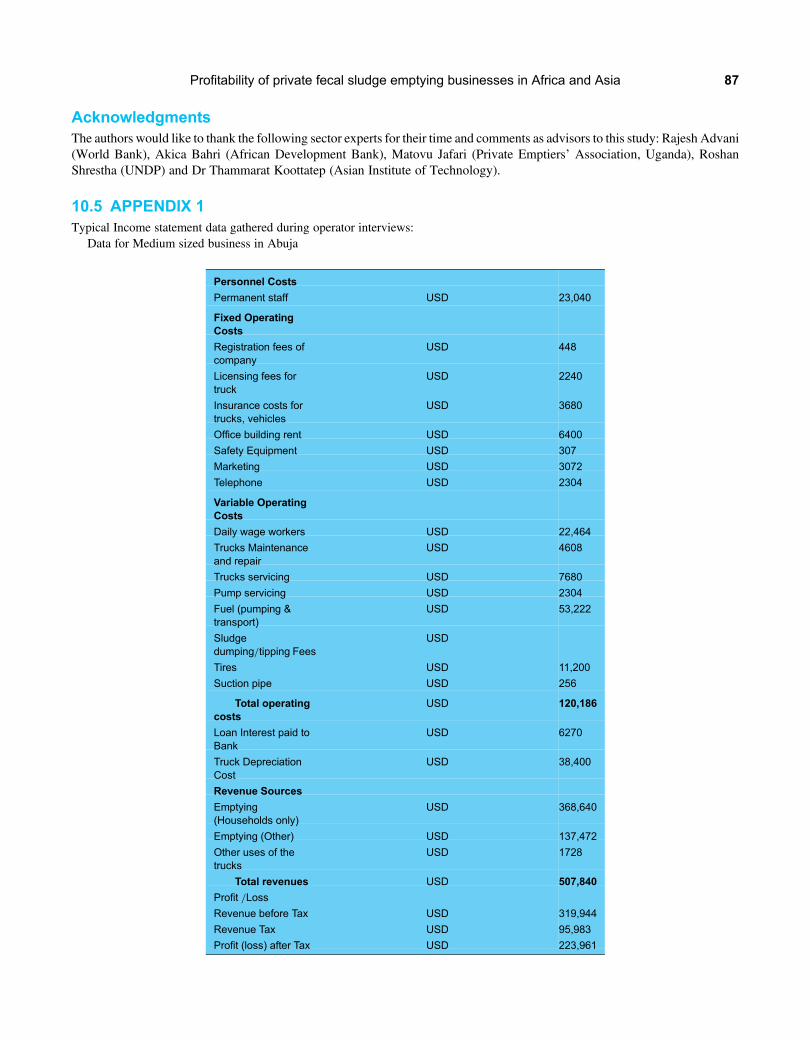
AcknowledgmentsThe authors would like to thank the following sector experts for their time and comments as advisors to this study: Rajesh Advani(World Bank), Akica Bahri (African Development Bank), Matovu Jafari (Private Emptiers’ Association, Uganda), RoshanShrestha (UNDP) and Dr Thammarat Koottatep (Asian Institute of Technology).
10.5 APPENDIX 1Typical Income statement data gathered during operator interviews:
Data for Medium sized business in Abuja
Personnel Costs
Permanent staff USD 23,040
Fixed OperatingCosts
Registration fees ofcompany
USD 448
Licensing fees fortruck
USD 2240
Insurance costs fortrucks, vehicles
USD 3680
Office building rent USD 6400
Safety Equipment USD 307
Marketing USD 3072
Telephone USD 2304
Variable OperatingCosts
Daily wage workers USD 22,464
Trucks Maintenanceand repair
USD 4608
Trucks servicing USD 7680
Pump servicing USD 2304
Fuel (pumping &transport)
USD 53,222
Sludgedumping/tipping Fees
USD
Tires USD 11,200
Suction pipe USD 256
Total operatingcosts
USD 120,186
Loan Interest paid toBank
USD 6270
Truck DepreciationCost
USD 38,400
Revenue Sources
Emptying(Households only)
USD 368,640
Emptying (Other) USD 137,472
Other uses of thetrucks
USD 1728
Total revenues USD 507,840
Profit /Loss
Revenue before Tax USD 319,944
Revenue Tax USD 95,983
Profit (loss) after Tax USD 223,961
Profitability of private fecal sludge emptying businesses in Africa and Asia 87

10.6 REFERENCESAECOM International Development, Inc. and the Department of Water and Sanitation in Developing Countries (Sandec) at the Swiss Federal
Institute of Aquatic Science and Technology (EAWAG) (2010). A Rapid Assessment of Septage Management in Asia.Collignon B. and Vezina M. (2000). Independent Water and Sanitation Providers in African Cities: Full Report of a Ten-country Study. Water
and Sanitation Program, World Bank, Washington DC, USA.Hutton G. (2012). Global Costs and Benefits of Drinking-Water Supply and Sanitation Interventions to Reach the MDG Target and Universal
Coverage. WHO, Geneva Switzerland.Hutton G. and Haller L. (2004). Evaluation of the Costs and Benefits of Water and Sanitation Improvements at the Global Level. Water,
Sanitation and Health. WHO, Geneva Switzerland.Jeuland M., Strauss M. and Kone D. (2004). Private Sector Management of Fecal Sludge: A Model for the Future? Focus of an Innovative
Planning Experience in Bamako, Mali. Swiss Federal Institute of Aquatic Science and Technology (EAWAG), Duebendorf, Switzerland.Kone D., Strauss M. and Saywell D. (2007). Towards an improved faecal sludge management (FSM). Proceedings of the 1st International
Symposium and Workshop of Faecal Sludge Management (FSM) policy, Dakar, Senegal.Mbeguere M., Gning J. B., Dadone P. H. and Kone D. (2010). Socio-economic profile and profitability of faecal sludge emptying companies.
Resources, Conservation and Recycling, 54, 1288–1295.Solo T. M. (1999). Small-scale entrepreneurs in the urban water and sanitation market. Environment and Urbanization, 11, 117–132.StraussM., Heinss U. andMontangero A. (2000). On-site Sanitation:When the Pits are Full–Planning for Resource Protection in Faecal Sludge
Management. IWA Publishing House and WHO Water Series. ISBN No. 3-932816-34-XTremolet S. (2011). Identifying the Potential for Results-Based Financing for Sanitation. Water and Sanitation Program, World Bank,
Washington DC, USA.Tremolet S., Kolsky P. and Perez E. (2010). Financing on-site Sanitation for the Poor. A Six Country Comparative Review and Analysis. Water
and Sanitation Program, World Bank, Washington DC, USA.WHO/UNICEF (2000). Joint Monitoring Programme for Water Supply and Sanitation. Global Water Supply and Sanitation Assessment 2000
Report.
Sanitation and Hygiene in Africa88

Chapter 11
Advancing health, learning and participationthrough WASH in schools in Africa
Therese Dooley and Murat SahinUNICEF
“A school is not a school without toilets, water and soap”
In 2011, estimates show that only 52% of the schools in Africa had access to water and 48% of schools had access tosanitation based on the UNICEF country office annual reports from 51 countries in Africa. Fulfilling every child’s rightto water, sanitation and hygiene education remains a major challenge for policymakers, school administrators andcommunities in many countries. The evidence on the impact of WASH in Schools (WinS) programming coming out ofAfrica demonstrates the real need for improving access to water and sanitation in schools and encouraging habitual(life-long) hygiene behaviours among school children. To focus and improve the situation of access to WinS in Africathis chapter outlines three key actions which were suggested during Africasan.
11.1 INTRODUCTION TO WinSWater, sanitation and hygiene education in schools –WASH in Schools (WinS) – seeks to provide safe drinking water, improvedsanitation facilities and promote lifelong health. WinS enhances the well-being of children and their families, and paves the wayfor new generations of healthy children and helps fulfil every child’s right to water, sanitation, health and education. Among itsmany benefits, WinS:
• Provides healthy, safe and secure school environments that can protect children from disease, abuse and exclusion. It helpsensure quality education, because children who are healthy and well-nourished can fully participate in school and gainmaximum benefits from their education. Quality education, in turn, leads to better health and nutrition outcomes.
• Encourages children’s pride in their schools and communities by providing dignity and privacy. This is especially true forgirls, who are more likely to attend school when adequate WASH facilities are present (Pearson & McPhedran, 2008).
• Is an investment in schoolchildren and the health of future generations. It enables children to become agents of change forimproving water, sanitation and hygiene behaviours in their families and communities. It helps children realize their fullpotential now and prepares them for healthy living as adults, able to share this legacy when they become parents.
11.2 ACCESS TO WASH IN SCHOOLSAlthough there has been an increase in access to WinS over the past years much remains to be done. As shown in Figure 11.1,almost half of the schools in developing countries do not have access to water and sanitation facilities Children commonly missschool due to inadequate facilities, and older girls who have reached the age of puberty are often particularly reluctant to stay inschool when toilet and washing facilities lack privacy, are unsafe, or are nonexistent. Even when children are in school, they areoften not meeting their learning potential due to WASH-related disease burdens.
Unlike Household Water and Sanitation there is currently no formal mechanism which monitors access to WinS at the globallevel. The only available data at the global level with regards to access to WinS comes from UNICEF country office annualreporting mechanism. The national monitoring systems (EMIS, HMIS, WIMS) often do not reflect WinS as an indicator,

therefore the quality of data on coverage and access remains questionable. It is not unusual to find that a national monitoringsystem considers a school to be providing adequate access to sanitation, even though 300 children are using one latrine hole.However the quality data of WinS coverage is a significant barrier to identifying children’s needs, establishing and carryingout effective programmes, and monitoring progress.
11.2.1 WASH in schools in AfricaThe situation of access to WinS in Africa is not much different than the global average of developing countries. In 2011, anestimated 52% of the schools had access to water and 48% of schools had access to sanitation based on the UNICEF countryoffice annual reports from 51 countries in Africa. There are also wide disparities between countries on access to WinS.When we take closer look at the 20 countries with least access to WinS in Africa, the situation is alarming: Only 29% ofchildren have access to adequate water supply and 27% have access to adequate sanitation facilities in schools. As in thecase of the data with regards to access to WinS at the global level, the quality and functionality of access to WASH facilitiesin Schools in Africa have always been in question (Figure 11.2).
Water coverage in schools may be lower than in schools. One would expect the schools to have similar rate of access toimproved water sources. According to the JMP 2012, 61% of the population in Sub Saharan Africa has access to an
63% 65%70% 71%
45% 47%52% 51%
0%
20%
40%
60%
80%
100%
2008 2009 2010 2011
School Water Coverage,Global, Average
All reporting UNICEFprogramme countries
Least Developed & OtherLow Income Countries (LDCs& OLICs)
59%64%
67% 68%
35%41% 44% 45%
0%
20%
40%
60%
80%
100%
2008 2009 2010 2011
School Sanitation Coverage, Global, Average(girls and boys)
All reporting UNICEFprogramme countries
Least Developed &Other Low IncomeCountries
Figure 11.1 Water and Sanitation Facilities in Primary Schools, 2008–2011 Estimates (UNICEF Water, 2011).
5248
29 27
0
10
20
30
40
50
60
% Schools with adequate water coverage
% Schools with adequatesanitation coverage
There are wide disparities between countries onaccess to WASH facilities in Schools in Africa
Average Access in Africa
20 countries with least access inAfrica
Figure 11.2 Data on water and sanitation in schools presented here is from a variety of government institutional reporting systems(compiled by UNICEF country offices in 2011), and generally not from surveys. School coverage data is based on nationalstandards, which vary from country to country (e.g. on pupil to toilet ratios).
Sanitation and Hygiene in Africa90

improved drinking water source at the household level whereas only 52% per cent of the primary schools have access to adequatewater supply (Figure 11.3).
However, access to WASH Facilities alone is not enough. It is critical for children to adopt key hygiene behaviours throughrelevant hygiene promotion activities with adequate supplies of soap and consumables available to enable the behaviours and toallow for operation and maintenance of WASH facilities.
A study in Kenya revealed that less than 2 per cent of children in schools washed their hands with soap, which was available inless than 5 per cent of facilities (Njuguna, 2008).
11.2.2 WASH in schools is effective in AfricaAlmost all countries in Africa implement WinS programs at different levels. It is important to note the success stories that havebeen captured over the years.
• WinS improves children’s health in Africa: WinS programs are a first step towards ensuring a healthy learningenvironment. Schools with quality WASH programs can lessen the spread of water and sanitation related diseasessuch as diarrhoea and worm infestations. Improving WASH conditions in schools helps prevent infection withsoil-transmitted worms, of which 100% of annual cases worldwide are attributable to inadequate sanitation andinsufficient hygiene (Prüss-Üstün, 2008). In 2008, 66.1 million between age of 5 to 10 are estimated to be infestedwith worms in Africa (Hall et al. 2008). Deworming services, supported by hygiene education, help children avoidreinfection, and proper water and sanitation facilities prevent children from re-exposure. The impact of wormreduction programmes in schools has been remarkable. In Kenya, a deworming programme among primaryschool-aged children reduced absenteeism by at least 25%, with the largest gains for the youngest children whosuffered the most ill health (Miguel & Kremer). A comprehensive program to improve WinS conditions in Kenyaresulted in a nearly 50% reduction in diarrheal illness (Freeman, 2011).
• WinS boosts attendance and achievement in African schools: Health and education work in synergy. Schools withimproved water and sanitation facilities attract and retain more students and teachers. Nutrition deficiencies,diarrhoea and worm infections are all related to inadequate water, sanitation and hygiene – and all affect schoolparticipation and learning. In Egypt, an intensive campaign to promote hand hygiene in 30 primary schools reducedabsenteeism caused by laboratory-confirmed influenza by 50%, influenza-like illness by 40%, diarrhoea by 30% andconjunctivitis by 67% (Talaat, 2011). The programme included guidebooks, activities, posters, songs, games, dramaand contests – all with the objective of having children wash their hands with soap at least twice a day while theyare at school.
• WinS promotes gender equality throughout Africa: As in other parts of society, gender discrimination is prevalent withinschools. In many cases, this discrimination is related to cultural beliefs and traditions; sometimes, it is caused byunrecognized problems and needs. Girls are particularly vulnerable to dropping out of school, partly because many arereluctant to continue their schooling when toilet and washing facilities are not private, not safe or simply not available.When schools have adequate facilities – particularly toilets and washstands that facilitate menstrual hygiene – a majorobstacle to attendance is removed.
45
50
55
60
65
Population with access to improved water supply in
Sub-Saharan Africa (JMP2012)
Schools with adequate watersupply in Africa (UNICEF
2011 Annual reports)
Access to water supply in schoolsmay be lower than at home in Africa
Access %
Figure 11.3 Access to improved water source in Sub-Saharan Africa as per JMP2012 vs adequate facilities in public schools asper non-weighted average from 51 countries in Africa. These datasets are not directly comparable: one is from institutional sourcesand another from household surveys.
Advancing health, learning and participation through WASH in schools in Africa 91

AWinS evaluation in Kenya indicates that girls were absent less in schools where there was more hand washing and very hightoilet use (Njuguna, 2008). The amount of time girls spend fetching water has a significant effect on their school attendance. InGhana, a study of Demographic and Health Surveys from 1993–2008 shows that a 15-minute reduction in collection timeincreases the proportion of girls attending school by 8%–12% (Nauges & Strand, 2011). Girls who can take advantage ofeducational opportunities for education are better able to protect themselves more likely to develop skills to contribute tosociety. The more access they have to education the less likely they are to marry before the age of 18 (IRCW, 2006). If theybecome mothers, they are more likely to raise healthy, well-nourished and educated children.
11.2.3 WinS reaches communities across AfricaWinS is a strategic intervention to reach entire communities. Direct engagement with students can lead to community adoption ofgood WASH behaviours (Onyango-Ouma, Aagaard-Hansen & Jensen 2005; O’Rielly et al. 2008) as well as improved health(Bowen, 2007). Children are often agents of change and education for good hygiene practices in schools can link students,families and communities. Children’s involvement with WASH in their communities can be promoted with minimuminvestment through activities such as environmental health clubs, drama groups and student focus groups. One example ofthis is the experience of Malawi’s Safe Water Clubs. In 2007, Safe Water Clubs were launched in 11 schools in NenoDistrict, Malawi, reaching about 5,500 students. The Safe Water Clubs promote the importance of clean water, good hygieneand improved sanitation. Club members create their own songs, dramas and games to communicate safe water and hygienemessages within their schools and communities. Since the programme began, there has been a 90 per cent reduction inabsenteeism due to diarrhoeal disease in the participating schools, even during the peak of the rainy season. As a result ofthe students bringing the safe water message to their homes and families, the community clinic reported a 35 per centdecrease in diarrhoeal disease cases in 2007 (Population Services International, 2009).
11.3 KEYACTIONS TO IMPROVE WinSMany Governments in Africa are exploring solutions to meet the Millennium Development Goals (MDGs) and are aware of thechallenges they are facing and the fact that they are off-track in meeting the MDGs. The third Africasan Conference was held inRwanda in 2011 attracting Governments, experts on sanitation and hygiene sector from across Africa. A specific WinS Sessionshared a common vision: All children should go to a school where there is water, sanitation, and hygiene education. Partnerscame together and reviewed the challenges and progress made in the region and outlined three key action points in order tofocus and scale up WinS programming in Africa. They are as follows:
• Set minimum standards for WinS. Adopt national, regional and local standards for WinS 13 (United Nations Children’sFund and World Health Organization, 2009). The minimum standards for WinS should be specific to each context andallow for gradual improvements to facilities and hygiene practices. Where national standards already exist, work withpartners to adjust them in light of new evidence and best practices. In 2011, In Malawi, a school sanitation reviewidentified problems with existing standards for handwashing water tanks, prompting a revision that will beincorporated into national standards. Other examples include Ghana, where government partners are incorporating newmenstrual hygiene-focused designs for toilet blocks for girls in basic schools into national standards, and Gambia,where a similar approach has already led to a revision in the national standards.
• Monitor WinS coverage through education management information systems (EMIS).Advocate for the inclusion ofWinSindicators in EMIS. Analyse data annually and use the findings for advocacy and improved resource allocation. Supportthe compilation of data on coverage and practices at the national and regional level and attract attention to theWinS sector.In 2011, several African countries including Malawi and Mali, conducted comprehensive WinS surveys for the first time.In some cases, the surveys led directly to results, such as in Tanzania, where information from a wide-ranging nationalsurvey helped to leverage an additional $15 million from donors for WinS. Incorporating WASH indicatorspermanently into national EMIS is a more complex and long-term proposition, but the advantages are clear: they showthat the education sector is internalising the need for WinS.
• Engage with at scale WinS programmes. Contribute to the bigger picture, bringing individual or small-scale projects intocooperative initiatives that reach more schools, more effectively. Gradual improvements to facilities and hygiene practicesrequire less investment in operation and maintenance and can be sustained with local resources. They are key toestablishing sustainable, at scale programmes for WinS with a clear vision and road map to reach to all schoolsand children.
Sanitation and Hygiene in Africa92

11.4 REFERENCESBowen A. (2007). A cluster-randomized controlled trial evaluating the effect of a handwashing-promotion program in Chinese Primary
Schools. American Journal of Tropical Medicine and Hygiene, 76(6), 1166–1173.Freeman M. C., Greene L. E., Dreibelbis R., Saboori S., Muga R., Brumback B. and Rheingans R. (2011). Assessing The Impact of A School-
based Water Treatment, Hygiene, and Sanitation Program on Pupil Diarrhea: A Cluster-randomized Trial. Faculty of Infectious Disease,London School of Hygiene and Tropical Medicine.
Hall A., Hewitt G., Tuffrey V. and de Siva N. (2008). A review and meta-analysis of the impact of intestinal worms on child growth andnutrition. Maternal Child Nutrition, April 4(Suppl. 1), 118–236.
IRCW (2006). Child Marriage and Education. Too Young to Wed: Education & Action Toward Ending Child Marriage. International Centerfor Research on Women. Available at http://www.icrw.org/files/images/Child-Marriage-Fact-Sheet-Education.pdf (accessed 10September 2013)
Miguel E. and KremerM. (2004).Worms: identifying impacts on education and health in the presence of treatment externalities.Econometrica,72(1), 159–217.
Nauges C. and Strand J. (2011). Water Hauling and Girls’ School Attendance: Some New Evidence from Ghana. World Bank, WashingtonDC, USA, 26 May 2011, 25.
Njuguna V., Karanja B., Thuranira M., Shordt K., Snel M., Cairncross S., Biran A. and Schmidt W. (2008). The Sustainability and Impact ofSchool Sanitation, Water and Hygiene Education in Kenya. United Nations Children’s Fund and IRC International Water and SanitationCentre, New York and Delft, Netherlands, pp. 2–3.
Onyango-Ouma W., Aagaard-Hansen J. and Jensen B. B. (2005). The potential of schoolchildren as health change agents in rural WesternKenya. Social Science & Medicine, 61(8), 1711–1722.
O’Rielly C. E., Freeman M. C., Ravani M., Migele J., Mwaki A., Ayalo M., Ombeki S., Hoekstra R. M. and Quick R. (2008). The impact of aschool-based safe water and hygiene program on knowledge and practices of students and their parents — Nyanza Province, westernKenya, 2006. Epidemiology Infect., 136(1), 80–91.
Pearson J. and McPhedran K. (2008). A literature review of the non-health impacts of sanitation. Waterlines, 27(1), 48–61.Population Services International (2009). Learning about Safe Water in Neno District, Malawi. PSI, Washington, DC, p. 1.Prüss-Üstün A., Bos R., Gore F. and Bartram J. (2008). SaferWater, Better Health: Costs, Benefits and Sustainability of Interventions to Protect
and Promote Health. World Health Organization, Geneva, p. 10.Talaat M., Afifi S., Dueger E., El-Ashry N., Marfin A., Kandeel A., Mohareb E. and El Sayed N. (2011). Effects of hand hygiene campaigns on
incidence of laboratory-confirmed influenza and absenteeism in schoolchildren, Cairo, Egypt. Emerging Infectious Diseases, 17(4),649–625.
UNICEF Water (2011). Sanitation and Hygiene Annual Report 2011, Programme Division, UNICEF, New York, p. 21.United Nations Children’s Fund and World Health Organization (2009). Water Sanitation and Hygiene Standards for Schools in Low-cost
Settings. UNICEF and WHO, Geneva.
Advancing health, learning and participation through WASH in schools in Africa 93


Chapter 12
Unleash the sanitation marketplace
Muthi Nhlema, John Sauer, Steve Sugden and Frank MillsoppWater for People
“Taking the cheapest option of a simple pit latrine and taking into consideration the growth in population, the cost for providing improvedsanitation to the world’s population will be over $300 billion US by 2015”
(Sah & Negussie 2008)
This chapter reflects on the private sector in sanitation development, in particular Water for People’s experience, anddiscusses factors which promote and limit private sector engagement. The chapter examines case studies and highlightlessons from seeking to stimulate a sanitation market place.
12.1 THE CHANGING LANDSCAPEFour decades of sanitation projects and programs in Africa funded by aid agencies and governments have had limitedimpact on the need or the sustainability of sanitation services. Factoring in population growth and migration, essentialto sustainability, access to improved sanitation has only increased 4% between 1990 and 2010 in Sub-Saharan Africa(JMP, 2011).
However we look at the sanitation status quo, there are only scattered examples of success with supply-driven approaches, andlittle evidence to suggest that they are scalable (Jenkins & Sugden 2006). New thinking, new approaches, and taking risks will benecessary to effectively address the global sanitation challenge within an acceptable timeframe.
Part of the need to innovate is driven by the reality of the cost to ‘build’ latrines for the 1.2 billion people who need them. Onestudy estimated that the cost could be upwards of $300 billion by 2015 for constructing simple pit latrines. Clearly that level offunding will not be available in the sanitation sector1 (Sah & Negussie 2008). Other factors forcing adaptation in the sanitationsector include climate change, population growth, and migration to urban areas (Lüthi et al. 2009).
Another reason for the shift to a demand driven approach is an increased understanding that the supply driven,engineer-based, and donor-focused approach does not provide incentives for enabling sanitation solutions to go to scale.This is in large part due to the fact that it creates the perception at community level and local government levels that theprovision of household latrines is a government’s or donor’s responsibility and heavy subsidizes are the norm. This creates asituation where households are not involved with the design, technology choice, or financing of the sanitation solution andtherefore have little ownership (Evans et al. 2009).
The supply driven approach is also heavily dependent on subsidies, which distort the value of the sanitation solution (and themarket) and saps the interest of the end-user to pay for and value the solution. The latest thinking about subsidies is that (if theyare used) they should be used to leverage other sources of funds for sanitation solutions that the consumer is demanding (Evanset al. 2009).
Fortunately supply driven approaches appear to be on the way out in the sanitation sector and demand driven focus onprogramming is on the rise and taking on many interesting facets. There is a noticeable shift in NGOs and governments to amore facilitatory role and greater reliance on private sector for service delivery and management. It is becoming accepted
1Sanitation Sector defined as all players – government, UN, development banks, NGO, private sector, faith-based groups, etc.

that the private sector has a key role to play: from latrine and bathroom construction, to emptying of latrine pits and septic tanks,to management of public toilets.
12.2 EMERGENCE OF MARKET-BASED APPROACHESHeavily donor-subsidized products or services crowd out the emergence of the private sector and the creation of a sanitationmarket – who would decide to open a business trying to provide something for a price while someone else is providingsomething similar for free? It doesn’t make business sense; any aspiring sanitation entrepreneur would look elsewhere,effectively strangling at the outset any self-sustaining benefit the private sector could have provided. It was this realization,of the detrimental and distortive effects that improperly targeted subsidies can have, that led the sanitation sector to shifttheir focus from that of a direct implementer of sanitation products or services to a market facilitator. While theoretically thisshift seems to be an easy one, putting it into practice has proven to be much more complicated.
Generally, a ‘market-based’ approach to sanitation (or within other development sectors) rests on the following assumptions:
• That markets are the most efficient mechanism for providing satisfactory goods and services at affordable prices.• That consumer households buy products and services that they are satisfied and comfortable with, and give them good
value for their money.• That the private sector makes money by providing products and services satisfactory to their consumers/clients and
modified in response to consumer demands and stated preferences.• That within this system, the incentives are in place such that coverage will continue to expand and be sustained because the
private sector, with the natural incentives that come along with buying and selling in a market, will continue to target newcustomers and do everything they can to keep existing ones.
Some key attributes of a market-based approach to sanitation include:
• Minimal or no ‘subsidies’ directed at households, given their potential to distort markets and crowd out the private sector.• Direct support of entrepreneurs and enterprises involved in different sanitation businesses – like managing public toilets,
construction, pit-emptying, and so on – through training in marketing, business planning, finance, bookkeeping, and otherskills that increase the human capital of a business.
• Coordination with the local financial sector to identify credit, loan and other financial alternatives for businesses andconsumers within the sanitation sector.
• Advocacy at the local level to reduce barriers to growth and success that the sanitation private sector might face.• A systems-approach instead of a beneficiary-model; the focus has moved from sanitation coverage statistics at a given
point in time to an end objective of a self-sustaining market system that is not reliant on outside support in the long-term.
In short, a market-based approach seeks to foster a system as the primary end goal, not a set number of beneficiaries at a givenpoint in time. This system supports a process whereby not only does sanitation coverage grow, but continues to do so and besustained in the long term because the local private sector is driving the process forward as they do in all other vibrantmarkets worldwide.
12.2.1 Case study – sanitation marketing failure in Chikhwawa: Were market-basedapproaches followed?Chikhwawa district has one of the harshest environments in Malawi. Temperatures reach as high as 42°C (≈108°F), hamperingthe hopes for good harvests. Flash floods are not an uncommon sight during rainy season, rendering hundreds homeless.
Only five percent of Chikhwawa residents have improved sanitation – one of the lowest in Malawi. The majority ofChikhwawa households prefer unimproved temporary traditional pit latrines (55%) or open defecation (34%). Indeed, somemajority tribes in Chikhwawa traditionally view open defecation as acceptable.
It is in this environment that Water For People Malawi tested the idea of Sanitation Marketing.Water For People’s approach to rural sanitation marketing, which in Chikhwawa was referred to as theMasonModel, focused
on trying to get households to purchase a latrine slab or an improved latrine from a local mason. The idea was that the masonswould find this a good side business (in addition to other construction work) and fulfill the market demand for sanitation in theprocess. Masons were given the following ‘capacity building’ as a part of the program:
• Improved Sanitation Technology, including ECOSAN latrines (Figure 12.1): the masons were sensitized on the differenttypes of latrines and their respective benefits. The training included actual construction of an improved latrine.
Sanitation and Hygiene in Africa96

• Basic Business Skills: general business practices were shared to enable the masons to understand the concept of business,the profit motive, record keeping and other essentials of business development which were central to the thinking aroundSanitation Marketing.
• Hardware Seed Support: the masons were supported with seed capital in the form of bags of cement and reinforcement forslab construction. This smart subsidywas to provide the masons with a one-off non-cash start-up for their businesses withthe idea that they would re-invest subsequent revenue into more cement, without reverting toWater For PeopleMalawi foradditional subsidy.
For their part, households were given options for paying for their sanitation solutions, including:
• Cash Installment Payment: the stipulated cost of a slab was set at MWK 1500.00 ($9.00). Households could purchasethe slabs by either paying the full amount at once or negotiate on a payment plan with the masons that wasmutually agreeable.
• Humanure Payment2 – Masons could install slabs and construct an improved latrine for the household at no actual cashvalue. However, the household pays for the products/services by allowing the mason to harvest the composted humanmanure (or humanure in short) from the latrine for an agreed period of time. The masons could choose to either sellthe humanure or use it for agricultural purposes to generate income.
Through the program 70 masons were trained between 2008 and 2011 and they provided households in their immediate vicinitywith latrine construction services on a fee paying basis. In early 2012, Water For People Malawi conducted a Rapid MarketAppraisal3 (RMA) that sampled seven trained masons and interviewed 16 households to evaluate the effectiveness of theprogram. It was deemed to be a failure for several key reasons:
High Dissatisfaction with Traditional Latrines: There was an almost unanimous negative sentiment from the households towardsthe traditional pit latrine. Most households cited the traditional latrine as being unsafe (due to the weak infrastructure) andunfashionable (as it was not ‘modern’ like other improved model latrines). This gives an indication that there was notsufficient work done upfront in the planning to find out what the consumer wanted and what the real demand forsanitation was in the program area.
Wrong Price Point: Households expressed concern with the cost of the slab (MK 1500.00≈USD 9.00) as being prohibitivelyexpensive and suggested a range from MWK 500.00 to MWK 800.00 (≈USD 3.00 to USD 4.90) as more reasonable.
Resistance to Pay: There was a general resistance to investing resources into purchasing a slab or paying one of their own to buildan improved latrine for them. Most of this resistance emanates from a strong awareness of past NGO projects that providedslabs/sanplats for free or as low as MWK 20.00 (≈USD 0.12).
Ironically, Water For People’s intervention with the seed capital seemed to cause some of the community resistance. Mr EphraimJimu, a mason from Ng’ombe village, mentioned that, ‘People know that we had received free cements for the slab construction,
Figure 12.1 An Fossa Alterna latrine – an example of an ECOSAN latrine in Malawi.
2This payment option was developed after realisation that instalment payback period was too long making the instalment option unviable.3This involves semi-structured interviews with 7 masons and 20 Households within the catchment areas of the masons.
Unleash the sanitation marketplace 97

[which] made it difficult to sell as it was perceived to be free slabs’. There was a case in one village where the local leadershipdemanded a portion of the seed cement as ‘tax’ for the masons to provide services in the community.
12.3 LESSONS LEARNED FROM THE RMA12.3.1 Masons are not entrepreneursWater for People Malawi trained 70 masons in all, of which only 31 are still actively providing sanitation services to households,and not profitably. The same trend was apparent with the seven masons that were visited during the RMA, only one of whom hadmanaged to market, sell and re-invest income realized from sales back into his sanitation business.
A closer look at this mason reveals that his success had everything to do with him, rather than the product, price, placeor promotion.
Besides the sanitation business, he provided different services of varying kinds to the community around him. He was acobbler, a builder/mason, a carpenter and an umbrella fixer as well. He had a practical understanding of the principles ofownership and sustainability that drive Sanitation Marketing, as compared with other masons who believed that SanitationMarketing was either not practical for the rural setting or should be a social/charitable venture rather than a commercial one.Simply put, he not only gets it – he was living it as an actual entrepreneur.
All the other masons were subsistence farmers and were not entrepreneurial at heart. For Sanitation Marketing to work, thereis need to find and empower more like him vs. trying to create them.
If the idea is to saturate the market with sanitation solutions than a more comprehensive recruitment method has to be exploredto locate individuals with entrepreneurial acumen.
12.3.2 The need to complement household financingThe community resistance that masons encountered is a clear indication that, whatever the intervention, community cohesionand ownership must be maintained to ensure ease of sell of products and services and sustainability of the intervention. Inthe rural context, communities apparently prefer that development interventions benefit the entire community rather than afew individuals. Moreover, earning a profit from the poor is often frowned upon by communities as unethical and even,morally wrong. This cultural context complicates the very essence of a market system which is driven by profit.
However, the RMA uncovered a growing social movement that is bringing community cohesion and ownershipthrough establishing rural savings schemes. This social movement, championed mostly by NGOs like CAWVOC, arepromoting Village Credit Schemes where the rural poor establish savings groups of anywhere between 10 and 16 peopleto build a cash reserve that could be accessed for personal or communal use. These credit schemes have harnessed thepower of cooperative action where some groups have reportedly saved up to MWK 500,000.00 (≈USD 3030.00) withinjust 9 months.4
There is a very strong expectation that slabs should be free because of past and on-going subsidy programs…. In one case, householdseven refused to pay MWK 20.00 for a slab
– Thomas Logea, Mwalija village Traditional Authority Kasisi
Such community systems could help solve the problems of community resistance and cash-flow into the sanitation businessesif payment structures could be created with such schemes to provide sanitation financing to rural households. That way,communities will not feel that the businesses are profiting from the rural poor since they would be accessing vastercommunal resources as compared to scarce household ones.
There is a lot of interest for the slabs, however…. (people) feel you are profiting from the poor–Vincent Chikumba, Mason from Traditional Authority Maseya
12.3.3 The market area was limited by the programOne of the stipulations of the program for masons was they could only sell in a geographically defined project area, usually theirimmediate village. This meant that the mason was not free to seek out customers freely and and expand their business on theirown terms. This program policy removed the incentive to compete and most likely removed the incentive for masons to seek outnew markets for their products.
4Petros Mkandawire, Chikhwawa Project Coordinator, CAWVOC, 15th December 2011.
Sanitation and Hygiene in Africa98

12.3.4 Previous subsidies hurt the programPast NGO projects and government initiatives defaulted to providing hardware subsidies to households as a way of increasingsanitation coverage. Despite the hard lessons learnt and a new government policy disallowing sanitation hardware subsidies,NGOs and local government continue to provide subsidies that are distorting market prices and creating unsustainablemarket dependency on subsidies (Figure 12.2).
12.3.5 Humanure was not a viable payment optionThe alternative arrangement for households to pay for their latrine through harvested compost was intended to provide flexibilityto entice market demand. However, the actual returns on humanure were unattractive and not worth the time and resourcesnecessary to collect and bring it to market. For example, one mason went to considerable effort to collect 3 tonnes ofhumanure that only generated MWK 6000.00 (≈USD 37.00) from his buyer.
The burden of waiting 12 months (the recommended minimum duration needed to effectively kill the pathogens in the sludgeis one year in Chikhwawa) and the effort required to go house to house to collect it also proved to be unrealistic for many masons.And in truth, the masons had no technical capacity to measure the safety or value of the manure.
12.3.6 Readjusting the approachThe analysis of these failures does provide some ideas on where to start to create successful models of sanitation as a business inrural areas:
• Advocate to NGOs and government on the implications of subsidy-led programs with a view to reducing them;• Develop a more comprehensive recruitment/selection criteria for masons where actual entrepreneurs are identified,
trained and supported with proper business development services;• Establish accessible lines of credit for sanitation financing for rural households either between households and rural credit
schemes or between traditional MFIs and rural credit schemes;• Redefine the NGO role in sanitation programming. Over the course of the sanitation marketing program in Chikhwawa
Water For People questioned their direct role in program implementation. In future programming Water For People willopt for a facilitator rather than a stakeholder role.
While it is still not proven that sanitation marketing can work in the rural areas of Malawi (and other parts of Africa) it is clearthat, if these programs are to stand any chance of being successful, the focus has to be on developing business and creating the
Figure 12.2 An abandoned latrine subsidized by Water For People in Chikhwawa.
Unleash the sanitation marketplace 99

enabling environment for the market to exist, sticking closely to the principles of market-based approaches. A market is morethan just a statistic of sanitation coverage gaps – it is people, communities, and households who are willing and able to pay forproducts and services they really want. It might be that some marketplaces are just too distorted (due to community issues, thepresence of subsidies, or the lack of relevant products) to be successful. But Sanitation Marketing is a sound concept if the rightmarket exists or can be established.
12.4 NEXT GENERATION MARKET-BASED APPROACHES – BUSINESSDEVELOPMENT SERVICESBased on lessons and findings similar to the above case study, Water For People is testing an approach called Sanitation as aBusiness in Africa (Malawi, Rwanda, and Uganda). This approach focuses attention on proven entrepreneurs and looks toenhance their existing skillsets and build capacity within their businesses. This kind of work is called Business DevelopmentServices (BDS). In essence the objective is to develop more effective market environments that allow the delivery ofdemand led services by small and medium-sized enterprises (SME) working in the sector. It is focused on giving the marketsgreater freedom to function and encouraging new private sector operators to enter the market and develop improved accessto goods and services.
BDS are generally defined as services that improve the performance of the SME, its access to markets, and its ability tocompete. BDS provide an array of business services both operational (day to day issues) and strategic (medium to long termissues) that improve performance. On the operational side, this includes services such as information, training, technologydevelopment, communications, management of accounts and tax records, and compliance with regulations. The strategicservices like marketing, product design, business planning, and obtaining finance help to improve performance. BDS aredesigned to serve individual businesses, as opposed to the larger business community. It is believed that private sector BDShave significant and positive contributions to the growth and health of the SME and this has been re-emphasized by theexpansion of the sector in recent years. Using professional BDS helps SMEs to access better technology, finance, andinfrastructure, more successful and efficient management of their business.
Traditionally, BDS have been delivered directly by donor organizations and governments but this approach has been largelyunsuccessful as it has failed to reach any scale. In addition the overall sustainability of these support programs is usually low asthey are governed by the availability of funding and timeframes of the programs.
The current approach targets existing local BDS private sector companies and looks to build up their capacity as well as havethem (instead of external actors) provide the SMEwith BDS support. This is a shift away from the direct provision of BDS by thedonors (through outside consultants) themselves to the SME, which also aims to make the donor more of a facilitator than astakeholder. Instead of a stakeholder, International NGOs and donors should primarily be viewed as an outside facilitator tothis process, helping stakeholders to identify incentives, remedy bottlenecks in the system, and increase stakeholder capacityto perform their roles better.5
In the new approach, one part of the external investment is targeted to show the success of BDS, for example by demonstratingthat BDS involvement enabled SME to secure commercial financing. This will hopefully raise awareness in the sanitation sectorthat BDS is effective and nurture a ‘willingness to pay’ for the BDS by the SME, as well as other players. As the overall sanitationmarket was underdeveloped, particular attention was paid to the recruitment of the BDS so as to identify companies that werepoised to take initiative and become ongoing sanitation proponents. It was also important to consider their capacity and ability tobroaden their scope to deliver a whole new array of services including technical training and moving new technologies to market(Sparkman & Muyana 2012 – BDS Selection Guide).
Figure 12.3 presents the facilitation model within the market development approach, emphasizing the external actor’s(NGO or donor) role in providing direct support to the BDS provider, rather than BDS services to the SMEs directly, asis traditional.
One example of this approach is Water For People’s current work with Captiva as BDS in Uganda, through a programsupported by a grant from the Bill and Melinda Gates Foundation. As a part of their scope of work, Captiva have alreadyselected 15 potential SME (from an initial pool of 108) who appear well positioned to benefit from in-depth BDS andexpand sanitation services to many new customers throughout Kampala, Uganda. Purposefully, Water For People took a
5The key objective of a market-based approach to sanitation is that the market is strengthened in such a way that sustainable access to sanitation services isincreased and spread, specifically among households without access to sewerage services. In order for the sanitation market to remain healthy and grow,numerous participants have to be incentivized to play their role, and have the capabilities to do so.
Sanitation and Hygiene in Africa100

very low profile in this process to avoid some of the more adverse effects of donor involvement that would ultimately distort thereality of a market-led approach. The strategy is led by Captiva with Water for People only playing a facilitating role The mainBDS activities with these initial SME will focus on helping them prepare so that that have a good possibility to access localcommercial financing for expanding their business. In this regard, BDS are assisting the SME with aspects like developmentof business plans and book-keeping to ensure that they have the necessary documentation and books of accounts that will berequired before they can access commercial lending. Water For People will be closely monitoring the expansion of the SMEand how this impacts access to sanitation goods and services.
In the meantime, it is becoming widely understood that the success of meeting the sanitation challenge hinges to a large degreeon activating the sanitation marketplace. As a result, more serious attention and programmatic work geared towardsmarket-based approaches should be considered. NGOs in particular need to rethink their role in the sanitation sector. For amarket to be healthy and sustainable, all participants should be satisfied with their roles, have the incentives to continueplaying them and even expanding them, and have the capability to do so. For even healthier markets, a viable supportstructure should be in place, whether from the local public (government) or private (BDS, etc.) sector, and they should alsohave the incentives and capabilities to carry this supportive role into the future. In such a scenario, the market is notdependent on outside donors, sustainability flourishes and reaching the scale needed to meet the sanitation challenge justmight happen.
12.5 REFERENCESEvans B., Voorden C.v. and Peal A. (2009). Public Funding for Sanitation: The Many Faces of Sanitation Subsidies, a primer. Water Supply
and Sanitation Collaborative Council (WSSCC), Geneva.JenkinsM. and Sugden S. (2006).Rethinking Sanitation: Lessons and Innovation for Sustainability and Success in the NewMilennium. UNDP.Joint Monitoring Programme (JMP). (2012). Progress on Drinking Water and Sanitation. World Health Organization (WHO)/UNICEF,
New York City.Luthi C., McConville J. and Kvarnstrom E. (2009). Community-based Approaches for Addressing the Urban Sanitation Challenges.
International Journal of Urban Sustainable Development, 1(1–2), 49–63.Munyana S. (2012). Business Development Service (BDS) Provider Selection Guide. Water For People-Uganda, Kampala.Sah S. and Negussie A. (2008). Community Led Total Sanitation (CLTS): Addressing the Challenges of Scale and Sustainability in Rural
Africa. Presented at the Water and Sanitation in International Development and Disaster Relief (WSIDDR). International WorkshopEdinburgh, Scotland, UK, 28–30 May 2008. Desalination, 248(1–3), 666–672.
Figure 12.3 Market facilitation model.
Unleash the sanitation marketplace 101


Putting it all Together


Chapter 13
Lessons from Rwanda
Nitin JainWater and Sanitation Program
Rwanda was selected to host Rwanda AfricaSan 3 through a competitive process assessing locations that offered practicallearning opportunities for AfricaSan participants. Rwanda is one of only 4 African countries (the only country low-incomecountry), assessed to be on track to meet the sanitation MDG by the UNICEF/////WHO Joint Monitoring Program. The story ofRwanda’s sanitation and hygiene sector gave participants confidence that large-scale progress can be made and lessonsfeatured in many sessions. AfricaSan 3 hosted an address by President Paul Kagame of Rwanda and is the onlyAfricaSan conference to be addressed by a head of state. This chapter provides a summary of lessons learnt fromsanitation and hygiene development in Rwanda.
13.1 INTRODUCTIONRwanda provides a compelling example of approaches that can help governments scale up access to sanitation. According to the2010 Joint Monitoring Program (JMP) update, household access to sanitation facilities has increased faster in rural Rwanda thanin any other country in Sub-Saharan Africa. Almost four million people gained access to improved sanitation between 1990 and2008. 54% of the population currently has access to improved sanitation, up from a baseline of 23% in 1990.1 Most of thisprogress has been with households upgrading ‘unimproved’ latrines to improved hygienic ones. While the greatest gainshave been in rural areas, improvements in urban sanitation are notable as coverage has increased despite tremendous growthin the urban population.
Understanding this progress requires understanding the evolution of the sector through interrelated drivers including culturalfactors, the post-genocide reconstruction process, progress in related sectors, and specific sector initiatives. The evolution of thesector can be described through four basic phases of development:
I – Traditional and cultural factors, historical – 1994. Many traditional and cultural aspects have helped more recentimprovements in sanitation. Open defecation, estimated at just 8% in 1992, was low historically due in part to colonial lawsand regulations. Furthermore, a common language and the government’s strategy of drawing on traditional customs havehelped drive progress.
II – Focus on reconstruction and reconciliation, 1995–2000. Almost 1.5 million people gained access in the yearsimmediately after the war. The government, donors, NGO’s, and communities focused extensively on housing reconstructionprograms, which included latrine construction, and other policies and initiatives targeting rehabilitation and reconciliation.While sanitation and hygiene promotion were not always the central goal of these efforts, housing reconstruction had animmediate impact and many initiatives and reforms in this period helped lay important groundwork for the later years.
III – Consolidating the sanitation strategy, 2000–2005. As significant economic and social improvements continued to bemade, the government started shifting its focus from short-term measures to recover from the war and genocide, to long termdevelopment plans and strategies. National programs laid the groundwork for the current hygiene promotion campaign.
1While JMP numbers differ from government figures, both sets of data show a similar scale of progress. This Chapter uses JMP for consistency.
IV – Accelerating progress, 2005–present. Recent years have seen government giving emphasis to taking stock andaccelerating results. Ambitious targets have been set through national policies and are implemented at the community levelthrough a strong decentralized model of governance, supported with rigorous systems of accountability that draw ontraditional practices.
13.2 TRADITIONAL AND CULTURAL FACTORS, HISTORICAL – 1994Rwanda is one of the most densely populated countries in the world, with almost 400 people per square kilometer (NISR,2009). Severe economic stagnation in the period leading up to the war and genocide of 1994 was further exacerbated by thetremendous human toll of the war, with an estimated 1 million victims of the genocide, two million refugees outsideRwanda, and some 1.5 million people internally displaced (UNHCR, 2000). In addition to the physical and mental effects,the extended years of war had a significant economic impact on the country. Some estimates suggest the damage caused bythe conflict between 1990–1993 cost the country up to $100 million a year (United Nations Development Programme, 2007).
13.2.1 Drawing on traditional factorsDespite these entrenched economic and social challenges, there have been several positive factors within Rwanda’s historicalcontext that have contributed to improvements in sanitation coverage. A survey in 1992 estimated just 8% of ruralhouseholds resorted to open defecation (NISR, 1992). Furthermore, basic hygienic practices, such as handwashing, have alsobeen common throughout the country. Colonial rules and regulations played an important role by establishing publichygiene laws as far back as 1926. A decree from 1959, for example, enforced the construction of latrines in every house,shop, and establishment.
Traditional factors are often seen to impede improvements in sanitation. In contrast, Rwandan society also has a number oftraditional institutions and social structures that the government has called upon to strengthen the reconciliation process and tosupport reconstruction on a large scale with limited resources (GoR Ministry of Finance and Economic Planning, 2002). Byreturning to these traditions after the war, Rwanda’s leaders were able to draw on social capital to help solve the severesocio-economic problems, reform agriculture and the economy and, most importantly, foster good governance. In morerecent years many of these have been formalized into the administrative system, making it easier for national policies andtargets to be implemented within a decentralized structure.
13.3 RECONSTRUCTION AND RECONCILIATION, 1995–2000The challenge in the years immediately after the genocide was to stabilize the precarious condition of the country throughreconstruction and reconciliation, reintegration of the survivors and returning refugees, and rebuilding social structures.Recognizing that acute poverty only exacerbated the difficult circumstances, the government’s priority in the aftermath ofthe war was to tackle poverty by putting in place national policies and building the institutional frameworks necessary totransform the rural economy. Structural reforms at this stage prioritized reforms in agriculture, health, and education. Whilesanitation and hygiene promotion weren’t always central to these efforts, many initiatives and reforms in this period helpedlay important groundwork for the later years.
13.3.1 Housing reconstruction and villagizationThe reconstruction process, which included the construction of improved latrines in new housing, had a very significant impacton sanitation coverage, with almost 1.5 million people gaining access between 1995 and 2000. Villagization, or umudugudu, wasa cornerstone of the government’s efforts to deliver basic services for the thousands of returning families and to confront thedemands of land scarcity. The government saw umudugudu as a way to provide security for scattered families and improveservices including schools, health centers, water, and roads at a lower cost. Developing detailed plans with specific technicalrequirements helped attract donor funding. Supported by relief agencies, an estimated 300,000 houses, most of whichincluded latrines, were constructed under the program by 2004 (IRIN, 2004).
13.3.2 Land reformGiven the complexity of reintegrating returning refugees with the number of families that died in 1994, ownership of housing andland was a pressing issue for the government to tackle (Wyss, 2006). Historically, land belonged to the state and citizens wereessentially given the right to develop it for their living. Following the war, the government changed this approach and, in 1996,started developing a new land law to give full ownership to all landowners (GoRMinistry of Lands, Environment Forests, Water
Sanitation and Hygiene in Africa106

and Natural Resources, 2004). A key element of the reform was to extend property rights to women, who constituted more than60 percent of the surviving population after the war. Securing property rights was recognized as an important aspect of economicreconstruction because title to land improved people’s ability to borrow money and created incentives to invest their own moneyin better housing (Global IDP Database, 2004).
13.3.3 Linkages with health sector reform: community health workersLike most other services in 1994, the health sector in Rwanda was in disarray. As basic capacity was a severe constraint, thegovernment established institutes such as the Kigali Health Institute to train a cadre of skilled doctors and nurses and tappedinto community level health workers to extend services to households (IMF Internim PRSP, 2000). Setting up these traininginstitutes was an important factor in building local capacity within the health sector, and may have contributed to importantpolicy decisions in the next phase that emphasized a shift from curative to preventative approaches to improving health.
Community health workers evolved from volunteer health workers that were recruited to provide support for traumatizedindividuals in the wake of the genocide (Matthews, 2009). Their role was gradually expanded to include basic preventiveservices including sensitizing community members on child health, family planning, nutrition, hygiene, and various diseasesat monthly village meetings (AMREF, 1997). Under the program, each village elected a male and a female volunteer to actas community health workers for the general population. Their role was further formalized in the 2005 National CommunityHealth Policy and in subsequent reforms. Though not government employees, the 45,000 community health workers havebecome more formally recognized. They are overseen by the Ministry of Health (MINISANTE) through a cadre of around450 health officers who have targets for improving sanitation included in their performance contracts. This combinednetwork of health offices and community health workers, backed by closely monitored performance targets, is now driving ascale of promotion that is a significant factor in motivating households to maintain and upgrade their latrines.
13.3.4 Shifting from emergency relief to a development path: Vision 2020Vision 2020 articulated the government’s goals in transforming Rwanda’s economy and, for the first time, placed access toimproved sanitation at the center of Rwanda’s development plans (GoR, 2002). The Government developed Vision 2020between 1998 and 1999 through consultative meetings with citizens throughout the country, laying the framework for all thesector policies and strategies that would emerge between 2001 and 2005. Through it, the government outlined a path totransform Rwanda into a middle-income nation in which Rwandans are healthier, educated and more prosperous by 2020.
13.4 CONSOLIDATING THE STRATEGY, 2001–2005By the early 2000’s, the government was able to consolidate its vision and started shifting its focus from short-term measures torecover from the war and genocide to long-term development plans and strategies. These included critical policies and strategiesfor the sanitation sector. Sanitation and hygiene emerged as important interventions as stakeholders saw more evidence showingthe need to shift from curative to preventative policies. Decentralization was a key reform of this period, laying down a basicinstitutional framework to improve sanitation coverage (GoR Ministry of Local Government, Community Development andSocial Affairs, 2004). Participatory Hygiene and Sanitation Transformation (PHAST) and Hygiene et Assainissement enMilieu Scolaire (HAMS) programs were initiated to promote hygiene and sanitation by influencing positive behaviouralchange and adoption of better practices among Rwandan communities, they also introduced concepts that later evolved andwere mainstreamed under the national community health promotion program.
13.4.1 Placing sanitation at the center of poverty reduction strategiesWhile the rural water supply sector started being actively managed by the government in the sixties and an urban utility wascreated in 1976, the first National Sectoral Policy was only developed in 1992 (GoR, 2010). It was subsequently revised fourtimes to include emerging issues including: demand responsive approaches (1997); decentralization and reinforcedparticipation (2004); and hygiene, sanitation, and environment (2010). Until 2010, the policies covered sanitation but, inpractice, mainly targeted water supply. Financing within the sector focused on water development. Many donor projectsincluded a sanitation component but this was often ignored in implementation. Health systems emphasized curativeapproaches. From 2010 greater donor priority was given to preventive measures and in response, the government startedinvesting in effective low-cost promotional strategies to encourage household investments in improved sanitation.
Lessons from Rwanda 107

In 2002, the government introduced its Poverty Reduction Strategy Paper (PRSP), developed through an extensive nationalconsultation process, to guide national planning efforts to achieve the targets outlined for Vision 2020. The PRSP recognized thataccess to water and sanitation was essential to the overall strategy and vision of improving lives and reducing poverty by:
• Improving maternal and children’s health;• Improving enrolment in schools, especially for girls;• Improving security, particularly for women; and• Reducing health expenses for households and the Government, particularly for diseases like diarrhea.
13.4.2 Increasing productivity because of better healthThis would later evolve under the second Poverty Reduction Strategy Paper, known as the Economic Development and PovertyReduction Strategy 2008–2012 (EDPRS). Under EDPRS, the government set itself an even more ambitious goal of increasingthe proportion of the population with sanitation services from 38 to 65 percent (GoR, September 2007). EDPRS also alignedresponsibility for different sectors between the different ministries, districts and other stakeholders. While the first PRSPfocused on managing a transitional period of rehabilitation and reconstruction, the EDPRS emphasizes growth andpoverty reduction.
In parallel to the PRSP, the government started drafting and revising sector strategies and, in 2004, published its first waterand sanitation policy which defined guidelines for efficient use of resources and integrated new aspects such as decentralization,participatory approach, and privatization (World Bank, 2006). The 2004 policy aligned government goals with MDG objectivesand Rwanda’s Vision 2020. It also complemented the government’s 7-year program which emphasized decentralization andparticipatory approaches to delivering services.
Following the passage of the constitution and presidential and legislative elections in 2003, the government acted toimplement institutional reforms to implement the new policy and rapidly increase the scope and quality of service delivery.In related shifts in the health sector, the government prioritized approaches that stimulated public demand for services,aligning health districts with the decentralized local government districts, and improving accountability of facilities andpersonnel to local government institutions. The community health worker system, while still based on volunteers, wasexpanded and given a larger mandate, and health facilities, personnel, and communities were incentivized to achieve resultswith the introduction of performance based financing.
13.4.3 Decentralization and donor harmonizationThe government’s main strategy to achieve good governance and sustainable economic development was to decentralizedecision making to bring the development process closer to the people (GoR, September 2004). The policy drew on lessonsfrom before the 1994 genocide, a period of poor governance characterized by highly centralized authority and lack of citizenparticipation in leadership and development. The government adopted the National Decentralization Policy in May 2000 as amechanism to achieve three main goals: good governance; poverty reduction; and efficient, effective and accountabledelivery of services, including improved sanitation. To implement the policy, the government set up the CommonDevelopment Fund (CDF) in 2002, with the goal of channeling 10% of the annual national revenues to support projects andprograms planned and implemented at the district level (GoR, 2006).
The CDF was designed to mobilize and target donors funding. The proliferation of aid partners with different approaches,mechanisms, and agendas had mixed results. On one hand, the influx of millions of dollars contributed to reconstruction ofhousing and services, thereby improving health indicators including access to sanitation. The influx of external resources,however, often only reflected donor priorities leading to a disproportionate expenditure of funding on too many sanitationmodels that were not designed and distributed according to the local context. These donor-driven programs were focused onconstructing facilities and ignored building local capacity and sanitation promotion programs. Furthermore, funding convergedon a handful of districts leaving other areas behind. In order to bring some measure of control, the government startedassigning different donors and NGO’s different districts and required that their approaches aligned with national strategies.
13.5 2005 – PRESENT: ACCELERATING PROGRESSSince 2005, there has been a positive, results based shift within the government. The international community and thegovernment have responded to the sanitation crisis and the momentum from AfricaSan and the eThekwini declaration hashelped raise the profile of sanitation within the entire continent. Senior government officials right up to the President haveactively supported key interventions in the sector. The President has often singled out hygiene and sanitation, noting that
Sanitation and Hygiene in Africa108

access to and use of hygienic sanitation facilities cannot be donated in the form of aid. These remarks point to the changingperception that personal hygiene and wellbeing are closely linked with economic development.
13.5.1 Community based health promotionThe Environmental Health Policy of 2008 and the National Water and Sanitation Policy of 2010 were developed based onevidence and knowledge from the previous decade of experience in Rwanda’s government-led effort to promote sanitation.The key change was in the evolving role of the community who, as beneficiaries, were increasingly expected to view theirown health and wellbeing as their most valuable asset. The Environmental Health Policy concretized the shift in thegovernment’s strategy to improve health indicators from curative to preventative approaches. In December 2009, theEnvironmental Health Desk of the Ministry of Health launched a Community Based Environmental Health PromotionProgram (CBEHPP) to build on the community-based approaches tested under PHAST and HAMS. CBEHPP is describedas ‘a hygiene behaviour change approach to reach all communities and empower them to identify their personal anddomestic hygiene and environmental health related problems (including access to safe drinking water and improvedsanitation) and solve them’ (GoR Ministry of Health, Environmental Health Desk, 2010). The Health Sector Strategic Plan2009–2012 further supports this by identifying sanitation as a high-impact intervention that the government will scale up(Government of Rwanda Ministry of Health, July 2009).
Further impetus for progress was provided following the re-election of the President. In 2010 he dramatically raised theprofile of CBEHPP by launching the Hygiene and Sanitation Presidential Initiative (HSPI), noting that hygiene andsanitation in homes, schools, offices, restaurants, and other public places form an important foundation for developmentbecause a healthy body in a healthy environment is a prerequisite for development. His party manifesto also urged differentministries to ensure full sanitation coverage countrywide by 2017, beating the vision 2020’s timeline. This level of supporthas had an important effect in accelerating efforts to mobilize resources and implement CBEHPP in all 30 districts.
2010 also marked the first national policy that drew together the key concepts from water and sanitation policies fromdifferent ministries into a holistic approach. The National Water and Sanitation Policy of 2010 focuses on six sanitationrelated fronts: household sanitation, institutional sanitation, collective sanitation, storm water drainage, solid wastemanagement and institutional sector framework. This policy draws greater focus to urban sanitation, defining a policyframework that supports the Sanitation Master Plan for Kigali town.
13.5.2 Strengthening decentralized service deliveryWhile developing policies and national commitment to improving access to sanitation has been critical to progress, the processof translating these national targets and policies into action on the ground has been Rwanda’s biggest success. Adapting Imihigo,a tradition that Rwanda has institutionalized as a means to enhance local government reform and stimulate development, hasbeen the key to this success.
Imihigo draws on a cultural practice of publicly committing to achieving specific goals. Failing to meet these commitments isa dishonor for the individuals and the community. Following the reforms in the early 2000’s, Rwanda’s Ministry for LocalAdministration (MINALOC) and the Ministry of Finance and Economic Planning (MINECOFIN) developed performancecontracts in the tradition of Imihigo holding the President of Rwanda and the district leaders accountable for specific goals ineach district, including sanitation coverage. These contracts have now been signed at all levels of the decentralized systemincluding households and individuals.
The signed contract between the head of household and local leaders includes baseline data for the district, districtdevelopment targets, performance indicators, and the budget allocations for each target (GoR, June 2007). Imihigoevaluations are carried out three times a year by a task force comprising the Prime Minister’s Office, MINALOC and thePresident’s Office. Each district presents its evaluation findings to the task force in the presence of stakeholders.
To strengthen the decentralization process, in 2007 the government developed the Rwanda Decentralization StrategicFramework (RDSF) to reinforce the link between good governance and the attainment of the targets under Vision 2020, theMDGs, and the EDPRS.
13.6 LOOKING AHEAD: EVALUATING SECTOR PERFORMANCEThe Country Status Overview (CSO), which benchmarks African countries and helps countries assess their own service deliverypathways for turning finance into sanitation services, shows that Rwanda is currently performing above the regional peer-groupaverage for both rural and urban sanitation (AMCOW, 2011). There is, however, still a long way for Rwanda to meet its target of100% sanitation coverage and, more importantly, sustain the gains. The CSO points out that policy tools with agreed national
Lessons from Rwanda 109

targets and a subsector policy are largely in place, but there is still institutional fragmentation, mainly because the process ofdecentralisation is still fairly recent. The central government is developing a coherent and effective coordination role, butdistricts are not yet sufficiently informed and mobilised.
While promotion programs to trigger demand for better sanitation have been effective, the market for rural sanitation onthe supply side still needs to be strengthened. Improved sanitation technologies are still too expensive for many householdsand the network of suppliers and masons is weak. CBEHPP will address this through incremental upgrades, wherecommunities focus on small actions that they can afford, but private sector interest in investing in sanitation markets needsto be encouraged.
The CSO also highlights that there need to be specific reforms to the budget structure to disaggregate subsector spending. TheAfrica Infrastructure Country Diagnostic report observes that Rwanda has been able to make considerable progress movingpeople up the sanitation ladder with very little public spending (Morella et al. 2008). Looking ahead, however, thegovernment will need to plan on investing more if it is to meet its targets. The annual capital investment to provideimproved sanitation infrastructure for just over 500,000 people a year is estimated at US$ 41 million per year. Under thegovernment’s strategy of leveraging household funds by investing in sanitation and hygiene promotion, users are expected tobear around 70 percent of these costs. The government has already planned for a budget of US$ 9 million per year, of whichUS$ 8 million is allocated for rural sanitation. This leaves a deficit of US$ 4 million year mainly in urban sanitation. Giventhe rapid population growth of the capital Kigali, which is expected to grow to over a million people by 2015, there is likelyto be demand for more sophisticated and expensive technology sanitation options including sewerage.
13.7 CONCLUSIONSFrom the ruins of years of war and genocide, Rwanda has moved to improve household access to hygienic sanitation facilitiesfaster than in any other country in Sub-Saharan Africa. Rwanda’s experience shows that progress is possible even in thesedifficult circumstances. Three key elements stand out from Rwanda’s experience that other countries can adapt andimplement to improve access to sanitation and improved hygiene:
Turning crisis to opportunity: In the immediate aftermath of the war, the government of Rwanda, donors, relief agencies, andNGO’s embarked on a massive housing reconstruction program that brought improved sanitation facilities to hundredsof thousands of people. While this was a response to unique circumstances, other situations can provide opportunities forcountries and donors to prioritize sanitation and leverage funding. Furthermore, while sanitation and hygiene were notalways central to other structural reforms such as land reform during these years, there are lessons to be learnt on howprogress and reforms in other sectors can influence and unlock gains in the sanitation sector.
Formalizing traditional elements into administrative frameworks: Drawing on familiar traditional practices to develop andformalize administrative frameworks has been a particularly successful strategy in Rwanda. While developing policies andnational commitment to improving access to sanitation has been critical to progress, the process of translating thesenational targets and policies into action on the ground has been Rwanda’s biggest success. Harnessing Imihigo, a traditionthat Rwanda has institutionalized as a means to enhance local government reform and strengthen ownership andaccountability, for example, made it easier for the government to implement national sanitation strategies intodecentralized networks that reached right down to the smallest administrative unit in each village. Similarly, the Ubudeheprogram, based on the tradition of mutual assistance, provided a successful network that helped the government target andsupport poor households. Similar approaches can be adopted in other countries, particularly other post-conflict nations.
However, while some traditional practices can be beneficial, there are others that the government broke down in order tomeet new challenges. Perhaps the most important example in the context of sanitation was empowering the role of womenwithin Rwandan society. Extending the right to own land, for example, was an important reform that improved access tofinancing and encouraged investments in permanent housing.
Forging strong political will supported at all levels of decentralization: Translating national policies and strategies into resultson the ground is critical to improving access. However, these gains are only possible at the national scale if political leadershipactively supports and drives progress towards the targets. In Rwanda, this support has come from the very top, where thePresident identified sanitation as a key approach to reducing poverty under national poverty reduction strategies and otherpolicies. This level of support was unprecedented and was critical in driving action to putting the country on adevelopment path that includes access to these basic needs. Support from lower levels of administration was no lessimportant. While devolution may begin at the centre, it must find equally willing expression at all levels if it is to cascadedown to access on the ground.
Sanitation and Hygiene in Africa110

13.8 REFERENCES
African Medical and Research Foundation (AMREF) (July 1997). Final Report on Emergency Assistance for Kiziguro District.AMCOW (2011). An AMCOWCountry Status Overview –Water supply and sanitation in RWANDA: Turning Finance into Services for 2015
and Beyond. Available at: http://www.wsp.org/sites/wsp.org/files/publications/CSO-rwanda.pdf (accessed 10 September 2013)Global IDP Database (2004). Profile of Internal Displacement: Rwanda. Compilation of the information available in the Global IDP Database
of the Norwegian Refugee Council (as of 29 October, 2004).Government of Rwanda (November 2002). Rwanda Vision 2020. Government of Rwanda.Government of Rwanda (September 2004). Organising Decentralised Governance for Effective Grass-roots Service Delivery: Rwanda’s
Experience. Government of Rwanda.Government of Rwanda (2006). Rwanda Water and Sanitation Sector Public Expenditure Review 2006. Government of Rwanda.Government of Rwanda (June 2007). Nyagatare District Development Plan 2008–2012. Government of Rwanda.Government of Rwanda (September 2007). Economic Development and Poverty Reduction Strategy (EDPRS) 2008–2012. Government of
Rwanda.Government of Rwanda (April 2010). Rwanda Water and Sanitation Sector Public Expenditure Review 2009. Draft Report.Government of Rwanda (2007). Towards a coherent National Program for sanitation and Hygiene Promotion in Rwanda. Government of
Rwanda Discussion Paper, July.Government of RwandaMinistry of Finance and Economic Planning (2002). Poverty Reduction Strategy Paper, 2002. Government of Rwanda
Ministry of Finance and Economic Planning.Government of Rwanda Ministry of Finance and Economic Planning (October 2004). Poverty Reduction Strategy Annual Progress Report.
Government of Rwanda Ministry of Finance and Economic Planning.Government of RwandaMinistry of Finance and Economic Planning (October 2009). Economic Development and Poverty Reduction Strategy
(EDPRS) Implementation Report. Government of Rwanda Ministry of Finance and Economic Planning, January–June 2009.Government of RwandaMinistry of Health (July 2009). Health Sector Strategic Plan June 2009–2012. Government of RwandaMinistry of Health.Government of Rwanda Ministry of Health, Environmental Health Desk (January 2010). Roadmap for Community-Based Environmental
Health Promotion Programme (CBEHPP). Government of Rwanda Ministry of Health, Environmental Health Desk.Government of Rwanda Ministry of Lands, Environment Forests, Water and Natural Resources (February 2004). National Land Policy.
Government of Rwanda Ministry of Lands, Environment Forests, Water and Natural Resources.Government of Rwanda Ministry of Lands, Environment Forests, Water and Natural Resources (October 2004). National Rural Water Supply
and Sanitation Programme. Government of Rwanda Ministry of Lands, Environment Forests, Water and Natural Resources.Government of Rwanda Ministry of Lands, Environment Forests, Water and Natural Resources (October 2004). Sectorial Policy onWater and
Sanitation. Government of Rwanda Ministry of Lands, Environment Forests, Water and Natural Resources.Government of Rwanda Ministry of Local Government, Community Development and Social Affairs (March 2004). Rwanda Five-Year
Decentralisation Implementation Programme 2004–2008. Government of Rwanda Ministry of Local Government, CommunityDevelopment and Social Affairs.
IMF (November 2000). An Approach to the Poverty Reduction Action Plan for Rwanda: Interim PRSP. IMF.Koster M. (October 2008). Fragmented Lives: Reconstructing Rural Livelihoods in Post-Genocide Rwanda. PhD Thesis, Sociology of
Consumers and Households, Wageningen University.Matthews D. (2009). Global Rhetoric, Local Actors: Community Health Workers and the Concept of Participation in Rwanda, University of
Oxford, Oxford.Morella E., Foster V. and Banerjee S. G. (2008). Africa Infrastructure Country Diagnostic. Summary of Background Paper 13. World Bank,
Washington DC, June 2008, Page 8.National Institute of Statistics of Rwanda – NISR (1992) Demographic and Health Survey, National Institute of Statistics of Rwanda (NISR).
Available at: http://www.statistics.gov.rw/survey-period/demographic-and-health-survey-1992 (Data retrieved April 2011)National Institute of Statistics of Rwanda – NISR (2009) National Population Projection (2007–2022), National Institute of
Statistics of Rwanda (NISR). Available at: http://statistics.gov.rw/publications/national-population-projection-2007-2022 (accessed10 Spetember 2013)
IRIN (2004). RWANDA: Government implements low-cost housing for returnees. Retrieved from http://www.irinnews.org/report/51581/rwanda-government-implements-low-cost-housing-for-returnees (accessed 10 September 2013).
SNV (2009). Joint Action Development Forum in Rwanda: Experiences and Lessons Learnt. SNV, September 2009.United Nations Development Programme (2010). Millennium Development Goals Progress Report. Rwanda Country Report 2010.United Nations Development Programme, Rwanda (2007). Turning Vision 2020 into Reality: From Recovery to Sustainable Human
Development. Rwanda. Available at: http://hdr.undp.org/en/reports/national/africa/rwanda/name,3322,en.html (accessed 10September 2013).
UNHCR (2000). Chapter 10: The Rwandan Genocide and its Aftermath. In: The State of the World’s Refugees 2000 Fifty Years ofHumanitarian Action. http://www.unhcr.org/3ebf9bb60.html (accessed 10 September 2013).
WHO/UNICEF Joint Monitoring Programme for Water Supply and Sanitation (2000). Global Water Supply and Sanitation Assessment 2000Report. WHO/UNICEF Joint Monitoring Programme for Water Supply and Sanitation.
Lessons from Rwanda 111

WHO/UNICEF Joint Monitoring Programme for Water Supply and Sanitation (2004). Meeting the MDG Drinking Water and SanitationTarget: a Mid-Rerm Assessment of Progress. WHO/UNICEF Joint Monitoring Programme for Water Supply and Sanitation.
WHO/UNICEF Joint Monitoring Programme for Water Supply and Sanitation (2006). Meeting the MDG Drinking Water and SanitationTarget: The Urban and Rural Challenge of the Decade. WHO/UNICEF Joint Monitoring Programme for Water Supply and Sanitation.
World Bank Internal Project Documents: 1994–2011.World Bank (2006)Getting Africa on Track to Meet the MDGs on Water and Sanitation: A Status Review of Sixteen African Countries. World
Bank, Washington D.C. Available at http://documents.worldbank.org/curated/en/2006/10/7689706/getting-africa-track-meet-mdgs-water-sanitation-status-review-sixteen-african-countries (accessed 10 September 2013)
Wyss K. (2006). A Thousand Hills for 9 Million People Land Reform in Rwanda: Restoration of Feudal Order or Genuine Transformation?Working Paper, Swisspeace, Bern, Switzerland. Available at http://www.swisspeace.ch/fileadmin/user_upload/Media/Publications/WP1_2006.pdf (accessed 10 Spetember 2013).
Sanitation and Hygiene in Africa112

Chapter 14
Sanitation in urban areas
Peter Hawkins, Isabel Blackett, Christiaan Heymans and Jeremy Colin
As Africa develops, it is also urbanizing, with the proportion of the population living in cities and towns having risen from28% in 1990 to about 38% in 2010. People come to African cities for work and a new life, but many are confronted by thesqualor of uncontrolled informal settlements. Improving urban sanitation services in Africa is amongst the continent’s mostpressing challenges.
14.1 SCALE OF THE CHALLENGEWith an annual growth rate of 4.3% Africa’s urban population has more than doubled from 1990 to 2010, from 145 million to337million.1 According to UN-Habitat, almost two thirds of these people live in slums, which are growing at a rate of four to fivemillion people per year. Sanitary conditions in these slums are generally lamentable, and public sector interventions to alleviatethe situation have by and large been minimal.
1The figures quoted in this section are based on the JMP report of 2010.

As the charts show, urban sanitation coverage in Sub-Saharan Africa has barely increased in percentage terms over 20 years,and the number of people practicing open defecation has risen by 77%, from 16million to 28 million. Clearly, ‘business as usual’will not deliver improved sanitation to Africa’s cities.
The JMP figures hide a huge problem: they address only access to sanitation facilities, whilst in urban areas where there is nospace to dig a new pit when a current latrine fills up, hygienic emptying services are an indispensable part of an adequatesanitation service. There are very few statistics to give an insight into this issue, but there is little doubt that many of thesanitation facilities counted by the JMP as ‘improved’ are not hygienically emptied and cause serious pollution and risks topublic health when emptied by traditional means.
The CSO2 analysis (AMCOW, 2011) of African countries shows that there are huge disparities in access to improvedsanitation in urban areas according to income levels, with the lowest quintile having around 50 percentage points lesscoverage than the richest. It also shows that of the four subsectors (urban and rural water supply, urban and rural sanitation),urban sanitation has the weakest service delivery pathway.
There is therefore a pressing need to address the urban sanitation challenge, with emphasis on including slum dwellers and thepoor, amongst whom the problem is concentrated. In the absence of such concerted intervention, cholera, diarrheas and worminfections will continue to abound, and education, productivity and the quality of life will continue to suffer.
14.2 MEETING THE CHALLENGE: WHAT WE KNOW14.2.1 Focus on service deliveryWhile the many and varied urban sanitation challenges in Africa are fairly well known, there is a notable lack of clarity andconsensus in the sector on strategies for addressing the challenges and achieving sustainable progress at scale. However, in arecent WSP study on urban sanitation (Hawkins, 2013), the overarching conclusion is that any effective response to thechallenge should view it in terms of service delivery rather than infrastructure, as has been the tendency in the past.
Put simply, African cities do not have sufficient space to be able to accumulate excreta around where people live. The currentsituation where a large proportion is buried in backyards or dumped into natural or man-made drainage ways is neithersustainable nor healthy, and a series of inter-linked services is needed on a daily basis to ensure its removal and disposal in away that is safe in both environmental and public health terms. Even in the case of the 10%–20% of urban householdsserved by sewerage systems, management of these systems is typically very weak, and broken down pumping stations andnon-functional wastewater treatment plants are the rule rather than the exception.
There is therefore a need to make a fundamental shift in thinking away from infrastructure towards a concept of servicedelivery. Cities need effective urban sanitation systems, consisting of sustainable processes and service providers that willensure the safe capture, storage, transport and treatment of excreta, not just investments in hardware. This in its turn requiresa focus on outcomes rather than inputs, just as in rural sanitation it is now accepted best practice to focus on behaviourchange rather than the construction of toilets per se.
14.2.2 Existing urban services and infrastructureUrban sanitation deficiencies in Africa are diverse and there is no common typology of what is ‘broken’ and needs to be fixed.Towns and cities have a mixture of on- and off-site sanitation facilities and services, some provided by householders, some byprivate developers and some by the municipality or utility. Only some of the challenges are physical, and it may take decades toachieve safe management and disposal of excreta and wastewater city-wide, supported by consumer awareness, sustainablefinancing and effective systems of decision-making and service delivery.
In established low-income settlements it is rare to find a complete lack of sanitation facilities. Sanitary conditions maynevertheless remain poor due, for example, to poorly constructed or maintained facilities; inadequate water supplies; toiletsdischarging into open drains which are blocked with uncollected garbage and frequently overflow; and communal toiletfacilities which are filthy, malfunctioning and possibly abandoned. This is exacerbated by inadequate services for managingthe fecal sludge from on-site facilities. Improving sanitation in such circumstances can be much harder than in communitieswhere there is a complete lack of infrastructure and services so that they present as a ‘blank sheet’.
There is also wide consensus amongst sector practitioners on the need for adequate drainage and solid waste management asan essential complement to excreta management services. Virtually all sanitation systems place the excreta underground (insewers, septic tanks or latrine pits), and these do not function effectively when flooded; excreta then becomes mixed withstormwater and flows all over flooded areas. Effective drainage is needed to deal with this, and this in turn will not functionif it is choked with uncollected solid waste. This is a common situation in Africa; with many of its largest cities located in
Sanitation and Hygiene in Africa114

coastal or riverine areas, low-lying and poorly drained land unsuitable for formal urban development is often occupied by denseunplanned settlements, and these account for a significant proportion of low-income residents.
14.2.3 Conceptual frameworks, tools and resourcesA number of conceptual frameworks and approaches have emerged in recent years for the planning and design of poor-inclusiveurban sanitation improvements. These include the Strategic Sanitation Approach, developed in Ghana in the 1990s,Sanitation 21, developed by IWA, and Community-Led Urban Environmental Sanitation, developed by SANDEC. Theiremergence was to some extent a response to the fact that too many urban sanitation investments fail to deliver all of theiranticipated benefits.
A limitation of these frameworks is that they are predicated on certain conditions being in place at city level, but which inpractice rarely are. Lack of capacity for sanitation planning and stakeholder consultation is also a critical gap. Even if cityauthorities were willing and able to use the frameworks, much remains to be done to develop processes for harmonizingthem with established municipal capacities, systems and budgeting processes.
For now, the principal value of these frameworks is that they have encouraged a holistic view of urban sanitation that goesbeyond infrastructure, placing greater emphasis on needs of users, including the poor, and the functionality of sanitation servicedelivery systems at local and city levels.
There is growing recognition that there is a political dimension to decision-making on sanitation. Several donors havetherefore been using political economy analysis to understand what factors drive or inhibit government interest in, andcommitment to, sanitation, with particular regard to the needs of the poor. There is little doubt that the application ofsuch analysis is of great value for contextualizing policy, resource allocation and operational decisions on urbansanitation programming.
14.2.4 Creating an enabling environmentWhilst there is a clear need in the water and sanitation sector to establish an ‘enabling environment’ for progress, little consensusand clarity exist on what this means in each particular context. What is clear is the need for governments to take urban sanitationmore seriously, prioritize support to the poor, allocate more resources to it and establish viable incentives and systems ofaccountability, so that the agencies responsible expand access to improved facilities and improve operations andmaintenance. Although some partial attempts to address this issue have been made in a few African countries, none havemanaged to do so in as comprehensive a manner as was done, for instance, under the Indonesia Sanitation SectorDevelopment Program (ISSDP) or the National Urban Sanitation Policy (NUSP) of India.
FinancePresently, when large investments are made in the water and sanitation sector, it is usually water supply that receives the bulk ofthe funds. Very few countries have put in place sector financing strategies for urban sanitation and some governments arereluctant to allocate funds because improvements (often assuming sewerage as the norm) are perceived as capital-intensive,rarely generate significant revenue and do not always deliver the benefits intended. Wasted investments are common andboth central and local governments often have no clear idea about what constitutes a good project that is worth investing in.The challenge is not simply to increase the level of funding available to the sector, but to use funds more effectively and toinclude the poorer sections of the urban population, where the health risks are typically greater.
Unfortunately, there is little evidence of new initiatives to strengthen sector financing frameworks for urban sanitation, andthe CSO studies show that internally sourced public sector capital funding for urban sanitation corresponds to less than 15% ofoverall requirements. Instead, the emphasis seems to be on how to maximize the impact of donor funding. There is a need toexplore how national urban sanitation programs operating within the government framework could be established to supportcost-effective, poor-inclusive sanitation planning and investment.
However, there have been some notable successes in capital financing at city level. The use of sanitation surcharges to fundon-site sanitation investments in Ouagadougou under PSAO is a rare case of a utility raising enough revenue to cover not only itsoperational costs but also some new investment in on-site sanitation.
There is growing consensus that some subsidies may be required for the poorest users to gain access to adequate sanitation,but targeting is an issue. For example, PAQPUD in Senegal (Section 14.4.1) used geographical targeting, working only inperi-urban districts known to have a predominantly low-income population. However, within these areas it was mostly theless poor households which benefited. Concentrating subsidies on the minimum level of service may go some way towardsaddressing this – as for instance in the improved latrines program in Mozambique during the 80’s and 90’s. There is a
Sanitation in urban areas 115
trade-off to be made between the increased transaction costs of better targeting, and the cost of subsidizing those who do not needit. Consideration also needs to be given to striking the right balance between interventions that benefit the poor directly and thosethat create viable services for the city as a whole.
Institutional arrangementsThere are no ideal institutional arrangements for providing poor-inclusive urban sanitation services; what works best islocation-specific. However, assigning responsibility for urban sanitation clearly and unambiguously to a single lead agencyhas been a significant factor in the success of some programs, including PAQPUD in Senegal and PSAO in Burkina Faso(Section 14.4.2). Some programs have established viable institutional arrangements not through the creation of a single leadagency, but rather by improving coordination between the various stakeholders or establishing new multi-stakeholderpartnerships. Nevertheless, the coordinating role is important even where implementation responsibility is shared, and thereis need for a primus inter pares.
Improving sanitation in slums and other low-income neighborhoods where standard service delivery options may not beapplicable usually requires direct engagement with households, in order to select service options that are both acceptable andaffordable. NGOs, often working closely with CBOs in the target communities, can have a lot to offer here. There is littlerecent evidence, however, of NGOs on their own facilitating at-scale urban sanitation improvements, highlighting the vitalrole of local government and/or public service providers.
Small-scale, informal private sector participation in urban on-site sanitation is well-established, particularly in latrineconstruction and pit emptying. Participation of the formal private sector on a larger scale in sewerage is less common exceptwhere combined with water supply. Where large private sector contracts have been established for the operation of citywater and sanitation services, rarely do these include specific provisions for expanding access to improved sanitationservices for the poor.
Norms and regulationsOfficial technical standards relating to sanitation, whether national or enshrined in local byelaws, are often quite exacting, and itmay not always be possible to comply with them fully, especially when making phased improvements as finances allow, orworking in densely populated informal settlements with irregular layouts. In some cities, pit latrines are illegal, althoughthere may be no other realistic alternative, and in Accra, Ghana, bucket latrines have been banned three times over the last20 years, without a concomitant upgrading program. A degree of flexibility and phasing in the application of standards istherefore important, and where government agencies are unwilling to compromise, this can prevent the realization ofsignificant improvements.
At the international level, too, donor agencies are bound by very strict environmental standards, which may result in thecollecting and treatment a small amount of excreta to a very high standard, rather than the more important task of controllingfecal pollution on a larger scale in places where the highest concentrations of people live.
14.2.5 Infrastructure developmentIn many cities in Sub-Saharan Africa, there is limited coverage not only by sewerage but also storm water drainage and otherbasic infrastructure such as reliable water and power supplies, street lighting and surfaced streets. The sanitation needs in suchlocations are usually obvious and the range of potentially viable technical options for improvement is not difficult to establish. Insuch circumstances the major constraints may be more of a legal, political or institutional nature.
However, the situation may be more complex, particularly where many households use a water-seal latrine with a septic tankor pit, with the overflow discharging into a nearby drain or sewer. Such situations, where the division between on-site and off-sitesanitation is blurred, is increasingly common, and it is perhaps surprising that there is no common understanding amonggovernment and development partners as to what, in technical terms, the priority problems are in such situations and howthey should be resolved.
SewerageThere is little evidence of large-scale investments in networked services that have benefited the poor at scale. Far more has beenwritten about the limitations of sewerage investments, and what can go wrong.
Entrenched beliefs that sewerage is the only ‘proper’ form of urban sanitation can lead municipal or government officials tochoose this option even where it is not technically viable. Perverse incentives around contracting may in any case reduce themotivation to develop cost-effective solutions. That said, on-site sanitation also has its limitations; as population densities
Sanitation and Hygiene in Africa116

grow and water consumption increases, it becomes increasingly difficult to manage the large resulting volumes of wastewater,and lack of space limits the use of pit latrines, particularly those that need to be relocated when the pit fills. Finding moreaffordable and pro-poor options for providing sewerage is therefore a priority, especially where population densities havealready reached this tipping point.
The evolution of condominial sewerage in Brazil and some other parts of Latin America has been documented extensively.Why the approach has not been taken up more widely is the subject of much debate but it appears that enabling conditions for theintroduction of condominial sewerage, such as technical capacity, financing mechanisms and the regulatory environment aresimply not in place yet in much of Africa. Another type of low-cost technology, settled sewerage, has been installed inDakar, and is currently being developed in Lusaka. This is an option which should be explored further, as in the normalcourse of events there is a tendency for users of on-site facilities to upgrade towards water-seal systems, which all too oftenend up discharging into street drains or sewers.
Although these types of system, and the decentralized wastewater treatment systems (DEWATS) championed by the GermanNGO, Borda, were conceived as community managed, experience has shown that the public sector or utility needs to accept aco-management responsibility by monitoring the facilities and providing technical support and funding for repairs andmaintenance, as well as on-going community promotion.
Community toiletsMuch has been learned and documented in recent years about effective approaches to the development and management ofcommunal toilet facilities in low-income residential areas. Challenges nevertheless remain, particularly with operation,maintenance and financial viability. It is also questionable whether community toilets can, on their own, fully address thesanitation needs of slums and other low-income areas. Convenience and safety are important issues here – particularlyfor women.
Much less has been written about shared toilets, with some notable exceptions such as the project supported by PracticalAction in Mukuru, Nairobi (Section 14.4.3). This is surprising given that, where space allows but household toilets are notpracticable or affordable, shared toilets reserved for the use of small, self-selected groups may be preferable to communalfacilities and the sense of ownership created may encourage users to keep the facilities clean.
Integrated slum upgrading programsSlum upgrading offers the potential to improve sanitation (and other) services for the urban poor on a large scale. Some programsset out to address the needs of slums comprehensively by removing the political and legal barriers which leave slums outside thenormal framework of public service provision and city governance, and it is increasingly (but by no means universally) the casethat African governments and municipalities are explicitly or tacitly recognizing at least a certain level of land use rights inunplanned settlements. However, there is little evidence of sanitation improvements at scale being introduced under slumupgrading programs. This is an area where there is potential to be tapped, by raising awareness on sanitation amongst urbanplanners, who are generally in charge of slum upgrading.
Fecal sludge managementAfter many years of neglect, this subject is receiving increased attention from development agencies and research organizations,though there has so far been no breakthrough in establishing and scaling up services for urban populations in general, or forlow-income areas in particular, where the problem is most acute. These efforts need to continue, as the bulk of low-incomehouseholds are likely to continue using on-site sanitation for the foreseeable future.
Emerging lessons include:
• As many houses in unplanned areas have very limited road access, emptying must in many cases be effected by manual ormanually maneuverable mechanical equipment, and then transferred to a tanker vehicle suitable for road transport to thetreatment plant. Given frequently poor traffic conditions, it is desirable in the larger cities to have a number of such plantsdecentralized around the city to reduce transport times, which are costly to operators. Depending on local conditions,transfer facilities (tanks) may be necessary, though they may be quite simple. However, ensuring the regular emptyingof transfer tanks may be a challenge. Alternatively, some operators may prefer to use a non-pressurized tanker toaccept wastes directly from primary emptying.
• There is a need for a range of emptying equipment, from buckets, through handpumps to trash pumps and vacuumsystems, as well as rakes and hooks to deal with solid waste that enters the pits, and these are gradually beingdeveloped in a number of places.
Sanitation in urban areas 117

• Fecal sludge management can be greatly facilitated by addressing the upstream end of the process – the latrine itself. Thusin South Africa, pour-flush latrines are being introduced to minimize the ingress of solid waste, which is the main factorleading to a need for manual rather than vacuum emptying. This also underlines the need to consider solid wastemanagement alongside excreta management.
• There are a number of initiatives under way to reinvent the bucket latrine. This has the advantage that the pit does notneed to be emptied – the ‘pit’ becomes a container that can be tightly covered and removed for disposal of thecontents and cleansing at a purpose-built facility. It is also easily accommodated even in very high occupancyaccommodation, and, as it involves virtually no on-site investment, may be attractive to slum landlords, or eventenants acting alone.
14.3 THE WAY FORWARD14.3.1 Service delivery frameworkAvailable evidence shows that to achieve poor-inclusive urban sanitation it is necessary to escape from the ‘conventional’,infrastructure-based approaches widely adopted, towards an approach based on the delivery of a series of complementaryservices. Whilst it is clear that there is no single universally applicable way of doing this, it is possible to identify a set ofkey principles, based on cases where urban sanitation improvements have benefitted poor communities. These aresummarized in the framework set out below, comprising three types of services which need to be combined to achievepoor-inclusive urban sanitation:
• Customer Services: These include supply of materials, construction of sanitation facilities, management of public toilets,and desludging services. They are typically provided directly to users and are often viable on a commercial basis, as theyhave a large private good component, although the poorest households may need targeted subsidies to access them. Theyare suitable for provision by small businesses, but may also be provided by a utility company.
• Public Services: These include treatment of fecal sludge, operation and maintenance of sewerage systems, maintenance ofdrainage systems, and solid waste management. They are delivered downstream of users, serving the general public bykeeping the environment clean and healthy. They produce public goods, and as such may not be able to be financedentirely by direct user charges. They are usually delivered by local authorities or utility companies, and may be lesssuitable for provision purely by the private sector, due to the need for substantial upfront infrastructure investment.Operational costs are usually funded through user charges, levies or local taxes, but it is rare for the full capital costsof the infrastructure needed to provide these services to be directly recovered from users.
• Infrastructure Development: As capital costs are frequently not recoverable, the planning, design, funding, andconstruction of public sanitation infrastructure, such as sewerage or drainage networks and treatment facilities, mayrequire recourse to higher level (national, regional or provincial) authorities or external financing agencies/donors.The client is effectively the provider of public sanitation services.
To be effective, these services require an enabling environment that provides policy guidance, rules and incentives to motivatestakeholders to prioritize sanitation, ensure accountability, and promote the development of adequate capacity to deliver thenecessary services sustainably and affordably, at three levels:
• National Enabling Environment: National government should ensure that local authorities and other responsible agenciesdeliver services of an acceptable standard, have the legal, financial and technical means to do so, and that monitoringmechanisms are in place to track progress and results.
• Local Governance: The need for local authorities to take the central role in ensuring adequate sanitation within theirjurisdiction is widely acknowledged. They need to plan, coordinate and monitor the activities by local stakeholderswhich are needed to deliver effective sanitation. Where these are to be undertaken by citizens or the private sector, thelocal authority will need to take on a promotion and enforcement role as well. Utilities may be responsible for theactual service delivery, but mostly under overall planning and coordination by the local authority. This is the keylocus for accountability – upwards to national policy makers and downwards to citizens.
• Community Consultation: This is needed to ensure that sanitation services reach all households, including those which areunable to pay for services, but which are exposed to high public health risks. Consultations are needed to balancecommunity needs and willingness to pay for services, and to agree on how communities will play their role inachieving effective sanitation.
Sanitation and Hygiene in Africa118

This service delivery framework is summarized in the Figure 14.1:
14.3.2 Drivers of changeSuch a framework alone will not of itself achieve poor-inclusive urban sanitation, as it requires a series of personal andinstitutional motivations to put it in place. Whilst much more remains to be done, some of these drivers of change are set outbelow:
• Systematic use of political economy analysis including clear accountability relationships, when planning andimplementing urban sanitation projects and programs;
• Evidence-based advocacy, such as documentation and dissemination to policy-makers of the economic results of defectivesanitation, and international benchmarking activities such as IBNet and the Country Status Overviews (CSOs);
• Development of improved financing mechanisms and targeting of subsidies to those unable to afford basic minimumsanitation;
• Involvement of viable utilities, where they exist, to exploit their financial and technical strength;• Improvement of policy, coupled with fiscal and regulatory mechanisms, to provide incentives for the responsible
authorities to act;• Pressure from development partners to include a range of sustainable options that are appropriate for all urban
residents;• Pressure from civil society and mechanisms to monitor and publicly name and shame those who are falling behind;• Involvement of users in decision-making on services and service levels, and marketing of the idea and specific practices
related to improved sanitation and hygiene;• Building coalitions of interests and networks at all levels, from urban communities to the international arena.
National Enabling Environment Policy and prioritization of poor-inclusive sanitation Planning, monitoring and financing mechanisms Regulation, legislation and norms Capacity development and technical expertise
Local Governance Planning and coordination Legislation and enforcement Monitoring and promotion Support to local services development
Community Consultation Planning and setting service levels Sanitation for rented accommodation
Customer Services Materials supply Construction Public toilets Desludging
Public ServicesSludge treatment Sewerage O&M Drainage mt’ce Solid waste m’gt
Infrastructure Dev’t Planning Design Funding Construction
SustainedPoor-inclusive Urban Sanitation Services
Figure 14.1 A framework for achieving poor-inclusive urban sanitation.
Sanitation in urban areas 119

The way such drivers of change function is summarized in the following Figure 14.2:
The introduction of accountability mechanisms is crucial to the service delivery approach, as it is these that ensure continuedpressure on service providers to perform.
14.3.3 Key technical challengesIn addition to identifying and effectively using drivers of change, there are a number of technical issues that need to be resolved,so that political will and funding, once mobilized, can deliver the desired services. These include:
• Managing the service chain, to ensure that all the necessary complementary services are in place and that best use is madeof the potential of all stakeholders, from utilities to householders;
• Development of at-scale pit emptying services for peri-urban and informal settlements, and criteria on whether to serviceexisting facilities or build new ones that are easier to service;
• Development of viable options for slum tenants, whether in-house or off-plot;• Development of systems that work in challenging environments, such as where houses are built over water, areas subject to
flooding, steep hillsides, and other marginal areas typically occupied by the urban poor;• Maximizing the use of sewerage systems, where connection rates in poor communities are often extremely low, negating
the major investments made;• Systematic analysis of decentralized systems.
14.3.4 PartnershipsThe delivery of poor-inclusive urban sanitation services requires the coordinated participation of many partners – users,landlords, civil society, the private sector, local authorities and utility companies, regulatory agencies, state and nationalgovernments, donor agencies, academic institutions, and others. This has probably contributed to the slow progress made inthis subsector, since such partnerships are often new and may take considerable effort to establish, especially in aresource-poor environment with many competing priorities.
However, given a will to tackle the large and growing problem of urban sanitation, there is evidence to show that it is possibleto make progress by working in such partnerships. Municipal authorities are uniquely placed to take on the crucial coordinatingrole, and should be supported to do so. This will underpin the necessary change from a sectorial, infrastructure-based approachto one based on service delivery and governance.
14.4 SOME EXAMPLES OF SUCCESSFUL INTERVENTIONS14.4.1 PAQPUD, DakarContextIn 2001, 75% of households in Dakar had a household water connection, at least 82% had access to improved sanitation and 31%had sewer connections. Open defecation was estimated at less than 3%. Unusually for Africa, central Dakar has a large and
Services to Reach Poor Communities� Effective fecal sludge management� Sanitation for low-cost rental accommodation� Sanitation systems for challenging
environments
Service Delivery Framework� National enabling
environment� Local governance� Community engagement
Drivers� Political factors, knowledge � Policy and fiscal incentives� Sustainable financing� Clarity and separation of
Acc
ou
nta
bili
tym
ech
anis
ms
Acco
un
tability
mech
anism
s
Figure 14.2 Drivers of change for poor-inclusive urban sanitation.
Sanitation and Hygiene in Africa120

functioning sewerage system. While access to sanitation was high on average, it was lower in peri-urban areas of the capital andsurveys revealed that the majority considered their toilet to be unsatisfactory.
Reforms initiated in 1995 had split the national water and sanitation utility into three entities: SONES (Société Nationale desEaux du Sénégal), a publicly-owned asset-holder, SDE (Sénégalaise des Eaux), a private operator operating under an affermage(lease) contract and a dedicated sanitation office, ONAS (Office National de l’Assainissement du Sénégal). During the first phaseof the reforms, most investments were allocated to water supply; sanitation was somewhat neglected and there was little politicalwill to promote on-site facilities.
OverviewThe Programme Eau à Long Terme began in 2001 with World Bank financing, and one component was the Programd’Assainissement Autonome des Quartiers Périurbains de Dakar (PAQPUD), the first government-led program to support toon-site sanitation. It was overseen by ONAS and implemented by the public works agency AGETIP (Agence d’Exécutiondes Travaux Public contre le Sous-emploi). PAQPUD targeted 33 lower-income urban and semi-urban residential districts,some in Dakar proper and others within Greater Dakar. Targets included 60,000 onsite sanitation facilities; public and schoollatrines for 30,000 people, and settled sewerage systems serving 127,000 people. A range of options were offered includingsinks-plus-soakaways, flush toilets and septic tanks. Masons were paid on completion of a facility and households wererequired to make an up-front contribution, initially set at 50% of hardware costs, but later reduced to 25% due to lowdemand. Credit was offered in the second phase. The cost to householders of the most frequently chosen sanitation option(twin-pit pour-flush latrine plus shower) was about US$185. The subsidy was available to everyone within the project area,provided they paid their up-front contributions.
In eleven districts where on-site sanitation was not viable, due mostly to periodic flooding, the project sewered septic tanks sothat solids remained on-site and the liquid fraction was piped away. This system was well adapted to Dakar since mosthouseholds, even in low-income areas, already had a pour-flush toilet discharging to a septic tank. Over 95% of theconnection cost was subsidized by the project, with householders paying US$14–44 for the connection plus, in many cases,for construction of a new septic tank.
OutcomeBy 2008 366,000 people were served by the project, some 22% of the target peri-urban population. Only 57% of the on-sitefacilities built were for excreta management, however; a large proportion were for grey water disposal.
An independent assessment (Norman et al. 2011) found that, within the intervention areas, many of the poorest householdsdid not benefit. Over 95% of non-beneficiary households in the on-site locations stated that they would have liked to participatebut had not been able to; very few reported that they were not interested. By far the most common reported reason fornon-participation was lack of knowledge of the project; very few said they could not afford to. In the settled seweragedistricts, roughly half did not receive a connection. In this case, nearly 75% of non-beneficiary households stated that theyhad been unable to participate; only 25% said they had not wanted to. The most common reported reasons for not being ableto participate were inability to pay the fee and/or lack of a toilet; being a tenant was also a factor in one district. The factthat most households needed to pay not only the connection fee but also cover the costs of internal connection from theirtoilet to the new septic tank may also have been relevant. The presence of a small number of households who could notaccess sewers because they had no toilet suggests that the project tended to exclude those in greatest need.
Implications for meeting the sanitation needs of the poor, at scaleTargeting only lower-income districts was valuable, and PAQPUD achieved better pro-poor outcomes than many earlier urbansanitation investments in Africa, where new sewerage had mostly benefited better-off households. There is evidently a need,however, to target within districts if projects are to benefit mostly the lowest-income households. In the case of sewerage,this would need to include measures to ensure that the poorest households would actually connect to the system.
Source. Adapted from Trémolet S. with Kolsky P. and Perez E. (2010) Financing On-site Sanitation for the Poor: A Six-CountryComparative Review and Analysis. Water and Sanitation Program; Verspyck R. and Guene O. (2012) Urban SanitationExperiences of Senegal and Burkina Faso, World Bank Report 66827-AFR, February 2012; and Norman G. and Pedley S.(2011) Exploring the negative space: evaluating reasons for the failure of pro-poor targeting in urban sanitation projects.Journal of Water, Sanitation and Hygiene for Development 1(2) 86–101.
Sanitation in urban areas 121

14.4.2 PSAO, OuagadougouContextIn 1992, when this program began, very few sanitation projects had been implemented in Ouagadougou. A sanitation fee leviedon water bills was introduced in 1985 but the proceeds were used to finance various activities not directly linked to sanitationservices. The National Water and Sanitation Agency, ONEA, dealt only with water supply; its sanitation and drainage functionsconflicted with the mandates other public bodies and none was able to deliver their responsibilities effectively. While 70% of thecity population had access to safe water (half via house connections), just under one third had access to improved sanitation, withnearly two thirds using unimproved latrines.
OverviewThe Ouagadougou Strategic Sanitation Plan (PSAO) sought to redress the imbalance between access to water supply and toimproved sanitation in the city. It was founded on the Strategic Sanitation Approach and aimed to provide flexible sanitationsolutions in a participatory, demand-responsive manner. At the start the Government appointed ONEA as the sole agency incharge of urban sanitation and directed that in future the surcharge would be used exclusively for that purpose. ONEA’steam in charge of program implementation was upgraded to a Sanitation Department (DASS).
The PSAO took a long term view and the establishment of sound arrangements, policies and partnerships initially tookprecedence over quantitative targets; this ground work took five years. The program then offered three investment components:
(1) Construction and rehabilitation of latrines, septic tanks and grey water soakaways via promotion, technical advice,artisan training and the provision of hardware subsidies.
(2) Provision of toilet blocks for all primary and secondary schools which needed them, along with a hygieneeducation program.
(3) Construction of a sewer network and wastewater treatment plant serving the downtown business and residential districtsand major industrial sites. This component received support from IDA, AFD and KfW.
The program operated in all city neighborhoods. Promotion was contracted out, initially to a NGO and, later, consulting firms,while works were executed by masons paid by households, with some construction materials provided in-kind. Qualityassurance was assigned to consulting firms. Up until 2006, costs associated with the on-site sanitation were fully recoveredfrom beneficiaries, partly through the surcharge and partly through direct user contributions to construction costs. When newdonor support was agreed in 2006, the hardware subsidy was increased from roughly 18% (for toilets) and 30% (forsoakaways) to 50%; this boosted demand.
OutcomeBy 2009, PSAO had reached 70% of the Ouagadougou population. Overall, it had achieved its objectives though householddemand was not as anticipated: grey water disposal accounted for 68% of on-site installations as compared to 32% fortoilets. The pace of implementation was also slower.
The program progressively built DASS’ technical and operational capacity, aided by the surcharge revenue which covered itsoperational costs.
Implications for meeting the sanitation needs of the poor, at scaleThe sanitation surcharge was widely accepted by urban water customers, whose number increased markedly during the program.The emphasis on on-site services meant that program support went mostly to less affluent neighborhoods, but there were nospecific measures to target the poorest households within those areas. A 1999 household survey found that the percentage ofcivil servants and formal sector employees among the beneficiaries was higher than in the general urban population, whileinformal sector workers and the unemployed were under-represented.
The quality of the technical design of onsite facilities and attention to quality assurance reinforced the credibility andacceptability of the program. Ouagadougou households (and masons) were familiar with latrines and soakaway pits beforethe PSAO, but existing facilities were mostly of substandard quality and functioned poorly.
Source. Adapted from Verspyck R. and Guene O. (2012) Urban Sanitation Experiences of Senegal and Burkina Faso, WorldBank Report 66827-AFR, February 2012.
Sanitation and Hygiene in Africa122

14.4.3 Shared and community toilets in Mukuru, NairobiContextNairobi has a partial sewerage network and Nairobi CityWater and Sewerage Company (NWSC) levies a conservancy charge ondomestic house connections. This does not apply in informal settlements, however, where most residents purchase waterfrom kiosks.
Mukuru is one of the largest slums in Nairobi, with a population of over 250,000. In 2007, Practical Action launched a projectto improve water and sanitation services in three Mukuru neighborhoods with a combined population, most of them tenants, of67,000.
OverviewPractical Action facilitated a partnership between NCWSC, small water enterprises (SWEs) and the community. The utilityconstructed ten new water chambers in the heart of the settlement, enabling SWEs to purchase metered bulk water andon-sell it to households. For sanitation, the project developed three communal sanitation blocks with toilets and washingfacilities, and 15 stand-alone toilets which were small shared facilities each with four seats and a hand washing facilityoutside. A 12.5% community contribution was paid towards capital costs. All toilet facilities were connected to sewers andhad roof-top water tanks. For each toilet block a self-help group was established to site the facility and run it oncecompleted. Each block occupied about 54 square meters, enough space for four houses. This land was provided by thecommunity. Stand-alone toilets occupied only a single house plot and served groups of 5–29 households. They were built bytrained local artisans. Landlords who agreed to build a stand-alone toilet gave up one house plot; each toilet was then sharedby the other households on the block, or between households in two or three adjacent blocks. The project also included ahygiene promotion component targeting young mothers and children.
OutcomeThe project resulted increased the number of toilet seats in the settlements from approximately 150 to 225 seats over 14 months.The stand-alone toilets were particularly popular and affordable and by 2011 four landlords had built their own withoutproject support, and more were planned. In order to connect the new facilities to the main Nairobi sewer network the projecthad laid 950 meters of 225 mm diameter pipe through the settlement. This was a major accomplishment and showed howeffective the project partnership had been – both in getting the support of the landlords and in overcoming the logisticalconstraints of working in such a congested location.
Implications for serving the poor at scaleAfter project support, toilet provision stood at 300 people per seat, still some way short of an acceptable ratio. Space was alimiting factor and some tenants would need to relocate if a better level of provision was to be achieved. Only part of theproject area was covered by sewerage leaving some residents feeling excluded. The capacity of the (very local) main trunksewer was more than adequate, however, to cope with all the wastewater from the three settlements. NCWSC was willing inprinciple to develop the sewer network further, and recognized a responsibility to provide disposal and treatment solutionsfor the informal settlements.
Practical Action considered that communal blocks were not a long term solution for Mukuru, because:
(1) Space was not available to build the number of facilities needed.(2) Entrepreneurs and self-help groups could not afford to build the facilities without external support.(3) Women and children used the communal blocks less than men and tended to revert to open defecation or the use of
‘flying toilets’ due to a combination of inconvenience (where the bock was more than 15 m from the home); lack ofprivacy; security concerns at night; and payment methods (women were less likely than men to pay on a daily basis,though they accepted monthly fees).
(4) There were doubts about the viability of long term management by informal CBOs.
Stand-alone toilets, however, were affordable to landlords without donor support; local artisans could build them to anacceptable standard; were convenient to users; and had low space requirements. Nevertheless, landlords would have had tosacrifice some vacant plots or relocate existing households if the model was to be scaled up.
Adapted from Peal and Evans (2011) Breaking Barriers in Water and Sanitation Service delivery to Informal Settlements,Case Study of the Mukuru Model, Practical Action. Available at: http://practicalaction.org/case-studies-17
Sanitation in urban areas 123

14.5 REFERENCESAMCOW (2011). Pathways to Progress: Transitioning to Country-Led Service Delivery Pathways to Meet Africa’s Water Supply
and Sanitation Targets. AMCOW Country Status Overviews, Regional Synthesis Report. Available at: https://www.wsp.org/sites/wsp.org/files/publications/CSO-Synthesis-Report.pdf (accessed 10 September 2013).
Hawkins P., Blackett I. and Heymans C. (2013). Poor-Inclusive Urban Sanitation: An Overview. Water and Sanitation Program/The WorldBank, Washington DC. Available at: http://www.wsp.org/sites/wsp.org/files/publications/WSP-Poor-Inclusive-Urban-Sanitation-Overview.pdf (accessed 10 September 2013).
Sanitation and Hygiene in Africa124

Chapter 15
What does it take to scale up rural sanitation?
Craig Kullmann and Eddy PerezWater and Sanitation Program
The purpose of this chapter is to share evidence, recent results, and learning regarding experiences in scaling up ruralsanitation programs. Specifically, areas discussed include strengthening the enabling environment, generating demand,and strengthening supply of products and services.
15.1 INTRODUCTION15.1.1 Status and challenges of rural sanitation in AfricaThe most recent Joint Monitoring Program (JMP) statistics show that over the last twenty years Sub-Saharan Africa (SSA) hasnot made any significant progress on rural sanitation. Figure 15.1 shows the current breakdown of sanitation access forthe region.
JMP statistics also show that there are seven countries in the region that account for 59 percent of rural households thatdefecate in the open (see Figure 15.2) Moreover, there are 16 countries that have more than 50 percent of their ruralpopulation defecating in the open. In comparison to urban sanitation statistics it is clear that open defecation is largely arural phenomena with a sizeable percentage of the rural inhabitants practicing open defecation across all wealth quintiles.Given the prevalence of open defecation, behaviour change needs to be a core part of any scaling up rural sanitation program.
Only four countries in SSA are on track to meet the Millenium Development Goal for the sanitation target. The recent secondround of Country Status Overview reports for the region, which assessed the service delivery pathways among 32 countries,found that for rural sanitation 39 percent of the countries have a weak enabling environment and service deliverymechanisms. Another 58 percent have a strengthened enabling environment, but still have some key bottlenecks such asfinancing to local governments that are inhibiting at-scale programming. There is only one country, South Africa that is
23%
12%
30%
35%
Improved (%)
Shared (%)
Other Unimproved (%)
Open Defeca�on (%)
Source: wssinfo.org
Figure 15.1 Rural sanitation access in Sub-Saharan Africa.

considered to have a well functioning enabling environment and have most of the elements of country-led service deliverypathway in place (AMCOW, 2011).
The SSA region has a 161 million people using unimproved and 190 million defecating in the open, which is over 250 millionpeople lacking access to improved sanitation. The lack of priority and investment in sanitation takes a toll on the region’seconomic development. Analysis carried out by the Water and Sanitation Program (WSP) in the Economics of SanitationInitiative, assessed the economic impact of not investing in sanitation among 18 African countries. The studies found thatthese countries lost approximately 1–2.5 percent of their GDP due to poor sanitation, while at the same time most countries’current investments in sanitation is less than 0.1 percent of GDP. Open defecation alone accounted for almost US$2 billionin annual losses in these countries (WSP, 2012a).
Sanitation in SSA is something that governments cannot afford to ignore. Scaling up rural sanitation in the SSA regionrequires immediate attention. The barriers to achieving scale are not insurmountable, and are in fact quite doable toovercome, with proper focus and leadership. The next section discusses the key components for achieving scale inrural sanitation.
15.2 WHAT IT TAKES TO GO TO SCALEExperience from Sub-Saharan Africa, South and Southeast Asia demonstrate that scaling up rural sanitation programs ispossible. In the past few decades, there are success stories in low-income countries, as in Bangladesh which has drasticallyreduced the levels of open defecation in rural areas from 40 to 5 percent of households over a 20 year period. Othercountries such as Sri Lanka and Thailand, which have migrated from low-income to middle income status, have almostachieved universal coverage in rural areas by investing early on in sanitation and putting in place the right components toscale up rural sanitation programs.
The experience from these countries along with others in SSA demonstrate that there are commonalities (WSP, 2012b),between these success stories that can serve as a roadmap for others to scale up sanitation programs in rural areas. Toachieve scale and sustained use of household toilets, there are four components (Figure 15.3) that require governments anddevelopment partners’ attention:
Strengthening the enabling environment, to facilitate working at scale and implementing sustainable rural sanitation programs;Generating demand for improved sanitation, local government agencies in particular need to be trained in demand creation suchas CLTS activities, behaviour change communication, and aspects of sanitation marketing;
Strengthening the supply of products and services, in particularly building the capacity of local builders, manufacturers, andsuppliers of sanitation products and services. Sanitation marketing strategies help to expand consumer awareness ofproduct options and costs, strengthen business skills, and improve the design, availability, and affordability of sanitationproducts and services; and
Learning from implementation, about what does and does not work and sharing that learning among stakeholders.
Ethiopia, 36,639
Nigeria, 24,652
Sudan, 15,391
Niger, 11,701
Burkina Faso, 9,301Mozambique, 8,352
Madagascar, 6,507
Other SSA Countries, 76,133
Source: wssinfo.org
Figure 15.2 Rural population defecating in the open in SSA (millions).
Sanitation and Hygiene in Africa126

15.2.1 The enabling environment1
This section summarizes key dimensions to the enabling environment that are critical to working at scale and implementingsustainable rural sanitation programs. For the purposes of this chapter, discussion on generating demand and strengtheningsupply will fall under the sub-section of Program Methodology under the enabling environment.
Policy, strategy, and direction. Policy is the ‘set of procedures, rules, and allocation mechanisms that provide the basis forprograms and services. Policies set the priorities and often determine the allocation of resources for implementation. Policiesare reflected in laws and regulations, economic incentives, and the assignment of rights and responsibilities for programimplementation.’ (Elledge et al. 2002). Establishing a shared vision and strategy among stakeholders and securing thepolitical will to implement them is the first step in scaling up sanitation.
Institutional arrangements. Before program methodologies such as CLTS and sanitation marketing can be scaled up,institutional arrangements must be in place, and all key roles and functions covered. Institutions at all levels must understandtheir roles, responsibilities, and authorities, and they must have the resources to carry out these roles.
There is a considerable global body of evidence that a clear institutional home for sanitation is critical for success. In SriLanka and Thailand, for example, the sanitation mandate clearly falls with Ministry of Health, which developed the capacityof staff and community health volunteers to address rural sanitation (Luong et al. 2000; Das Gupta et al. 2009). Severaldecades of investment by their ministries of health enabled the sanitation sectors to develop in these countries well beforethey graduated to middle income countries. In Bangladesh, the Ministry of Local Government, Rural Development andCooperatives provided leadership for their Total Sanitation Campaign. The evidence suggests that so long as sanitation has aclear home and strong leadership it can be located in one of several ministries. However, since most of the costs of poorsanitation are related to health, a stronger engagement by ministries of health is sensible (Bartram & Cairncross, 2010;WaterAid, 2011).
Program methodology. CLTS and sanitation marketing are complementary programmatic approaches to scaling up sanitation,but they are not detailed programmethodologies. A methodology consists of rules, specific activities, and these activities’ timingand sequence. Each country must develop a methodology that is specific and appropriate to its context and covers all phases ofimplementation, including demand creation.
Implementation capacity. Institutions at all levels – including government staff and contracted organizations – must haveadequate human resources with the full range of skills required to perform their functions; an ‘organizational home’ withinthe institution overseeing the program; systems and procedures required for implementation; and the ability to monitoreffectiveness and make adjustments.
StrengthenEnabling
Environment
GenerateDemand forImprovedSanitation
StrengthenSupply
Learning andKnowledge
Figure 15.3 Success factors in scaling up rural.
1The section is developed from (WSP, 2012b).
What does it take to scale up rural sanitation? 127

Capacity building to scale up rural sanitation programs entails more than just training staff and volunteers on technical skillssuch as PHAST, CLTS, or sanitation marketing, but also how to adequately plan, budget, monitor, coordinate, andmanage a hostof activities at various levels of government. A capacity building strategy that articulates the range of skills that need to be built,how capacity building will take place, and how much it will cost is key part of planning an at-scale program.
For a more in-depth discussion on role of local governments and building their capacity in wider range of skills, refer toBuilding the Capacity of Local Governments to Scale-Up Community Led Total Sanitation and Sanitation Marketing inRural Areas – WSP 2010, and also What Does it Take to Scale Up Rural Sanitation – WSP 2012.
Availability of products and services. A key element of an at-scale sanitation program is the existence of a robust local privatesector that meets the needs of the rural poor with consumer-responsive and affordable sanitation products and services, wherehousehold demand is determined through formative research.
Financing and incentives. Financing costs include social mobilization such as training, staff salaries, transportation, officeequipment and supplies, and the development of BCC materials. In addition, programs must establish mechanisms thatenable communities to achieve total sanitation and ensure that individual households – including the poorest – can pay foron-site sanitation facilities.
Public expenditure on rural sanitation is dedicated to areas such as demand creation, capacity building, supervision,monitoring, strengthening the supply of products and services, and community reward systems. For more informationregarding financing options see WSP publication Financing On-site Sanitation for the Poor.
Cost-effective implementation. The potentially high costs of social intermediation at scale make cost-effective implementationa key element. To assess the approach’s cost-effectiveness and determine how best to achieve economies of scale, cost data mustbe collected throughout the implementation.
Monitoring and evaluation. A large-scale sustainable sanitation program requires regular performance monitoring and, andwillingness and ability to use the monitoring process to make adjustments to improve and strengthen the program. Overallmonitoring responsibility must be at the highest government level of the program but must be based on information collectedat the community level and channeled through the local-government or district level.
15.2.2 Country examples of going to scaleThe next section illustrates two concrete examples from Sub-Saharan African countries – Tanzania and Benin – on howimprovements in the dimensions of their enabling environment framework has helped them move on a path to scale up ruralsanitation. In the examples provided below, the service delivery model is through the regional and local government, theaccepted way to reach scale in a sustainable manner.
15.2.3 Tanzania – at scale rural sanitation programmingPolicy, strategy, and directionIn 2007, WSP conducted a baseline assessment of the enabling environment to understand the barriers and opportunities tohelp the Government of Tanzania and its development partners scale up access to sanitation in rural areas. The assessmentfound that a national policy and strategy for rural sanitation was needed and that sector coordination was poor.
Over three years development partners2 worked closely together with the government to strengthen sector coordination.In 2010, a follow up assessment was conducted, which found that improved coordination helped facilitate sector ownershipof a Memorandum of Understanding (MoU) between line ministries responsible for sanitation, and the establishment oftechnical working groups. This coordination and common vision enabled drafting of a national sanitation and hygiene policy(WSP, 2011a).
In turn, the draft national sanitation and hygiene policy influenced the Government of Tanzania’s National Strategy forGrowth and Reduction of Poverty II 2010–2014 (MKUKUTA-2). The MKUKUTA-2 strategy is the government’s firstofficial document to recalculate rural coverage that mirrors the statistics reported by the JMP and include definitions ofimproved sanitation that are aligned with the draft sanitation and hygiene policy. Having a consensus around actual coveragestatistics is a major step forward, and the inclusion of the revised targets in MKUKUTA-2 provides a clear roadmap of whatneeds to be achieved in the sector (WSP, 2011a). With these improvements in the enabling environment, the Ministry
2UNICEF, WaterAid, GTZ, SNV and WSP.
Sanitation and Hygiene in Africa128

of Health and Social Welfare (MoHSW) in coordination with the other line ministries responsible for sanitation have developed astrategic vision to implement a National Sanitation Campaign to increase access to sanitation in rural areas. The governmentlaunched the campaign in 2011 and plans to cover 132 districts.
Institutional arrangementsThe Government of Tanzania with its development partners formed the Water Sector Development Program (WSDP in 2006,which is the main financing vehicle for public investment in water supply and sanitation. In 2010, responsibility for sanitationwithin the WSDP shifted from the Ministry of Water and Irrigation (MoWI) to the Ministry of Health and Social Welfare(MoHSW) to manage and implement a National Sanitation Campaign. The shift in responsibility was coupled by the signingof a Memorandum of Understanding between the MoHSW, MoWI, Ministry of Education and Vocational Training, and thePrime Minister’s Office of Regional and Local Government that articulates the roles and responsibilities of each ministry forsanitation. The MoU is not legally binding, but is has helped strengthen collaboration and cooperation between lineministries and development partners, which will be key in the implementation of the National Sanitation Campaign. Thecampaign will managed by the MoHSW and require close collaboration with the other line ministries (WSP, 2011a).
Program methodologyOver the last few years there has been significant progress made in developing a coherent programmatic approach in Tanzaniathat is accepted by key stakeholders. Previously, the sector was fractured and the government was using Participatory Hygieneand Sanitation Transformation (PHAST) as the main approach to improve sanitation and hygiene. Also, the approaches ofCommunity Led Total Sanitation (CLTS) and sanitation marketing were not well known or used in Tanzania. Thegovernment and stakeholders have reached consensus through joint review processes and dialogue that CLTS and sanitationmarketing approaches are simple, cost-effective, scalable, and should be the basis for the government’s National SanitationCampaign (WSP, 2011a).
The combined approach of using CLTS and sanitation marketing has been scaled up in 10 districts through localgovernments, and will be rolled out nationally through the government’s campaign. In the ten districts, district Water andSanitation Teams were trained in the approach and have taken a lead in training community volunteers to carry outbehaviour change activities. These interpersonal behaviour change activities were supported through messages broadcast viaradio and direct consumer contact events. Behaviour change messages were developed and based on formative research. Theformative research also led to product development of the sanplat as a cheaper and more viable option for poor families.Initially, supply side strengthening activities focused on training masons, but resource constraints of local masons hasprompted government and development partners to find ways to work more closely with local hardware stores and link themto masons since they are more likely to have access to capital (WSP, 2012b).
Implementation capacityIn scaling up community led total sanitation and sanitation marketing in the 10 districts, WSP supported the government byhiring and training local resource agencies who in turn trained local government (district) Water and Sanitation Teams on arange of activities. With initial support from the resource agencies district governments then went on to train village levelfacilitators in community led total sanitation. Resource agencies worked with district governments to identify and train localmasons to strengthen the supply of sanitation products and services.
As mentioned above, training masons at local level did not result in the intended outcomes. Often masons were not able tomeet demand because they did not have the upfront capital to invest in materials and supplies. Additionally, a sizeable portion ofthe masons that were initially trained became inactive or went on to use their skills in other construction fields. The learning fromthis experience has led the government and development partners to engage more with the sanitation supply chain and find waysto link masons with local hardware stores.
FinancingIn many places such as Tanzania, governments are adopting a no-subsidy policy for on-site sanitation. In these contexts,households are a the main financier of capital investment in their sanitation facility.
As previously mentioned, WSDP is the main vehicle to finance water supply and sanitation in Tanzania. The government isallocating $20 million USD to the National Sanitation Campaign, and cover 132 districts. This equates to approximately USD$100,000 per district over three years to reach two million households with improved access to sanitation. This financing will
What does it take to scale up rural sanitation? 129

cover costs for social mobilization such as training, staff salaries, transportation, office equipment and supplies, and thedevelopment of BCC materials.
Additional program financing – approximately $4 million USD – specifically for sanitation and hygiene is projected tocome from the Global Sanitation Fund (GSF). This financing will support total sanitation and sanitation marketing activitiesin select districts and also support enabling environment activities strengthening the National Sanitation Campaign(WSP, 2011a).
Availability of products and toolsIn Tanzania, formative research was carried out to better understand the target audience. This research resulted in evidence basednon-health related communication messages and tools such as pictorial cards used in interpersonal communication or radioadvertisements. Research around product development also resulted in the promotion of a sanitation platform that is, sanplat.In Tanzania, this is a 2 ft × 2 ft. concrete slab that is retrofitted to an earthen slab and costs about USD $5.
Monitoring and resultsOut of all the components of the enabling environment monitoring and evaluation remains one of the biggest challenges in theTanzania context. In the 10 districts where community led total sanitation and sanitation marketing had been implemented atscale significant effort was given to build on existing paper based government monitoring systems; however, even with theseefforts it is not clear that this system is viable at a national scale. This is an area that government and development partnerscontinue to explore and work on. Programming results from these 10 districts are estimated to have reached 270,000 peoplewith improved sanitation and over 130 open defecation communities as June 2011.
15.2.4 Benin – national scale up of rural sanitationPolicy, strategy, and directionSimilar to Tanzania, Benin hosts a favorable policy environment that emphasizes demand responsive approaches, decentralizeddecision making, zero subsidies for latrines, private sector participation, low cost technologies, and the government’s role as acoordinator and regulator. The government’s policy has been in place since 1990 and a sector strategy was developed in 1994.Box 15.1 articulates four key principals from Benin’s National Water Supply and Sanitation Sector Development Strategy(NWSSSDS) (WSP, 2011b). The government’s policy and strategy are considered to be enabling factors that allowed forscaling up of Benin’s National Program for Hygiene and Sanitation.
Institutional arrangementAs in Tanzania, the Ministry of Health (MoH) is the lead of institution for rural sanitation in Benin. Within the MoH, theDirectorate for Hygiene and Basic Sanitation has championed sanitation marketing to help scale up access to ruralhouseholds. The MoH at the national level provides leadership and strategic direction to the sub-sector. They also take thelead in the development and provision of promotional and training materials, and are responsible for other functions such asmonitoring, evaluation, reporting and budgeting. Other key stakeholders are regional governments who provide leadership atthe local level and train a cadre of volunteer hygiene promoters and local masons at the village level. They are also
BOX 15.1 PRINCIPLES FOR BENIN SCALING UP RURAL SANITATION
(1) Decentralize decision making process to the community level (allowing households to make informed decisions abouttheir water and sanitation infrastructure)
(2) Community contribution to initial capital investment and full contribution to cost recovery of infrastructure withhouseholds responsible for the full costs of their sanitation facilities
(3) Prioritize efforts to reduce the costs of technologies, both capital investment and maintenance costs(4) Development of the national and local private sector as primary actor responsible for supplying water and sanitation
goods and services, along with systematic hygiene promotion in all rural water supply and sanitation programs.
Source: Experiences from Rural Benin: Sanitation Marketing at Scale.
Sanitation and Hygiene in Africa130

responsible for program monitoring and quality assurance of latrine construction. While not a paid function, village volunteerhygiene promoters are an extension of the MoH, and are supported by MoH staff at the regional level, and carry outcommunity-based sanitation promotional activities. These volunteers also monitor latrine construction, and householdhygiene behaviour (WSP, 2011b).
Program methodologyThe programmatic approach in Benin has evolved over time incorporating lessons learned from the government’s fieldexperience to refine and improve the approach. As part of the interpersonal communication strategy, PHAST is used tostimulate demand for sanitation and also improve hygiene practices. From 1998–1999, the government piloted sanitationmarketing as a complimentary approach to PHAST, and from 2000–2002, they worked on a strategy to combine thetwo approaches. In 2005, they launched their combined approach in 5 departments and have subsequently scaled up toall 11 departments. The approach uses a community volunteer base system to interact with households over a period of18 months.
During this cycle, volunteers carry out sanitation and hygiene promotion through community meetings and household visits.Messages delivered through community volunteers are supported by local radio advertisements. The sanitation marketingcomponent focused on the development of cheaper products such as the sanplat, and trained local entrepreneurs on latrineconstruction and basic marketing and sales techniques. These local service providers were also promoted through massmedia and direct consumer contact events. The government’s willingness to experiment, learn from new approaches such assanitation marketing, and ultimately harmonize their approach with their national policy and strategy allowed them to scaleup a more effective and sustainable programmatic approach.
Implementation CapacityThe government of Benin used a cascade training approach and began with training the local government hygiene agents(two per district) and local NGOs – where local government hygiene agents were not available – who in turn trainedlocal masons and local health volunteers at the village level. Once local volunteers were trained, it was the responsibilityof the Hygiene Agents to provide supervision and follow up. The training of local masons was intended to develop anetwork of providers.
FinancingThe government is committed to investing in rural sanitation by budgeting and planning programs according to its developmentobjectives. It has sustained its budgetary commitments, and has received continued support from donors to fulfill its developmentobjectives for rural sanitation. The government has made a significant financial investment to build the capacity of humanresources to implement its rural sanitation and hygiene program at all levels of government down to the community and theprivate sector (Kpinsoton & Jenkin, 2011).
Availability of products and toolsAs in Tanzania, the Government of Benin carried out formative research early on to better understand behaviours around latrineuse, preferences for different types of sanitation products. The research resulted in evidence based non-health relatedcommunication messages highlighting the advantages of using a latrine and the disadvantages of defecating in the open. Thisresearch led to the development of tools such as pictorial cards used in interpersonal communication or radio advertisements.Also, as a result of the research, a sanplat that covers the entire pit was promoted and the minimum investment byhouseholds to improve their latrine was USD $60 (WSP, 2011b).
Monitoring and resultsThrough sanitation promotional activities, local promotion volunteers develop community maps showing all households in acommunity and whether they have a latrine or not. These maps provide a baseline of latrine coverage and allow ongoingmonitoring. When a household starts new construction or completes construction of a latrine the promotion volunteerindicates it on the community map. After the 18 month promotional cycle is finished, local government officials conductan evaluation to measure changes in latrine coverage (WSP, 2011b). Between 2005 and 2009, Benin’s rural sanitationprogram helped increase access to over 18,000 households in over 2000 localities (WSP, 2011b).
What does it take to scale up rural sanitation? 131

15.3 CONCLUSIONSMuch has been learned over the last serveral years on how to design and implement large-scale sustainable rural sanitationprograms; how to promote systematic policy and institutional reform; how to strengthen stakeholders’ support for at-scaleservice delivery; and how to develop and support affordable financing strategies that are effective in reaching the poor.
The key take away message is that in order to accelerate progress in increasing access to improved sanitation in ruralSub-Saharan Africa, governments need learn from one another and share experiences on creating an enabling environmentthat will support large scale sustainable programs. Countries need to analyze their enabling environments to understand thebottlenecks of progress. Only when those impediments are identified can a government take action on each of thedimensions of the enabling environment. Real progress can be made as demonstrated by Tanzania, Benin, and othercountries outside of Sub-Saharan Africa. To accomplish this, is not a question of a country’s ability to do it, but rather isquestion of their will to do it. Based on economic analysis, sanitation is a smart investment and by ignoring the issue willonly continue to be a drag on a country’s economic development.
15.4 WHAT DO WE STILL NEED TO KNOW?The examples from Tanzania and Benin show that scaling up rural sanitation programs is possible, and putting in motion thelevers of change takes time and commitment. Nevertheless, these two examples along with others from outside the regiondemonstrate that there are solutions to addressing SSA’s problem of low access to sanitation in rural areas.
Experience from these examples also shows that there is more to be learned as governments and development partners moveforward. Some of these areas include:
• What resources will it take to strengthen the 39 percent of SSA countries with a weak enabling environment to point wherethey are in a position to scale up rural sanitation?
• What evidence or advocacy will it take to influence line ministries and Ministries of Finance to allocate more resources torural sanitation programming?
• What are the key political economy factors that inhibiting progress in countries where the enabling environment is weak,but also those that are in transition to improving?
• What are the key constraints in sanitation supply chain for rural sanitation and how can we capitalize on national ormulti-national companies that may be interested in sanitation?
15.5 REFERENCESAMCOW (2011). Pathways to Progress: Transitioning to Country-Led Service Delivery Pathways to Meet Africa's Water Supply and
Sanitation Targets. AMCOW Country Status Overviews, Regional Synthesis Report. Available at: https://www.wsp.org/sites/wsp.org/files/publications/CSO-Synthesis-Report.pdf (accessed 10 September 2013).
Bartram J. and Cairncross S. (2010). Hygiene, sanitation, and water: forgotten foundations of health. PLoS Med 7(11), e1000367. doi:10.1371/journal.pmed.1000367
Das Gupta M. and Gostin L. (2009). How can donors help build global public goods in health? World Bank Policy Paper.Elledge M., Rosensweig F. and Warner D. (2002). Guidelines for the Assessment of National Sanitation Policies, EHP Strategic Report 2.Kpinsoton G. and Jenkin M. (2011). National Scale up of Rural Sanitation in Benin: Adapting Sanitation Marketing in an African Context.
Africasan 3 Prensentation.Luong T., Chanacharnmongkol O. and Thatsanatheb T. (2000). Universal Sanitation – Thailand Experiences. 26th WEDC Conference.
Available at: http://wedc.lboro.ac.uk/resources/conference/26/Luong.pdf (accessed 10 September 2013).WaterAid (2011). The Sanitation Problem: What Can and Should the Health Sector do? Available at: http://www.wateraid.
org/∼/media/Publications/sanitation-problem-health-sector.pdf (accessed 10 September 2013).WSP (2011a). Enabling Environment Assessment – Tanzania. Available at: http://www.wsp.org/sites/wsp.org/files/publications/WSP-
Tanzania-Enabling-Environment-Endline.pdf (accessed 10 September 2013).WSP (2011b). Experiences from Rural Benin: Sanitation Marketing at Scale. Available at: http://www.wsp.org/sites/wsp.
org/files/publications/wsp-benin-sanitation-marketing.pdf (accessed 10 September 2013).WSP (2012a). Economic Impacts of Poor Sanitation in Africa – Fact Sheet. Available at: http://www.wsp.org/sites/wsp.
org/files/features/ESI-Factsheet-Africa.pdf (accessed 10 September 2013).WSP (2012b). What Does it Take to Scale Up Rural Sanitation. Available at: http://www.wsp.org/sites/wsp.org/files/publications/WSP-
What-does-it-take-to-scale-up-rural-sanitation.pdf (accessed 10 September 2013).
Sanitation and Hygiene in Africa132

Chapter 16
CLTS in Africa: Trajectories, challengesand moving to scale
Petra BongartzCLTS/IDS
At AfricaSan 3 in Kigali it was clear that in short three years since the last AfricaSan conference, and in only five yearssince its initial rollout in Africa, Community-led Total Sanitation (CLTS) had spread and diversified to become moreembedded in Africa than in any other region. This chapter looks at the progress and maturing of CLTS in Africa. Itintroduces innovations and adaptations, poses questions and challenges and suggests possible ways forward as CLTSgoes to scale on the continent.
16.1 A NEW ERACommunity-led Total Sanitation (CLTS) was seeded in Africa in a hands-on training workshop facilitated by Kamal Karnear Dar es Salaam in early 2007. Plan International, which had convened the workshop then spearheaded its initial spreadin six countries. Over the five years since 2007, Kamal Kar has made many further visits to Africa to promote CLTS andconduct hands-on trainings and many African trainers have become active. The adoption and spread of CLTS has been littleshort of spectacular. As of mid-2012, UNICEF estimates suggest that close to ten million people are living in communitiesthat have been declared open defecation free (ODF) in Africa. This has happened in the context of an enabling environmentwhich has been strengthened by the recognition, approval and support of CLTS by governments and external agencies. Moreattention has been given to sanitation policy and budget issues thanks to the International Year of Sanitation in 2008 and theeThekwini Declaration at AfricaSan+ 5, has helped increase the profile of the sector and explicitly includes indicatorsrelated to national coordination, monitoring and evaluation and community-led approaches.
At least seventeen African countries have made CLTS central to their national rural sanitation policies – Ethiopia, Eritrea,Kenya, Malawi, Mali, Mauritania, Sierra Leone, Zambia, Togo, Nigeria, Niger, Liberia, Guinea Conakry, Ghana, Gambiaand Cameroon. National, sub-national and district level working groups are overseeing the implementation of CLTS.Some governments have set ambitious targets for making their rural areas ODF, for example Northern Ghana by 2012,Kenya 2013, Ethiopia, Mauritania and Zambia 2015, Malawi 2016 and Madagascar 2018. They have adopted the policy ofno household hardware subsidy which is a critical condition for the rapid spread of CLTS. Governments have made lendersand donors remove these subsidies from their project proposals: Ghana did this with the World Bank, Chad with theEuropean Union, and Nigeria and Mauritania with the African Development Bank. UNICEF, WSP, bilateral donors, andNGOs such as Plan, SNV and Engineers Without Borders (EWB) have recognised the power and potential of CLTS andsupported and promoted its spread. Increasingly, CLTS has become a continent-wide movement, ushering in a new era forrural sanitation.
Nevertheless, many challenges and questions remain, for example concerning appropriate follow up after triggering,monitoring and evaluation, sustainability, equity and the interface and interaction between CLTS and other approaches suchas sanitation marketing. Perhaps the most important overarching question for CLTS remains how to go to scale with quality.

16.2 WHAT WE HAVE LEARNED: CHALLENGES AND KEY ELEMENTS OF SUCCESS16.2.1 Government leadershipGovernments have become key actors in CLTS. Whether it’s the endorsement of CLTS as national sanitation policy, nationalODF campaigns, or the integration of CLTS into the responsibilities of local government staff, health extension workers and soon, advocacy efforts to gain buy-in from government have clearly paid off. Undeniably, CLTS can only be sustainable andscalable if government is at the centre, but government involvement and leadership in sanitation does not comewithout challenges.
Whilst integrating CLTS with existing government systems and the ongoing work of local government staff seem like anobvious way to ensure wide reach, sustainability and flow of data to national levels, there are questions about whether theseprofessionals are always the right people to take on CLTS responsibilities, especially where training and triggering areconcerned. Are they equipped with the right skills and do they have the capacity and time to do CLTS justice alongside their(often) many other responsibilities? Does CLTS come naturally to them, that is, are they able to adopt the role of the devil’sadvocate, talk freely about shit and avoid falling into a teaching role? Can they ‘sing and dance’, as Kamal Kar describes thequalities of a good CLTS facilitator? It is clear that government can’t ‘do’ CLTS on its own but needs support, coaching,capacity-building and networking with others (for more on this topic see Raeside (2010) and Soublière (2010)).
16.2.2 Networking, partnerships and peer supportIn recognition of these challenges, innovative support systems and peer-to-peer learning have been set up to assist governmentstaff at all levels. In most countries, there are national WASH groups or ODF Taskforces through which different stakeholderswork jointly and coordinate their activities better. In Kenya, district level reflection and learning workshops support continuousreflection, peer-learning and finding solutions jointly with involvement of all stakeholders (government, NGOs, INGOs andothers), in particular with the view of improving follow up after triggering and sustainability. In Malawi, Engineers WithoutBorders, Canada staff have set up an innovative model for peer support and sharing of experiences. EWB staff partner withpeople from the bottom to the top of the water and sanitation sector to create stronger learning and coordination linkagesbetween stakeholders who tend to work in isolation; innovate feasible solutions to deal with challenges of programmecapacity or staff motivation; and facilitate leadership development among key leaders throughout the water and sanitationsector (to read more about this, see Raeside (2010)). On an international level, IDS continues to engage in networking viathe CLTS website www.communityledtotalsanitation.org, its bi-monthly e-newsletter with over 3000 subscribers and sharingand learning as well as thematic workshops that bring together practitioners to exchange experiences, discuss challenges andshare innovations and ideas, make linkages and support each other.
16.2.3 Supporting champions at all levelsChampions at all levels are crucial to successful spread and sustainability. Natural Leaders, those who emerge duringtriggering and have the passion and commitment to take the lead in implementing action plans towards ODF in theircommunities, play a critical role. Champions and natural leaders at all levels need to be recognised, identified andencouraged and enabled to have maximum influence. For this, support mechanisms as well as ways of sustaining theirinterest and motivation are needed.
In Ethiopia, the work of Natural Leaders has been professionalised through forming a legal entity and enterprise, the NaturalLeader’s Association which can access funding and loans and aims to address issues of sustainability by improving themovement up the sanitation ladder in ODF kebeles. The Association focuses on sanitation and hygiene promotion, demandcreation and the production and supply of sanitation hardware such as slabs in accordance with community demand (Tunsisaand Beyene (2012). In Homa Bay, Kenya, a Natural Leader’s Forum convenes Natural Leaders from triggered villages toreflect together on the status of CLTS implementation in the district, discuss their challenges and agree on ways forward.This has had the effect of ‘energizing them to rededicate themselves to their mission’ (Otieno (2011). In Sierra Leone, aTraining Manual (http://www.communityledtotalsanitation.org/resource/clts-training-manual-natural-leaders), designed bythe Ministry of Health and Sanitation (MoHS), UNICEF and GOAL, helps support Natural Leaders during thepre-triggering, triggering and follow-up of CLTS communities and regular trainings are being held to build the capacity ofNLs. Plan Sierra Leone uses rewards and incentives in various forms, from Natural Leaders being recognised by name atODF ceremonies to distribution of bicycles to make them more mobile and increase their reach. There are debates aboutwhether incentives in the form of rewards are a good way to motivate Natural Leaders. Reward and incentives schemes maybe counter-productive and unsustainable in the long term. The best way forward will depend on the local context.
Sanitation and Hygiene in Africa134

Alternative ways of motivating champions and natural leaders, e.g. through capacity development, cross visits, trainings,recognition, exposure, mentoring and coaching, should also be considered.
16.2.4 Follow-up, monitoring, verification and certificationNational policies and ODF campaigns raise issues around the reliability of data. Will ambitious targets lead to false reportingand act against sustainability? Over-reporting of achievements is a risk. There is an urgent need for practical realism asRobert Chambers argues (2011) – a need to balance aiming at high targets with feasibility. An indicator of honest reliabledata is that a substantial number of communities fail when they first apply for ODF verification. However, this means notpunishing failure but providing encouragement and support to address problems. It is important that communities strive tomeet ODF criteria not because an external agency tells them to, but because they recognise the value and benefit of ashit-free environment.
• Verification, certification and monitoring at scale pose many challenges:• How can monitoring by communities and local level staff provide realistic and comparable data for monitoring, analysis
and subsequent appropriate follow up action higher up in the system?• Who is best placed to conduct verification in order for the data to be credible?• What reporting systems can capture sustainable ODF status of communities rather than once again reverting to counting
latrines built?• The increasing speed of CLTS means that it can be challenging for verification and certification to keep up with
communities’ claims to be ODF, so human resource capacity needs to be factored into the equation from the start.
Some promising models for verification are already in use. In Côte d’Ivoire, exchange verification missions are used betweenthe two regions (Bouaké and Tiassalé) where CLTS is being implemented, making verification more objective and aidinginter-regional learning. The teams include members from the government, NGOs, local authorities and communityrepresentatives and teams assess communities according to a set of criteria. In Malawi, verification is also being conductedjointly by community leaders, district representatives, and NGOs working in the area. The Government of Malawi’s strategyoutlines two levels of verification criteria: ODF, meaning every household uses a latrine with privacy, there is no shit in thebush (100 percent latrine coverage, sharing is acceptable) and ODF++ for which every household has a latrine with coverand handwashing facility (100 percent coverage, sharing is acceptable); all religious institutions, market centres and healthcentres in the catchment area have latrines with covers and hand washing facilities (100 percent coverage). Similarly, inEthiopia, the Ministry of Health has developed a verification protocol that is being used by all stakeholders, so thatstandardised indicators are applied across the board. First, there is self-verification at village level, then verification at kebele(smallest administrative unit) level, followed by verification and certification by district staff and finally ODF celebrations inthe community. In Kenya, third party verification is being used and large-scale verifications have been conducted by theNGO KWAHO in Nyanza and Western Provinces. Verification criteria included latrine coverage, existence of handwashingfacilities and dish racks. A large percentage of villages (54 percent) were failed, but the process had a positive orientation,calling on evaluators to be ‘watchdogs not bloodhounds’. KWAHO reported that ‘[t]he most critical aspect of thecertification exercise was to encourage and celebrate sanitation progress and innovations attained by various communities.Even when the village had not attained ODF status it was our mandate to encourage the natural leaders, the CLTS teamstowards attaining ODF status. The approach also encompassed appreciative inquiry in to the way forward for thosecommunities that had not attained ODF status.’ (2011: 7).
It is hoped that more learning around these issues will emerge from an international workshop due to take place in Malawilater this year (August 2012) as well as from IRC’s proposed symposium on monitoring sustainable WASH service delivery inEthiopia in April 2013.
16.2.5 Reflection, documentation, sharing and learning, researchStrengthening the evidence base for CLTS continues to be crucial. Continuous reflection, documentation, learning and sharingactivities are needed. With the fast rate of development and transformation that CLTS has seen in Africa, much of the territoryahead is unknown and this makes rapid ‘learning whilst doing’ an imperative. This ‘action learning’ takes many forms, but thevital ingredients are honesty, transparency and flexibility: recognising what does or doesn’t work, admitting failure, adjustingplans, being open to change, and learning from the innovations and successes of others in similar situations. This also hasimplications for institutional ways of working- there is still some way to go in changing institutional attitudes so that
CLTS in Africa: Trajectories, challenges and moving to scale 135

reflection, documentation, sharing and learning become central to implementation and are not seen as add-ons or extra-curricularactivities. Many good initiatives are already taking place in this area:
• International workshops that bring together CLTS practitioners from governments, NGOs and agencies andfacilitate cross-country and cross-organisational learning (e.g., the CLTS in Africa workshops in Mombasa in 2009(Bongartz 2009), Lusaka in 2010 (see Lusaka Declaration (2010)) and Bamako (see Bamako Consensus (2010)) andthe workshop on scaling up at Lukenya in 2011 (see Lukenya Notes (2011)), organised by IDS in collaboration withothers).
• Regional and international conferences such as AfricaSan, the annual Stockholm World Water Week, the World ToiletSummit due to be held in Durban in December 2012.
• The CLTS website www.communityledtotalsanitation.org, which aims to be a global hub for CLTS, connecting thenetwork of practitioners, communities, NGOs, agencies, researchers, governments, donors and others involved orinterested in CLTS and a space for sharing and learning on CLTS across organisations, countries and sectors.
• In country peer-to-peer sharing initiatives, national taskforces and WATSAN groups.• CLTS Newsletters such as the Malawian S.H.I.T.S. (http://www.communityledtotalsanitation.org/resource/
shits-sharing-highlights-total-sanitation), the Kenyan S.S.H.I.T. (http://www.communityledtotalsanitation.org/resource/shared-sanitation-hygiene-information-and-tales-sshit-kenyas-monthly-clts-newsletter), UNICEF SierraLeone’s Quarterly WASH report (http://www.communityledtotalsanitation.org/resource/quarterly-wash-report-unicef-sierra-leone) and Plan Ethiopia’s quarterly newsletters (http://www.communityledtotalsanitation.org/resource/wash-acsearch-newsletter).
• Emerging national CLTS websites, for example, in Kenya.• Exchange visits between different districts within countries, between different countries and between regions.
Supporting the ongoing enquiry into what works best and how to achieve scale with quality and sustainability, are a number ofresearch, action learning and implementation projects, for example:
• Plan’s Pan African project Empowering self-help sanitation of rural and peri-urban communities and schools in Africa(2009 to 2014) which aims to improve sanitation and hygiene practices in rural communities in eight African countries(Ethiopia, Ghana, Kenya, Malawi, Niger, Sierra Leone, Uganda, Zambia) through CLTS as well as urban CLTSand School-led Total Sanitation (SLTS). For more information see http://www.communityledtotalsanitation.org/country/pan-africa.
• The ODF sustainability study conducted by Plan Australia, Plan UK and Plan Netherlands in Ethiopia, Kenya, SierraLeone and Uganda.
• The Gates-funded 3-country Plan project Testing modified CLTS for scalability led by Plan USA and the Universityof North Carolina, Chapel Hill which looks at improving the cost-effectiveness and scalability of the CLTSapproach through increased engagement of local actors in Kenya, Ghana and Ethiopia (See http://www.planusa.org/content2675015).
The impact evaluation of CLTS being carried out in Mali by the Center for Distributive, Labor and Social Studies (CEDLAS) ofArgentina (Universidad Nacional de La Plata) in collaboration with UNICEF and the PEP Research Network and funded by theBill & Melinda Gates Foundation.
16.3 INNOVATIONS: UCLTS, NEW TECHNOLOGIES AND SLTS16.3.1 Urban CLTSCLTS has not just spread into new geographical areas, but also been applied in new settings such as the urban and peri-urbancontext and in schools (Figure 16.1).
In June 2010, Plan Kenya, together with a CBO called Community Cleaning Services (CCS) initiated an exciting pilottrialling an urban form of CLTS in Mathare 10, an informal settlement in Nairobi (see Musyoki (2010) for the beginnings ofthis pilot). There are of course major differences between the rural and the urban setting. Communities are moreheterogeneous, urban dwellers are more transient, there are issues relating to limited space, tenancy arrangements andpit-emptying, particularly in urban slums. In recognition of this, urban CLTS (UCLTS) has not been about conductingconventional triggering in cities or about people digging pits or erecting structures (the city bylaws would not permit this).
Sanitation and Hygiene in Africa136

Instead, it has focused onmobilising citizens to become aware of their sanitation situation and of their rights in this respect so thatthey can challenge the institutions who have so far not met their obligation to ensure that citizens’ right to live in a cleanenvironment is fulfilled. Thus, in the Mathare context it has also become known as Citizen-led Total Sanitation. It builds onthe history of struggles against forced eviction in the informal settlements, putting sanitation and environmentalimprovements on the radar of residents and the agenda of structure owners/landlords and mandated institutions such as theNairobi City Council: ‘UCLTS does not concern itself with the hardware solutions rather it triggers the residents to startasking the right questions to the right people.’ (see Musyoki (2012)).
Thus, UCLTS in Mathare was initially demand-driven. However, a new phase has begun: The City Council of Nairobirequested training for their staff from Plan and CCS. This took place in May 2012 (see Musyoki (2012)). The City Councilnow wants to scale UCLTS up to 5 more wards in Nairobi. Government, local administration and public health officers fromthe City Council of Nairobi are beginning to enforce environmental sanitation laws and want to leave a legacy of goodsanitation in Mathare.
In Zambia, ‘urban CLTS through legal enforcement’ is being used in Choma and Lusaka. It was initiated as a response tocholera outbreaks in Lusaka. Some aspects of triggering are still used, but the emphasis is on legal enforcement of laws andby-laws to address and confront ‘urban nuisances’ related to sanitation as well as food and general hygiene. Institutions andbusinesses are being sensitised with campaigns and trainings to ‘clean up their act’ and provide proper sanitation facilities(for more information see Zulu (2011). In Mauritania, UNICEF together with the local municipality, used an adaptation ofCLTS in the town of Rosso (32,000 inhabitants), which led to several urban neighbourhoods being declared ODF (for moreinformation see van Maanen (2010)).
16.3.2 Technological innovationsIn the context of Mathare, there has also been a lot of innovation in terms of new technologies such as GIS and mobile mapping.TheMapMathare initiative (http://mappingnobigdeal.wordpress.com/2011/03/03/how-to-map-open-defecation-areas/) usedparticipatory GIS for open street mapping of the area (Figure 16.2). Youth were trained and equipped with the knowledge andskills to carry out the mapping via mobile phones complemented by digital photography, video SMS and ushahidi (http://ushahidi.com/). The results are thematic maps (http://www.mapkibera.org/blog/2011/02/14/base-map-of-mathare-is-complete/) on sanitation and other issues affecting the Mathare community (e.g., open defecation areas, open drains,
Figure 16.1 Urban CLTS project banner in Mathare, Nairobi (photo credit: Petra Bongartz).
CLTS in Africa: Trajectories, challenges and moving to scale 137

garbage sites, public and private toilets, water points, types of buildings etc. as well as stories and videos which can be accessedvia the Mathare Valley Blog (http://matharevalley.wordpress.com). The collected data will be used as evidence for advocacyand for engaging key stakeholders.
In other areas of Kenya, for example Kilifi, the Point of Interest Mapper (POIMAPPER), a customised software thatcombines mobile and Geographic Information Systems (GIS) technology, has also been used for data collection, analysis,documentation and communication. The resulting data can support planning, monitoring and evaluation (baselines)of programmes.
16.3.3 SLTSSchool-Led Total Sanitation (SLTS) is another growing area of innovation. Children generally make good and committedNatural Leaders and schools can serve as a good focal point for community discussions, celebrations and learning aroundsanitation and hygiene (Figure 16.3). Triggering takes place in a school setting, with children acting as messengers that taketheir learning and desire to stop open defecation and its detrimental effects back home and into their communities. PlanKenya uses schools as catchment areas and venues for the actual CLTS triggering. Children are involved in the entireprocess and they share the outcome of their analysis and action plans with the wider community. In Zambia, Plan uses focusgroup discussions and transect walks with children for post-triggering follow-up, getting the children to evaluate the progressmade with hygiene behaviour change in their villages. In Uganda, SLTS is used by Plan Uganda in conjunction with thechild-to-child approach. CLTS triggering in schools encourages children to identify hygiene and sanitation issues within theschool environment and to come up with action plans to maintain cleanliness and hygiene there as well as practicinghygienic behaviours at home, too. Perhaps the most developed and systematised variation of SLTS is being used in Ethiopiawhere Plan and the Local Administration in Shebedino have been using an SLTS approach that engages teachers intriggering CLTS since October 2010 (see Box16.1).
Figure 16.2 Map Mathare thematic map.
Sanitation and Hygiene in Africa138

16.3.4 Post-emergency/////conflictAnother new environment in which CLTS has been trialled in the last two years are post-emergency and post-conflict settings,including in Liberia, the Democratic Republic of Congo, Sudan and South Sudan. This is still at a relatively early stage ofdevelopment and there are many challenges, including the dependency culture and the fact that many NGO interventions aremodelled along the lines of serving short term needs by giving out subsidies. (For more on CLTS in emergency andpost-conflict/post-emergency situations, see Greaves (2012)), and Philip Otieno’s blogs on introducing CLTS in SouthSudan and Sudan (http://www.communityledtotalsanitation.org/contributors/philip-otieno (accessed 19 June 2012)).
16.3.5 Beyond ODFOnce the process of rapid collective behaviour change has been triggered, achieving ODF status is only one of the importantmilestones rather than the end of the journey. Follow up and long term strategies for sustainability are crucial. Depending on
BOX 16.1 SCHOOL-LED TOTAL SANITATION IN SHEBEDINO –A PROMISING WAY TO SCALING UP
Schools are triggered, with teachers and pupils evaluating the extent of open defecation and the conditions of their schooltoilets. Teachers also attend a live triggering by an experienced facilitator to learn how it is done. Then, during a Health andEducation Development Promotion Day which is part of the curriculum, pairs of teachers trigger all the Development Units(DUs)/Yelemat Budens (typically consisting of 25–30 households) in the Kebele, usually two or three of these together.Pupils bring family and community members to this meeting and engage in a sort of competition as to who can bring themost people. After triggering, a Chilo (shit) Eradication Committee consisting of one elder, one man, one woman, oneyouth and one child is formed, sets targets and moves the process forward. The pupils on the Committee, i.e. the youthand child, file a weekly progress report with the school, which passes them on to the Kebele Administration which canthen follow up. The weekly report includes categories such as toilets constructed, roadside toilets installed, their stagesof construction, and ‘ashamed people’ who had been found doing open defecation. Progress with this form of SLTS hasbeen promising and this system clearly has many strengths that may offer a way of going to scale faster in Ethiopia thannormal CLTS.
Source: For more information see http://www.communityledtotalsanitation.org/resource/school-led-total-sanitation-reflections-potential-shebedino-pilot
Figure 16.3 A common children’s game has been adapted for SLTS in Ethiopia to raise awareness of sanitation issues(Photo credit: Petra Bongartz).
CLTS in Africa: Trajectories, challenges and moving to scale 139

communities’ exposure and access to sanitation and hygiene products and services and their economic status, they step ontodifferent rungs of the sanitation ladder. Since the poorer people usually start with very basic sanitation options, there can bea risk of lapsing back to open defecation, if adequate support for investing in more sustainable options is not available.Therefore post-ODF strategies for sustainability need to consider how to link communities with opportunities for sanitationimprovement that cater to their needs and their means.
Sanitation Marketing is one of the approaches introduced to address this. However, it is still relatively new and a much clearerunderstanding of it is needed. What experience has shown already is that since markets are context specific, there is no one sizefits all solution and time and resources have to be invested in understanding the local conditions and creating the right balanceand integration of demand creation, market supply and enabling environment. And, crucially, CLTS and Sanitation Marketingneeds to be carefully sequenced as experience fromUganda has shown (see Nabalema (2011)). Behaviour change and ODF needto be firmly in place before selling latrines to communities so as not to delay ODF attainment (for more information see Chapter 6on Sanitation Behaviour Change and at http://www.wsp.org/wsp/toolkit/what-is-sanitation-marketing).
Other ways of helping communities move up the sanitation ladder have included:
• Engaging with financial institutions to see if their home improvement loans portfolio can be extended to include help withlatrine upgrading (Uganda).
• Artisan Fairs where community members come together to discuss problems, and find solutions to common challenges(Nigeria).
• Promoting micro entrepreneurs as professional sanitation service providers through market research, strengtheningof technical and business development/management skills of local micro-entrepreneurs, and facilitating forward(to communities) and backward (to supply chain actors at the regional/national level) linkages of thesemicro-entrepreneurs based on their business plans (Kenya).
16.4 CONCLUSION: TRANSFORMING AT SCALEGiven the rapid changes with CLTS in Africa over the last two years, it is clear that we have moved into a different landscapewith new uncertainties, challenges and opportunities. Recognising its value and potential, and seeing the success across a widerange of country contexts, the key concern of all stakeholders is now how to scale up with quality at sub-district, district, provinceor region, and national levels. Based on experience, the following priorities emerge:
• Capacity and quality: Good hands-on training and follow-up mentoring of facilitators and trainers are crucial. Trainingwithout mentoring support, and rushed or cascade training, both risk large-scale failure. Plans need to provide forsteady exponential expansion of good training with mentoring, bearing in mind that only a minority of those trainedwill make good trainers. Quality assurance in going to scale depends on their personal qualities and performance.
• Champions, commitment and campaigns: CLTS has spread through committed champions who have recognised its powerand potential. They have been at all levels from Presidents to local Natural Leaders. Those working in central and localgovernments have often been critically important. Successful spread of CLTS has tended to be fastest and best as part ofmulti-faceted campaigns involving many actors in government departments, NGOs, religious organisations, the mediaand other organisations. Leadership, enthusiasm and competition have played their part. One key challenge is toenable more and more champions to dedicate more and more of their time to CLTS. Those many, like healthextension workers, health volunteers and Natural Leaders, who also have other responsibilities, need backing andencouragement. And most critically, a cadre is needed of capable and committed staff who have been released orrecruited to be full-time on CLTS.
• Follow up and rapid realism: A lot of questions still remain about good follow up post ODF.We need to knowmore abouthow to link CLTS with pro-poor sanitation marketing and other post-ODF follow-up activities to move communities upthe sanitation ladder and ensure equity and inclusion. The target-driven national campaigns on which so manygovernments have embarked are at risk of false claims and reports. As in India, these can generate inflated figures andan unfounded fantasy of achievement which is later and embarrassment. To prevent this demands rapid realism –
rapid, cross-checked information flows about what is really happening at the grass roots. Many initiatives can supportthis: recognising and rewarding the realism and honesty of those who report that they have not achieved their targets;regular reflective meetings at different levels to review progress and replan actions; developing M and E andinformation management systems, increasingly using ICTs, to provide accurate real time data; and ODF verificationpractices which balance passes and failures, making failures positive learning experiences for communities. The mottoat all levels should be ‘Learn fast and fail forwards’.
Sanitation and Hygiene in Africa140
• Innovating, learning, networking, sharing and mutual support: Learning from innovations, action and experience, andsharing what works and what does not, are vital for fast and effective navigation in going to scale. Good relationships andcommunication between the different stakeholders are key. Networking, information sharing and fora for collaborationsuch as the national working groups, and taskforces are essential tools and sources of mutual support. Action learning,research, workshops like the ones in Lusaka, Bamako and Lukenya (see Lusaka Declaration (2010), Bamako Consensus(2010) and Lukenya Notes (2011)) and exchange visits between countries all have their part to play. Websites (such aswww.communityledtotalsanitation.org) and newsletters (see section 3.5 above) are potent means of learning fast.
And, above all, we need honesty, a willingness to learn from failure and the ability to be flexible and change course as fieldrealities continue to change with dramatic speed.
What will next two years bring? Based on what we have seen these past two years, our hopes and expectations are high. IfGovernments, with support from civil society, can support champions, multiply capacity, foster and reward honest realism, andnetwork, learn, and share with each other, CLTS should become transformative on a vast scale. In rural sanitation and hygiene,Africa can then expect to outstrip much of Asia. But such success is far from a foregone conclusion.Whether such transformationtakes place will depend on the vision, commitment, guts and honesty at all levels of the champions who spearhead and spreadCLTS. We look to them.
16.5 REFERENCESBamako Consensus (2010). The Bamako CLTS Consensus: What Works and Traps to Avoid. Regional Sharing and Learning Workshop
for francophone Africa, 29 November–3 December 2010, Bamako. http://www.communityledtotalsanitation.org/resource/bamako-consensusle-consensus-de-bamako-pour-latpc (accessed 19 June 2012).
Bongartz P. (2009). AfricaSan: one year on. Workshop on CLTS in Africa. http://www.communityledtotalsanitation.org/resource/clts-africa-mombasa-workshop-march-2009 (accessed 19 June 2012).
Chambers R. (2011). Passion, Energy and Commitment. http://www.communityledtotalsanitation.org/blog/passion-energy-and-commitment (accessed 19 June 2012).
Greaves F. (2012). Learning and Recommendations on the use of CLTS in Emergency Contexts. http://tilz.tearfund.org/webdocs/Tilz/Topics/watsan/Learning%20and%20recommendations%20on%20the%20use%20of%20CLTS%20in%20emergency%20contexts%20_June%202012.pdf (accessed 25 June 2012).
KWAHO (2011). ODF Third Party Verification: Nyanza and Western Provinces. Kenya Water for Health Organization and GOK-UNICEFWASH Program, KWAHO, Kenya.
Lukenya Notes (2011). Taking CLTS to Scale with Quality. http://www.communityledtotalsanitation.org/resource/lukenya-notes-taking-clts-scale-quality (accessed 19 June 2012).
Lusaka Declaration (2010). Statement and Recommendations from the Regional Sharing and Learning. Workshop of CLTS Decision-makers,Practitioners and Networkers in Lusaka, World Toilet Day, 19 November 2010. http://www.communityledtotalsanitation.org/resource/lusaka-declaration (accessed 19 June 2012).
Musyoki S. (2010). Piloting CLTS in an Urban Setting: Diary of Progress in Mathare 10, Nairobi Kenya. http://www.communityledtotalsanitation.org/resource/piloting-clts-urban-setting-diary-progress-mathare-10-nairobi-kenya (accessed 19 June 2012).
Musyoki S. (2012a).CanUrbanCLTSWork?http://www.communityledtotalsanitation.org/blog/can-urban-clts-work (accessed19 June 2012).Musyoki S. (2012b). New Dawn for Urban CLTS in Nairobi. http://www.communityledtotalsanitation.org/blog/new-dawn-urban-clts-
nairobi (accessed 19 June 2012).Nabalema C. (2011). The Phasing Of Community-Led Total Sanitation (CLTS) and Sanitation Marketing (Sanmark) in Uganda. http://www.
communityledtotalsanitation.org/resource/phasing-clts-and-sanitation-marketing-uganda (accessed 19 June 2012).Otieno P. V. (2011). Natural Leaders Networking. http://www.communityledtotalsanitation.org/resource/natural-leaders-networking
(accessed 19 June 2012).Raeside A. (2010). Participatory development approaches need participatory management!. PLA Notes., 61, 109–118.Soublière J.-F. (2010). Adopting CLTS. Is your organisation ready? Analysing organisational requirements. PLA Notes, 61, 119–128.Tunsisa B. and Beyene A. (2012). Natural Leaders Association in Sidama Zone (The Attempt to Sanitation and Hygiene Ladder Improvement).
http://www.communityledtotalsanitation.org/resource/improving-movement-sanitation-ladder-through-natural-leaders-associations(accessed 19 June 2012).
Ministry of Health and Sanitation (MoHS), UNICEF and GOAL (2010). CLTS Training Manual for Natural Leaders http://www.communityledtotalsanitation.org/resource/clts-training-manual-natural-leaders (accessed 19 June 2012).
van Maanen P. (2010). Lessons Learnt in Urban Sanitation. http://www.communityledtotalsanitation.org/resource/lessons-learnt-urban-sanitation-mauritania (accessed 19 June 2012).
Zulu G. (2011). Urban CLTS in Zambia: The Case of Choma and Lusaka. http://www.communityledtotalsanitation.org/resource/urban-clts-zambia (accessed 19 June 2012).
CLTS in Africa: Trajectories, challenges and moving to scale 141


Chapter 17
Sanitation services in towns
Robert Roche and Letitia A Obeng
Dialogue on sanitation is often in distinct streams: rural or urban focus. Intermediary spatial developments are oftenneglected, in individual towns. Urbanization is not only creating large urban conurbations, but populations in towns inAfrica are also growing fast. Capacity, technical solutions, finance and management in towns are often very differentfrom those in rural or urban settings. This chapter presents a discussion of the individual characteristics, from asanitation service delivery perspective and outlines what we know about how to address common problems.
17.1 WHAT IS A TOWN?Some towns are essentially large villages consisting of scattered homes surrounded by farmland, or a cluster of homesand shops along a road. Others may have higher density housing, business centers with shops and hotels, light industrialareas, weekly markets, and both public and private institutions. The population in towns ranges from 5000 to 50,000 people(but the principles set out in this note also apply to small cities and large villages). They fill the space between villages andcities – between ‘rural’ and ‘urban’ where neither informal community-management of water supply and sanitation nor largeutility management is well suited. The numbers and sizes of towns in Africa are growing rapidly with most doubling inpopulation every 10–15 years. For every urban center there are three secondary cities, 12 small cities, 50 large towns, andcome 150 small towns. Most ‘large villages’ would already benefit from a piped water supply system and will grow tobecome small towns in the next 15 years (Table 17.1).
With this increase in population there is an increased demand for basic services. Towns are important because they provide anexcellent opportunity for inclusive growth which is described by the African Union and the Economic Commission for Africa(2011) as requiring ‘national economic structure transformation, unlocking entrepreneurship across regions and sectors, withwell-designed and supportive policy actions underpinned by a vibrant private sector and productive entrepreneurship’.AU Commission (2011).
Table 17.1 The relative numbers of towns and cities in Africa
Population range No. ofcities/////towns
No. of cities/////townsper urban center
Averagepopulation
Urban centers .500,000 9 1 1,800,000
Secondary cities 100,000–500,000 33 3 240,000
Small cities 50,000–100,000 110 12 80,000
Large towns 15,000–50,000 433 50 25,000
Small towns 5000–15,000 ∼1500 150 8000
Large villages 2000–5,0000 ∼4000 450 3000
Source: Based on town/city population data for Ghana, Ethiopia, Mozambique, Senegal, Tanzania, and Uganda.

17.2 DECENTRALIZATION AND THE IMPLICATION FOR SERVICE DELIVERY IN TOWNSFor the last two decades, African governments have been shifting the responsibility for basic services to local government(districts and municipalities). In many countries, the ownership and overall responsibility for water supply, wastewatermanagement, human excreta and solid waste management and associated hygiene education are now with local authorities.
Service delivery. The term sanitation service as used here means the provision and operation of a safe and easily accessiblemeans of disposing of human excreta and wastewater. In the delivery of sanitation services in towns, water supply must alsobe considered.
As more water comes into the town, there is more wastewater to collect, treat and dispose of. Also, as the quality of life intowns improves, there is an increasing demand for more sophisticated forms of human waste disposal. Unfortunately, neitherinformal community-management nor large utility management is well suited as a service delivery mechanism in towns, soalternatives have to be found. The majority of households in towns will continue to rely on pit latrines or pour flush toilets,and can dispose of greywater on site through seepage pits. However, increasing numbers of households and small businessesare using more water than can be disposed on their property. In addition, it has to be remembered that towns also faceincreased water stress and in water scarce environments and approached to minimize water use including alternativetechnologies, conservation and reuse should be part of the service delivery discussion.
Ownership and regulation. Higher level regulatory authority is normally held by the Ministries of Health and Water as part oftheir policy and resource allocation functions. Their responsibilities include permits for water abstraction and wastewaterdischarge, monitoring of public health (water quality and environmental sanitation), and approval of business plans anddesigns for facilities financed by the central government.
In its regulatory function for on-site sanitation, local government can domuch by: (i) promoting improved hygiene and on-sitedisposal of human excreta, (ii) arranging training for local artisans to construct proper latrines and seepage pits according tostandard designs, (iii) facilitating savings/loan schemes to help households accrue sufficient cash to construct improvedfacilities, and (iv) taking enforcement action against those who disregard sanitation statutes. Furthermore, because of theinter-linkages, between water and the wastewater produced in towns, local governments find themselves with a challenge toensure appropriate service delivery systems that will deal with the management of both the solid and liquid wastes.
As the regulator of on-site sanitation and the owner of public water supply and wastewater collection/treatment facilities,local government is in the unique position to plan comprehensively for water and sanitation. Plans to address water supplyand sanitation services for homes, businesses and institutions, can include bringing more water to towns with the challengeof conserving, reusing and disposing of it.
Oversight and operation of publically owned water and sanitation facilities (Figure 17.1). While local authorities own and/orregulate all aspects of water supply and sanitation, there are various reasons for local authorities to delegate management of publicwater supply and wastewater collection/treatment facilities to a local board or association, and for the water/wastewaterboard/association in turn to hire individuals or companies to operate the facilities. These are related to autonomy,accountability, demand responsiveness, and cost effective design and operation outlined in Box 17.1 (Pilgrim and Roche, 2007).
Oversight: Local governments should delegate oversight and operations to others. A local board/association whose memberslive in the town will have the greatest interest in good water supply and sanitation services and the most accountability to
SpecialistSupport Operator
WaterBoard
PlanningPartnership
Figure 17.1 Oversight and Operation Arrangements of Publically-Owned Sanitation Services.
Sanitation and Hygiene in Africa144

their fellow townspeople. As a result they are most likely to make decisions solely on what’s best for local water supply andsanitation services and will see to it that funds are ring fenced.
Operations: Local water board/association members can provide oversight and guidance but lack the time and expertisenecessary for operating their facilities. Day-to-day operations can best be contracted to an individual through aperformance agreement or a private operator through a contract that sets out performance standards and performancerewards. Considerable authority should be given to the chief operator to hire/fire staff, to procure goods and services, andto make day-to-day operational decisions without delays and needless interference of the water board.
Professional Support: The limited revenue base from town water supply and wastewater collection/treatment means that fulltime engineers and financial specialists are often unaffordable. The local operator can certainly carry out all routineoperations, but should have professional support to improve efficiency and resolve problems. While the town waterboard/association should get professional help to review operator performance, plan expansion, and update business plansincluding tariff structures. The water and wastewater board/association, the specialist support to the board and the localoperator and the operator all work together in partnership.
17.3 THE WATER SUPPLYAND SANITATION LINKThe demand for water is increasing in towns, particularly in those with expanding businesses and institutions, and growingpersonal wealth. An improved water supply means increasing volumes of water that must be disposed of on-site; conveyedthrough sewers to treatment facilities; or discharged into community streets, paths and street drains. Meanwhile, the type ofsanitation facility and related wastewater depends on the type of water connection.
BOX 17.1 SUCCESS FACTORS FOR PIPED WATER SUPPLYAND WASTEWATER MANAGEMENTIN SMALL TOWNS
• Autonomy: Wastewater treatment and town water supply are marginal from a business perspective, so revenue from thesale of water and treatment of wastewater should be ring-fenced to prevent their use for the other needs of the town, nomatter how important. Diverting revenue for other purposes will certainly preclude proper maintenance and the ability toexpand facilities to keep up with the growing population. In addition, the service provider should be able to hire and firestaff, set attractive salaries, and offer bonuses for achieving performance goals.
• Accountability: Local boards whose members represent households and other consumers should be responsible foroverseeing the treatment, disposal or reuse of wastewater collected as well as the operation and expansion of thetown water supplies. They in turn should be accountable to the owner of the facilities (usually the local municipality ordistrict) which delegated management to them. Transparency is essential to gain and maintain the trust of users.Regular reports on operational efficiency and income/expenditures should be presented for public review and aspecialist should be hired each year to review technical and financial performance.
• Demand responsiveness: A range of water services should be offered including house connections, yard taps, and publicstandpipes. At the same time, households and other consumers need to be aware of the wastewater collection,treatment, disposal and reuse options associated with each type of water supply service. This underpins sustainabilityby selling sufficient water to finance recurrent and expansion costs as well as wastewater management costs.Innovative payment schemes are always helpful. Where local water sources are constrained, the pricing structure cancontrol demand, particularly for high end uses.
• Cost-effective design and operations: Small town water supply systems are over-designed when conventional urbanpiped water design criteria are employed, significantly increasing both construction and operating costs and limitingoptions for establishing financial viability of systems constructed. Households and other consumers require accurateinformation about costs of different services so they can make informed choices.
• Professional Support: A common mistake that many small towns make is underestimating what is required to managetheir water supply and wastewater facilities successfully. Many towns assume that they can go it alone, but most donot have adequate capacity to do so. Local operators can be trained to handle routine tasks, but experiencedprofessionals are needed to check that town water supplies are being operated efficiently and to plan their expansionto keep up with a growing population.
• Water Resources Management: The ‘Achilles heel’ of a small town is its water source. Small towns rely on groundwaterunless there is a large surface source nearby. Given the increasing water stress and scarcity in Africa, many are finding ithard to meet the growing demand, despite their efforts at source protection and recharge augmentation. Where sewersand pond systems are employed to convey and treat wastewater, reclaiming wastewater for irrigation can augmentfreshwater sources.
Sanitation services in towns 145

Water Supply. People want more water delivered more hours each day. Households that must queue for water at a publicstandpipe would like a tap in their yard or to share one with a neighbor. Those with yard taps in turn want to move up tohouse connections with internal plumbing and various water fixtures (i.e., sinks, showers, and toilets).
Sanitation. Households that carry water home or have a yard tap usually have an unimproved pit latrine and are able to disposeof the resulting wastewater on their property, or could if they employed a properly designed seepage pit or trench. Increasingly,households, businesses and institutions are installing flush toilets with septic tanks. However, most septic tanks do not removesolid materials effectively and their overflow is usually discharged to a street drain.
The biggest problem when wastewater is treated on site is that there is a lack of understanding about septic tank design, andparticularly about seepage pit and leach field design. Most countries have appropriate design standards for septic tanks, but theygenerally are not adhered to at the local level. Tanks need sufficient volume to store solids as they decompose, two chambers toeffectively separate solids from the overflow, and outlets at mid-depth between the scum layer that forms at the surface and thesludge blanket at the bottom. Furthermore, seepage pits/trenches are either absent or seriously undersized to keep the wastewateron-site. To design a seepage pit or trench, it is important to take into account the reduction in the infiltration rates. Over timemicrobial activity creates a slime layer in the water-soil boundary (2–5 cm thick) which greatly reduces the initial infiltrationrate by two to three orders of magnitude. For example, an initial 1 gallon/ft2/ min percolation test rate will reduce to about1 gallon/ft2/day (45 liters/m2/day) over the period of a year, and then hold constant for a number of years. Table 17.2gives acceptable loading rates of wastewater in seepage pits/trenches which correspond to percolation rates in a standard test hole.
BOX 17.2 WATER SUPPLY & SANITATION OPTIONS
Water Options
• House Connections: Households with internal plumbing and multiple fixtures.• Yard Taps: Households with a tap in their yard.• Shared Yard Taps: Households that draw water from a neighbor’s tap.• Community/Public Water Points: Households that draw water from a public tap.• Alternative Sources: Traditional and other sources besides the piped system.
Sanitation Options
• Pit latrine: unimproved or ventilated with floor plate that is easy to clean.• Pour flush toilet: Low volume flush toilet with discharge to seepage pit.• Flush toilet: Flush from tank with discharge to septic tank and leach field or directly to a sewer.• Sewer: Can be simplified: small bore if solids are first removed in a individual or shared septic tank or shallow.• Wastewater stabilization pond: Remove suspended solids, stabilize organic material, and reduce pathogens with longer
detention times and ponds in series if reclaimed for irrigation.
Table 17.2 Sizing of Seepage Pits/Trenches.
Percolation Test*Water Level Drop inTest Hole (min/////cm)
Seepage Pit/////TrenchDesign Rate
(liters/////m2/////day)
1 45
2 30
5 24
10 14
15 12
20 10
30 8
60 6
*Percolation test measures the water drop when the depth of water is 15 cm in a 35 cmdiameter hole presoaked overnight. California Regional Water Quality Control Board (1979).
Sanitation and Hygiene in Africa146

For example, if the test percolation rate is 5 min/cm, the acceptable loading rate of a seepage trench would be at24 liters/m2/day. Accordingly, a family of five that generates 200 liters/day of wastewater would need a trench with wettedsurface area of 8.3 m2 (200/24= 8.3). If the trench is 0.5 meters wide and 1 meter deep, 2/3 of which is filled with gravel,its wetted surface area would be 1.8 m2 per meter of trench (2 * 0.67+ 0.5= 1.8) and its required length would be 4.6meters (8.3/1.8= 4.6).
17.4 STRATEGIC PLANNING FOR SANITATION IN TOWNSStrategic planning is all about setting priorities based on real demand (matching what people want to what they are willing to payfor) and doing what can be done with available resources. As a result designs must be staged base on available financing, watersources should be augmented through groundwater recharge and reuse, and planning should include both water supply andsanitation. One starts by engaging the community in a planning process to prioritize their needs and determine their demandfor improved services. Immediate service improvements implemented during the planning process build the confidence inpeople that something will come out of the process and motivate them to participate in it. Cost effective design, linked tobusiness plans helps build sustainability.
Engaging the community. Much can be gained from engaging officials and community members up front in clarifyinginstitutional arrangements and responsibilities, in introducing different service options and associated costs, in discussingwater sourcing, drainage needs and in mapping out options for location of different services. Surveys, discussion groups andworkshops are common tools to facilitate the planning process. It is also important to identify and take action on things thatcan be done right away to improve services such as training of local artisans to design/construct on-site systems, introducinga revolving fund to cover the initial cost of these systems, identifying and stopping wastewater discharges that are causingproblems in the community, facilitating the collection and disposal of sludge from on-site systems, and constructing publicsanitation facilities, engaging small service providers for drainage work.
Cost effective design. It’s also worthwhile at least preparing a preliminary design to identify the wastewater –related facilitiesand investments needed. Cost effective design is fundamental to balancing costs to revenues. It takes account of the limited fundsthat government can grant for new construction, the limited revenues that can be generated from the sale of water for maintenanceand expansion of the system or of treated wastewater and unpredictability in population growth.
A cost effective design starts with initial assessment and mapping of the town, according to the expected demand for waterand wastewater facilities. Again, the focus here is on wastewater management, but similar considerations are needed forassociated water supply services. The focus of the initial assessment is on the types of wastewater facilities thathouseholds/businesses want, their capacity to dispose of wastewater on-site, and the identification of areas that requiresewers. In thinking through options for disposal of wastewater in towns, simplified sewerage should be a viable option.Mara (2005) demonstrates the favorable cost comparison between simplified and conventional sewerage.
The operating and expansion costs for the preferred types of service will determine the tariffs that must be charged toproduce/distribute water and to collect/treat the resulting wastewater. A financial model linking service levels to the price ofwater supply and wastewater collection and disposal provides a means to evaluate alternative service levels in an iterativeconsultation process until expenditures for operations and expansion match income from the sale of water andcollection/treatment of wastewater. An iterative design and consultation process is therefore required.
For water supply, costs can be minimized through modular designs of most components that are sized to meet today’spopulation plus five years of average growth. The components can be duplicated to meet actual demand. Considerable costscan also be saved by relaxing design standards for daily/seasonal peaking factors and for water pressure within the pipednetwork. Where the yield of available sources in constrained, residents would need to take measures to recharge thegroundwater source, combine surface and groundwater sources, and introduce measures to conserve water through customerawareness and the tariff structure.
For wastewater, cost effective design means the continued utilization of on-site systems to the extent possible, and use ofeither street drains or sewers where it cannot. Often a combination of on-site solids removal (effectively primary treatment)and simplified sewers can be the best way to upgrade existing systems.
Business Planning. The business plan brings the overall planning process together. It combines the proposed managementarrangements, investment schedule, financing strategy, operating staff/procedures, monitoring/reporting program, andcustomer relations.
The key aspect of a business plan is its recognition that public water supply and sanitation services can only be sustained andexpanded if (i) people want them and are willing to pay for them (in other words, that there is demand for the services); and (ii)
Sanitation services in towns 147

funds are available to pay for ongoing operational costs and expansion of services to meet demand. The business plan shouldcontain a plan for maintaining, extending and improving the supply system over time while taking into account waterresource availability.
The business plan includes:
• Management arrangements: Defining the roles and responsibilities of the oversight body (the water board) and waterutility operator, plus professional support arrangements.
• Expansion schedule: The works required to meet actual demand during the first five years as part of 15 year expansionplan. Financial modelling is essential to ensure that the community can afford recurrent, replacement and part of theexpansion costs.
• Conservation schedule: The steps needed to increase conservation of water use, given resource constraints.• Financing strategy: Including how and from whom the money to pay for the investment plan will be raised.• Operating procedures: Describing the systems and procedures used for accounting, billing and collection, unit operations,
budgeting, and procurement.• Monitoring and reporting program: Setting out the monitoring plan for reporting performance and regulatory obligations
to the Water Board.• Customer relations policy: To offer informed choices to consumers, including the type of connection, and to keep
performance records and decisions transparent.
17.5 EVOLVING CONSIDERATIONS FOR TOWNSAccording to the World Water Assessment Report (2012), more than three hundred million people, (almost 40 percent of thepopulation) in Sub-Saharan Africa live in a water scarce environment. Given this fact and the challenges that climate changeis bringing across the continent, the populations and leaders in towns, like other urban areas, need to think about theimplications of these with respect to their development needs around water supply, wastewater and human excretamanagement. Some considerations follow for national and local government:
• National governments should support the evolving needs of towns, by considering alternative and water-saving appliancesand technologies which are also cost effective but have had little relevant research in SSA (e.g., simplified sewerage).
• Education and sensitization programs need to emphasize the importance of water conservation, augmentation and reuse.• Planning for water supply and wastewater management should be considered together by towns.• ‘Green’ or ‘Eco’on site systems should be considered where they are culturally acceptable.
17.6 SUMMARYAND CONCLUSIONSThe populations of towns are growing rapidly, as they evolve from big villages to centers of growing businesses and institutions.The demand for improved services is growing even faster, making it increasingly difficult to contain wastewater on individual
BOX 17.3 STEPS IN COST EFFECTIVE DESIGN PROCESS
• Engage officials and the community at large in the planning process, starting with the preparation of a map of town andidentification of service areas and corresponding stakeholder groups.
• Determine current service level and projected demand for water connections and sanitation facilities.• Assess the water production and distribution capacity of existing components.• Assess the demand for treatment of wastewater dependent in part on the supply source.• Assess the capacity of households, businesses and institutions to dispose of wastewater on site, and identify areas
where sewers may be required.• Determine the need for public water supply and sanitation facilities at schools, market centers, and transport stations.• Determine the current supply gap and identify additional water sources.• Prepare preliminary engineering designs.• Carry out a financial model and continue stakeholder dialogue to arrive at sustainable water supply and
sanitation services.
Sanitation and Hygiene in Africa148

properties. At the same time decentralization processes are shifting ownership and responsibility for public water supply andsanitation to the town level. This is added to their traditional responsibility for regulating on-site sanitation facilities.
Given the convergence of water supply with wastewater collection/disposal, the move to local ownership of publicwater supply and sanitation facilities is fortuitous. Proven factors in successful town water supply, however, point to thedelegation of oversight of both piped water supply a wastewater collection to local water boards and operations toindividuals/companies contracted by them. Going forward a central technical issue for towns will be cost effective design.In addition, as demand for water exceeds the capacity of local water sources, water conservation and wastewaterreclamation/reuse will play an important role in meeting demand.
17.7 REFERENCESAU Commission (2011). Report on the Progress in Achieving the Millennium Development Goals in Africa. Meeting of the Committee of
Experts of the 4th Joint Annual Meetings of the AU Conference of Ministers of Economy and Finance and ECA Conference ofAfrican Ministers of Finance, Planning and Economic Development.
California Regional Water Quality Control Board (1979). Minimum Guidelines for the Control of Individual Wastewater Treatments andDisposal Systems. San Francisco Bay Region.
Mara D. (2005). Water Sector in Small Urban Centers, UN Habitat Report on the Water and Sanitation in Small Urban Centres: Paper 3.Pilgrim N. and Roche R. (2007). The principles of town water supply and sanitation, World Bank Water Working Note.
Sanitation services in towns 149


Sector Management and Financing

Chapter 18
eThekwini commitments monitoring and nationalsanitation action plans
Sophie Hickling1 and Yolande Coombes21WSP Consultant2Senior Sanitation and Hygiene Specialist, WSP
18.1 THE eTHEKWINI COMMITMENTS ON SANITATIONIn 2008 the AfricaSan+ 5 conference, which coincided with the International Year of Sanitation, brought together over 600participants including ministers from 32 African countries. The conference culminated in the eThekwini Declaration – astrong statement of commitments by African governments to prioritise sanitation (Box 18.1). In many ways the eThekwinideclaration has been the launchpad for concerted efforts to improve the sanitation situation across Africa.
At AfricaSan+ 5 in 2008, 17 countries became signatories of the eThekwini commitments; other countries have signed themretrospectively. The eThekwini declaration was subsequently endorsed by Heads of State at the AU Summit, 2008 through theSharm el Sheik Declaration, ratified by all members of the African Union. The eThekwini commitments have also beenreaffirmed through various regional and sub-regional declarations such as the Libreville Declaration on Health andEnvironment in Africa (AMCOW, 2011a).
BOX 18.1 ETHEKWINI COMMITMENTS ON SANITATION (FEBRUARY 2008)
(1) Bring the outcomes of AfricaSan 2008 to the African Union Heads of State Summit;(2) Track implementation of the eThekwini Declaration and report on progress at the AfricaSan 3;(3) Update country sanitation and hygiene policies; establish one national plan for accelerating progress to meet national
sanitation goals/MDGs; and ensure national programs are on track;(4) Increase the profile of sanitation and hygiene in PRSP and other strategic planning processes;(5) Ensure one, accountable institution takes leadership of the national sanitation portfolio; establish one coordinating
body for sanitation and hygiene, involving all stakeholders;(6) Establish specific public sector budget allocations for sanitation and hygiene programs with a target allocation of a
minimum of 0.5% of GDP;(7) Use effective and sustainable approaches, such as household and community led initiatives, marketing for behaviour
change, targeted at the poor, women, children, youth and the unserved;(8) Development sanitation information systems and tools to track progress at local and national levels; produce regular
regional reports on Africa’s sanitation status;(9) Recognize gender and youth aspects of sanitation, and involve women in all decision-making;(10) Build and strengthen capacity for sanitation and hygiene implementation including research and development, and
support knowledge exchange and partnership development;(11) Give special attention to countries, or areas, emerging from conflict or natural disasters.

18.2 FROM COMMITMENTS TO ACTIONWhile the commitments provided the broad framework of what needs to be done to advance sanitation, their operationalization atcountry level needs to be planned, financed and monitored in order to achieve results. To support countries in this process, one ofthe key outputs of AfricaSan+ 5 was the AfricaSan Action Plan guidance.
The National Action Plan Matrix is divided into 8 themes, broadly aligned to the eThekwini commitments. As a first step thematrix can be used for countries to assess the current situation. From there the country is able to determine what action isrequired, timeframes and responsibilities.
The AfricaSan Action Planning process was highly useful in guiding countries from commitments to action. After 2008, verygood progress was made in certain areas of the eThekwini commitments. For example between the first and second East AfricaSanitation conferences almost all countries had taken steps towards developing a national sanitation plan and most haddesignated a coordinating body (ANEW et al. 2010).
However in some cases, possibly due in part to thematrix format covering 8 broad themes, the AfricaSan action plans delinkedthe process of planning from the overall goal and the process became the end in itself rather than themeans of achieving sanitationimprovements (East Africa Sanitation Plans Peer and Panel Review, 2010). Some country plans became in effect staticdocuments, parallel to sector processes and updated infrequently. Indeed a 2010 review of five AfricaSan Action Plans inEast Africa found that only one had been revised and updated since it had been developed, bringing into question its utilityas a sector planning and resource mobilisation tool (East Africa Sanitation Plans Peer and Panel Review, 2010).
To address this, in the lead-up to AfricaSan3, countries reviewed their AfricaSan action plans and other sector documents toidentify a small number of key priority action areas which had seen least progress since AfricaSan+ 5 and which wereeffectively bottlenecks holding back overall progress in the sector. The results of this process were used to develop moredetailed Priority Action Plans for Sanitation with shorter-term, tangible goals which could be re-set in a rolling 6-monthreview process. The Priority Action Plans for Sanitation dovetail into - rather than replace - the National Action Plan, with aview to focussing efforts where they are most needed.
A unique and important feature of AfricaSan is its structure as an on-going process rather than a series of conferences.Between the main AfricaSan conferences held in 2008 and 2011, various sub-regional AfricaSan meetings took place toreview progress and provide opportunities for peer learning.
The importance of continuity of dialogue and action to the AfricaSan process is also evident at country level. In advance ofAfricaSan3, 38 countries held preparation meetings involving government, development partners and civil society. Throughevidence-based review, countries generated eThekwini monitoring scores and identified current strengths and weaknesses inthe sector.
The outputs of in-country preparation meetings informed the design of the main conference, helping to ensure that sessionthemes addressed key concerns in the region (see Figure 18.1).
Figure 18.1 Process flow from AfricaSan 3 preparation meetings to Priority Action Plan for Sanitation development.
Sanitation and Hygiene in Africa154

Wes
t A
fric
aE
ast
Afr
ica
So
uth
afr
ica
Cen
tral
Afr
ica
Benin
Burkina Faso
Cape Verde
Cote d’Ivoire
Gambia, The
Ghana
Guinea-Bissau
Guinea
Liberia
Mauritania**
Mali
Niger
Nigeria
Senegal
Sierra Leone
Togo
Burundi
Comoros
Djibouti
Eritrea
Ethiopia
Kenya
Rwanda
Somalia***
Southern Sudan
Sudan
Tanzania
Uganda
Angola
Botswana
Lesotho
Madagascar
Malawi
Mozambique
Namibia
South Africa
Swaziland
Zambia
Zimbabwe
Cameroon
Central African Republic
Chad
Congo, Dem. Rep.of
Congo, Rep.of
Equatorial Guinea
Gabon
São Tomé and Principe
Total/72
eThekwini Commitments on Sanitation
Is th
ere
a na
tiona
l san
itatio
n po
licy?
22
11
21
22
12
22
22
10
12
22
22
12
12
22
11
11
11
21
55
Is th
ere
one
natio
nal s
anita
tion
plan
to
mee
t the
MD
G ta
rget
?2
21
22
22
11
22
22
12
02
22
22
12
22
22
12
21
01
12
158
Wha
t pro
file
is g
iven
to s
anita
tion
with
in th
e P
RS
P?
22
22
22
22
11
12
21
21
12
22
11
22
21
21
12
01
12
21
56
Is th
ere
a pr
inci
pal a
ccou
ntab
le
inst
itutio
n to
take
lead
ersh
ip?
12
22
22
21
12
21
21
20
12
22
11
11
11
21
22
21
02
21
53
Is th
ere
one
coor
dina
ting
body
in
volv
ing
all s
take
hold
ers?
21
12
22
11
12
22
21
10
12
22
21
22
20
21
22
22
11
02
54
Is th
ere
a sp
ecifi
c pu
blic
sec
tor
budg
et li
ne fo
r sa
nita
tion?
12
22
21
10
21
22
12
10
11
22
21
22
01
11
22
00
12
22
49
Is 0
.5%
of G
DP
allo
cate
d to
sa
nita
tion?
00
01
00
00
00
10
11
00
11
11
00
01
00
10
00
00
00
12
13
Is th
ere
a sa
nita
tion
mon
itorin
gan
d ev
alua
tion
(M+
E)
syst
em?
12
01
01
11
10
11
21
00
12
11
11
12
01
11
11
11
11
10
33
Do
Inst
itutio
nal s
anita
tion
prog
ram
sin
clud
e ge
nder
asp
ects
?0
22
11
22
12
22
12
21
11
22
22
22
20
22
22
22
22
12
260
Gre
en=
Goo
d pr
ogre
ss (
2 po
ints
)
Yello
w=
Som
e pr
ogre
ss (
1 po
int)
Red
= In
suffi
cien
t pro
gres
s (0
poi
nts)
Gre
y=
No
data
Red
, yel
low
, gre
en:
Pro
gres
s to
war
ds th
eeT
hekw
ini c
omm
itmen
ts
To tr
ack
thes
e co
mm
itmen
ts b
etw
een
Afr
icaS
an m
eetin
gs, v
isit
WA
SH
wat
ch.o
rg**
In N
orth
Afr
ica,
Mau
ritan
ia w
as th
e on
ly c
ount
ry to
hav
e co
nven
ed a
n A
fric
aSan
3 C
ount
ry P
repa
ratio
n M
eetin
g. O
win
g to
this
and
with
the
perm
issi
on o
f the
nat
iona
l tea
m, f
or th
e pu
rpos
es o
f thi
s do
cum
ent,
Mau
ritan
ia d
ata
has
been
incl
uded
in th
e W
est A
fric
a R
egio
n.**
*Som
alia
: It w
as n
ot p
ossi
ble
to h
old
natio
nal c
onsu
ltatio
n m
eetin
gs in
Som
alia
due
to th
e on
goin
g co
nflic
t in
the
coun
try
. One
sem
i-aut
onom
ous
stat
e in
the
NE
of t
he c
ount
ry (
Pun
tland
) w
as a
ble
to h
old
cons
ulta
tions
and
due
to th
e re
lativ
e pe
ace
in th
at s
tate
, it i
s w
illin
g an
d ab
le to
impl
emen
t ac
tiviti
es to
sca
le u
p sa
nita
tion
in th
e st
ate.
Res
ults
from
the
Pun
tland
sta
te c
onsu
ltatio
n ar
e in
clud
ed in
all
Afr
ica
eThe
kwin
i Mon
itorin
g to
giv
e an
indi
catio
n of
the
stat
us o
f San
itatio
n in
Som
alia
alth
ough
they
may
not
be
com
plet
ely
repr
esen
tativ
e of
the
who
le c
ount
ry.
Figure
18.2
AllAfricaeThekw
iniM
onito
ringResu
lts,A
fricaSan32011
(AMCOW
etal.2011
b).
eThekwini commitments monitoring and national sanitation action plans 155

Throughout AfricaSan3 the focus was on planned, realistic and sustained action towards improving sanitation. Newknowledge garnered through the conference thematic sessions combined with strengthened regional linkages andopportunities for technical assistance, peer learning and exchange through the conference sub-regional fora, helped countriesdevelop robust priority action plans for sanitation.
18.3 MONITORING THE eTHEKWINI COMMITMENTSAt the end of 2008, as part of the commitment to track and report on implementation of the eThekwini declaration, AMCOW andpartner agencies requested the Sanitation Task Force to lead the follow up on the commitments to sanitation (AMCOW TAC,2008). Through the AfricaSan Task Force Sub-Committee on eThekwini Monitoring and Action Plans, indicators weresubsequently developed along with criteria for measuring them. These indicators and criteria were reviewed duringin-country preparation meetings and the first All Africa eThekwini Monitoring report was produced and presented atAfricaSan3 (see Figure 18.2).
The high degree of variation in the sanitation environment across Africa limits the utility of the eThekwini monitoring as acountry benchmarking tool. Comparisons cannot be made between an upper middle-income country such as South Africa andone that has had no functioning government for 20 years such as Somalia. However, reviewing results across the commitmentsprovides useful insights into commonalities in commitment achievements. At a glance one can see that there has been progressacross most countries in developing national sanitation policies and action plans, but that securing adequate budgets and rollingout monitoring and evaluation systems has remained a challenge.
At county level, commitment monitoring can also be used to gauge progress over time and triangulate priorities to ensure thatresources are being targeted towards sector shortfalls.
18.4 AFRICASAN3 MINISTERS STATEMENT AND IMPLICATIONSThe all Africa eThekwini monitoring report presented at AfricaSan3 showed that countries had substantively met theeThekwini indicators, with both East and West Africa having scored green in over 70% of cases (see Table 18.1). However,in some cases the original indicators and criteria did not adequately measure implementation of the eThekwini commitments.For example, the indicator used to measure national policies and plans, captured only their existence and not the second halfof the commitment which calls for steps to be taken to ensure national sanitation programs are on track.
Other commitments were not included in the all Africa eThekwini monitoring – for example the commitment to use effectiveand sustainable approaches and that to build and strengthen capacity for sanitation and hygiene implementation.
To address these issues Ministers at AfricaSan3 recommended –through the sanitation taskforce – to:
(1) Review and propose indicators for those targets for which no indicators exist where necessary(2) Refine indicators for those targets which have now largely been met(3) Test and consult widely on the proposed new indicators and(4) To report back at the next AfricaSan meeting using the new proposed indicators
In response to this ministerial directive, the AfricaSan Sub-Committee for eThekwini Monitoring and Action Plans havedeveloped a monitoring methodology which matches eThekwini commitments to existing country data generated andvalidated by two on-going processes: the AMCOW Country Status Overview (CSO) and the UN-Water Global AnnualAssessment of Sanitation and Drinking-Water (GLAAS). Both these processes include indicators that capture eThekwiniCommitments and in most cases provide more depth to be able to gauge the degree to which the sector is implementingcommitments.
Table 18.1 2011 eThekwini Monitoring – proportionof commitments met by region.
Central 55%
East 71%
South 62.5%
West 71%
Sanitation and Hygiene in Africa156

As both CSO and GLAAS report on sanitation indicators for urban and rural settings individually, it will be possible todisaggregate data and present results for urban and rural settings independently to allow for more detailed analysis andbetter targeting.
Three of the original commitments are not included, as they do not specifically target country government action, ratherregional bodies, donors and other non-state actors. These are:
1. To bring the messages, outcomes and commitments made atAfricaSan 2008 to the attention of the African Union at its 2008Heads of State and Government Summit to raise the profile ofsanitation and hygiene on the continent.
AU Heads of State endorsed the eThekwinicommitments at the 11th Ordinary Session, 2008,Sharm el Sheik
2. To support the leadership of AMCOW to track theimplementation of the eThekwini Declaration and prepare adetailed report on progress in mid 2010, when AMCOW willprovisionally host a follow-up AfricaSan event.
All-Africa eThekwini monitoring completed byAMCOW and reported at AfricaSan 3, 2011
11. To give special attention to countries or areas which areemerging from conflict or natural disasters
Directed to donors’ (and NGOs’) engagement in fragilestates.
As a baseline, indicators will be drawn from the 2012 GLAAS report (2011 data) and the CSO2 (2009/10 data). The baselinewill be drafted through desk review, and countries given the opportunity to present evidence and supplement informationthrough regional dialogue and meetings in 2013. Against this baseline, a second All Africa eThekwini Monitoring will bemeasured and reported back at the next AfricaSan Conference in 2014.
The eThekwini Declaration and AfricaSan Action Plan, AfricaSan, 2008.
18.5 REFERENCESAMCOW TAC (2008). Meeting of the Technical Advisory Committee of the African Ministers Council on Water (AMCOW): Summary
recommendations, November 2008.AMCOW, WSP, UNICEF, WaterAid, CREPA (2011a). Sanitation and Hygiene in Africa at a Glance: a synthesis of country priority
actions. Available at: http://www.wsp.org/sites/wsp.org/files/publications/WSP-2011-Sanitation-&-Hygiene-in-Africa-at-a-Glance.pdf (accessed 10 September 2013).
AMCOW, WSP, UNICEF, WaterAid, CREPA (2011b). Sanitation and Hygiene in Africa at a Glance: eThekwini Traffic Lights Report.Available at: http://www.wsp.org/sites/wsp.org/files/publications/WSP-2011-eThekwini-Traffic-Lights-Report.pdf (accessed 6September 2013).
ANEW, AMCOW, IRC, UgandaWater & Sanitation Working Group, WaterAid, UNICEF andWSP-Af (2010). 2nd Eastern Africa SanitationConference. Conference Report, 2010. Available at http://www.wateraid.org/∼/media/Publications/eastern-africa-sanitation-conference.pdf (accessed 10 September 2013).
East Africa Sanitation Plans Peer and Panel Review (2010). Background documents to the 2nd Eastern Africa Sanitation Conference, Kampala,2010 (unpublished).
eThekwini commitments monitoring and national sanitation action plans 157


Chapter 19
Sustainable financing
Catarina Fonseca1, Kwabena Nyarko2, André Uandela3 and Guy Norman41IRC – International Water and Sanitation Centre2KNUST – Kwame Nkrumah University of Science and Technology3Co-Water Mozambique4WSUP – Water & Sanitation for the Urban Poor
Sanitation, and particularly rural and peri-urban sanitation, is still widely seen as a purely household responsibility. As aresult, most large-scale interventions to increase access to a basic level of service tend to focus exclusively on promotingdemand for latrines, capacity building for the development and setting up of small businesses for latrine construction,and awareness raising for hand-washing at critical moments. Based on studies by IRC, KNUST and WSUP inMozambique, Ghana and Burkina Faso, and supported by data from other countries, key findings presented in thischapter conclude that households are already financing the construction and maintenance of their facilities; that thepoorest will need subsidies for accessing and using basic sanitation services; and that unless funds are available forcontinuing hygiene promotion on a regular basis, long-lasting impacts on health and convenience expected from latrineconstruction will not be achieved. Existing data shows that coverage ‘averages’ mask the reality of poor use and poorreliability of sanitation facilities, and sanitation interventions need to seriously consider the finances needed to maintainboth the facilities and the hygiene behaviour changes over time. Coverage figures also hide existing inequalities in accessto service. This paper compares existing expenditure on different cost components against benchmarks, and suggests howto reformulate financing strategies for sanitation services.
19.1 THE CHALLENGETwo and a half billion people are still without basic sanitation access (37% of the global population); almost three-quarters ofthese people live in rural areas; open defecation is still practised by 1.1 billion people (15% of the global population); thesanitation MDG is not going to be met. If these figures sound bad, reality is proving even worse. Extensive data collectionon the services received by households in Mozambique, Ghana, Burkina Faso and India concludes that the level of sanitationservices delivered to rural populations is very poor, below national or international norms (Burr & Fonseca, 2011).
Additionally, the poorest are more likely not to have water and sanitation services than the wealthy, and rural areas have muchlower coverage than urban areas. Inequalities extend beyond wealth and geography: girls and women are more likely to bear theburden of water collection, women without access to sanitation suffer the indignity of being forced to defecate in the open and areat risk from rape and assault, and the widespread lack of menstrual hygiene management facilities limits the participation ofwomen in education and the workplace.
Universality is about ensuring WASH services for all – even the hardest to reach – without exception. Currently, there islimited equality in access: the poorest are more likely not to have sanitation services than the wealthy; rural areas have muchlower coverage than urban areas. The latest JMP report shows that in many of the countries which have increased access,there is a disproportionate increase in access by those in the wealthier quintiles and those living in urban areas. This isespecially true for sanitation.
WASHCost teams in Burkina Faso, Ghana, Andhra Pradesh (India) andMozambique collected and analysed cost and servicelevel information for water, sanitation and hygiene in rural and peri-urban areas, applying the life-cycle costs approach. The

life-cycle costs approach examines the complex relationships between expenditure, service delivery, poverty, effectiveness andsustainability. The research has identified expenditure on provision, support and long-term maintenance and replacementrequired to ensure that sanitation services meet national standards and serve families into the future. It offers a financialperspective on sanitation problems, which are exacerbated by limited affordability and limited effective demand.
WASHCost findings on costs and service levels include among others:
(1) In Mozambique, the very poor are twice as likely to defecate in the open as the less poor and less likely to have access toanything other than a traditional latrine. Three quarters (73%) of those classified as ‘less poor’ have access to sanitation,compared with two thirds (67%) of ‘poor’ families and half (52%) of the ‘very poor’.
(2) In Andhra Pradesh, 17% of households received a financial incentive from the government to construct latrines, but only32% of household latrines are used by all family members and 17% are not used at all. Households were more likely touse latrines when they have invested their own resources. Even in villages that won government prizes for becoming‘open-defecation free’ slippage is a problem, meaning that people return to open defecation.
(3) Technically advanced latrines cost more but do not necessarily deliver significantly better services.
19.2 WHAT NEEDS TO BE FINANCED?To understand what needs to be financed, we first need to break down costs (fixed and recurrent) and compare them against theservices delivered. The costs for sanitation services can be roughly divided into six cost categories illustrated in Table 19.1. Mostcosting methodologies compare the costs of different technologies along the sanitation chain, that is, a technology-basedapproach. However, the same technology – for instance a single pit latrine – can provide different levels of servicedepending on the quality of construction, on the availability of pit emptying, or on whether the waste is disposed safely. Thisis at the heart of life-cycle cost analysis: comparing sanitation costs with the service levels received by households (Fonsecaet al. 2011). Analysing disaggregated data provides guidance on finance gaps and how value for money can be achieved.
Table 19.1 WASHCost life-cycle cost components.
Cost Components Brief Description
Capital Expenditure(CAPEX) Thecosts of providing a service wherethere was none before; or ofsubstantially increasing the level ofservices.
Capital ExpenditureHardware (CapExHrd)
Capital investment in fixed assets, such as cost ofexcavation of pit, lining, slabs, superstructures anddrainage pipes, drainage systems, solid waste disposalsystems.
Capital ExpenditureSoftware (CapExSft)
Expenditure on one-off work with stakeholders prior toconstruction or implementation, extension, enhancementand augmentation (including one-off capacity building).
Recurrent expenditureExpenditureassociated with maintaining anexisting service at its intended level.
Operational Expenditure(OpEx)
Recurrent (regular, on-going) expenditure on labour,materials and purchases of cleaning products for sanitaryfacilities, soap for handwashing, minor repairs.
Capital MaintenanceExpenditure(CapManEx)
Asset renewal and replacement cost: occasional andlumpy costs that seek to restore the functionality of asystem, such as replacing slabs, superstructure orirregular pit emptying.
Cost of Capital (CoC) Cost of interest payments on micro-finance and any otherloans taken to construct sanitation facilities.
Expenditure on DirectSupport(ExpDS)
Expenditure on on-going support activities for serviceproviders, users or user groups. Costs of regularlyconducting awareness campaigns and trainingprogrammes.
Expenditure on IndirectSupport(ExpIDS)
Expenditure on macro-level support, including planningand policy-making, and support to decentralised serviceauthorities or local government.
Source: Fonseca et al. (2011).
Sanitation and Hygiene in Africa160

WASHCost has tested over 1000 indicators in its 5 years of action research. Of these, there are four key criteria of services thatare critical to define a sanitation ‘service’, namely: accessibility to sanitation facilities which separate faeces from users; use ofthe facilities by household members; reliability and cleanliness of the facilities; and non- problematic environmental impact(Potter et al. 2011). For sanitation, a basic level of service is achieved when the following criteria are met by the majority ofthe population in the service area:
(i) At least some members of the household use a latrine with an impermeable slab available at the house, in the compoundor shared with neighbours.
(ii) The latrine is clean, even if this may require high user effort for pit emptying and other long-term maintenance.
The disposal of sludge is safe and use of the latrine does not result in problematic environmental impact.Under each of the criteria there are several indicators which also feature in many country standards and norms. There are also
many other possible indicators, including affordability and acceptability: however, these require considerable resources tocollect, and are not easy to compare within a country or across different countries. The criteria and indicators chosen toidentify a minimum level of service have been tested at scale and are replicable with meagre country resources whenincluded in on-going monitoring systems. Therefore, they have the potential for being used and collected with some regularity.
The capital cost of building latrines varies widely within and between countries, reflecting differences in local conditions andmarkets, and in construction quality and standards. The minimum expenditure required to provide a basic level of sanitationservice ranges from US$ 7 for a basic pit latrine to US$ 36 (2011 prices) for a VIP latrine. Where the cost of materials andconstruction is comparatively high, the benchmarks suggest that a pit latrine can cost US$ 26 and a VIP latrine as much asUS$ 358 to provide a basic level of service.
In general, latrines cost more to construct in urban and peri-urban areas than in rural areas, and the cost rises with thesophistication of the technology. The cost of VIP latrines in more densely populated peri-urban areas can be two to threetimes higher than in rural areas. The cost of constructing VIP latrines is five times higher in Burkina Faso than in Ghana andMozambique (Burr & Fonseca, 2011).
Building a latrine is only a first step towards an effective sanitation service. The latrine must be used, kept clean, maintainedand replaced at the end of its useful life if families and communities are to benefit. Table 19.2 provides recurrent expenditurebenchmarks for basic sanitation services.
The most problematic recurrent costs – because they are inadequately financed and result in poor services – are the directsupport costs and the capital maintenance expenditure. Expenditure on structured efforts to support sanitation andenvironmental protection is known as expenditure on direct support. Direct support covers the promotion of latrineconstruction and use, stimulating demand, and working towards sustained behaviour change. These ‘software’ costs areusually neglected in cost estimations. Regular campaigns are needed to promote regular pit-emptying and environmentalprotection, including checks to ensure that water sources are not contaminated with faecal material.
The WASHCost benchmark expenditure on direct support on sanitation ranges from US$ 0.5 to US$ 1.5 per person per yearto maintain a basic service. In reality, the actual expenditure on direct and indirect support found in the WASHCost researchcountries is five to ten times lower than this, ranging from US$ 0.1 and US$ 0.2 per person per year in rural Andhra Pradeshand Mozambique (Verhoeven & Smits, 2011).
Table 19.2 Recurrent expenditure benchmarks for basic sanitation services.
Breakdown of recurrent expenditure* Cost ranges[min-max] in US$ 2011 per person, per year
Traditionalpit
VIP typelatrines
Pour-flush orseptic-tank latrines
Operational and minor expenditure 0.5–1 1–4 1–4
Capital maintenance expenditure 0.5–1.5 1–3** 2–6**
Expenditure on direct support*** 0.5–1.5 0.5–1.5 0.5–1.5
Total 1.5–4 2.5–8.5 3.5–11.5
*‘Cost of capital’ and ‘expenditure on indirect support’ are not included owing to insufficient and unreliable sources of information.**Based on pit-emptying figures derived from Chowdhry and Kone, 2012. Figures used for pit-emptying assume that traditional VIP-type latrinesrequire emptying every five years, and pour flush/ septic tanks every two years. These figures may be adapted to context-specific situations.***Derived from a soon-to-be-published dataset from a large implementation programme in the sector.
Sustainable financing 161

The recurrent costs of keeping the latrine clean and maintained, of emptying the pit and safely disposing of sludge, and of‘capital maintenance’ to ensure that major repairs are carried out, are essential for sustainable sanitation and were found torange between US$ 0.5 per person per year for traditional pit latrines and up to US$ 6 per person per year for pour-flush orseptic-tank latrines. Data on pit-emptying is especially scarce, underlining that this is a rare event. Without proper attentionto emptying latrines and to high-cost major repairs, most fill up or fail within two years in peri-urban areas, and within fiveto eight years in rural areas. If latrines do not fill up, it can indicate that they are not being used by all family members.Widespread lack of use and failure of household latrines are both public health and environmental issues: not simplyfamily problems.
In Burkina Faso,Mozambique andGhana, higher levels of service are achieved in peri-urban/small-town areas in comparisonwith rural areas, due to improved environmental protection and reliability. This coincides with generally higher expenditure onconstruction and recurrent costs.
In addition to widely observed deficits in the financing of specific sanitation cost components, there are deficits in thefinancing of sanitation for specific groups in the population. Inequalities in access to sanitation services are present in everycountry of the world: inequities related to gender, age and disability are consistent across the world, while others related toethnicity and caste are country-specific. The existing data available for WASH coverage per wealth quintile (JMP) impliesthat in many countries in the world, coverage has increased in the higher quintiles but has stagnated in lower-income groups.This implies that funds will need to be targeted specifically for the poorest in these countries.
19.3 WHAT IS BEING FINANCED BY WHOM?Although governments have policies to develop safe sanitation and programmes to build latrines, in rural areas sanitation islargely left to families. Local expenditure on sanitation in the countries where WASHCost has carried out detailed costingresearch is too low, and is focused almost entirely on the capital costs of building latrines. The expenditure is largely met byhouseholds or government subsidies directly to households, or – more commonly – to small businesses to reduce the costs oflatrine construction. On the other hand, the largest sanitation programmes in the sector (typically grant-funded) tend to focuson innovative and expensive infrastructure and/or ensuring the ‘right’ enabling environment, promoting local business andcreating demand for sanitation and hygiene programmes.
As a result, there is a striking gap between the expenditure required to provide a basic level of service to the poorest, and whatis actually being spent. Too little is spent on stimulating and sustaining demand for hygienic latrine use, and on ensuring thatlatrines are kept clean and in good repair on a yearly basis until there is evidence that hygiene behaviour has really changed.Further, the absence of arrangements for pit emptying and measures to ensure environmental protection is adverselyaffecting service levels achieved.
The findings of WASHCost research in Burkina Faso, Ghana, Mozambique and the state of Andhra Pradesh in India showthat expenditure on keeping latrines clean and in good condition is generally far too low. However, there exists a constituency offamilies who highly value their facilities and regard them as a worthwhile family investment. A significant minority (10–15%) ofhouseholds in Burkina Faso and Ghana spend more than US$ 15 per person per year on keeping their latrines clean and in goodcondition. These ‘high-spending’ households – many of whom beautify their latrines and bathrooms – are more common inperi-urban areas and amongst households with more technologically advanced latrines. It would be of great benefit toidentify the key factors that motivate these families and to try to replicate that in stimulating demand.
Actual expenditure on indirect support – policy-making, planning and training at a higher level to strengthen the sector –wasvirtually invisible for sanitation in WASHCost research countries.
19.4 HOW TO MEET THE FINANCING GAP?The cost of sustaining basic sanitation services for 20 years can be 5–20 times the cost per person of building a new latrine. Asdescribed in this paper, even although households are already contributing to meet many of the costs, the actual recurrentexpenditure on the smaller and regular operational maintenance, as well as the larger and irregular expenditure on capitalmaintenance is extremely low. This is assumed to be strongly linked to the high observed levels of low use by all or somemembers of the household, and low reliability once the pit is full or the slab needs to be replaced.
The most conspicuous finding from the different studies has been the poor level of sanitation services delivered to ruralpopulations. WASHCost data demonstrates a completely inadequate level of expenditure on recurrent costs following initialconstruction associated with low service levels. This situation can be remedied if, following construction of newinfrastructure, there are people and finances in place to ensure that latrines and hand-washing facilities continue to be usedand assets are maintained (with regular pit latrine emptying, for instance).
Sanitation and Hygiene in Africa162

We suggest that instead of a lack of finances, a re-allocation of some of the existing expenditure to ensure follow-up activitiesand pit-emptying would deliver more value for money in the medium and long term. Ensuring that higher recurrent costs (slabreplacement, transport, pit-emptying, water seal replacement, etc.) are being paid, either by households or by implementingagencies, can improve value for money by protecting assets and avoiding a waste of capital expenditure. A system wherelife-cycle costs are transparent and fully covered can be a system in which capital investments can be used to extend andimprove services, rather than replacing services that have failed prematurely.
Households are already contributing much more than is generally acknowledged. WASHCost research suggests that it isunlikely that poor families can meet the costs of basic sanitation. A better understanding of the real costs of sanitation for thepoorest families is needed, together with a more detailed picture of affordability. An important message emerging from theIRC-WASHCost data and WSUP implementation experience is that without a clear commitment from governments, NGOsand donors to subsidise (i) latrine construction for the poorest and (ii) major recurrent costs over the long term, sustainablesanitation services for poor communities in developing countries will remain unachievable.
For an analysis of potential pro-poor sanitation financing mechanisms, WSUP has produced discussion papers on progresslinked finance and sanitation surcharges collected through water bills, assessing the feasibility for these mechanisms to addresssome of the financing gaps mentioned above (WSUP, 2011–2012).
19.5 LOOKING FORWARDWhat is not measured is not costed, what is not costed is not done. Applying the life-cycle cost approach to sanitation servicesand assessing the level of service delivered after the interventions, ensures that implementing agencies start to monitor thesustainability of their programmes. How many of the household members are still using the latrines after 2 years? Is non-usemore common among the poor? How reliable are pit latrine emptying services in the area? How many of these problems area result of lack of appropriate financing?
IRC, KNUST and WSUP have identified the following areas where there is still relatively limited knowledge for financingsustainable sanitation services at scale:
(i) The use of correct and appropriate costing language in the sanitation and hygiene sub-sectors is critical for comparinglike with like when financing needs are discussed. Over recent years, more studies in which sanitation costs are madeexplicit are becoming available, but it is unclear what cost components are taken into account. The life-cycle costapproach provides a standard language which is commonly used in urban infrastructure.
(ii) The WASHCost life-cycle cost benchmarks for a basic sanitation level are based on a limited data set. It is critical thatlarge scale sanitation programmes share and make their costs publicly available. This would ensure more accuratebenchmarks and, as a result, more realistic and robust financing approaches.
(iii) There are at present no cost benchmarks for delivering effective school sanitation and hygiene programmes whichinclude menstrual hygiene education and facilities. This is an area of research which is critical, specifically toensure that girls continue to attend school once they reach puberty.
(iv) For those countries with a high sanitation coverage level, little is known on the cost of reaching the last 20% or 10%.Will these households cost more to reach because they either live in remote areas or are destitute? Will specificmeasures be needed to reach them, including different intervention and financing models?
(v) There is a strong case for policy makers to refocus sanitation priorities. Planning for demand creation and latrineconstruction is important. It is also critical to plan for higher expenditure on support and measures to promotelatrine use and environmental protection, including systems for pit emptying and the safe disposal of faecal sludge.
Looking forward, there needs to be progress overall in access to sanitation services, for all the wealth quintiles, for the wholepopulation. Success cannot be measured with averages, it cannot come at the expense of stagnating coverage and inadequateservices for the poorest.
Success will need to be measured in terms of reducing existing inequalities in access to sanitation - between rich and poor,urban and rural dwellers, slums and formal urban settlements, and disadvantaged groups and the general population. This alsoimplies a need for tracking patterns of discrimination and inequality in access to sanitation services across countries so as toencourage targeted efforts to improve them. This means improving the monitoring and analysis of different forms ofdiscrimination and inequality, and disaggregated datasets.
Ultimately, setting targets specifically for reducing inequalities in access to sanitation and hygiene services will enablecountries to strike a balance between investing in sustainable and better services while at the same time investing in reachingthe ones that have been, so far, left out.
Sustainable financing 163

19.6 REFERENCESBurr P. and Fonseca C. (2011). Applying the Life-cycle Costs Approach to Sanitation: Costs and Service Levels in Andhra Pradesh (India),
Briefing Note 3, Burkina Faso, Ghana and Mozambique. IRC International Water and Sanitation Centre, The Hague. Available at: http://www.washcost.info/page/1626 (accessed 2 September 2013).
Catão R. and Naafs A. (2012). Custos de saneamento peri-urbano: Análise dos custos de construção e manutenção de infra-estruturas desaneamento em alguns Bairros de Maputo, WASHCost Folheto Informativo Moçambique S03, WASHCost Mozambique, Maputo.Available at: http://www.washcost.info/page/2418 (accessed 2 September 2013).
Dubé A., Bassono R. and Pezon C. (2011). Le coût des latrines au Burkina Faso: une application de l’approche des coûts à long terme,Document de travail N1, IRC International Water and Sanitation Centre and Ougadougou: WASHCost Burkina Faso, The Hague.Available at: http://www.washcost.info/page/1701 (accessed 2 September 2013).
Dwumfour-Asare B. K., Nyarko K. B., Moriarty P., Obuobisa-Darko A. and Appiah-Effah E. (2012). Life-cycle Costs in Ghana: Access toSanitation Services, WASHCost Ghana Briefing Note 5, IRC International Water and Sanitation Centre, The Hague. Available at: http://www.washcost.info/page/2316 (accessed 2 September 2013).
Fonseca C., Franceys R., Batchelor C., McIntyre P., Klutse A., Komives K., Moriarty P., Naafs A., Nyarko K., Pezon C., Potter A., Reddy R.and Snehalatha M. (2011). Life-cycle Costs Approach: Costing Sustainable Services, WASHCost Briefing Note 1a [pdf] IRCInternationalWater and Sanitation Centre, The Hague. Available at: http://www.washcost.info/page/1557 (accessed 2 September 2013).
Norman G., Fonseca C. and Jacimovic R. (2012). FinancingWater and Sanitation for The Poor: Six Key Solutions,Water and Sanitation for theUrban Poor: Discussion Paper; DP#003. The Hague, The Netherlands, IRC International Water and Sanitation Centre and London, UK:Water and Sanitation for the Urban Poor (WSUP).
Potter A., with Klutse A., SnehalathaM., Batchelor C., Uandela A., Naafs A., Fonseca C. and Moriarty P. (2011). Assessing Sanitation ServiceLevels, WASHCost Working Paper 3, 2nd edn. IRC International Water and Sanitation Centre, The Hague. Available at: http://www.washcost.info/page/902 (accessed 2 September 2013).
Potter A., Uandela A. and Naafs A. (2012). Sanitation Service Levels: Assessing Services in Rural and Peri-urban Mozambique, WASHCostMozambique Briefing Note S02, WASHCost Mozambique, Maputo. Available at: http://www.washcost.info/content/download/2002/13806/file/S-02%20Sanitation%20services%20in%20Mozambique.pdf (accessed 2 September 2013).
Snehalatha M., Ratna Reddy V. and Jayakumar N. (2010). Assessing Sanitation Costs and Services in Andhra Pradesh, India. In IRCInternational Water and Sanitation Centre, IRC Symposium 2010 Pumps, pipes and promises. The Hague. 16–18 November 2010,The Netherlands. IRC International Water and Sanitation Centre, The Hague. Available at: http://www.irc.nl/page/55873 (accessed2 September 2013).
Snehalatha M. and Anitha V. (2012) India’s total sanitation campaign: is it on the right track? Progress and issues of TSC in Andhra Pradesh.Journal of Rural Development, 31(2), 173–192.
Snehalatha M., Anitha V., Busenna P. and Venkata Swamy M. (2012). Nirmal gram puraskar and sanitation service levels: curse of slippage,WASHCost-CESS Working Paper 24, WASHCost India and CESSS, Hyderabad. Available at: http://www.washcost.info/page/2639(accessed 2 September 2013).
Trémolet S., Kolsky P. and Perez E. (2010) Financing On-site Sanitation for the Poor. A Six Country Comparative Review and Analysis,A Report for the Water and Sanitation Programme, The World Bank. Available at: http://documents.worldbank.org/curated/en/2010/01/ 12840650/financing-on-site-sanitation-poor-six-country-comparative-review-analysis (accessed 2 September 2013).
Uandela A. and Naafs A. (2012). Custos das infra-estruturas de saneamento em Moçambique: análise dos custos de construção deinfra-estruturas de saneamento rural e peri-urbano. WASHCost Folheto Informativo Moçambique S01, WASHCost Mozambique,Maputo. Available at: http://www.washcost.info/content/download/1997/13768/file/S-01%20WASHCost%20Custos%20das%20infastructuras%20de%20saneamento.pdf (accessed 2 September 2013).
Verhoeven J. and Smits S. (2011). Post-construction support for sustainable rural water supply services. Expenditure on direct and indirectsupport. In RWSN-Rural Water and Sanitation Network, 6th Rural Water and Sanitation Network Forum. 29 November–1 December2011, Kampala, Uganda, St. Gallen: RWSN Secretariat. Available at: http://www.washcost.info/page/1831 (accessed 2 September2013).
WSUP (2011a). Financing Communal Toilets: The Tchemulane Project in Maputo. Practice note. Available at: http://www.wsup.com/sharing/documents/PN002CommunalToiletsMaputo.pdf (accessed 2 September 2013).
WSUP (2011b). Using Water Kiosk Revenues to Cross-finance Environmental Hygiene: Tana’s RF2 Model. Practice note. Available at:http://www.wsup.com/sharing/documents/PN001WaterKioskTanaEnglish.pdf (accessed 2 September 2013).
WSUP (2011c). Progress-linked finance: A Study of the Feasibility and Practicality of a Proposed WASH Financing Approach. Discussionpaper. Available at: http://www.wsup.com/sharing/documents/DP002ProgressLinkedFinance.pdf (accessed 2 September 2013).
WSUP (2012). Sanitation Surcharges Collected through Water Bills: A Way Forward for Financing Pro-Poor Sanitation? Discussion paper.Available at: http://www.wsup.com/sharing/documents/DP004SanitationSurcharges.pdf (accessed 2 September 2013).
Zita J. and Naafs A. (2011). Cost of PEC-Zonal activities in Mozambique: Analysis of Contract Costs from 2008 up to 2011, WASHCostMozambique Briefing Note D 01, WASHCost Mozambique, Maputo, Available at: http://www.washcost.info/page/1804 (accessed 2September 2013).
Sanitation and Hygiene in Africa164

Chapter 20
Monitoring sanitation in Africa Ongoing initiativesand lessons from the field
Abdou-Salam Savadogo1
World Health Organization2
Monitoring sanitation and hygiene has been a challenge in many countries in Africa, when, for decades sanitation was littlemore than hardware provision. Behaviour changes, such as hand washing, safe management of excreta and water athousehold level, are private and sensitive issues in most cultures and difficult to measure. At AfricaSan 3, the sessions onmonitoring provided opportunities to address these and other issues and share approaches and best practices. Thischapter summarizes the discussions in Kigali on the status and challenges of monitoring WASH and examines ways ofstrengthening monitoring at all levels.
20.1 THE AFRICAN REGION: LONG ROAD TO THE SANITATION MDGAfrica as a whole is not on track to achieving the sanitation MDG: the only sub-region on track is North Africa. Only fourcountries are currently going to meet the sanitation MDG. Progress is slow: according to a recent snapshot on WASHpublished by AMCOW, sanitation coverage only increased from 35 percent in 1990 to 40 percent in 2010, representing 189million people that have gained access. In the same period the population grew by almost 400 million people. More than onein five people in Africa still practice open defecation. A few African countries have performed well above the others andshow a substantial growth in coverage since 1995. These include Angola, Cape Verde, the Democratic Republic of Congo,Gambia, Malawi and Rwanda.
The Joint Monitoring Program (for water and sanitation managed by UNICEF andWHO) has recently undertaken an analysisof the access to sanitation by wealth quintiles. An analysis of the data from 35 countries in sub-Saharan Africa (representing 84percent of the region’s population) shows that over 90 percent of the richest quintile in urban areas uses improved sanitation.However, in the poorest rural quintile, open defecation is practiced by over 60 percent of households.
20.2 RECONCILING JMPAND COUNTRY SANITATION COVERAGE DATAEven though sanitation is specific to context, the JMP endeavours to produce estimates that are comparable among countries andacross time. This means that global definitions need to be standard, whilst countries use their own definitions, standards andclassifications of sanitation facilities. Issues in reconciling JMP and country data include:
• The JMP uses a linear trend line for its estimation, whereas countries use different data sources and different methods ofestimation, resulting in different datasets. JMP helps to explain these differences through a ‘data reconciliation’ process.
• The current JMP method of monitoring assesses progress solely on the basis of the types of facilities used, whereassanitation (at large) includes many other considerations that go beyond the infrastructure alone. In fact, manystakeholders recommend that the estimates of the JMP consider aspects such as usage of toilets, treatment of excreta, etc.
1Several individuals who co-led the monitoring session have given valuable comments on different parts of the chapter. Special thanks to: Ramatu Jalloh, WASHCommunication for Development Specialist, UNICEF Sierra Leone; Muchie Kidanu. WASH Specialist, UNICEF Ethiopia; Abiy Girma. Focal Person WASHInventory. Ministry of Water and Energy (Ethiopia); and, Alastair Morrison. Programme Manager, UNDP Water Governance Facility at SIWI.2Disclaimer: The author alone is responsible for the views expressed in this chapter; they do not necessarily represent the decisions, policy or views of WHO.

• The exclusion of shared facilities from the category of improved sanitation is contentious, especially as shared sanitation iswidespread, can be a public health improvement and is the only alternative in many urban areas.
• The use of MDG monitoring indicators at the country level is also questioned and some stakeholders recommend that thecurrent JMP indicators be ‘localized’ to increase their value for sector planning, policy development and investment.
These are all valid points and WHO and UNICEF is seeking to address them in future monitoring initiatives. As a globalmonitoring mechanism, the JMP is required to produce global access estimates to describe tends, track progress towards theMDG target and provide evidence to global decision-makers to and enable them to shape future global strategy toimprove sanitation.
20.3 COUNTRY MONITORING CAPACITIES ARE WEAKNational capacities are inadequate to produce timely and reasonably accurate monitoring data (GLAAS, 2012). CSO2 hasreported that only two countries (Uganda and South Africa) have dedicated national mechanisms for monitoring the qualityand quantity of sanitation facility uptake. However, even in these countries, the relationship between public interventionsand the quality and quantity of household uptake of sanitation has not been established (CSO2, 2012). A common bottleneckis the lack of budget for the WASH sector monitoring as a whole.
In Africa, there are few countries where the information on hygiene – on a national scale – is available and regularly updated.Data on hygiene are scarce and what there is may even be distributed amongst several institutions. Some countries have yet toestablish a meaningful baseline. Lack of attention to monitoring is indicative of the low profile given to sanitation and hygiene bythe country authorities. An exception is the case of Ethiopia. Box 20.1 describes how Ethiopia has prioritized sector monitoringand what it has taken to put a system in place.
20.4 SUB-NATIONAL MONITORING AND THE CHALLENGE OF NATIONAL ALIGNMENTMany encouraging sanitation initiatives have been undertaken in Africa, as reported in various sessions at AfricaSan 3. Many ofthese occur at the local level and are monitoried as projects or through local institutions, but this information is not fed intonational monitoring systems. A case in point in Community-Led Total Sanitation (CLTS): at AfricaSan 3 is was reportedthat over 34 countries in Africa are actively tackling the problem of open defecation through the adoption of approaches on
BOX 20.1 THE ETHIOPIAN NATIONALWASH INVENTORY TRACKS THE HYGIENE PROMOTION OUTCOMES
Since 2009, the Ethiopian Government has set up a consolidated National WASH Inventory (NWI) to capture information onthe status of water supply, sanitation and hygiene in the country. The inventory, for the first time, establishes comprehensivebaseline data for the whole of Ethiopia and for all stakeholders. The NWI is able to track the hygiene promotion outcomes(e.g. hand washing) and feed information into the district and national monitoring systems. Sector monitoring by NWIincreases responsibility and ownership by implementers at different levels both inside and outside of Government.
NWI is phased as follows:
• The 1st phase (June 2010) comprised the regions of Afar, Harari and Dire Dawa, where data collection has beencompleted.
• The 2nd phase (June 2011) included the remaining regions: Oromia, Amhara, Southern Nations and NationalitiesPeople’s (SNNP) regions, Tigray, Benishangul-Gumuz, Gambella, Somali and Addis Ababa. The data collection ofPhase 2 regions is completed and data are being checked and analysed.
NWI has been established after several major steps in building the sector in Ethiopia. These include: the civil service reformand the hiring of health sector staff, the drafting of a Universal Access Plan for WASH, the establishment of a MoU betweenthe Education, Health and Water sectors and the development training modules on hygiene and sanitation promotion. TheNWI is a data collection exercise on a vast scale covering all Ethiopians districts and municipalities; over 730Woredas andover 16,600 Kebeles. The exercise required training of over 46,000 Kebele-level enumerators and intensive coordination oflogistics. NWI has made steady progress as a result of good preparation, delegation of roles, cooperation with non-stateactors and a well-designed incentives. Local capacity remains a challenge: Woreda staff require more knowledge onreporting and analysis and more financial resources and logistical support.
Sanitation and Hygiene in Africa166

CLTS. These approaches are even included in national sanitation policy and strategy documents in more than 10 Africancountries (CSO2). A sample of countries includes Ethiopia, Madagascar, Ghana, Mali, Nigeria. The Sierra Leone case (Box20.2), gives a sense on how a multi-stakeholder partnership, built by Government, civil society organizations andcommunities can support the spread of CLTS. Some countries have even set targets by which they will eliminate opendefecation on a national level. This is the case of Rwanda where a target was set for the elimination of ODF by 2017 andKenya where the target was set for 2013.
CLTS typifies the problem of aligning local and national monitoring. Many CLTS activities are only monitored as the districtlevel and data is not fed up into national monitoring systems. This disjuncture between sub-national and national monitoring isalso prevalent in urban areas. Monitoring of services to slums is generally neglected by utilities and service data is not alwaysdisaggregated. Utilities also usually monitor sludge offloaded at sewage plants, leaving out the neighborhoods predominatelyserved by on-site sanitation facilities. As a result, the waste produced in cities is grossly underestimated. The use of mobilephones and GIS offer potential for improvement of urban monitoring but these have not yet been applied on a national scale.
Alignment of sub-national to national monitoring systems is a generic problem in sanitation and hygiene monitoring.Improvements should be based on the following pillars of action:
• Capacity building at each step to strengthen monitoring processes.• Alignment with and inclusion of local monitoring in the national one, in terms of definition, indicators and timeframe, in
order to accurately reflect national figures• Provision of institutional strengthening and support mechanism by the Government to leverage community participation
and involvement.
20.5 THE ENABLING ENVIRONMENT MATTERSMonitoring the enabling environment for the water, sanitation and hygiene sector helps to increase effectiveness and efficiencyof funding injected into the sector. In Africa, this is monitored and analysed in two ways: the UN-Water Global Analysis andAssessment of Sanitation and Drinking-Water (GLAAS) and the AMCOW Country Status Overview (CSO).
20.5.1 The UN-Water Global Analysis and Assessment of Sanitation andDrinking-Water (GLAAS)The objective of the UN-Water Global Analysis and Assessment of Sanitation and Drinking-Water (GLAAS) is to monitor theinputs required to extend and sustain water, sanitation and hygiene (WASH) systems and services. This includes the components
BOX 20.2 MONITORING CLTS IN SIERRA LEONE
Community Lead Total Sanitation (CLTS) is known as a participatory learning and action approach which stimulates acollective community sense of shame, fear and disgust, as community members confront the harsh realities of poorsanitation and its negative effects on the entire community. In 2009, the Government of Sierra Leone (GoSL) adopted acomprehensive policy aiming to achieve 100% open defecation free (ODF) in one district and 50% in five others. Sincethen, the CLTS process has been led by GoSL through the Ministry of Health and Sanitation and includes NGOs asGOAL, PACE, MUWODA (local NGOs), and local councils and communities.
CLTS has become a strategic priority in Sierra Leone’s Poverty Reduction Strategy Paper (PRSP II). It is implemented insix districts with a plan to scale up to another six. The activities already carried out included training for Government staff,NGO staff and Natural Leaders. In schools, child-friendly WASH facilities were built and health clubs were established. Aregularly updated, functional database on CLTS is established within the Ministry of Health and Sanitation (MOHS). Allthese achievements ‘triggered’ 3949 villages, of which 1534 are declared ODF. It is anticipated that the first district(Kenema) is planned to be 100% ODF by the end of this year and remaining 5 districts in 2013.
Despite this encouraging progress, ensuring regular data collection and monitoring visits is a problem Not all theenumerators are able to perform data using a GPS. The Implementing Partners do not have the resources needed tocover large areas assigned to them, sometimes located in remote areas. Advocacy to decision-makers could alsoimprove. Communications could improve such as on radio programs, talk shows, drama series, and videos etc. One ideais for district councils to reward ODF communities by providing them with safe drinking water as part of a WASH package.
Monitoring sanitation in Africa Ongoing initiatives and lessons from the field 167

of the ‘enabling environment’: documenting government policy and institutional frameworks; the volume, sources and targetingof investment; the sufficiency of human resources; priorities and gaps with respect to external assistance.
The GLAAS report is an invaluable input to the Sanitation and Water for All (SWA) High-Level Meeting, where ministerialdelegations from developing countries and donors discuss ways to overcome bottlenecks in the process of providing basicsanitation and safe drinking water to all people.
The GLAAS uses the data collected from countries and supplements these with new data collected from External SupportAgencies (ESAs). At the country level, the production of the report is facilitated by national focal points with the support ofthe WHO country office and in some cases, an external facilitator.
The second UN-Water GLAAS report, released in April 2012, presents data received from 74 developing countries (of which37 African countries), covering all the Millennium Development Goal (MDG) regions, and from 24 external support agencies(ESAs). A total of 35 Sub-Saharan countries and 2 North African countries (Egypt and Morocco) participated in the reporting.
The report pointed out that in 2010, some countries from Sub-Saharan Africa have reported a shortage of funding, and havehigh needs. These include the Democratic Republic of Congo, Guinea-Bissau, Liberia, Madagascar, Mali, Nigeria, to name afew. Despite the shortage of funds, some of them have also reported a limited capacity in using funds that are allocated bydomestic governments or committed by external donors. Other countries have done particularly well in policies andfinancing. This category of countries includes Burkina Faso, Ethiopia, Ghana, Kenya, Rwanda and South Africa.
In many countries, the use of periodic reviews to monitor and evaluate the performance of sanitation and drinking wateruptake and services has been increasingly institutionalized as a basis for planning.
Finally, the need to strengthen the collection of the WASH financial information, a harmonized method of data monitoringwas also emphasized in the report.
20.5.2 The AMCOW country status overview (CSO)Country Status Overviews (CSO) analyse the ways in which inputs (finance) are translated into outcomes (coverage or use)through government systems. The report identifies the barriers in the WASH service delivery pathways and presentsremedial priority actions of each country surveyed.
The development of the CSO2 was commissioned by the African Ministers’ Council on Water (AMCOW) and led by theWorld Bank-administered Water and Sanitation Program (WSP) in collaboration with the African Development Bank(AfDB), the United Nations Children’s Fund (UNICEF), the World Bank and the World Health Organization (WHO). Thisfollowed the initial development of CSO1 by the Water and Sanitation and published in 2006. The CSO2 assessmentcovered a total of 32 countries in Africa.
The main findings of CSO2 were:
• Countries that have done better in extendingWASH services are not necessarily the wealthiest. In fact, low-income stablecountries3 made the most progress in reducing open defecation in rural areas and in increasing access to sanitation inurban areas.
• Disparities among countries in the sanitation are striking and are sometimes huge .• Disparities between richest and poorest quintiles persist in most countries.• A key action is to ensure that service delivery pathways are embedded within, and linked to, core government systems.
CSO’s are a useful instrument because they provide an analysis of the sector country by country. This collection of data not onlyto decision-makers to see the overall status and achievements of a country, but to all stakeholders in a sector to see where they canposition their contributions towards a greater good. Several other initiatives also provide a country-based analysis. Box 20.3describes the country assessments undertaken by the UNDP MDG GoAL WASH project.
20.6 MONITORING eTHEKWINI COMMITMENTSDuring the AfricaSan+5 held in Durban, South Africa in February 2008, the Ministers and heads of delegations responsible forsanitation and hygiene from 32 African countries made the eThekwini commitments for sanitation. These included creatingsanitation policy, developing a national plan to meet the sanitation MDG, establishing one institution accountable for leadingthe sanitation and allocating 0.5% of GDP to sanitation.
Since the eThekwini Declaration was signed, a group of agencies, including UNICEF, WaterAid, and the World Bank’sWater and Sanitation Program (WSP), has been tracking progress using a ‘traffic light’ system. This simply records, against
3Benin, BurkinaFaso, Ethiopia, Ghana, Kenya, Madagascar, Malawi, Mali, Mauritania, Mozambique, Niger, Rwanda, Senegal, Tanzania, and Uganda.
Sanitation and Hygiene in Africa168

each commitment, whether a country has made good progress (green), some progress (yellow) or insufficient progress (red). Themost recent traffic light summary was created for AfricaSan 3 in July 2011. Thirty eight countries participated in the exercise, andthirty three of these completed and endorsed their reports, before including them for consideration in the regional report.
An overview of consolidated scores of participating countries shows that the region has performed by mainstreaming genderin sanitation programs in institutional settings (especially schools). Moreover, most countries also have a national sanitation planto meet the MDG target. Nevertheless, the region does not do well in meeting the commitment of allocating 0.5% of GDP tosanitation and implementing the sanitation Monitoring and Evaluation (M & E) system.
20.7 WAYS FORWARD MONITORING SANITATION AND HYGIENE IN AFRICA20.7.1 Global initiativesIn the preparation of the Post-2015 monitoring landscape, the JMP has initiated a review of the current global drinking-water andsanitation target and indicators. This process aims to propose a new generation of targets and indicators, considering theprinciples underlying the Human Right to Water and Sanitation.With the participation of countries in this process, theexpectation is that most of their concerns are taken into account in the new monitoring frame. The new targets and indicatorsare supposed to be adopted by the UN General Assembly in September 2013.
The JMP has also taken some steps to address all technical andmethodological shortcomings prior to 2015, by organizing taskforce meetings to work out appropriate solutions. This work will be strengthened in the future, based on country requests andJMP specific needs. Despite this engagement in countries, it is worth noting that sub-national monitoring is not a JMP remit andthat the national MIS should take care of this monitoring level, even though the JMP could provide technical backstopping.
As for the GLAAS process, the regular review and advisory meetings allow to receive advice from partners in order toimprove the methodology of data collection and the sharing of the outcomes of the report.
20.7.2 Regional and national initiativesMonitoring and evaluation still faces big challenges at various levels despite positive efforts made in recent years. Very often, itis difficult to diagnose the specific bottleneck along the chain of WASH service delivery because of a lack of information causedby ineffective monitoring.
As ways forward, the ministerial commitments made at AfricaSan 3, undoubtedly, provide a basis for sanitation and hygieneimprovement in the region. These commitments relate to strengthening the monitoring by revisiting current indicators, refiningand testing them, and reporting back at the next AfricaSAN meeting using the new proposed indicators.
The African Union (AU) Assembly, held in Sharm El Sheik in July 2008, requested the African Ministers’ Council on Water(AMCOW) to set up a Pan-African Mechanism for Monitoring the Water and Sanitation sector and to annually report to the AU
BOX 20.3 THE MDG GoALWASH PROJECT
MDG GoALWASH is a UNDP programme that aims to accelerate achievement of the water and sanitation MDGs throughstrategically targeted interventions that strengthen governance of the water and sanitation sectors at appropriate levels. Theapproach begins with a country assessment that identifies the gaps, needs, constraints and opportunities in national waterand sanitation sector and analyses national strategies, aid coordination, institutional arrangements, sector financing, sectormonitoring and evaluation and sector capacity.
By the beginning of 2010, detailed sector assessments were completed in 11 countries (five in Africa: Djibouti,Madagascar, Mali, Sierra Leone, Zambia) and project documents developed for 10 of them. The data is derived fromvarious sources available at the national level and endorsed by the sector Ministries. The programme has now moved toimplementing country projects in 10 countries, based upon the assessments made earlier. A gradual expansion of theprogramme is envisaged, as new resources are identified and become available. It has already received numerousrequests from national governments and UNDP Country Offices to expand into new countries including, in Africa,Botswana and Sierra Leone.
All GoALWASH programmes are run by national managers, responsive to the local culture and context. The UNDP withits leadership role in the program is capable of building contacts at the highest levels of the Government and its ResidentCoordinators have access to senior decision makers who can really drive change in water governance.
Monitoring sanitation in Africa Ongoing initiatives and lessons from the field 169

Assembly on the progress made. Since then, AMCOW has worked with other monitoring mechanisms4 on a Core set ofindicators considering a number of sub-themes and performance categories related to the WASH services. The firstcontinental report is being prepared. It is based on countries’ self-reports and aims to produce data on the use of toilets andcollection systems, both in urban and rural areas.
Country consultations and data gathering started in May 2012 and the inaugural report is expected by October 2012. It isworth noting that GIZ/BMZ and the African Water Facility African Development Bank are providing support to AU inimplementing this ambitious project.
Sub-regions in Africa have set up other individual initiatives on WASH monitoring that need to be sustained and bettervalued. For instance, the Eastern Africa Regional Sanitation Conference, the SADC Water and Sanitation Sub RegionalConference and the MDGs Monitoring and Evaluation of water in North Africa – MEWINA- are part of these initiatives.
With the rapid spread of CLTS in the African region, it is likely that future monitoring, at least at the sub-national level, willheavily repose on community-led types of monitoring. To this end, corrections must be made in order to make sure that theresults obtained at the local level can feed the national and the international levels. This is only in way that monitoring canbe useful for decision making.
In addition, the next IRC’s flagship symposium, which will focus on monitoringWASH services, is planned for April 2013 inAddis Ababa (Ethiopia). This symposium will offer an opportunity to technicians to discuss and share the latest tools, includingdiscussions on indicators, from the national to the international level. During the forum, the life-cycle costs approach, seeking atbetter understanding the costs related to providing WASH services, will be featured as a means to increase countries’ capacity inplanning and monitoring of WASH services.
20.8 REFERENCESAMCOW (2008). Meeting of the Technical Advisory Committee of the African Ministers’ Council on Water. Nairobi (27–28 November
2008). African Ministers Council on Water.AMCOW/WSP-AF. AMCOW Country Status Overviews (2011). Pathways to Progress: Transitioning to Country-Led Service Delivery
Pathways to Meet Africa’s Water Supply and Sanitation Targets, Regional Synthesis Report.Clarissa Brocklehurst (2011). Monitoring Sanitation after 2015. Discussion Paper. WSP.KatharinaW. and Kristof B. (May 2011).What next after completing the first NationalWASH Inventory? Suggestions from stakeholders at the
national, regional, and woreda level. RiPPLE Report. Ripple.MWI/GTZ/KFW (November 2007). Accelerating Access to Sanitation/East Africa Regional Conference. Conference report.Sanitation and Water for All High Level Meeting (April 2012) Statement of Commitments, Kenya.Sophie H. and Jane B. (2010). Tales of shits Community-let Total Sanitation in Africa. PP51-60 – Participatory Learning and Action 61.
IDS-Plan-IIED.UN-Water (2012). UN-Water Global Annual Assessment of Sanitation and Drinking-Water (GLAAS) 2012 Report: The Challenge of
Extending and Sustaining Services. UN-Water- World Health Organization, New York.WHO/UNICEF (2012a). Progress on Drinking Water and Sanitation: 2012 Update. WHO/UNICEF, Geneva/New York.WHO/UNICEF (2012b). A Snapshot of Drinking Water and Sanitation in Africa – 2012 Update. WHO/UNICEF, Geneva/New York.
4JMP, GLAAS, Aquastat, Mewina, etc.
Sanitation and Hygiene in Africa170

Chapter 21
Capacity building
Sophie HicklingWater and Sanitation Program
Without adequate capacity, sanitation programmes cannot be successful and sustainable in the long term. The need forcapacity building in sanitation was a key theme emerging from several country preparation meetings prior to AfricaSan 3and cut across sessions throughout the conference. And yet often times it is not clear what ‘capacity building’ exactlymeans and how to do it well. This chapter first defines what capacity building is, and assesses the need for sanitationcapacity in Africa. Previous and current actions on capacity building are explored using examples, followed by adiscussion on where future efforts might focus to bridge the capacity gap and ensure that capacity building becomes acentral part of sanitation planning and implementation.
21.1 INTRODUCTIONSanitation capacity is a broad term that includes having sufficient numbers of appropriately skilled human resources in place atnational, regional and local level, both within government and externally within development partners and civil society. Inaddition, these skilled staff need to have adequate material resources, equipment and financial resources to carry out theirroles effectively, as well as opportunities to generate and share knowledge to advance the sector.
Capacity development can be viewed in three levels (Spuhler et al. 2012), each of which should be addressed by sector plansto ensure that capacity building is cohesive, comprehensive and effective in bringing about results:1
(1) Individual level: people / staff having appropriate skills and competencies to carry out their role.(2) Organizational / institutional level: having procedures, systems, policies and cultures in place to carry out the
institutions role.(3) Enabling environment: having governance structures, institutional arrangements, policies etc consistent with achieving
sanitation goals.
Capacity building is a continuous process of securing skills, resources and knowledge rather than a one-off training event. Itneeds to be embedded in sector plans to ensure that gaps are identified in each of these three levels (individual, institutionaland enabling environment) and addressed strategically and efficiently as a central part of the sectors core business.
21.2 THE CAPACITY BUILDING CHALLENGESeveral aspects of sanitation present challenges to capacity building. Human resource planning and coordination for sanitation isa complex issue involving many skill-sets, cutting across multiple line-ministries at central and decentralized level, and alsoincluding the private sector, NGOs and civil society. Assessing scattered capacity is a challenge as is using existingcapacity efficiently.
The 2012 GLAAS report found that although shortages of extension staff for sanitation and hygiene promotion,technicians and skilled labour were reported as a bottleneck to the sector, ‘half of countries did not report on how many
1A similar 3-level approach is used by SNV Kenya (see Box 21.2).
WASH staff were in place’, indicating that accurate information on actual resources available is largely unknown (UN-WaterGLAAS, 2012).
The recent process of decentralization has in many cases passed the onus of sanitation provision to local authorities that do nothave the staff, skills or experience to deliver results (AMCOW et al. 2008).
Many times, multiple actors are engaged in capacity building in an unplanned way by to meet immediate needs. Without aclear capacity building strategy or plan, disjointed, ad-hoc efforts to build capacity do not produce results. Without results, futureinvestment in capacity building is deterred.
Frequently capacity building initiatives focus only on staff numbers and human skills, without consideration for theinterconnectedness of other ‘levels’ of capacity building (i.e., institutional and enabling environment). Even a full cadre ofhighly trained individuals cannot sustainably achieve sanitation goals without strong institutional arrangements, policies andsystems in place.
21.3 SANITATION CAPACITY BUILDING AS A PRIORITY IN AFRICAA review of sanitation and hygiene status in 32 countries carried out in 2008 [AMCOW et al. 2008] found sanitation capacity tobe a critical constraint to making progress towards the sanitation MDG. Country reports highlighted a lack of capacity at allinstitutional levels: public institution, local government, private operator and civil society.
Agreed priority actions in country reports of the second AMCOW Country Status Overview frequently refer to the need forsector capacity building at different levels including at local or district level for improved implementation. Other key needs arefor central sanitation departments to assume a strong advisory role in support of districts, and for a stronger private sector.
In the lead up to AfricaSan 3, 38 countries undertook country preparation meetings, and 33 submitted endorsed countryreports detailing priority actions to get back on track to meet the sanitation MDG. One of the key priorities that emerged,common across 13 countries, was capacity building.
For the majority of cases capacity building priorities referred to decentralized capacity building of local government, districtor commune teams. However a significant number of countries referred to reinforcing capacity of newly established nationalsanitation departments.
At district or local level, capacity building priorities reflect the practicalities of implementing programmes on the ground - inparticular contract management, planning and implementation. At national or regional level the focus was more on capacitybuilding to equip technical teams to assume an advisory role in support of districts or communes.
21.4 ACTION FOR CAPACITY BUILDINGBuilding sanitation capacity is being given higher priority in Africa. At the 2012 Sanitation and Water for All High LevelMeeting, ministers made a commitment ‘to assess and address capacity gaps to improve sector performance; Ministers willassess capacity deficits in human resources, skills, at national and decentralized levels and implement appropriate actions toaddress these gaps. Ministers will set out a course of action to build capacity to deliver services for all’ (SWA, 2012a). Thistype of high-level commitment will not automatically translate into greater capacity on the ground, however it does holdgovernments accountable to addressing the issue.
Action is taking place at country level. Both Zimbabwe and Ethiopia have significant experience in building and maintainingsanitation capacity. Box 21.1 gives details of how success was achieved in Zimbabwe. Ethiopia has defined a capacity buildingstrategy for scaling up sanitation and hygiene and an approach to knowledge management, learning and sharing which isclustered into four thematic areas:- increased number of trained personnel at all levels, strengthened systems for actionresearch, platforms for networking and dissemination, and coordination (SWA, 2012b). A tangible example is the cadre of38,000 skilled Health Extension Workers developed and supported by the MoH, which has contributed to the gains seen inthe sanitation sector.
As the Zimbabwe example illustrates, the use of dedicated resource agencies to build capacity for sanitation at different levelscan be efficient and effective. InWest Africa a strategy of working withWSA (Water and Sanitation for Africa)2, an experiencedand regionally active training organization, has led to a rapid increase in the number of skilled CLTS facilitators available(Bevan, 2011). Another organization with a specific focus on capacity building is SNV, Box 21.2 provides more informationon SNVs approach to capacity building for sanitation in Africa. A study of the WSP total sanitation sanitation marketing
2Previously known as CREPA (Centre Regional pour l’Eau Potable et l’Assainissement à faible cout).
Sanitation and Hygiene in Africa172

(TSSM) program in Tanzania found that using national NGOs as resource agencies to build the capacity of local government wasan effective approach. However potential limitations to the approach include insufficient suitably skilled organizationsin-country, and whether those resource agencies themselves have the ability to scale up activities to a national programme(Rosensweig & Kopitopoulos, 2010).
Several countries that identified capacity building as a priority to reach the sanitation MDG, have since developed concreteaction plans detailing specific activities to address capacity building amongst other priorities. For example the TanzanianSanitation Sector working group is currently finalizing a capacity needs assessment. Against a backdrop of recent progress inthe sanitation sector in Tanzania and new financing for scaling up activities, the study will compare existing human resourcecapacity with the requirements for delivering a national programme. It will examine the capacity of government, NGOs andthe private sector at national and decentralized level, as well as addressing capacity requirements in the enablingenvironment for example institutional arrangements and coordination platforms.3
In the case of Malawi, as well as including capacity building in district investment and strategic plans, the sector will focus onthe importance of knowledge management for capacity building by engaging with academia and higher learning institutes forresearch and development as well as improving documentation and dissemination of knowledge.
There are several instruments available for building capacity: education, training, research and documentation and knowledgeand information management and sharing (Spuhler et al. 2012). As noted, identifying existing national and regional resourcecentres and training institutions is a first step in building sector capacity (GLAAS, 2012). Embedding sanitation into existingcourses and degrees, or developing new curricula dealing with sanitation such as in Zimbabwe will ensure a cadre of trainedindividuals. In order to be effective, training should include a clear strategy, objectives, methodology, trainers with expertisein the subject matter as well as training skills, materials and a way to monitor and evaluate the effectiveness and impact ofthe training (Rosensweig & Kopitopoulos, 2010). Knowledge generation through research, reflection, documentation andknowledge sharing, such as in Malawi, which holds regular stakeholder discussion forums and produces a national CLTSnewsletter are essential to building sector capacity (Nyimba in Hickling & Bevan, 2010). At the local level capacity buildingcould be promoted by institutionalizing mechanisms for districts to share experiences and lessons learned (Perez et al. 2012).The sector could set up a community of practice for sanitation, to share ideas and solve commons problems: an approachthat has been successful in the health and private sectors.
BOX 21.1 ZIMBABWE: PLANNING FOR CAPACITY FROM INCEPTION
The successful Integrated Rural Water Supply and Sanitation Programme (IRWSSP) implemented in Zimbabwe from thelate 1980s to 2000 exemplifies how capacity development, in terms of human resources, institutional capacity andknowledge management, was integrated into program development at the outset of a national program. A vital successfactor for Zimbabwe was the government leadership and prioritization of capacity building as a way to achievelong-term goals.
A first full capacity assessment took place in 1987 with subsequent, periodic capacity assessments taking place, toestablish what skills were needed at each level to attain Programme goals - from national coordination units, to provincialand district water supply and sanitation committees, to local private sector, village committees and pump attendants.From this a coordinated approach to training, material support and knowledge sharing was developed.
Specialized training institutes such as the Institute of Water and Sanitation Development (IWSD) have been instrumentalfor capacity building, providing tailor-made courses to meet identified needs. For example, in terms of formal training, theIWSD offered a postgraduate diploma aimed at creating a generation of government sector managers to drive water andsanitation programmes. Government and donors supported candidates to attend this diploma course. IWSD also offeredshort professional and skills development courses in response to demand. Ministries also prioritized training: the Ministryof Health and Child Welfare trained latrine builders, and the District Development Fund trained pump mechanics.Training was also made available at the sub-district level, for example, through community health clubs.
Other elements of success included: clarity on roles and responsibilities, standardized training curricula, and dedicatedfunding from the government budget to support capacity building. A strong link was created between research (such asthrough the Blair Research Institute), policy and training.
Information provided by Noma Neseni, Institute of Water and Sanitation Development.
3Private communication – WSP Tanzania.
Capacity building 173
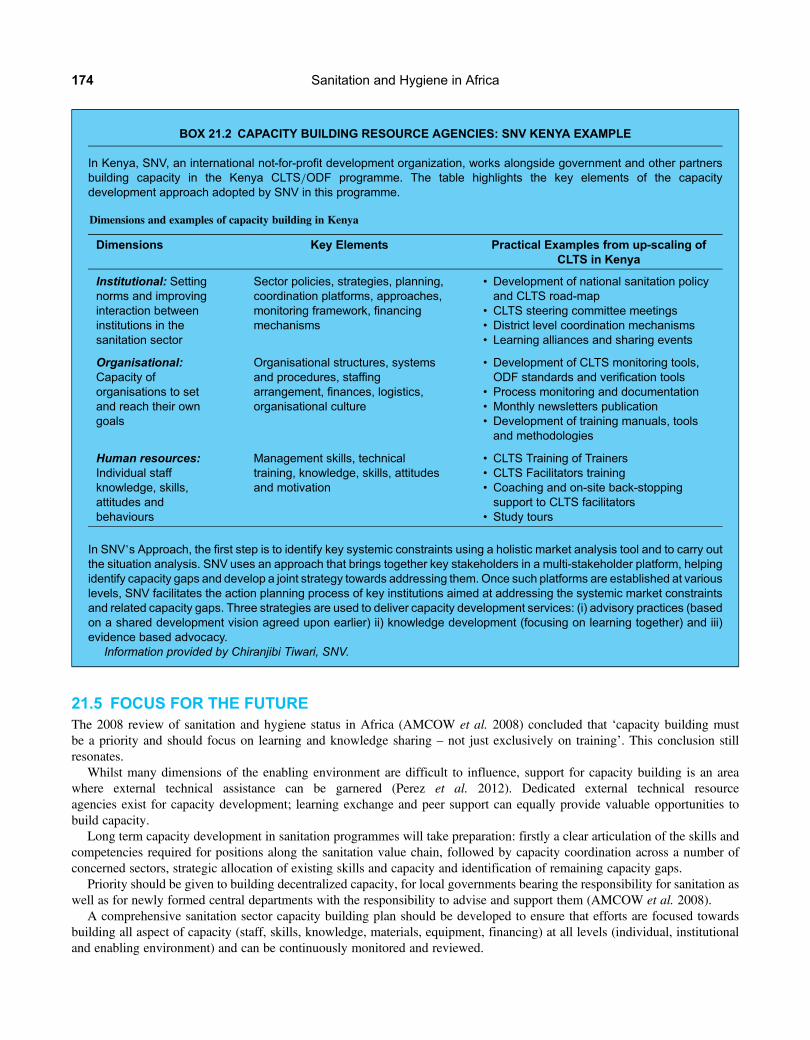
21.5 FOCUS FOR THE FUTUREThe 2008 review of sanitation and hygiene status in Africa (AMCOW et al. 2008) concluded that ‘capacity building mustbe a priority and should focus on learning and knowledge sharing – not just exclusively on training’. This conclusion stillresonates.
Whilst many dimensions of the enabling environment are difficult to influence, support for capacity building is an areawhere external technical assistance can be garnered (Perez et al. 2012). Dedicated external technical resourceagencies exist for capacity development; learning exchange and peer support can equally provide valuable opportunities tobuild capacity.
Long term capacity development in sanitation programmes will take preparation: firstly a clear articulation of the skills andcompetencies required for positions along the sanitation value chain, followed by capacity coordination across a number ofconcerned sectors, strategic allocation of existing skills and capacity and identification of remaining capacity gaps.
Priority should be given to building decentralized capacity, for local governments bearing the responsibility for sanitation aswell as for newly formed central departments with the responsibility to advise and support them (AMCOW et al. 2008).
A comprehensive sanitation sector capacity building plan should be developed to ensure that efforts are focused towardsbuilding all aspect of capacity (staff, skills, knowledge, materials, equipment, financing) at all levels (individual, institutionaland enabling environment) and can be continuously monitored and reviewed.
BOX 21.2 CAPACITY BUILDING RESOURCE AGENCIES: SNV KENYA EXAMPLE
In Kenya, SNV, an international not-for-profit development organization, works alongside government and other partnersbuilding capacity in the Kenya CLTS/ODF programme. The table highlights the key elements of the capacitydevelopment approach adopted by SNV in this programme.
Dimensions and examples of capacity building in Kenya
Dimensions Key Elements Practical Examples from up-scaling ofCLTS in Kenya
Institutional: Settingnorms and improvinginteraction betweeninstitutions in thesanitation sector
Sector policies, strategies, planning,coordination platforms, approaches,monitoring framework, financingmechanisms
• Development of national sanitation policyand CLTS road-map
• CLTS steering committee meetings• District level coordination mechanisms• Learning alliances and sharing events
Organisational:Capacity oforganisations to setand reach their owngoals
Organisational structures, systemsand procedures, staffingarrangement, finances, logistics,organisational culture
• Development of CLTS monitoring tools,ODF standards and verification tools
• Process monitoring and documentation• Monthly newsletters publication• Development of training manuals, toolsand methodologies
Human resources:Individual staffknowledge, skills,attitudes andbehaviours
Management skills, technicaltraining, knowledge, skills, attitudesand motivation
• CLTS Training of Trainers• CLTS Facilitators training• Coaching and on-site back-stoppingsupport to CLTS facilitators
• Study tours
In SNV’s Approach, the first step is to identify key systemic constraints using a holistic market analysis tool and to carry outthe situation analysis. SNV uses an approach that brings together key stakeholders in a multi-stakeholder platform, helpingidentify capacity gaps and develop a joint strategy towards addressing them. Once such platforms are established at variouslevels, SNV facilitates the action planning process of key institutions aimed at addressing the systemic market constraintsand related capacity gaps. Three strategies are used to deliver capacity development services: (i) advisory practices (basedon a shared development vision agreed upon earlier) ii) knowledge development (focusing on learning together) and iii)evidence based advocacy.
Information provided by Chiranjibi Tiwari, SNV.
Sanitation and Hygiene in Africa174

Finally approaches need to take a broader view of capacity building, to encompass individual, institutional and enablingenvironment aspects fully embedded within national policies, strategies and programmes to promote sector accountability forbuilding and sustaining capacity towards meeting sanitation goals.
21.6 REFERENCESAMCOW, AfDB,World Bank, WSP (2008). Can Africa Afford to Miss the Sanitation MDG Target?: A Review of the Sanitation and Hygiene
Status in 32 Countries. AMCOW, AfDB, World Bank, WSP.Bevan J. (2011). A review of the UNICEF roll-out of the CLTS approach inWest and Central Africa. Briefing paper: 35thWEDC International
Conference, Loughborough, UK.Hickling S. and Bevan J. (2010). Scaling up CLTS in sub-Saharan Africa. In: Participatory Learning and Action 61: Tales of Shit—
Community-Led Total Sanitation in Africa. Ashley H., Kenton N. and Milligan A. (eds.). The International Institute for Environmentand Development (IIED), London.
Perez E., Cardosi J., Coombes Y., Devine J., Grossman A., Kullman C., Kumar C., Mukherjee N., Prakash M., Robiarto A., Setiwan D., SinghU. and Wartono D. 2012. What does it take to scale up rural sanitation? Water and Sanitation Program: Working Paper.
Rosensweig F. and Kopitopoulos D. (2010). Building the capacity of local government to scale up community-led total sanitation andsanitation marketing in rural areas. Water and Sanitation Program: Working Paper.
Sanitation and Water for All (SWA) (2012a). A global step change for universal access: statement by ministers responsible for water andsanitation. to be presented at the Sanitation and Water for All (SWA) High Level Meeting (HLM), Friday 20th April 2012,Washington DC.
Sanitation and Water for All (SWA) (2012b). Ethiopia country statement for sanitation and water for all. High Level Meeting, 20 April 2012,Washington, DC. Available at: http://www.sanitationandwaterforall.org/files/Ethiopia_Statement_to_2012_HLM_EN.pdf (Accessed09 December 2012).
Spuhler D., McCreay C., Fogde M. and Jenssen P. (2012). Capacity development for sustainable sanitation. Sustainable Sanitation AllianceFactsheet. In: Sustainable Sanitation Alliance – Compilation of 13 factsheets on Key Sustainable Sanitation Topics, E. von Münch (ed.),Sustainable Sanitation Alliance (SuSanA), Eschborn, Germany.
UN-Water Global Analysis and Assessment of Sanitation and Drinking-Water (2012). The Challenge of Extending and Sustaining Services,GLAAS 2012 Report, WHO/UN–Water.
Capacity building 175


Chapter 22
Making the case for sanitation and hygieneGiving the issue the priority it demands
Saskia Castelein and Amanda MarlinWater Supply and Sanitation Collaborative Council
AfricaSan 3 was, amongst other things, an advocacy event. Advocacy work during the past decade has broken the tabooaround sanitation: clean toilets and good hygienic behaviour are now considered essential for the economic and socialdevelopment of a country. However, despite the progress, there is a continuing need for targeted action: specific budgetlines with sufficient funding, transparent tracking systems and solid plans which target the poorest. This chapter reviewsthe state of advocacy for sanitation and hygiene in Africa and considers what is needed to better make its case.
22.1 WANTED: LEADERSHIP FOR SANITATION AND HYGIENESanitation and hygiene is increasingly discussed more openly: events and conferences are attracting high-level participants andpowerful voices are championing the cause. We know that success requires not just funding and plans, but also committedleadership. The impressive progress made in Rwanda (see Box 22.1), the host country for AfricaSan 3, can readily be seenas a result of leadership – from the highest level, the President, right through to decision-makers at local level.
22.2 NEW MATERIALS AND NEW WAYS OF WORKING TOGETHER22.2.1 New advocacy materials using economic argumentsThe sector has had considerable impact with health related messages, such as the links between poor sanitation and diarrhoealdisease, and these arguments will always be core to our advocacy. However, especially in the current harsh economic climate,and thanks to the emergence of new research, advocacy messages that focus on the economics of sanitation and hygiene are both
BOX 22.1 AFRICAN LEADERS STAND UP IN SUPPORT OF SANITATION AND HYGIENE
Paul Kagame set the tonewhen he spoke at the gala dinner at AfricaSan 3. He quoted anAfrican proverb ‘even if you need toask your brother to wash your back, you should still be able to wash your stomach’. Hewent on to say that he understood thatAfrican countries might have, in the past, needed some help from donors – and that some might still need help – but addedthat they should also be able to contribute to the efforts themselves, in other words, they should ‘wash their own stomachs’.Twelvemonths after Kagame’s speech, at a sanitationmeeting in rural Uganda, Kagame’s comment was quoted – proof thatgood oratory sticks in the mind, and thus is good advocacy! Rwanda led not just by word, but also by deed. Visitors fromaround the continent noted that this country is one of only four Sub-Saharan countries that are on-track to meet the MDGtarget for sanitation and remarked on the clean streets and availability of public toilet blocks as they drove around the capital.
Kagame was not the only African leader to make a strong stand at AfricaSan 3. Eng. Ebele Okeke, of Nigeria, a WSSCCWASH Ambassador, participated in a number of sessions and shared her experiences in high-level advocacy in Nigeria andbeyond. Mrs Mary Broh, the dynamic Mayor of Monrovia, Liberia, used her time at Africasan 3 to plan towards a renewedpush to improve sanitation in her hometown, gathering ideas, and building a strong plan for community action.

possible and needed. Newmaterials launched at AfricaSan 3 highlighted the economic benefits of investing in sanitation, and thecosts of failing to do so.
One of those new sets of advocacymaterials came fromWSSCC,with the launch of its newWASH campaign –GDP for GDP,which stands for Good Dignity Practices for Gross Domestic Product. With this campaign slogan, WSSCC aims to redefinewhat ‘shit’ stands for – a source of economic gain, rather than a drain on government or donor funds. Gross DomesticProduct (GDP) is an internationally recognized term and understood by those in key decision making positions acrossgovernments, the private sector and the development sector. Increasing GDP is considered a sign of progress. The underlyingmessage is that sanitation, whether in the literal context of reusing human waste, or in a broader development context, has apositive economic value. This could be from an increase in productivity, an increase in tourism revenues or a reduction ofhealth costs. By linking good sanitation and hygiene with economic benefits, the GDP for GDP campaign aims at convincingand engaging decision-makers, as well as entrepreneurs, to take and sustain action based on evidence. Economic case-studiesstudies on sanitation address a previous gap in evidence that is needed for advocacy, especially when seeking to convincegovernments to act. In Kigali, the Water and Sanitation Programme presented the Economics of Sanitation Initiativeshowcasing socio-economic returns to households, businesses and the wider community. Benefits include increasedproductivity through time gains and health benefits, increased tourism revenues through clean environments, and otherbenefits related to dignity and safety. The studies also provided indications of economic losses when sanitation facilities arenon-existent or not used. AfricaSan 3 presented a number of studies ready to be used for country advocacy work.1
These advocacy materials, based on economic studies, have since been used to good effect in a number of countries – mostparticularly in the discussions that took place at national level in the lead up to the Sanitation and Water for All High LevelMeeting held in Washington in April 2012. The High Level Meeting engages Ministers of Finance, and these economicanalyses focus directly on the issues, and use the language, that we know resonates with them. As a sector, we would dowell to develop equally well-tailored advocacy materials to reach decision-makers in related sectors: in the fields ofnutrition, education, climate change or human rights.
While making the most of economic arguments, it is important to ensure growth with equity. Too often, efforts to reach thelargest possible numbers of people result in programmes that ‘pick the low hanging fruit’. Studies presented at AfricaSan 3,analyzing the gaps between rich and poor, men and women, urban and rural, showed that, over time, the gaps in access arein fact increasing. Encouragingly, new thinking, led by UNICEF, among others, indicates that pro-poor approaches are, infact, the most cost-effective way to achieve improvements in health and development. Sanitation advocates will not need tomake a choice between economic arguments or equity arguments, but advocacy messages will need to be well-crafted, tocapture these subtleties and will need to coordinate efforts to ensure that consistent messages are being communicated.
22.2.2 New global platformsAfricaSan3 was also an opportunity to look at some key global initiatives, and to consider how they could be used to helpstrengthen work being done at national and regional level.
22.2.3 Sanitation and Water for AllThe Sanitation and Water for All partnership (SWA) brings together governments, donors, civil society organizations anddevelopment partners to achieve sustainable sanitation and drinking water for everyone in the world. It was set up in 2010and, unlike previous initiatives, developing country governments are in the driving seat. Donors are there to support. TheSWA partners work towards a higher prioritization of political leadership, a stronger evidence base that supports gooddecision-making; and towards solid national plans with targeted investments, so that money is spent where it is most neededand in a way that is most effective.
AfricaSan 3 was held in July 2011 – nine months before the second SWAHigh Level Meeting (HLM) which took place at theWorld Bank in April 2012. This was ideal timing – it was a great opportunity for participants from each of the countries to findout more about the plans for the meeting, to strategize on how best to encourage their finance ministers to attend, and to hear thelatest facts and figures, which could be used to underpin their advocacy.
The HLM and national meetings are an opportunity to promote decision-making based on evidence. The HLM is timed toutilize the findings of the Global Analysis and Assessment of Sanitation and Drinking Water (GLAAS) and theUNICEF-WHOJointMonitoring Programme report (JMP), both ofwhich are key sources of evidence for decisions and advocacy.
1Currently, there are studies for: Benin, Burkina Faso, Central African Republic, Chad, Democratic Republic of Congo, Ghana, Kenya, Liberia, Madagascar,Mauritania, Mozambique, Niger, Nigeria, Tanzania, Uganda, Zambia.
Sanitation and Hygiene in Africa178

22.2.4 Drive to 2015A special event on the first night of AfricaSan 3 provided the chance to launch Sustainable Sanitation: the Drive to 2015. Keynote speaker and champion of this advocacy initiative, Ms. Ushchi Eid, the Vice Chair of the Secretary-General’s AdvisoryBoard on Water and Sanitation (UNSGAB), invited all those present to take on the sentiment at the heart of the drive – tomake the right to sanitation a reality.
The Drive to 2015 builds on the success of the 2008 International Year of Sanitation. In 2010, the UN General Assemblyadopted a resolution calling upon Member States to ‘redouble efforts to close the sanitation gap’. The resolution gave birthto the Sanitation Drive to 2015 to focus attention on the sanitation target by mobilizing political will, as well as financial andtechnical resources. The resolution also made history by calling for an end to open defecation, the most dangerous sanitationpractice for public health.
A fewmonths before the AfricaSan 3 conference, the Drive to 2015 was launched in NewYork by UN Secretary-General BanKi-moon along with members of the Secretary-General’s Advisory Board on Water and Sanitation and other dignitaries. In hisspeech, the Secretary-General highlighted the importance of improved sanitation and its link in contributing to developmentgoals stating, ‘it is time to put sanitation and access to proper toilets at the center of our development discussions’.
The Drive to 2015 was certainly visible at AfricaSan 3 – with the logo on each participant’s lanyard, sessions in theprogramme, and fact sheets available addressing the main key messages:
• Sanitation for all: making the right a reality• Sanitation is vital for good health• Sanitation brings dignity, equality and safety• Sanitation is a good economic investment• Sanitation sustains clean environments
22.2.5 Civil society – a growing voice within the Regional Sanitation movementFor the first time civil society played a central formal role in the AfricaSan 3 agenda. ANEW, a network of networks of 23African countries, was fully involved in the preparatory processes and used the opportunity in Kigali to engage on issues ofcoordination, capacity building, planning, monitoring and transparency, and on equity and inclusion. Civil society’s presencein AfricaSan may be further enhanced. In a review of the Regional Sanitation Conferences coordinated and published byWSSCC (2012), Cross et al. (2012) observed that civil society participation in the South Asia regional sanitation conference(SACOSAN) is particularly strong. In SACOSAN civil society hosts a workshop in the lead up to the conference, CSOsdevelop a statement to feed into the final conference statement, and civil societies are represented on the drafting panel forthe final conference statement.
22.3 WHAT NEXT FOR WASH ADVOCACY?The climate in whichWASH advocacy needs to take place is changing, and if we are to be successful we will need to change too.Various options are available, none of them mutually exclusive.
One option, raised by Cross and colleagues in their paper ‘Synthesis of assessments of Regional Sanitation Conferences:looking back to look forward’ (WSSCC, 2012), is for the regional sanitation conferences to grow into a fully-fledged socialmovement. This is an intriguing prospect. When one looks at other global health and development issues, such as the effortsto control HIV/AIDS, climate change or gender equality, they are characterized by broad-based understanding and supportby people in both developed and developing countries. Teles and Schmidt (2011) note that ‘Successful efforts to changepublic policy often require both grassroots as well as elite strategies’.
Arguably the importance of clean drinking water has broad-based, global support, but sanitation and hygiene do not.Members of the general public in rich countries, and those who do have access to toilets in developing countries often seemunaware of the extent of the issue or, if aware, are not taking action. They are not calling on their governments to act orlending their voice to the debate on the issues. Recent advocacy efforts around World Water Day – ‘The World’s longesttoilet queue’ in 2010, and ‘The world walks for water and sanitation’ in 2011 and 2012, are starting to build this type ofinternational social movement. Emerging campaign work around ‘World Toilet Day’ has a similar aim. The strong role ofmedia (Box 22.2) and civil society in Kigali could be seen as a step towards the growth of a social movement, with theregional sanitation conferences as a key point for documenting and sharing successes from grassroots campaigning, learningfrom the experience of others, and joint planning for future activities.
Making the case for sanitation and hygiene 179

Another trend seems to be the development of more, and more sophisticated, advocacy messages (Box 22.3). In AfricaSan3there was considerable discussion around economic and equity issues, and the UN recognition of the right to water andsanitation. Increasing talk about ‘moving people up the sanitation ladder’ sees advocacy going beyond the simple messagethat people need toilets, to more complex discussions about what sorts of toilets are needed. Advocacy and behaviourchange are closely linked – as are efforts to both stimulate demand and meet supply. There is an increasing body of work inthe areas of ‘Sanitation Marketing’ and ‘Sanitation as a Business’. No matter what you call them – and whether you considerthese latter topics to fall within or outside the box marked ‘advocacy’ – these are emerging concerns that are a feature of ourcurrent environment, and they bring with them a rich and complex web of messages, aimed at a range of audiences, and witha range of intended outcomes. Our advocacy messages, and the materials we develop to support our campaigns, need toreflect this complexity of messaging, while nonetheless aiming to retain the holy grail of advocacy – a simple ‘ask’ that therecipients will be both motivated and empowered to fulfill.
BOX 22.3 ADVOCACY MESSAGES HEARD – LOUD AND CLEAR – AT AFRICASAN 3
Access to water and sanitation is a human right
The overarching ambition of Sustainable Sanitation: the Drive to 2015 is to ‘Turn this right into a reality’. Civil societygroups talked about the importance of putting people at the centre of decision-making, and UNICEF, WSSCC, WaterAidand others highlighted the extent to which it is the poorest, and most marginalized who suffer most.
Investing in water and sanitation makes good economic sense
WSP and WSSCC both introduced new advocacy materials outlining the economic benefits of investing in water andsanitation, and the costs associated with not doing so.
African leaders must be in the driving seat
President Paul Kagame urged his fellow politicians to take on responsibility for improving water and sanitation in theirown countries – not be reliant on donors.
Civil society voices must be heard
Civil society has a vital role to play – too many programmes have failed because of poor consultation… and promisesmade on the international stage must be kept.
Get the numbers right
‘If CSOs can work with governments to monitor what is spent, what structures are put up and what they are promotingthen we can make progress. Data collection is a big issue for us in Zambia. We often don’t agree with government when wecompare our information on coverage and service provision.’ Kalaluka Mubu, Guest Blog from AfricaSan3, July 2011.
BOX 22.2 THE WEST AFRICAN WASH JOURNALIST NETWORK AT AFRICASAN 3
The West Africa WASH Journalist Network was created in late 2010 to influence policy, to express the perspective of theunserved poor and improve the quality and quantity of information on WASH. It is a network of networks from 13 WestAfrican countries supported by WSSCC and WaterAid. The network was active at AfricaSan 3: journalists increased theircontacts and knowledge and organised, Sanitation HARDtalk, a dialogue between the media and high profile panelistsincluding the General Director of the Ministère de l’Eau in Madagascar and the Minister of Sanitation in Ghana.
Although the link between media and policy or social change at a large scale might not always be evident, the power of astrong story together with coordinated efforts has a huge potential for impact. A network can give an influential voice to thelocal story by sharing it at regional level. However, journalists do not only have the opportunity and responsibility to highlightthe reality of unserved communities, they can and will increasingly play a role demanding commitments and actions fromgovernments, eventually leading to policy changes. The West Africa WASH journalist network gathered interest fromcommunications and development professionals and replicating a similar network in other regions, both Africa and Asia,was explored.
Sanitation and Hygiene in Africa180
A third consideration, and one that is also true for other sectors, is the need to work in coalition. Good advocacy has alwaysbeen characterized by the building of alliances. The fight against slavery, movements to secure the vote for women, the gradualerosion of the tobacco industry – all these have been championed by diverse – often surprising – combinations of advocates. Cox(2011) argues that ‘coalition is king’. In reviewing a number of recent development campaigns, including ‘Make PovertyHistory’ and ‘The global campaign for climate action’, he notes a number of factors currently undermining functioningcoalitions – including funding pressures that drive organizations to act independently, in order to claim successes, and toofew opportunities for joint strategic conversations at CEO level.
In WASH, there are now more organizations involved – a sign of previous success in advocacy – but that brings with it theneed to pay more attention to collaboration. We need to ensure that we’re collaborating with the right groups, and in this sensenational level organizations with timely, relevant knowledge of peoples’ experience are key, and we need to ensure that, in ourefforts to be able to collaborate we do not end up with the ‘lowest common denominator’ – messages and activities that offendno-one, but achieve nothing. Globally, the Sanitation and Water for All partnership is providing a framework for dialogue andaction at the highest level. The regional sanitation conferences, such as AfricaSan can provide a crucial opportunity to continuethat dialogue, and consider its particular relevance and application at regional level.
On reflection, AfricaSan3 delivered in terms of advocacy. Through high-level statements and media coverage it was itself anadvocacy activity. Participants discussed advocacy materials and activities and shared experience. And the technical sessions ona range of issues – from sustainable technologies, to economic analyses – equipped advocates with the facts and figures they needas the evidence base for their work. If AfricaSan 4 can achieve these same functions, it will be serving a useful function in thesector. If it can go further, fostering a strong, civil-society-led social movement, providing a platform for the development andsharing of nuanced advocacy messages, and strengthening coalitions between organizations, then it will be doing even better.
22.4 REFERENCESCox B. (2011). Campaigning for International Justice. Available at: http://www.bond.org.uk/data/files/Campaigning_for_International_
Justice_Brendan_Cox_May_2011.pdf (Accessed 10 September 2013).Teles S. and Schmitt M. (2011). The Elusive craft of evaluating advocacy. Available at: http://www.hewlett.org/uploads/documents/
Elusive_Craft.pdf (Accessed 10 September 2013).WSSCC (2012). Synthesis of assessments of Regional Sanitation Conferences: looking back to look forward. Piers Cross, with contributions
from Barbara Evans, Diana Iskreva, Ceridwen Johnson, Clarissa Brocklehurst, Yolande Coombes, Ravi Narayan, Marta Litwinczik andArchana Patkar. WSSCC, Geneva.
Making the case for sanitation and hygiene 181

Looking Ahead


Chapter 23
ConclusionsThe MDGs and Post 2015
Yolande CoombesWater and Sanitation Program
23.1 AN AfricaSan BOOKIn the introduction to this book, Piers Cross reminds us that AfricaSan is more than just a series of meetings, but has become amovement for change in sanitation. The processes that take place between the conferences and meetings are just as critical to thesuccess as the events themselves. To build on this momentum, and to broaden the audience, it was decided to produce an‘AfricaSan’ book. This book has three main objectives:
• To document the technical papers presented at AfricaSan 3 to bring the knowledge to a wider audience.• To capture the discussion and new knowledge that was generated in the interactions at AfricaSan 3.• To update that knowledge with new learning generated since the conference.
These objectives were used as the criteria to decide on what chapters to include in this book, as well as using the feedbackfrom the country preparation meetings ahead of AfricaSan 3. The country preparation meetings outlined (i) key priority areaswhere countries were requesting technical assistance, (ii) a review on progress against the eThekwini commitments and iii) areview of the action plans countries had put together. These three pieces of information helped to identify those topics wheremore information was needed. Figure 23.1 summarizes the country priority actions in a word cloud and these address manyof the specific chapters and cross cutting themes of this book. But the intention of this AfricaSan book was not only toexplore the challenges that countries face, but also to document what has been learned in the past 10 years of the AfricaSanmovement, which could assist countries to accelerate their rate of progress towards the MDGs and ultimately universalaccess to sanitation.
23.2 WHAT HAVE WE LEARNED?23.2.1 Impacts of poor sanitationOur understanding of the impacts of poor sanitation and hygiene increases as we gather more and better evidence. InChapter 3, we learned how the burden of disease from diarrhoea is greatest amongst African children under 5, but that
Figure 23.1 All Africa word cloud highlighting country priorities for technical assistance.

interventions to improve sanitation and hygiene are one of the most cost-effective ways of relieving this burden. Similarly,as the evidence base grows from more impact evaluations, more of these are needed within the African context, andshould be used not just for advocacy, but also for assessing cost-effectiveness of different methods of implementation overtime. This point was echoed in Chapter 4 on economic impacts of sanitation and hygiene, where it was also notedthat current investments in sanitation and hygiene are still low (less than 0.1% of GDP): quantifying the damage ofpoor sanitation and hygiene can be a way to both advocate for greater resources, and to demonstrate the impact ofeliminating open defecation in the continent. The burden of poor sanitation falls disproportionately on the poor, and tacklingthese and other inequities was the theme of Chapter 5 which presented case studies on menstrual hygiene, people living withaids and sexual violence to demonstrate how support measures are needed to overcome specific impediments that stand inthe way of excluded groups accessing safe services. For universal access to be achieved, the needs of all groups must beaddressed.
23.2.2 Behaviours and market-based approaches to tackle hygiene and sanitationA recurring theme throughout the book is the importance of the correct behaviours for sanitation and hygiene: this theme isspecifically addressed in Chapters 6 and 7. Provision of hardware is not enough; intrinsic motivation to practice safesanitation or handwashing with soap is the key to sustainability and health impact. One approach to achieving this is throughsanitation marketing which was reviewed in Chapter 8, where key lessons from sanitation marketing programs in Africa andbeyond were shared.
Two emerging topics, especially important in the context of the Post 2015 targets (see next section) are: re-use and faecalsludge management (FSM). Good FSM becomes increasingly important as it is becomes evident that the safe managementof excreta out of the household is as important as the containment within. In Africa, lack of appropriate finance is hamperingthe scale-up of FSM services and thus its profitability (see Chapter 10). Chapter 9 explores how the productive re-use ofsanitation waste can contribute to increased food security, how this could be introduced in both rural and urban settings inAfrica and how income could potentially be generated from the reuse of excreta.
The role of the private sector was a recurring theme at AfricaSan 3, both in the technical café presentations as well as themain thematic sessions. Chapter 12 focuses on market-based approaches. building on sanitation marketing from Chapter 8and looking to the future and the engagement with small and medium enterprises working on sanitation through businessdevelopment services. In order to accelerate the rate of progress to sanitation, market based approaches, which work at scale,are needed.
23.2.3 Specific SettingsMany countries requested guidance with respect to specific sanitation issues from particular settings. Chapter 11 reports on howonly half of schools in Africa have adequate sanitation facilities, yet improvedWASH facilities in schools is known to impact onlifelong habits and behaviours. The chapter helps countries think through how to improve WASH in schools based onrecommendations provided by counties at AfricaSan 3. School WASH has specific targets in the post 2015 agenda. Chapters14, 15 and 17 address the settings of Urban, Rural and Small towns and review the progress that has been made as well asthe existing challenges for the continent. Across all three settings there are some common issues such as scale, the enablingenvironment and the service delivery pathway, all of which need to be addressed in the efforts to accelerate the rate ofaccess to sanitation.
In Chapters 13 and 16 on the case of Rwanda and on Community-Led Total Sanitation (CLTS) in Africa we learned aboutsome of Africa’s success stories with respect to sanitation. Rwanda as the host nation for AfricaSan 3 was, at the time, one of onlyfour countries on track to achieve the sanitation MDG in sub-Saharan Africa. Rwanda has made great strides in solid wastemanagement as well as household sanitation. CLTS in Africa documents how in a relatively short period of time since itsintroduction to the continent, great progress has been made, and has contributed considerably to scaling up access tosanitation. This was a very vibrant session of the AfricaSan conference and the chapter captures the discussion andrecommendations made at the conference.
23.2.4 Core country priority themesThe end section of the book reflects some of the most important themes of the conference, which relate back to the countrypriorities as highlighted in the word cloud – financing, monitoring, capacity building and advocacy. Many of these prioritiesare areas where countries are struggling in terms of progress against the eThekwini commitments, and Chapter 18 flags those
Sanitation and Hygiene in Africa186

commitments where more needs to be done. In addition, it reviews the changes to the indicators to measure the eThekwinicommitments that the Ministers at AfricaSan 3 put forward.
Chapter 19 analyses how sanitation is financed and how the burden falls mainly on the household and how a lifecycleapproach to costs and financing sanitation needs to be taken. The cost of sustaining basic sanitation services for 20 years canbe five to twenty times the cost per person of building a new latrine. Chapter 20 on monitoring reviews some of thechallenges such as monitoring behaviour change. At AfricaSan 3 the sessions on monitoring provided opportunities toanalyse challenges and share approaches and best practices which are captured in this chapter. The need for capacitybuilding in sanitation was a key theme emerging from several country preparation meetings prior to AfricaSan 3 and cutacross sessions throughout the conference. Chapter 21 assesses the need for sanitation capacity in Africa followed by adiscussion on where future efforts might focus to bridge the capacity gap and ensure that capacity building becomes acentral part of sanitation planning and implementation.
At the heart of the AfricaSan movement is the core aim to raise the profile of hygiene and sanitation withinGovernment, within other sectors and on the international stage. Chapter 22 reviews how advocacy work during thepast decade has broken the taboo around sanitation: clean toilets and good hygienic behaviour are now consideredessential for the economic and social development of a country. The chapter ends by setting a challenge to AfricaSan 4 toprovide a platform for the development and sharing of nuanced advocacy messages, and strengthening coalitions betweenorganizations.
23.3 WHERE ARE WE NOW?In the ten years since the first AfricaSan in 2002 the 2012 JMP update on sanitation shows that coverage rate for improvedsanitation in Africa is now 30% (compared to 28% in 2002). This equates to 127 million people who have gained access toimproved sanitation since 1990, but because of population increases, the rate of change is marginal. In sub-Saharan Africa45% of the population use either shared or unimproved facilities and an estimated 25% practice open defecation (31% in2002). What this shows us is that although progress is being made, the rate of progress is only marginally ahead of the ratesof population growth. This rate needs to be accelerated to realise the MDGs.
However there are some success stories (such as the Rwanda story in Chapter 16) and Table 23.1 taken from the 2012JMP update highlights countries in Africa which have performed above the regional average.
Table 23.1 Countries in Africa, which have performed above the regional average.
Population in2010 (millions)
Sanitationcoveragein 2010 (%)
Population thatgains access tosanitation since1995 (millions)
MDGprogress
Proportion of 2010population thatgained access tosanitation since1995 (%)
Angola 19.1 58 6.8 On track 35.9
Rwanda 10.6 55 3.6 Not ontrack
33.7
Cape Verde 0.5 61 0.2 On track 32.3
Gambia 1.7 68 0.5 Progressbutinsufficient
28.5
Botswana 2 62 0.5 On track 25.8
Malawi 14.9 51 3.4 Not ontrack
22.8
DRC 66 24 10.7 Not ontrack
16.3
Sub-Saharan Africa 856 30 105 Not ontrack
12.2
Source: JMP 2013 update.
Conclusions 187

One way to measure progress is in terms of the outcome numbers of those who have gained access to sanitation, and that is theway that progress towards the MDGs is measured. Another and arguably more important way to review progress is on theprogrammatic conditions and enabling environment for sanitation as the intermediate outcomes. If attention and focus is notmade on improving intermediate outcomes then hope for accelerating access to improved sanitation will remain out of reach.
Table 23.2 Progress on commitments reported at AfricaSan 3.
Commitment Indicators Score
1. Bring the outcomes of AfricaSan 2008 to the African Union Heads of State Summit;
Outcomes taken to AU Done
2. Track implementa�on of the eThekwini Declara�onand report on progress at the AfricaSan 3
eThekwini reported at AfricaSan 3Done
3. Update country sanita�on and hygiene policies; establish one na�onal plan for accelera�ng progress to meet na�onal sanita�on goals/MDGs; and ensure na�onal programs are on track;
Is there a na�onal sanita�on policy?
4. Increase the profile of sanita�on and hygiene in PRSP and other strategic planning processes;
What profile is given to sanita�on within the PRSP
5. Ensure one, accountable ins�tu�on takes leadership of the na�onal sanita�on por�olio; establish one coordina�ng body for sanita�on and hygiene, involving all stakeholders;
Is there a principle accountable ins�tu�on to take leadership?
Is there one coordina�ng body involving all stakeholders?
6. Establish specific public sector budget alloca�ons for sanita�on and hygiene programs with a target alloca�on of a minimum of 0.5% of GDP;
Is there a specific public sector budget line for sanita�on?
Is 0.5% of GDP allocated to sanita�on?
NOT MEASURED IN 2011 7. Use effec�ve and sustainable approaches, such as household and community led ini�a�ves, marke�ng for behaviour change, targeted at the poor, women, children, youth and the unserved;
8. Development sanita�on informa�on systems and tools to track progress at local and na�onal levels; produce regular regional reports on Africa's sanita�on status;
Is there a sanita�on monitoring and evalua�on system?
9. Recognize gender and youth aspects of sanita�on, and involve women in all decision-making;
Do ins�tu�onal sanita�on programs include gender
aspects
10. Build and strengthen capacity for sanita�on and hygiene implementa�on including research and development, and support knowledge exchange and partnership development;
NOT MEASURED IN 2011
11. Give special a�en�on to countries, or areas, emerging from conflict or natural disasters
NOT MEASURED IN 2011
Legend: = Good Progress = Some Progress = Insufficient Progress
Sanitation and Hygiene in Africa188

As is pointed out in Chapter 18, AfricaSan 3 provided an opportunity for countries to report back on progress on the eThekwinicommitments, and Chapter 15 discussed key elements of the enabling environment. Table 23.2 identifies some areas of progressthat the sub-continent has seen on average, to improve the enabling environment, but this table also highlights some keybottlenecks that persist. What is important to note is that improving all dimensions of the enabling environment (e.g., policy,institutional arrangements, implementation capacity, financing, cost-effectiveness, and monitoring and evaluation systems) atthe country level is what will enable countries to move from current trends in access to those that are needed to achieveuniversal access. As mentioned in Chapter 18 some of the commitments were not measured in 2011 and at AfricaSan 3,Ministers recommended that indicators be developed for all the commitments, and that a revised scoring system bedeveloped in line with other pan-Africa processes. As Chapter 18 states, in some cases the original indicators and criteria didnot adequately measure implementation of the eThekwini commitments. For example, the indicator used to measure nationalpolicies and plans, captured only their existence and not the second half of the commitment, which calls for steps to be takento ensure national sanitation programs are on track. AMCOW have taken the lead to ensure that monitoring of thecommitments better reflects their intention.
23.4 AFTER THE MDGS – POST 2015 TARGETSAs has been mentioned elsewhere in this book the MDG for sanitation in Africa will not be met. A few countries are ontrack, but the continent as a whole will miss this target. However, having a target such as the MDG to strive towardshas been positive and motivating for many countries and sector stakeholders. As a result technical experts have beendeliberating about what targets should be set for sanitation and hygiene under the post-2015 global development agenda.Many different individuals and organisations have been consulted over the past two years and there are four main targetsfor WASH (which are subsequently broken down into a series of sub-targets and indicators). As with the MDGs thepurpose in setting these targets was to be ambitious, and give countries something to strive towards but they may notnecessarily be achievable by all countries in Africa in the given timeframe without concerted efforts to accelerate the rate ofaccess to sanitation.
23.4.1 The Post 2015 Targets for WASH
(1) No one practices open defecation.(2) Everyone has safe water, sanitation and hygiene at home.(3) All schools and health centres have water, sanitation and hygiene.(4) Water, sanitation and hygiene are sustainable and inequalities have been progressively eliminated.
23.4.2 Indicators for the targets include
• The percentage of population using adequate sanitation.• The percentage of households with soap and water at a handwashing facility.• The percentage of primary and secondary schools with safe drinking water, separate toilets for boys and girls, and
provisions for menstrual hygiene management and washing hands with water and soap.• The progressive reduction of inequalities between disadvantaged groups and the general population.
To assist countries interpret and operationalize these targets within a rights based approach, a series of working groups was setup to refine the targets and indicators along 4 themes: (i) Water, (ii) Sanitation (iii) Hygiene and (iv) Equity andNon-Discrimination.
23.4.3 Sanitation and Hygiene (household/////population) sub-targets and indicators
2025 Target: no one practices open defecation, and inequalities in the practice of open defecation have beenprogressively eliminated.
Supporting indicators:
• Percentage of population not using any sanitation facility.• Percentage of households in which open defecation is practiced by any household member.• Percentage of households with children under 5 reporting hygienic disposal of the stools of children under 5.
Conclusions 189

2030 Target:. everyone uses basic handwashing facilities when at home, and inequalities in access have beenprogressively eliminated.
Supporting indicators:
• Percentage of households with soap and water at a handwashing facility commonly used by family members.• Percentage of households with soap and water at a handwashing facility within or immediately near sanitation facilities.• Percentage of households with soap and water at a handwashing facility within or immediately near the food
preparation area.
2040 Target:. everyone uses adequate sanitation at home, and the excreta from at least half of households with adequatesanitation are safely managed. Inequalities in access have been progressively reduced.
Supporting indicators:
• Percentage of population using an adequate sanitation facility.• Percentage of households where the sanitation facility is used by all members of household (including men and women,
boys and girls, elderly, people with disabilities) whenever needed.• Percentage of households with adequate sanitation whose excreta are safely managed.• Share of human excreta that reaches designated disposal sites.
Additional sub-targets have been put together for schools, and health centres. For more information on the Post 2015 targetsplease visit www.wssinfo.org
23.5 LOOKING AHEADThe post 2015 targets have been designed around a vision where everyone in Africa would use adequate sanitation when at homeand that the excreta from at least half of schools, health centres and households are safely managed and most importantly, thatinequalities in access to sanitation have been progressively reduced. To reach this vision of universal access we need to acceleratethe rate of access to sanitation. Figure 23.2 shows the number of years it will take to achieve universal access if countries maintainthe same annual coverage rate they have had from 1990 to now. For sub-Saharan Africa it will be 123 years before the continentachieves universal access if it maintains the current annual trend of 0.81% per year, and for some countries it will be more than200 years from now (Tanzania, Niger and Nigeria).
But the rate of acceleration needed to achieve the 2040 target in most African countries is not a big leap; on average it meansaccelerating the rate of progress to 3.5%. Table 23.3 shows the additional annual percentage needed to achieve the 2040 target ofuniversal access.
If countries which are part of the AfricaSan movement commit to accelerating the rate of access then an Open defecation FreeAfrica where there is universal access can be a reality in our lifetime.
0 50 100 150 200 250
Burkina Faso (0.75%)
DRC (1.19%)
Ethiopia (1.18%)
Ghana (0.5%)
Kenya (0.75%)
Mozambique (0.75)
Niger (0.38%)
Nigeria (0.38%)
Senegal (1.56%)
Tanzania (0.44%)
Uganda (1.06%)
Zambia (0.94%)
Sub-Saharan Africa…
2040 UniversalAccess Target
Years to GainUniversal Access
Figure 23.2 Number of Years to obtain Universal Access if current rate of annual progress continues (Source: Data from JMP2013 update).
Sanitation and Hygiene in Africa190

Table 23.3 Additional annual percentage needed to achieve the 2040 target of universal access.
Country Annual ratesince 1995to 2011
Years to gainuniversalaccess
UA achievedwill beachieved by
Additionalannual rate ofaccelerationneeded to reach2040 target
Burkina Faso 0.75% 133 2146 2.65%
DRC 1.19% 84 2097 2.21%
Ethiopia 1.19% 84 2097 2.31%
Ghana 0.50% 200 2213 2.90%
Kenya 0.75% 133 2146 2.75%
Mozambique 0.75% 133 2146 2.75%
Niger 0.38% 263 2276 3.12%
Nigeria 0.38% 263 2276 3.12%
Senegal 1.56% 64 2077 1.94%
Tanzania 0.44% 227 2240 3.06%
Uganda 1.06% 94 2107 2.44%
Zambia 0.94% 106 2119 2.56%
Sub-Saharan Africa 0.81% 123 2136 2.69%
Source: Data from JMP 2013
Conclusions 191


Sanitation and Hygiene in Africa: Where do We Stand?Analysis from the AfricaSan Conference, Kigali, Rwanda
Edited by Piers Cross and Yolande Coombes
The Third African Sanitation and Hygiene Conference was held in Kigali, Rwanda in July 2011. It was hosted by the Government of the Republic of Rwanda, and the African Minister s Council on Water. The meeting attracted extraordinary interest: over 1000 people registered and nearly 900 people attended from a total of 67 countries, including representatives of 42 African countries.
The content of AfricaSan 3 was aligned with the needs of countries as defined in country preparation meetings which took place in advance. AfricaSan 3 looked to address the country needs and to commitments and country action planning. Different groups (ministers, civil society, local government, utilities, and donors) committed to actions to support the goals of AfricaSan. The goal of the AfricaSan process is to support countries to achieve the Millennium Development Goal, (MDG) for sanitation and hygiene.
Sanitation and Hygiene in Africa: Where do We Stand? takes stock of progress made by African countries through the AfricaSan process since 2008 and the progress needed to meet the MDG on sanitation by 2015 and beyond. This book addresses priorities which have been identified by African countries as the key elements which need to be addressed in order to accelerate progress.
•ReviewsprogressonimplementingtheeThekwiniDeclarationtomeettheMDGforsanitationand progress generally in Africa. It analyses what is needed to accelerate the rate of access to sanitation in Africa.
•SharesadvancesintheevidencebaseonsanitationandhygieneinAfricatobeableto assist decision-makers to overcome key blockages in implementing large-scale sanitation and hygiene programs.
•Raisestheprofileofsanitationandhygieneasadeterminantofsustainabledevelopmentinorder to strengthen leadership and advocacy for sustained sanitation and behavior changes.
This book is essential reading for government staff from Ministries responsible for sanitation, sector stakeholders working in NGOs, CSOs and agencies with a focus on sanitation and hygiene and water and Sanitation specialists. It is also suitable for Masters courses in water and sanitation and for researchers and the donor community.
Sanitation and H
ygiene in Africa: W
here do We S
tand?Edited by P
iers Cross and Yolande Coombes
www.iwapublishing.com
ISBN: 9781780405414 (Paperback)ISBN: 9781780405421 (eBook)
Sanitation and Hygiene in Africa: Where do We Stand?Analysis from the AfricaSan Conference, Kigali, RwandaEdited by Piers Cross and Yolande Coombes
Sanitation and Hygiene in Africa_layout_2.0.indd 1 19/09/2013 13:13


