18
Sanlam Employee Benefits Sanlam Plus Pension & Provident Preservation Fund monthly investment fact sheets May 2019
Sanlam Employee Benefits
Sanlam Plus Pension & Provident Preservation Fund monthly
investment fact sheetsMay 2019

Sanlam Plus Pension & Provident Preservation Fund May 2019
SMM 70 Portfolio
SMM 50 Portfolio
SMM Moderate Absolute Fund
SMM NUR Balanced Fund
Sanlam Accumulation Portfolio
SIM Balanced Fund
SIM Moderate Absolute Fund
SIM Cash Fund
Sanlam Allan Gray Global Balanced Portfolio
Sanlam Coronation Houseview Portfolio
Sanlam Foord Balanced Fund
Sanlam Investec Balanced Fund
Satrix Enhanced Balanced Tracker Fund
Sanlam Monthly Bonus Fund
Sanlam Stable Bonus Portfolio
The benchmark reflects the fund's long-term strategic asset allocations. Fund asset allocations may be allowed to vary Monthly and cumulative returnsThe benchmark reflects the fund's long-term strategic asset allocations. Fund asset allocations may be allowed to vary The benchmark reflects the fund's long-term strategic asset allocations. Fund asset allocations may be allowed to vary
Sanlam Investment Management Single Manager Range
Monthly and cumulative returns
External Single Manager Range
Index-tracking Range
Member Investment Selection Menu
Multi-manager Range
Smoothed Bonus Range
Regulation 28 Compliance
LIFESTAGE PROGRAMMELIFESTAGE PROGRAMMEIFESTAGE PROGRAMMEMember Investment Selection Menu
All of the Trustee-approved institutionally priced portfolios are compliant with Regulation 28 .
The Sanlam Umbrella Fund Trustees are responsible for ensuring compliance with Regulation
28 of the Pension Funds Act, and no monitoring is required at Participating Employer
level. The Trustees will take whatever steps are necessary to ensure ongoing compliance
with Regulation 28 including the possibility of making changes to the Fund's investments, for
example closing non-compliant portfolios to new inflows, as permitted in terms of the
approved Investment Protocol.
Smoothed Bonus Range
Smooth bonus portfolios contain various intricacies outside of the scope of these monthly fact
sheets. For more information members are advised to consult the product brochures which
explain the mechanics of the Sanlam Monthly Bonus Fund and the Sanlam Stable Bonus
Portfolio in more detail. These brochures are available on the Sanlam website at
www.sanlam.co.za

Period Ending 31-May-19 Benchmark 49% Capped SWIX (Shareholder Weighted Index)
Fund Size R 734 million 10% BEASSA Total Return Index
Inception Date Feb-00 2% Short Term Fixed Interest Index (STeFI)
8% Sapy Property Index
6% Barclays SA Inflation Linked Index
21% MSCI World (Developed Markets) Equity Index
4% Barclays Global Aggregate Bond Index
The relatively high equity allocation of the Fund should occasionally result in
high volatility but also high rate of growth compared to funds with a moderate
risk profile.
Risk Profile
This fund has a moderate -aggressive risk profile
Foreign Split
Fund Benchmark
Financials 17.9%
Resources 38.2%
Industrials 43.9%
*Based on 1 year returns
Fund Benchmark
1 Month -3.8% -3.2%
3 Months 0.2% 1.2%
6 Months 6.7% 6.9%
1 Year 4.4% 4.2%
3 Years 3.8% 4.4%
5 Years 5.6% 6.8%
Share Name % of Equities
Naspers 16.2%
Standard Bank Group Limited 4.4%
Firstrand Limited 4.4%
Anglo American 4.0%
British American Tobacco Plc 3.7% % of negative months over the last 3 years
Sasol Limited 3.6% Average capital loss in one month
Impala Platinum Holdings Limited 2.7% Downside risk *
MTN Group Limited 2.2% * Downside risk is measured as the standard deviation of the underperformance
BHP Group 2.2%
Sanlam 2.2%
4.7%
of the portfolio relative to CPI
Note: Performance figures are gross of investment management fees, but are net of any performance fees (if applicable). For portfolios in the Smoothed Bonus Range ,the returns are gross of investment management fees,
but are net of any guarantee premiums. Performance figures for periods greater than 12 months are annualised. All data shown is at the month-end, unless specifically indicated differently. Changes in currency rates of
exchange may cause the value of your investment to fluctuate. Past performance is not necessarily a guide to the future returns. The value of investments and the income from them may increase or decrease and are not
guaranteed. You may not get back the amount you invest. The product information sheets are prepared for the SANLAM UMBRELLA FUND by its investment consultants. The product information sheets are prepared in
good faith and the information, data and opinions contained in the product information sheets are based on source information considered reliable. However, no guarantee, explicit or otherwise are provided that the
information and data contained therein are correct and comprehensive. The SANLAM UMBRELLA FUND and the investment consultants cannot be held liable for any loss, expense and/or damage following from the use of
the product information sheets.
21.1%
34.4%
44.5%
41.7%
-1.9%
Sanlam Plus Pension & Provident Preservation Fund May 2019
The benchmark reflects the fund's long-term strategic asset allocations. Fund asset allocations may be allowed to vary from the benchmark, depending on market conditions.
Asset class breakdown
Fund performance (%)
Top 10 equity holdings (% of Equities)
Equity sectoral exposure (%)
Fund manager breakdown
Risk analysis(based on the last 3 years' monthly returns)
LIFESTAGE PROGRAMMELIFESTAGE PROGRAMMEIFESTAGE PROGRAMMESMM 70 Portfolio
0.7%
-1.8%
101.1%
-20.0%
0.0%
20.0%
40.0%
60.0%
80.0%
100.0%
International Bond International Cash International Equity
0.80% per annum for the first R100m0.75%per annum on portion of assets between R100m - R250m0.70% per annum on portion of assets between R250m - R500m0.60% per annum on portion of assets between R500m - R1bn0.55%per annum on the portion above R1bn
Fees
60
80
100
120
140
160
-4%
-2%
0%
2%
4%
6%
May-1
8
Ju
n-1
8
Ju
l-18
Aug
-18
Sep
-18
Oct-
18
No
v-1
8
De
c-1
8
Ja
n-1
9
Feb
-19
Mar-
19
Apr-
19
May-1
9
Cum
ula
tive R
etu
rn
Month
ly R
etu
rn
Fund Fund (Cum)
48.5%
14.6%
4.6%8.1%
24.2%
0%
10%
20%
30%
40%
50%
60%
Equities and Alternative Bonds Cash Property Foreign
Monthly and cummulative returns
Fund objective
Blackrock Dev World Equity, 0.9%
Blue Ink Fixed Income, 1.1%
Blue Ink Long Short Aggr, 1.8%
Coronation Strategic Income, 0.6%
Ethos Mid Market 1A Partnership 2,
0.1%Ethos Mid Market1
(A) Partnership, 0.7%
Ginsglobal Emerging Markets,
2.6%Ginsglobal Equity
Index, 7.6%
International Cash, 2.9%
Matrix Bond Plus, 4.2%
ML Drakens Africa SA UCITs, 1.3%
Prescient Bonds, 6.3%
Sanlam Africa Equity, 1.9%
Satrix Global Factor Enhanced Equity,
6.2%Satrix Property Tracker, 7.4%
SIM Active Income, 0.4%
SMM Core Equity, 17.8%
SMM Inflation Linked Bonds, 1.6%
SMM Momentum Equity, 9.8%
SMM Quality Equity, 10.4%
SMM Value Equity, 9.9%
SMMI Cash, 1.1%
SMMI Tracker MSCI Index UPFUP, 3.4%
Please refer to the “Local equity manager breakdown for SMMI portfolios” for a detailed outline of the underlying equity managers within this portfolio.
All Sub-funds invested in this portfolio are charged the highest investment management fee applicable to the first tranche of assets, and Sub -funds with greater than R100 million assets are separately rebated any savings due to the sliding investment management fee scale on a monthly basis.The underlying investment managers may be incentivised on a performance fee basis.

Period Ending 31-May-19 Benchmark 35.0% Capped SWIX (Shareholder Weighted Index)
Fund Size R 461 million 20.0% BEASSA Total Return Index
Inception Date Sep-00 10.0% STeFI Composite
6.0% Sapy Property Index
9.0% Barclays SA Inflation Linked Index
2.0% US 3 month Libor Rate
15.0% MSCI World Equity Index (Developed Markets)
The Fund aims to provide investment returns in line with its risk profile. The 3.0% Barclays Global Aggregate Index
moderate equity allocation should result in moderate volatility and a moderate
rate of growth.
This fund has a moderate risk profile.
Foreign Split
Fund Benchmark
Financials 18.1%
Resources 38.2%
Industrials 43.7%
*Based on 1 year returns
Fund Benchmark
1 Month -2.8% -2.1%
3 Months 1.0% 1.6%
6 Months 6.3% 6.5%
1 Year 5.5% 5.4%
3 Years 5.0% 4.9%
5 Years 6.4% 6.9%
Share Name % of Equities
Naspers 16.1%
Standard Bank Group Limited 4.4%
Firstrand Limited 4.4%
Anglo American 4.1%
British American Tobacco Plc 3.7%
Sasol Limited 3.6%
Impala Platinum Holdings Limited 2.7% % of negative months over the last 3 years
MTN Group Limited 2.2% Average capital loss in one month
BHP Group 2.2% Downside risk *
Sanlam 2.2%
3.5%
* Downside risk is measured as the standard deviation of the underperformance
of the portfolio relative to CPI
Note: Performance figures are gross of investment management fees, but are net of any performance fees (if applicable). For portfolios in the Smoothed Bonus Range ,the returns are gross of investment management fees,
but are net of any guarantee premiums. Performance figures for periods greater than 12 months are annualised. All data shown is at the month-end, unless specifically indicated differently. Changes in currency rates of
exchange may cause the value of your investment to fluctuate. Past performance is not necessarily a guide to the future returns. The value of investments and the income from them may increase or decrease and are not
guaranteed. You may not get back the amount you invest. The product information sheets are prepared for the SANLAM UMBRELLA FUND by its investment consultants. The product information sheets are prepared in good
faith and the information, data and opinions contained in the product information sheets are based on source information considered reliable. However, no guarantee, explicit or otherwise are provided that the information and
data contained therein are correct and comprehensive. The SANLAM UMBRELLA FUND and the investment consultants cannot be held liable for any loss, expense and/or damage following from the use of the product
information sheets.
21.1%
34.4%
44.5%
38.9%
-1.4%
Sanlam Plus Pension & Provident Preservation Fund May 2019
The benchmark reflects the fund's long-term strategic asset allocations. Fund asset allocations may be allowed to vary from the benchmark, depending on market conditions.
Asset class breakdown
Fund performance (%)
Top 10 equity holdings (% of Equities)
Equity sectoral exposure (%)
Fund manager breakdown
Risk analysis(based on the last 3 years' monthly returns)
LIFESTAGE PROGRAMMELIFESTAGE PROGRAMMEIFESTAGE PROGRAMMESMM 50 Portfolio
Monthly and cumulative returns
2.8%
-4.4%
101.6%
-20.0%
0.0%
20.0%
40.0%
60.0%
80.0%
100.0%
International Bond International Cash International Equity
0.75% per annum for the first R100m 0.70%per annum on portion of assets between R100m - R250m 0.65% per annum on portion of assets between R250m - R500m 0.55% per annum on portion of assets between R500m - R1bn 0.50%per annum on the portion above R1bn
60
80
100
120
140
160
-4%
-2%
0%
2%
4%
6%
May-1
8
Ju
n-1
8
Ju
l-18
Aug
-18
Sep
-18
Oct-
18
No
v-1
8
De
c-1
8
Ja
n-1
9
Feb
-19
Mar-
19
Apr-
19
May-1
9
Cum
ula
tive R
etu
rn
Month
ly R
etu
rn
Fund Fund (Cum)*
35.7%
30.2%
7.8% 7.1%
19.2%
0%
5%
10%
15%
20%
25%
30%
35%
40%
45%
50%
Equities andAlternative
Bonds Cash Property Foreign
Blue Ink Fixed Income, 1.6%
Blue Ink Long Short Aggr, 1.3%
Coronation Strategic Income,
4.7%
Ethos Mid Market 1A Partnership 2,
0.1%Ethos Mid Market1
(A) Partnership, 0.7%
Futuregrowth Bonds, 2.1%
Ginsglobal Emerging Markets,
1.4%
Ginsglobal Equity Index, 9.9%
International Cash, 2.0%
Matrix Bond Plus, 8.4%
ML Drakens Africa SA UCITs, 1.0%
Prescient Bonds, 12.5%
Sanlam Africa Equity, 0.8%
Satrix Global Factor Enhanced Equity,
3.1%
Satrix Property Tracker, 6.4%
SIM Active Income, 3.3%
SMM Core Equity, 12.8%
SMM Inflation Linked Bonds, 2.6%
SMM Momentum Equity, 6.8%
SMM Quality Equity, 7.4%
SMM Value Equity, 7.1%
SMMI Cash, 1.0%
SMMI Tracker MSCI Index
UPFUP, 3.0%
Fees
Risk profile
Fund objective
Please refer to the “Local equity manager breakdown for SMMI portfolios” for a detailed outline of the underlying equity managers within this portfolio.
All Sub-funds invested in this portfolio are charged the highest investment management fee applicable to the first tranche of assets, and Sub-funds with greater than R100 million assets are separately rebated any savings due to the sliding investment management fee scale on a monthly basis.The underlying investment managers may be incentivised on a performance fee basis.

Period Ending 31-May-19 Benchmark CPI + 5%
Fund Size R 442 million
Inception Date May-03
This fund has a moderate risk profile
Fees
0.80% per annum for the first R100m
0.75%per annum on portion of assets between R100m - R250m
0.70% per annum on portion of assets between R250m - R500m
0.65% per annum on portion of assets between R500m - R1bn
0.60%per annum on the portion above R1bn
Fund
Financials
Resources
Industrials
*Based on 1 year returns
Fund Benchmark *
1 Month -2.2% 0.7%
3 Months 1.9% 2.9%
6 Months 7.0% 4.6%
1 Year 9.1% 9.5%
3 Years 5.4% 9.8%
5 Years 7.7% 10.0%
* The figure for the most recent month is estimated.
% of Equities
Naspers 13.1%
Sasol Limited 5.9%
Standard Bank Group Limited 5.0%
4.2%
3.7%
3.6%
3.2% % of negative months over the last 3 years
2.8% Average capital loss in one month
2.8% Downside risk **
ABSA Group Limited 2.2% ** Downside risk is measured as the standard deviation of the underperformance
of the portfolio relative to CPI
Anglo American 3.0%
Note: Performance figures are gross of investment management fees, but are net of any performance fees (if applicable). For portfolios in the Smoothed Bonus Range ,the returns are gross of investment management fees,
but are net of any guarantee premiums. Performance figures for periods greater than 12 months are annualised. All data shown is at the month-end, unless specifically indicated differently. Changes in currency rates of
exchange may cause the value of your investment to fluctuate. Past performance is not necessarily a guide to the future returns. The value of investments and the income from them may increase or decrease and are not
guaranteed. You may not get back the amount you invest. The product information sheets are prepared for the SANLAM UMBRELLA FUND by its investment consultants. The product information sheets are prepared in
good faith and the information, data and opinions contained in the product information sheets are based on source information considered reliable. However, no guarantee, explicit or otherwise are provided that the information
and data contained therein are correct and comprehensive. The SANLAM UMBRELLA FUND and the investment consultants cannot be held liable for any loss, expense and/or damage following from the use of the product
information sheets.
Firstrand Limited
REINET INV SCA 38.9%
Nedbank Group Limited -1.1%
British American Tobacco Plc
29.3%
30.6%
40.1%
Share Name
BHP Group
Sanlam Plus Pension & Provident Preservation Fund May 2019
Asset class breakdown
Monthly and cumulative returns
Fund performance (%)
Top 10 equity holdings (% of Equities)
Equity sectoral exposure (%)
Fund manager breakdown
Risk analysis
LIFESTAGE PROGRAMMELIFESTAGE PROGRAMMEIFESTAGE PROGRAMMESMM Moderate Absolute Fund
7.0%-10.3%
103.3%
-20.0%
0.0%
20.0%
40.0%
60.0%
80.0%
100.0%
International Bond International Cash International Equity
60
80
100
120
140
160
-4%
-2%
0%
2%
4%
6%
May-1
8
Ju
n-1
8
Ju
l-18
Aug
-18
Sep
-18
Oct-
18
No
v-1
8
De
c-1
8
Ja
n-1
9
Feb
-19
Mar-
19
Apr-
19
May-1
9
Cum
ula
tive R
etu
rn
Month
ly R
etu
rn
Fund Fund (Cum)*
27.7%28.6%
12.7%11.5%
19.5%
0%
5%
10%
15%
20%
25%
30%
Equities and Alternative Bonds Cash Property Foreign
Risk profile
Fund objective
Abax Flexible Equity, 13.1%
Aylett Equity Prescient B3, 6.8%
Blackrock Dev World Equity,
10.5%
Blue Ink Fixed Income, 1.6%
Coronation Strategic Income,
10.2%
Foord Domestic Absolute Return,
6.9%International Cash,
0.3%Matrix Medium Equity, 10.7%
Sanlam Real Assets Fund, 2.5%
Satrix Property Tracker, 1.9%
SIM Active Income, 5.9%
SIM Enhanced Yield, 4.9%
SMM Flexible Equity (Truffle),
10.0%
SMMI Cash, 0.7%
SMMI Tracker MSCI Index
UPFUP, 5.0%
Truffle Flexible Property, 9.0%
Foreign Split
The fund’s objective is to provide long-term absolute (positive) returns to investors. In specific terms, it aims to achieve a return of inflation + 5%, gross of investment management fees over any rolling three -year period and aim for no capital loss over any rolling 12 months. The fund has a low to medium risk profile relative to typical balanced portfolios.
All Sub-funds invested in this portfolio are charged the highest investment management fee applicable to the first tranche of assets, and Sub-funds with greater than R100 million assets are separately rebated any savings due to the sliding investment management fee scale on a monthly basis.The underlying investment managers may be incentivised on a performance fee basis.

Period Ending 31-May-19 Benchmark
Fund Size R 197 million The market value weighted average rolling three year total return
Inception Date Jan-14 of peer group Shariah Balanced Funds.
Provide stable long-term investment returns by investing in Shariah
compliant balanced funds.
Risk Profile
This fund is Shariah Compliant - moderate-aggressive risk profile.
0.95% per annum
Monthly and cumulative returns Foreign Split
Fund
Resources
Industrials
*Based on 1 year returns
Fund Benchmark
1 Month -1.9% -1.8%
3 Months 1.1% 0.7%
6 Months 5.9% 4.9%
1 Year 6.0% 3.7%
3 Years 4.8% 2.5%
5 Years 5.1% 3.5%
Share Name % of Equities
Anglo American 5.8%
BHP Group 4.5%
MTN Group Limited 4.3% % of negative months over the last 3 years
African Rainbow Minerals Limited 4.0% Average capital loss in one month
Mondi Limited 3.9% Downside risk **
Sasol Limited 3.9% ** Downside risk is measured as the standard deviation of the underperformance
A E C I LIMITED 3.4% of the portfolio relative to CPI
Metair Investments Ltd 3.3%
Barloworld Limited 3.2%
AVI Limited 3.0%
Sanlam Plus Pension & Provident Preservation Fund May 2019
41.7%
-1.3%
3.3%
Note: Performance figures are gross of investment management fees, but are net of any performance fees (if applicable). For portfolios in the Smoothed Bonus Range ,the returns are gross of investment management fees, but
are net of any guarantee premiums. Performance figures for periods greater than 12 months are annualised. All data shown is at the month-end, unless specifically indicated differently. Changes in currency rates of exchange
may cause the value of your investment to fluctuate. Past performance is not necessarily a guide to the future returns. The value of investments and the income from them may increase or decrease and are not guaranteed. You
may not get back the amount you invest. The product information sheets are prepared for the SANLAM UMBRELLA FUND by its investment consultants. The product information sheets are prepared in good faith and the
information, data and opinions contained in the product information sheets are based on source information considered reliable. However, no guarantee, explicit or otherwise are provided that the information and data contained
therein are correct and comprehensive. The SANLAM UMBRELLA FUND and the investment consultants cannot be held liable for any loss, expense and/or damage following from the use of the product information sheets.
52.4%
47.6%
Asset class breakdown
Fund performance (%)
Top 10 equity holdings (% of Equities)
Fund manager breakdown
LIFESTAGE PROGRAMMELIFESTAGE PROGRAMMEIFESTAGE PROGRAMMESMM NUR Balanced Fund
Fees
13.7%
86.3%
0.0%
20.0%
40.0%
60.0%
80.0%
100.0%
International Cash International Equity
60
80
100
120
140
160
-4%
-2%
0%
2%
4%
6%
May-1
8
Ju
n-1
8
Ju
l-18
Aug
-18
Sep
-18
Oct-
18
No
v-1
8
De
c-1
8
Ja
n-1
9
Feb
-19
Mar-
19
Apr-
19
May-1
9
Cu
mula
tive
Re
turn
Month
ly R
etu
rn
Fund Fund (Cum)*
39.8%
4.0%
33.4%
1.4%
21.4%
0%
5%
10%
15%
20%
25%
30%
35%
40%
45%
Equity Bonds Cash Property Foreign
ABSA Shariah Bank -Current Accounts, 0.8%
Kagiso Islamic Balanced,
39.2%
Old Mutual Albaraka Balanced, 30.1%
Sentio SCI HIKMA Shariah Balanced,
29.9%
Fund objective
Risk analysis
Equity sectoral exposure (%)

Period Ending 31-May-19 Benchmark 24.5% SWIX (Shareholder Weighted Index)
Fund Size R 12,596 million 24.5% Capped SWIX (Shareholder Weighted Index)
Inception Date 01-Jul-13 10.0% BEASSA Total Return All Bond Index
8.0% FTSE/JSE SAPY Index
2.0% Short Term Fixed Interest Index (STeFI)
6.0% Barclays SA Inflation Linked Index
21.0% MSCI World (Developed Markets) Equity Index
4.0% Barclays Global Aggregate Index
Fund Benchmark
Financials 18.4%
Resources 36.6%
Industrials 45.0%
*Based on 1 year returns
Fund Benchmark
1 Month -3.9% -3.4%
3 Months 0.7% 1.5%
6 Months 6.8% 7.5%
1 Year 4.5% 4.5%
3 Years 3.8% 4.0%
5 Years 6.1% 7.2%
Naspers 18.7%
Standard Bank Group Limited 4.4%
Firstrand Limited 4.1%
Anglo American 3.7%
Sasol Limited 3.5%
British American Tobacco Plc 3.2%
MTN Group Limited 2.5%
Impala Platinum Holdings Limited 2.2%
Sanlam 2.2%
BHP Group 2.1%
% of negative months over the last 3 years
Average capital loss in one month
Downside risk *
* Downside risk is measured as the standard deviation of the underperformance
of the portfolio relative to CPI
41.7%
-2.1%
4.8%
Note: Performance figures are gross of investment management fees, but are net of any performance fees (if applicable). For portfolios in the Smoothed Bonus Range ,the returns are gross of investment management fees, but
are net of any guarantee premiums. Performance figures for periods greater than 12 months are annualised. All data shown is at the month-end, unless specifically indicated differently. Changes in currency rates of exchange may
cause the value of your investment to fluctuate. Past performance is not necessarily a guide to the future returns. The value of investments and the income from them may increase or decrease and are not guaranteed. You may
not get back the amount you invest. The product information sheets are prepared for the SANLAM UMBRELLA FUND by its investment consultants. The product information sheets are prepared in good faith and the information,
data and opinions contained in the product information sheets are based on source information considered reliable. However, no guarantee, explicit or otherwise are provided that the information and data contained therein are
correct and comprehensive. The SANLAM UMBRELLA FUND and the investment consultants cannot be held liable for any loss, expense and/or damage following from the use of the product information sheets.
19.3%
31.6%
49.1%
Share Name % of Equities
Sanlam Plus Pension & Provident Preservation Fund May 2019
Fund performance (%)
Asset class breakdown
Fund manager breakdown
Monthly and cumulative returns
The benchmark reflects the fund's long-term strategic asset allocations. Fund asset allocations may be allowed to vary from the benchmark, depending on market conditions.
Top 10 holdings (% of Equities)
Equity sectoral exposure (%)
Foreign split
Risk analysis(based on the last 3 years' monthly returns)
LIFESTAGE PROGRAMMELIFESTAGE PROGRAMMEIFESTAGE PROGRAMMESanlam Accumulation Portfolio
The fund is an aggressive portfolio displaying high levels of volatility over the short term and is aiming to provide market related growth.Scrip lending may be performed on the passive equity component.
Risk profile
1.00% per annum for the first R50m0.90% per annum on the portion of assets between R50m - R100m0.775% per annum on the portion of assets between R100m – R300m0.70% per annum on the portion of assets between R300m – R500m0.65% per annum on the portion above R500m
All Sub-funds invested in Sanlam Lifestage Accumulation Portfolio are charged the highest investment management fee applicable to the first tranche of assets, and Sub-funds with greater than R50 million assets are separately rebated any savings due to the sliding investment management fee scale on a monthly basis.The underlying investment managers may be incentivised on a performance fee basis.
0.0%5.5%
94.5%
0.0%
20.0%
40.0%
60.0%
80.0%
100.0%
International Bond International Cash International Equity
Fees
Fund objective
This portfolio has an aggressive risk profile
54.1%
10.9% 1.5% 8.0%
25.5%
-20%
0%
20%
40%
60%
Equities andAlternative
Bonds Cash Property Foreign
Blue Ink Fixed Income, 1.6% Blue Ink Long Short
Aggr, 2.5%
Coronation Strategic Income, 0.6% Ethos Mid Market
1A Partnership 2, 0.1%Ethos Mid Market1
(A) Partnership, 0.6%
Ginsglobal Emerging Markets,
2.5%
Ginsglobal Equity Index, 3.6%
International Cash, 1.4%
Matrix Bond Plus, 4.0%
ML Drakens Africa SA UCITs, 0.7%
MSCI World Tracker, 8.2%
Passive Equity Portfolio, 12.4%
Satrix Global Factor Enhanced Equity,
4.1%
Satrix Property Tracker, 8.2%
SIM Active Income, 0.4%
SMM Core Equity, 9.2%
SMM Inflation Linked Bonds, 1.0%
SMM Momentum Equity, 4.9%
SMM Quality Equity, 5.0%
SMM Value Equity, 5.1%
SMMI Cash, 0.6%
SMMI Swix tracker, 12.5%
Please refer to the “Local equity manager breakdown for SMMI portfolios” for a detailed outline of the underlying equity managers within this portfolio.
Fund performance (%)
Fund manager breakdown
Monthly and cumulative returns
The benchmark reflects the fund's long-term strategic asset allocations. Fund asset allocations may be allowed to vary from the benchmark, depending on market conditions.
Top 10 holdings (% of Equities)
Equity sectoral exposure (%)
Foreign split
Risk analysis(based on the last 3 years' monthly returns)
Risk profile
1.00% per annum for the first R50m0.90% per annum on the portion of assets between R50m - R100m0.775% per annum on the portion of assets between R100m – R300m0.70% per annum on the portion of assets between R300m – R500m0.65% per annum on the portion above R500m
All Sub-funds invested in this portfolio are charged the highest investment management fee applicable to the first tranche of assets, and Sub-funds with greater than R50 million assets are separately rebated any savings due to the sliding investment management fee scale on a monthly basis.The underlying investment managers may be incentivised on a performance fee basis.
5.5%
94.5%
0.0%
20.0%
40.0%
60.0%
80.0%
100.0%
International Cash International Equity
Fees
Fund objective
60
70
80
90
100
110
120
130
140
-6%
-4%
-2%
0%
2%
4%
6%
May-1
8
Ju
n-1
8
Ju
l-18
Aug
-18
Sep
-18
Oct-
18
No
v-1
8
De
c-1
8
Ja
n-1
9
Feb
-19
Mar-
19
Apr-
19
May-1
9
Cum
ula
tive R
etu
rn
Month
ly R
etu
rn
Fund Fund (Cum)*
54.1%
10.9%1.5% 8.0%
25.5%
0%
10%
20%
30%
40%
50%
60%
Equities and Alternative Bonds Cash Property Foreign
Blue Ink Fixed Income, 1.6%
Blue Ink Long Short Aggr, 2.5% Coronation Strategic
Income, 0.6%
Ethos Mid Market 1A Partnership 2,
0.1% Ethos Mid Market1 (A) Partnership,
0.6%
Ginsglobal Emerging Markets,
2.5%Ginsglobal Equity
Index, 3.6%
International Cash, 1.4%
Matrix Bond Plus, 4.0%
ML Drakens Africa SA UCITs, 0.7%
MSCI World Tracker, 8.2%
Passive Equity Portfolio, 12.4%
Prescient Bonds, 6.0%Sanlam Africa
Equity, 1.8%
Satrix Global Factor Enhanced Equity,
4.1%
Satrix Property Tracker, 8.2%
SIM Active Income, 0.4%
SMM Core Equity, 9.2%
SMM Inflation Linked Bonds, 1.0%
SMM Momentum Equity, 4.9%
SMM Quality Equity, 5.0%
SMM Value Equity, 5.1%
SMMI Cash, 0.6%
SMMI Swix tracker, 12.5%
SMMI Tracker MSCI Index UPFUP, 3.0%
Please refer to the “Local equity manager breakdown for SMMI portfolios” for a detailed outline of the underlying equity managers within this portfolio.

Period Ending 31-May-19 Benchmark
Fund Size R 839 million
Inception Date Feb-75
The portfolio has a moderate-aggressive risk profile.
0.70% per annum for the first R100m
0.60% per annum on portion of assets between R100m - R250m
0.55% per annum on portion of assets between R250m - R500m
0.50%per annum on portion of assets between R500m - R1bn
0.45% per annum on the portion above R1bn
No performance Fees Foreign Split
*Based on 1 year returns
Fund Benchmark Benchmark
1 Month -3.0% -3.4% Financials 36.4%
3 Months 1.5% 0.5% Resources 20.2%
6 Months 8.6% 6.2% Industrials 43.4%
1 Year 6.1% 4.0%
3 Years 4.7% 2.8%
5 Years 6.4% 5.0%
% of negative months over the last 3 years
Average capital loss in one month
Downside risk *
Naspers N 22.1% * Downside risk is measured as the standard deviation of the underperformance
FirstRand / RMBH 4.2% of the portfolio relative to CPI
Stanbank 4.0%
Anglos 3.8%
Growpnt 3.5%
Sasol 3.3%
British American Tobacco 3.2%
MTN Group 2.8%
NEPIROCK (NEP) 2.3%
BILLITON (BHP) 2.2%
Note: Performance figures are gross of investment management fees, but are net of any performance fees (if applicable). For portfolios in the Smoothed Bonus Range ,the returns are gross of investment management fees, but are net of any
guarantee premiums. Performance figures for periods greater than 12 months are annualised. All data shown is at the month-end, unless specifically indicated differently. Changes in currency rates of exchange may cause the value of your
investment to fluctuate. Past performance is not necessarily a guide to the future returns. The value of investments and the income from them may increase or decrease and are not guaranteed. You may not get back the amount you invest. The
product information sheets are prepared for the SANLAM UMBRELLA FUND by its investment consultants. The product information sheets are prepared in good faith and the information, data and opinions contained in the product information
sheets are based on source information considered reliable. However, no guarantee, explicit or otherwise are provided that the information and data contained therein are correct and comprehensive. The SANLAM UMBRELLA FUND and the
investment consultants cannot be held liable for any loss, expense and/or damage following from the use of the product information sheets.
-1.8%
Share Name % of Equities 4.6%
41.7%
Fund
37.7%
18.3%
44.0%
Sanlam Plus Pension & Provident Preservation Fund May 2019
Alexander Forbes Global Large Manager Watch Median
Asset class breakdown
Monthly and cumulative returns
Fund performance (%)
Top 10 equity holdings (% of Equities)
Equity sectoral exposure (%)
LIFESTAGE PROGRAMMELIFESTAGE PROGRAMMEIFESTAGE PROGRAMMESIM Balanced Fund
0.3%
99.7%
0.0%
20.0%
40.0%
60.0%
80.0%
100.0%
International Cash International Equity
The fund’s objective is to provide stable long-term investment income and capital growth. It provides peer-related investment returns by investing primarily in equities, fixed-interest investments, cash and foreign assets.
60
80
100
120
140
160
-6%
-4%
-2%
0%
2%
4%
6%
8%
May-1
8
Ju
n-1
8
Ju
l-18
Aug
-18
Sep
-18
Oct-
18
No
v-1
8
De
c-1
8
Ja
n-1
9
Feb
-19
Mar-
19
Apr-
19
May-1
9
Cum
ula
tive R
etu
rn
Month
ly R
etu
rn
Fund Fund (Cum)*
53.3%
13.9%
6.7%
26.1%
0%
10%
20%
30%
40%
50%
60%
Equities Bonds Cash Foreign
Risk profile
Fees
Fund objective
All Sub-funds invested in this portfolio are charged the highest investment management fee applicable to the first tranche of assets, and Sub-funds with greater than R100 million assets are separately rebated any savings due to the sliding investment management fee scale on a monthly basis.
The benchmark reflects the fund's long-term strategic asset allocations. Fund asset allocations may be allowed to vary from the benchmark, depending on market conditions.
Risk analysis(based on the last 3 years' monthly returns)

Period Ending 31-May-19 Benchmark CPI+5%
Fund Size R 1,356.3 million
Inception Date 01-Jul-03
No performance Fees
Fund
*Based on 1 year returns Financials 25.9%
Resources 23.0%
Industrials 51.1%
Fund Benchmark
1 Month -0.6% 0.7%
3 Months 2.2% 2.9%
6 Months 6.4% 4.6%
1 Year 8.8% 9.5% % of negative months over the last 3 years
3 Years 7.0% 9.8% Average capital loss in one month
5 Years 8.5% 10.0% Downside risk *
* Downside risk is measured as the standard deviation of the underperformance
of the portfolio relative to CPI
Naspers N 24.9%
FirstRand / RMBH 5.2%
Stanbank 5.1%
Anglos 4.7%
Sasol 4.0%
British American Tobacco 3.6%
MTN Group 3.5%
BILLITON (BHP) 2.6%
Implats 2.6%
Sanlam 2.6%
Sanlam Plus Pension & Provident Preservation Fund May 2019
Note: Performance figures are gross of investment management fees, but are net of any performance fees (if applicable). For portfolios in the Smoothed Bonus Range ,the returns are gross of investment management fees,
but are net of any guarantee premiums. Performance figures for periods greater than 12 months are annualised. All data shown is at the month-end, unless specifically indicated differently. Changes in currency rates of
exchange may cause the value of your investment to fluctuate. Past performance is not necessarily a guide to the future returns. The value of investments and the income from them may increase or decrease and are not
guaranteed. You may not get back the amount you invest. The product information sheets are prepared for the SANLAM UMBRELLA FUND by its investment consultants. The product information sheets are prepared in good
faith and the information, data and opinions contained in the product information sheets are based on source information considered reliable. However, no guarantee, explicit or otherwise are provided that the information and
data contained therein are correct and comprehensive. The SANLAM UMBRELLA FUND and the investment consultants cannot be held liable for any loss, expense and/or damage following from the use of the product
information sheets.
Share Name % of Equities
Benchmark
-0.7%
2.1%
25.6%
17.5%
56.9%
36.1%
Fund performance (%)
Monthly and cumulative returns
The benchmark reflects the fund's long-term strategic asset allocations. Fund asset allocations may be allowed to vary from the benchmark, depending on market conditions.
Top 10 holdings (% of Equities)
Foreign split
LIFESTAGE PROGRAMMELIFESTAGE PROGRAMMEIFESTAGE PROGRAMMESIM Moderate Absolute Fund
The fund’s objective is to provide long-term absolute (positive) returns to investors. In specific terms, it aims to achieve a return of inflation + 5%, gross of investment management fees over any rolling three -year period and aim for no capital loss over any rolling 12 months. The fund has a low to medium risk profile relative to typical balanced portfolios.
0.70% per annum for the first R100m 0.60% per annum on the portion of assets between R100m – R250m 0.55% per annum on the portion of assets between R250m – R500m 0.50% per annum on the portion of assets between R500m – R1bn 0.45% per annum on the portion of assets above R1bn
Fund objective
Fund performance (%)
Asset class breakdown
Monthly and cumulative returns
Top 10 holdings (% of Equities)
Equity sectoral exposure (%)
Risk profile
5.1%
18.9%
70.9%
5.1%
0.0%
20.0%
40.0%
60.0%
80.0%
100.0%
International Bonds International Cash International Equity InternationalProperty
Fees
Fund objective
This portfolio has a moderate risk profile
60
70
80
90
100
110
120
130
140
-6%
-4%
-2%
0%
2%
4%
6%
May-1
8
Ju
n-1
8
Ju
l-18
Aug
-18
Sep
-18
Oct-
18
No
v-1
8
De
c-1
8
Ja
n-1
9
Feb
-19
Mar-
19
Apr-
19
May-1
9
Cum
ula
tive R
etu
rn
Month
ly R
etu
rn
Fund Fund (Cum)*
17.0%
11.6%
47.8%
1.4%
22.2%
0%
10%
20%
30%
40%
50%
60%
Equities andAlternative
Bonds Cash Property Foreign
All Sub-funds invested in this portfolio are charged the highest investment management fee applicable to the first tranche of assets, and Sub-funds with greater than R100 million assets are separately rebated any savings due to the sliding investment management fee scale on a monthly basis.
Risk analysis(based on the last 3 years' monthly returns)

Period Ending 31-May-19 Benchmark STeFI Index
Fund Size R 1,666 million
Inception Date Jul-01
Risk Profile Fund Benchmark
This fund has a conservative risk profile. 1 Month 0.7%
3 Months 2.0%
Fees 6 Months 4.1%
1 Year 8.2%
0.20% per annum for the first R100m 3 Years 8.3%
0.125% per annum on portion of assets between R100m - R500m 5 Years 7.8%
0.10% per annum on the portion of assets above R500m
No performance Fees
Monthly and cumulative returns
% of negative months over the last 3 years
Average capital loss in one month
Downside risk *
* Downside risk is measured as the standard deviation of the underperformance
of the portfolio relative to CPI
*Based on 1 year returns
Sanlam Plus Pension & Provident Preservation Fund May 2019
0.6%
1.8%
Note: Performance figures are gross of investment management fees, but are net of any performance fees (if applicable). For portfolios in the Smoothed Bonus Range ,the returns are gross of investment management
fees, but are net of any guarantee premiums. Performance figures for periods greater than 12 months are annualised. All data shown is at the month-end, unless specifically indicated differently. Changes in currency
rates of exchange may cause the value of your investment to fluctuate. Past performance is not necessarily a guide to the future returns. The value of investments and the income from them may increase or decrease
and are not guaranteed. You may not get back the amount you invest. The product information sheets are prepared for the SANLAM UMBRELLA FUND by its investment consultants. The product information sheets
are prepared in good faith and the information, data and opinions contained in the product information sheets are based on source information considered reliable. However, no guarantee, explicit or otherwise are
provided that the information and data contained therein are correct and comprehensive. The SANLAM UMBRELLA FUND and the investment consultants cannot be held liable for any loss, expense and/or damage
following from the use of the product information sheets.
3.6%
7.3%
7.4%
7.1%
0.0%
0.0%
0.3%
SANLAM CASH FUND
Fund performance (%)
Risk analysis(based on the last 3 years' monthly returns)
SANLAM CASH FUNDSANLAM CASH FUND
LIFESTAGE PROGRAMMELIFESTAGE PROGRAMMEIFESTAGE PROGRAMMESIM Cash Fund
To provide capital stability and high liquidity that offers competitive returns compared to bank deposits.
60
80
100
120
140
-4%
-2%
0%
2%
4%
May-1
8
Ju
n-1
8
Ju
l-18
Aug
-18
Sep
-18
Oct-
18
No
v-1
8
De
c-1
8
Ja
n-1
9
Feb
-19
Mar-
19
Apr-
19
May-1
9
Cum
ula
tive R
etu
rn
Month
ly R
etu
rn
Fund Fund (Cum)*
Fund objective
All Sub-funds invested in this portfolio are charged the highest investment management fee applicable to the first tranche of assets, and Sub-funds with greater than R100 million assets are separately rebated any savings due to the sliding investment management fee scale on a monthly basis.

Period Ending 31-May-19 Benchmark Alexander Forbes Global Large Manager
Fund Size R 4,192 million Watch Average
Inception Date Jul-10
This fund has a moderate-aggressive risk profile.
Foreign split
Fund
Financials
Resources
Industrials
*Based on 1 year returns
Fund Benchmark ** % of negative months over the last 3 years
1 Month -5.1% -3.4% Average capital loss in one month
3 Months -0.4% 0.7% Downside risk *
6 Months 4.5% 6.3% * Downside risk is measured as the standard deviation of the underperformance
1 Year 1.6% 4.4%
3 Years 3.5% 4.0%
5 Years 7.2% 5.8%
Share Name % of Equities
Naspers 13.6%
British American Tobacco Plc 10.7%
Sasol Limited 6.5%
Glencore Xstrata Plc 5.4%
Standard Bank Group Limited 5.4%
Remgro Limited 5.2%
Investec Plc 3.7%
Old Mutual Limited 3.5%
Woolworths Holdings Limited 3.1%
Newplat (NGPLT) 3.1%
Sanlam Plus Pension & Provident Preservation Fund May 2019
38.9%
24.5%
27.0%
48.5%
-2.2%
5.1%
of the portfolio relative to CPI
** Cumulative monthly benchmark returns
Note: Performance figures are gross of investment management fees, but are net of any performance fees (if applicable). For portfolios in the Smoothed Bonus Range ,the returns are gross of investment management
fees, but are net of any guarantee premiums. Performance figures for periods greater than 12 months are annualised. All data shown is at the month-end, unless specifically indicated differently. Changes in currency rates
of exchange may cause the value of your investment to fluctuate. Past performance is not necessarily a guide to the future returns. The value of investments and the income from them may increase or decrease and are
not guaranteed. You may not get back the amount you invest. The product information sheets are prepared for the SANLAM UMBRELLA FUND by its investment consultants. The product information sheets are prepared
in good faith and the information, data and opinions contained in the product information sheets are based on source information considered reliable. However, no guarantee, explicit or otherwise are provided that the
information and data contained therein are correct and comprehensive. The SANLAM UMBRELLA FUND and the investment consultants cannot be held liable for any loss, expense and/or damage following from the use
of the product information sheets.
Asset class breakdown
Monthly and cumulative returns
Fund performance (%)
Top 10 equity holdings (% of Equities)
Equity sectoral exposure (%)
Risk analysis(based on the last 3 years' monthly returns)
LIFESTAGE PROGRAMMEIFESTAGE PROGRAMMESanlam Allan Gray Global Balanced Portfolio
This Portfolio is for institutional investors with an average risk tolerance. It aims to offer long-term returns superior to the benchmark, but at lower risk of capital loss.
10.9%
26.1%
61.8%
1.2%
0.0%
20.0%
40.0%
60.0%
80.0%
100.0%
International Bond International Cash International Equity InternationalProperty
Risk Profile
49.5%
10.4%8.2%
1.3%
30.6%
0%
10%
20%
30%
40%
50%
60%
Equity Bonds Cash Property Foreign
40
60
80
100
120
140
160
-6%
-4%
-2%
0%
2%
4%
6%
May-1
8
Ju
n-1
8
Ju
l-18
Aug
-18
Sep
-18
Oct-
18
No
v-1
8
De
c-1
8
Ja
n-1
9
Feb
-19
Mar-
19
Apr-
19
May-1
9
Cum
ula
tive R
etu
rn
Month
ly R
etu
rn
Fund Fund (Cum)*
Fund objective
Fees
South African assets 1.25% per annumNo performance fee on South African assets. International assets0.10% per annum of the international assets, after the recovery of the performance related fee. A performance related fee variable between 0.5% and 2.5% per annum of the value of the international assets, with a fee of 1.5% per annum for returns equal to the benchmark
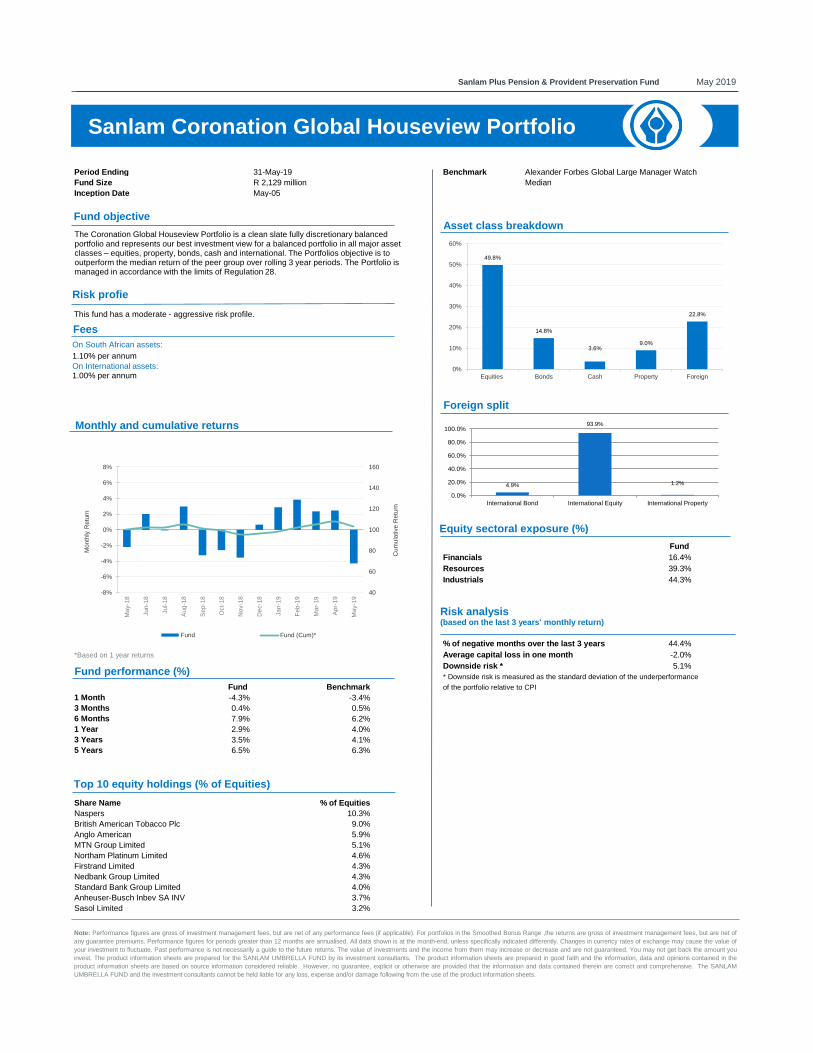
Period Ending 31-May-19 Benchmark Alexander Forbes Global Large Manager Watch
Fund Size R 2,129 million Median
Inception Date May-05
Foreign split
Fund
Financials
Resources
Industrials
% of negative months over the last 3 years
*Based on 1 year returns Average capital loss in one month
Downside risk *
* Downside risk is measured as the standard deviation of the underperformance
Fund Benchmark
1 Month -4.3% -3.4%
3 Months 0.4% 0.5%
6 Months 7.9% 6.2%
1 Year 2.9% 4.0%
3 Years 3.5% 4.1%
5 Years 6.5% 6.3%
Share Name % of Equities
Naspers 10.3%
British American Tobacco Plc 9.0%
Anglo American 5.9%
MTN Group Limited 5.1%
Northam Platinum Limited 4.6%
Firstrand Limited 4.3%
Nedbank Group Limited 4.3%
Standard Bank Group Limited 4.0%
Anheuser-Busch Inbev SA INV 3.7%
Sasol Limited 3.2%
Sanlam Plus Pension & Provident Preservation Fund May 2019
5.1%
of the portfolio relative to CPI
Note: Performance figures are gross of investment management fees, but are net of any performance fees (if applicable). For portfolios in the Smoothed Bonus Range ,the returns are gross of investment management fees, but are net of
any guarantee premiums. Performance figures for periods greater than 12 months are annualised. All data shown is at the month-end, unless specifically indicated differently. Changes in currency rates of exchange may cause the value of
your investment to fluctuate. Past performance is not necessarily a guide to the future returns. The value of investments and the income from them may increase or decrease and are not guaranteed. You may not get back the amount you
invest. The product information sheets are prepared for the SANLAM UMBRELLA FUND by its investment consultants. The product information sheets are prepared in good faith and the information, data and opinions contained in the
product information sheets are based on source information considered reliable. However, no guarantee, explicit or otherwise are provided that the information and data contained therein are correct and comprehensive. The SANLAM
UMBRELLA FUND and the investment consultants cannot be held liable for any loss, expense and/or damage following from the use of the product information sheets.
16.4%
39.3%
44.3%
44.4%
-2.0%
Asset class breakdown
Monthly and cumulative returns
Fund performance (%)
Top 10 equity holdings (% of Equities)
Equity sectoral exposure (%)
Risk analysis(based on the last 3 years' monthly return)
LIFESTAGE PROGRAMMEIFESTAGE PROGRAMMESanlam Coronation Global Houseview Portfolio
The Coronation Global Houseview Portfolio is a clean slate fully discretionary balanced portfolio and represents our best investment view for a balanced portfolio in all major asset classes – equities, property, bonds, cash and international. The Portfolios objective is to outperform the median return of the peer group over rolling 3 year periods. The Portfolio is managed in accordance with the limits of Regulation 28.
4.9%
93.9%
1.2%
0.0%
20.0%
40.0%
60.0%
80.0%
100.0%
International Bond International Equity International Property
Risk profie
Fees
49.8%
14.8%
3.6%9.0%
22.8%
0%
10%
20%
30%
40%
50%
60%
Equities Bonds Cash Property Foreign
40
60
80
100
120
140
160
-8%
-6%
-4%
-2%
0%
2%
4%
6%
8%
May-1
8
Ju
n-1
8
Ju
l-18
Aug
-18
Sep
-18
Oct-
18
No
v-1
8
De
c-1
8
Ja
n-1
9
Feb
-19
Mar-
19
Apr-
19
May-1
9
Cum
ula
tive R
etu
rn
Month
ly R
etu
rn
Fund Fund (Cum)*
On South African assets:
1.10% per annum
On International assets: 1.00% per annum
This fund has a moderate - aggressive risk profile.
Fund objective

Period Ending 31-May-19 Benchmark Average of the SA Multi-Asset High Equity
Fund Size R 341 million Category
Inception Date Apr-12
This fund has a moderate - aggressive risk profile.
Fees
Foreign split
Fund
Financials
Resources
Industrials
*Based on 1 year returns
Fund Benchmark
1 Month -3.9% -4.0% % of negative months over the last 3 years
3 Months -0.2% -0.1% Average capital loss in one month
6 Months 5.7% 4.9% Downside risk *
1 Year 2.4% 1.8% * Downside risk is measured as the standard deviation of the underperformance
3 Years 1.4% 2.2%
*5 Years 5.2% 4.8%
*Returns are illustrative as the Fund has not been invested over that period
Share Name % of Equities
BHP Group 12.3%
Sasol Limited 9.8%
Naspers 9.8%
RMB Holdings Limited 8.8%
New Gold ETF 8.7%
Richemont 8.4%
British American Tobacco Plc 8.3%
Standard Bank Group Limited 6.3%
Aspen Healthcare Holdings 4.5%
Bid Corporation Limited 3.4%
-2.5%
5.8%
of the portfolio relative to CPI
Note: Performance figures are gross of investment management fees, but are net of any performance fees (if applicable). For portfolios in the Smoothed Bonus Range ,the returns are gross of investment management fees, but are net of any
guarantee premiums. Performance figures for periods greater than 12 months are annualised. All data shown is at the month-end, unless specifically indicated differently. Changes in currency rates of exchange may cause the value of your
investment to fluctuate. Past performance is not necessarily a guide to the future returns. The value of investments and the income from them may increase or decrease and are not guaranteed. You may not get back the amount you invest.
The product information sheets are prepared for the SANLAM UMBRELLA FUND by its investment consultants. The product information sheets are prepared in good faith and the information, data and opinions contained in the product
information sheets are based on source information considered reliable. However, no guarantee, explicit or otherwise are provided that the information and data contained therein are correct and comprehensive. The SANLAM UMBRELLA
FUND and the investment consultants cannot be held liable for any loss, expense and/or damage following from the use of the product information sheets.
11.2%
37.0%
51.8%
41.7%
Sanlam Plus Pension & Provident Preservation Fund May 2019
Asset class breakdown
Monthly and cumulative returns
Fund performance (%)
Top 10 equity holdings (% of Equities)
Equity sectoral exposure (%)
Risk analysis(based on the last 3 years' monthly returns)
LIFESTAGE PROGRAMMEIFESTAGE PROGRAMMESanlam Foord Balanced Fund
The fund aims to provide investors with a steady growth in income and capital as well as the preservation of real capital. The portfolio shall comprise a mix of securities in the equity, bond, money and property markets.
Risk profile
South African assets: 0.70% per annumInternational assets: 1.35% per annum
Performance fee of 10% (excluding VAT) of the outperformance of its benchmark calculated over a rolling 12 month period.The performance fee is accrued daily and paid monthly. There is no cap on performance fee. A high water mark applies.
40
60
80
100
120
140
160
-8%
-6%
-4%
-2%
0%
2%
4%
6%
8%
May-1
8
Ju
n-1
8
Ju
l-18
Aug
-18
Sep
-18
Oct-
18
No
v-1
8
De
c-1
8
Ja
n-1
9
Feb
-19
Mar-
19
Apr-
19
May-1
9
Cu
mula
tive R
etu
rn
Month
ly R
etu
rn
Fund Fund (Cum)*
38.6%
17.4%
6.4%4.5%
33.1%
0.0%
5.0%
10.0%
15.0%
20.0%
25.0%
30.0%
35.0%
40.0%
45.0%
Equities Bonds Cash Property Foreign
2.9%7.0%
89.5%
0.6%
0.0%
20.0%
40.0%
60.0%
80.0%
100.0%
International Bonds International Cash International Equity InternationalProperty
Fund objective

Period Ending 31-May-19 Benchmark Alexander Forbes Global Best Investment View
Inception Date Jan-97 Median
Foreign split
Fund
Financials
Resources
*Based on 1 year returns Industrials
Fund Benchmark
1 Month -3.3% -3.3%
3 Months -0.1% 1.0% % of negative months over the last 3 years
6 Months 6.8% 6.8% Average capital loss in one month
1 Year 4.2% 4.8% Downside risk *
3 Years 4.6% 4.4% * Downside risk is measured as the standard deviation of the underperformance
5 Years* 8.1% 6.4%
* Returns are off the FFS as the fund has not been invested for that period
Share Name % of Equities
Anglo American 9.4%
BHP Group 8.6%
Naspers 6.9%
Standard Bank Group Limited 6.5%
Sasol Limited 6.4%
Anheuser-Busch Inbev SA INV 5.2%
Firstrand Limited 5.1%
ABSA Group Limited 5.0%
British American Tobacco Plc 4.7%
MTN Group Limited 4.6%
38.9%
-2.1%
4.7%
of the portfolio relative to CPI
Note: Performance figures are gross of investment management fees, but are net of any performance fees (if applicable). For portfolios in the Smoothed Bonus Range ,the returns are gross of investment management
fees, but are net of any guarantee premiums. Performance figures for periods greater than 12 months are annualised. All data shown is at the month-end, unless specifically indicated differently. Changes in currency rates
of exchange may cause the value of your investment to fluctuate. Past performance is not necessarily a guide to the future returns. The value of investments and the income from them may increase or decrease and are
not guaranteed. You may not get back the amount you invest. The product information sheets are prepared for the SANLAM UMBRELLA FUND by its investment consultants. The product information sheets are prepared
in good faith and the information, data and opinions contained in the product information sheets are based on source information considered reliable. However, no guarantee, explicit or otherwise are provided that the
information and data contained therein are correct and comprehensive. The SANLAM UMBRELLA FUND and the investment consultants cannot be held liable for any loss, expense and/or damage following from the use
of the product information sheets.
38.1%
9.7%
52.2%
Sanlam Plus Pension & Provident Preservation Fund May 2019
Asset class breakdown
Monthly and cumulative returns
Fund performance (%)
Equity sectoral exposure (%)
Risk analysis(based on the last 3 years' monthly returns)
Top 10 equity holdings (% of Equities)
LIFESTAGE PROGRAMMEIFESTAGE PROGRAMMESanlam Investec Balanced Fund
The primary objective is to deliver capital growth over the medium to long term at volatility levels that reflect a moderate risk profile. The portfolio will invest in a combination of equities, bonds, money market instruments, listed property as well as international equities and fixed interest investments. The portfolio will be broadly diversified across asset classes. Active asset allocation and securities selection strategies appropriate to the needs of moderate investors will be followed.
24.7%
74.8%
0.5%
0.0%
20.0%
40.0%
60.0%
80.0%
100.0%
120.0%
International Cash International Equity International Property
Riks profile
Fees
South African assets: 0.90% per annumInternational assets: 0.60% per annum
40
60
80
100
120
140
160
-10%
-8%
-6%
-4%
-2%
0%
2%
4%
6%
8%
10%
May-1
8
Ju
n-1
8
Ju
l-18
Aug
-18
Sep
-18
Oct-
18
No
v-1
8
De
c-1
8
Ja
n-1
9
Feb
-19
Mar-
19
Apr-
19
May-1
9
Cum
ula
tive R
etu
rn
Month
ly R
etu
rn
Fund Fund (Cum)*
46.8%
17.5%
2.7% 4.3%
28.7%
0%
5%
10%
15%
20%
25%
30%
35%
40%
45%
50%
Equities Bonds Cash Property Foreign
This fund has a moderate-aggressive risk profile.
Fund objective

Period Ending 31-May-19 Benchmark 49.0% Capped SWIX (Shareholder Weighted Index)
Fund Size R 1,964 million 8.0% Sapy Property Index
Inception Date Sep-08 10.0% ALBI (BEASSA All Bond Index)
2.0% STeFI
21.0% MSCI (Developed Markets) World Index
4.0% Barclays Global Aggregate Index
6.0% S&P South Africa Sovereign ILB 1+Y Index
Foreign split
Fund Benchmark
Financials 35.6%
*Based on 1 year returns Resources 19.4%
Industrials 45.0%
Fund Benchmark
1 Month -3.3% -3.2%
3 Months 1.0% 1.1%
6 Months 6.6% 6.4%
1 Year 5.0% 4.8%
3 Year 4.3% 4.1%
5 Year 7.4% 7.4%
Share Name % of Equities
Naspers N 9.2%
FirstRand / RMBH 4.8%
Growpnt 4.4%
Stanbank 4.4%
Sasol 3.6%
MTN Group 3.2%
Redefine Properties 3.2%
Anglos 3.2%
NEPIROCK (NEP) 2.7%
Sanlam 2.3%
% of negative months over the last 3 years
Average capital loss in one month
Downside risk *
* Downside risk is measured as the standard deviation of the underperformance
19.4%
45.0%
Note: Performance figures are gross of investment management fees, but are net of any performance fees (if applicable). For portfolios in the Smoothed Bonus Range ,the returns are gross of investment management fees, but are
net of any guarantee premiums. Performance figures for periods greater than 12 months are annualised. All data shown is at the month-end, unless specifically indicated differently. Changes in currency rates of exchange may cause
the value of your investment to fluctuate. Past performance is not necessarily a guide to the future returns. The value of investments and the income from them may increase or decrease and are not guaranteed. You may not get
back the amount you invest. The product information sheets are prepared for the SANLAM UMBRELLA FUND by its investment consultants. The product information sheets are prepared in good faith and the information, data and
opinions contained in the product information sheets are based on source information considered reliable. However, no guarantee, explicit or otherwise are provided that the information and data contained therein are correct and
comprehensive. The SANLAM UMBRELLA FUND and the investment consultants cannot be held liable for any loss, expense and/or damage following from the use of the product information sheets.
35.6%
44.4%
-1.7%
4.2%
of the portfolio relative to CPI
Sanlam Plus Pension & Provident Preservation Fund May 2019
Asset class breakdown
Monthly and cumulative returns
Fund performance (%)
Top 10 equity holdings (% of Equities)
Equity sectoral exposure (%)
Fund manager breakdown
LIFESTAGE PROGRAMMELIFESTAGE PROGRAMMEIFESTAGE PROGRAMMESatrix Enhanced Balanced Tracker Fund
0.3%
79.1%
8.4% 12.2%
0.0%
20.0%
40.0%
60.0%
80.0%
100.0%
International Cash Sanlam World EquityTracker I
Sanlam EmergingMarket Equity
Tracker
iShares GlobalAggregate Bond ETF
60
80
100
120
140
-6%
-4%
-2%
0%
2%
4%
6%
May-1
8
Ju
n-1
8
Ju
l-18
Aug
-18
Sep
-18
Oct-
18
No
v-1
8
De
c-1
8
Ja
n-1
9
Feb
-19
Mar-
19
Apr-
19
May-1
9
Cum
ula
tive R
etu
rn
Month
ly R
etu
rn
Fund Fund (Cum)*
49.1%
16.7%
2.1%
8.3%
23.8%
0%
10%
20%
30%
40%
50%
60%
Equities Bonds Cash Property Foreign
Fund objective
Risk profile
Fees
South African assets:0.36% per annumThe domestic equity component tracks the Capped SWIX Index. Script lending is permitted in respect of this basket of shares, and the resultant income (net of associated costs) is periodically rebated to clients participating in this portfolio, and effectively serves to reduce the quoted management fee.
The portfolio invests in tracker equity and bond indices, locally and abroad, and also cash to create a moderate risk balanced portfolio which is expected to perform close to the underlying indices without incurring active management costs. Scrip lending may be performed on the passive equity component.
This fund has a moderate-aggressive risk profile.
Sanlam Cash, 2.1%
Satrix Bond C (D), 16.7%
iShares Global Aggregate Bond
ETF, 2.9%
Sanlam Emerging
Market Equity Tracker, 2.0%Local Equity,
49.1%
Local Property, 8.3%
International Cash, 0.1%
Sanlam World Equity Tracker I,
18.8%
Risk analysis(based on the last 3 years' monthly returns)

Period Ending 31-May-19 Benchmark 16.0% SWIX (Shareholder Weighted Index)
Fund Size (Book Value) R7 127million 16.0% Capped SWIX (Shareholder Weighted Index)
Inception Date Jul-99 25.5% BEASSA Total Return All Bond Index
1.0% STeFI + 2%
Fund objective 2.0% IGOVI
17.5% MSCI World Index (Dev. Markets)
5.0% Barclays Global Aggregate Index
2.5% US 3 month London InterBank Offered Rate (LIBOR)
+2.5% (net of fees)
8.0% STeFI Index
6.5% BEASSA 7-12 years TRI plus 1.0% p.a.
Risk Profile
Fees
Foreign split
*Based on 1 year returns
Fund
Financials
Fund (gross of fees) Resources
1 Month 0.7% Industrials
3 Months 1.7%
6 Months 2.8%
1 Year 6.4%
3 Years 7.3%
5 Years 9.3%
% of negative months over the last 3 years
Average capital loss in one month
Downside risk *
* Downside risk is measured as the standard deviation of the underperformance
17.3%
5.2%
4.9%
4.0%
4.0%
3.7% June 2019: 97.41% funded
3.5%
2.7%
2.7%
2.2%OMutual (OMU)
Note: Performance figures are gross of investment management fees, but are net of any performance fees (if applicable). For portfolios in the Smoothed Bonus Range ,the returns are gross of investment management fees,
but are net of any guarantee premiums. Performance figures for periods greater than 12 months are annualised. All data shown is at the month-end, unless specifically indicated differently. Changes in currency rates of
exchange may cause the value of your investment to fluctuate. Past performance is not necessarily a guide to the future returns. The value of investments and the income from them may increase or decrease and are not
guaranteed. You may not get back the amount you invest. The product information sheets are prepared for the SANLAM UMBRELLA FUND by its investment consultants. The product information sheets are prepared in good
faith and the information, data and opinions contained in the product information sheets are based on source information considered reliable. However, no guarantee, explicit or otherwise are provided that the information and
data contained therein are correct and comprehensive. The SANLAM UMBRELLA FUND and the investment consultants cannot be held liable for any loss, expense and/or damage following from the use of the product
information sheets.
MTN Group
ABSAG ABG
Consol Holdings
British American Tobacco
Sasol
Anglos
Stanbank
Naspers N
Share Name % of Equities
FirstRand / RMBH
0.4%
of the portfolio relative to CPI
The Monthly Bonus Fund (MBF) protects investors against short-term volatility by smoothing
out investment returns, whilst providing valuable guarantees on benefit payments. The
underlying portfolio is mandated with more weight to less risky asset classes than a typical
balanced fund. The Sanlam Monthly Bonus Fund offers 100% capital guarantee and fully
vesting bonuses. Fully vesting bonuses are declared monthly in advance.
0.0%
0.0%
Sanlam Plus Pension & Provident Preservation Fund May 2019
61.8%
24.1%
14.1%
Asset class breakdown
Monthly and cumulative bonuses
Fund bonuses (%)
Top 10 equity holdings (% of Equities)
Equity sectoral exposure (%)
Risk analysis(based on the last 3 years' monthly returns)
LIFESTAGE PROGRAMMELIFESTAGE PROGRAMMEIFESTAGE PROGRAMMESanlam Monthly Bonus Fund
57.4%
42.6%
0.0%
20.0%
40.0%
60.0%
80.0%
100.0%
International Equity International Other
60
80
100
120
140
-4%
-2%
0%
2%
4%
May-1
8
Ju
n-1
8
Ju
l-18
Aug
-18
Sep
-18
Oct-
18
No
v-1
8
De
c-1
8
Ja
n-1
9
Feb
-19
Mar-
19
Apr-
19
May-1
9
Cum
ula
tive R
etu
rn
Month
ly R
etu
rn
Fund Fund (Cum)*
32.7%
24.2%
5.7%
2.4%
7.3%
27.7%
0%
5%
10%
15%
20%
25%
30%
35%
Equities Bonds Credit Cash Property Foreign
This fund has a conservative risk profile.
Investment Management Fees:0.425% per annumGuarantee Premium:A guarantee premium of 1.6% per annum Annual Performance Linked Fee:The investment manager may be incentivised with performance fees(capped at 0.30% p.a.)
Funding level

Period Ending 31-May-19 Benchmark 16.0% SWIX (Shareholder Weighted Index)
Fund Size (Book Value) R8 800m million 16.0% Capped SWIX (Shareholder Weighted Index)
Inception Date Nov-86 25.5% BEASSA Total Return All Bond Index
1.0% STeFI + 2%
2.0% IGOVI
17.5% MSCI World Index (Dev. Markets)
5.0% Barclays Global Aggregate Index
2.5% US 3 month London InterBank Offered Rate
(LIBOR) +2.5% (net of fees)
8.0% STeFI Index
6.5% BEASSA 7-12 years TRI plus 1.0% p.a.
Conservative
Foreign Split
Fund
*Based on 1 year returns Financials
Resources
Industrials
Fund (gross of fees)
1 Month 0.7%
3 Months 1.9% Fund
6 Months 3.1% % of negative months over the last 3 years 0.0%
1 Year 7.1% Average capital loss in one month 0.0%
3 Years 7.9% Downside risk * 0.4%
5 Years 9.6% * Downside risk is measured as the standard deviation of the underperformance
of the portfolio relative to CPI
The Non - Vested bonuses as a proportion of the total Sanlam Stable Bonus Portfolio
holdings:
17.3% Sanlam Umbrella Pension Fund12.40%
5.2% Sanlam Umbrella Provident Fund10.89%
4.9%
4.0% * Only impacts Sanlam Lifestage members opting for this preservation strategy in the last
4.0% 6 years before retirement.
3.7%
3.5%
2.7%
2.7%
2.2%
Sanlam Plus Pension & Provident Preservation Fund May 2019
24.1%
14.1%
61.8%
Share Name % of Equities
Naspers N
FirstRand / RMBH
Stanbank
British American Tobacco
Sasol
Anglos
OMutual (OMU)
Note: Performance figures are gross of investment management fees, but are net of any performance fees (if applicable). For portfolios in the Smoothed Bonus Range ,the returns are gross of investment management fees, but are
net of any guarantee premiums. Performance figures for periods greater than 12 months are annualised. All data shown is at the month-end, unless specifically indicated differently. Changes in currency rates of exchange may
cause the value of your investment to fluctuate. Past performance is not necessarily a guide to the future returns. The value of investments and the income from them may increase or decrease and are not guaranteed. You may
not get back the amount you invest. The product information sheets are prepared for the SANLAM UMBRELLA FUND by its investment consultants. The product information sheets are prepared in good faith and the information,
data and opinions contained in the product information sheets are based on source information considered reliable. However, no guarantee, explicit or otherwise are provided that the information and data contained therein are
correct and comprehensive. The SANLAM UMBRELLA FUND and the investment consultants cannot be held liable for any loss, expense and/or damage following from the use of the product information sheets.
MTN Group
ABSAG ABG
Consol Holdings June 2019: 97.35% funded
Monthly and cumulative bonuses
Fund bonuses (%)
Top 10 equity holdings (% of Equities)
Asset class breakdown
Equity sectoral exposure (%)
Risk analysis(based on the last 3 years' monthly returns)
LIFESTAGE PROGRAMMEIFESTAGE PROGRAMMESanlam Stable Bonus Portfolio
The Stable Bonus Portfolio (SBP) offers investors stable, smoothed returns with a partial guarantee on benefit payments. A bonus, which consists of a vesting and non-vesting component is declared monthly in advance. Bonuses cannot be negative. The portfolio offers 100% capital guarantee and partially vesting bonuses
57.2%
42.8%
0.0%
20.0%
40.0%
60.0%
80.0%
100.0%
International Equity International Other
Fees
Risk profile
Fund objective
40
60
80
100
120
140
160
-4%
-2%
0%
2%
4%
May-1
8
Ju
n-1
8
Ju
l-18
Aug
-18
Sep
-18
Oct-
18
No
v-1
8
De
c-1
8
Ja
n-1
9
Feb
-19
Mar-
19
Apr-
19
May-1
9
Cum
ula
tive R
etu
rn
Month
ly R
etu
rn
Fund Fund (Cum)*
32.6%
24.2%
5.7%
2.7%
7.2%
27.6%
0%
5%
10%
15%
20%
25%
30%
35%
Equities Bonds Credit Cash Property Foreign
Investment Management Fees:0.425% per annum
Guarantee Premium:A guarantee premium of 0.9% per annum
Annual Performance Linked Fee:The investment manager may be incentivised with performance fees(capped at 0.30% p.a.)
Funding Level

Lifestage
Accumulation
SMM 70
Portfolio
SMM 50
PortoflioSMM 30 Portfolio
ILLA
Preservation
Domestic Equity
Core Equity
Fairtree Equity 1.8% 3.4% 2.5% 1.4% 1.3%
Truffe Equity 1.9% 3.7% 2.7% 1.5% 1.4%
ABAX Eqity 1.8% 3.5% 2.5% 1.4% 1.3%
Coronation Equity 2.3% 4.5% 3.2% 1.8% 1.7%
Sentio Equity 1.4% 2.7% 1.9% 1.1% 1.0%
Quality Equity
First Avenue 1.7% 3.6% 2.5% 1.4% 1.1%
Steyn Equity 1.0% 2.1% 1.5% 0.8% 0.7%
Bataleur Equity 1.2% 2.6% 1.9% 1.1% 0.8%
Satrix Quality Index 1.0% 2.1% 1.5% 0.9% 0.7%
Momentum Equity
Kaizen Thematic Equity 0.9% 1.9% 1.3% 0.7% 0.7%
Satrix Momentum 2.5% 5.0% 3.5% 2.0% 1.8%
Capricorn Equity 0.0% 0.0% 0.0% 0.0% 0.0%
Value Equity
ABSA Select Equity 1.1% 2.2% 1.6% 0.9% 0.8%
Investec Value 1.0% 2.0% 1.4% 0.8% 0.7%
SIM General Equity 1.6% 3.1% 2.2% 1.3% 1.1%
Satrix Stable Dividend 1.2% 2.4% 1.7% 1.0% 0.9%
Total 22.5% 44.7% 31.9% 18.2% 15.9%
Sanlam Plus Pension & Provident Preservation Fund May 2019
Note: Performance figures are gross of investment management fees, but are net of any performance fees (if applicable). For portfolios in the Smoothed Bonus Range
,the returns are gross of investment management fees, but are net of any guarantee premiums. Performance figures for periods greater than 12 months are
annualised. All data shown is at the month-end, unless specifically indicated differently. Changes in currency rates of exchange may cause the value of your
investment to fluctuate. Past performance is not necessarily a guide to the future returns. The value of investments and the income from them may increase or
decrease and are not guaranteed. You may not get back the amount you invest. The product information sheets are prepared for the SANLAM UMBRELLA FUND by
its investment consultants. The product information sheets are prepared in good faith and the information, data and opinions contained in the product information
sheets are based on source information considered reliable. However, no guarantee, explicit or otherwise are provided that the information and data contained therein
are correct and comprehensive. The SANLAM UMBRELLA FUND and the investment consultants cannot be held liable for any loss, expense and/or damage following
from the use of the product information sheets.
LIFESTAGE PROGRAMMELIFESTAGE PROGRAMMEIFESTAGE PROGRAMME
Local equity manager breakdown for SMMI portfolios


