24
Santa Ana Unified School District 2011 CST Enter School Name Version: Intermediate
| Date post: | 14-Dec-2015 |
| Category: |
Documents |
| Upload: | sabina-west |
| View: | 213 times |
| Download: | 0 times |

Santa Ana Unified School District
2011 CST
Enter School Name
Version: Intermediate
Presentation GoalsPresentation Goals
SAUSD CST Highlights and Data Mat
Our School’s CST ResultsAYP and APINext StepsHelpful Reports on
DataDirector to View STAR Results

Reflecting on last year . . . Reflecting on last year . . .
In departments, What were your goals last year for
the CST?What did you do to achieve those
goals?

CST ScoresCST Scores2011 CST Results

Q: Q: HowHow are the CST results are the CST results reported to schools and reported to schools and
teachers?teachers? Site administrators and staff
receive CST results of:◦Individual students◦Classes◦Grade levels◦Schools◦District◦County◦And, overall state performance

SAUSD Data MatsSAUSD Data Mats
Work with a partner to examine the Data Mat . . .
What do you notice within your subject area/s and grades? What do you notice about other subject areas?
What patterns do you notice overall from elementary through high school in the various subject areas?

Santa Ana HighlightsSanta Ana HighlightsEnglish–Language Arts We had more than 900 additional students score proficient and advanced from
2009 to 2011 in English Language Arts; a 5.9% overall increase from 2009. Overall growth in the percent proficient and advanced in English Language Arts
increased from 2% to 5% in Grades 2-5, 7-8, and 10-11 from the prior year. Percent proficient and advanced increased 5% in English Language Arts in
Grades 3 and 7 from the prior year.
Mathematics In Mathematics, we had more than 1,800 additional students score proficient
and advanced from 2009 to 2011; a 8.5% overall increase from 2009. Grade 4 exceeded the 2011 NCLB Target (68.5%) in Mathematics for 2011. Overall growth in the percent proficient and advanced in Mathematics
increased from 2% to 8% in Grades 2-7 from the prior year. Increased percent proficient and advanced in Algebra I (Grades 10-11),
Geometry (Grade 10), and Algebra II (Grade 11) from the prior year. There was an increase of approximately 250 students in Grade 10 Algebra II
while maintaining the same percent proficient and advanced from the prior year.

Santa Ana Highlights Santa Ana Highlights (cont.)(cont.)
History-Social ScienceThere was an increase in the percent proficient and
advanced in History-Social Science; furthermore, there is a general trend of yearly increases since 2007 in Grade 8, 10, and 11.
Science The number of students scoring proficient and advanced
in Grade 5 Science increased by 3% from the prior year. Overall growth in the percent proficient and advanced in
Biology (Grades 10-11) increased from 2% to 4% from the prior year.
There was a 3% increase in Grade 10 Chemistry and a 6% increase in Grade 11 Physics in percent proficient and advanced from the prior year.
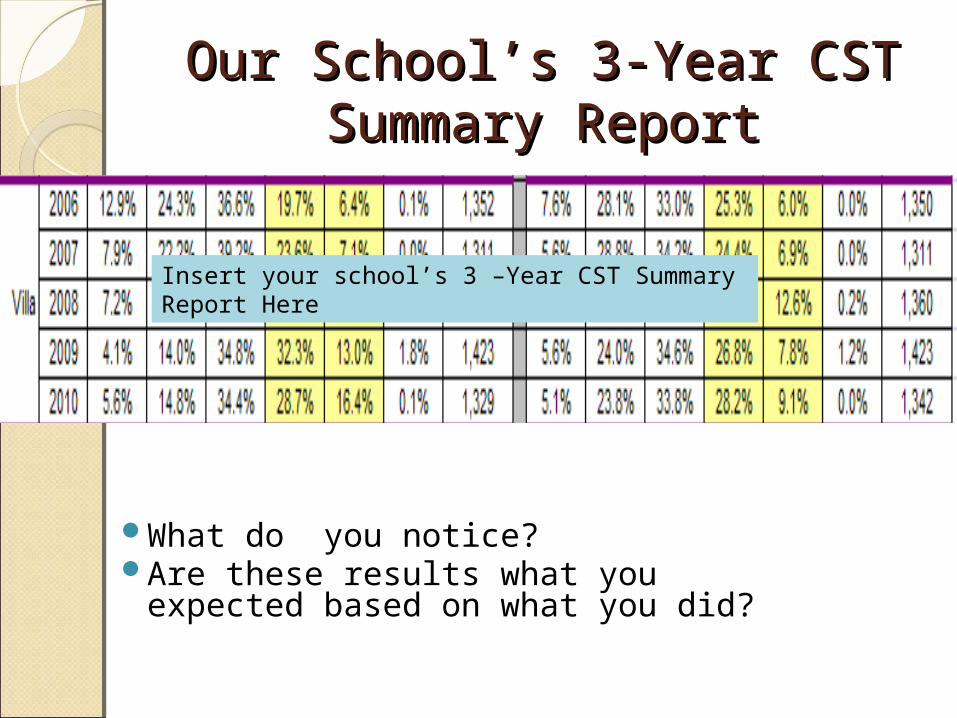
Our School’s 3-Year CST Our School’s 3-Year CST Summary ReportSummary Report
What do you notice?Are these results what you expected
based on what you did?
Insert your school’s 3 –Year CST Summary Report Here

Now, let’s go deeper . . . Now, let’s go deeper . . .
Look at your subject and grade reports based on the 2009-2010 and 2010-2011 CSTs
Look within subject and also look outside your subject areaWhat do you notice?What questions might you have?

Next Steps:Next Steps:
Think about what you discussed and your feedback from your colleagues
Recommendation:Discuss within your dept. and with your administrator to determine your goals for this year

State and Federal State and Federal Accountability systemsAccountability systems
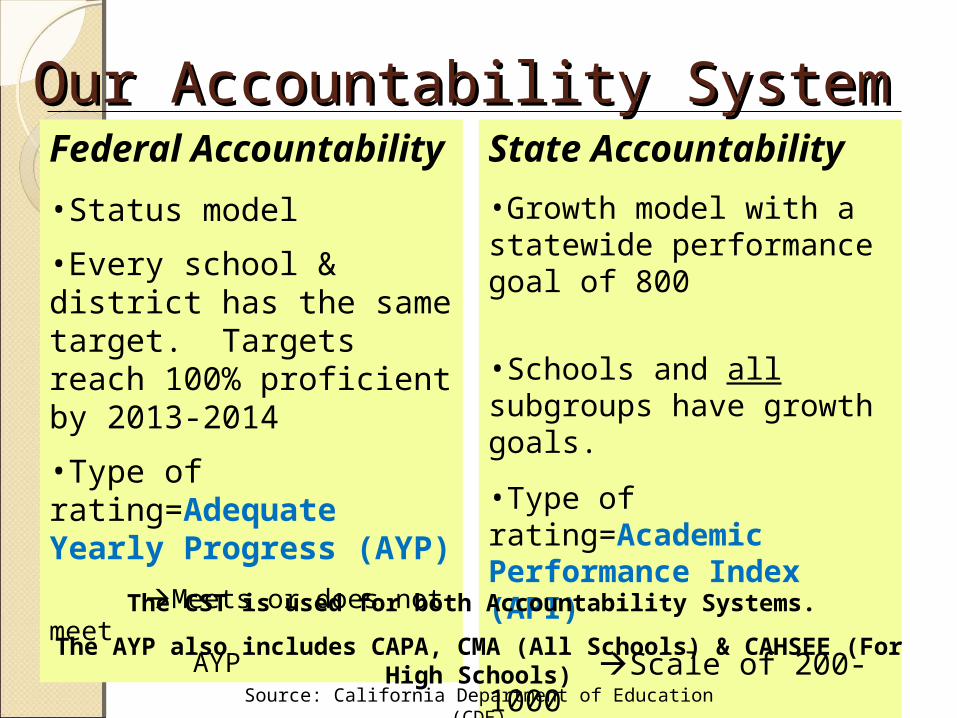
Our Accountability System Our Accountability System Federal Accountability
•Status model
•Every school & district has the same target. Targets reach 100% proficient by 2013-2014
•Type of rating=Adequate Yearly Progress (AYP)
Meets or does not meet AYP
State Accountability
•Growth model with a statewide performance goal of 800
•Schools and all subgroups have growth goals.
•Type of rating=Academic Performance Index (API)
Scale of 200-1000
Source: California Department of Education (CDE)
The CST is used for both Accountability Systems.
The AYP also includes CAPA, CMA (All Schools) & CAHSEE (For High Schools)
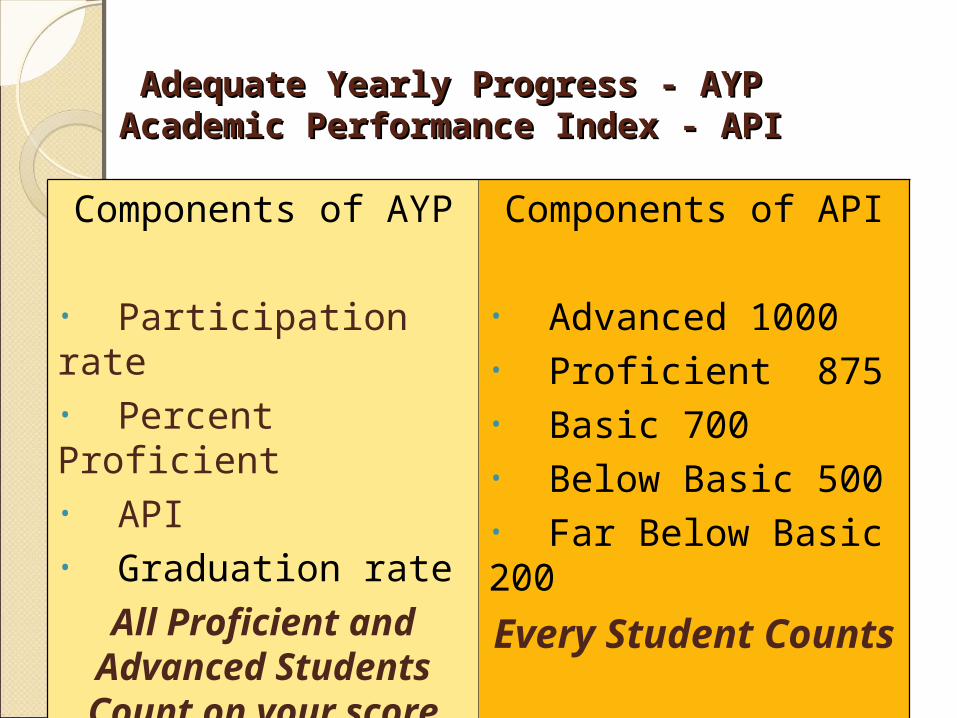
Adequate Yearly Progress - AYPAdequate Yearly Progress - AYPAcademic Performance Index - APIAcademic Performance Index - API
Components of AYP
• Participation rate• Percent Proficient• API• Graduation rate
All Proficient and Advanced Students Count on your score
Components of API
• Advanced 1000• Proficient 875• Basic 700• Below Basic 500• Far Below Basic 200
Every Student Counts
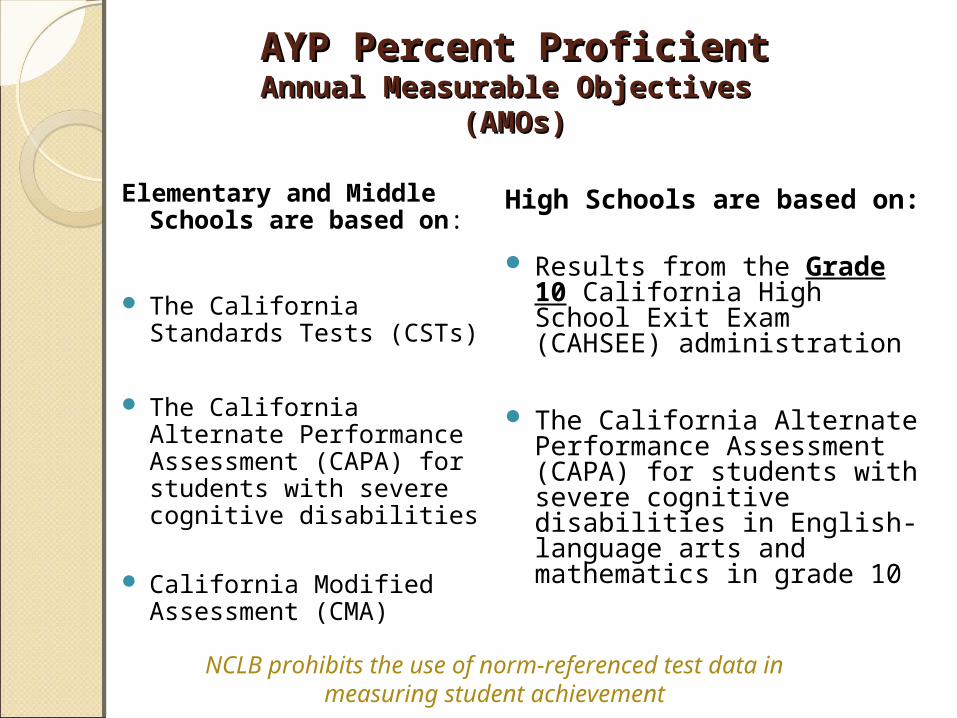
AYP Percent ProficientAYP Percent ProficientAnnual Measurable Objectives Annual Measurable Objectives
(AMOs)(AMOs)
Elementary and Middle Schools are based on:
The California Standards Tests (CSTs)
The California Alternate Performance Assessment (CAPA) for students with severe cognitive disabilities
California Modified Assessment (CMA)
High Schools are based on:
Results from the Grade 10 California High School Exit Exam (CAHSEE) administration
The California Alternate Performance Assessment (CAPA) for students with severe cognitive disabilities in English-language arts and mathematics in grade 10
NCLB prohibits the use of norm-referenced test data in measuring student achievement
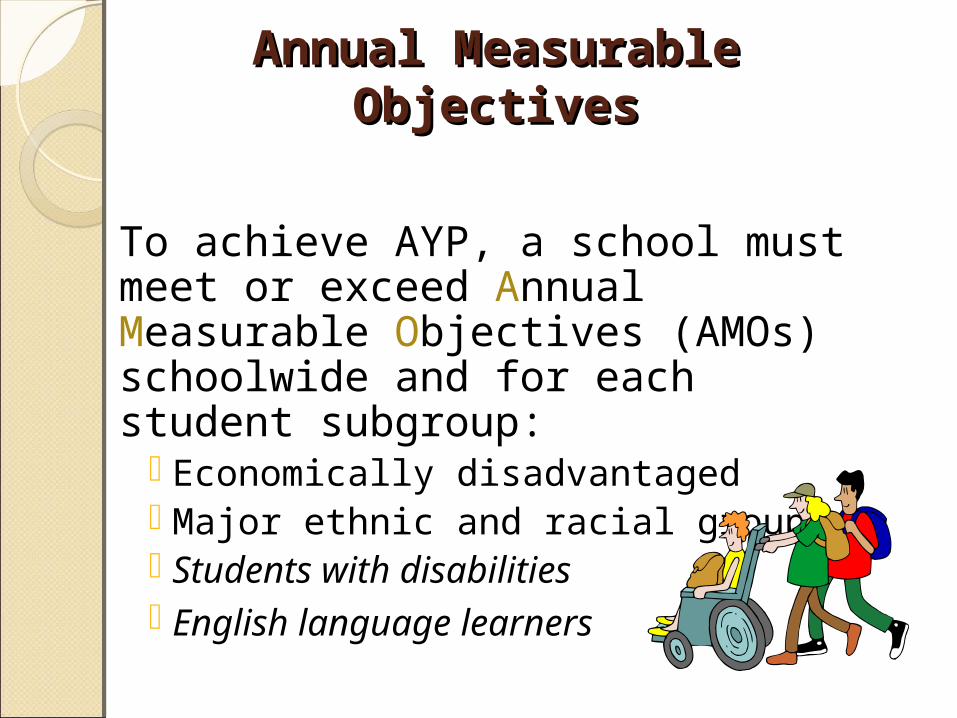
Annual Measurable Annual Measurable ObjectivesObjectives
To achieve AYP, a school must meet or exceed Annual Measurable Objectives (AMOs) schoolwide and for each student subgroup:
Economically disadvantaged Major ethnic and racial groups Students with disabilities English language learners

AMOs: English language artsAMOs: English language artsElementary and Middle SchoolsElementary and Middle Schools
89.2%
24.4%13.6%
67.6%56.8%
46.0%35.2%
78.4%
100.0%
0%
10%
20%
30%
40%
50%
60%
70%
80%
90%
100%
2001-2002
2002-2003
2003-2004
2004-2005
2005-2006
2006-2007
2007-2008
2008-2009
2009-2010
2010-2011
2011-2012
2012-2013
2013-2014

AMOs: MathAMOs: MathElementary / Middle SchoolsElementary / Middle Schools
37.0%47.5%
58.0%68.5%
79.0%89.5%
26.5%16.0%
100.0%
0%
10%
20%
30%
40%
50%
60%
70%
80%
90%
100%
2001-2002
2002-2003
2003-2004
2004-2005
2005-2006
2006-2007
2007-2008
2008-2009
2009-2010
2010-2011
2011-2012
2012-2013
2013-2014
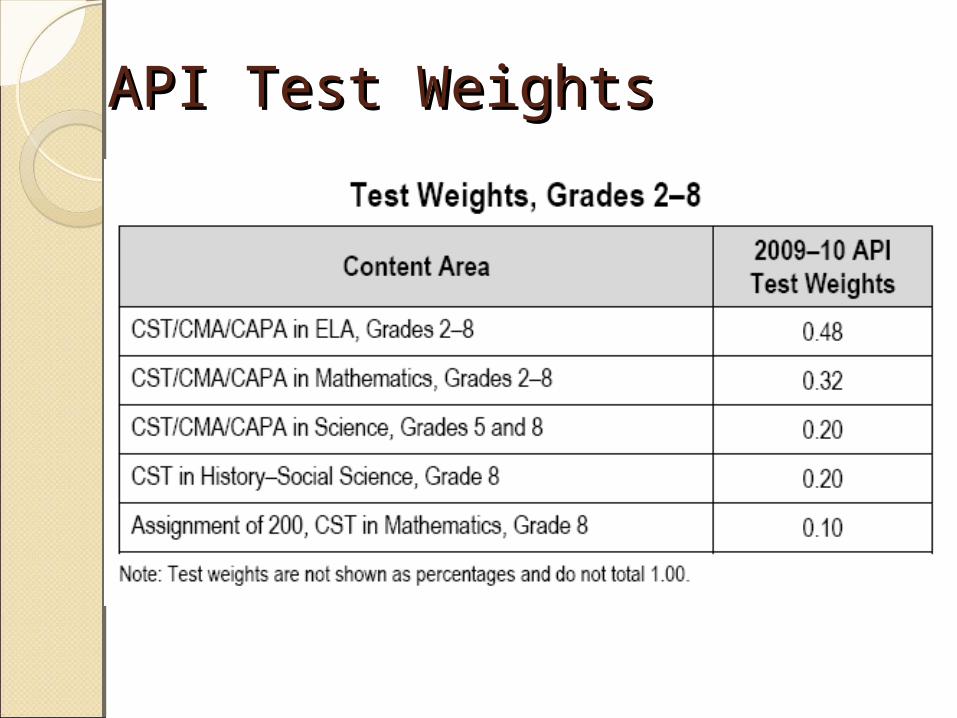
API Test WeightsAPI Test Weights

You may want to insert your KDS API and AYP Reports here. If you are unable to locate them, please contact SAUSD Dept. of Research and Evaluation

DataDirector: What’s DataDirector: What’s NewNew


Suggested Pre-Built Reports for Suggested Pre-Built Reports for Viewing STAR Results on DataDirectorViewing STAR Results on DataDirector
Report Name:
What is it? What does it include?
Notes:
CST Scaled Scores
Easy to read snapshot of individual student performance on a CST as they relate to the performance band.
•Identifies students who are on the margins of advancing or falling-back a proficiency level•Filters and identifies students by performance level or scaled score, e..g. I only want to view students who were on the “bubble,” 340 and above on the CST ELA for grade 9.
CST Cluster Scores
Identifies performance for individual students, teachers, district and state on each of the strands tested on the CST.
•Provides pie charts and bar graphs on classroom averages, school averages, district averages as well as performance level distributions. Important: Remember to use the Summary Options menu . Click on the“Include Teacher Summary” option to view the pie charts.
Pivot Table
CST or CELDT student performance comparison over a 2 year period. Creates pivot tables that identify “sliders, gainers, stickers.”
See next slide
CST Percent Proficient Trend Analysis
Multi-tiered analysis of students proficient on the CST. Includes bar graphs and charts of students’ performance over time. Includes disaggregated subgroup performance.
Compare growth trends in number of students proficient or at the varying proficiency levels for multiple years.
Select “Cohort Report” to see only students who took any of the selected assessments. Select “Limited Cohort Report” for students who took all selected assessments. The “Year to Year Comparison” compares students and their test results from one academic year to another.
Contact InformationContact Information
Santa Ana Unified School DistrictDepartment of Research and
Evaluation(714) 558-5850 Phone
(714) 558-5573 Fax


