95
i June 2019 SANTA FE RIVER AND SPRINGS ENVIRONMENTAL ANALYSIS Phase 2: Quarterly Report #5: Environmental Data Naked Under the Stars Naked Springs Photo by John Moran and David Moynahan
i
June 2019
SANTA FE RIVER AND SPRINGS ENVIRONMENTAL ANALYSIS
Phase 2: Quarterly Report #5: Environmental Data
Naked Under the Stars Naked Springs
Photo by John Moran and David Moynahan

ii
Santa Fe River and Springs Environmental Analysis
Phase 2 – Quarterly Report #5: Environmental Data
Prepared for
Santa Fe River and Springs Scientific Working Group
Date
December 2019
Prepared by
The Howard T. Odum Florida Springs Institute

i
Table of Contents Figures ..................................................................................................................................................... iii
Tables ....................................................................................................................................................... iv
Section 1.0 Introduction .................................... 1
Section 2.0 Methods.......................................... 4
2.1 Introduction ......................................................................................................................................... 4
2.2 Physical Environment ......................................................................................................................... 9
2.2.1 Underwater Light Transmission .................................................................................................. 9
2.2.2 Water Quality ............................................................................................................................. 10
2.2.3 Secchi Disk Visibility ................................................................................................................ 10
2.2.4 Stream Discharge ....................................................................................................................... 10
2.3 Biology .............................................................................................................................................. 11
2.3.1 Fish............................................................................................................................................. 11
2.3.2 Plant Community Characterization ............................................................................................ 11
2.3.3 Human Use ................................................................................................................................ 12
Section 3.0 Results .......................................... 15
3.1 Physical Environment ............................... 15
3.1.1 Underwater Light Transmission..................................................................................................... 15
3.1.9 Water Clarity .................................................................................................................................. 15
3.1.2 Water Quality ................................................................................................................................. 15
3.1.3 Dissolved Oxygen .......................................................................................................................... 15
3.1.4 pH ................................................................................................................................................... 16
3.1.5 Specific Conductance ..................................................................................................................... 16
3.1.6 Water Temperature ........................................................................................................................ 16
3.1.7 Discharge ....................................................................................................................................... 16
3.1.9 Flow and Nitrate Period of Record ................................................................................................ 27
3.1.8 Detailed Water Chemistry .............................................................................................................. 30
3.2 Biology ...................................................... 31
3.2.1 Fish ................................................................................................................................................. 31

ii
3.2.2 Vegetation ...................................................................................................................................... 33
3.2.3 Human Use..................................................................................................................................... 37
References ....................................................... 50
Appendix A ..................................................... 51
Detailed Water Chemistry ....................................................................................................................... 51
Appendix B ..................................................... 77
Quarters 1-5 Fish Data ............................................................................................................................ 77
Appendix C ..................................................... 83
Quarter 5 Data ......................................................................................................................................... 83

iii
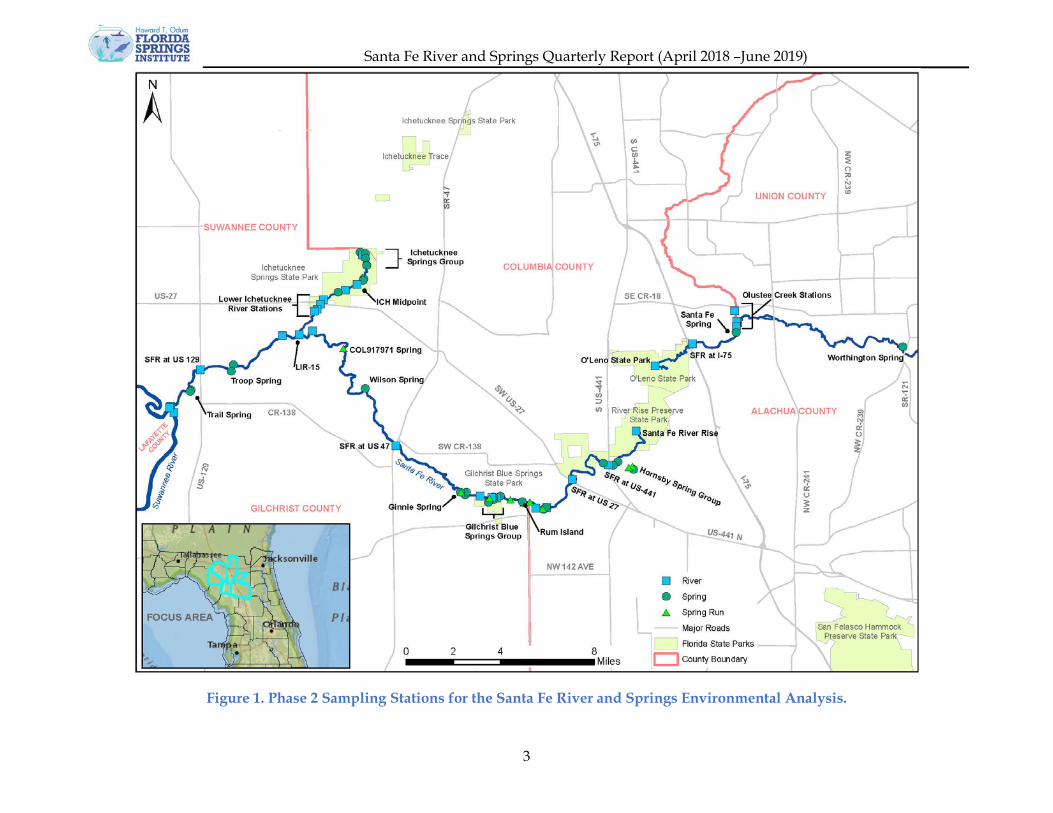
Table of Exhibits Figures Figure 1. Phase 2 Sampling Stations for the Santa Fe River and Springs Environmental Analysis. ...................................................................................................................................................................... 3
Figure 2. Segments 1 and 2 Santa Fe River monitoring station locations. ......................................... 5
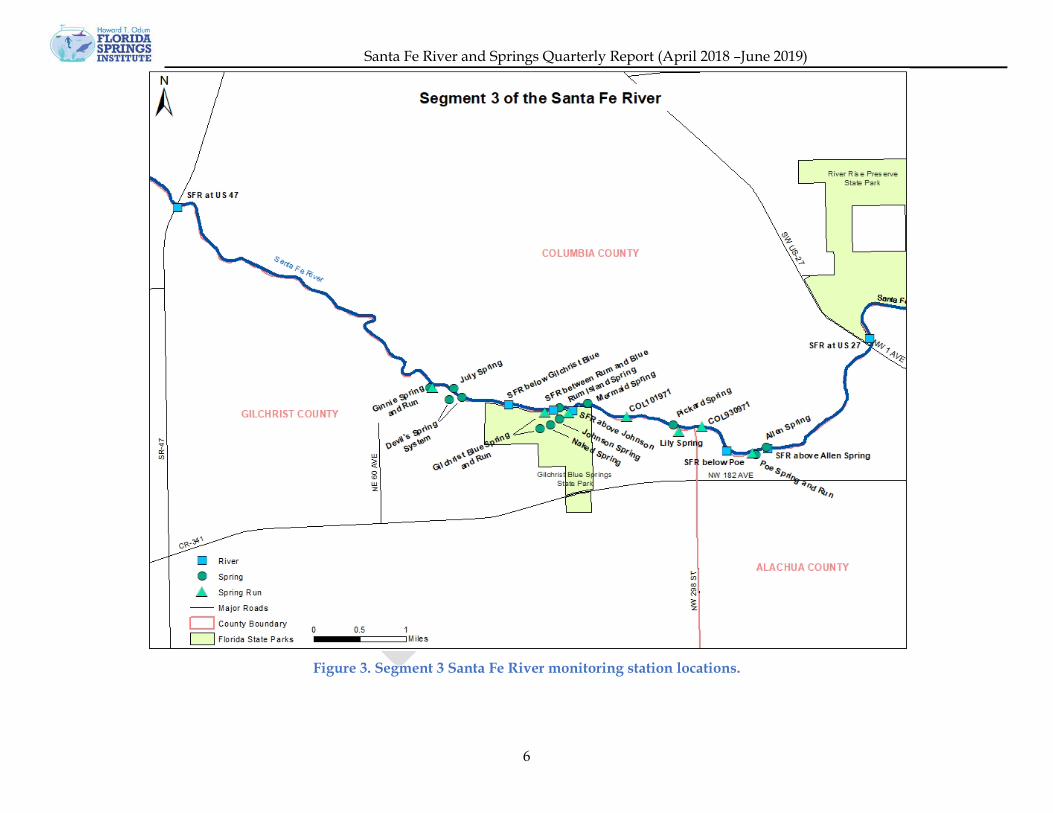
Figure 3. Segment 3 Santa Fe River monitoring station locations. ...................................................... 6
Figure 4. Lower Santa Fe River Segment 4 and the Ichetucknee monitoring station locations. ..... 7
Figure 5. Underwater LI COR sensor used to measure PAR. .............................................................. 9
Figure 6. Human use survey area for Gilchrist Blue Spring (22300 m2). .......................................... 12
Figure 7. Human use survey area for Naked Spring (640 m2). .......................................................... 13
Figure 8. Human use area for Ichetucknee Head Spring (3940 m2). ................................................. 13
Figure 9. Human use area for Blue Hole Spring (1100 m2). ............................................................... 14
Figure 10. Human use survey area for Poe Springs Park (4560 m2). ................................................ 14
Figure 12. PAR Diffuse Attenuation and Percent Transmittance measurements along the Santa Fe River (April 2018 through June 2019) .................................................................................................... 17
Figure 13. PAR Diffuse Attenuation and Percent Transmittance measurements along the Ichetucknee River (April 2018 through June 2019) ............................................................................. 18
Figure 14. Average horizontal Secchi disc readings along the Santa Fe and Ichetucknee Rivers (April 2018 through June 2019) .............................................................................................................. 19
Figure 15. Average vertical Secchi disc readings along the Santa Fe River (April 2018 through June 2019) ........................................................................................................................................................... 20
Figure 16. Seasonal variations of water quality parameters in rivers vs springs between April 2018 and June 2019. ........................................................................................................................................... 21
Figure 17. Dissolved oxygen measurements along the Santa Fe and Ichetucknee Rivers (April 2018 through June 2019) ................................................................................................................................... 22
Figure 18. pH measurements along the Santa Fe and Ichetucknee Rivers (April 2018 through June 2019) ........................................................................................................................................................... 23
Figure 19. Specific conductance measurements along the Santa Fe and Ichetucknee Rivers (April 2018 through June 2019) .......................................................................................................................... 24
Figure 20. Water temperature measurements along the Santa Fe and Ichetucknee Rivers (April 2018 through June 2019) .......................................................................................................................... 25
Figure 21. Water flow measurements along portions of the Santa Fe River and Ichetucknee River collected between April 2018 and June 2019. ....................................................................................... 26
Figure 22. Mass balance schematic used to illustrate NOx-N in tons/year entering the Santa Fe River during quarter 5 (April-June 2019).............................................................................................. 28

iv
Figure 23. Nitrate measurements along the Santa Fe and Ichetucknee Rivers between April 2018 and June 2019. ........................................................................................................................................... 29
Figure 24. A quarterly comparison of fish biomass (kg/ha) in springs along the Santa Fe and Ichetucknee Rivers (April 2018 through June 2019) ............................................................................ 32
Figure 25. Percent cover comparison in Gilchrist Blue Spring during quarter 5. ........................... 34
Figure 26. Percent cover comparison in Naked Spring during quarter 5. ...................................... 34
Figure 27. Percent cover comparison in the Ichetucknee Head Spring Run during quarter 5. .... 35
Figure 28. Percent cover comparison in Blue Hole Spring during quarter 5. .................................. 35
Figure 29. Percent cover comparison in Poe Spring during quarter 5. ............................................. 36
Figure 30. Weekday human use at Gilchrist Blue Spring (Friday 4/26/2019). ............................... 38
Figure 31. Weekend human use at Gilchrist Blue Spring (Sunday 6/2/2019). ............................... 39
Figure 32. Weekday human use at Gilchrist Blue Spring (Wednesday 6/12/2019). ..................... 40
Figure 33. Weekday human use at Naked Spring (Tuesday 5/7/2019). ......................................... 41
Figure 34. Weekend human use at Naked Spring (Saturday 6/22/2019). ...................................... 42
Figure 35. Weekday human use at Ichetucknee Head Spring (Wednesday 5/8/2019). ............... 43
Figure 36. Weekend human use at Ichetucknee Head Spring (Saturday 6/1/2019). ................... 44
Figure 37. Weekday human use at Blue Hole Spring (Monday 5/20/2019). ................................. 45
Figure 38. Weekend human use at Blue Hole Spring (Sunday 6/16/2019). .................................. 46
Figure 39. Weekday human use at Poe Springs (Wednesday 5/22/2019). ..................................... 47
Figure 40. Weekday human use at Poe Springs (Tuesday 6/4/2019). ............................................. 48
Figure 41. Weekend human use at Poe Springs (Sunday 6/23/2019). ............................................. 49
Tables Table 1. Collaborators for the Santa Fe River and Springs Environmental Analysis. ...................... 2
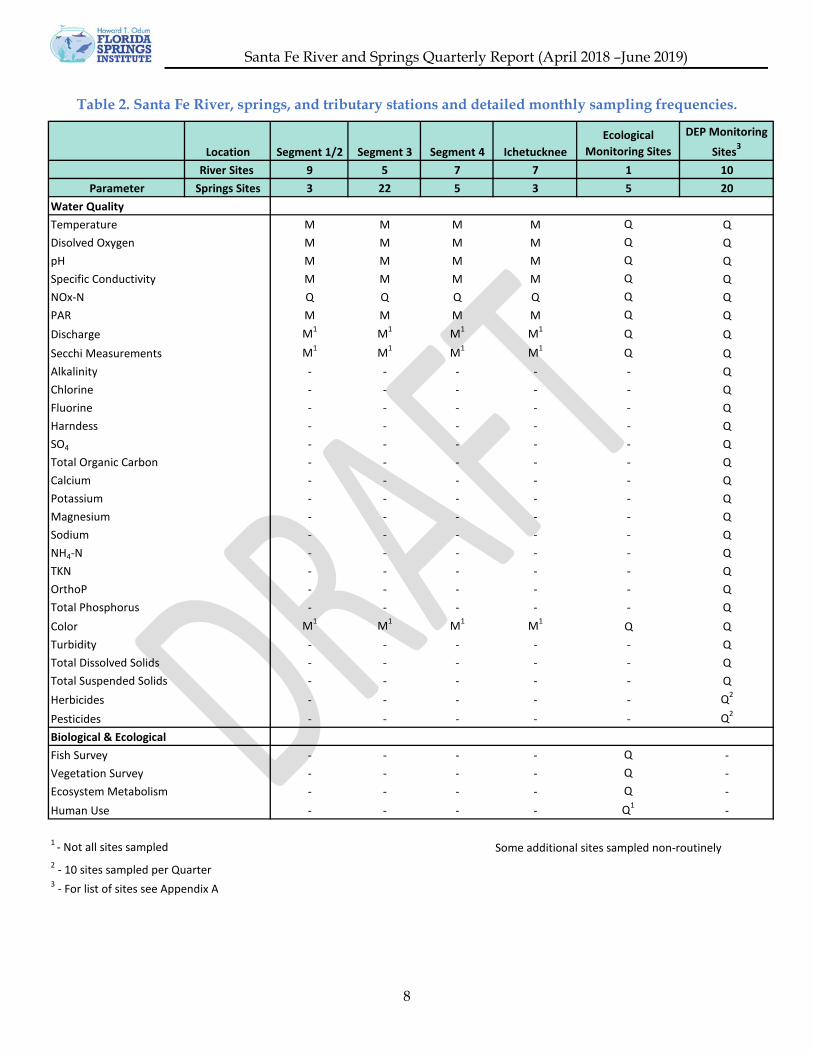
Table 2. Santa Fe River, springs, and tributary stations and detailed monthly sampling frequencies. ................................................................................................................................................. 8
Table 3. A comparison of average analyte concentrations at the Santa Fe River and spring stations (April 2018 through June 2019) .............................................................................................................. 30
Table 4. Seasonal fish counts, densities and biomass for various springs along the Santa Fe and Ichetucknee Rivers (April 2018 through June 2019) ............................................................................ 31

Santa Fe River and Springs Quarterly Report (April 2018 –June 2019)
1
Section 1.0 Introduction The Santa Fe River is classified as an Outstanding Florida Water and is home to over 40 recorded springs. The river and springs provide essential habitat for a diversity of flora and fauna and are a major contributor to the economic vitality of surrounding areas (FSI 2012, SRWMD 2014)). However, the Santa Fe River and springs are experiencing negative impacts from a variety of stressors including reduced discharge, increased nitrate-nitrogen levels, excessive recreation, harmful aquatic plant management activities, and structural alterations. These changes are resulting in a shifting ecological baseline for the Santa Fe river.
The Howard T. Odum Florida Springs Institute (FSI) in partnership with Our Santa Fe River, Inc. (OSFR) and other collaborators (Table 1) is conducting a Santa Fe River and Springs Environmental Analysis. The project consists of 3 phases; Phase 1 - a summary of existing data (completed in May 2017 [FSI 2017]), Phase 2 - a detailed river health evaluation, and Phase 3 - the development of a holistic management plan and recovery strategy. This report is a Phase 2 interim deliverable.
FSI began data collection at Santa Fe River springs, spring runs, and river stations (Figure 1) for Phase 2 in April 2018. The aim of this phase is to fill existing data gaps by conducting a comprehensive, two-year monitoring program to improve understanding of the physical, chemical, biological, and ecological condition of the springs and river. These data will be used in conjunction with other existing and ongoing research to develop an updated baseline of ecological conditions for the Santa Fe River and springs that can be used to assess ongoing changes in spring and river health and serve as a basis for developing a recovery and management strategy.
Results from the first four quarters of sampling (April 2018 through March 2019) were summarized previously (FSI 2019). This report summarizes progress through the first fifteen months of intensive sampling (April 2018 through June 2019). Detailed data for the fifth quarter (April- June 2019) can be found in Appendix C.

Santa Fe River and Springs Quarterly Report (April 2018 –June 2019)
2
Name Affiliation Email Position ResearchDr. Robert Knight Florida Springs Institute [email protected] FSI Director Springs ConservationHillary Skowronski Florida Springs Institute [email protected] Environmental Scientist Santa Fe River Springs Monitoring and EcologyZoey Hendrickson Florida Springs Institute [email protected] Environmental Scientist Santa Fe River Springs Monitoring and EcologyAngeline Meeks Florida Springs Institute [email protected] GIS Analyst Blue Water AuditDr. Jerry Johnston Santa Fe College [email protected] Faculty Turtle research and ecologyDr. Matt Cohen University of Florida [email protected] Faculty EcohydrologyDr. Bobby Hensley University of Florida - Cohen Lab [email protected] Post Doc Hydraulics and ecosystem metabolism in spring fed riversLily Kirk University of Florida - Cohen Lab [email protected] PhD student ecosystem respirationLauren DeVito University of Florida - Cohen Lab [email protected] PhD student ecosystem respirationDr. Lindsey Reisinger University of Florida [email protected] Faculty Invasive species, crayfishDr. Bill Pine University of Florida [email protected] Faculty River EcologyDr. Wendy Graham University of Florida [email protected] Director of Water Institute BMAPsDr. Colette Jacono University of Florida [email protected] Research Scientist Botany and Aquatic plantsDr. Xiang Bi University of Florida [email protected] Faculty Environmental and Resource EconomicsDr. Dina Liebowitz University of Florida [email protected] Independent researcher SpringsDr. Rob De Rooij University of Florida [email protected] Research Assistant ScientistMelissa Price UF/USGS [email protected] PhD student and scientist SturgeonDr. Steve Walsh USGS [email protected] Biologist Ichthyology and Fish EcologyEric Nagid FWC [email protected] Biologist Fisheries ManagementCameron Bodine FWC [email protected] BiologistTravis Tuten FWC [email protected] Biologist Fisheries Management, LTM programSahale Casebolt FWC [email protected] Biologist Freshwater MusselsDr. Gary Warren FWC [email protected] Section Head Freshwater InvertebratesSusan Geda FWC [email protected] Frsshwater Biologist Freshwater BiologistDr. Jim Williams FWC/USGS, retired [email protected] Researcher Ichthyology, musselsDr. Jennifer Bernatis FWC [email protected] Biologist InvertebratesDr. Brian Katz FDEP [email protected] Environmental Specialist Nutrient fate and transport in springs and groundwaterDr. Anne Barkdoll FDEP [email protected] Environmental Specialist II Park NaturalistDan Pearson FDEP [email protected] Environmental Specialist Park NaturalistRick Owen FDEP [email protected] Environmental SpecialistMike Eckles FDEP [email protected] Environmental Specialist Team Lead Tallahassee Regional Operating CenterSine Murray FDEP [email protected] Cole Ichetucknee Springs State Park [email protected] Park Biologist Vegetation surveysGabby Paxton Gilchrist Blue Springs/O’Leno State Parks [email protected] Park DirectorAmy Brown Suwannee River WMD [email protected] Program Manager Water Supply ProgramDarlene Velez Suwannee River WMD [email protected] Program Manager Water Resources ProgramTom Mirti Suwannee River WMD [email protected] Deputy Executive Director Water and Land ResourcesTara Rodgers St. John’s River WMD [email protected] Field Program Supervisor Water Resource InformationStacie Greco Alachua County [email protected] Water Conservation Coordinator Water conservationGreg Owen Alachua County [email protected] Senior Environmental Specialist Water quality and conservationPete Butt Karst Environmental Services [email protected] Consultant Caves and springsGeorgia Shemitz Karst Environmental Services [email protected] Consultant Caves and springsTom Morris Karst Environmental Services [email protected] Consultant Caves and springsChris Burney Alachua Conservation Trust [email protected] Project ManagerIvor Kincaide Alachua Conservation Trust [email protected] Land ManagerErica Hernandez Alachua Conservation Trust [email protected] Statewide Land Acquisition SpecialistBrian Pope Lubee Bat Conservancy [email protected] Director Native bat researchDr. Joseph Mitchell Mitchell Eco Research Service & FLMNH [email protected] Consultant Turtle research, herpetologyDr. Ken Sulak USGS, retired [email protected] Retired Sturgeon research
Table 1. Collaborators for the Santa Fe River and Springs Environmental Analysis.
Santa Fe River and Springs Quarterly Report (April 2018 –June 2019)
3
Figure 1. Phase 2 Sampling Stations for the Santa Fe River and Springs Environmental Analysis.

Santa Fe River and Springs Quarterly Report (April 2018 –June 2019)
4
Section 2.0 Methods 2.1 Introduction Data were collected over a 15-month period along the Santa Fe River as well as from several of its springs, and 3 of its major tributaries: the Ichetucknee River, Olustee Creek, and Cow Creek. For this assessment, monitoring was divided into five study segments, with one segment within the Upper Santa Fe River from SR 121 bridge at Worthington Springs downstream to O’Leno State Park, three segments within the Lower Santa Fe River below River Rise, and two tributary segments (Olustee Creek and Ichetucknee River):
• Upper Santa Fe River o Segment 1 (Worthington Spring at SR 121 to the Santa Fe River Sink in O’Leno
State Park) • Lower Santa Fe River
o Segment 2 (Santa Fe River Rise to US Hwy 27) o Segment 3 (US Hwy 27 to State Road 47) o Segment 4 (State Road 47 to Suwannee River confluence)
• Olustee Creek (CR 18 bridge to Santa Fe River confluence) • Ichetucknee River (Head Spring to Santa Fe River confluence)
Routine monitoring of water quality field parameters, nitrate nitrogen and color, and physical conditions was conducted in each segment during Quarters 1-5 (April 2018 through June 2019). Table 2 provides sampling frequencies for spring, spring run, and river stations. Detailed maps identifying monitoring station locations for each segment are provided in Figure 2 through Figure 4. A total of 61 monitoring stations were selected to characterize water quality and related ecological conditions. Additional ecological and biological data were collected at three spring and river sites during the quarter. The ecological and biological surveys include recording data sonde and HOBO (temperature and light pendant) deployments, fish counts, vegetation surveys and flow measurements. These representative sites included:
• Poe Springs • Gilchrist Blue/Naked Springs • Ichetucknee River/Blue Hole Spring
Water quality samples were collected for analysis by the Florida Department of Environmental Protection (FDEP) analytical laboratory for color, chloride, sulfate, arsenic, copper, iron, chlorophyll a, nitrate+nitrite nitrogen, total ammonia, total Kjeldahl nitrogen, total phosphorus, and fecal coliforms at 10 river and 20 spring sites on a quarterly basis, with 10 sites sampled each month. Priority herbicides and insecticides were tested at 10 spring or river stations quarterly. During routine monitoring, water samples were also collected for analysis by McGlynn Laboratories Inc. for nitrate nitrogen and color.

Santa Fe River and Springs Quarterly Report (April 2018 –June 2019)
5
Figure 2. Segments 1 and 2 Santa Fe River monitoring station locations.
Santa Fe River and Springs Quarterly Report (April 2018 –June 2019)
6
Figure 3. Segment 3 Santa Fe River monitoring station locations.

Santa Fe River and Springs Quarterly Report (April 2018 –June 2019)
7
Figure 4. Lower Santa Fe River Segment 4 and the Ichetucknee monitoring station locations.
Santa Fe River and Springs Quarterly Report (April 2018 –June 2019)
8
Table 2. Santa Fe River, springs, and tributary stations and detailed monthly sampling frequencies.
Location Segment 1/2 Segment 3 Segment 4 IchetuckneeEcological
Monitoring SitesDEP Monitoring
Sites3
River Sites 9 5 7 7 1 10Parameter Springs Sites 3 22 5 3 5 20
Water QualityTemperature M M M M Q QDisolved Oxygen M M M M Q QpH M M M M Q QSpecific Conductivity M M M M Q QNOx-N Q Q Q Q Q QPAR M M M M Q QDischarge M1 M1 M1 M1 Q QSecchi Measurements M1 M1 M1 M1 Q QAlkalinity - - - - - QChlorine - - - - - QFluorine - - - - - QHarndess - - - - - QSO4 - - - - - QTotal Organic Carbon - - - - - QCalcium - - - - - QPotassium - - - - - QMagnesium - - - - - QSodium - - - - - QNH4-N - - - - - QTKN - - - - - QOrthoP - - - - - QTotal Phosphorus - - - - - QColor M1 M1 M1 M1 Q QTurbidity - - - - - QTotal Dissolved Solids - - - - - QTotal Suspended Solids - - - - - QHerbicides - - - - - Q2
Pesticides - - - - - Q2
Biological & Ecological Fish Survey - - - - Q -Vegetation Survey - - - - Q -Ecosystem Metabolism - - - - Q -Human Use - - - - Q1 -
1 - Not all sites sampled Some additional sites sampled non-routinely2 - 10 sites sampled per Quarter3 - For list of sites see Appendix A
Santa Fe River and Springs Quarterly Report (April 2018 –June 2019)
9
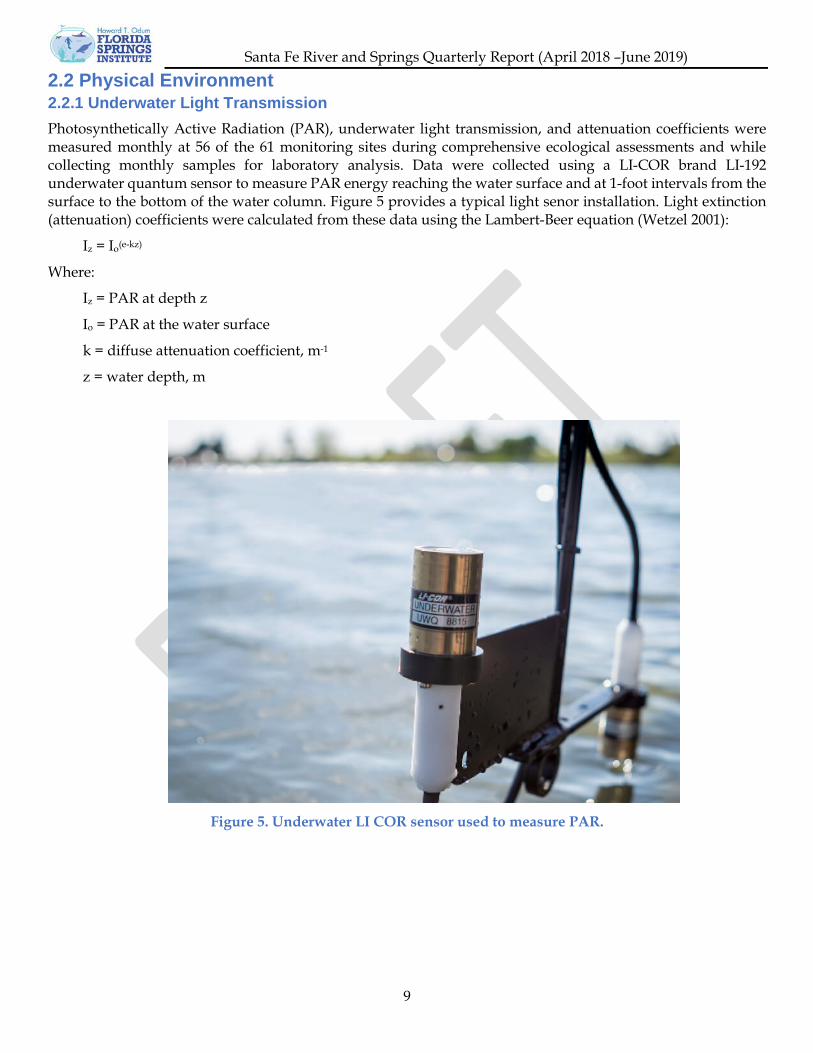
2.2 Physical Environment 2.2.1 Underwater Light Transmission Photosynthetically Active Radiation (PAR), underwater light transmission, and attenuation coefficients were measured monthly at 56 of the 61 monitoring sites during comprehensive ecological assessments and while collecting monthly samples for laboratory analysis. Data were collected using a LI-COR brand LI-192 underwater quantum sensor to measure PAR energy reaching the water surface and at 1-foot intervals from the surface to the bottom of the water column. Figure 5 provides a typical light senor installation. Light extinction (attenuation) coefficients were calculated from these data using the Lambert-Beer equation (Wetzel 2001):
Iz = Io(e-kz)
Where:
Iz = PAR at depth z
Io = PAR at the water surface
k = diffuse attenuation coefficient, m-1
z = water depth, m
Figure 5. Underwater LI COR sensor used to measure PAR.
Santa Fe River and Springs Quarterly Report (April 2018 –June 2019)
10
2.2.2 Water Quality Field parameters (water temperature, dissolved oxygen concentration, oxygen percent saturation, pH, and specific conductance) were measured monthly using a YSI proDSS meter at each of the 61 (28 river and 33 springs) monitoring sites, during comprehensive ecological assessments, and while collecting monthly samples for laboratory analysis.
During routine monitoring, water samples were collected at 60 of the 61 sample sites and sent to McGlynn Laboratories Inc. for nitrate nitrogen and color analysis. Samples were collected by placing a capped sample bottle below the surface water, uncapping to collect water, and recapping underwater. Samples have a 28-day holding time and are sent to the lab bi-weekly.
Water samples for laboratory analysis were also collected according to Department of Environmental Protection (FDEP) standard operating procedures. Thirty sites (10 river and 20 springs) were sampled four times throughout the year. Samples were shipped overnight to the FDEP Central Laboratory in Tallahassee where they were analyzed for color, chloride, sulfate, arsenic, copper, iron, chlorophyll a, NOx-N, NH4-N, TKN, total phosphorus, and fecal coliforms. Ten spring and river sites were also sampled once per quarter for additional priority herbicides, insecticides, and trace organic compounds.
2.2.3 Secchi Disk Visibility Visual water clarity was assessed using Secchi disk visibility, the distance where a standard white and black Secchi disk disappears. At tannic river and creek stations, the Secchi depth was estimated by vertically lowering the Secchi disk below the water surface. In spring systems, underwater visibility is commonly greater than the depth of the water column, in those cases Secchi disk visibility was measured horizontally. Vertical and horizontal Secchi distance was measured with a 20-centimeter diameter black and white disk attached to the end of a tape measure below the surface of the water. For horizontal readings a skin diver extended the tape while moving away from the disk and recorded the distance at which it was no longer visible. Secchi disk measurements were taken at 39 stations during monthly monitoring sessions and during comprehensive ecological sampling.
2.2.4 Stream Discharge Stream discharge was measured at 13 locations, including 10 springs, at the US-27 bridge, Ichetucknee below the Blue Hole confluence, and at the mouth of the Ichetucknee River (LIR-15) using a Hach FH950 portable velocity meter. At each location, a fiberglass tape was stretched across the stream channel perpendicular to the flow direction, allowing depth and velocity to be measured in up to 25 evenly spaced segments. Narrower streams were measured at 10-22 segments. At water depths less than 2.5 ft, velocity was measured at 0.6 of the water column depth. For water depths greater than 2.5 ft, velocity was measured at 0.2, 0.6, and 0.8 fractional depths of the water column.

Santa Fe River and Springs Quarterly Report (April 2018 –June 2019)
11
2.3 Biology 2.3.1 Fish Visual surveys of the fish communities were conducted during ecological assessments at the Ichetucknee Headspring and run, as well as, Blue Hole, Gilchrist Blue, Naked, and Poe springs systems. Visual surveys of fish communities were made by 2 to 3 people using mask and snorkel gear. Observers spread out to evenly span the spring run segment and swam in parallel paths, noting the fish species or groups of similar species (lowest practical taxonomic level) of all observed fish. All observations were reported to a data recorder, who was at a fixed location on shore or who followed the observers in a boat. Following each survey, observers estimated the total length (average and range) by fish species. Fish density was calculated for each sub-section by dividing the number of individual fishes counted by the area sampled. Wet-weight biomass of fish species was estimated using published length-weight relationships (Schneider et al. 2000) and average species total lengths and total numbers. Fish assemblage diversity was calculated using the Shannon-Wiener diversity index based on the calculated densities of individual species or groups (Zar 1984).
2.3.2 Plant Community Characterization The distribution and percent cover of aquatic plant communities (macroalgae and submerged aquatic vegetation), as well as substrates in the study segment were visually estimated this quarter in 3 spring systems: Gilchrist Blue Springs, Poe and the Ichetucknee River. Aquatic vegetative cover was documented along several transects in each spring run using the line-intercept method. A tape measure was stretched along each transect, and all aquatic plant communities intercepting the vertical plane of the line were recorded. Line-intercept data were used to estimate percent cover, frequency, relative cover, and relative frequency. Frequency was based on dividing each transect into 8 equal sized sub-transects. Values by species were summed and averaged to yield an importance value as follows:
Linear Cover Distance for Species A =∑ (m)A Speciesfor distancesintercept line
Percent Cover =(m) distance transect Total
(m)A Species of distancecover Linear x 100
Relative Percent Cover =(m) species all of distancecover linear Total
(m)A Species of distancecover Linear x 100
Absolute Frequency =tssubtransec ofnumber Total
occurredA Speciesin which tssubtransec ofNumber
Relative Frequency =∑ species all of sfrequencie absolute
A Species offrequency Absolutex 100
Importance Value = ( )2
Frequency Relative Cover Vegetative Relative +
All observed plants were identified to species or lowest possible taxonomic classification.

Santa Fe River and Springs Quarterly Report (April 2018 –June 2019)
12
2.3.3 Human Use Human use is a physical factor that has potential to impact springs. Foot traffic in the spring and its run and bank erosion are two common ways that humans can influence the health of a spring. Many springs with shallow runs experience plant disturbance when visitors can walk in the run. Human use was recorded at the Gilchrist Blue, Ichetucknee and Poe springs systems. During ecological monitoring, human use was monitored at one location for the duration of ecological sampling and compared to observations from a weekend day. Observers recorded the number of individuals participating in in-water and out-of-water activities in 15-minute intervals. In-water categories include wading, bathing, swimming, snorkeling, tubing, canoeing/kayaking, fishing and “other” and out-of-water categories include sitting, walking, sunbathing, nature study, dive prep and “other”. Figure 6 through Figure 10 show the study area for all springs for human use observations.
Results from human use surveys are provided in section 3.2.3 Human Use.
Figure 6. Human use survey area for Gilchrist Blue Spring (22300 m2).

Santa Fe River and Springs Quarterly Report (April 2018 –June 2019)
13
Figure 7. Human use survey area for Naked Spring (640 m2).
Figure 8. Human use area for Ichetucknee Head Spring (3940 m2).

Santa Fe River and Springs Quarterly Report (April 2018 –June 2019)
14
Figure 9. Human use area for Blue Hole Spring (1100 m2).
Figure 10. Human use survey area for Poe Springs Park (4560 m2).

Santa Fe River and Springs Quarterly Report (April 2018 –June 2019)
15
Section 3.0 Results This section summarizes data collected as part of the ecosystem monitoring conducted along the Santa Fe River and springs from Quarters 1 through 5 (April 2018 through June 2019). These data provide a quantitative record of existing conditions in the river and are useful for comparison to historic and future environmental data from the Santa Fe River and springs. Parameter figures are represented by a box and whisker plot. River stations are indicated with a green diamond and spring stations with a blue diamond
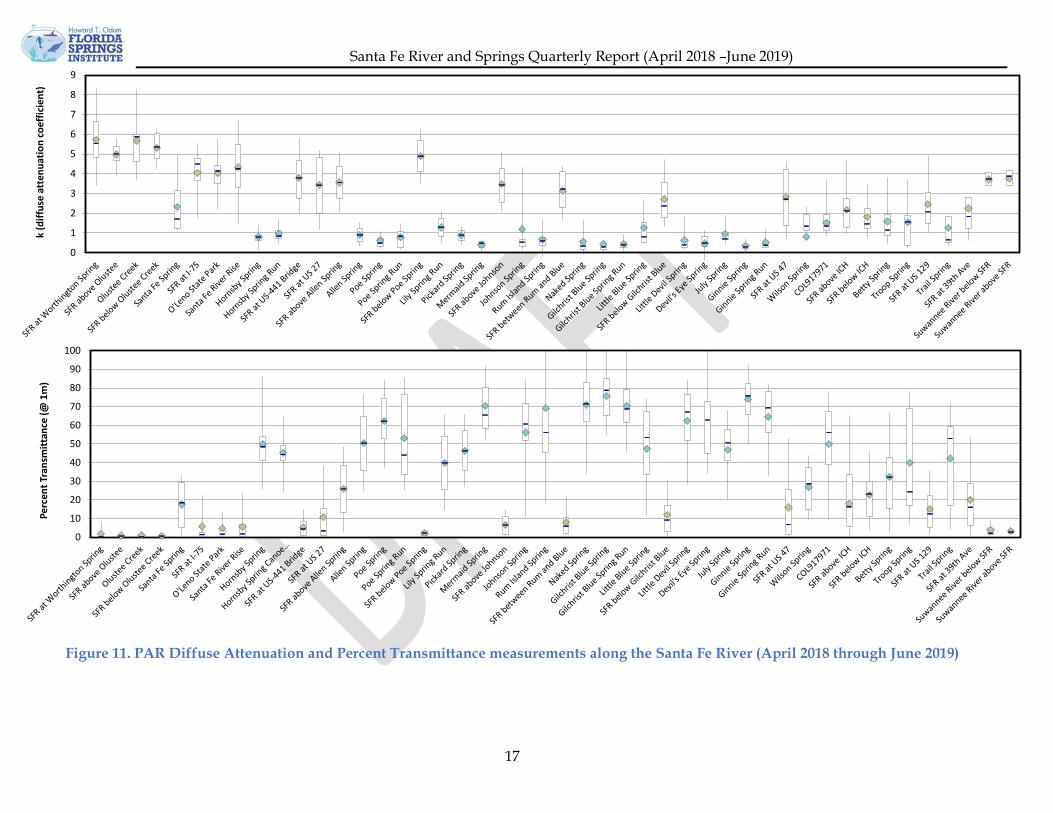
3.1 Physical Environment 3.1.1 Underwater Light Transmission The summaries of PAR percent transmittance and diffuse attenuation data collected on the Santa Fe and Ichetucknee river are presented in Figure 12 and Figure 13. PAR diffuse attenuation is consistently highest in the tannic waters of the Upper Santa Fe, and lowest in the springs. Light transmittance is consistently higher in the spring and spring run stations and increases in the Santa Fe River with travel distance downstream until reaching segment 4 (SFR at SR-47). PAR attenuation in the Ichetucknee River (dominated by spring flow) is typically less than 1 and transmittance is typically greater than 50%, like the Santa Fe River springs.
3.1.9 Water Clarity Figure 14 and Figure 15 present the average horizontal and vertical Secchi disc readings at sites on the Santa Fe and the Ichetucknee Rivers. Spring stations typically had readings greater than 15m except for vertical Secchi readings in Segment 2 at Santa Fe Spring. Santa Fe River stations had Secchi readings that were typically below 3m. Horizontal Secchi readings were between 8.5 and 52m. Of the springs studied, Gilchrist Blue Spring had the highest measured water clarity with an average visibility of 52 m. Little Devil and Ginnie Springs also had good clarity averaging 49 m and 48 m, respectively.
3.1.2 Water Quality Figure 16 shows the water quality results for samples collected by FSI staff on four segments of the Santa Fe River and associated springs, and the Ichetucknee River and associated springs. Compared to the adjacent river stations, spring stations have lower dissolved oxygen concentrations and higher specific conductance. pH shows a similar fluctuation between spring and river stations, with river stations being slightly more acidic due to the influence of rain, whereas river temperatures spike during the 2nd quarter (summer months) and drop again in the fall and winter months. During quarter 5, the average temperature continues to drop, which may be due to the lack of rainfall/runoff, and therefore greater influence of spring water in the river.
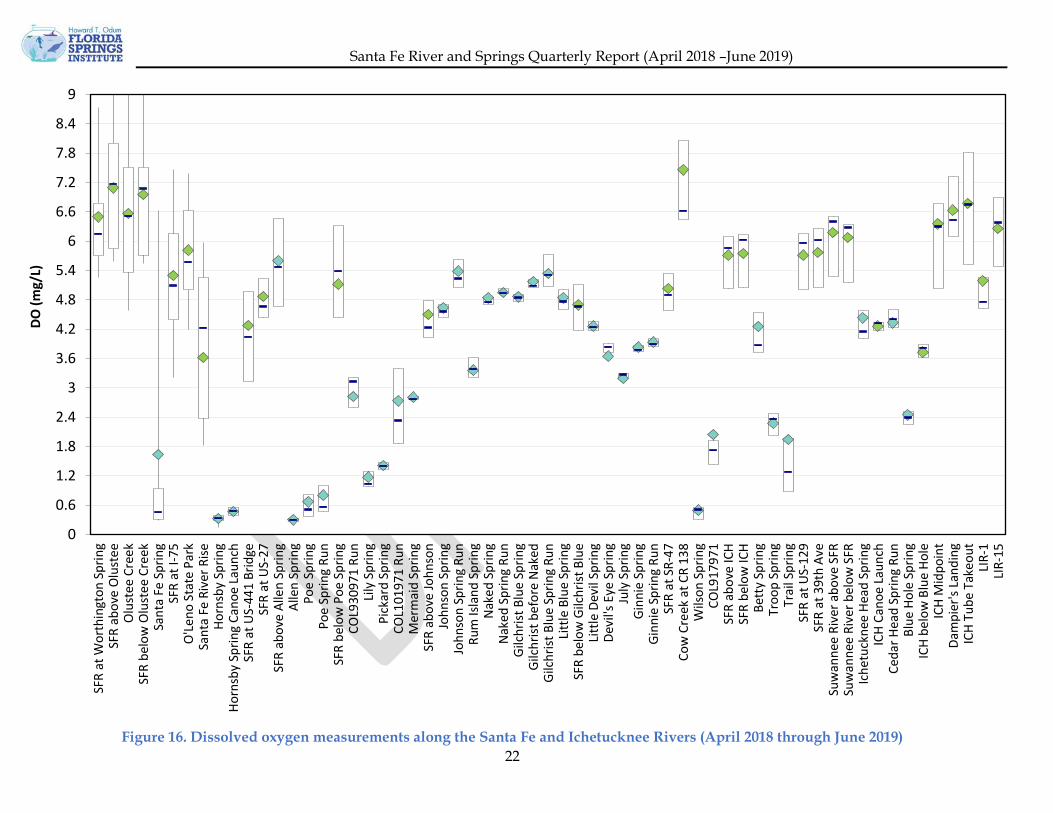
3.1.3 Dissolved Oxygen Figure 17 presents boxplots to display the fluctuation of dissolved oxygen (mg/L) measured along four segments of the Santa Fe River as well as the Ichetucknee River between 1 April 2018 and 30 June 2019. During this sampling period, the Santa Fe River dissolved oxygen concentrations were typically 4 mg/L or higher while spring stations had variable DO values ranging from very low (0.38 mg/L at Hornsby Spring) to over 5 mg/L at the Gilchrist Blue Springs Group. The Ichetucknee Head Spring as well as Cedar Head Spring Run and Blue Hole spring feeding the Ichetucknee River have lower DO concentrations (<4.4 mg/L) while the DO concentrations in the main channel of the Ichetucknee River rise from about 4 mg/L at the upstream canoe launch to over 6.75 mg/L near the tube takeout location.
Santa Fe River and Springs Quarterly Report (April 2018 –June 2019)
16
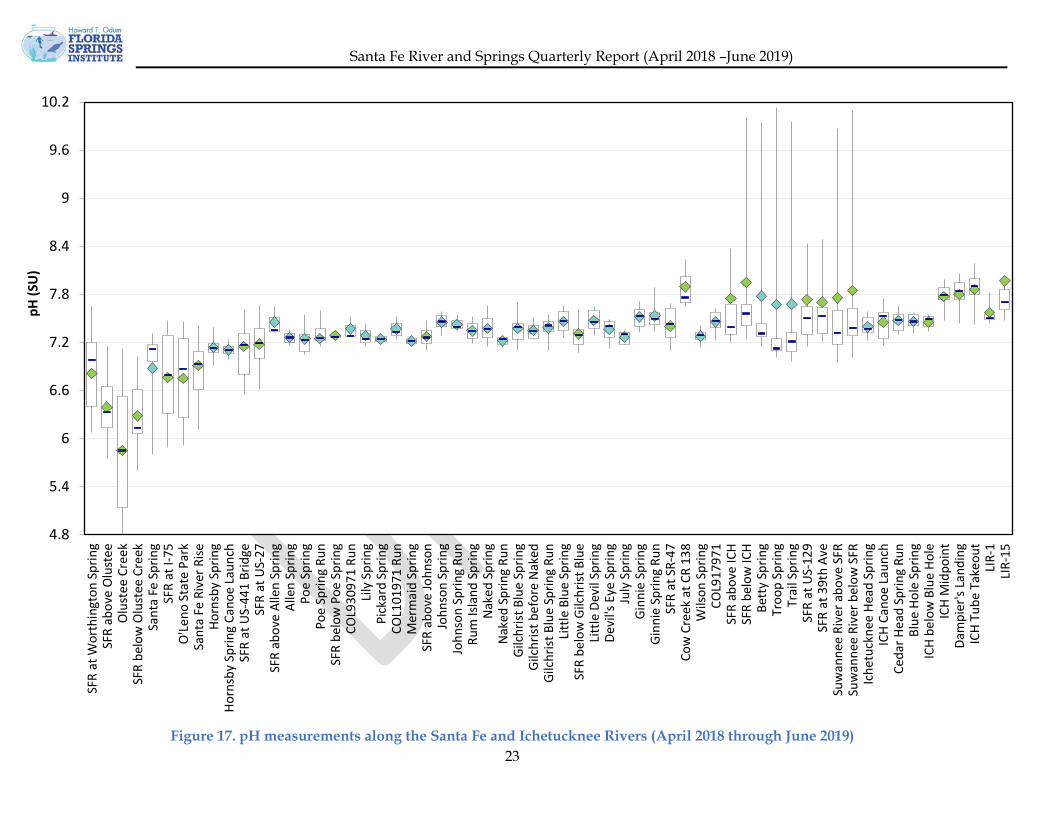
3.1.4 pH Figure 18 presents boxplots to display the fluctuation of pH measured along four segments of the Santa Fe River and the Ichetucknee River between 1 April 2018 and 30 June 2019. pH values in segments one and two had values below 7.2 s.u. due to a lack of spring water and influence of rainwater and runoff. Hornsby Spring (segment 2) has a higher pH at 7.42 s.u. which is more representative of the groundwater feeding the springs. All river and spring stations downstream from US-27 had values between 7.25 and 7.40 s.u with little variation between spring and river stations until segment 4 where the water is slightly more basic.
3.1.5 Specific Conductance Figure 19 presents boxplots to display the fluctuation of specific conductance measured along four segments of the Santa Fe River and the Ichetucknee River between 1 April 2018 and 30 June 2019. Spring stations typically had a higher specific conductance value compared to the river stations and did not vary as much. Specific conductance is a useful parameter when determining how much groundwater is entering the river and its origin. Changes in conductivity measurements may be related to the mixing of groundwater with surface water, rain or other inputs. River stations varied more, due to rain occurrences, dry periods, and runoff. During periods of high rainfall, the conductance is lower, but in times of little rainfall, the river is mainly spring fed, thus increasing the specific conductance. Santa Fe Spring in segment 1 had an average of 285 umhos/cm, while most other springs in other segments had specific conductance values between 295 and 456 umhos/cm. Lower specific conductance values in springs are likely associated with periodic flow reversals and subsequent discharge of groundwater with a significant surface water component. Troop spring had an unusually high average specific conductance of 870 umhos/cm as well as neighboring springs such as Betty Spring, and Trail Spring (~450 umhos/cm). These three springs are located 1-2 miles North of Alliance Branford Dairy (American Dairy), and have high concentrations of NOx-N, indicating the influence of wastewater input into the groundwater coming out of these springs.
3.1.6 Water Temperature Figure 20 presents boxplots to display the fluctuation of water temperature (°C) measurements along four segments of the Santa Fe River and along the Ichetucknee River collected between 1 April and 30 June 2019. River stations show more variability whereas springs have a consistent average of 21.8-22.9°C except for Santa Fe Spring at an average of 20.93°C. The depth of the river changes greatly throughout the year, allowing surface waters to warm when levels are lower, but increased rainfall and winter months cool the water, producing the wider range on the boxplots.
3.1.7 Discharge Figure 21 presents boxplots of discharge measurements collected for nine spring and two river stations along portions of the Santa Fe River and Ichetucknee River collected between 01 April and 30 June 2019. Santa Fe Spring and Hornsby Spring show the greatest variation where they increase in flow during the wetter months and decrease in flow during dry months. The remaining springs and Ichetucknee River stations show little to no fluctuation throughout the seasons.
Santa Fe River and Springs Quarterly Report (April 2018 –June 2019)
17
Figure 11. PAR Diffuse Attenuation and Percent Transmittance measurements along the Santa Fe River (April 2018 through June 2019)
0
1
2
3
4
5
6
7
8
9
k (d
iffus
e at
tenu
atio
n co
effic
ient
)
0
10
20
30
40
50
60
70
80
90
100
Perc
ent T
rans
mitt
ance
(@ 1
m)

Santa Fe River and Springs Quarterly Report (April 2018 –June 2019)
18
Figure 12. PAR Diffuse Attenuation and Percent Transmittance measurements along the Ichetucknee River (April 2018 through June 2019)
0
0.2
0.4
0.6
0.8
1
1.2
1.4
1.6k
(diff
use
atte
nuat
ion
coef
ficie
nt)
20
30
40
50
60
70
80
90
Perc
ent T
rans
mitt
ance
(@ 1
m)

Santa Fe River and Springs Quarterly Report (April 2018 –June 2019)
19
Figure 13. Average horizontal Secchi disc readings along the Santa Fe and Ichetucknee Rivers (April 2018 through June 2019)
0
5
10
15
20
25
30
35
40
45
50
55
60
65
70
75
80
Horiz
onta
l Sec
chi (
m)

Santa Fe River and Springs Quarterly Report (April 2018 –June 2019)
20
Figure 14. Average vertical Secchi disc readings along the Santa Fe River (April 2018 through June 2019)
0
0.5
1
1.5
2
2.5
3
3.5
4
4.5
5
5.5
Vert
ical
Sec
chi (
m)

Santa Fe River and Springs Quarterly Report (April 2018 –June 2019)
21
Figure 15. Seasonal variations of water quality parameters in rivers vs springs between April 2018 and June 2019.
2.0
2.5
3.0
3.5
4.0
4.5
5.0
5.5
6.0
Q1 Q2 Q3 Q4 Q5
Average DO (mg/L)
River Spring
7.15
7.20
7.25
7.30
7.35
7.40
7.45
Q1 Q2 Q3 Q4 Q5
Average pH (SU)
River Spring
245
265
285
305
325
345
365
385
405
425
Q1 Q2 Q3 Q4 Q5
Average Specific Conductance (µS/cm)
River Spring
21.5
21.7
21.9
22.1
22.3
22.5
22.7
22.9
23.1
Q1 Q2 Q3 Q4 Q5
Average Water Temperature (°C)
River Spring
Santa Fe River and Springs Quarterly Report (April 2018 –June 2019)
22
Figure 16. Dissolved oxygen measurements along the Santa Fe and Ichetucknee Rivers (April 2018 through June 2019)
0
0.6
1.2
1.8
2.4
3
3.6
4.2
4.8
5.4
6
6.6
7.2
7.8
8.4
9SF
R at
Wor
thin
gton
Spr
ing
SFR
abov
e O
lust
eeO
lust
ee C
reek
SFR
belo
w O
lust
ee C
reek
Sant
a Fe
Spr
ing
SFR
at I-
75O
'Len
o St
ate
Park
Sant
a Fe
Riv
er R
iseHo
rnsb
y Sp
ring
Horn
sby
Sprin
g Ca
noe
Laun
chSF
R at
US-
441
Brid
geSF
R at
US-
27SF
R ab
ove
Alle
n Sp
ring
Alle
n Sp
ring
Poe
Sprin
gPo
e Sp
ring
Run
SFR
belo
w P
oe S
prin
gCO
L930
971
Run
Lily
Spr
ing
Pick
ard
Sprin
gCO
L101
971
Run
Mer
mai
d Sp
ring
SFR
abov
e Jo
hnso
nJo
hnso
n Sp
ring
John
son
Sprin
g Ru
nRu
m Is
land
Spr
ing
Nak
ed S
prin
gN
aked
Spr
ing
Run
Gilc
hrist
Blu
e Sp
ring
Gilc
hrist
bef
ore
Nak
edGi
lchr
ist B
lue
Sprin
g Ru
nLi
ttle
Blu
e Sp
ring
SFR
belo
w G
ilchr
ist B
lue
Litt
le D
evil
Sprin
gDe
vil's
Eye
Spr
ing
July
Spr
ing
Ginn
ie S
prin
gGi
nnie
Spr
ing
Run
SFR
at S
R-47
Cow
Cre
ek a
t CR
138
Wils
on S
prin
gCO
L917
971
SFR
abov
e IC
HSF
R be
low
ICH
Bett
y Sp
ring
Troo
p Sp
ring
Trai
l Spr
ing
SFR
at U
S-12
9SF
R at
39t
h Av
eSu
wan
nee
Rive
r abo
ve S
FRSu
wan
nee
Rive
r bel
ow S
FRIc
hetu
ckne
e He
ad S
prin
gIC
H Ca
noe
Laun
chCe
dar H
ead
Sprin
g Ru
nBl
ue H
ole
Sprin
gIC
H be
low
Blu
e Ho
leIC
H M
idpo
int
Dam
pier
's La
ndin
gIC
H Tu
be T
akeo
utLI
R-1
LIR-
15
DO (m
g/L)
Santa Fe River and Springs Quarterly Report (April 2018 –June 2019)
23
Figure 17. pH measurements along the Santa Fe and Ichetucknee Rivers (April 2018 through June 2019)
4.8
5.4
6
6.6
7.2
7.8
8.4
9
9.6
10.2SF
R at
Wor
thin
gton
Spr
ing
SFR
abov
e O
lust
eeO
lust
ee C
reek
SFR
belo
w O
lust
ee C
reek
Sant
a Fe
Spr
ing
SFR
at I-
75O
'Len
o St
ate
Park
Sant
a Fe
Riv
er R
iseHo
rnsb
y Sp
ring
Horn
sby
Sprin
g Ca
noe
Laun
chSF
R at
US-
441
Brid
geSF
R at
US-
27SF
R ab
ove
Alle
n Sp
ring
Alle
n Sp
ring
Poe
Sprin
gPo
e Sp
ring
Run
SFR
belo
w P
oe S
prin
gCO
L930
971
Run
Lily
Spr
ing
Pick
ard
Sprin
gCO
L101
971
Run
Mer
mai
d Sp
ring
SFR
abov
e Jo
hnso
nJo
hnso
n Sp
ring
John
son
Sprin
g Ru
nRu
m Is
land
Spr
ing
Nak
ed S
prin
gN
aked
Spr
ing
Run
Gilc
hrist
Blu
e Sp
ring
Gilc
hrist
bef
ore
Nak
edGi
lchr
ist B
lue
Sprin
g Ru
nLi
ttle
Blu
e Sp
ring
SFR
belo
w G
ilchr
ist B
lue
Litt
le D
evil
Sprin
gDe
vil's
Eye
Spr
ing
July
Spr
ing
Ginn
ie S
prin
gGi
nnie
Spr
ing
Run
SFR
at S
R-47
Cow
Cre
ek a
t CR
138
Wils
on S
prin
gCO
L917
971
SFR
abov
e IC
HSF
R be
low
ICH
Bett
y Sp
ring
Troo
p Sp
ring
Trai
l Spr
ing
SFR
at U
S-12
9SF
R at
39t
h Av
eSu
wan
nee
Rive
r abo
ve S
FRSu
wan
nee
Rive
r bel
ow S
FRIc
hetu
ckne
e He
ad S
prin
gIC
H Ca
noe
Laun
chCe
dar H
ead
Sprin
g Ru
nBl
ue H
ole
Sprin
gIC
H be
low
Blu
e Ho
leIC
H M
idpo
int
Dam
pier
's La
ndin
gIC
H Tu
be T
akeo
utLI
R-1
LIR-
15
pH (S
U)

Santa Fe River and Springs Quarterly Report (April 2018 –June 2019)
24
Figure 18. Specific conductance measurements along the Santa Fe and Ichetucknee Rivers (April 2018 through June 2019)
0
100
200
300
400
500
600
700
800
900
1000
1100SF
R at
Wor
thin
gton
Spr
ing
SFR
abov
e O
lust
eeO
lust
ee C
reek
SFR
belo
w O
lust
ee C
reek
Sant
a Fe
Spr
ing
SFR
at I-
75O
'Len
o St
ate
Park
Sant
a Fe
Riv
er R
iseHo
rnsb
y Sp
ring
Horn
sby
Sprin
g Ca
noe
Laun
chSF
R at
US-
441
Brid
geSF
R at
US-
27SF
R ab
ove
Alle
n Sp
ring
Alle
n Sp
ring
Poe
Sprin
gPo
e Sp
ring
Run
SFR
belo
w P
oe S
prin
gCO
L930
971
Run
Lily
Spr
ing
Pick
ard
Sprin
gCO
L101
971
Run
Mer
mai
d Sp
ring
SFR
abov
e Jo
hnso
nJo
hnso
n Sp
ring
John
son
Sprin
g Ru
nRu
m Is
land
Spr
ing
Nak
ed S
prin
gN
aked
Spr
ing
Run
Gilc
hrist
Blu
e Sp
ring
Gilc
hrist
bef
ore
Nak
edGi
lchr
ist B
lue
Sprin
g Ru
nLi
ttle
Blu
e Sp
ring
SFR
belo
w G
ilchr
ist B
lue
Litt
le D
evil
Sprin
gDe
vil's
Eye
Spr
ing
July
Spr
ing
Ginn
ie S
prin
gGi
nnie
Spr
ing
Run
SFR
at S
R-47
Cow
Cre
ek a
t CR
138
Wils
on S
prin
gCO
L917
971
SFR
abov
e IC
HSF
R be
low
ICH
Bett
y Sp
ring
Troo
p Sp
ring
Trai
l Spr
ing
SFR
at U
S-12
9SF
R at
39t
h Av
eSu
wan
nee
Rive
r abo
ve S
FRSu
wan
nee
Rive
r bel
ow S
FRIc
hetu
ckne
e He
ad S
prin
gIC
H Ca
noe
Laun
chCe
dar H
ead
Sprin
g Ru
nBl
ue H
ole
Sprin
gIC
H be
low
Blu
e Ho
leIC
H M
idpo
int
Dam
pier
's La
ndin
gIC
H Tu
be T
akeo
utLI
R-1
LIR-
15
Spec
ific C
ondu
ctan
ce (u
mho
s/cm
)

Santa Fe River and Springs Quarterly Report (April 2018 –June 2019)
25
Figure 19. Water temperature measurements along the Santa Fe and Ichetucknee Rivers (April 2018 through June 2019)
11
12
13
14
15
16
17
18
19
20
21
22
23
24
25
26
27SF
R at
Wor
thin
gton
Spr
ing
SFR
abov
e O
lust
eeO
lust
ee C
reek
SFR
belo
w O
lust
ee C
reek
Sant
a Fe
Spr
ing
SFR
at I-
75O
'Len
o St
ate
Park
Sant
a Fe
Riv
er R
iseHo
rnsb
y Sp
ring
Horn
sby
Sprin
g Ca
noe
Laun
chSF
R at
US-
441
Brid
geSF
R at
US-
27SF
R ab
ove
Alle
n Sp
ring
Alle
n Sp
ring
Poe
Sprin
gPo
e Sp
ring
Run
SFR
belo
w P
oe S
prin
gCO
L930
971
Run
Lily
Spr
ing
Pick
ard
Sprin
gCO
L101
971
Run
Mer
mai
d Sp
ring
SFR
abov
e Jo
hnso
nJo
hnso
n Sp
ring
John
son
Sprin
g Ru
nRu
m Is
land
Spr
ing
Nak
ed S
prin
gN
aked
Spr
ing
Run
Gilc
hrist
Blu
e Sp
ring
Gilc
hrist
bef
ore
Nak
edGi
lchr
ist B
lue
Sprin
g Ru
nLi
ttle
Blu
e Sp
ring
SFR
belo
w G
ilchr
ist B
lue
Litt
le D
evil
Sprin
gDe
vil's
Eye
Spr
ing
July
Spr
ing
Ginn
ie S
prin
gGi
nnie
Spr
ing
Run
SFR
at S
R-47
Cow
Cre
ek a
t CR
138
Wils
on S
prin
gCO
L917
971
SFR
abov
e IC
HSF
R be
low
ICH
Bett
y Sp
ring
Troo
p Sp
ring
Trai
l Spr
ing
SFR
at U
S-12
9SF
R at
39t
h Av
eSu
wan
nee
Rive
r abo
ve S
FRSu
wan
nee
Rive
r bel
ow S
FRIc
hetu
ckne
e He
ad S
prin
gIC
H Ca
noe
Laun
chCe
dar H
ead
Sprin
g Ru
nBl
ue H
ole
Sprin
gIC
H be
low
Blu
e Ho
leIC
H M
idpo
int
Dam
pier
's La
ndin
gIC
H Tu
be T
akeo
utLI
R-1
LIR-
15
Wat
er T
empe
ratu
re (°
C)

Santa Fe River and Springs Quarterly Report (April 2018 –June 2019)
26
Figure 20. Water flow measurements along portions of the Santa Fe River and Ichetucknee River collected between April 2018 and June 2019.
0
50
100
150
200
250
300
350
Disc
harg
e (c
fs)

Santa Fe River and Springs Quarterly Report (April 2018 –June 2019)
27
3.1.9 Flow and Nitrate Period of Record Figure 22 illustrates spring and river flows and nitrate concentrations used to estimate the tons of NOx-N at key measurement stations along the Santa Fe River. These numbers were based on the discharge measurements and reported NOx-N concentrations observed during quarter 5 only (April-June 2019). During this quarterly monitoring period, the estimated nitrate nitrogen load increased dramatically with distance down river, from an average of 13.4 tons/year in the Santa Fe River at the Worthington Springs station, to an average of 1682 tons/year in the Santa Fe River at U.S. 129, upstream of the confluence with the Suwannee River. This is an observed net increase of 1,669 tons of nitrogen per year entering the Suwannee River. Flows and concentrations at key stations were combined to estimate loads per time at spring and river stations. Flow data for the period of record are recorded by FSI staff, Suwannee River Water Management District (SRWMD), and the U.S. Geological Survey (USGS). Nitrate nitrogen data is collected by FSI staff and analyzed by FDEP and McGlynn Laboratories Inc. Measured nitrogen inputs are represented by blue circles and boxes. Measured flows are multiplied by nitrate-N concentrations to estimate average mass of nitrogen (tons per year) entering the Santa Fe River. Estimated inputs are in green and are calculated by taking the difference between measured upstream and downstream nitrogen loads. Estimated nitrogen loads at some stations such as SFR at US-27 and SFR at US-441 are based on FSI’s measured or estimated flows. SFR at US-27 flow was measured monthly by FSI staff, and SFR at US-441 flow was estimated by creating a stage-discharge curve that was produced by using manually read stage and flow measurements reported by SRWMD. As additional data are collected, discharge estimates at this station will be more reliable.
Flow rates at river stations increased from upstream to downstream from 45 cfs to 1,857 cfs. This increase is due to a combination of surface water inputs from Olustee and Cow Creeks and increasing groundwater inputs from upstream to downstream. In terms of total nitrogen inputs to the river of 1,682 tons, less than 4% entered as surface water inflows, 96% was derived from spring and diffuse groundwater inflows. The difference between the Santa Fe River nitrogen mass inputs and mass outflow to the Suwannee River indicated that in-stream nitrate nitrogen assimilation/dissimilation by chemical and biological processes was negligible.
Figure 23 presents the average nitrate-and-nitrite (NOx-N) levels measured at 50 locations along the Santa Fe River and 11 locations along the Ichetucknee. Segments 1 and 2 (SFR at Worthington Spring to COL930971) had values that were typically lower than the springs numeric nutrient standard of 0.35 mg/L, except for all springs stations in those segments, which ranged from 0.47 to 0.72 mg/L. NOx-N concentrations were generally highest in the spring boils, with the Gilchrist blue Spring Group having values typically above 2 mg/L, Ginnie Spring system ranging from 1.42 to 2.02 mg/L and Betty/Troop/Trail springs with very high concentrations ranging from 5 mg/L to more than 50 mg/L. Elevated NOx-N concentrations at Betty, Troop, and Trail springs may be attributed to their proximity to Alliance Dairy located only 1-2 miles to the south. The numeric nutrient limit for nitrate of 0.35 mg/L set by the Florida Department of Environmental Protection is represented by a grey dotted line on the graph.

Santa Fe River and Springs Quarterly Report (April 2018 –June 2019)
28
Figure 21. Mass balance schematic used to illustrate NOx-N in tons/year entering the Santa Fe River during
quarter 5 (April-June 2019)

Santa Fe River and Springs Quarterly Report (April 2018 –June 2019)
29
Figure 22. Nitrate measurements along the Santa Fe and Ichetucknee Rivers between April 2018 and June 2019.
00.5
11.5
22.5
33.5
44.5
55.5
66.5
77.5
88.5
99.510
SFR
at W
orth
ingt
on S
prin
gSF
R ab
ove
Olu
stee
Olu
stee
Cre
ekSF
R be
low
Olu
stee
Cre
ekSa
nta
Fe S
prin
gSF
R at
I-75
O'L
eno
Stat
e Pa
rkSa
nta
Fe R
iver
Rise
Horn
sby
Sprin
gHo
rnsb
y Sp
ring
Cano
e La
unch
SFR
at U
S-44
1 Br
idge
SFR
at U
S-27
SFR
abov
e Al
len
Sprin
gAl
len
Sprin
gPo
e Sp
ring
Poe
Sprin
g Ru
nSF
R be
low
Poe
Spr
ing
COL9
3097
1 Ru
nLi
ly S
prin
gPi
ckar
d Sp
ring
COL1
0197
1 Ru
nM
erm
aid
Sprin
gSF
R ab
ove
John
son
John
son
Sprin
gJo
hnso
n Sp
ring
Run
Rum
Isla
nd S
prin
gN
aked
Spr
ing
Nak
ed S
prin
g Ru
nGi
lchr
ist B
lue
Sprin
gGi
lchr
ist b
efor
e N
aked
Gilc
hrist
Blu
e Sp
ring
Run
Litt
le B
lue
Sprin
gSF
R be
low
Gilc
hrist
Blu
eLi
ttle
Dev
il Sp
ring
Devi
l's E
ye S
prin
gJu
ly S
prin
gGi
nnie
Spr
ing
Ginn
ie S
prin
g Ru
nSF
R at
SR-
47Co
w C
reek
at C
R 13
8W
ilson
Spr
ing
COL9
1797
1SF
R ab
ove
ICH
SFR
belo
w IC
HBe
tty
Sprin
gTr
ail S
prin
gSF
R at
US-
129
SFR
at 3
9th
Ave
Suw
anne
e Ri
ver a
bove
SFR
Suw
anne
e Ri
ver b
elow
SFR
Iche
tuck
nee
Head
Spr
ing
ICH
Cano
e La
unch
Ceda
r Hea
d Sp
ring
Run
Blue
Hol
e Sp
ring
ICH
belo
w B
lue
Hole
ICH
Mid
poin
tDa
mpi
er's
Land
ing
ICH
Tube
Tak
eout
LIR-
1LI
R-15
NO
x-N
(mg/
L)

Santa Fe River and Springs Quarterly Report (April 2018 –June 2019)
30
3.1.8 Detailed Water Chemistry Appendix A presents the results of water chemistry analysis of samples collected at 10 sites along the Santa Fe River and at 20 of its springs and tributaries. Samples collected were also analyzed for 71 priority herbicides, pesticides, and trace organic compounds. Table 3 presents average analyte detection results for the Santa Fe River and its springs. Boxes highlighted in blue present a value below the detection limit. These values were calculated by averaging all spring and all river values for the period of record.
Table 3. A comparison of average analyte concentrations at the Santa Fe River and spring stations (April 2018 through June 2019)
Analyte Units River Spring Analyte Units River Spring Analyte Units River Spring4,4'-DDD ng/L 4.43 4.12 Dicofol ng/L 31.25 31.96 Metribuzin ng/L 0.33 0.294,4'-DDE ng/L 4.43 4.12 Dieldrin ng/L 4.16 4.27 Mevinphos ng/L 0.49 0.484,4'-DDT ng/L 4.93 4.55 Dimethenamid ng/L 0.10 0.10 Mirex ng/L 2.08 2.14a-BHC ng/L 2.08 2.14 Disulfoton ng/L 0.49 0.48 Molinate ng/L 0.29 0.29Acesulfame K ng/L 0.10 0.10 Dithiopyr ng/L 0.10 0.10 Nitrate-Nitrite (N) mg/L 0.30 1.75Acetochlor ng/L 0.24 0.24 Endosulfan I ng/L 4.16 4.27 Nitrogen- Total Kjeldahl mg/L 0.87 0.29a-Chlordane ng/L 1.03 1.06 Endosulfan II ng/L 4.16 4.27 Norflurazon ng/L 0.49 0.48Alachlor ng/L 0.28 0.24 Endosulfan sulfate ng/L 2.08 2.14 NOX-N mg/L 0.24 1.95Aldrin ng/L 4.16 4.27 Endothall µg/L 0.25 0.25 Orthophosphate (P) mg/L 0.12 0.06Alkalinity, Total mg/L 57.18 150.31 Endothall-d6 µg/L 5.58 4.49 Oxadiazon ng/L 0.10 0.10Ametryn ng/L 0.38 0.36 Endrin ng/L 2.08 2.14 Parathion Ethyl ng/L 0.24 0.24Ammonia (N) mg/L 0.02 0.01 Endrin aldehyde ng/L 2.08 2.14 Parathion Methyl ng/L 0.32 0.29AMPA µg/L 0.10 0.10 Endrin Ketone ng/L 2.08 2.14 PCNB ng/L 34050.00 40062.50Arsenic µg/L 0.87 0.85 EPTC ng/L 1.22 1.20 Pendimethalin ng/L 0.97 0.97Atrazine ng/L 1.80 0.70 Ethalfluralin ng/L 3.13 3.20 Permethrin ng/L 10.33 10.61Atrazine Desethyl ng/L 1.46 1.50 Ethion ng/L 0.15 0.14 Phorate ng/L 0.24 0.24Azinphos Methyl ng/L 2.88 2.66 Ethoprop ng/L 0.10 0.10 Phosphorus- Total mg/L 0.16 0.07b-BHC ng/L 5.69 5.49 Fenamiphos ng/L 0.30 0.28 Potassium mg/L 0.96 1.10Bifenthrin ng/L 4.20 4.25 Fipronil ng/L 0.24 0.24 Prodiamine ng/L 0.17 0.17Boron µg/L 17.27 14.81 Fipronil Desulfinyl ng/L 0.12 0.12 Prometon ng/L 0.88 0.87Bromacil ng/L 0.49 0.49 Fipronil Sulfide ng/L 0.15 0.14 Prometryn ng/L 0.19 0.19Butylate ng/L 0.39 0.39 Fipronil Sulfone ng/L 0.15 0.16 Residues- Filterable (TDS) mg/L 150.95 208.02Calcium mg/L 27.24 62.66 Fluoride mg/L 0.10 0.12 Residues- Nonfilterable (TS mg/L 3.07 2.10Carbon- Organic mg/L 26.63 5.01 Fonofos ng/L 0.19 0.19 Simazine ng/L 0.50 0.49Carbophenothion ng/L 6.28 5.79 g-BHC ng/L 5.69 5.44 Simazine-d10 ng/L 19391.67 19537.50Chlordane ng/L 3.65 3.41 g-Chlordane ng/L 1.03 1.06 Sodium mg/L 5.58 4.90Chloride mg/L 9.72 8.61 Glufosinate µg/L 0.10 0.10 Sucralose µg/L 0.07 0.05Chlorothalonil ng/L 2.08 2.14 Glyphosate µg/L 0.10 0.10 Sucralose-d6 ng/L 5.38 5.11Chlorpyrifos Ethyl ng/L 0.24 0.24 Glyphosate 13C 15N µg/L 5.04 4.10 Sulfate mg/L 11.90 16.69Chlorpyrifos Methyl ng/L 0.10 0.10 Hardness- Calculated mg/L 85.86 185.07 Tebuconazole ng/L 0.48 0.49Cis-Nonachlor ng/L 1.03 1.10 Heptachlor ng/L 1.57 1.61 Terbufos ng/L 0.10 0.10Color (true) µg/L 323.00 52.54 Heptachlor epoxide ng/L 2.08 2.14 Terbufos-d10 ng/L 19750.00 18587.50Copper µg/L 0.46 0.28 Hexachlorobenzene ng/L 2.10 2.10 Terbuthylazine ng/L 0.42 0.41Cyanazine ng/L 1.16 0.95 Hexazinone ng/L 0.74 0.58 Tetrachloro-m-xylene ng/L 24108.33 28493.75Cypermethrin ng/L 20.75 21.43 Iron ng/L 745.00 138.21 Toxaphene ng/L 31.25 31.96d-BHC ng/L 5.69 5.44 Magnesium mg/L 4.33 6.94 Trans-Nonachlor ng/L 1.03 1.10Decachlorobiphenyl ng/L 27358.33 31450.00 Malathion ng/L 0.34 0.34 Trifluralin ng/L 1.43 1.33Demeton ng/L 3.16 2.77 Metalaxyl ng/L 0.26 0.25 Turbidity NTU 2.43 0.58Diazinon ng/L 0.12 0.12 Methoxychlor ng/L 4.16 4.27 Zinc µg/L 5.42 5.06
Metolachlor ng/L 2.07 0.77

Santa Fe River and Springs Quarterly Report (April 2018 –June 2019)
31
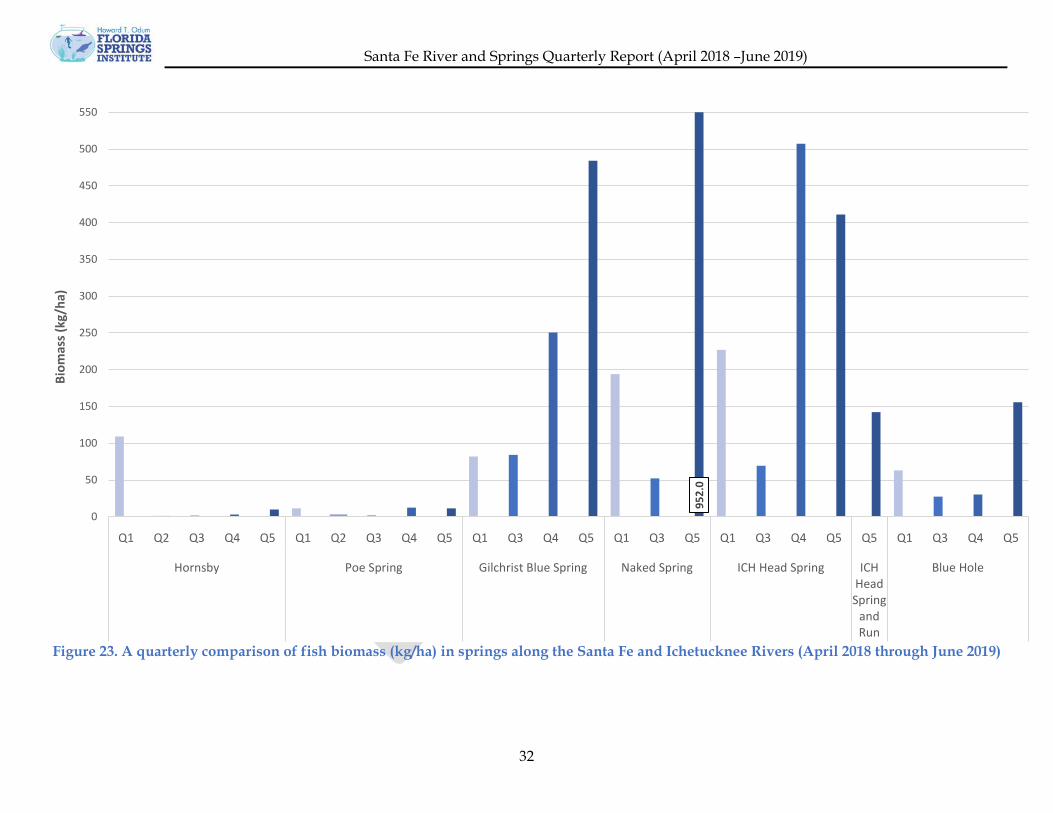
3.2 Biology 3.2.1 Fish Table 4 presents the results from seasonal data from fish counts during ecological and biological monitoring in seven Santa Fe River and Ichetucknee River springs. Overall, when comparing fish biomass in the presented springs and rivers, quarters 2 and 3 (July-Sept and Oct-Dec) typically had the lowest biomass. Quarters 1, 4 and 5 had higher biomass values. During the April-June (Q1 and Q5) fish surveys, many juvenile fish were counted after spawning events occurred. Quarter 5 had counts in the thousands which may be due to the spawning events, as well as increased experience in the research team conducting the counts.
Figure 24 illustrates the changes in biomass in each system throughout the year.
Detailed fish data for quarters 1-5 can be found in Appendix B.
Table 4. Seasonal fish counts, densities and biomass for various springs along the Santa Fe and Ichetucknee Rivers (April 2018 through June 2019)
Location Quarter Number of Fish Total Density (#/ha) Total Biomass (kg/ha)1 810 3,830 109.22 459 2,170 1.43 154 728 1.54 380 1,797 3.15 3,206 15,158 10.11 216 1,520 11.52 399 2,808 3.23 11 77 1.84 70 493 12.45 318 2,238 11.51 1,939 3,413 82.03 3,027 5,327 84.24 1,064 1,873 250.75 18,929 89,066 484.11 746 3,715 194.03 328 1,633 52.35 10,831 92,257 952.01 419 5,828 227.13 244 3,394 69.44 445 6,189 507.25 2,218 30,848 410.9
Ichetucknee Head Spring and Run 5 9,715 10,447 142.41 796 1,013 63.13 217 276 27.34 447 569 30.45 3,335 10,205 155.8
Hornsby
Poe Spring
Blue Hole
ICH Head Spring
Gilchrist Blue Spring
Naked Spring
Santa Fe River and Springs Quarterly Report (April 2018 –June 2019)
32
Figure 23. A quarterly comparison of fish biomass (kg/ha) in springs along the Santa Fe and Ichetucknee Rivers (April 2018 through June 2019)
952.
0
0
50
100
150
200
250
300
350
400
450
500
550
Q1 Q2 Q3 Q4 Q5 Q1 Q2 Q3 Q4 Q5 Q1 Q3 Q4 Q5 Q1 Q3 Q5 Q1 Q3 Q4 Q5 Q5 Q1 Q3 Q4 Q5
Hornsby Poe Spring Gilchrist Blue Spring Naked Spring ICH Head Spring ICHHeadSpring
andRun
Blue Hole
Biom
ass (
kg/h
a)
Santa Fe River and Springs Quarterly Report (April 2018 –June 2019)
33
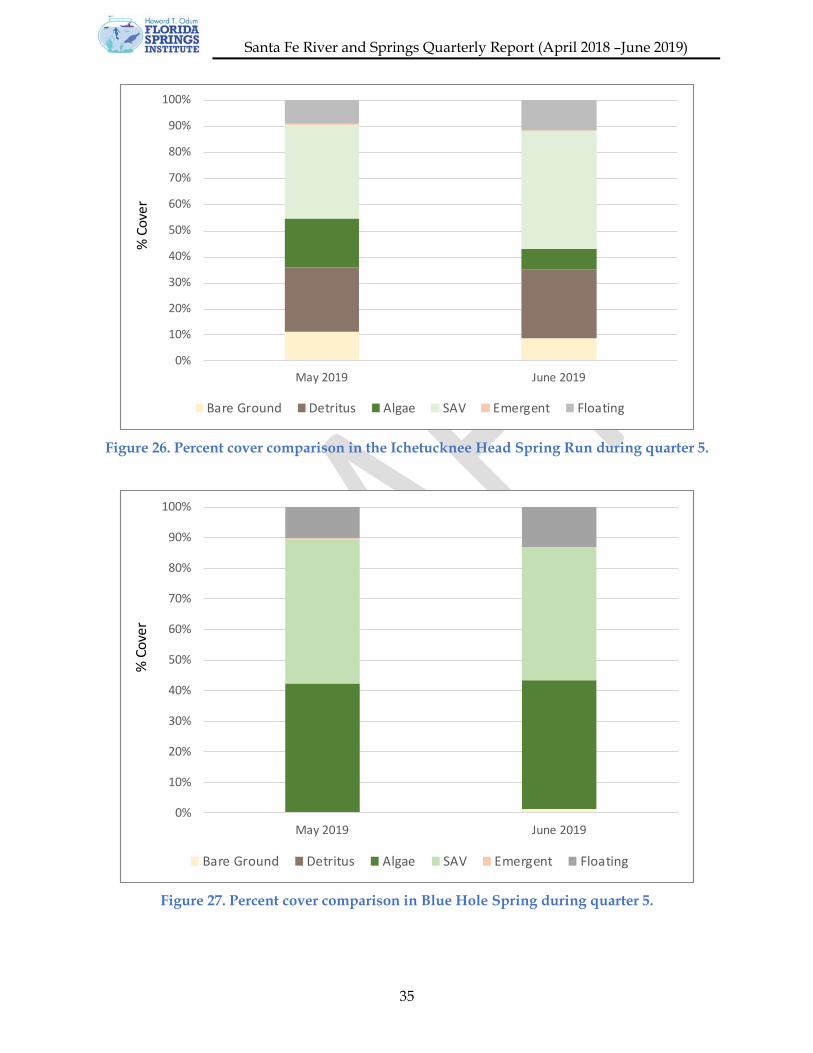
3.2.2 Vegetation Figure 25 through Figure 29 present the results of vegetation surveys conducted along transects at Gilchrist Blue, Naked, Blue Hole, Poe springs as well as a portion of the Ichetucknee River. Observations have been divided into six categories: detritus, bare ground (sand, rocks, roots, etc.), algae, submerged aquatic vegetation (SAV), emergent vegetation, and floating vegetation.
Figure 25 illustrates the vegetation shift observed in Gilchrist Blue Spring from April to June. The algae cover decreased from 30% in April to 11.8% in June, with detritus increasing from to 15% in April to 32% in June. With SAV ranging from only 12.7 to 15.8%, algae, bare ground and detritus dominate the system.
Naked Spring (Figure 26) is heavily dominated by detritus. The algae cover has ranged between 11 and 23%. During quarters 3 and 4, Naked experienced heavy rain and downed trees due to storms. The detritus build-up is most likely due to submerged trees lying within the spring for an extended period. The algae cover may have decreased from 23 to 11% due to the removal of the mentioned trees, and disturbance of the spring bottom during the work.
Figure 27 illustrates the shift of percent cover in the Ichetucknee Head Spring and its run to below the confluence of Blue Hole Spring. The presence of bare ground, detritus and floating vegetation (duckweed) remains constant throughout May and June, and we see an increase in SAV and decrease in algae. As rainfall increased, the run became deeper as water levels rose, thus reducing the amount of foot traffic in the spring run. SAV had the chance to begin recovering from the disturbances. Percent cover in Blue Hole Spring (Figure 28) consisted mostly of SAV, algae, and floating vegetation (duckweed). Due to the depth and high discharge of the spring, foot traffic is not common, possibly contributing to the relatively high cover of strap-leaf sagittaria. The observed algal cover in Blue Hole is primarily epiphytic with excessive growth covering much of the native SAV.
Poe Spring (Figure 29) is biologically depauperate. Although nitrates are low, emergent, submerged and floating vegetation were not recorded during this study period. The proportions of bare ground, detritus and algae changed very little from May to June.

Santa Fe River and Springs Quarterly Report (April 2018 –June 2019)
34
Figure 24. Percent cover comparison in Gilchrist Blue Spring during quarter 5.
Figure 25. Percent cover comparison in Naked Spring during quarter 5.
0%
10%
20%
30%
40%
50%
60%
70%
80%
90%
100%
April 2019 May 2019 June 2019
% C
over
Bare Ground Detritus Algae SAV Emergent Floating
0%
10%
20%
30%
40%
50%
60%
70%
80%
90%
100%
April 2019 May 2019 June 2019
% C
over
Bare Ground Detritus Algae SAV Emergent Floating
Santa Fe River and Springs Quarterly Report (April 2018 –June 2019)
35
Figure 26. Percent cover comparison in the Ichetucknee Head Spring Run during quarter 5.
Figure 27. Percent cover comparison in Blue Hole Spring during quarter 5.
0%
10%
20%
30%
40%
50%
60%
70%
80%
90%
100%
May 2019 June 2019
% C
over
Bare Ground Detritus Algae SAV Emergent Floating
0%
10%
20%
30%
40%
50%
60%
70%
80%
90%
100%
May 2019 June 2019
% C
over
Bare Ground Detritus Algae SAV Emergent Floating

Santa Fe River and Springs Quarterly Report (April 2018 –June 2019)
36
Figure 28. Percent cover comparison in Poe Spring during quarter 5.
0%
10%
20%
30%
40%
50%
60%
70%
80%
90%
100%
May 2019 June 2019
% C
over
Bare Ground Detritus Algae SAV Emergent Floating
Santa Fe River and Springs Quarterly Report (April 2018 –June 2019)
37
3.2.3 Human Use Figure 30 through Figure 41 illustrate weekday and weekend comparisons of human use of three major springs systems. Each figure contains a graph comparing in water vs out of water activity at each 15-minute interval as well as two detailed graphs specifying the specific activities taking place in and out of water.
Gilchrist Blue Spring was monitored twice during the week (Figure 30 and Figure 32) and once during the weekend (Figure 31). During the weekday monitoring, the maximum number of guests ranged from 60-75 while the Sunday survey had more than 300 guests enjoying the state park. During the weekdays, more out of water activity activities were taking place with most park guests sitting and walking along the spring. As for weekday in water activities, guests were mostly wading or swimming. Weekend use was evenly split between in water and out of water activities. Throughout the day, most guests were wading, sitting or walking.
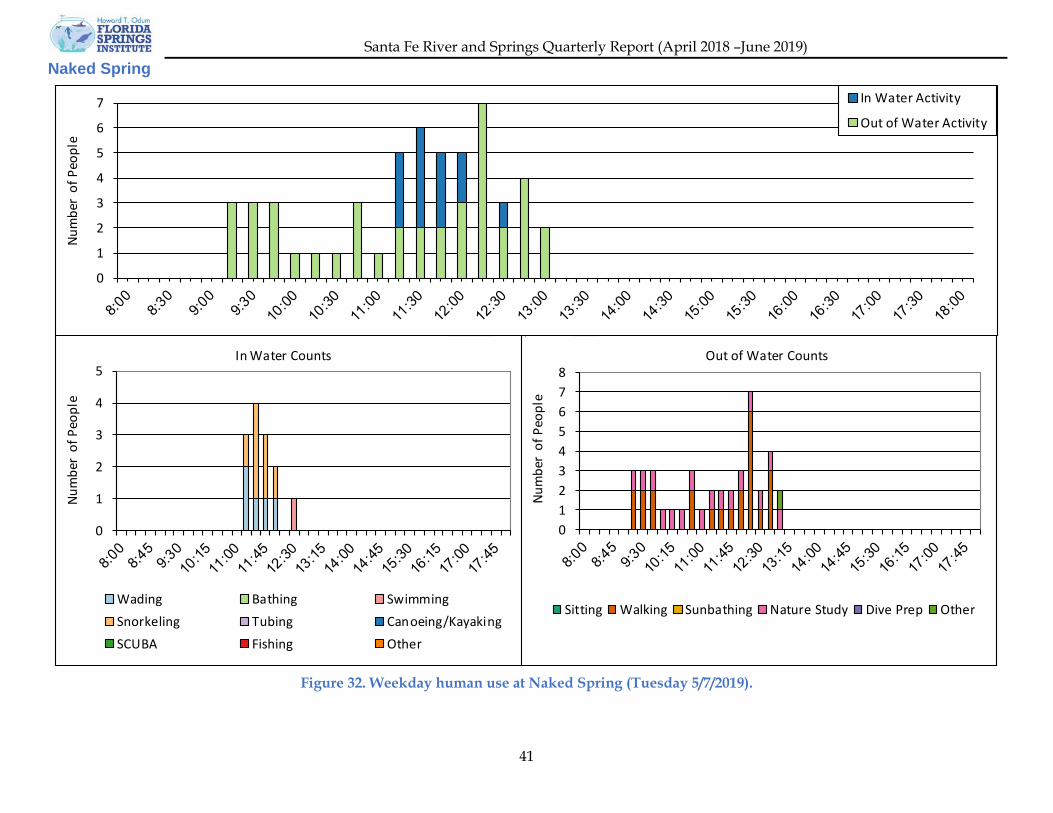
Naked Spring was monitored during May and June. During the weekday survey (Figure 33) the maximum number of people in or near the spring was 7, while the weekend survey (Figure 34) recorded over 30 people. The Naked Spring survey area is approximately 0.064 hectares (98% smaller than the Gilchrist blue Spring system), so fewer people are expected to be at the spring. During the weekday survey, in water activities were observed for just over an hour. Out of water activities were observed throughout the 3 hours and 45 minutes, with most people walking to and along the spring. During the weekend, more people were observed in the water mostly wading, bathing and tubing.
Ichetucknee Head Spring human use data was collected in May and June. During the weekday survey (Figure 35) a maximum of just over 30 people were observed in or around the spring during a 15 minute interval, while the weekend surveyor counted more than 125 people utilizing the spring at a given time (Figure 36). For both days, an increase in guests began as late as 12:30. During the weekend, ~70% of people were observed in the water wading, bathing and swimming,
Blue Hole Spring was surveyed in May and June. During the weekday survey (Figure 37) a maximum of 15 people were observed during a survey interval, while the weekend survey Figure 38) had almost 45 people in or around the spring. During the Wednesday survey, in water activity was observed for only one hour of the five-hour survey with only wading, swimming, snorkeling, and kayak/canoeing occurring. As for the out of water activity, mostly the FSI science team and fellow nature observers were recorded around the spring. During the weekend, out of water activity was most observed with most people walking to or from the spring.
Poe Spring was surveyed during two weekdays (Figure 39 and Figure 40) and one weekend day (Figure 41). During the weekdays, human use maxed out at 23-44 people in/around the spring, while during the weekend almost 200 people were at/in the spring. During the weekend, in water and out of water use was split 50/50 with most people wading, sitting and walking. Gilchrist Blue Spring had only 100 more people during its weekend survey which is surprising due to the popularity and size of the human use area.

Santa Fe River and Springs Quarterly Report (April 2018 –June 2019)
38
Gilchrist Blue Spring
Figure 29. Weekday human use at Gilchrist Blue Spring (Friday 4/26/2019).
0
25
50
75Nu
mbe
r of
Peo
ple
In Water Activity
Out of Water Activity
05
10152025303540
Num
ber
of P
eopl
e
In Water Counts
Wading Bathing SwimmingSnorkeling Tubing Canoeing/KayakingSCUBA Fishing Other
05
1015202530354045
Num
ber
of P
eopl
e
Out of Water Counts
Sitting Walking Sunbathing Nature Study Dive Prep Other

Santa Fe River and Springs Quarterly Report (April 2018 –June 2019)
39
Figure 30. Weekend human use at Gilchrist Blue Spring (Sunday 6/2/2019).
0
50
100
150
200
250
300
350Nu
mbe
r of
Peo
ple
In Water Activity
Out of Water Activity
020406080
100120140160
Num
ber
of P
eopl
e
In Water Counts
Wading Bathing SwimmingSnorkeling Tubing Canoeing/KayakingSCUBA Fishing Other
020406080
100120140160180200
Num
ber
of P
eopl
e
Out of Water Counts
Sitting Walking Sunbathing Nature Study Dive Prep Other

Santa Fe River and Springs Quarterly Report (April 2018 –June 2019)
40
Figure 31. Weekday human use at Gilchrist Blue Spring (Wednesday 6/12/2019).
0
10
20
30
40
50
60Nu
mbe
r of
Peo
ple
In Water Activity
Out of Water Activity
0
5
10
15
20
25
30
Num
ber
of P
eopl
e
In Water Counts
Wading Bathing SwimmingSnorkeling Tubing Canoeing/KayakingSCUBA Fishing Other
0
10
20
30
40
50
60
Num
ber
of P
eopl
e
Out of Water Counts
Sitting Walking Sunbathing Nature Study Dive Prep Other
Santa Fe River and Springs Quarterly Report (April 2018 –June 2019)
41
Naked Spring
Figure 32. Weekday human use at Naked Spring (Tuesday 5/7/2019).
0
1
2
3
4
5
6
7
Num
ber
of P
eopl
e
In Water Activity
Out of Water Activity
0
1
2
3
4
5
Num
ber
of P
eopl
e
In Water Counts
Wading Bathing SwimmingSnorkeling Tubing Canoeing/KayakingSCUBA Fishing Other
012345678
Num
ber
of P
eopl
e
Out of Water Counts
Sitting Walking Sunbathing Nature Study Dive Prep Other

Santa Fe River and Springs Quarterly Report (April 2018 –June 2019)
42
Figure 33. Weekend human use at Naked Spring (Saturday 6/22/2019).
0
5
10
15
20
25
30
35Nu
mbe
r of
Peo
ple
In Water Activity
Out of Water Activity
0
5
10
15
20
25
Num
ber
of P
eopl
e
In Water Counts
Wading Bathing SwimmingSnorkeling Tubing Canoeing/KayakingSCUBA Fishing Other
02468
1012141618
Num
ber
of P
eopl
e
Out of Water Counts
Sitting Walking Sunbathing Nature Study Dive Prep Other

Santa Fe River and Springs Quarterly Report (April 2018 –June 2019)
43
Ichetucknee Head Spring
Figure 34. Weekday human use at Ichetucknee Head Spring (Wednesday 5/8/2019).
0
5
10
15
20
25
30
35Nu
mbe
r of
Peo
ple
In Water Activity
Out of Water Activity
0
5
10
15
20
Num
ber
of P
eopl
e
In Water Counts
Wading Bathing Swimming
Snorkeling Tubing Canoeing/Kayaking
SCUBA Fishing Other
0
5
10
15
20
25
Num
ber
of P
eopl
e
Out of Water Counts
Sitting Walking Sunbathing Nature Study Dive Prep Other

Santa Fe River and Springs Quarterly Report (April 2018 –June 2019)
44
Figure 35. Weekend human use at Ichetucknee Head Spring (Saturday 6/1/2019).
0
25
50
75
100
125
150Nu
mbe
r of
Peo
ple
In Water Activity
Out of Water Activity
0
20
40
60
80
100
120
Num
ber
of P
eopl
e
In Water Counts
Wading Bathing SwimmingSnorkeling Tubing Canoeing/KayakingSCUBA Fishing Other
05
10152025303540
Num
ber
of P
eopl
e
Out of Water Counts
Sitting Walking Sunbathing Nature Study Dive Prep Other
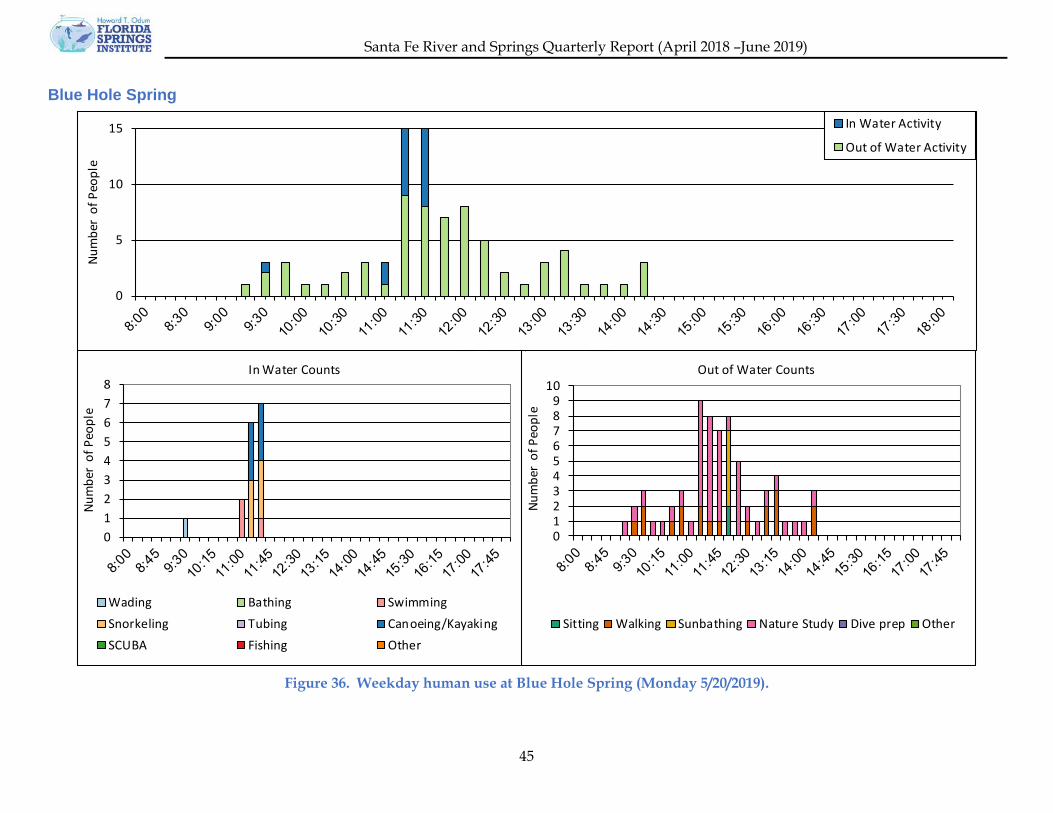
Santa Fe River and Springs Quarterly Report (April 2018 –June 2019)
45
Blue Hole Spring
Figure 36. Weekday human use at Blue Hole Spring (Monday 5/20/2019).
0
5
10
15
Num
ber
of P
eopl
e
In Water Activity
Out of Water Activity
012345678
Num
ber
of P
eopl
e
In Water Counts
Wading Bathing SwimmingSnorkeling Tubing Canoeing/KayakingSCUBA Fishing Other
0123456789
10
Num
ber
of P
eopl
e
Out of Water Counts
Sitting Walking Sunbathing Nature Study Dive prep Other
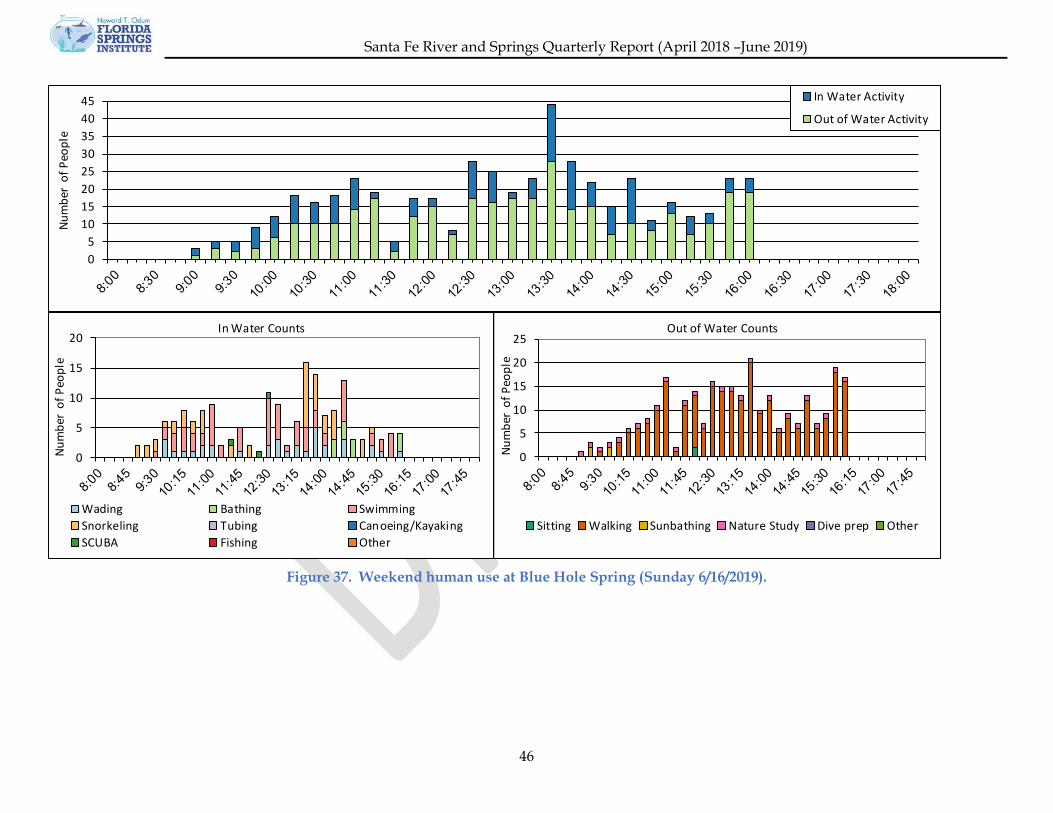
Santa Fe River and Springs Quarterly Report (April 2018 –June 2019)
46
Figure 37. Weekend human use at Blue Hole Spring (Sunday 6/16/2019).
05
1015202530354045
Num
ber
of P
eopl
e
In Water Activity
Out of Water Activity
0
5
10
15
20
Num
ber
of P
eopl
e
In Water Counts
Wading Bathing SwimmingSnorkeling Tubing Canoeing/KayakingSCUBA Fishing Other
0
5
10
15
20
25
Num
ber
of P
eopl
e
Out of Water Counts
Sitting Walking Sunbathing Nature Study Dive prep Other

Santa Fe River and Springs Quarterly Report (April 2018 –June 2019)
47
Poe Spring
Figure 38. Weekday human use at Poe Springs (Wednesday 5/22/2019).
0
5
10
15
20
25
30
35Nu
mbe
r of
Peo
ple
In Water Activity
Out of Water Activity
0
2
4
6
8
10
12
14
Num
ber
of P
eopl
e
In Water Counts
Wading Bathing SwimmingSnorkeling Tubing Canoeing/KayakingSCUBA Fishing Other
02468
1012141618
Num
ber
of P
eopl
e
Out of Water Counts
Sitting Walking Sunbathing Nature Study Dive prep Other

Santa Fe River and Springs Quarterly Report (April 2018 –June 2019)
48
Figure 39. Weekday human use at Poe Springs (Tuesday 6/4/2019).
05
1015202530354045
Num
ber
of P
eopl
eIn Water Activity
Out of Water Activity
0
5
10
15
20
25
Num
ber
of P
eopl
e
In Water Counts
Wading Bathing SwimmingSnorkeling Tubing Canoeing/KayakingSCUBA Fishing Other
0
5
10
15
20
25
30
Num
ber
of P
eopl
e
Out of Water Counts
Sitting Walking Sunbathing Nature Study Dive Prep Other

Santa Fe River and Springs Quarterly Report (April 2018 –June 2019)
49
Figure 40. Weekend human use at Poe Springs (Sunday 6/23/2019).
0255075
100125150175200
Num
ber
of P
eopl
eIn Water Activity
Out of Water Activity
0
20
40
60
80
100
120
Num
ber
of P
eopl
e
In Water Counts
Wading Bathing SwimmingSnorkeling Tubing Canoeing/KayakingSCUBA Fishing Other
0
20
40
60
80
100
Num
ber
of P
eopl
e
Out of Water Counts
Sitting Walking Sunbathing Nature Study Dive Prep Other

Santa Fe River and Springs Quarterly Report (April 2018 –June 2019)
50
References
Copeland, B. J. and W. R. Duffer. 1964. Use of a clear plastic dome to measure gaseous diffusion rates in natural waters. Limnology and Oceanography 9:494-499. Odum, H.T. 1957a. Trophic Structure and Productivity of Silver Springs, Florida. Ecological Monographs. Volume 27 (1): 55-112. Odum, H.T. 1957b. Primary Production Measurements in Eleven Florida Springs and a Marine Turtle-Grass Community. Limnology and Oceanography 2:85-97. Schneider, J.C., P.W. Larrman, and H. Gowing. 2000. Length-weight relationships, Chapter 17, In Schneider, J.C. [Ed.] Manual of Fisheries Survey Methods II: With Periodic Updates. Michigan Department of Natural Resources, Fisheries Special Report 25, Ann Arbor, MI. Wetzel, R.G. 2001. Limnology: Lake and River Ecosystems. 3rd Ed. Academic Press, San Diego, CA.
Zar, J.H. 1984. Biostatistical analysis. 2nd ed. Englewood Cliffs, NJ: Prentice-Hall. 130 p.

Santa Fe River and Springs Quarterly Report (April 2018 –June 2019)
51
Appendix A Detailed Water Chemistry
Santa Fe River Sites Detailed Chemical Analysis - April 16, 2018
GROUP PARAMETER UNITS O'Leno State Park
Santa Fe River
Rise
SFR above
ICH
SFR at 39th Ave
SFR at I-75
SFR at US 129
SFR at US 27
SFR at US 47
SFR at US-441 Bridge
SFR at Worthington
Spring DISSOLVED
OXYGEN DO % 70.5 64.6 64.8 64.6 69.5 65.8 65.7 60.0 62.6 67.8 DO mg/L 6.51 5.89 5.96 5.93 6.42 6.05 6.06 5.50 5.73 6.36
GENERAL INORGANIC Alk
mg/L as CaCO3 8.50 12.0 84.0 100 8.60 96.0 36.0 83.0 44.0 9.10
Cl-T mg/L 9.90 9.40 8.90 8.20 9.70 8.60 9.60 9.30 10.0 10.0 A F-T mg/L 0.077 I 0.084 I 0.110 0.110 0.077 I 0.110 0.100 0.110 0.110 0.076 I
Hardness mg/L as CaCO3 28.8 33.6 115 131 28.3 124 60.2 112 73.3 28.9
SO4 mg/L 6.10 3.80 12.0 13.0 4.70 13.0 9.50 12.0 12.0 2.3 A GENERAL ORGANIC TOC mg/L 36.0 34.0 18.0 14.0 36.0 15.0 29.0 19.0 27.0 36.0
METAL Ca-T mg/L 7.47 9.20 38.1 44.3 7.34 41.1 18.4 36.9 22.7 7.48 K-T mg/L 1.2 I 1.20 1 I 1.1 I 1.1 I 0.95 I 1.2 I 1.1 I 1.2 I 1.2 I Mg-T mg/L 2.46 2.59 4.74 5.03 2.43 5.07 3.46 4.71 4.04 2.49 Na-T mg/L 5.40 5.10 5.00 4.60 5.30 4.90 5.20 5.10 5.60 5.60
NITROGEN NH4-N mg/L 0.012 0.012 0.008 0.010 0.013 0.010 0.010 0.008 0.010 0.014 NOx-N mg/L 0.024 0.020 0.430 0.570 0.026 0.480 0.085 0.460 0.110 0.052 TKN mg/L 1.20 1.10 0.680 0.570 1.10 0.610 0.980 0.700 0.880 1.20
PHOSPHORUS OrthoP mg/L 0.160 0.160 0.120 0.110 0.160 0.110 0.160 0.130 0.150 0.150 TP mg/L 0.210 0.230 0.160 0.140 0.200 0.140 0.210 0.160 0.190 0.210
PHYSICAL Color PCU 420 420 230 170 460 190 360 240 350 430 pH SU 6.63 J 6.97 J 7.38 J 7.39 J 6.71 J 7.47 J 7.15 J 7.29 J 7.52 J 6.68 J SpCond umhos/cm 71.1 78.5 224 251 72.0 249 130 221 156 74.7 Turb NTU 2.70 2.60 2.00 1.80 2.60 1.90 2.60 1.90 2.30 3.2 A
SOLID TDS mg/L 106 115 160 174 114 174 134 170 142 A 114 TSS mg/L 2 U 3 I 4 I 4 I 3 I 4 I 4 I 3 I 4 IA 2 I
TEMPERATURE Wtr Temp C 19.2 19.8 19.4 19.5 19.2 19.4 19.3 19.6 19.7 18.4

Santa Fe River and Springs Quarterly Report (April 2018 –June 2019)
52
Santa Fe River Springs and Tributaries Detailed Chemical Analysis - May 15, 2018
GROUP PARAMETER UNITS
Cow Creek at CR 138
Gilchrist Blue
Spring
Ginnie Spring
Hornsby Spring
Johnson Spring
Little Devil
Spring
Olustee Creek
Poe Spring
Rum Island Spring
Santa Fe
Spring
DISSOLVED OXYGEN DO % 71.6 58.2 43.3 4.80 52.0 50.2 57.9 9.70 36.9 5.40
DO mg/L 6.25 5.01 3.76 0.410 4.49 4.34 4.91 0.840 3.20 0.470
GENERAL INORGANIC Alk mg/L as CaCO3 192 170 A 149 A 160 179 156 29.0 188 187 144
Cl-T mg/L 5.40 6.60 6.00 12.0 7.20 6.10 14.0 12.0 8.70 9.60
F-T mg/L 0.056 I 0.096 I 0.087 I 0.170 0.110 0.087 I 0.110 0.120 0.120 0.250
Hardness mg/L as CaCO3 212 198 176 213 214 182 48.5 213 221 184
SO4 mg/L 0.21 I 11.0 10.0 36.0 14.0 9.30 4.70 15.0 16.0 31.0
TOC mg/L 11.0 0.5 U 0.5 U 2.80 0.5 U 0.5 U 27.0 1.80 0.71 I 3.60 METAL Ca-T mg/L 81.3 68.1 61.2 71.7 73.0 63.0 12.5 75.2 76.0 55.0
K-T mg/L 0.32 I 0.54 I 0.45 I 1.1 I 0.6 I 0.5 I 1.50 0.84 I 0.7 I 0.82 I
Mg-T mg/L 2.30 6.90 5.58 8.21 7.60 5.90 4.19 6.20 7.46 11.3
Na-T mg/L 2.90 3.20 2.90 8.00 3.60 3.00 7.60 7.10 4.60 6.00 NITROGEN NH4-N mg/L 0.084 0.002 I 0.002 U 0.002 U 0.002 U 0.005 I 0.052 0.002 U 0.002 U 0.008
NOx-N mg/L 0.072 2.40 1.70 0.540 2.40 2.00 0.300 0.230 1.70 0.590
TKN mg/L 0.460 0.09 I 0.08 U 0.12 I 0.098 I 0.13 I 0.940 0.13 I 0.12 I 0.17 I PHOSPHORUS OrthoP mg/L 0.055 0.034 0.034 0.093 0.041 0.038 0.160 0.082 0.055 0.120
TP mg/L 0.067 0.034 0.034 0.088 0.038 0.039 0.210 0.078 0.053 0.120 PHYSICAL Color CPU 67 A 2.5 U 2.5 U 18.0 2.5 U 2.5 U 250 6.90 3.2 I 30.0
pH SU 7.76 7.61 7.61 7.17 7.60 7.68 6.94 7.27 7.46 7.34
SpCond umhos/cm 326 384 339 425 410 349 124 429 424 374
Stage ft 25.3 Turb NTU 0.083 0.150 0.250 0.150 0.200 0.450 2.10 0.200 0.150 0.300
SOLID TDS mg/L 229 196 184 238 A 223 178 115 229 234 A 217
TSS mg/L 2 I 2 I 2 U 2 U 2 I 2 I 2 I 2 I 2 UA 2 I TEMPERATURE Wtr Temp C 22.0 22.7 22.4 22.5 22.6 22.5 23.6 22.4 22.6 21.7

Santa Fe River and Springs Quarterly Report (April 2018 –June 2019)
53
Santa Fe River Springs and Tributaries Detailed Chemical Analysis - June 13 and 14, 2018
GROUP PARAMETER UNITS Gilchrist
Blue Spring Run
Johnson Spring
Poe Spring
Wilson Spring
Blue Hole Spring
Cedar Head Spring Run
ICH Midpoint
Launch
ICH Tube
Takeout
ICH Head Spring LIR-15
DISSOLVED OXYGEN DO % 57.2 50.8 9.10 3.10 28.7 48.5 73.8 96.3 47.3 67.6
DO mg/L 4.92 4.39 0.790 0.280 2.52 4.25 6.38 8.22 4.15 5.85
GENERAL INORGANIC Alk mg/L
CaCO3 171 176 187 141 145 153 149 145 154 152
Cl-T mg/L 6.60 7.10 12.0 12.0 5.30 4.90 6.20 6.10 4.40 6.10
F-T mg/L 0.100 0.110 0.130 0.190 0.120 0.110 0.140 0.140 0.100 0.140
Hardness mg/L
CaCO3 214 224 223 221 169 181 176 176 186 177
SO4 mg/L 12.0 14.0 14.0 55.0 4.80 5.80 9.50 10.0 8.60 11.0
TOC mg/L 0.5 U 0.5 U 1.80 3.00 0.5 U 0.5 U 0.52 I 0.55 I 0.5 U 0.7 I METAL As-T ug/L 0.4 0.4 1.7 1.1 0.8 0.8 1.1 1.1 0.5 1.1
B-T ug/L 12.500 13.000 20.10 15.50 10.800 10.400 12.00 11.70 9.900 11.80
Ca-T mg/L 0,073 0,077 0,079 0,070 0,058 0,062 0,059 0,059 0,063 0,059
Cu-T ug/L 0.2 U 0.2 U 0.2 U 0.2 U 0.2 U 0.2 U 0.2 U 0.2 U 0.2 U 0.2 U
Fe-T ug/L 30 U 30 U 30 U 30 U 30 U 30 U 40 I 43 I 30 U 30 U
K-T mg/L 0.6 I 0.63 I 0.89 I 0.71 I 0.43 I 0.3 U 0.47 I 0.45 I 0.3 U 0.46 I
Na-T mg/L 3.50 3.90 7.40 7.60 3.30 2.90 4.10 4.10 2.60 4.10
Mg-T mg/L 0,008 0,008 0,007 0,011 0,006 0,006 0,007 0,007 0,007 0,007
Zn-T ug/L 5 U 5 U 5 U 5 U 5 U 5 U 5 U 5 U 5 U 5 U NITROGEN NH4-N mg/L 0.002 U 0.002 U 0.002 U 0.003 I 0.006 0.003 I 0.008 0.007 0.002 U 0.007
NOx-N mg/L 2.40 2.30 0.220 0.570 0.790 0.870 0.580 0.530 0.810 0.540
TKN mg/L 0.08 U 0.08 UJ 0.200 0.230 0.08 I 0.096 I 0.11 I 0.12 IJ 0.094 I 0.12 I PHOSPHORUS OrthoP mg/L 0.040 0.038 0.083 0.090 0.044 0.032 0.045 0.043 0.022 0.041
TP mg/L 0.039 0.036 0.085 0.099 0.045 0.034 0.057 0.056 0.026 0.048 PHYSICAL pH SU 7.41 7.38 7.27 7.26 7.57 7.53 7.82 8.02 7.51 7.71
Color PCU 2.5 U 2.5 U 10.0 26.0 2.5 U 2.5 U 2.5 U 2.5 U 2.5 U 2.5 U
SpCond umhos/cm 402 421 439 439 325 341 338 337 350 345
Turb NTU 1.20 0.1 U 0.300 0.250 0.600 0.400 0.700 0.350 0.350 0.250 TEMPERATURE Wtr Temp C 22.9 22.7 22.6 21.7 21.7 21.8 22.6 23.2 21.9 22.5
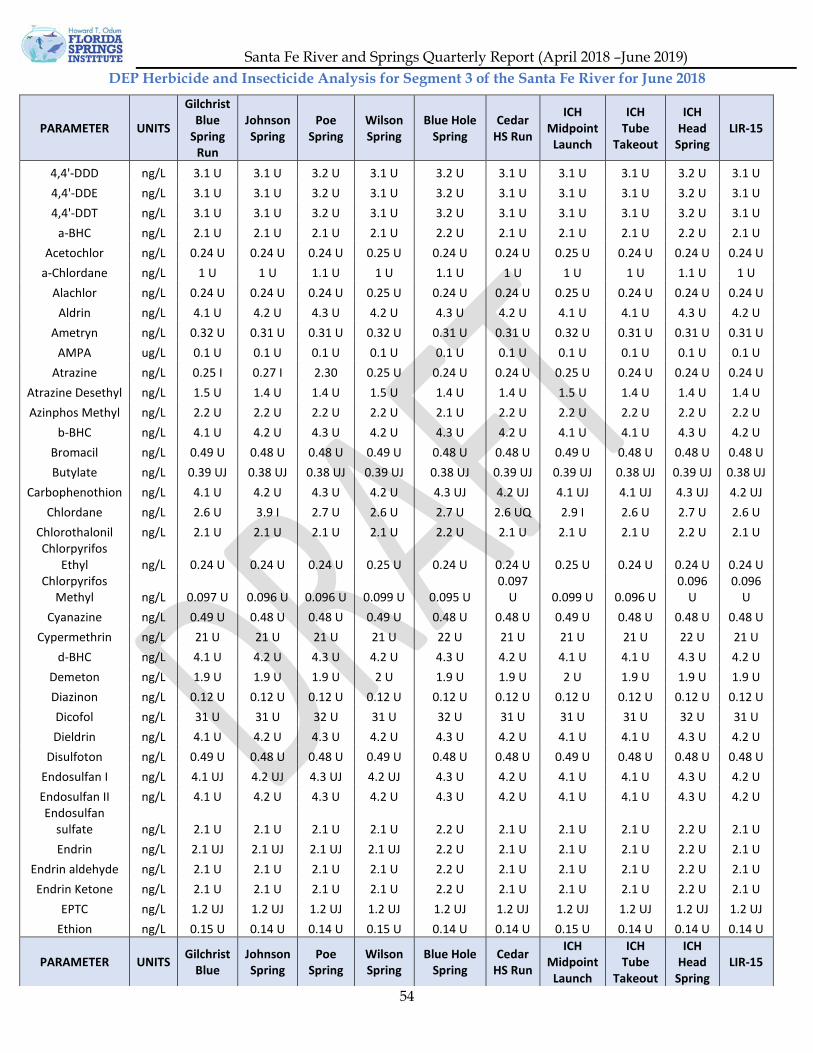
Santa Fe River and Springs Quarterly Report (April 2018 –June 2019)
54
DEP Herbicide and Insecticide Analysis for Segment 3 of the Santa Fe River for June 2018
PARAMETER UNITS
Gilchrist Blue
Spring Run
Johnson Spring
Poe Spring
Wilson Spring
Blue Hole Spring
Cedar HS Run
ICH Midpoint
Launch
ICH Tube
Takeout
ICH Head
Spring LIR-15
4,4'-DDD ng/L 3.1 U 3.1 U 3.2 U 3.1 U 3.2 U 3.1 U 3.1 U 3.1 U 3.2 U 3.1 U 4,4'-DDE ng/L 3.1 U 3.1 U 3.2 U 3.1 U 3.2 U 3.1 U 3.1 U 3.1 U 3.2 U 3.1 U 4,4'-DDT ng/L 3.1 U 3.1 U 3.2 U 3.1 U 3.2 U 3.1 U 3.1 U 3.1 U 3.2 U 3.1 U
a-BHC ng/L 2.1 U 2.1 U 2.1 U 2.1 U 2.2 U 2.1 U 2.1 U 2.1 U 2.2 U 2.1 U Acetochlor ng/L 0.24 U 0.24 U 0.24 U 0.25 U 0.24 U 0.24 U 0.25 U 0.24 U 0.24 U 0.24 U
a-Chlordane ng/L 1 U 1 U 1.1 U 1 U 1.1 U 1 U 1 U 1 U 1.1 U 1 U Alachlor ng/L 0.24 U 0.24 U 0.24 U 0.25 U 0.24 U 0.24 U 0.25 U 0.24 U 0.24 U 0.24 U
Aldrin ng/L 4.1 U 4.2 U 4.3 U 4.2 U 4.3 U 4.2 U 4.1 U 4.1 U 4.3 U 4.2 U Ametryn ng/L 0.32 U 0.31 U 0.31 U 0.32 U 0.31 U 0.31 U 0.32 U 0.31 U 0.31 U 0.31 U
AMPA ug/L 0.1 U 0.1 U 0.1 U 0.1 U 0.1 U 0.1 U 0.1 U 0.1 U 0.1 U 0.1 U Atrazine ng/L 0.25 I 0.27 I 2.30 0.25 U 0.24 U 0.24 U 0.25 U 0.24 U 0.24 U 0.24 U
Atrazine Desethyl ng/L 1.5 U 1.4 U 1.4 U 1.5 U 1.4 U 1.4 U 1.5 U 1.4 U 1.4 U 1.4 U Azinphos Methyl ng/L 2.2 U 2.2 U 2.2 U 2.2 U 2.1 U 2.2 U 2.2 U 2.2 U 2.2 U 2.2 U
b-BHC ng/L 4.1 U 4.2 U 4.3 U 4.2 U 4.3 U 4.2 U 4.1 U 4.1 U 4.3 U 4.2 U Bromacil ng/L 0.49 U 0.48 U 0.48 U 0.49 U 0.48 U 0.48 U 0.49 U 0.48 U 0.48 U 0.48 U Butylate ng/L 0.39 UJ 0.38 UJ 0.38 UJ 0.39 UJ 0.38 UJ 0.39 UJ 0.39 UJ 0.38 UJ 0.39 UJ 0.38 UJ
Carbophenothion ng/L 4.1 U 4.2 U 4.3 U 4.2 U 4.3 UJ 4.2 UJ 4.1 UJ 4.1 UJ 4.3 UJ 4.2 UJ Chlordane ng/L 2.6 U 3.9 I 2.7 U 2.6 U 2.7 U 2.6 UQ 2.9 I 2.6 U 2.7 U 2.6 U
Chlorothalonil ng/L 2.1 U 2.1 U 2.1 U 2.1 U 2.2 U 2.1 U 2.1 U 2.1 U 2.2 U 2.1 U Chlorpyrifos
Ethyl ng/L 0.24 U 0.24 U 0.24 U 0.25 U 0.24 U 0.24 U 0.25 U 0.24 U 0.24 U 0.24 U Chlorpyrifos
Methyl ng/L 0.097 U 0.096 U 0.096 U 0.099 U 0.095 U 0.097
U 0.099 U 0.096 U 0.096
U 0.096
U Cyanazine ng/L 0.49 U 0.48 U 0.48 U 0.49 U 0.48 U 0.48 U 0.49 U 0.48 U 0.48 U 0.48 U
Cypermethrin ng/L 21 U 21 U 21 U 21 U 22 U 21 U 21 U 21 U 22 U 21 U d-BHC ng/L 4.1 U 4.2 U 4.3 U 4.2 U 4.3 U 4.2 U 4.1 U 4.1 U 4.3 U 4.2 U
Demeton ng/L 1.9 U 1.9 U 1.9 U 2 U 1.9 U 1.9 U 2 U 1.9 U 1.9 U 1.9 U Diazinon ng/L 0.12 U 0.12 U 0.12 U 0.12 U 0.12 U 0.12 U 0.12 U 0.12 U 0.12 U 0.12 U Dicofol ng/L 31 U 31 U 32 U 31 U 32 U 31 U 31 U 31 U 32 U 31 U Dieldrin ng/L 4.1 U 4.2 U 4.3 U 4.2 U 4.3 U 4.2 U 4.1 U 4.1 U 4.3 U 4.2 U
Disulfoton ng/L 0.49 U 0.48 U 0.48 U 0.49 U 0.48 U 0.48 U 0.49 U 0.48 U 0.48 U 0.48 U Endosulfan I ng/L 4.1 UJ 4.2 UJ 4.3 UJ 4.2 UJ 4.3 U 4.2 U 4.1 U 4.1 U 4.3 U 4.2 U Endosulfan II ng/L 4.1 U 4.2 U 4.3 U 4.2 U 4.3 U 4.2 U 4.1 U 4.1 U 4.3 U 4.2 U Endosulfan
sulfate ng/L 2.1 U 2.1 U 2.1 U 2.1 U 2.2 U 2.1 U 2.1 U 2.1 U 2.2 U 2.1 U Endrin ng/L 2.1 UJ 2.1 UJ 2.1 UJ 2.1 UJ 2.2 U 2.1 U 2.1 U 2.1 U 2.2 U 2.1 U
Endrin aldehyde ng/L 2.1 U 2.1 U 2.1 U 2.1 U 2.2 U 2.1 U 2.1 U 2.1 U 2.2 U 2.1 U Endrin Ketone ng/L 2.1 U 2.1 U 2.1 U 2.1 U 2.2 U 2.1 U 2.1 U 2.1 U 2.2 U 2.1 U
EPTC ng/L 1.2 UJ 1.2 UJ 1.2 UJ 1.2 UJ 1.2 UJ 1.2 UJ 1.2 UJ 1.2 UJ 1.2 UJ 1.2 UJ Ethion ng/L 0.15 U 0.14 U 0.14 U 0.15 U 0.14 U 0.14 U 0.15 U 0.14 U 0.14 U 0.14 U
PARAMETER UNITS Gilchrist Blue
Johnson Spring
Poe Spring
Wilson Spring
Blue Hole Spring
Cedar HS Run
ICH Midpoint
Launch
ICH Tube
Takeout
ICH Head
Spring LIR-15

Santa Fe River and Springs Quarterly Report (April 2018 –June 2019)
55
Spring Run
Fenamiphos ng/L 0.24 U 0.24 U 0.24 U 0.25 U 0.24 U 0.24 U 0.25 U 0.24 U 0.24 U 0.24 U Fipronil ng/L 0.24 U 0.24 U 0.24 U 0.25 U 0.24 U 0.24 U 0.25 U 0.24 U 0.24 U 0.24 U
Fipronil Sulfide ng/L 0.15 U 0.14 U 0.14 U 0.15 U 0.14 U 0.14 U 0.15 U 0.14 U 0.14 U 0.14 U Fipronil Sulfone ng/L 0.15 U 0.14 U 0.25 I 0.15 U 0.14 U 0.14 U 0.15 U 0.14 U 0.14 U 0.14 U
Fonofos ng/L 0.19 U 0.19 U 0.19 U 0.2 U 0.19 U 0.19 U 0.2 U 0.19 U 0.19 U 0.19 U g-BHC ng/L 4.1 U 4.2 U 4.3 U 4.2 U 4.3 U 4.2 U 4.1 U 4.1 U 4.3 U 4.2 U
g-Chlordane ng/L 1 U 1 U 1.1 U 1 U 1.1 U 1 U 1 U 1 U 1.1 U 1 U Glyphosate ug/L 0.1 U 0.1 U 0.1 U 0.1 U 0.1 U 0.1 U 0.1 U 0.1 U 0.1 U 0.1 U Heptachlor ng/L 1.6 U 1.6 U 1.6 U 1.6 U 1.6 U 1.6 U 1.6 U 1.6 U 1.6 U 1.6 U Heptachlor
epoxide ng/L 2.1 U 2.1 U 2.1 U 2.1 U 2.2 U 2.1 U 2.1 U 2.1 U 2.2 U 2.1 U Hexazinone ng/L 0.49 U 0.48 U 0.89 I 0.49 U 0.48 U 0.48 U 0.49 U 0.48 U 0.48 U 0.48 U Malathion ng/L 0.34 U 0.34 U 0.34 U 0.35 U 0.33 U 0.34 U 0.35 U 0.34 U 0.34 U 0.34 U Metalaxyl ng/L 0.24 U 0.24 U 0.24 U 0.25 U 0.24 U 0.24 U 0.25 U 0.24 U 0.24 U 0.24 U
Methoxychlor ng/L 4.1 U 4.2 U 4.3 U 4.2 U 4.3 U 4.2 U 4.1 U 4.1 U 4.3 U 4.2 U Metolachlor ng/L 0.25 I 0.24 U 0.35 I 0.3 I 0.24 U 0.24 U 0.25 U 0.24 U 0.24 U 0.24 U Metribuzin ng/L 0.19 UJ 0.19 UJ 0.19 UJ 0.2 UJ 0.19 UJ 0.19 UJ 0.2 UJ 0.19 UJ 0.19 UJ 0.19 UJ Mevinphos ng/L 0.49 U 0.48 U 0.48 U 0.49 U 0.48 U 0.48 U 0.49 U 0.48 U 0.48 U 0.48 U
Mirex ng/L 2.1 U 2.1 U 2.1 U 2.1 U 2.2 U 2.1 U 2.1 U 2.1 U 2.2 U 2.1 U Molinate ng/L 0.29 U 0.29 U 0.29 U 0.3 U 0.29 U 0.29 U 0.3 U 0.29 U 0.29 U 0.29 U
Norflurazon ng/L 0.49 U 0.48 U 0.48 U 0.49 U 0.48 U 0.48 U 0.49 U 0.48 U 0.48 U 0.48 U Parathion Ethyl ng/L 0.24 U 0.24 U 0.24 U 0.25 U 0.24 U 0.24 U 0.25 U 0.24 U 0.24 U 0.24 U
Parathion Methyl ng/L 0.24 U 0.24 U 0.24 U 0.25 U 0.24 U 0.24 U 0.25 U 0.24 U 0.24 U 0.24 U Pendimethalin ng/L 0.97 U 0.96 U 0.96 U 0.99 U 0.95 U 0.97 U 0.99 U 0.96 U 0.96 U 0.96 U
Permethrin ng/L 10 U 10 U 11 U 10 U 11 U 10 U 10 U 10 U 11 U 10 U Phorate ng/L 0.24 U 0.24 U 0.24 U 0.25 U 0.24 U 0.24 U 0.25 U 0.24 U 0.24 U 0.24 U
Prometon ng/L 0.88 U 0.86 U 0.86 U 0.89 U 0.86 U 0.87 U 0.89 U 0.86 U 0.87 U 0.86 U Prometryn ng/L 0.19 U 0.19 U 0.19 U 0.2 U 0.19 U 0.19 U 0.2 U 0.19 U 0.19 U 0.19 U Simazine ng/L 0.49 U 0.48 U 0.73 I 0.49 U 0.48 U 0.48 U 0.49 U 0.48 U 0.48 U 0.48 U Sucralose ug/L 0.01 U 0.01 U 0.210 0.01 U 0.01 U 0.01 U 0.01 U 0.01 U 0.01 U 0.01 U
Terbufos ng/L 0.097 U 0.096 U 0.096 U 0.099 U 0.095 U 0.097
U 0.099 U 0.096 U 0.096
U 0.096
U Terbuthylazine ng/L 0.41 U 0.41 U 0.41 U 0.42 U 0.4 U 0.41 U 0.42 U 0.41 U 0.41 U 0.41 U
Toxaphene ng/L 31 U 31 U 32 U 31 U 32 U 31 UQ 31 U 31 U 32 U 31 U Trifluralin ng/L 1 U 1 U 1.1 U 1 U 1.1 U 1 U 1 U 1 U 1.1 U 1 U

Santa Fe River and Springs Quarterly Report (April 2018 –June 2019)
56
Santa Fe River Sites Detailed Chemical Analysis – July 9, 2018
GROUP PARAMETER UNITS
SFR at Worthington
Spring
O'Leno State Park
Santa Fe River
Rise SFR at
I-75
SFR at US-441 Bridge
SFR at US 27
SFR at US 47
SFR above
ICH SFR at US 129
SFR at 39th Ave
DISSOLVED OXYGEN DO % 64.1 65.4 53.9 64 54.3 55.6 55.1 61 59.6 56.2
DO mg/L 5.27 5.36 4.44 5.25 4.48 4.58 4.59 5.05 4.98 4.72 GENERAL
INORGANIC Alk mg/L as CaCO3 9.8 7.6 12 7.6 51 38 85 88 97 99
Cl-T mg/L 8.5 7.9 8.4 8.1 9.4 9 9 8.9 8.9 8.5
F-T mg/L 0.079 I 0.081 I 0.088 I 0.082 I 0.11 0.1 0.11 0.11 0.11 0.11
Hardness mg/L as CaCO3 29.4 28.1 36.3 28.1 84.5 66.5 115 122 132 133
SO4 mg/L 1.1 0.96 4.2 1 14 10 12 13 13 13
TOC mg/L 40 41 40 42 31 35 24 24 19 18 METAL Ca-T mg/L 7.91 7.6 10.4 7.58 26.8 20.8 38.5 40.7 44.2 44.7
K-T mg/L 0.84 I 0.77 I 0.81 I 0.81 I 0.91 I 0.9 I 0.82 I 0.85 I 0.84 I 0.91 I
Mg-T mg/L 2.34 2.21 2.53 2.22 4.26 3.53 4.69 4.9 5.15 5.18
Na-T mg/L 4.7 4.5 4.6 4.5 5.5 5.2 5 5.1 4.8 4.7 NITROGEN NH4-N mg/L 0.017 0.017 0.019 0.017 0.016 0.015 0.008 0.007 0.009 0.009
NOx-N mg/L 0.067 0.056 0.056 0.054 0.15 0.12 0.52 0.51 0.59 0.61
TKN mg/L 1.2 1.2 1.2 1.3 0.96 1 0.83 0.71 0.71 0.75 J PHOSPHORUS OrthoP mg/L 0.15 0.16 0.16 0.16 0.14 0.16 0.12 0.11 0.11 0.11
TP mg/L 0.2 0.2 0.21 0.2 0.19 0.2 0.15 0.14 0.13 0.12 PHYSICAL Color PCU 520 540 530 540 410 460 320 310 270 250
pH SU 6.09 5.84 6.15 6.02 6.89 6.86 7.16 7.28 7.32 7.53
SpCond umhos/cm 70.6 65.2 80.1 65.5 177.9 137.2 228.1 235.2 251.2 256.1
Turb NTU 3.4 A 2.8 3.2 2.9 2.4 2.7 2.1 2.2 A 1.6 1.7 SOLID TDS mg/L 116 117 130 112 143 142 134 176 162 A 166 A
TSS mg/L 4 I 4 I 3 I 3 I 3 I 3 I 3 I 3 I 4 IA 3 IA TEMPERATURE Wtr Temp C 25.2 25.6 25.2 25.4 25.1 25.1 24.5 24.7 24.3 24.5

Santa Fe River and Springs Quarterly Report (April 2018 –June 2019)
57
Santa Fe River Springs and Tributaries Detailed Chemical Analysis – August 9, 2018
GROUP PARAMETER UNITS Poe
Spring Gilchrist Blue
Spring Run Ginnie
Spring Run LIR-15 SFR at
39th Ave SFR at US
129 SFR at US
27 SFR at US
47 SFR at US-441 Bridge
DISSOLVED OXYGEN DO % 5.70 40.70 49.30 52.50 50.20 52.10 41.80 46.10 37.20
DO mg/L 0.48 3.36 4.25 4.48 4.08 4.24 3.35 3.75 3.02
GENERAL INORGANIC Alk mg/L as CaCO3 186 A 46 163 121 52 55 26 50 43
Cl-T mg/L 12 6.4 6.2 6 5.5 5.8 6.3 6.4 7.0
F-T mg/L 0.13 0.088 I 0.093 I 0.12 0.085 I 0.087 I 0.085 I 0.088 I 0.1
Hardness mg/L as CaCO3 206 71.9 185 144 71.1 73.4 45.5 72.6 72.3
SO4 mg/L 17 7 10 8.9 4.2 5.5 6.8 7 14 A
TOC mg/L 3 35 0.52 I 12 30 31 39 33 34 METAL As-T ug/L 1.67 0.96 0.77 1.05 0.92 0.87 0.89 0.93 0.98
B-T ug/L 20.100 17.000 11.10 13.60 16.400 15.900 17.30 17.60 18.400
Ca-T mg/L 72.3 23.5 64 48.1 23.6 24.3 14 23.8 22.7
Cu-T ug/L 0.2 U 0.56 I 0.26 I 0.2 I 0.54 I 0.49 I 0.53 I 0.58 I 0.49 I
Fe-T ug/L 30 U 810 30 U 260 720 720 1020 850 870
K-T mg/L 0.96 I 0.86 I 0.49 I 0.6 I 0.89 I 0.85 I 0.91 I 0.9 I 0.94 I
Na-T mg/L 7.4 4 3.1 3.9 3.4 3.5 3.8 3.9 4.5
Mg-T mg/L 6.14 3.18 6.14 5.9 2.93 3.08 2.56 3.22 3.75
Zn-T ug/L 5 U 6.4 I 5 U 5 U 6.8 I 6 I 7.3 I 7.4 I 6.6 I NITROGEN NH4-N mg/L 0.002 I 0.017 0.003 I 0.011 0.015 0.014 0.022 0.016 0.021
NOx-N mg/L 0.14 0.13 2 0.4 0.19 0.21 0.055 0.22 0.091
TKN mg/L 0.35 1.1 0.11 I 0.55 0.97 0.98 1.2 1.1 1 PHOSPHORUS OrthoP mg/L 0.084 0.17 0.036 0.091 0.16 0.16 0.19 0.17 0.17
TP mg/L 0.085 0.21 0.036 0.11 0.2 0.2 0.22 0.19 0.22 PHYSICAL pH SU 7.22 7.00 7.45 7.48 7.24 7.15 6.53 6.86 6.72
Color PCU 16.00 470.00 2.5 U 150.00 430.00 430.00 530.00 450.00 460.00
SpCond umhos/cm 424.20 222.30 360.80 313.85 137.00 145.80 97.00 142.10 151.10
Turb NTU 0.3 1.8 0.15 0.9 1.8 1.6 2.5 A 2 2.3 TEMPERATURE Wtr Temp C 22.70 24.95 22.60 23.30 25.90 25.80 26.60 25.80 25.90
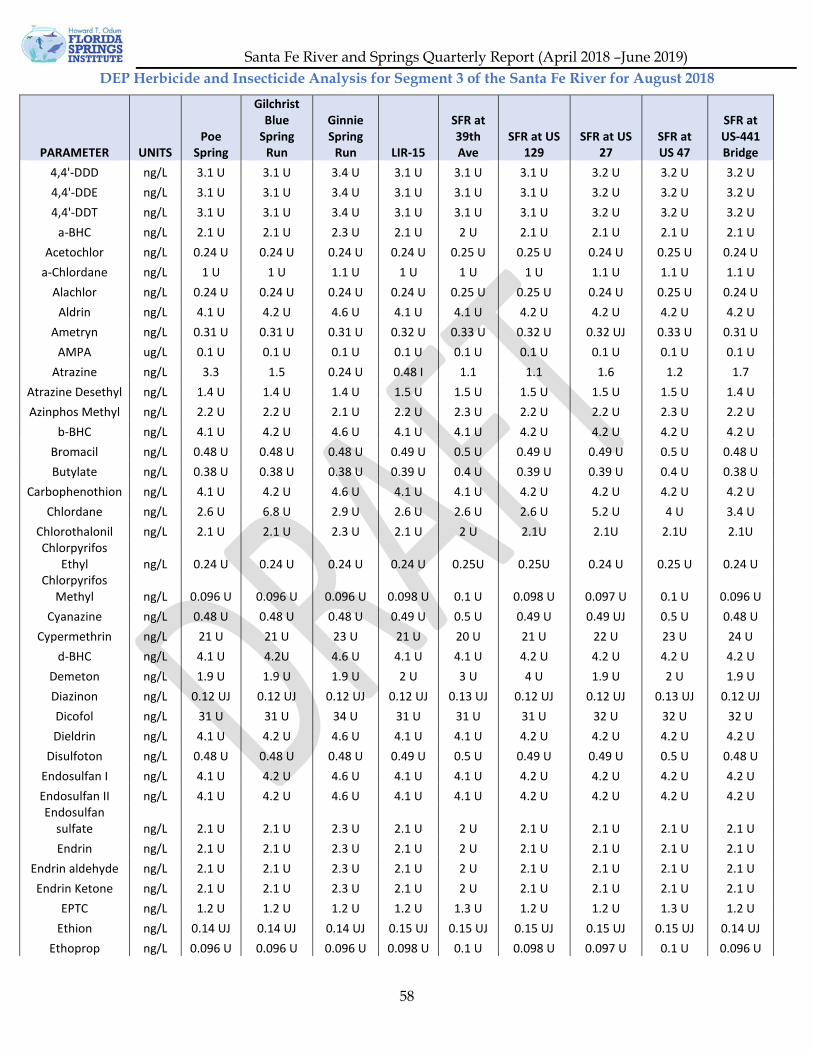
Santa Fe River and Springs Quarterly Report (April 2018 –June 2019)
58
DEP Herbicide and Insecticide Analysis for Segment 3 of the Santa Fe River for August 2018
PARAMETER UNITS Poe
Spring
Gilchrist Blue
Spring Run
Ginnie Spring
Run LIR-15
SFR at 39th Ave
SFR at US 129
SFR at US 27
SFR at US 47
SFR at US-441 Bridge
4,4'-DDD ng/L 3.1 U 3.1 U 3.4 U 3.1 U 3.1 U 3.1 U 3.2 U 3.2 U 3.2 U 4,4'-DDE ng/L 3.1 U 3.1 U 3.4 U 3.1 U 3.1 U 3.1 U 3.2 U 3.2 U 3.2 U 4,4'-DDT ng/L 3.1 U 3.1 U 3.4 U 3.1 U 3.1 U 3.1 U 3.2 U 3.2 U 3.2 U
a-BHC ng/L 2.1 U 2.1 U 2.3 U 2.1 U 2 U 2.1 U 2.1 U 2.1 U 2.1 U Acetochlor ng/L 0.24 U 0.24 U 0.24 U 0.24 U 0.25 U 0.25 U 0.24 U 0.25 U 0.24 U
a-Chlordane ng/L 1 U 1 U 1.1 U 1 U 1 U 1 U 1.1 U 1.1 U 1.1 U Alachlor ng/L 0.24 U 0.24 U 0.24 U 0.24 U 0.25 U 0.25 U 0.24 U 0.25 U 0.24 U
Aldrin ng/L 4.1 U 4.2 U 4.6 U 4.1 U 4.1 U 4.2 U 4.2 U 4.2 U 4.2 U Ametryn ng/L 0.31 U 0.31 U 0.31 U 0.32 U 0.33 U 0.32 U 0.32 UJ 0.33 U 0.31 U
AMPA ug/L 0.1 U 0.1 U 0.1 U 0.1 U 0.1 U 0.1 U 0.1 U 0.1 U 0.1 U Atrazine ng/L 3.3 1.5 0.24 U 0.48 I 1.1 1.1 1.6 1.2 1.7
Atrazine Desethyl ng/L 1.4 U 1.4 U 1.4 U 1.5 U 1.5 U 1.5 U 1.5 U 1.5 U 1.4 U Azinphos Methyl ng/L 2.2 U 2.2 U 2.1 U 2.2 U 2.3 U 2.2 U 2.2 U 2.3 U 2.2 U
b-BHC ng/L 4.1 U 4.2 U 4.6 U 4.1 U 4.1 U 4.2 U 4.2 U 4.2 U 4.2 U Bromacil ng/L 0.48 U 0.48 U 0.48 U 0.49 U 0.5 U 0.49 U 0.49 U 0.5 U 0.48 U Butylate ng/L 0.38 U 0.38 U 0.38 U 0.39 U 0.4 U 0.39 U 0.39 U 0.4 U 0.38 U
Carbophenothion ng/L 4.1 U 4.2 U 4.6 U 4.1 U 4.1 U 4.2 U 4.2 U 4.2 U 4.2 U Chlordane ng/L 2.6 U 6.8 U 2.9 U 2.6 U 2.6 U 2.6 U 5.2 U 4 U 3.4 U
Chlorothalonil ng/L 2.1 U 2.1 U 2.3 U 2.1 U 2 U 2.1U 2.1U 2.1U 2.1U Chlorpyrifos
Ethyl ng/L 0.24 U 0.24 U 0.24 U 0.24 U 0.25U 0.25U 0.24 U 0.25 U 0.24 U Chlorpyrifos
Methyl ng/L 0.096 U 0.096 U 0.096 U 0.098 U 0.1 U 0.098 U 0.097 U 0.1 U 0.096 U Cyanazine ng/L 0.48 U 0.48 U 0.48 U 0.49 U 0.5 U 0.49 U 0.49 UJ 0.5 U 0.48 U
Cypermethrin ng/L 21 U 21 U 23 U 21 U 20 U 21 U 22 U 23 U 24 U d-BHC ng/L 4.1 U 4.2U 4.6 U 4.1 U 4.1 U 4.2 U 4.2 U 4.2 U 4.2 U
Demeton ng/L 1.9 U 1.9 U 1.9 U 2 U 3 U 4 U 1.9 U 2 U 1.9 U Diazinon ng/L 0.12 UJ 0.12 UJ 0.12 UJ 0.12 UJ 0.13 UJ 0.12 UJ 0.12 UJ 0.13 UJ 0.12 UJ Dicofol ng/L 31 U 31 U 34 U 31 U 31 U 31 U 32 U 32 U 32 U Dieldrin ng/L 4.1 U 4.2 U 4.6 U 4.1 U 4.1 U 4.2 U 4.2 U 4.2 U 4.2 U
Disulfoton ng/L 0.48 U 0.48 U 0.48 U 0.49 U 0.5 U 0.49 U 0.49 U 0.5 U 0.48 U Endosulfan I ng/L 4.1 U 4.2 U 4.6 U 4.1 U 4.1 U 4.2 U 4.2 U 4.2 U 4.2 U Endosulfan II ng/L 4.1 U 4.2 U 4.6 U 4.1 U 4.1 U 4.2 U 4.2 U 4.2 U 4.2 U Endosulfan
sulfate ng/L 2.1 U 2.1 U 2.3 U 2.1 U 2 U 2.1 U 2.1 U 2.1 U 2.1 U Endrin ng/L 2.1 U 2.1 U 2.3 U 2.1 U 2 U 2.1 U 2.1 U 2.1 U 2.1 U
Endrin aldehyde ng/L 2.1 U 2.1 U 2.3 U 2.1 U 2 U 2.1 U 2.1 U 2.1 U 2.1 U Endrin Ketone ng/L 2.1 U 2.1 U 2.3 U 2.1 U 2 U 2.1 U 2.1 U 2.1 U 2.1 U
EPTC ng/L 1.2 U 1.2 U 1.2 U 1.2 U 1.3 U 1.2 U 1.2 U 1.3 U 1.2 U Ethion ng/L 0.14 UJ 0.14 UJ 0.14 UJ 0.15 UJ 0.15 UJ 0.15 UJ 0.15 UJ 0.15 UJ 0.14 UJ
Ethoprop ng/L 0.096 U 0.096 U 0.096 U 0.098 U 0.1 U 0.098 U 0.097 U 0.1 U 0.096 U

Santa Fe River and Springs Quarterly Report (April 2018 –June 2019)
59
PARAMETER UNITS Poe
Spring
Gilchrist Blue
Spring Run
Ginnie Spring
Run LIR-15
SFR at 39th Ave
SFR at US 129
SFR at US 27
SFR at US 47
SFR at US-441 Bridge
Fenamiphos ng/L 0.24 U 0.24 U 0.24 U 0.24 U 0.25 U 0.25 U 0.24 U 0.25 U 0.24 U Fipronil ng/L 0.24 U 0.24 U 0.24 U 0.24 U 0.25 U 0.25 U 0.24 U 0.25 U 0.24 U
Fipronil Sulfide ng/L 0.14 U 0.14 U 0.14 U 0.15 U 0.15 U 0.15 U 0.15 U 0.15 U 0.14 U Fipronil Sulfone ng/L 0.22 I 0.14 U 0.14 U 0.15 U 0.15 U 0.15 U 0.15 U 0.15 U 0.14 U
Fonofos ng/L 0.19 U 0.19 U 0.19 U 0.2 U 0.2 U 0.2 U 0.19 U 0.2 U 0.19 U g-BHC ng/L 4.1 U 4.2 U 4.6 U 4.1 U 4.1 U 4.2 U 4.2 U 4.2 U 4.2 U
g-Chlordane ng/L 1 U 1 U 1.1 U 1 U 1 U 1 U 1.1 U 1.1 U 1.1 U Glyphosate ug/L 0.1 U 0.1 U 0.1 U 0.1 U 0.1 U 0.1 U 0.1 U 0.1 U 0.1 U Heptachlor ng/L 1.6 U 1.6 U 1.7 U 1.6 U 1.5 U 1.6 U 1.6 U 1.6 U 1.6 U Heptachlor
epoxide ng/L 2.1 U 2.1 U 2.3 U 2.1 U 2 U 2.1 U 2.1 U 2.1 U 2.1 U Hexazinone ng/L 0.48 U 0.48 U 0.48 U 0.49 U 0.5 U 0.49 U 0.49 U 0.85 I 0.48 U Malathion ng/L 0.34 U 0.34 U 0.33 U 0.34 U 0.35 U 0.34 U 0.34 U 0.35 U 0.34 U Metalaxyl ng/L 0.24 U 0.24 U 0.24 U 0.24 U 0.25 U 0.25 U 0.24 U 0.25 U 0.24 U
Methoxychlor ng/L 4.1 U 4.2 U 4.6 U 4.1 U 4.1 U 4.2 U 4.2 U 4.2 U 4.2 U Metolachlor ng/L 0.28 I 1.5 0.24 U 0.5 I 1.8 1.6 1.5 1.6 1.5 Metribuzin ng/L 0.19 UJ 0.19 UJ 0.19 UJ 0.2 UJ 0.2 UJ 0.2 UJ 0.19 UJ 0.2 UJ 0.19 UJ Mevinphos ng/L 0.48 U 0.48 U 0.48 U 0.49 U 0.5 U 0.49 U 0.49 U 0.5 U 0.48 U
Mirex ng/L 2.1 U 2.1 U 2.3 U 2.1 U 2 U 2.1 U 2.1 U 2.1 U 2.1 U Molinate ng/L 0.29 U 0.29 U 0.29 U 0.29 U 0.3 U 0.29 U 0.29 UJ 0.3 U 0.29 U
Norflurazon ng/L 0.48 U 0.48 U 0.48 U 0.49 U 0.5 U 0.49 U 0.49 U 0.5 U 0.48 U Parathion Ethyl ng/L 0.24 U 0.24 U 0.24 U 0.24 U 0.25 U 0.25 U 0.24 U 0.25 U 0.24 U
Parathion Methyl ng/L 0.24 U 0.24 U 0.24 U 0.24 U 0.25 U 0.25 U 0.24 U 0.25 U 0.24 U Pendimethalin ng/L 0.96 U 0.96 U 0.96 U 0.98 U 1 U 0.98 U 0.97 U 1 U 0.96 U
Permethrin ng/L 10 U 10 U 11 U 10 U 10 U 10 U 11 U 11 U 11 U Phorate ng/L 0.24 U 0.24 U 0.24 U 0.24 U 0.25 U 0.25 U 0.24 U 0.25 U 0.24 U
Prometon ng/L 0.86 U 0.87 U 0.86 U 0.88 U 0.91 U 0.88 U 0.88 U 0.91 U 0.86 U Prometryn ng/L 0.19 U 0.19 U 0.19 U 0.2 U 0.2 U 0.2 U 0.19 U 0.2 U 0.19 U Simazine ng/L 0.48 U 0.48 U 0.48 U 0.49 U 0.5 U 0.49 U 0.49 U 0.5 U 0.48 U Sucralose ug/L 0.28 0.066 0.01 U 0.01 U 0.082 0.039 I 0.07 0.072 0.057 Terbufos ng/L 0.096 U 0.096 U 0.096 U 0.098 U 0.1 U 0.098 U 0.097 U 0.1 U 0.096 U
Terbuthylazine ng/L 0.41 U 0.41 U 0.41 U 0.41 U 0.43 U 0.42 U 0.41 U 0.43 U 0.41 U Toxaphene ng/L 31 U 31 U 34 U 31 U 31 U 31 U 32 U 32 U 32 U Trifluralin ng/L 1 U 1 U 1.1 U 1 U 1 U 1 U 1.1 U 1.1 U 1.1 U
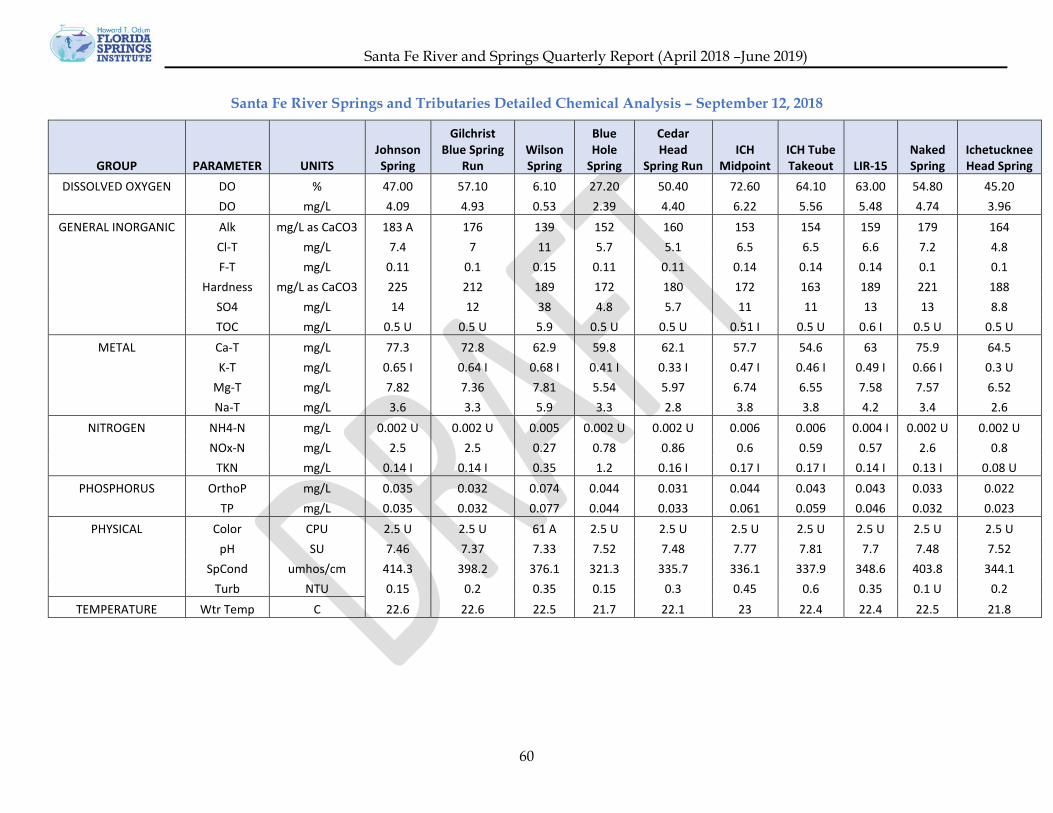
Santa Fe River and Springs Quarterly Report (April 2018 –June 2019)
60
Santa Fe River Springs and Tributaries Detailed Chemical Analysis – September 12, 2018
GROUP PARAMETER UNITS Johnson Spring
Gilchrist Blue Spring
Run Wilson Spring
Blue Hole
Spring
Cedar Head
Spring Run ICH
Midpoint ICH Tube Takeout LIR-15
Naked Spring
Ichetucknee Head Spring
DISSOLVED OXYGEN DO % 47.00 57.10 6.10 27.20 50.40 72.60 64.10 63.00 54.80 45.20
DO mg/L 4.09 4.93 0.53 2.39 4.40 6.22 5.56 5.48 4.74 3.96 GENERAL INORGANIC Alk mg/L as CaCO3 183 A 176 139 152 160 153 154 159 179 164
Cl-T mg/L 7.4 7 11 5.7 5.1 6.5 6.5 6.6 7.2 4.8
F-T mg/L 0.11 0.1 0.15 0.11 0.11 0.14 0.14 0.14 0.1 0.1
Hardness mg/L as CaCO3 225 212 189 172 180 172 163 189 221 188
SO4 mg/L 14 12 38 4.8 5.7 11 11 13 13 8.8
TOC mg/L 0.5 U 0.5 U 5.9 0.5 U 0.5 U 0.51 I 0.5 U 0.6 I 0.5 U 0.5 U METAL Ca-T mg/L 77.3 72.8 62.9 59.8 62.1 57.7 54.6 63 75.9 64.5
K-T mg/L 0.65 I 0.64 I 0.68 I 0.41 I 0.33 I 0.47 I 0.46 I 0.49 I 0.66 I 0.3 U
Mg-T mg/L 7.82 7.36 7.81 5.54 5.97 6.74 6.55 7.58 7.57 6.52
Na-T mg/L 3.6 3.3 5.9 3.3 2.8 3.8 3.8 4.2 3.4 2.6 NITROGEN NH4-N mg/L 0.002 U 0.002 U 0.005 0.002 U 0.002 U 0.006 0.006 0.004 I 0.002 U 0.002 U
NOx-N mg/L 2.5 2.5 0.27 0.78 0.86 0.6 0.59 0.57 2.6 0.8
TKN mg/L 0.14 I 0.14 I 0.35 1.2 0.16 I 0.17 I 0.17 I 0.14 I 0.13 I 0.08 U PHOSPHORUS OrthoP mg/L 0.035 0.032 0.074 0.044 0.031 0.044 0.043 0.043 0.033 0.022
TP mg/L 0.035 0.032 0.077 0.044 0.033 0.061 0.059 0.046 0.032 0.023 PHYSICAL Color CPU 2.5 U 2.5 U 61 A 2.5 U 2.5 U 2.5 U 2.5 U 2.5 U 2.5 U 2.5 U
pH SU 7.46 7.37 7.33 7.52 7.48 7.77 7.81 7.7 7.48 7.52
SpCond umhos/cm 414.3 398.2 376.1 321.3 335.7 336.1 337.9 348.6 403.8 344.1
Turb NTU 0.15 0.2 0.35 0.15 0.3 0.45 0.6 0.35 0.1 U 0.2 TEMPERATURE Wtr Temp C 22.6 22.6 22.5 21.7 22.1 23 22.4 22.4 22.5 21.8

Santa Fe River and Springs Quarterly Report (April 2018 –June 2019)
61
Santa Fe River Springs and Tributaries Detailed Chemical Analysis – October 16, 2018
GROUP PARAMETER UNITS
SFR at Worthington
Spring
O'Leno State Park
Santa Fe River Rise
Hornsby Spring
Poe Spring
Johnson Spring
Gilchrist Blue Spring
Run
Little Blue
Spring Naked Spring
Rum Island Spring
DISSOLVED OXYGEN DO % 72.1 62.9 28.7 3.9 5.5 52.8 50.8 51.1 55.2 38 DO mg/L 6.15 5.4 2.42 0.33 0.5 4.56 5.06 4.41 4.78 3.28 GENERAL INORGANIC Alk mg/L as CaCO3 15 48 90.5 166 193 181.5 170 169 176 182 Cl-T mg/L 10 11 14 12 11 7.85 6.7 6.6 7 8.5 F-T mg/L 0.076 0.13 0.185 0.17 0.13 0.115 0.0985 0.099 0.11 0.12 Hardness mg/L as CaCO3 32.6 69 142.5 196 210 204 189 193 200 202 SO4 mg/L 2.5 10 43.5 33 14 15 11 11 13 16 TOC mg/L 33 26 15.5 1.9 1.1 0.9 0.5 0.5 0.5 1.3 METAL As-T ug/L 0.82 0.99 1.06 1.5 1.62 0.62 0.425 0.47 0.45 0.73 B-T ug/L 23 22.2 11.9 20.6 18.8 14.05 12 12 12.1 14.6 Ca-T mg/L 8.39 19.3 42.7 66.3 74 69.65 64.6 66.1 68.2 69 Cu-T ug/L 0.65 0.49 0.29 0.2 0.2 0.2 0.2 0.2 0.2 0.2 Fe-T ug/L 980 620 380 30 30 30 30 30 30 30 K-T mg/L 1.2 1.2 1 0.84 0.74 0.57 0.54 0.49 0.56 0.63 Na-T mg/L 6.5 6.5 8.45 7.9 7 4.25 3.35 3.4 3.5 4.7 Mg-T mg/L 2.83 5.07 8.785 7.3 6.14 7.345 6.705 6.83 7.17 7.23 Zn-T ug/L 5 5 5 5 5 5 5 5 5 5 NITROGEN NH4-N mg/L 0.02 0.015 0.014 0.002 0.002 0.002 0.002 0.004 0.002 0.002 NOx-N mg/L 0.099 0.22 0.44 0.74 0.36 2.15 2.55 2.4 2.6 1.8 TKN mg/L 1.2 0.82 0.555 0.23 0.23 0.235 0.19 0.21 0.15 0.28 PHOSPHORUS OrthoP mg/L 0.096 0.12 0.11 0.086 0.081 0.045 0.028 0.03 0.033 0.054 TP mg/L 0.2 0.15 0.14 0.091 0.083 0.046 0.0325 0.033 0.033 0.056 PHYSICAL pH SU 7.1 7.23 7.41 7.38 7.38 7.54 7.44 7.55 7.65 7.5 Color PCU 410 310 190 12 4.6 5.55 2.5 2.5 2.5 8.6 SpCond umhos/cm 86.4 160.2 324.9 434.3 436.1 416.7 391.5 390.3 409 427.3 Turb NTU 7.4 3.4 3.15 0.35 0.35 0.45 0.825 0.7 0.4 0.5 SOLID TDS mg/L 125 144 219 244 219 201 201 190 230 211 TSS mg/L 9 3 4.5 2 2 2 2.5 2 2 2 TEMPERATURE Wtr Temp C 23.30 22.90 24 22.60 22.50 22.60 22.7 22.60 22.50 22.6

Santa Fe River and Springs Quarterly Report (April 2018 –June 2019)
62
DEP Herbicide and Insecticide Analysis for Segment 3 of the Santa Fe River for October 2018
PARAMETER UNITS
SFR at Worthington
Spring
O'Leno State Park
Santa Fe
River Rise
Hornsby Spring
Poe Spring
Johnson Spring
Gilchrist Blue
Spring Run
Little Blue
Spring
Naked Spring
Rum Island Spring
4,4'-DDD ng/L 3.1 3 3.1 3.1 3.2 3.6 3.1 3.1 3.3 3.9
4,4'-DDE ng/L 3.1 3 3.1 3.1 3.2 3.6 3.1 3.1 3.3 3.9
4,4'-DDT ng/L 3.1 3 3.1 3.1 3.2 3.6 3.1 3.1 3.3 3.9
a-BHC ng/L 2.1 2 2.05 2.1 2.1 2.4 2.1 2.1 2.2 2.6
Acetochlor ng/L 0.24 0.24 0.24 0.24 0.24 0.24 0.24 0.24 0.24 0.24
a-Chlordane ng/L 1 1 1 1 1.1 1.2 1 1 1.1 1.3
Alachlor ng/L 0.24 0.24 0.24 0.24 0.24 0.24 0.24 0.24 0.24 0.24
Aldrin ng/L 4.1 4.1 4.1 4.1 4.2 4.7 4.15 4.2 4.3 5.1
Ametryn ng/L 0.31 0.31 0.31 0.32 0.32 0.315 0.31 0.31 0.31 0.31
AMPA ug/L 0.1 0.1 0.1 0.1 0.1 0.1 0.1 0.1 0.1 0.1
Atrazine ng/L 1 0.77 0.59 0.77 1.9 0.42 0.455 0.45 0.45 0.47
Atrazine Desethyl ng/L 1.4 1.4 1.4 1.5 1.7 1.85 1.45 1.7 1.5 2
Azinphos Methyl ng/L 2.1 2.2 2.2 2.2 2.2 2.2 2.2 2.2 2.2 2.2
b-BHC ng/L 4.1 4.1 4.1 4.1 4.2 4.7 4.15 4.2 4.3 5.1
Bromacil ng/L 0.48 0.48 0.48 0.49 0.49 0.485 0.48 0.48 0.48 0.48
Butylate ng/L 0.38 0.39 0.38 0.39 0.39 0.39 0.385 0.39 0.39 0.39
Carbophenothion ng/L 4.1 4.1 4.1 4.1 4.2 4.7 4.15 4.2 4.3 5.1
Chlordane ng/L 2.6 2.5 2.6 2.6 2.6 3.4 2.6 2.6 2.7 4.1
Chlorothalonil ng/L 2.1 2 2.05 2.1 2.1 2.4 2.1 2.1 2.2 2.6
Chlorpyrifos Ethyl ng/L 0.24 0.24 0.24 0.24 0.24 0.24 0.24 0.24 0.24 0.24 Chlorpyrifos Methyl ng/L 0.095 0.097 0.096 0.098 0.098 0.097 0.096 0.097 0.097 0.097
Cyanazine ng/L 0.48 0.48 0.48 0.49 0.49 0.485 0.48 0.48 0.48 0.48
Cypermethrin ng/L 21 20 20.5 21 21 24 21 21 22 26
d-BHC ng/L 4.1 4.1 4.1 4.1 4.2 4.7 4.15 4.2 4.3 5.1
Demeton ng/L 1.9 1.9 1.9 2 2 1.9 1.9 1.9 1.9 1.9
Diazinon ng/L 0.12 0.12 0.12 0.12 0.12 0.12 0.12 0.12 0.12 0.12
Dicofol ng/L 31 30 31 31 32 36 31 31 33 39
Dieldrin ng/L 4.1 4.1 4.1 4.1 4.2 4.7 4.15 4.2 4.3 5.1
Disulfoton ng/L 0.48 0.48 0.48 0.49 0.49 0.485 0.48 0.48 0.48 0.48
Endosulfan I ng/L 4.1 4.1 4.1 4.1 4.2 4.7 4.15 4.2 4.3 5.1
Endosulfan II ng/L 4.1 4.1 4.1 4.1 4.2 4.7 4.15 4.2 4.3 5.1
Endosulfan sulfate ng/L 2.1 2 2.05 2.1 2.1 2.4 2.1 2.1 2.2 2.6
Endrin ng/L 2.1 2 2.05 2.1 2.1 2.4 2.1 2.1 2.2 2.6
Endrin aldehyde ng/L 2.1 2 2.05 2.1 2.1 2.4 2.1 2.1 2.2 2.6
Endrin Ketone ng/L 2.1 2 2.05 2.1 2.1 2.4 2.1 2.1 2.2 2.6
EPTC ng/L 1.2 1.2 1.2 1.2 1.2 1.2 1.2 1.2 1.2 1.2
Ethion ng/L 0.14 0.14 0.14 0.15 0.15 0.145 0.14 0.14 0.15 0.14
Ethoprop ng/L 0.095 0.097 0.096 0.098 0.098 0.097 0.096 0.097 0.097 0.097

Santa Fe River and Springs Quarterly Report (April 2018 –June 2019)
63
PARAMETER UNITS
SFR at Worthington
Spring
O'Leno State Park
Santa Fe River
Rise Hornsby Spring
Poe Spring
Johnson Spring
Gilchrist Blue
Spring Run
Little Blue
Spring Naked Spring
Rum Island Spring
Fenamiphos ng/L 0.24 0.24 0.24 0.24 0.24 0.24 0.24 0.24 0.24 0.24 Fipronil ng/L 0.24 0.24 0.24 0.24 0.24 0.24 0.24 0.24 0.24 0.24 Fipronil Sulfide ng/L 0.14 0.14 0.14 0.15 0.15 0.145 0.14 0.14 0.15 0.14 Fipronil Sulfone ng/L 0.14 0.14 0.14 0.15 0.31 0.145 0.14 0.14 0.15 0.14 Fonofos ng/L 0.19 0.19 0.19 0.2 0.2 0.19 0.19 0.19 0.19 0.19 g-BHC ng/L 4.1 4.1 4.1 4.1 4.2 4.7 4.15 4.2 4.3 5.1 g-Chlordane ng/L 1 1 1 1 1.1 1.2 1 1 1.1 1.3 Glyphosate ug/L 0.1 0.1 0.1 0.1 0.1 0.1 0.1 0.1 0.1 0.1 Heptachlor ng/L 1.5 1.5 1.55 1.5 1.6 1.75 1.6 1.6 1.6 1.9 Heptachlor epoxide ng/L 2.1 2 2.05 2.1 2.1 2.4 2.1 2.1 2.2 2.6 Hexazinone ng/L 1.5 1.2 0.975 0.85 0.97 0.485 0.53 0.48 0.48 0.48 Malathion ng/L 0.33 0.34 0.335 0.34 0.34 0.34 0.34 0.34 0.34 0.34 Metalaxyl ng/L 0.24 0.24 0.24 0.24 0.24 0.24 0.24 0.24 0.24 0.24 Methoxychlor ng/L 4.1 4.1 4.1 4.1 4.2 4.7 4.15 4.2 4.3 5.1 Metolachlor ng/L 5.1 8 0.77 0.52 0.24 0.24 0.65 0.57 0.41 0.24 Metribuzin ng/L 0.19 0.19 0.19 0.2 0.2 0.19 0.19 0.19 0.19 0.19 Mevinphos ng/L 0.48 0.48 0.48 0.49 0.49 0.485 0.48 0.48 0.48 0.48 Mirex ng/L 2.1 2 2.05 2.1 2.1 2.4 2.1 2.1 2.2 2.6 Molinate ng/L 0.29 0.29 0.29 0.29 0.29 0.29 0.29 0.29 0.29 0.29 Norflurazon ng/L 0.48 0.48 0.48 0.49 0.49 0.485 0.48 0.48 0.48 0.48 Parathion Ethyl ng/L 0.24 0.24 0.24 0.24 0.24 0.24 0.24 0.24 0.24 0.24 Parathion Methyl ng/L 0.24 0.24 0.24 0.24 0.24 0.24 0.24 0.24 0.24 0.24 Pendimethalin ng/L 0.95 0.97 0.96 0.98 0.98 0.97 0.96 0.97 0.97 0.97 Permethrin ng/L 10 10 10 10 11 12 10 10 11 13 Phorate ng/L 0.24 0.24 0.24 0.24 0.24 0.24 0.24 0.24 0.24 0.24 Prometon ng/L 0.86 0.87 0.86 0.88 0.88 0.87 0.865 0.87 0.87 0.87 Prometryn ng/L 0.19 0.19 0.19 0.2 0.2 0.19 0.19 0.19 0.19 0.19 Simazine ng/L 0.48 0.48 0.48 0.49 0.49 0.485 0.48 0.48 0.48 0.48 Sucralose ug/L 0.12 0.11 0.056 0.18 0.13 0.0135 0.01 0.01 0.01 0.017 Terbufos ng/L 0.095 0.097 0.096 0.098 0.098 0.097 0.096 0.097 0.097 0.097 Terbuthylazine ng/L 0.41 0.41 0.41 0.41 0.42 0.41 0.41 0.41 0.41 0.41 Toxaphene ng/L 31 30 31 31 32 36 31 31 33 39 Trifluralin ng/L 1 1 1 1 1.1 1.2 1 1 1.1 1.3

Santa Fe River and Springs Quarterly Report (April 2018 –June 2019)
64
Santa Fe River Springs and Tributaries Detailed Chemical Analysis – November 6, 2018
GROUP PARAMETER UNITS Betty Spring
SFR at US 129
Cedar Head
Spring Run ICH
Midpoint LIR-15 Trail
Spring Troop Spring
ICH South Take-out
Ichetucknee Head Spring
Blue Hole
Spring DISSOLVED OXYGEN DO % 43.10 68.6 50.3 69.5 78.00 22.60 28.20 75.70 45.90 27.60
DO mg/L 3.72 5.95 4.4 5.99 6.79 1.95 2.44 6.57 4.02 2.40
GENERAL INORGANIC Alk mg/L as CaCO3 157 160 158 152 153 160 156 152 162 150
Cl-T mg/L 12 11 4.9 6.5 6.4 11 33 6.4 4.5 5.5
F-T mg/L 0.082 0.15 0.11 0.14 0.14 0.068 0.073 0.14 0.1 0.12
Hardness mg/L as CaCO3 257 203 175 167 180 233 402 178 182 166
SO4 mg/L 53 29 5.5 10 12 35 100 11 8.6 4.8
TOC mg/L 0.51 2.7 0.5 0.5 0.5 0.79 1.4 0.5 0.5 0.5
METAL Ca-T mg/L 92.3 67.6 60.3 55.5 60.2 81.3 135 59.1 62.1 57.5
K-T mg/L 4.4 0.8 0.3 0.44 0.5 9.7 34 0.49 0.3 0.43
Mg-T mg/L 6.42 8.23 5.97 6.81 7.29 7.18 15.9 7.29 6.56 5.53
Na-T mg/L 3.6 6.2 3 4.2 4.3 7.4 28.5 4.4 2.7 3.6
NITROGEN NH4-N mg/L 0.002 0.004 0.002 0.005 0.006 0.003 0.002 0.005 0.002 0.002
NOx-N mg/L 8 1 0.88 0.66 0.63 12 52 0.63 0.82 0.8
TKN mg/L 0.08 0.25 0.1 0.094 0.13 0.16 0.8 0.13 0.11 0.13
PHOSPHORUS OrthoP mg/L 0.049 0.061 0.031 0.042 0.044 0.051 0.072 0.044 0.02 0.043
TP mg/L 0.051 0.072 0.035 0.062 0.057 0.052 0.076 0.062 0.023 0.046
PHYSICAL Color PCU 2.5 21 2.5 2.5 2.5 3.3 2.9 2.5 2.5 2.5
pH SU 7.46 7.67 7.67 7.84 7.78 7.41 7.32 8.17 7.69 7.55
SpCond umhos/cm 504 399.9 330.7 332.6 336.7 496.2 1001 333.2 339.6 318
Turb NTU 0.3 1.1 0.6 0.55 0.8 0.35 0.9 0.75 0.4 0.2
SOLID TDS mg/L 284 224 163 164 177 292 715 169 170 153
TSS mg/L 2 2 2 2 2 2 3 2 2 2
TEMPERATURE Wtr Temp C 22.6 22.4 21.9 22.7 22.2 22.5 22.3 22.4 21.9 21.7

Santa Fe River and Springs Quarterly Report (April 2018 –June 2019)
65
Santa Fe River Springs and Tributaries Detailed Chemical Analysis – December 12 & 13, 2018
GROUP PARAMETER UNITS Santa Fe
Spring Olustee Creek
Hornsby Spring
Poe Spring
Johnson Spring
Gilchrist Blue Spring
Run
Cow Creek at CR 138
Devil's Eye
Spring
Ginnie Spring
Run Naked Spring
DISSOLVED OXYGEN DO % 80.10 82.20 4.50 10.90 53.60 62.40 87.10 44.20 47.90 54.50
DO mg/L 8.64 9.15 0.39 0.95 4.63 5.42 9.49 3.82 4.16 4.71
GENERAL INORGANIC Alk mg/L as CaCO3 8.5 1.4 146 189 180 172 52 177 153 177
Cl-T mg/L 12 9.7 13 11 7.3 7 7.8 7.4 6.2 7.1
F-T mg/L 0.077 0.063 0.17 0.12 0.11 0.098 0.036 0.1 0.086 0.1
Hardness mg/L as CaCO3 32.1 22.1 215 214 215 204 72 198 181 218
SO4 mg/L 3.2 1.1 32 13 14 12 0.51 13 9.8 13
TOC mg/L 34 41 1.9 1.3 0.5 0.5 32 0.5 0.5 0.5
METAL Ca-T mg/L 7.8 5.28 73 75.5 73.5 69.9 26.8 67.9 62.4 74.5
K-T mg/L 1.4 0.31 0.97 0.81 0.63 0.56 0.3 0.525 0.4 0.64
Mg-T mg/L 3.07 2.17 8.08 6.24 7.61 7.12 1.22 6.855 6.09 7.83
Na-T mg/L 5.6 4.8 8 6.2 3.3 3.1 3.3 3.25 2.9 3.3
NITROGEN NH4-N mg/L 0.002 0.002 0.002 0.002 0.002 0.002 0.004 0.002 0.002 0.002
NOx-N mg/L 0.018 0.007 0.72 0.3 2.5 2.6 0.009 2 1.8 2.6
TKN mg/L 1 1.1 0.29 0.19 0.14 0.13 0.93 0.118 0.096 0.16
PHOSPHORUS OrthoP mg/L 0.13 0.11 0.086 0.079 0.035 0.031 0.014 0.038 0.034 0.032
TP mg/L 0.17 0.15 0.088 0.082 0.036 0.032 0.03 0.037 0.034 0.034
PHYSICAL Color PCU 322.35 390 9 13.25 13.85 2.5 280 2.5 14.25 2.5
pH SU 5.52 5.85 6.84 7.55 7.53 7.53 8.28 7.46 7.93 7.55
SpCond umhos/cm 82.8 62.2 436.4 432.5 417.1 396.6 134.3 409.7 349.5 409.9
Turb NTU 2.9 3.1 0.15 0.25 0.4 0.25 1 0.4 0.15 0.35
SOLID TDS mg/L 126 116 250 230 226 212 154 213 164 210
TSS mg/L 2 3 2 2 2 2 2 2 2 2
TEMPERATURE Wtr Temp C 11.9 10.6 22.5 22.4 22.5 22.3 11.5 22.5 22.3 22.6
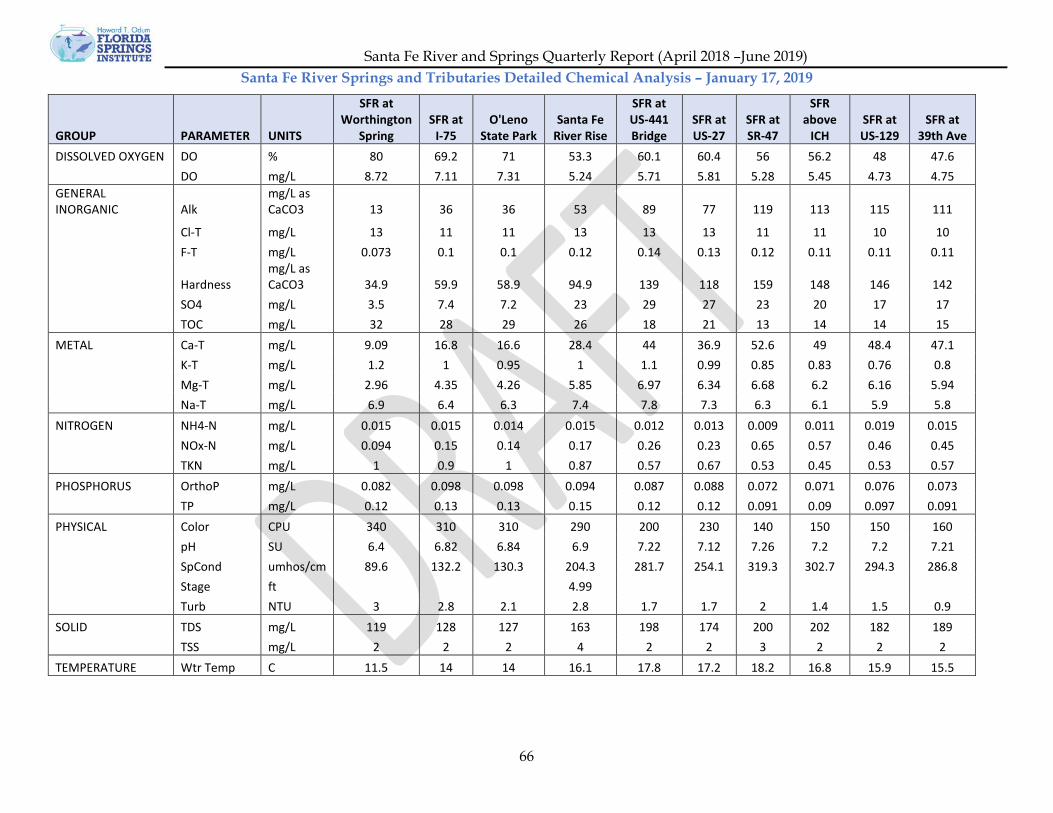
Santa Fe River and Springs Quarterly Report (April 2018 –June 2019)
66
Santa Fe River Springs and Tributaries Detailed Chemical Analysis – January 17, 2019
GROUP PARAMETER UNITS
SFR at Worthington
Spring SFR at
I-75 O'Leno
State Park Santa Fe
River Rise
SFR at US-441 Bridge
SFR at US-27
SFR at SR-47
SFR above
ICH SFR at US-129
SFR at 39th Ave
DISSOLVED OXYGEN DO % 80 69.2 71 53.3 60.1 60.4 56 56.2 48 47.6 DO mg/L 8.72 7.11 7.31 5.24 5.71 5.81 5.28 5.45 4.73 4.75 GENERAL INORGANIC Alk
mg/L as CaCO3 13 36 36 53 89 77 119 113 115 111
Cl-T mg/L 13 11 11 13 13 13 11 11 10 10 F-T mg/L 0.073 0.1 0.1 0.12 0.14 0.13 0.12 0.11 0.11 0.11
Hardness mg/L as CaCO3 34.9 59.9 58.9 94.9 139 118 159 148 146 142
SO4 mg/L 3.5 7.4 7.2 23 29 27 23 20 17 17 TOC mg/L 32 28 29 26 18 21 13 14 14 15 METAL Ca-T mg/L 9.09 16.8 16.6 28.4 44 36.9 52.6 49 48.4 47.1 K-T mg/L 1.2 1 0.95 1 1.1 0.99 0.85 0.83 0.76 0.8 Mg-T mg/L 2.96 4.35 4.26 5.85 6.97 6.34 6.68 6.2 6.16 5.94 Na-T mg/L 6.9 6.4 6.3 7.4 7.8 7.3 6.3 6.1 5.9 5.8 NITROGEN NH4-N mg/L 0.015 0.015 0.014 0.015 0.012 0.013 0.009 0.011 0.019 0.015 NOx-N mg/L 0.094 0.15 0.14 0.17 0.26 0.23 0.65 0.57 0.46 0.45 TKN mg/L 1 0.9 1 0.87 0.57 0.67 0.53 0.45 0.53 0.57 PHOSPHORUS OrthoP mg/L 0.082 0.098 0.098 0.094 0.087 0.088 0.072 0.071 0.076 0.073 TP mg/L 0.12 0.13 0.13 0.15 0.12 0.12 0.091 0.09 0.097 0.091 PHYSICAL Color CPU 340 310 310 290 200 230 140 150 150 160 pH SU 6.4 6.82 6.84 6.9 7.22 7.12 7.26 7.2 7.2 7.21 SpCond umhos/cm 89.6 132.2 130.3 204.3 281.7 254.1 319.3 302.7 294.3 286.8 Stage ft 4.99 Turb NTU 3 2.8 2.1 2.8 1.7 1.7 2 1.4 1.5 0.9 SOLID TDS mg/L 119 128 127 163 198 174 200 202 182 189 TSS mg/L 2 2 2 4 2 2 3 2 2 2 TEMPERATURE Wtr Temp C 11.5 14 14 16.1 17.8 17.2 18.2 16.8 15.9 15.5

Santa Fe River and Springs Quarterly Report (April 2018 –June 2019)
67
Santa Fe River Springs and Tributaries Detailed Chemical Analysis – February 18, 2019
PARAMETER UNITS Olustee Creek
Santa Fe
Spring Hornsby Spring
Poe Spring
Johnson Spring
Naked Spring
Gilchrist Blue Spring
Run
Little Blue
Spring
Devil's Eye
Spring Ginnie
Spring Run DO % 80.0 4.8 4.8 5.3 63.9 66.4 69.7 56.2 57.1 48.9 DO mg/L 7.8 0.4 0.4 0.5 5.5 5.7 6.0 4.9 4.8 4.2 Alk mg/L as CaCO3 1.5 131 164 198 183 179 175 171 173 152.5 Cl-T mg/L 8.5 9.7 13 12 7.4 7.1 7 6.8 7.2 6.35 F-T mg/L 0.064 0.22 0.17 0.12 0.11 0.1 0.1 0.096 0.098 0.0855 Hardness mg/L as CaCO3 17.7 167 212 223 214 209 204 199 197 172.5 SO4 mg/L 0.32 25 42 15 14 13 12 11 12 10 TOC mg/L 37 5.8 2.5 1.3 0.5 0.5 0.5 0.5 0.61 0.605 Ca-T mg/L 4.27 50.2 70.9 78.7 73.3 71.6 69.9 68.4 67.8 59.95 K-T mg/L 0.3 0.86 1 0.79 0.67 0.62 0.62 0.57 0.59 0.4 Mg-T mg/L 1.7 10 8.46 6.4 7.62 7.35 7.12 6.86 6.71 5.625 Na-T mg/L 4.1 5.4 7.4 6.1 3.3 3.1 3.1 2.9 3.2 2.7 NH4-N mg/L 0.01 0.01 0.002 0.002 0.002 0.002 0.002 0.002 0.004 0.005 NOx-N mg/L 0.011 0.56 0.61 0.36 2.3 2.4 2.4 2.4 2 1.65 TKN mg/L 1 0.3 0.29 0.16 0.093 0.084 0.32 0.08 0.21 0.125 OrthoP mg/L 0.1 0.12 0.082 0.08 0.032 0.032 0.031 0.031 0.037 0.033 TP mg/L 0.13 0.13 0.086 0.077 0.035 0.034 0.033 0.033 0.042 0.036 Color CPU 440 54 16 4.8 2.5 2.5 2.5 2.5 2.5 2.5 pH SU 4.87 7.09 7.08 7.06 7.24 7.26 7.31 7.24 7.23 7.38 SpCond umhos/cm 53.5 344.4 450.2 446.9 423.9 416.7 407.2 396.7 400.9 349.3 Stage ft 2.36 Turb NTU 2.2 0.45 0.15 0.15 0.5 0.2 0.35 0.15 0.2 0.125 TDS mg/L 107 203 261 238 203 225 207 192 198 186.5 TSS mg/L 2 2 2 2 2 2 2 2 2 2 Wtr Temp C 16.8 20.5 22.5 22.3 22.6 22.7 22.8 22.5 22.5 22.5

Santa Fe River and Springs Quarterly Report (April 2018 –June 2019)
68
Santa Fe River Springs and Tributaries Detailed Chemical Analysis – March 13, 2019
GROUP PARAMETER UNITS SFR below
Olustee Creek
Santa Fe
Spring
SFR at I-75
Hornsby Spring
SFR at US-27
Gilchrist Blue Spring
SFR at SR-47
SFR above
ICH
LIR-15
SFR at US-129
DISSOLVED OXYGEN DO % 76 3.7 59.9 4 57.7 57.9 58.7 63.3 71.9 63.8 DO mg/L 7.07 0.33 5.47 0.34 5.32 5 5.28 5.61 6.41 5.72 GENERAL INORGANIC Alk mg/L as CaCO3 13 134 43 166 92 173.5 128 127 155 128 Cl-T mg/L 12 9.8 11 13 13 6.25 11 11 6.6 11 F-T mg/L 0.084 0.26 0.13 0.17 0.15 0.1 0.14 0.13 0.14 0.13 Hardness mg/L as CaCO3 32.7 187 70.6 227 142 207 176 174 186 170 SO4 mg/L 2.1 31 9.5 38 31 10.15 25 24 13 22 TOC mg/L 32 5.3 24 2.2 17 0.5 10 11 0.8 9.1 METAL As-T ug/L 0.53 1.34 0.71 1.34 0.87 0.3 0.78 0.76 1.07 0.74 B-T ug/L 16.8 16.9 17.6 21 18.1 11.2 16.7 16.4 12.3 15.4 Ca-T mg/L 8.35 54.2 19.6 76.6 44.4 71.1 58.1 57.6 62 56.5 Cu-T ug/L 0.46 0.4 0.4 0.4 0.48 0.4 0.4 0.4 0.4 0.4 Fe-T ug/L 690 77 530 30 340 30 230 220 32 200 K-T mg/L 0.88 0.88 0.84 1.1 0.9 0.535 0.84 0.78 0.39 0.79 Na-T mg/L 6.7 6.6 6.8 8.8 8.2 3.5 7.1 6.9 4.5 6.3 Mg-T mg/L 2.88 12.6 5.25 8.65 7.45 7.24 7.5 7.28 7.66 7.05 Zn-T ug/L 5 5 5 5 5 5 5 5 5 5 NITROGEN NH4-N mg/L 0.025 0.009 0.023 0.006 0.011 0.002 0.006 0.007 0.008 0.008 NOx-N mg/L 0.11 0.48 0.18 0.57 0.35 2.4 0.78 0.74 0.49 0.69 TKN mg/L 1 0.21 0.81 0.18 0.59 0.081 0.47 0.43 0.1 0.39 PHOSPHORUS OrthoP mg/L 0.12 0.12 0.12 0.082 0.093 0.032 0.079 0.074 0.04 0.07 TP mg/L 0.17 0.13 0.16 0.069 0.12 0.0325 0.093 0.091 0.048 0.083 PHYSICAL pH SU 6.05 7.13 6.79 7.08 7.07 7.26 7.19 7.22 7.57 7.15 Color CPU 360 51 300 11 190 2.5 110 110 3.4 100 SpCond umhos/cm 83.8 364 150.8 447.5 293.7 393.6 338.7 335 352.1 334.8 Turb NTU 3.6 0.6 3.1 0.2 1.5 0.2 1.2 1.1 0.85 1.9 SOLID TDS mg/L 111 224 136 258 197 208 217 219 196 216 TSS mg/L 3 2 2 2 2 2 2 2 2 2 TEMPERATURE Wtr Temp C 18.8 21.2 19.7 22.5 19.2 22.6 20.4 20.4 21.1 20.7

Santa Fe River and Springs Quarterly Report (April 2018 –June 2019)
69
DEP Herbicide and Insecticide Analysis for Segment for March 2019
PARAMETER UNITS SFR below
Olustee Creek
Santa Fe
Spring
SFR at I-75
Hornsby Spring
SFR at US-27
Gilchrist Blue
Spring
SFR at SR-47
SFR above
ICH LIR-15
SFR at US-129
4,4'-DDD ng/L 8.4 8.5 8.3 8.6 8.4 8.45 8.8 8.4 8.7 8.3
4,4'-DDE ng/L 8.4 8.5 8.3 8.6 8.4 8.45 8.8 8.4 8.7 8.3
4,4'-DDT ng/L 11 11 10 11 11 11 11 10 11 10
a-BHC ng/L 2.1 2.1 2.1 2.1 2.1 2.1 2.2 2.1 2.2 2.1
Acesulfame K ng/L 0.1 0.1 0.1 0.1 0.1 0.1 0.1 0.1 0.1 0.1
Acetochlor ng/L 0.24 0.24 0.24 0.24 0.24 0.245 0.24 0.25 0.24 0.25
a-Chlordane ng/L 1.1 1.1 1 1.1 1.1 1.1 1.1 1 1.1 1
Alachlor ng/L 0.84 0.24 0.6 0.24 0.31 0.245 0.24 0.25 0.24 0.25
Aldrin ng/L 4.2 4.2 4.2 4.3 4.2 4.25 4.4 4.2 4.3 4.1
Ametryn ng/L 0.57 0.59 0.58 0.58 0.58 0.59 0.59 0.59 0.58 0.59
AMPA ug/L 0.1 0.1 0.1 0.1 0.1 0.1 0.1 0.1 0.1 0.1
Atrazine ng/L 4.8 0.36 3.6 0.41 5.1 0.26 3.3 3.3 0.24 3.5
Atrazine Desethyl ng/L 1.4 1.5 1.5 1.4 1.5 1.5 1.5 1.5 1.5 1.5
Azinphos Methyl ng/L 4.8 4.9 4.8 4.8 4.8 4.95 4.9 5 4.9 4.9
b-BHC ng/L 11 11 10 11 11 11 11 10 11 10
Bifenthrin ng/L 4.2 4.2 4.2 4.3 4.2 4.25 4.4 4.2 4.3 4.1
Bromacil ng/L 0.48 0.49 0.48 0.56 0.48 0.495 0.49 0.5 0.49 0.49
Butylate ng/L 0.38 0.39 0.39 0.39 0.39 0.395 0.39 0.4 0.39 0.39
Carbophenothion ng/L 13 13 12 13 13 13 13 13 13 12
Chlordane ng/L 5.3 5.3 5.2 5.4 5.3 5.3 5.5 5.2 5.4 5.2
Chlorothalonil ng/L 2.1 2.1 2.1 2.1 2.1 2.1 2.2 2.1 2.2 2.1
Chlorpyrifos Ethyl ng/L 0.24 0.24 0.24 0.24 0.24 0.245 0.24 0.25 0.24 0.25
Chlorpyrifos Methyl ng/L 0.096 0.098 0.097 0.096 0.097 0.0985 0.098 0.099 0.097 0.098
Cis-Nonachlor ng/L 1.1 1.1 1 1.1 1.1 1.1 1.1 1 1.1 1
Cyanazine ng/L 3.1 3.2 3.2 3.1 3.1 3.2 3.2 3.2 3.2 3.2
Cypermethrin ng/L 21 21 21 21 21 21 22 21 22 21
d-BHC ng/L 11 11 10 11 11 11 11 10 11 10
Decachlorobiphenyl ng/L 19900 27900 20750 36100 20850 38050 24100 28300 34350 25150
Demeton ng/L 6.7 6.8 6.8 6.7 6.8 6.9 6.9 6.9 6.8 6.9
Diazinon ng/L 0.12 0.12 0.12 0.12 0.12 0.12 0.12 0.12 0.12 0.12
Dicofol ng/L 32 32 31 32 32 32 33 31 33 31
Dieldrin ng/L 4.2 4.2 4.2 4.3 4.2 4.25 4.4 4.2 4.3 4.1
Dimethenamid ng/L 0.096 0.098 0.097 0.096 0.097 0.0985 0.098 0.099 0.097 0.098
Disulfoton ng/L 0.48 0.49 0.48 0.48 0.48 0.495 0.49 0.5 0.49 0.49
Dithiopyr ng/L 0.096 0.098 0.097 0.096 0.097 0.0985 0.098 0.099 0.097 0.098
Endosulfan I ng/L 4.2 4.2 4.2 4.3 4.2 4.25 4.4 4.2 4.3 4.1
Endosulfan II ng/L 4.2 4.2 4.2 4.3 4.2 4.25 4.4 4.2 4.3 4.1
Endosulfan sulfate ng/L 2.1 2.1 2.1 2.1 2.1 2.1 2.2 2.1 2.2 2.1
Endothall ng/L 0.25 0.25 0.25 0.25 0.25 0.25 0.25 0.25 0.25 0.25
Endothall-d6 ng/L 7.33 5.15 7.16 4.51 7.05 4.665 5.67 5.94 5.11 5.58
Endrin ng/L 2.1 2.1 2.1 2.1 2.1 2.1 2.2 2.1 2.2 2.1
Endrin aldehyde ng/L 2.1 2.1 2.1 2.1 2.1 2.1 2.2 2.1 2.2 2.1

Santa Fe River and Springs Quarterly Report (April 2018 –June 2019)
70
Endrin Ketone ng/L 2.1 2.1 2.1 2.1 2.1 2.1 2.2 2.1 2.2 2.1
EPTC ng/L 1.2 1.2 1.2 1.2 1.2 1.2 1.2 1.2 1.2 1.2
Ethalfluralin ng/L 3.2 3.2 3.1 3.2 3.2 3.2 3.3 3.1 3.3 3.1
Ethion ng/L 0.14 0.15 0.15 0.14 0.15 0.15 0.15 0.15 0.15 0.15
Ethoprop ng/L 0.096 0.098 0.097 0.096 0.097 0.0985 0.098 0.099 0.097 0.098
Fenamiphos ng/L 0.48 0.49 0.48 0.48 0.48 0.495 0.49 0.5 0.49 0.49
Fipronil ng/L 0.24 0.24 0.24 0.24 0.24 0.245 0.24 0.25 0.24 0.25
Fipronil Desulfinyl ng/L 0.12 0.12 0.12 0.12 0.12 0.12 0.12 0.12 0.12 0.12
Fipronil Sulfide ng/L 0.14 0.15 0.15 0.14 0.15 0.15 0.15 0.15 0.15 0.15
Fipronil Sulfone ng/L 0.14 0.15 0.15 0.14 0.15 0.15 0.15 0.15 0.15 0.15
Fonofos ng/L 0.19 0.2 0.19 0.19 0.19 0.195 0.2 0.2 0.19 0.2
g-BHC ng/L 11 11 10 11 11 11 11 10 11 10
g-Chlordane ng/L 1.1 1.1 1 1.1 1.1 1.1 1.1 1 1.1 1
Glufosinate ng/L 0.1 0.1 0.1 0.1 0.1 0.1 0.1 0.1 0.1 0.1
Glyphosate ug/L 0.1 0.1 0.1 0.1 0.1 0.1 0.1 0.1 0.1 0.1
Glyphosate 13C 15N ng/L 4.45 3.58 4.5 3.49 4.4 3.505 3.54 3.43 3.68 3.6
Heptachlor ng/L 1.6 1.6 1.6 1.6 1.6 1.6 1.6 1.6 1.6 1.6
Heptachlor epoxide ng/L 2.1 2.1 2.1 2.1 2.1 2.1 2.2 2.1 2.2 2.1
Hexachlorobenzene ng/L 2.1 2.1 2.1 2.1 2.1 2.1 2.2 2.1 2.2 2.1
Hexazinone ng/L 0.48 0.52 0.48 0.59 0.48 0.495 0.51 0.5 0.49 0.49
Malathion ng/L 0.33 0.34 0.34 0.34 0.34 0.345 0.34 0.35 0.34 0.34
Metalaxyl ng/L 0.29 0.29 0.29 0.29 0.29 0.295 0.29 0.3 0.29 0.29
Methoxychlor ng/L 4.2 4.2 4.2 4.3 4.2 4.25 4.4 4.2 4.3 4.1
Metolachlor ng/L 1.4 0.49 1.1 0.48 0.55 0.66 0.49 0.5 0.49 0.49
Metribuzin ng/L 0.72 0.73 0.73 0.72 0.73 0.74 0.73 0.74 0.73 0.74
Mevinphos ng/L 0.48 0.49 0.48 0.48 0.48 0.495 0.49 0.5 0.49 0.49
Mirex ng/L 2.1 2.1 2.1 2.1 2.1 2.1 2.2 2.1 2.2 2.1
Molinate ng/L 0.29 0.29 0.29 0.29 0.29 0.295 0.29 0.3 0.29 0.29
Norflurazon ng/L 0.48 0.49 0.48 0.48 0.48 0.495 0.49 0.5 0.49 0.49
Oxadiazon ng/L 0.096 0.098 0.097 0.096 0.097 0.0985 0.098 0.099 0.097 0.098
Parathion Ethyl ng/L 0.24 0.24 0.24 0.24 0.24 0.245 0.24 0.25 0.24 0.25
Parathion Methyl ng/L 0.53 0.54 0.53 0.53 0.53 0.545 0.54 0.55 0.54 0.54
PCNB ng/L 33300 32600 36600 40100 30000 37150 27100 34200 33800 31700
Pendimethalin ng/L 0.96 0.98 0.97 0.96 0.97 0.985 0.98 0.99 0.97 0.98
Permethrin ng/L 11 11 10 11 11 11 11 10 11 10
Phorate ng/L 0.24 0.24 0.24 0.24 0.24 0.245 0.24 0.25 0.24 0.25
Prodiamine ng/L 0.17 0.17 0.17 0.17 0.17 0.17 0.17 0.17 0.17 0.17
Prometon ng/L 0.86 0.88 0.87 0.87 0.87 0.89 0.88 0.89 0.88 0.88
Prometryn ng/L 0.19 0.2 0.19 0.19 0.19 0.195 0.2 0.2 0.19 0.2
Simazine ng/L 0.97 0.49 0.64 0.48 0.49 0.495 0.49 0.5 0.49 0.49
Simazine-d10 ng/L 14600 18700 16900 17000 18000 18550 17600 15000 19900 19500
Sucralose ug/L 0.034 0.011 0.027 0.09 0.06 0.013 0.04 0.044 0.01 0.042
Sucralose-d6 ng/L 3.67 3.84 3.7 3.66 3.87 3.975 3.88 3.85 4.01 3.83
Tebuconazole ng/L 0.48 0.49 0.48 0.48 0.48 0.495 0.49 0.5 0.49 0.49
Terbufos ng/L 0.096 0.098 0.097 0.096 0.097 0.0985 0.098 0.099 0.097 0.098
Terbufos-d10 ng/L 14500 17700 16200 16800 18300 16900 17300 13400 17700 17900

Santa Fe River and Springs Quarterly Report (April 2018 –June 2019)
71
Terbuthylazine ng/L 0.41 0.42 0.41 0.41 0.41 0.415 0.42 0.42 0.41 0.42
Tetrachloro-m-xylene ng/L 20500 23500 23300 30500 23300 33800 21000 25900 26400 24500
Toxaphene ng/L 32 32 31 32 32 32 33 31 33 31
Trans-Nonachlor ng/L 1.1 1.1 1 1.1 1.1 1.1 1.1 1 1.1 1
Trifluralin ng/L 2.6 2.7 2.6 2.7 2.6 2.65 2.7 2.6 2.7 2.6

Santa Fe River and Springs Quarterly Report (April 2018 –June 2019)
72
Santa Fe River Springs and Tributaries Detailed Chemical Analysis – April 13, 2019
GROUP PARAMETER UNITS Betty Spring
Cedar Head
Spring Run
LIR-15
Trail Spring
Troop Spring
Ichetucknee Head Spring
Blue Hole
Spring
Rum Island Spring
Wilson Spring
ICH Tube
Takeout
DISSOLVED OXYGEN DO % 62.50 51.50 67.50 7.80 22.50 60.50 24.40 46.70 6.50 90.50 DO mg/L 5.49 4.49 5.99 0.69 1.97 5.35 2.14 4.03 0.58 7.91 GENERAL INORGANIC Alk
mg/L as CaCO3 163 158 156 166 170 162 151 188 140 153
Cl-T mg/L 11 5.2 6.7 11 26 4.7 5.8 8.2 11 6.6 F-T mg/L 0.13 0.11 0.14 0.13 0.08 0.1 0.12 0.12 0.16 0.14
Hardness mg/L as CaCO3 224 184 188 219 355 188 175 230 201 180
SO4 mg/L 35 5.9 13 29 78 8.9 4.9 16 36 11 TOC mg/L 1.7 0.5 0.5 1.9 1.6 0.51 1 0.5 3.3 0.55 METAL Ca-T mg/L 76.5 63.5 62.8 73.9 121 64.1 60.4 78.8 66.8 59.9 K-T mg/L 1.8 0.36 0.48 1.7 24.7 0.3 0.51 0.77 0.75 0.46 Mg-T mg/L 7.92 6.25 7.65 8.35 12.9 6.78 5.96 7.95 8.43 7.49 Na-T mg/L 5.9 3.1 4.4 6.6 21.5 2.8 3.9 4.6 6.5 4.4 NITROGEN NH4-N mg/L 0.005 0.003 0.002 0.006 0.027 0.008 0.012 0.002 0.003 0.005 NOx-N mg/L 2.5 0.85 0.79 2.2 36 0.57 0.69 1.9 0.64 0.51 TKN mg/L 0.25 0.08 0.08 0.23 0.4 0.08 0.094 0.18 0.19 0.089 PHOSPHORUS OrthoP mg/L 0.059 0.032 0.04 0.058 0.075 0.023 0.046 0.047 0.085 0.04 TP mg/L 0.064 0.038 0.026 0.066 0.082 0.051 0.07 0.052 0.09 0.06 PHYSICAL Color CPU 11 2.5 2.5 13 5.8 2.5 2.5 2.5 32 2.5 pH SU 7.41 7.47 7.63 7.07 7.05 7.37 7.44 7.27 7.1 7.9 SpCond umhos/cm 440 337.5 350.5 485.6 854 355.4 322.7 429.6 389.7 338.6 Turb NTU 0.45 0.4 0.35 0.55 0.5 0.15 0.15 0.15 0.3 0.45 SOLID TDS mg/L 258 192 196 249 614 195 187 243 231 185 TSS mg/L 2 2 2 2 2 2 2 2 2 2 TEMPERATURE Wtr Temp C 21.8 22.1 21.1 21.6 21.8 21.5 21.7 22.7 21.3 22
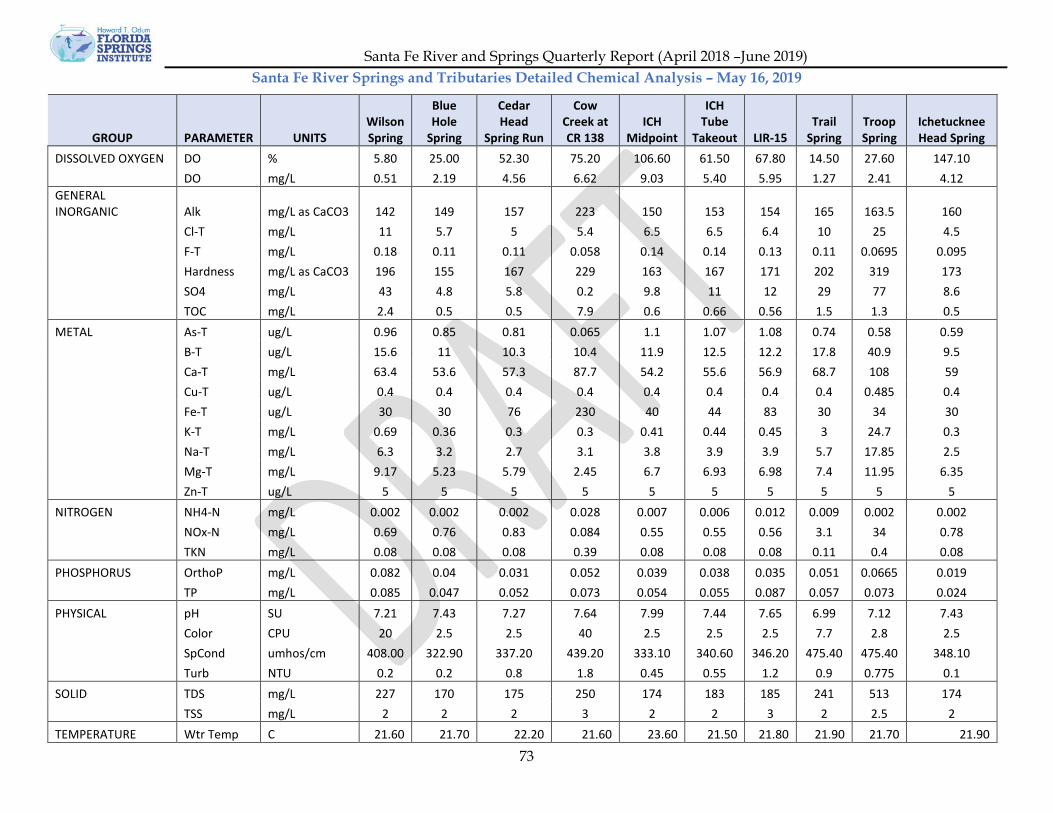
Santa Fe River and Springs Quarterly Report (April 2018 –June 2019)
73
Santa Fe River Springs and Tributaries Detailed Chemical Analysis – May 16, 2019
GROUP PARAMETER UNITS Wilson Spring
Blue Hole
Spring
Cedar Head
Spring Run
Cow Creek at CR 138
ICH Midpoint
ICH Tube
Takeout LIR-15 Trail
Spring Troop Spring
Ichetucknee Head Spring
DISSOLVED OXYGEN DO % 5.80 25.00 52.30 75.20 106.60 61.50 67.80 14.50 27.60 147.10 DO mg/L 0.51 2.19 4.56 6.62 9.03 5.40 5.95 1.27 2.41 4.12 GENERAL INORGANIC Alk mg/L as CaCO3 142 149 157 223 150 153 154 165 163.5 160 Cl-T mg/L 11 5.7 5 5.4 6.5 6.5 6.4 10 25 4.5 F-T mg/L 0.18 0.11 0.11 0.058 0.14 0.14 0.13 0.11 0.0695 0.095 Hardness mg/L as CaCO3 196 155 167 229 163 167 171 202 319 173 SO4 mg/L 43 4.8 5.8 0.2 9.8 11 12 29 77 8.6 TOC mg/L 2.4 0.5 0.5 7.9 0.6 0.66 0.56 1.5 1.3 0.5 METAL As-T ug/L 0.96 0.85 0.81 0.065 1.1 1.07 1.08 0.74 0.58 0.59 B-T ug/L 15.6 11 10.3 10.4 11.9 12.5 12.2 17.8 40.9 9.5 Ca-T mg/L 63.4 53.6 57.3 87.7 54.2 55.6 56.9 68.7 108 59 Cu-T ug/L 0.4 0.4 0.4 0.4 0.4 0.4 0.4 0.4 0.485 0.4 Fe-T ug/L 30 30 76 230 40 44 83 30 34 30 K-T mg/L 0.69 0.36 0.3 0.3 0.41 0.44 0.45 3 24.7 0.3 Na-T mg/L 6.3 3.2 2.7 3.1 3.8 3.9 3.9 5.7 17.85 2.5 Mg-T mg/L 9.17 5.23 5.79 2.45 6.7 6.93 6.98 7.4 11.95 6.35 Zn-T ug/L 5 5 5 5 5 5 5 5 5 5 NITROGEN NH4-N mg/L 0.002 0.002 0.002 0.028 0.007 0.006 0.012 0.009 0.002 0.002 NOx-N mg/L 0.69 0.76 0.83 0.084 0.55 0.55 0.56 3.1 34 0.78 TKN mg/L 0.08 0.08 0.08 0.39 0.08 0.08 0.08 0.11 0.4 0.08 PHOSPHORUS OrthoP mg/L 0.082 0.04 0.031 0.052 0.039 0.038 0.035 0.051 0.0665 0.019 TP mg/L 0.085 0.047 0.052 0.073 0.054 0.055 0.087 0.057 0.073 0.024 PHYSICAL pH SU 7.21 7.43 7.27 7.64 7.99 7.44 7.65 6.99 7.12 7.43 Color CPU 20 2.5 2.5 40 2.5 2.5 2.5 7.7 2.8 2.5 SpCond umhos/cm 408.00 322.90 337.20 439.20 333.10 340.60 346.20 475.40 475.40 348.10 Turb NTU 0.2 0.2 0.8 1.8 0.45 0.55 1.2 0.9 0.775 0.1 SOLID TDS mg/L 227 170 175 250 174 183 185 241 513 174 TSS mg/L 2 2 2 3 2 2 3 2 2.5 2 TEMPERATURE Wtr Temp C 21.60 21.70 22.20 21.60 23.60 21.50 21.80 21.90 21.70 21.90
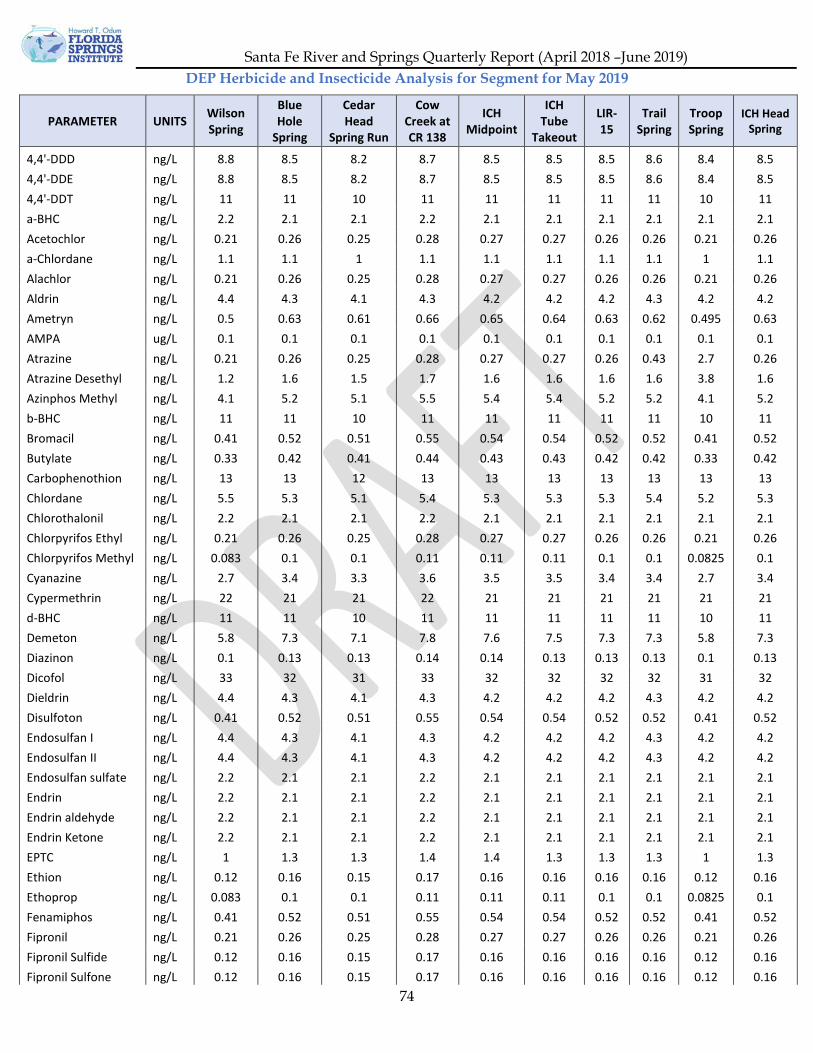
Santa Fe River and Springs Quarterly Report (April 2018 –June 2019)
74
DEP Herbicide and Insecticide Analysis for Segment for May 2019
PARAMETER UNITS Wilson Spring
Blue Hole
Spring
Cedar Head
Spring Run
Cow Creek at CR 138
ICH Midpoint
ICH Tube
Takeout
LIR-15
Trail Spring
Troop Spring
ICH Head Spring
4,4'-DDD ng/L 8.8 8.5 8.2 8.7 8.5 8.5 8.5 8.6 8.4 8.5 4,4'-DDE ng/L 8.8 8.5 8.2 8.7 8.5 8.5 8.5 8.6 8.4 8.5 4,4'-DDT ng/L 11 11 10 11 11 11 11 11 10 11 a-BHC ng/L 2.2 2.1 2.1 2.2 2.1 2.1 2.1 2.1 2.1 2.1 Acetochlor ng/L 0.21 0.26 0.25 0.28 0.27 0.27 0.26 0.26 0.21 0.26 a-Chlordane ng/L 1.1 1.1 1 1.1 1.1 1.1 1.1 1.1 1 1.1 Alachlor ng/L 0.21 0.26 0.25 0.28 0.27 0.27 0.26 0.26 0.21 0.26 Aldrin ng/L 4.4 4.3 4.1 4.3 4.2 4.2 4.2 4.3 4.2 4.2 Ametryn ng/L 0.5 0.63 0.61 0.66 0.65 0.64 0.63 0.62 0.495 0.63 AMPA ug/L 0.1 0.1 0.1 0.1 0.1 0.1 0.1 0.1 0.1 0.1 Atrazine ng/L 0.21 0.26 0.25 0.28 0.27 0.27 0.26 0.43 2.7 0.26 Atrazine Desethyl ng/L 1.2 1.6 1.5 1.7 1.6 1.6 1.6 1.6 3.8 1.6 Azinphos Methyl ng/L 4.1 5.2 5.1 5.5 5.4 5.4 5.2 5.2 4.1 5.2 b-BHC ng/L 11 11 10 11 11 11 11 11 10 11 Bromacil ng/L 0.41 0.52 0.51 0.55 0.54 0.54 0.52 0.52 0.41 0.52 Butylate ng/L 0.33 0.42 0.41 0.44 0.43 0.43 0.42 0.42 0.33 0.42 Carbophenothion ng/L 13 13 12 13 13 13 13 13 13 13 Chlordane ng/L 5.5 5.3 5.1 5.4 5.3 5.3 5.3 5.4 5.2 5.3 Chlorothalonil ng/L 2.2 2.1 2.1 2.2 2.1 2.1 2.1 2.1 2.1 2.1 Chlorpyrifos Ethyl ng/L 0.21 0.26 0.25 0.28 0.27 0.27 0.26 0.26 0.21 0.26 Chlorpyrifos Methyl ng/L 0.083 0.1 0.1 0.11 0.11 0.11 0.1 0.1 0.0825 0.1 Cyanazine ng/L 2.7 3.4 3.3 3.6 3.5 3.5 3.4 3.4 2.7 3.4 Cypermethrin ng/L 22 21 21 22 21 21 21 21 21 21 d-BHC ng/L 11 11 10 11 11 11 11 11 10 11 Demeton ng/L 5.8 7.3 7.1 7.8 7.6 7.5 7.3 7.3 5.8 7.3 Diazinon ng/L 0.1 0.13 0.13 0.14 0.14 0.13 0.13 0.13 0.1 0.13 Dicofol ng/L 33 32 31 33 32 32 32 32 31 32 Dieldrin ng/L 4.4 4.3 4.1 4.3 4.2 4.2 4.2 4.3 4.2 4.2 Disulfoton ng/L 0.41 0.52 0.51 0.55 0.54 0.54 0.52 0.52 0.41 0.52 Endosulfan I ng/L 4.4 4.3 4.1 4.3 4.2 4.2 4.2 4.3 4.2 4.2 Endosulfan II ng/L 4.4 4.3 4.1 4.3 4.2 4.2 4.2 4.3 4.2 4.2 Endosulfan sulfate ng/L 2.2 2.1 2.1 2.2 2.1 2.1 2.1 2.1 2.1 2.1 Endrin ng/L 2.2 2.1 2.1 2.2 2.1 2.1 2.1 2.1 2.1 2.1 Endrin aldehyde ng/L 2.2 2.1 2.1 2.2 2.1 2.1 2.1 2.1 2.1 2.1 Endrin Ketone ng/L 2.2 2.1 2.1 2.2 2.1 2.1 2.1 2.1 2.1 2.1 EPTC ng/L 1 1.3 1.3 1.4 1.4 1.3 1.3 1.3 1 1.3 Ethion ng/L 0.12 0.16 0.15 0.17 0.16 0.16 0.16 0.16 0.12 0.16 Ethoprop ng/L 0.083 0.1 0.1 0.11 0.11 0.11 0.1 0.1 0.0825 0.1 Fenamiphos ng/L 0.41 0.52 0.51 0.55 0.54 0.54 0.52 0.52 0.41 0.52 Fipronil ng/L 0.21 0.26 0.25 0.28 0.27 0.27 0.26 0.26 0.21 0.26 Fipronil Sulfide ng/L 0.12 0.16 0.15 0.17 0.16 0.16 0.16 0.16 0.12 0.16 Fipronil Sulfone ng/L 0.12 0.16 0.15 0.17 0.16 0.16 0.16 0.16 0.12 0.16
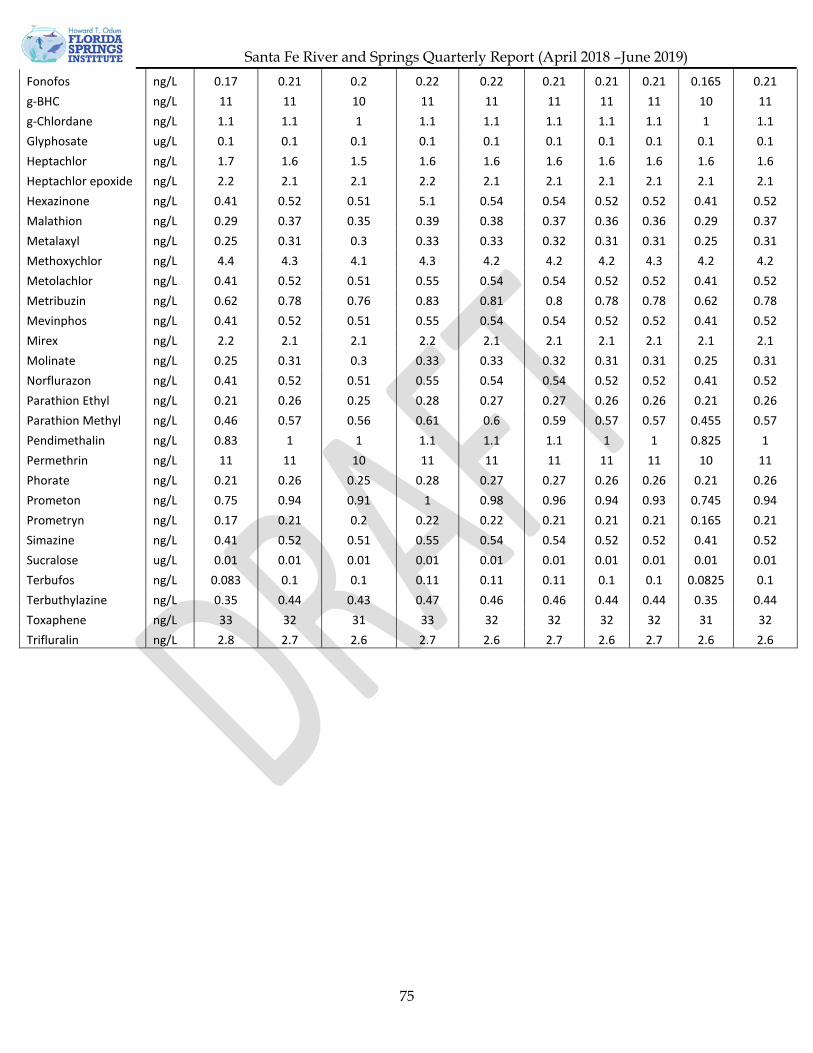
Santa Fe River and Springs Quarterly Report (April 2018 –June 2019)
75
Fonofos ng/L 0.17 0.21 0.2 0.22 0.22 0.21 0.21 0.21 0.165 0.21 g-BHC ng/L 11 11 10 11 11 11 11 11 10 11 g-Chlordane ng/L 1.1 1.1 1 1.1 1.1 1.1 1.1 1.1 1 1.1 Glyphosate ug/L 0.1 0.1 0.1 0.1 0.1 0.1 0.1 0.1 0.1 0.1 Heptachlor ng/L 1.7 1.6 1.5 1.6 1.6 1.6 1.6 1.6 1.6 1.6 Heptachlor epoxide ng/L 2.2 2.1 2.1 2.2 2.1 2.1 2.1 2.1 2.1 2.1 Hexazinone ng/L 0.41 0.52 0.51 5.1 0.54 0.54 0.52 0.52 0.41 0.52 Malathion ng/L 0.29 0.37 0.35 0.39 0.38 0.37 0.36 0.36 0.29 0.37 Metalaxyl ng/L 0.25 0.31 0.3 0.33 0.33 0.32 0.31 0.31 0.25 0.31 Methoxychlor ng/L 4.4 4.3 4.1 4.3 4.2 4.2 4.2 4.3 4.2 4.2 Metolachlor ng/L 0.41 0.52 0.51 0.55 0.54 0.54 0.52 0.52 0.41 0.52 Metribuzin ng/L 0.62 0.78 0.76 0.83 0.81 0.8 0.78 0.78 0.62 0.78 Mevinphos ng/L 0.41 0.52 0.51 0.55 0.54 0.54 0.52 0.52 0.41 0.52 Mirex ng/L 2.2 2.1 2.1 2.2 2.1 2.1 2.1 2.1 2.1 2.1 Molinate ng/L 0.25 0.31 0.3 0.33 0.33 0.32 0.31 0.31 0.25 0.31 Norflurazon ng/L 0.41 0.52 0.51 0.55 0.54 0.54 0.52 0.52 0.41 0.52 Parathion Ethyl ng/L 0.21 0.26 0.25 0.28 0.27 0.27 0.26 0.26 0.21 0.26 Parathion Methyl ng/L 0.46 0.57 0.56 0.61 0.6 0.59 0.57 0.57 0.455 0.57 Pendimethalin ng/L 0.83 1 1 1.1 1.1 1.1 1 1 0.825 1 Permethrin ng/L 11 11 10 11 11 11 11 11 10 11 Phorate ng/L 0.21 0.26 0.25 0.28 0.27 0.27 0.26 0.26 0.21 0.26 Prometon ng/L 0.75 0.94 0.91 1 0.98 0.96 0.94 0.93 0.745 0.94 Prometryn ng/L 0.17 0.21 0.2 0.22 0.22 0.21 0.21 0.21 0.165 0.21 Simazine ng/L 0.41 0.52 0.51 0.55 0.54 0.54 0.52 0.52 0.41 0.52 Sucralose ug/L 0.01 0.01 0.01 0.01 0.01 0.01 0.01 0.01 0.01 0.01 Terbufos ng/L 0.083 0.1 0.1 0.11 0.11 0.11 0.1 0.1 0.0825 0.1 Terbuthylazine ng/L 0.35 0.44 0.43 0.47 0.46 0.46 0.44 0.44 0.35 0.44 Toxaphene ng/L 33 32 31 33 32 32 32 32 31 32 Trifluralin ng/L 2.8 2.7 2.6 2.7 2.6 2.7 2.6 2.7 2.6 2.6
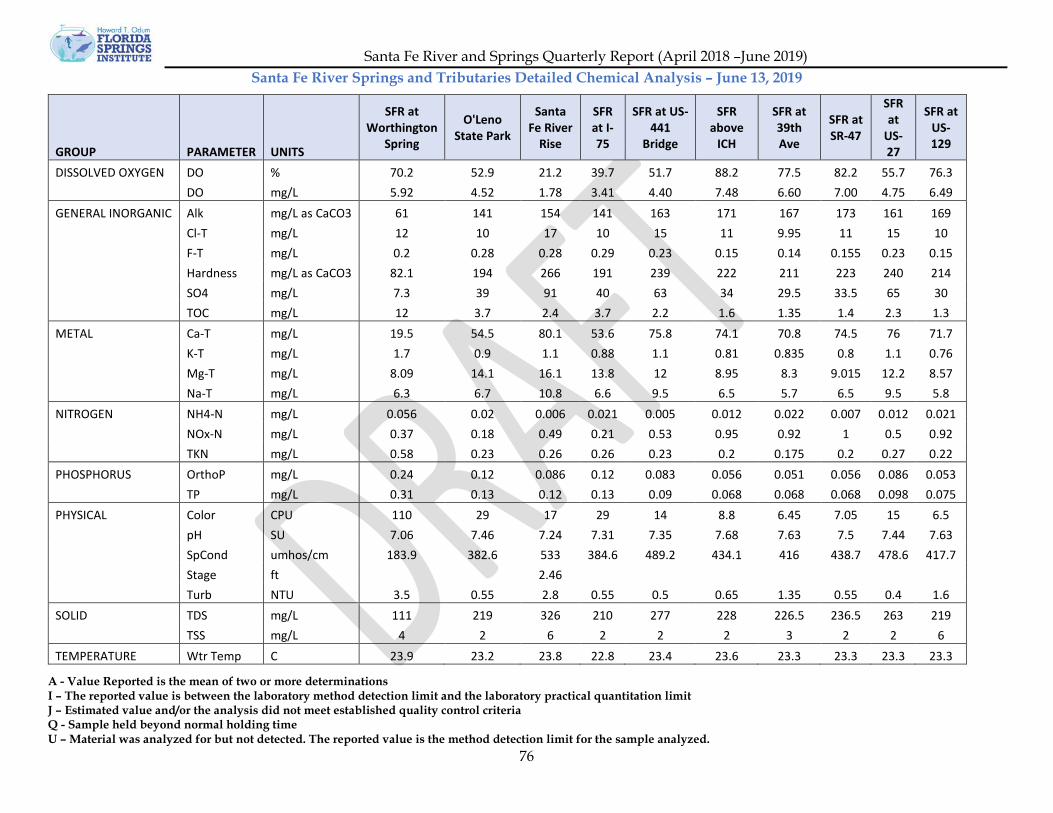
Santa Fe River and Springs Quarterly Report (April 2018 –June 2019)
76
Santa Fe River Springs and Tributaries Detailed Chemical Analysis – June 13, 2019
GROUP PARAMETER UNITS
SFR at Worthington
Spring
O'Leno State Park
Santa Fe River
Rise
SFR at I-75
SFR at US-441
Bridge
SFR above
ICH
SFR at 39th Ave
SFR at SR-47
SFR at
US-27
SFR at US-129
DISSOLVED OXYGEN DO % 70.2 52.9 21.2 39.7 51.7 88.2 77.5 82.2 55.7 76.3 DO mg/L 5.92 4.52 1.78 3.41 4.40 7.48 6.60 7.00 4.75 6.49 GENERAL INORGANIC Alk mg/L as CaCO3 61 141 154 141 163 171 167 173 161 169 Cl-T mg/L 12 10 17 10 15 11 9.95 11 15 10 F-T mg/L 0.2 0.28 0.28 0.29 0.23 0.15 0.14 0.155 0.23 0.15 Hardness mg/L as CaCO3 82.1 194 266 191 239 222 211 223 240 214 SO4 mg/L 7.3 39 91 40 63 34 29.5 33.5 65 30 TOC mg/L 12 3.7 2.4 3.7 2.2 1.6 1.35 1.4 2.3 1.3 METAL Ca-T mg/L 19.5 54.5 80.1 53.6 75.8 74.1 70.8 74.5 76 71.7 K-T mg/L 1.7 0.9 1.1 0.88 1.1 0.81 0.835 0.8 1.1 0.76 Mg-T mg/L 8.09 14.1 16.1 13.8 12 8.95 8.3 9.015 12.2 8.57 Na-T mg/L 6.3 6.7 10.8 6.6 9.5 6.5 5.7 6.5 9.5 5.8 NITROGEN NH4-N mg/L 0.056 0.02 0.006 0.021 0.005 0.012 0.022 0.007 0.012 0.021 NOx-N mg/L 0.37 0.18 0.49 0.21 0.53 0.95 0.92 1 0.5 0.92 TKN mg/L 0.58 0.23 0.26 0.26 0.23 0.2 0.175 0.2 0.27 0.22 PHOSPHORUS OrthoP mg/L 0.24 0.12 0.086 0.12 0.083 0.056 0.051 0.056 0.086 0.053 TP mg/L 0.31 0.13 0.12 0.13 0.09 0.068 0.068 0.068 0.098 0.075 PHYSICAL Color CPU 110 29 17 29 14 8.8 6.45 7.05 15 6.5 pH SU 7.06 7.46 7.24 7.31 7.35 7.68 7.63 7.5 7.44 7.63 SpCond umhos/cm 183.9 382.6 533 384.6 489.2 434.1 416 438.7 478.6 417.7 Stage ft 2.46 Turb NTU 3.5 0.55 2.8 0.55 0.5 0.65 1.35 0.55 0.4 1.6 SOLID TDS mg/L 111 219 326 210 277 228 226.5 236.5 263 219 TSS mg/L 4 2 6 2 2 2 3 2 2 6 TEMPERATURE Wtr Temp C 23.9 23.2 23.8 22.8 23.4 23.6 23.3 23.3 23.3 23.3
A - Value Reported is the mean of two or more determinations I – The reported value is between the laboratory method detection limit and the laboratory practical quantitation limit J – Estimated value and/or the analysis did not meet established quality control criteria Q - Sample held beyond normal holding time U – Material was analyzed for but not detected. The reported value is the method detection limit for the sample analyzed.

Santa Fe River and Springs Quarterly Report (April 2018 –June 2019)
77
Appendix B Quarters 1-5 Fish Data
The following tables present the results of fish surveys at Gilchrist Blue Spring, Naked Spring, and Poe Spring Systems and at the Ichetucknee Headspring, Blue Hole Spring, and the run from the Ichetucknee Head Spring to just below the Blue Hole confluence during the first five quarters of Phase 2 of the Lower Santa Fe River Springs Project. Density and biomass are represented as #/hectare and kilogram/hectare, respectively. Quarters with multiple fish counts have been averaged.

Santa Fe River and Springs Quarterly Report (April 2018 –June 2019)
78
Gilchrist Blue Spring Fish Summary
Count Density Biomass Count Density Biomass Count Density Biomass Count Density BiomassAtlantic Needlefish --- --- --- --- --- --- --- --- --- 3 18 0.81Blackbanded Darter --- --- --- --- --- --- --- --- --- 5 4 0.03Bluefin Killifish 5 4 0.01 238 140 0.42 154 271 0.04 342 619 0.07Bluegill Sunfish 234 46 0.96 104 31 0.64 72 127 5.64 519 240 4.21brook silverside --- --- --- --- --- --- --- --- --- 200 2,407 12.00Brown Darter --- --- --- --- --- --- --- --- --- 11 7 0.02Darter sp. --- --- --- 1 2 0.00 --- --- --- --- --- ---Eastern Mosquitofish 93 55 0.01 60 106 0.18 --- --- --- 1,968 1,988 1.12Golden Shiner --- --- --- --- --- --- 24 42 0.57 4 7 1.39Hogchoker 2 2 0.04 1 2 0.04 1 2 0.03 37 38 0.52Lake Chubsucker --- --- --- 2 4 1.94 --- --- --- 1 12 1.90Largemouth Bass 113 17 3.77 61 18 4.07 85 150 6.46 193 128 31.09Minnows 108 38 0.02 1,541 542 0.13 --- --- --- 5,190 5,149 1.28Mullet --- --- --- --- --- --- 107 188 226.94 --- --- ---Pickerel --- --- --- --- --- --- --- --- --- 1 2 0.01Redbreast Sunfish 394 58 3.95 16 9 0.40 2 4 0.15 58 34 1.10Redear Sunfish --- --- --- --- --- --- --- --- --- 26 14 0.71Redeye Chub --- --- --- --- --- --- 41 72 0.02 6,632 4,561 8.04Russetfin topminnow 7 3 0.01 --- --- --- --- --- --- --- --- ---Sailfin Molly --- --- --- --- --- --- 1 2 0.00 20 23 0.33Seminole Killifish 5 3 0.01 --- --- --- --- --- --- 14 29 0.11Shiners --- --- --- --- --- --- --- --- --- 1,351 1,189 4.45Spotted sucker 3 5 1.66 8 14 4.43 --- --- --- --- --- ---Spotted Sunfish 277 49 1.28 146 51 1.35 56 99 2.60 418 194 3.53Striped mullet 29 26 0.97 --- --- --- --- --- --- --- --- ---Sunfish sp. 669 235 6.21 849 249 6.56 521 917 8.23 1,934 1,318 24.09Suwannee Bass --- --- --- --- --- --- --- --- --- 1 2 1.25swamp darter --- --- --- --- --- --- --- --- --- 1 2 0.01
Q1 Q3 Q4 Q5Common Name

Santa Fe River and Springs Quarterly Report (April 2018 –June 2019)
79
Naked Spring Fish Summary
Count Density Biomass Count Density Biomass Count Density BiomassBlackbanded Darter --- --- --- --- --- --- 4 17 0.13Bluefin Kil l ifish --- --- --- --- --- --- 25 213 0.05Bluegil l Sunfish 186 396 22.35 --- --- --- 250 426 9.32Bowfin --- --- --- --- --- --- 4 9 1.21Brown Darter --- --- --- --- --- --- 1 9 0.01Darter sp. --- --- --- 1 9 0.01 --- --- ---Eastern Mosquitofish 9 26 0.75 --- --- --- 72 204 0.20Hogchoker --- --- --- --- --- --- 2 17 0.36Lake Chubsucker 6 26 6.85 --- --- --- 29 62 18.76Largemouth Bass 29 41 4.78 21 89 20.35 80 170 18.70Minnows 10 85 0.02 90 767 0.19 405 1,150 0.43Pickerel --- --- --- --- --- --- 2 9 0.26Redbreast Sunfish 164 349 30.29 --- --- --- 9 38 2.43Redear Sunfish --- --- --- --- --- --- 25 71 4.00Redeye Chub --- --- --- --- --- --- 6,889 14,670 21.60Russetfin topminnow 1 9 0.04 --- --- --- --- --- ---Sailfin Molly --- --- --- --- --- --- 2 9 0.10Seminole Kil l ifish --- --- --- --- --- --- 2 17 0.02Spotted Sunfish 240 511 13.47 --- --- --- 311 662 14.88Sunfish sp. 101 430 11.34 216 920 24.25 2,697 5,743 117.56Suwannee Bass --- --- --- --- --- --- 22 47 28.61
Q3Common Name
Q1 Q5
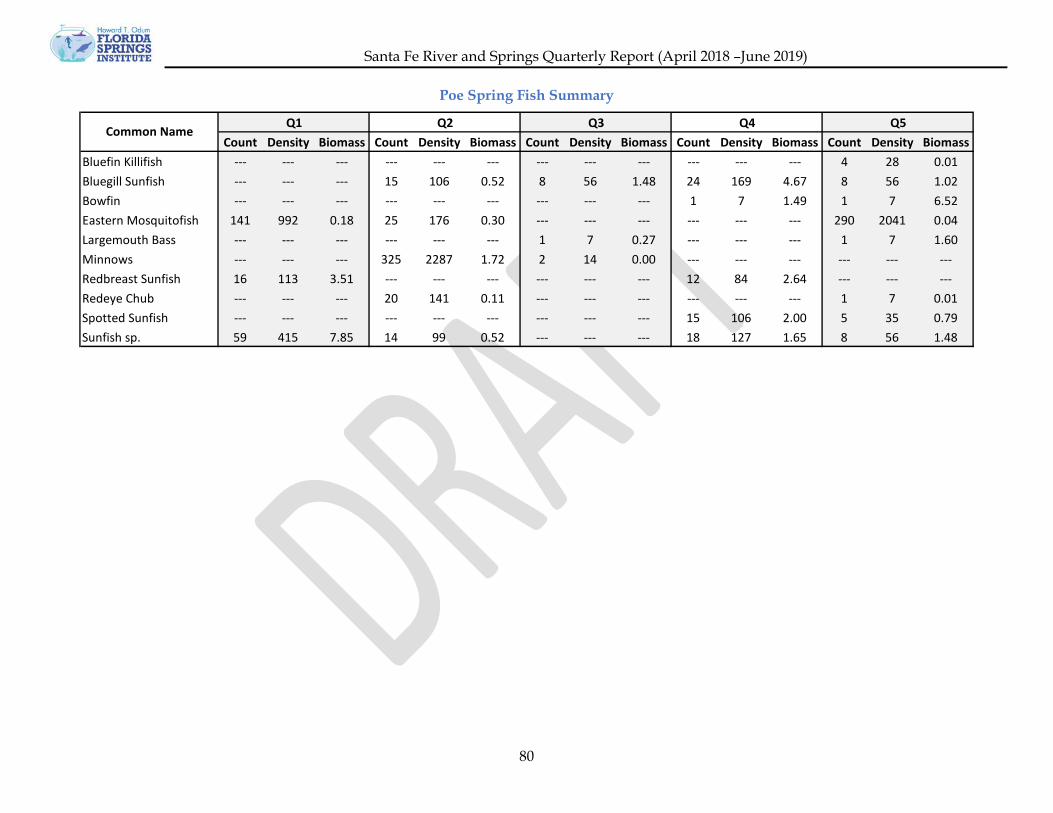
Santa Fe River and Springs Quarterly Report (April 2018 –June 2019)
80
Poe Spring Fish Summary
Count Density Biomass Count Density Biomass Count Density Biomass Count Density Biomass Count Density BiomassBluefin Killifish --- --- --- --- --- --- --- --- --- --- --- --- 4 28 0.01Bluegill Sunfish --- --- --- 15 106 0.52 8 56 1.48 24 169 4.67 8 56 1.02Bowfin --- --- --- --- --- --- --- --- --- 1 7 1.49 1 7 6.52Eastern Mosquitofish 141 992 0.18 25 176 0.30 --- --- --- --- --- --- 290 2041 0.04Largemouth Bass --- --- --- --- --- --- 1 7 0.27 --- --- --- 1 7 1.60Minnows --- --- --- 325 2287 1.72 2 14 0.00 --- --- --- --- --- ---Redbreast Sunfish 16 113 3.51 --- --- --- --- --- --- 12 84 2.64 --- --- ---Redeye Chub --- --- --- 20 141 0.11 --- --- --- --- --- --- 1 7 0.01Spotted Sunfish --- --- --- --- --- --- --- --- --- 15 106 2.00 5 35 0.79Sunfish sp. 59 415 7.85 14 99 0.52 --- --- --- 18 127 1.65 8 56 1.48
Q5Common Name
Q1 Q2 Q3 Q4
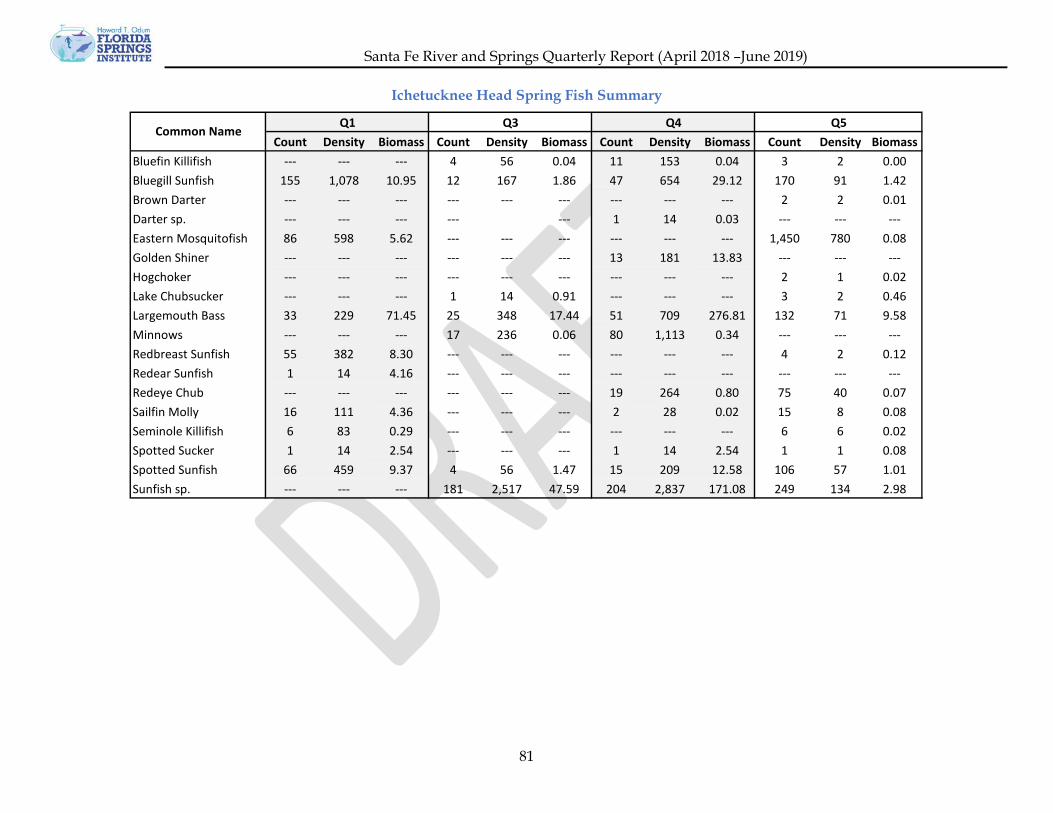
Santa Fe River and Springs Quarterly Report (April 2018 –June 2019)
81
Ichetucknee Head Spring Fish Summary
Count Density Biomass Count Density Biomass Count Density Biomass Count Density BiomassBluefin Killifish --- --- --- 4 56 0.04 11 153 0.04 3 2 0.00Bluegill Sunfish 155 1,078 10.95 12 167 1.86 47 654 29.12 170 91 1.42Brown Darter --- --- --- --- --- --- --- --- --- 2 2 0.01Darter sp. --- --- --- --- --- 1 14 0.03 --- --- ---Eastern Mosquitofish 86 598 5.62 --- --- --- --- --- --- 1,450 780 0.08Golden Shiner --- --- --- --- --- --- 13 181 13.83 --- --- ---Hogchoker --- --- --- --- --- --- --- --- --- 2 1 0.02Lake Chubsucker --- --- --- 1 14 0.91 --- --- --- 3 2 0.46Largemouth Bass 33 229 71.45 25 348 17.44 51 709 276.81 132 71 9.58Minnows --- --- --- 17 236 0.06 80 1,113 0.34 --- --- ---Redbreast Sunfish 55 382 8.30 --- --- --- --- --- --- 4 2 0.12Redear Sunfish 1 14 4.16 --- --- --- --- --- --- --- --- ---Redeye Chub --- --- --- --- --- --- 19 264 0.80 75 40 0.07Sailfin Molly 16 111 4.36 --- --- --- 2 28 0.02 15 8 0.08Seminole Killifish 6 83 0.29 --- --- --- --- --- --- 6 6 0.02Spotted Sucker 1 14 2.54 --- --- --- 1 14 2.54 1 1 0.08Spotted Sunfish 66 459 9.37 4 56 1.47 15 209 12.58 106 57 1.01Sunfish sp. --- --- --- 181 2,517 47.59 204 2,837 171.08 249 134 2.98
Common NameQ1 Q3 Q4 Q5

Santa Fe River and Springs Quarterly Report (April 2018 –June 2019)
82
Blue Hole Spring Fish Summary
Count Density Biomass Count Density Biomass Count Density Biomass Count Density BiomassAtlantic Needlefish 1 1 0.06 --- --- --- --- --- --- --- --- ---Black Crappie --- --- --- --- --- --- 2 3 0.67 --- --- ---Bluefin Killifish 6 4 0.06 --- --- --- 150 191 0.14 --- --- ---Bluegill Sunfish 252 160 3.11 --- --- --- 53 67 0.75 41 160 1.28Bowfin 1 1 0.56 --- --- --- --- --- --- --- --- ---Eastern Mosquitofish 185 118 1.19 --- --- --- --- --- --- 150 181 0.07Golden Shiner --- --- --- --- --- --- 2 3 0.11 1 11 1.43Lake Chubsucker 28 18 3.13 24 31 9.60 1 1 0.13 9 20 3.49Largemouth Bass 129 82 8.71 35 45 5.24 77 98 11.52 96 314 50.62Minnows 5 6 0.13 28 36 0.01 --- --- --- 380 4,270 3.21Redbreast Sunfish 40 25 1.01 --- --- --- 12 15 1.13 --- --- ---Redeye Chub --- --- --- --- --- --- 2 3 0.00 2,456 2,014 8.06Sailfin Molly --- --- --- --- --- --- --- --- --- 1 1 0.00Spotted Sucker 77 49 9.85 22 28 8.82 21 27 8.41 --- --- ---Spotted Sunfish 72 46 4.12 --- --- --- --- --- --- 13 23 0.60Sunfish sp. --- --- --- 108 138 3.62 127 162 7.57 186 328 4.78Suwannee Bass --- --- --- --- --- --- --- --- --- 2 22 13.38
Q1 Q3 Q4 Q5Common Name

Santa Fe River and Springs Quarterly Report (April 2018 –June 2019)
83
Appendix C Quarter 5 Data
Dissolved Oxygen
0
1
2
3
4
5
6
7
8
9
10
11
SFR
at W
orth
ingt
on S
prin
gSF
R ab
ove
Olu
stee
Olu
stee
Cre
ekSF
R be
low
Olu
stee
Cre
ekSa
nta
Fe S
prin
gSF
R at
I-75
O'L
eno
Stat
e Pa
rkSa
nta
Fe R
iver
Rise
Horn
sby
Sprin
gHo
rnsb
y Sp
ring
Cano
e La
unch
SFR
at U
S-44
1 Br
idge
SFR
at U
S-27
SFR
abov
e Al
len
Sprin
gAl
len
Sprin
gPo
e Sp
ring
Poe
Sprin
g Ru
nSF
R be
low
Poe
Spr
ing
COL9
3097
1 Ru
nLi
ly S
prin
gPi
ckar
d Sp
ring
COL1
0197
1 Ru
nM
erm
aid
Sprin
gSF
R ab
ove
John
son
John
son
Sprin
g Ru
nRu
m Is
land
Spr
ing
SFR
betw
een
Rum
and
Blu
eN
aked
Spr
ing
Nak
ed S
prin
g Ru
nGi
lchr
ist B
lue
Sprin
gGi
lchr
ist b
efor
e N
aked
Gilc
hrist
Blu
e Sp
ring
Run
SFR
belo
w G
ilchr
ist B
lue
Devi
l's E
ye S
prin
gLi
ttle
Dev
il Sp
ring
July
Spr
ing
Ginn
ie S
prin
gGi
nnie
Spr
ing
Run
SFR
at U
S 47
Cow
Cre
ek a
t CR
138
Wils
on S
prin
gCO
L917
971
SFR
abov
e IC
HSF
R be
low
ICH
Bett
y Sp
ring
Troo
p Sp
ring
Trai
l Spr
ing
SFR
at U
S-12
9SF
R at
39t
h Av
eSu
wan
nee
Rive
r bel
ow S
FRSu
wan
nee
Rive
r abo
ve S
FRIc
hetu
ckne
e He
ad S
prin
gIC
H Ca
noe
Laun
chCe
dar H
ead
Sprin
g Ru
nBl
ue H
ole
Sprin
gIC
H be
low
Blu
e Ho
leIC
H M
idpo
int
Dam
pier
's La
ndin
gIC
H Tu
be T
akeo
utLI
R-15
Segment 1 Segment 2 Segment 3 Segment 4 Ichetucknee
Diss
olve
d O
xyge
n (m
g/L)
RiverSpring

Santa Fe River and Springs Quarterly Report (April 2018 –June 2019)
84
pH
0
1
2
3
4
5
6
7
8
9
SFR
at W
orth
ingt
on S
prin
gSF
R ab
ove
Olu
stee
Olu
stee
Cre
ekSF
R be
low
Olu
stee
Cre
ekSa
nta
Fe S
prin
gSF
R at
I-75
O'L
eno
Stat
e Pa
rkSa
nta
Fe R
iver
Rise
Horn
sby
Sprin
gHo
rnsb
y Sp
ring
Cano
e La
unch
SFR
at U
S-44
1 Br
idge
SFR
at U
S-27
SFR
abov
e Al
len
Sprin
gAl
len
Sprin
gPo
e Sp
ring
Poe
Sprin
g Ru
nSF
R be
low
Poe
Spr
ing
COL9
3097
1 Ru
nLi
ly S
prin
gPi
ckar
d Sp
ring
COL1
0197
1 Ru
nM
erm
aid
Sprin
gSF
R ab
ove
John
son
John
son
Sprin
g Ru
nRu
m Is
land
Spr
ing
SFR
betw
een
Rum
and
Blu
eN
aked
Spr
ing
Nak
ed S
prin
g Ru
nGi
lchr
ist B
lue
Sprin
gGi
lchr
ist b
efor
e N
aked
Gilc
hrist
Blu
e Sp
ring
Run
SFR
belo
w G
ilchr
ist B
lue
Devi
l's E
ye S
prin
gLi
ttle
Dev
il Sp
ring
July
Spr
ing
Ginn
ie S
prin
gGi
nnie
Spr
ing
Run
SFR
at U
S 47
Cow
Cre
ek a
t CR
138
Wils
on S
prin
gCO
L917
971
SFR
abov
e IC
HSF
R be
low
ICH
Bett
y Sp
ring
Troo
p Sp
ring
Trai
l Spr
ing
SFR
at U
S-12
9SF
R at
39t
h Av
eSu
wan
nee
Rive
r bel
ow S
FRSu
wan
nee
Rive
r abo
ve S
FRIc
hetu
ckne
e He
ad S
prin
gIC
H Ca
noe
Laun
chCe
dar H
ead
Sprin
g Ru
nBl
ue H
ole
Sprin
gIC
H be
low
Blu
e Ho
leIC
H M
idpo
int
Dam
pier
's La
ndin
gIC
H Tu
be T
akeo
utLI
R-15
Segment 1 Segment 2 Segment 3 Segment 4 Ichetucknee
pH (S
U)
SpringRiver

Santa Fe River and Springs Quarterly Report (April 2018 –June 2019)
85
Specific Conductance
850
0
50
100
150
200
250
300
350
400
450
500SF
R at
Wor
thin
gton
Spr
ing
SFR
abov
e O
lust
eeO
lust
ee C
reek
SFR
belo
w O
lust
ee C
reek
Sant
a Fe
Spr
ing
SFR
at I-
75O
'Len
o St
ate
Park
Sant
a Fe
Riv
er R
iseHo
rnsb
y Sp
ring
Horn
sby
Sprin
g Ca
noe
Laun
chSF
R at
US-
441
Brid
geSF
R at
US-
27SF
R ab
ove
Alle
n Sp
ring
Alle
n Sp
ring
Poe
Sprin
gPo
e Sp
ring
Run
SFR
belo
w P
oe S
prin
gCO
L930
971
Run
Lily
Spr
ing
Pick
ard
Sprin
gCO
L101
971
Run
Mer
mai
d Sp
ring
SFR
abov
e Jo
hnso
nJo
hnso
n Sp
ring
Run
Rum
Isla
nd S
prin
gSF
R be
twee
n Ru
m a
nd B
lue
Nak
ed S
prin
gN
aked
Spr
ing
Run
Gilc
hrist
Blu
e Sp
ring
Gilc
hrist
bef
ore
Nak
edGi
lchr
ist B
lue
Sprin
g Ru
nSF
R be
low
Gilc
hrist
Blu
eDe
vil's
Eye
Spr
ing
Litt
le D
evil
Sprin
gJu
ly S
prin
gGi
nnie
Spr
ing
Ginn
ie S
prin
g Ru
nSF
R at
US
47Co
w C
reek
at C
R 13
8W
ilson
Spr
ing
COL9
1797
1SF
R ab
ove
ICH
SFR
belo
w IC
HBe
tty
Sprin
gTr
oop
Sprin
gTr
ail S
prin
gSF
R at
US-
129
SFR
at 3
9th
Ave
Suw
anne
e Ri
ver b
elow
SFR
Suw
anne
e Ri
ver a
bove
SFR
Iche
tuck
nee
Head
Spr
ing
ICH
Cano
e La
unch
Ceda
r Hea
d Sp
ring
Run
Blue
Hol
e Sp
ring
ICH
belo
w B
lue
Hole
ICH
Mid
poin
tDa
mpi
er's
Land
ing
ICH
Tube
Tak
eout
LIR-
15
Segment 1 Segment 2 Segment 3 Segment 4 Ichetucknee
Spec
ific
Cond
ucta
nce
(uS/
cm)
RiverSpring
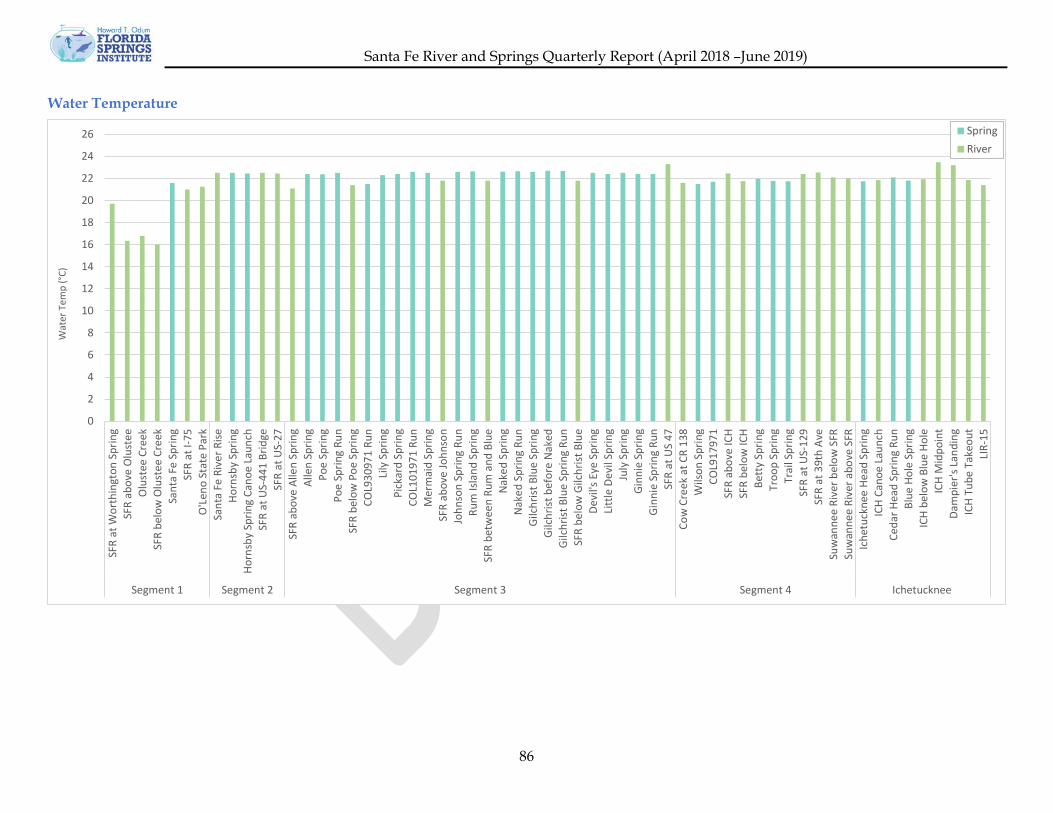
Santa Fe River and Springs Quarterly Report (April 2018 –June 2019)
86
Water Temperature
0
2
4
6
8
10
12
14
16
18
20
22
24
26
SFR
at W
orth
ingt
on S
prin
gSF
R ab
ove
Olu
stee
Olu
stee
Cre
ekSF
R be
low
Olu
stee
Cre
ekSa
nta
Fe S
prin
gSF
R at
I-75
O'L
eno
Stat
e Pa
rkSa
nta
Fe R
iver
Rise
Horn
sby
Sprin
gHo
rnsb
y Sp
ring
Cano
e La
unch
SFR
at U
S-44
1 Br
idge
SFR
at U
S-27
SFR
abov
e Al
len
Sprin
gAl
len
Sprin
gPo
e Sp
ring
Poe
Sprin
g Ru
nSF
R be
low
Poe
Spr
ing
COL9
3097
1 Ru
nLi
ly S
prin
gPi
ckar
d Sp
ring
COL1
0197
1 Ru
nM
erm
aid
Sprin
gSF
R ab
ove
John
son
John
son
Sprin
g Ru
nRu
m Is
land
Spr
ing
SFR
betw
een
Rum
and
Blu
eN
aked
Spr
ing
Nak
ed S
prin
g Ru
nGi
lchr
ist B
lue
Sprin
gGi
lchr
ist b
efor
e N
aked
Gilc
hrist
Blu
e Sp
ring
Run
SFR
belo
w G
ilchr
ist B
lue
Devi
l's E
ye S
prin
gLi
ttle
Dev
il Sp
ring
July
Spr
ing
Ginn
ie S
prin
gGi
nnie
Spr
ing
Run
SFR
at U
S 47
Cow
Cre
ek a
t CR
138
Wils
on S
prin
gCO
L917
971
SFR
abov
e IC
HSF
R be
low
ICH
Bett
y Sp
ring
Troo
p Sp
ring
Trai
l Spr
ing
SFR
at U
S-12
9SF
R at
39t
h Av
eSu
wan
nee
Rive
r bel
ow S
FRSu
wan
nee
Rive
r abo
ve S
FRIc
hetu
ckne
e He
ad S
prin
gIC
H Ca
noe
Laun
chCe
dar H
ead
Sprin
g Ru
nBl
ue H
ole
Sprin
gIC
H be
low
Blu
e Ho
leIC
H M
idpo
int
Dam
pier
's La
ndin
gIC
H Tu
be T
akeo
utLI
R-15
Segment 1 Segment 2 Segment 3 Segment 4 Ichetucknee
Wat
er T
emp
(°C)
SpringRiver

Santa Fe River and Springs Quarterly Report (April 2018 –June 2019)
87
Water Flow
0
25
50
75
100
125
Santa Fe Spring Poe Spring Run Gilchrist before Naked Gilchrist Blue Spring Run
Segment 1 Segment 3
Disc
harg
e (c
fs)
Spring

Santa Fe River and Springs Quarterly Report (April 2018 –June 2019)
88
Nitrate-Nitrite
34.660.00.20.40.60.81.01.21.41.61.82.02.22.42.6
SFR
at W
orth
ingt
on S
prin
gSF
R ab
ove
Olu
stee
Olu
stee
Cre
ekSF
R be
low
Olu
stee
Cre
ekSa
nta
Fe S
prin
gSF
R at
I-75
O'L
eno
Stat
e Pa
rkSa
nta
Fe R
iver
Rise
Horn
sby
Sprin
gSF
R at
US-
441
Brid
geSF
R at
US-
27SF
R ab
ove
Alle
n Sp
ring
Alle
n Sp
ring
Poe
Sprin
gPo
e Sp
ring
Run
SFR
belo
w P
oe S
prin
gLi
ly S
prin
gPi
ckar
d Sp
ring
COL1
0197
1 Ru
nM
erm
aid
Sprin
gSF
R ab
ove
John
son
John
son
Sprin
g Ru
nRu
m Is
land
Spr
ing
Nak
ed S
prin
gGi
lchr
ist B
lue
Sprin
gGi
lchr
ist B
lue
Sprin
g Ru
nSF
R be
low
Gilc
hrist
Blu
eDe
vil's
Eye
Spr
ing
Litt
le D
evil
Sprin
gJu
ly S
prin
gGi
nnie
Spr
ing
Run
SFR
at U
S 47
Cow
Cre
ek a
t CR
138
Wils
on S
prin
gCO
L917
971
SFR
abov
e IC
HSF
R be
low
ICH
Bett
y Sp
ring
Troo
p Sp
ring
Trai
l Spr
ing
SFR
at U
S-12
9SF
R at
39t
h Av
eSu
wan
nee
Rive
r bel
ow S
FRSu
wan
nee
Rive
r abo
ve S
FRIc
hetu
ckne
e He
ad S
prin
gIC
H Ca
noe
Laun
chCe
dar H
ead
Sprin
g Ru
nBl
ue H
ole
Sprin
gIC
H be
low
Blu
e Ho
leIC
H M
idpo
int
Dam
pier
's La
ndin
gIC
H Tu
be T
akeo
utLI
R-15
Segment 1 Segment 2 Segment 3 Segment 4 Ichetucknee
NO
x-N
(Mg/
L)
Spring
River
Spring Standard

Santa Fe River and Springs Quarterly Report (April 2018 –June 2019)
89
Water Clarity
0
5
10
15
20
25
30
35
40
45
50
55
60
65
70
Hornsby Spring Poe Spring Gilchrist Blue Spring Ginnie Spring Ichetucknee Head Spring
Segment 2 Segment 3 Ichetucknee
Secc
hi M
easu
rem
ents
(m)
Horizontal Secchi Spring
0.0
1.0
2.0
3.0
4.0
5.0
6.0
7.0
8.0
9.0
10.0
SFR atWorthington
Spring
SFR aboveOlustee
OlusteeCreek
SFR belowOlusteeCreek
Santa FeSpring
O'Leno StatePark
SFR belowGilchrist
Blue
SFR at US-129
SFR at 39thAve
SuwanneeRiver below
SFR
SuwanneeRiver above
SFR
Segment 1 Segment 4
Secc
hi M
easu
rem
ents
(m)
Vertical Secchi River


