136
B udget Addendum FY 2015 - 17 Adopted Biennial Budget City of Santa Monica

Budget AddendumFY 2015-17 Adopted Biennial Budget
City of Santa Monica


Table of Contents
User Guide ....................................................................................................................................... i
Introduction to the Addendum Introduction to the Addendum ................................................................................................. 1
Revenue Summary Tables FY 2016-17 Revenue Summary by Category and Fund ........................................................ 7 Historical Revenue Summary by Fund and Category ........................................................... 9
Expenditure Summary Tables FY 2016-17 Expenditure Summary by Fund ............................................................................ 19 Historical Expenditure Summary by Fund and Department/Type .................................... 21
Department Summary Tables City Council ................................................................................................................................. 35 City Manager .............................................................................................................................. 37 Records and Election Services (City Clerk) ........................................................................... 39 Finance ......................................................................................................................................... 41 City Attorney ................................................................................................................................ 43 Human Resources ....................................................................................................................... 45 Information Systems ................................................................................................................... 47 Planning and Community Development............................................................................... 49 Police ............................................................................................................................................ 51 Fire ................................................................................................................................................. 55 Community and Cultural Services ........................................................................................... 57 Library ............................................................................................................................................ 61 Public Works ................................................................................................................................. 63 Big Blue Bus .................................................................................................................................. 69 Housing and Economic Development ................................................................................... 71
Goals, Objectives and Service Benchmarks FY 2016-17 Department Updates ............................................................................................. 77
Personnel and Staffing Summary Tables Summary of Personnel by Fund ............................................................................................... 87 Personnel by Department and Division .................................................................................. 93

User Guide
Introduction to the Addendum This section provides a guide to the Addendum, and points users to more detailed budget and economic information.
Citywide Revenue Summary Tables This section provides revenue summary tables updated for the FY 2016-17 Adopted Budget and FY 2015-16 Estimated Actuals.
Revenue Summary by Category and Fund Historical Revenue Summary by Fund and Category
Citywide Expenditure Summary Tables This section provides expenditure summary tables updated for the FY 2016-17 Adopted Budget and FY 2015-16 Revised Budget.
Expenditure Summary by Fund Historical Expenditure Summary by Fund and Department / Type
Department Summary Tables This section provides department-level expenditure and budget updates, by division by fund and by fund by major account type (salaries and wages or supplies and expenses), and department-level staffing information by division by fund.
Goals, Objectives, and Service Benchmarks The FY 2015-17 Biennial Budget includes goals, objectives and service benchmarks for each department. This section provides updates made during the FY 2016-17 exception-based budget process.
Personnel and Staffing Summary Tables This section provides personnel and staffing updates, by fund and by department and division, for the FY 2016-17 Adopted Budget and FY 2015-16 Revised Budget.
i

Introduction to the Addendum
Biennial Budget Process
The City Council approved biennial budgeting for the City of Santa Monica on February 8, 2011. The City develops a spending plan every two years, and makes limited second year budget plan changes as needed. This technique improves budget development efficiency by reducing the amount of staff time needed to produce the budget in the second year. Staff prepares and presents the City’s Operating Biennial Budget in one year, and the Capital Improvement Program (CIP) Biennial Budget in the next year. On June 23, 2015, Council adopted the FY 2015-16 Operating Budget and approved the FY 2016-17 Operating Budget Plan. At that time, Council also adopted the FY 2015-16 CIP Budget.
Key Changes Incorporated in the Addendum
This Addendum reflects changes made to the FY 2016-17 Operating Budget as part of an exception-based budget process conducted in early 2016. Departments requested budget and staffing adjustments for FY 2016-17 only if programs, activities or revenue had changed significantly since Council’s approval of the Budget Plan. Departments also requested adjustments to begin the shift of resources towards the City’s strategic goals and the elements that will lay the groundwork for a new operating and strategic framework for the City. The FY 2016-18 Biennial Capital Improvement Program Budget reflects the City’s highest priorities and maximizes the use of grants and other non-General Funds to increase the number of priority projects that can be implemented with limited resources. Council approved these changes and adopted the FY 2016-17 Operating and CIP Budgets and approved the FY 2017-18 CIP Budget Plan on June 14, 2016.
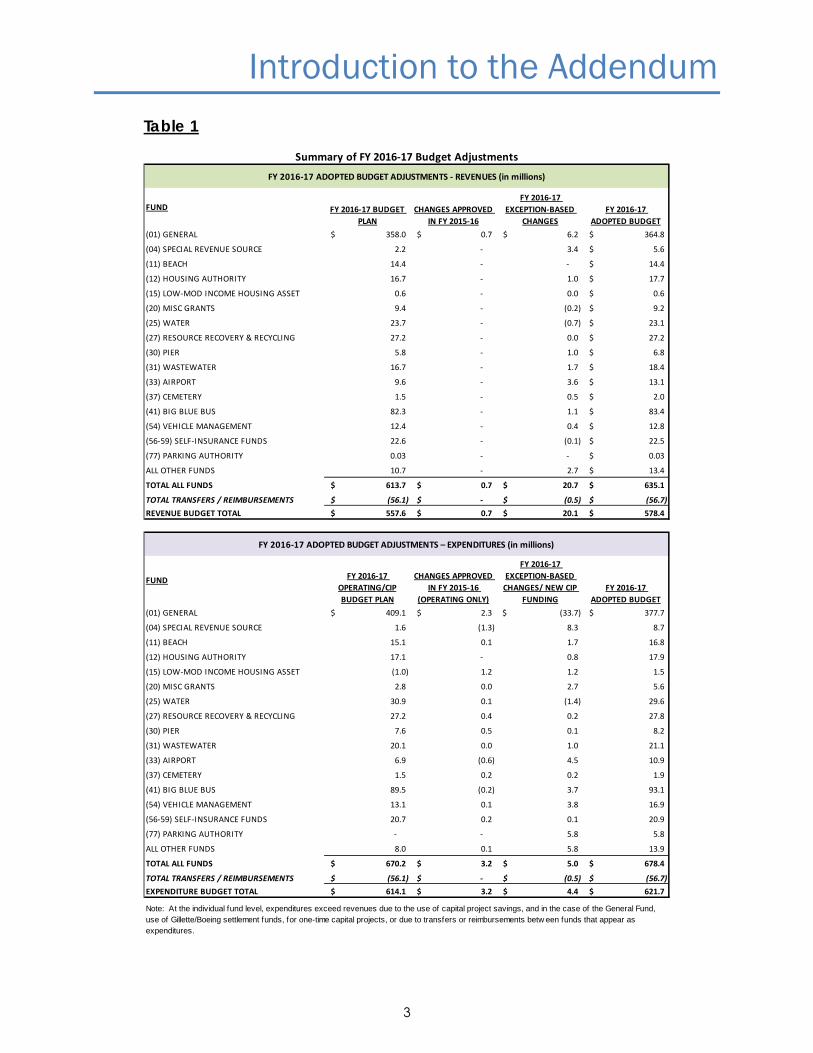
These adjustments are summarized in Table 1 below. More detail about changes from the Budget Plan is available in the May 24, 2016 staff report for the Council budget study session, and in the June 14, 2016 Budget Adoption staff report. A portion of the adjustments carry over from budget revisions approved during FY 2015-16, and the rest are new changes to recognize updated revenue projections, corrections based on historical spending, and program changes.
Revenues
The Adopted FY 2016-17 revenue budget is $578.4 million, a $20.8 million or 3.7% increase over the FY 2016-17 Budget Plan, primarily due to a $6.9 million increase in General Fund revenues, mostly from increases in parking rates and usage, increased Airport Office/Shop lease proceeds, more Developer Agreement contributions from Transportation Impact Fees, and increased sewer service charge revenue.
1

Introduction to the Addendum
Expenditures
The Adopted expenditure budget is $621.7 million, a $7.6 million or 1.2% increase over the FY 2016-17 Budget Plan, primarily due to the addition of communications personnel and operating changes and capital projects that advance Council’s five Strategic Goals, partially offset by the delay of Fire Station 1 construction.
The City’s FY 2016-17 Adopted Budget complies with the City’s policy to adopt a balanced budget where current revenues will be sufficient to support current operating expenditures. Instances where expenditures exceed revenues in Table 1 below are due to the use of capital reserves set aside in previous years for pay-as-you-go projects, and to the timing of capital grant revenue (transit projects are funded through reimbursement grants). With the changes discussed above, the FY 2016-17 Adopted Budget remains in balance.
Goals, Objectives, and Service Benchmarks
The FY 2015-17 Biennial Budget includes Goals, Objectives, and Service Benchmarks for each department. Departments determine the key performance indicators, metrics, milestones, outputs, and outcomes to track effectiveness, efficiency, and impact. Modifications to departmental biennial work plans are made throughout the year to respond to emerging needs and issues. This addendum shows updates to Department Goals, Objectives, and Benchmarks made during the FY 2016-17 Exception-Based budget process.
2
Introduction to the Addendum
Table 1
(01) GENERAL 358.0$ 0.7$ 6.2$ 364.8$
(04) SPECIAL REVENUE SOURCE 2.2 - 3.4 5.6$
(11) BEACH 14.4 - - 14.4$
(12) HOUSING AUTHORITY 16.7 - 1.0 17.7$
(15) LOW-MOD INCOME HOUSING ASSET 0.6 - 0.0 0.6$
(20) MISC GRANTS 9.4 - (0.2) 9.2$
(25) WATER 23.7 - (0.7) 23.1$
(27) RESOURCE RECOVERY & RECYCLING 27.2 - 0.0 27.2$
(30) PIER 5.8 - 1.0 6.8$
(31) WASTEWATER 16.7 - 1.7 18.4$
(33) AIRPORT 9.6 - 3.6 13.1$
(37) CEMETERY 1.5 - 0.5 2.0$
(41) BIG BLUE BUS 82.3 - 1.1 83.4$
(54) VEHICLE MANAGEMENT 12.4 - 0.4 12.8$
(56-59) SELF-INSURANCE FUNDS 22.6 - (0.1) 22.5$
(77) PARKING AUTHORITY 0.03 - - 0.03$
ALL OTHER FUNDS 10.7 - 2.7 13.4$
TOTAL ALL FUNDS 613.7$ 0.7$ 20.7$ 635.1$
TOTAL TRANSFERS / REIMBURSEMENTS (56.1)$ -$ (0.5)$ (56.7)$ REVENUE BUDGET TOTAL 557.6$ 0.7$ 20.1$ 578.4$
(01) GENERAL 409.1$ 2.3$ (33.7)$ 377.7$
(04) SPECIAL REVENUE SOURCE 1.6 (1.3) 8.3 8.7
(11) BEACH 15.1 0.1 1.7 16.8
(12) HOUSING AUTHORITY 17.1 - 0.8 17.9
(15) LOW-MOD INCOME HOUSING ASSET (1.0) 1.2 1.2 1.5
(20) MISC GRANTS 2.8 0.0 2.7 5.6
(25) WATER 30.9 0.1 (1.4) 29.6
(27) RESOURCE RECOVERY & RECYCLING 27.2 0.4 0.2 27.8
(30) PIER 7.6 0.5 0.1 8.2
(31) WASTEWATER 20.1 0.0 1.0 21.1
(33) AIRPORT 6.9 (0.6) 4.5 10.9
(37) CEMETERY 1.5 0.2 0.2 1.9
(41) BIG BLUE BUS 89.5 (0.2) 3.7 93.1
(54) VEHICLE MANAGEMENT 13.1 0.1 3.8 16.9
(56-59) SELF-INSURANCE FUNDS 20.7 0.2 0.1 20.9
(77) PARKING AUTHORITY - - 5.8 5.8
ALL OTHER FUNDS 8.0 0.1 5.8 13.9
TOTAL ALL FUNDS 670.2$ 3.2$ 5.0$ 678.4$
TOTAL TRANSFERS / REIMBURSEMENTS (56.1)$ -$ (0.5)$ (56.7)$ EXPENDITURE BUDGET TOTAL 614.1$ 3.2$ 4.4$ 621.7$
Summary of FY 2016-17 Budget Adjustments
FY 2016-17 ADOPTED BUDGET ADJUSTMENTS - REVENUES (in millions)
FUND FY 2016-17 BUDGET PLAN
CHANGES APPROVED IN FY 2015-16
FY 2016-17 EXCEPTION-BASED
CHANGESFY 2016-17
ADOPTED BUDGET
CHANGES APPROVED IN FY 2015-16
(OPERATING ONLY)
FY 2016-17 EXCEPTION-BASED
CHANGES/ NEW CIP FUNDING
FY 2016-17 ADOPTED BUDGET
FY 2016-17 ADOPTED BUDGET ADJUSTMENTS – EXPENDITURES (in millions)
Note: At the individual fund level, expenditures exceed revenues due to the use of capital project savings, and in the case of the General Fund, use of Gillette/Boeing settlement funds, for one-time capital projects, or due to transfers or reimbursements betw een funds that appear as expenditures.
FUND FY 2016-17 OPERATING/CIPBUDGET PLAN
3

Introduction to the Addendum
Additional Budget Detail and Economic Information
There is additional budget detail and economic information available online as outlined below.
• Additional detail about budget changes – The budget adoption staff report presented to Council on June 14, 2016 includes additional information on department-specific expenditure and revenue changes, personnel changes, fee revisions, the GANN appropriations limit, and Community and Cultural Services Grants program updates. (Visit www.smgov.net/council and select “Agendas, Minutes and Staff Reports”, then navigate to the June 14, 2016 Council Agenda, Item 9-A.)
• Capital Improvement Program Budget – The FY 2016-18 Biennial Capital Improvement Program (CIP) Budget, which includes 127 capital projects Citywide, is $113.7 million in FY 2016-17 and $121.7 million in FY 2017-18 for all funds. The General Fund component is $37.1 million in FY 2016-17 and $61.9 million in FY 2017-18. This budget funds new capital projects identified as the City’s highest priorities, and maintains existing infrastructure. Council adopted the first year of the FY 2016-18 Biennial CIP Budget and approved the FY 2017-18 budget plan on June 14, 2016. The FY 2016-18 Adopted Capital Improvement Program Budget is available on the City’s website. (Visit www.smgov.net/budget.)
• Financial Status Update – Staff provided Council an update to the City’s Five-Year Forecast on May 24, 2016; this update is available on the City Council website. The update showed a potential shortfall of $3.5 million in FY 2018-19, which increases to $6.4 million (1.6% of the General Fund budget) in FY 2019-20. Staff also presented alternate budget scenarios, and discussed proposed changes. (Visit www.smgov.net/council and select “Agendas, Minutes and Staff Reports”, then navigate to the May 24, 2016 Council Agenda, Item 4-A.)
4

REVENUE SUMMARY TABLES
FY 2016-17 Adopted Budget
5

6

FundProperty
TaxesSales Taxes Other Taxes
Licenses and
Permits
Inter-
governmental
Charges for
Service
Fines and
ForfeituresInvestment Rent Grants Other Budget Total
(01) General Fund 52,611,717$ 54,629,049$ 132,921,411$ 44,159,837$ 1,361,898$ 39,628,425$ 16,300,000$ 4,900,000$ 7,992,206$ 10,288,340$ 364,792,883$
(04) Special Revenue Source Fund 563,454$ 3,000$ 5,065,394$ 5,631,848$
(06) Clean Bchs & Ocean Prcl Tx Fd 3,126,543$ 127,000$ 3,253,543$
(11) Beach Recreation Fund 143,000$ 30,000$ 11,900,491$ 200,000$ 1,451,072$ 661,389$ 14,385,952$
(12) Housing Authority Fund 17,705,352$ 17,705,352$
(14) TORCA Fund 40,000$ 50,000$ 50,000$ 140,000$
(15) Low/Mod Incme Housing Asset Fd 30,000$ 550,000$ 580,000$
(19) CDBG Fund 1,327,760$ 3,000$ 1,330,760$
(20) Miscellaneous Grants Fund 9,165,251$ 66,000$ 9,231,251$
(22) COPS Fund 100,000$ 1,300$ 101,300$
(25) Water Fund 22,126,102$ 500,000$ 466,806$ 23,092,908$
(27) Resource Recovery & Recyc Fund 26,242,000$ 200,000$ 783,400$ 27,225,400$
(28) Community Broadband Fund 2,115,000$ 2,115,000$
(30) Pier Fund 6,769,489$ 30,000$ 6,799,489$
(31) Wastewater Fund 17,785,452$ 5,000$ 400,000$ 201,000$ 18,391,452$
(33 & 52) Airport AND Special Aviation Funds 12,298,809$ 60,000$ 786,618$ 13,145,427$
(34) Stormwater Management Fund 1,598,100$ 361,662$ 1,959,762$
(37) Cemetery Fund 1,954,815$ 1,000$ 22,780$ 1,978,595$
(41) Big Blue Bus Fund 46,455,850$ 16,238,304$ 279,639$ 16,702,022$ 3,732,809$ 83,408,624$
(43) Gas Tax Fund 1,899,336$ 7,000$ 1,906,336$
(44) SCAQMD AB 2766 Fund 710,000$ 5,300$ 715,300$
(53) Parks and Recreation Fund 1,000$ 1,000$
(54) Vehicle Management Fund 12,002,798$ 275,000$ 472,600$ 12,750,398$
(55) Info Tech Rplcmnt & Svcs Fund 1,866,879$ 56,000$ 1,922,879$
(56) Self-insur, General Liab/Auto 2,999,998$ 150,000$ 3,149,998$
(57) Self-insurance, Bus Fund 2,500,000$ 55,000$ 2,555,000$
(58) Risk Management - Admin 3,037,698$ 3,037,698$
(59) Self-insur, Workers' Comp Fund 13,440,002$ 300,000$ 13,740,002$
(77) Parking Authority Fund 27,000$ 27,000$
SUBTOTAL 52,611,717$ 101,084,899$ 136,087,954$ 44,302,837$ 32,299,597$ 195,067,816$ 16,305,000$ 7,727,239$ 9,443,278$ 16,702,022$ 23,442,798$ 635,075,157$
Reimbursement and Transfers (54,805,176)$ (1,858,670)$ (56,663,846)$
GRAND TOTAL 52,611,717$ 101,084,899$ 136,087,954$ 44,302,837$ 32,299,597$ 140,262,640$ 16,305,000$ 7,727,239$ 7,584,608$ 16,702,022$ 23,442,798$ 578,411,311$
FY 2016-17 Revenue Summary by Category and Fund
7

8

FY 2015-16 Estimated
FY 2016-17 Adopted
Actual Budget Amount Percent(01) General Fund
Charges for Service 37,379,902$ 37,332,243$ 40,395,744$ 39,628,425$ (767,319)$ -1.9%Fines and Forfeitures 16,253,547 16,287,291 16,271,500 16,300,000 28,500 0.2%Intergovernmental 1,110,729 2,593,729 1,442,532 1,361,898 (80,634) -5.6%Investment Income 4,700,546 3,313,549 3,000,000 4,900,000 1,900,000 63.3%Licenses and Permits 36,895,331 39,370,035 40,599,122 44,159,837 3,560,715 8.8%Other 10,261,730 10,037,583 8,221,887 10,288,340 2,066,453 25.1%Other Local Taxes 123,920,479 129,105,915 129,417,000 132,921,411 3,504,411 2.7%Property Taxes 49,148,710 54,044,934 50,109,671 52,611,717 2,502,046 5.0%Rentals 9,066,536 9,504,058 10,028,067 7,992,206 (2,035,861) -20.3%Sales Taxes 49,210,039 51,089,716 55,579,647 54,629,049 (950,598) -1.7%
(01) General Fund Total $ 337,947,547 $ 352,679,053 $ 355,065,170 $ 364,792,883 $ 9,727,713 2.7%
(04) Special Revenue Source FundCharges for Service 493,937$ 1,307,521$ 809,749$ 563,454$ (246,295)$ -30.4%Investment Income 58,553 16,481 3,000 3,000 - 0.0%Other 7,090,974 11,106,993 7,617,419 5,065,394 (2,552,025) -33.5%
(04) Special Revenue Source Fund Total $ 7,643,464 $ 12,430,995 $ 8,430,168 $ 5,631,848 $ (2,798,320) -33.2%
(06) Clean Bchs & Ocean Prcl Tx Fund Investment Income 85,655$ 60,349$ 77,000$ 127,000$ 50,000$ 64.9%Other Local Taxes 2,839,282 2,898,594 3,065,239 3,126,543 61,304 2.0%
(06) Clean Bchs & Ocean Prcl Tx Fund Total $ 2,924,936 $ 2,958,943 $ 3,142,239 $ 3,253,543 $ 111,304 3.5%
(11) Beach Recreation FundCharges for Service 13,202,714$ 12,810,949$ 12,129,541$ 11,900,491$ (229,050)$ -1.9%Intergovernmental - - 30,000 30,000 -$ 0.0%Investment Income 118,096 123,971 145,000 200,000 55,000$ 37.9%Licenses and Permits 181,016 207,302 143,000 143,000 -$ 0.0%Other 868,229 748,958 656,389 661,389 5,000$ 0.8%Rentals 1,245,430 1,098,612 1,821,713 1,451,072 (370,641) -20.3%
(11) Beach Recreation Fund Total $ 15,615,485 $ 14,989,792 $ 14,925,643 $ 14,385,952 $ (539,691) -3.6%
Change vs. Prior Year
Historical Revenue Summary by Fund and CategoryFY 2013-14
ActualFY 2014-15
Actual
9

FY 2015-16 Estimated
FY 2016-17 Adopted
Actual Budget Amount Percent
Change vs. Prior Year
Historical Revenue Summary by Fund and CategoryFY 2013-14
ActualFY 2014-15
Actual
(12) Housing Authority FundIntergovernmental 16,149,915$ 15,695,786$ 17,841,897$ 17,705,352$ (136,545)$ -0.8%Investment Income 7,934 297 - - - n/a
(12) Housing Authority Fund Total $ 16,157,849 $ 15,696,083 $ 17,841,897 $ 17,705,352 $ (136,545) -0.8%
(14) TORCA FundInvestment Income 41,737$ 34,451$ 50,000$ 50,000$ -$ 0.0%Other 305,583 76,436 264,756 50,000 (214,756)$ -81.1%Other Local Taxes 58,974 43,944 40,000 40,000 - 0.0%
(14) TORCA Fund Total $ 406,294 $ 154,831 $ 354,756 $ 140,000 $ (214,756) -60.5%
(15) Low/Mod Incme Housing Asset FundInvestment Income 26,041$ 10,198$ 28,000$ 30,000$ 2,000$ 7.1%Other 702,778 851,333 550,000 550,000 - 0.0%
(15) Low/Mod Incme Housing Asset Fund Total $ 728,819 $ 861,531 $ 578,000 $ 580,000 $ 2,000 0.3%
(19) CDBG FundIntergovernmental 1,213,234$ 1,440,426$ 1,310,493$ 1,327,760$ 17,267$ 1.3%Investment Income 2,189 942 3,000 3,000 - 0.0%
(19) CDBG Fund Total $ 1,215,422 $ 1,441,368 $ 1,313,493 $ 1,330,760 $ 17,267 1.3%
10

FY 2015-16 Estimated
FY 2016-17 Adopted
Actual Budget Amount Percent
Change vs. Prior Year
Historical Revenue Summary by Fund and CategoryFY 2013-14
ActualFY 2014-15
Actual
(20) Miscellaneous Grants FundIntergovernmental 11,904,428$ 8,942,913$ 39,232,865$ 9,165,251$ (30,067,614)$ -76.6%Investment Income 94,786 71,570 66,000 66,000 -$ 0.0%Other 39,906 - - - - n/a
(20) Miscellaneous Grants Fund Total $ 12,039,120 $ 9,014,484 $ 39,298,865 $ 9,231,251 $ (30,067,614) -76.5%
(22) COPS FundIntergovernmental 155,170$ 161,820$ 100,000$ 100,000$ -$ 0.0%Investment Income 2,205 1,353 1,000 1,300 300 30.0%
(22) COPS Fund Total $ 157,376 $ 163,173 $ 101,000 $ 101,300 $ 300 0.3%
(23) Disaster FundInvestment Income 146 111 - - - n/a
(23) Disaster Fund Total $ 146 $ 111 $ - $ - $ - n/a
(25) Water FundCharges for Service 22,902,640$ 22,664,712$ 20,346,813$ 22,126,102$ 1,779,289$ 8.7%Investment Income 435,334 372,023 400,000 500,000 100,000$ 25.0%Other 768,610 543,673 466,806 466,806 - 0.0%
(25) Water Fund Total $ 24,106,584 $ 23,580,408 $ 21,213,619 $ 23,092,908 $ 1,879,289 8.9%
11

FY 2015-16 Estimated
FY 2016-17 Adopted
Actual Budget Amount Percent
Change vs. Prior Year
Historical Revenue Summary by Fund and CategoryFY 2013-14
ActualFY 2014-15
Actual
(27) Resource Recovery & Recyc FundCharges for Service 23,271,775$ 24,425,878$ 25,403,200$ 26,242,000$ 838,800$ 3.3%Investment Income 146,733 130,056 150,000 200,000 50,000$ 33.3%Other 683,893 763,973 759,300 783,400 24,100 3.2%
(27) Resource Recovery & Recyc Fund Total $ 24,102,402 $ 25,319,907 $ 26,312,500 $ 27,225,400 $ 912,900 3.5%
(28) Community Broadband FundCharges for Service - - - 2,115,000 2,115,000 100.0%
(28) Community Broadband Fund Total $ - $ - $ - $ 2,115,000 $ 2,115,000 100.0%
(30) Pier FundCharges for Service 5,953,173$ 6,813,624$ 6,948,495$ 6,769,489$ (179,006)$ -2.6%Investment Income 73,154 13,167 25,000 30,000 5,000$ 20.0%Other 43,262 472 - - - n/a
(30) Pier Fund Total $ 6,069,588 $ 6,827,262 $ 6,973,495 $ 6,799,489 $ (174,006) -2.5%
(31) Wastewater FundCharges for Service 21,033,699$ 20,160,150$ 18,277,490$ 17,785,452$ (492,038)$ -2.7%Fines and Forfeitures - 2,366 5,000 5,000 -$ 0.0%Investment Income 341,123 268,635 340,000 400,000 60,000$ 17.6%Other 252,840 316,447 201,000 201,000 - 0.0%
(31) Wastewater Fund Total $ 21,627,661 $ 20,747,598 $ 18,823,490 $ 18,391,452 $ (432,038) -2.3%
(33) & (52) Airport & Special Aviation FundsCharges for Service 5,396,797$ 5,897,241$ 7,436,633$ 12,298,809$ 4,862,176$ 65.4%Investment Income 33,617 38,183 50,000 60,000 10,000$ 20.0%Other 129,235 87,776 784,054 786,618 2,564 0.3%
(33) & (52) Airport & Special Aviation Funds Total $ 5,559,650 $ 6,023,201 $ 8,270,687 $ 13,145,427 $ 4,874,740 58.9%
12

FY 2015-16 Estimated
FY 2016-17 Adopted
Actual Budget Amount Percent
Change vs. Prior Year
Historical Revenue Summary by Fund and CategoryFY 2013-14
ActualFY 2014-15
Actual
(34) Stormwater Management FundCharges for Service 1,395,628$ 1,458,352$ 1,599,000$ 1,598,100$ (900)$ -0.1%Investment Income 10,558 15,667 20,000 - (20,000)$ -100.0%Other 56,104 637,547 2,402,852 361,662 (2,041,190) -84.9%
(34) Stormwater Management Fund Total $ 1,462,290 $ 2,111,566 $ 4,021,852 $ 1,959,762 $ (2,062,090) -51.3%
(37) Cemetery FundCharges for Service 1,325,777$ 1,604,606$ 1,414,245$ 1,954,815$ 540,570$ 38.2%Investment Income 228 256 1,000 1,000 -$ 0.0%Other 31,626 21,336 22,333 22,780 447 2.0%
(37) Cemetery Fund Total $ 1,357,632 $ 1,626,198 $ 1,437,578 $ 1,978,595 $ 541,017 37.6%
(41) Big Blue Bus FundCapital Grants 28,431,735$ 10,333,282$ 23,867,858$ 16,702,022$ (7,165,836)$ -30.0%Charges for Service 17,060,922 16,664,917 16,046,571 16,238,304 191,733$ 1.2%Intergovernmental 19,650 - - - -$ n/aInvestment Income 272,546 319,058 274,349 279,639 5,290$ 1.9%Other 3,243,554 3,387,083 3,874,479 3,732,809 (141,670)$ -3.7%Sales Taxes 40,671,444 47,098,487 45,026,058 46,455,850 1,429,792 3.2%
(41) Big Blue Bus Fund Total $ 89,699,852 $ 77,802,827 $ 89,089,315 $ 83,408,624 $ (5,680,691) -6.4%
(43) Gas Tax FundIntergovernmental 2,778,326$ 2,581,822$ 2,063,782$ 1,899,336$ (164,446)$ -8.0%Investment Income 10,369 5,924 3,000 7,000 4,000 133.3%
(43) Gas Tax Fund Total $ 2,788,696 $ 2,587,746 $ 2,066,782 $ 1,906,336 $ (160,446) -7.8%
(44) SCAQMD FundIntergovernmental 113,542$ 264,230$ 110,000$ 710,000$ 600,000$ 545.5%Investment Income 7,634 6,223 5,300 5,300 - 0.0%
(44) SCAQMD Fund Total $ 121,177 $ 270,452 $ 115,300 $ 715,300 $ 600,000 520.4%
13

FY 2015-16 Estimated
FY 2016-17 Adopted
Actual Budget Amount Percent
Change vs. Prior Year
Historical Revenue Summary by Fund and CategoryFY 2013-14
ActualFY 2014-15
Actual
(53) Parks and Recreation FundInvestment Income 2,152$ 1,615$ 1,000$ 1,000$ -$ 0.0%Other Local Taxes 18,200 26,568 9,510 - (9,510) -100.0%
(53) Parks and Recreation Fund Total $ 20,352 $ 28,184 $ 10,510 $ 1,000 $ (9,510) -90.5%
(54) Vehicle Management FundCharges for Service 10,738,117$ 10,345,090$ 11,631,747$ 12,002,798$ 371,051$ 3.2%Investment Income 239,094 193,210 255,000 275,000 20,000$ 7.8%Other 154,630 200,791 212,000 472,600 260,600 122.9%
(54) Vehicle Management Fund Total $ 11,131,841 $ 10,739,091 $ 12,098,747 $ 12,750,398 $ 651,651 5.4%
(55) Info Tech Rplcmnt & Svcs FundCharges for Service 2,079,179$ 2,054,848$ 2,003,577$ 1,866,879$ (136,698)$ -6.8%Investment Income 60,541 53,660 56,000 56,000 - 0.0%
(55) Info Tech Rplcmnt & Svcs Fund Total $ 2,139,719 $ 2,108,508 $ 2,059,577 $ 1,922,879 $ (136,698) -6.6%
(56) Self-insur, General Liab/Auto FundCharges for Service 3,095,740$ 3,164,491$ 2,999,998$ 2,999,998$ -$ 0.0%Investment Income 156,014 101,133 120,000 150,000 30,000$ 25.0%Other 323,488 79,689 - - - n/a
(56) Self-insur, General Liab/Auto Fund Total $ 3,575,242 $ 3,345,314 $ 3,119,998 $ 3,149,998 $ 30,000 1.0%
14

FY 2015-16 Estimated
FY 2016-17 Adopted
Actual Budget Amount Percent
Change vs. Prior Year
Historical Revenue Summary by Fund and CategoryFY 2013-14
ActualFY 2014-15
Actual
(57) Self-insurance, Bus FundCharges for Service 2,500,000$ 2,500,250$ 2,500,000$ 2,500,000$ -$ 0.0%Investment Income 56,108 32,454 50,000 55,000 5,000 10.0%
(57) Self-insurance, Bus Fund $ 2,556,108 $ 2,532,704 $ 2,550,000 $ 2,555,000 $ 5,000 0.2%
(58) Risk Management - Admin FundCharges for Service 2,445,550$ 2,702,009$ 2,767,849$ 3,037,698$ 269,849$ 9.7%Investment Income 1,477 (1) - - - n/a
(58) Risk Management - Admin Fund Total $ 2,447,027 $ 2,702,008 $ 2,767,849 $ 3,037,698 $ 269,849 9.7%
(59) Self-insur, Workers' Comp FundCharges for Service 9,223,970$ 14,973,131$ 12,800,001$ 13,440,002$ 640,001$ 5.0%Investment Income 265,271 180,480 250,000 300,000 50,000$ 20.0%Other 7,651 10,504 - - - n/a
(59) Self-insur, Workers' Comp Fund Total $ 9,496,893 $ 15,164,115 $ 13,050,001 $ 13,740,002 $ 690,001 5.3%
(77) Parking Authority FundInvestment Income 35,893$ 25,373$ 25,000$ 27,000$ 2,000$ 8.0%Other - - - - - n/a
(77) Parking Authority Fund Total $ 35,893 $ 25,373 $ 25,000 $ 27,000 $ 2,000 8.0%
Total All FUNDS $ 603,135,063 $ 613,932,825 $ 655,057,531 $ 635,075,157 $ (19,982,374) -3.1%
Less Reimbursements and Transfers (48,549,122)$ (54,492,345)$ (55,049,671)$ (56,663,846)$ (1,614,175)$ 2.9%
GRAND TOTAL 554,585,941$ 559,440,480$ 600,007,860$ 578,411,311$ (21,596,549)$ -3.6%
15

FY 2015-16 Estimated
FY 2016-17 Adopted
Actual Budget Amount Percent
Change vs. Prior Year
Historical Revenue Summary by Fund and CategoryFY 2013-14
ActualFY 2014-15
Actual
(13) Disaster Relief Fund a
Intergovernmental 182,750 151,759 2,800,188 - (2,800,188) -100.0%
(13) Disaster Relief Fund Total $ 182,750 $ 151,759 $ 2,800,188 $ - $ (2,800,188) -100.0%
a. Reimbursements from the Federal Emergency Management Agency (FEMA) and the California State Office of Emergency Services for projects related to the Northridge earthquake.
16

EXPENDITURE SUMMARY TABLES
FY 2016-17 Adopted Budget
17

18
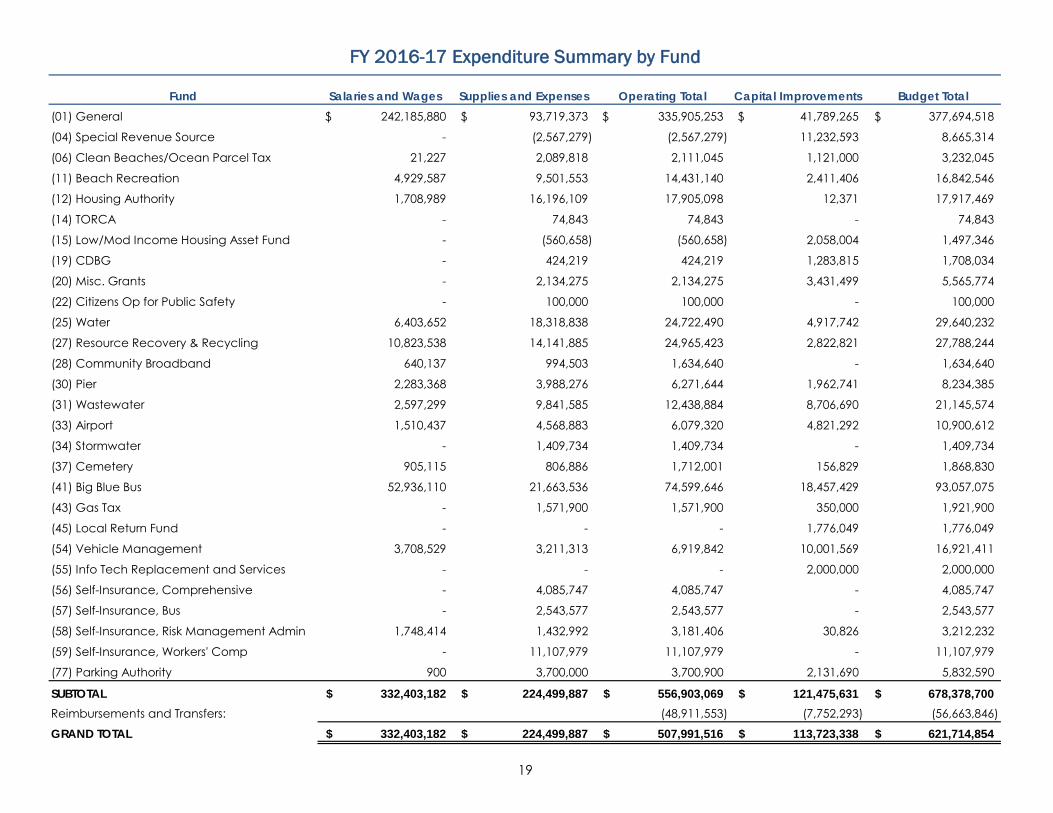
Fund Salaries and Wages Supplies and Expenses Operating Total Capital Improvements Budget Total(01) General 242,185,880$ 93,719,373$ 335,905,253$ 41,789,265$ 377,694,518$
(04) Special Revenue Source - (2,567,279) (2,567,279) 11,232,593 8,665,314
(06) Clean Beaches/Ocean Parcel Tax 21,227 2,089,818 2,111,045 1,121,000 3,232,045
(11) Beach Recreation 4,929,587 9,501,553 14,431,140 2,411,406 16,842,546
(12) Housing Authority 1,708,989 16,196,109 17,905,098 12,371 17,917,469
(14) TORCA - 74,843 74,843 - 74,843
(15) Low/Mod Income Housing Asset Fund - (560,658) (560,658) 2,058,004 1,497,346
(19) CDBG - 424,219 424,219 1,283,815 1,708,034
(20) Misc. Grants - 2,134,275 2,134,275 3,431,499 5,565,774
(22) Citizens Op for Public Safety - 100,000 100,000 - 100,000
(25) Water 6,403,652 18,318,838 24,722,490 4,917,742 29,640,232
(27) Resource Recovery & Recycling 10,823,538 14,141,885 24,965,423 2,822,821 27,788,244
(28) Community Broadband 640,137 994,503 1,634,640 - 1,634,640
(30) Pier 2,283,368 3,988,276 6,271,644 1,962,741 8,234,385
(31) Wastewater 2,597,299 9,841,585 12,438,884 8,706,690 21,145,574
(33) Airport 1,510,437 4,568,883 6,079,320 4,821,292 10,900,612
(34) Stormwater - 1,409,734 1,409,734 - 1,409,734
(37) Cemetery 905,115 806,886 1,712,001 156,829 1,868,830
(41) Big Blue Bus 52,936,110 21,663,536 74,599,646 18,457,429 93,057,075
(43) Gas Tax - 1,571,900 1,571,900 350,000 1,921,900
(45) Local Return Fund - - - 1,776,049 1,776,049
(54) Vehicle Management 3,708,529 3,211,313 6,919,842 10,001,569 16,921,411
(55) Info Tech Replacement and Services - - - 2,000,000 2,000,000
(56) Self-Insurance, Comprehensive - 4,085,747 4,085,747 - 4,085,747
(57) Self-Insurance, Bus - 2,543,577 2,543,577 - 2,543,577
(58) Self-Insurance, Risk Management Admin 1,748,414 1,432,992 3,181,406 30,826 3,212,232
(59) Self-Insurance, Workers' Comp - 11,107,979 11,107,979 - 11,107,979
(77) Parking Authority 900 3,700,000 3,700,900 2,131,690 5,832,590
SUBTOTAL 332,403,182$ 224,499,887$ 556,903,069$ 121,475,631$ 678,378,700$ Reimbursements and Transfers: (48,911,553) (7,752,293) (56,663,846)
GRAND TOTAL 332,403,182$ 224,499,887$ 507,991,516$ 113,723,338$ 621,714,854$
FY 2016-17 Expenditure Summary by Fund
19

20

(1) (2) (3) (4) (5) (6)
FUND/DEPARTMENT BUDGET UNIT
(01) General FundOperating BudgetCity Council 846,823$ 1,094,613$ 1,503,649$ 947,051$ (556,598)$ -37.0%City Manager 8,405,045 11,149,422 15,752,885 15,840,386 87,501 0.6%Records & Election Services 2,250,008 2,709,332 2,437,603 3,035,235 597,632 24.5%Finance 11,007,843 11,297,453 12,636,750 13,515,857 879,107 7.0%City Attorney 9,273,348 9,988,261 10,448,009 10,921,265 473,256 4.5%Human Resources 3,752,507 3,942,249 4,561,062 4,504,004 (57,058) -1.3%Information Systems 7,586,929 7,994,662 9,048,137 7,545,222 (1,502,915) -16.6%Planning & Comm. Development 29,242,856 29,771,424 33,748,900 36,411,478 2,662,578 7.9%Police 74,147,802 76,908,594 81,767,924 85,207,234 3,439,310 4.2%Fire 33,345,089 34,471,510 36,392,251 39,669,180 3,276,929 9.0%Community & Cultural Services 24,333,675 24,938,933 26,951,973 27,991,334 1,039,361 3.9%Library 10,945,083 11,564,334 12,427,018 12,852,539 425,521 3.4%Public Works 37,131,486 39,514,204 42,287,269 44,365,025 2,077,756 4.9%Housing & Economic Development 4,705,440 4,784,037 5,795,879 5,897,555 101,676 1.8%Operating Budget 256,973,934$ 270,129,028$ 295,759,309$ 308,703,365$ 12,944,056$ 4.4%
Non-DepartmentalAll Other Transactions 67,050,781$ 61,695,444$ 33,884,843$ 34,035,499$ 150,656$ 0.4%Non-Departmental 67,050,781$ 61,695,444$ 33,884,843$ 34,035,499$ 150,656$ 0.4%
Operating Budget Subtotal 324,024,715$ 331,824,472$ 329,644,152$ 342,738,864$ 13,094,712$ 4.0%Interfund Transfers & Reimbursements (15,073,713) (11,448,426) (6,269,198) (6,833,611) (564,413) 9.0%Operating Budget Total 308,951,002$ 320,376,046$ 323,374,954$ 335,905,253$ 12,530,299$ 3.9%Capital Budget 47,311,516 27,145,358 99,911,498 41,789,265 (58,122,233) -58.2%Sub-Total 356,262,518$ 347,521,404$ 423,286,452$ 377,694,518$ (45,591,934)$ -10.8%Less Reappropriated Capital b - - 62,865,372 - (62,865,372) -100%General Fund Total 356,262,518$ 347,521,404$ 360,421,080$ 377,694,518$ 17,273,438$ 4.8%
a. FY 2015-16 Revised Budget differs from amounts presented in the FY 2015-17 Adopted Budget due to Council-approved budget changes.b. Reappropriated Capital represents capital projects fully funded in prior fiscal years that are still underway; these are financed using associated fund reserves.
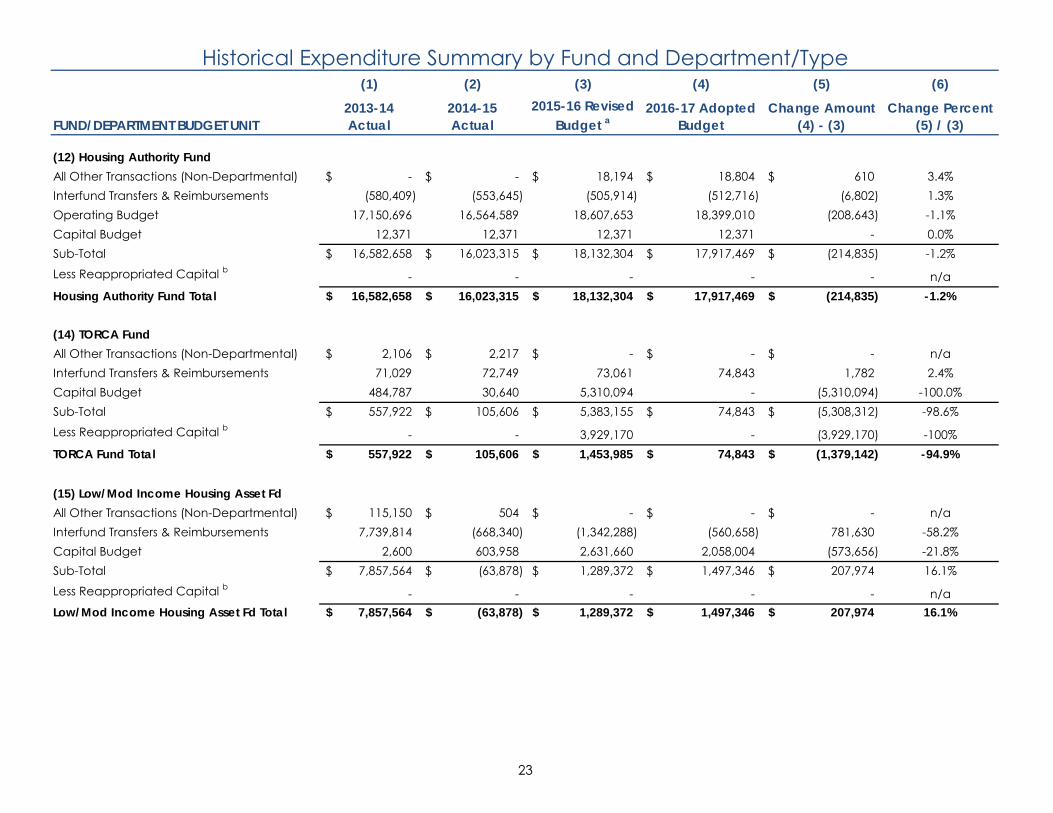
Historical Expenditure Summary by Fund and Department/Type
2013-14Actual
2014-15Actual
2015-16 RevisedBudget a
2016-17 AdoptedBudget
Change Amount(4) - (3)
Change Percent(5) / (3)
21

(1) (2) (3) (4) (5) (6)
FUND/DEPARTMENT BUDGET UNIT
Historical Expenditure Summary by Fund and Department/Type
2013-14Actual
2014-15Actual
2015-16 RevisedBudget a
2016-17 AdoptedBudget
Change Amount(4) - (3)
Change Percent(5) / (3)
(04) Special Revenue Source FundAll Other Transactions (Non-Departmental) -$ -$ 356,200$ -$ (356,200)$ -100.0%Interfund Transfers & Reimbursements 630,444$ 4,407,204$ (7,620,098)$ (3,239,996)$ 4,380,102$ -57.5%Operating Budget 250,881 18,272 420,229 672,717 252,488 60.1%Capital Budget (151,637) 5,188,966 26,524,150 11,232,593 (15,291,557) -57.7%Sub-Total 729,688$ 9,614,442$ 19,680,481$ 8,665,314$ (11,015,167)$ -56.0%Less Reappropriated Capital b - - 16,541,501 - (16,541,501) -100%Special Revenue Source Fund Total 729,688$ 9,614,442$ 3,138,980$ 8,665,314$ 5,526,334$ 176.1%
(06) Clean Beaches & Ocean Prcl Tx FundInterfund Transfers & Reimbursements 1,549,740$ 1,519,812$ 647,780$ 1,277,538$ 629,758$ 97.2%Operating Budget 280,021 330,919 844,806 833,507 (11,299) -1.3%Capital Budget 1,770,477 341,577 7,269,141 1,121,000 (6,148,141) -84.6%Sub-Total 3,600,238$ 2,192,308$ 8,761,727$ 3,232,045$ (5,529,682)$ -63.1%Less Reappropriated Capital b - - 5,432,141 - (5,432,141) -100%Clean Beaches & Ocean Prcl Tx Fund Total 3,600,238$ 2,192,308$ 3,329,586$ 3,232,045$ (97,541)$ -2.9%
(11) Beach Recreation FundAll Other Transactions (Non-Departmental) 47,378$ 66,863$ 33,008$ 34,069$ 1,061$ 3.2%Operating Budget 11,324,340 11,892,205 13,949,582 14,397,071 447,489 3.2%Capital Budget 1,347,788 911,552 4,554,009 2,411,406 (2,142,603) -47.0%Sub-Total 12,719,506$ 12,870,620$ 18,536,599$ 16,842,546$ (1,694,053)$ -9.1%Less Reappropriated Capital b - - 2,374,364 - (2,374,364) -100%Beach Recreation Fund Total 12,719,506$ 12,870,620$ 16,162,235$ 16,842,546$ 680,311$ 4.2%
22
(1) (2) (3) (4) (5) (6)
FUND/DEPARTMENT BUDGET UNIT
Historical Expenditure Summary by Fund and Department/Type
2013-14Actual
2014-15Actual
2015-16 RevisedBudget a
2016-17 AdoptedBudget
Change Amount(4) - (3)
Change Percent(5) / (3)
(12) Housing Authority FundAll Other Transactions (Non-Departmental) -$ -$ 18,194$ 18,804$ 610$ 3.4%Interfund Transfers & Reimbursements (580,409) (553,645) (505,914) (512,716) (6,802) 1.3%Operating Budget 17,150,696 16,564,589 18,607,653 18,399,010 (208,643) -1.1%Capital Budget 12,371 12,371 12,371 12,371 - 0.0%Sub-Total 16,582,658$ 16,023,315$ 18,132,304$ 17,917,469$ (214,835)$ -1.2%Less Reappropriated Capital b - - - - - n/aHousing Authority Fund Total 16,582,658$ 16,023,315$ 18,132,304$ 17,917,469$ (214,835)$ -1.2%
(14) TORCA FundAll Other Transactions (Non-Departmental) 2,106$ 2,217$ -$ -$ -$ n/aInterfund Transfers & Reimbursements 71,029 72,749 73,061 74,843 1,782 2.4%Capital Budget 484,787 30,640 5,310,094 - (5,310,094) -100.0%Sub-Total 557,922$ 105,606$ 5,383,155$ 74,843$ (5,308,312)$ -98.6%Less Reappropriated Capital b - - 3,929,170 - (3,929,170) -100%TORCA Fund Total 557,922$ 105,606$ 1,453,985$ 74,843$ (1,379,142)$ -94.9%
(15) Low/Mod Income Housing Asset FdAll Other Transactions (Non-Departmental) 115,150$ 504$ -$ -$ -$ n/aInterfund Transfers & Reimbursements 7,739,814 (668,340) (1,342,288) (560,658) 781,630 -58.2%Capital Budget 2,600 603,958 2,631,660 2,058,004 (573,656) -21.8%Sub-Total 7,857,564$ (63,878)$ 1,289,372$ 1,497,346$ 207,974$ 16.1%Less Reappropriated Capital b - - - - - n/aLow/Mod Income Housing Asset Fd Total 7,857,564$ (63,878)$ 1,289,372$ 1,497,346$ 207,974$ 16.1%
23

(1) (2) (3) (4) (5) (6)
FUND/DEPARTMENT BUDGET UNIT
Historical Expenditure Summary by Fund and Department/Type
2013-14Actual
2014-15Actual
2015-16 RevisedBudget a
2016-17 AdoptedBudget
Change Amount(4) - (3)
Change Percent(5) / (3)
(17) S/A Earthquake Project Area c
All Other Transactions (Non-Departmental) 14,821,045$ 9,779,491$ -$ -$ -$ n/aInterfund Transfers & Reimbursements - 540,041 - - - n/aCapital Budget 2,296,740 2,203,260 - - - n/aSub-Total 17,117,785$ 12,522,792$ -$ -$ -$ n/aLess Reappropriated Capital b - - - - - n/aS/A Earthquake Project Area Total 17,117,785$ 12,522,792$ -$ -$ -$ n/a
(19) CDBG FundAll Other Transactions (Non-Departmental) 266,821$ 413,228$ 149,499$ 29,499$ (120,000)$ -80.3%Interfund Transfers & Reimbursements 196,991 116,401 190,000 193,452 3,452 1.8%Operating Budget 203,837 199,010 501,268 201,268 (300,000) -59.8%Capital Budget 564,454 860,401 988,834 1,283,815 294,981 29.8%Sub-Total 1,232,103$ 1,589,040$ 1,829,601$ 1,708,034$ (121,567)$ -6.6%
Less Reappropriated Capital b - - 242,263 - (242,263) -100%CDBG Fund Total 1,232,103$ 1,589,040$ 1,587,338$ 1,708,034$ 120,696$ 7.6%
(20) Miscellaneous Grants FundInterfund Transfers & Reimbursements 782,622 726,240 941,749 948,136 6,387 0.7%Operating budget 2,573,872 3,127,077 5,102,637 1,186,139 (3,916,498) -76.8%Capital Budget 5,630,186 9,292,508 46,496,193 3,431,499 (43,064,694) -92.6%Sub-Total 8,986,680$ 13,145,825$ 52,540,579$ 5,565,774$ (46,974,805)$ -89.4%Less Reappropriated Capital b - - 39,351,242 - (39,351,242) -100%Miscellaneous Grants Fund Total 8,986,680$ 13,145,825$ 13,189,337$ 5,565,774$ (7,623,563)$ -57.8%
c. Redevelopment Agency (RDA) funds converted to private purpose trust funds following the RDA dissolution in February 2012.
24

(1) (2) (3) (4) (5) (6)
FUND/DEPARTMENT BUDGET UNIT
Historical Expenditure Summary by Fund and Department/Type
2013-14Actual
2014-15Actual
2015-16 RevisedBudget a
2016-17 AdoptedBudget
Change Amount(4) - (3)
Change Percent(5) / (3)
(22) COPS Fund Operating Budget 163,649$ 73,371$ 100,000$ 100,000$ -$ 0.0%Sub-Total 163,649$ 73,371$ 100,000$ 100,000$ -$ 0.0%Less Reappropriated Capital b - - - - - n/aCOPS Fund Total 163,649$ 73,371$ 100,000$ 100,000$ -$ 0.0%
(25) Water FundAll Other Transactions (Non-Departmental) 70,940$ (48,266)$ 56,226$ 57,973$ 1,747$ 3.1%Interfund Transfers & Reimbursements 1,032,808 1,675,619 2,202,087 1,903,566 (298,521) -13.6%Operating Budget 22,126,582 20,003,532 26,237,853 22,760,951 (3,476,902) -13.3%Capital Budget 5,639,444 5,193,651 13,468,465 4,917,742 (8,550,723) -63.5%Sub-Total 28,869,774$ 26,824,536$ 41,964,631$ 29,640,232$ (12,324,399)$ -29.4%Less Reappropriated Capital b - - 14,143,117 - (14,143,117) -100%Water Fund Total 28,869,774$ 26,824,536$ 27,821,514$ 29,640,232$ 1,818,718$ 6.5%
(27) Resource Recovery & Recyc Fund All Other Transactions (Non-Departmental) 39,129$ (195,014)$ 97,648$ 100,994$ 3,346$ 3.4%Interfund Transfers & Reimbursements 417,689 408,079 587,238 601,137 13,899 2.4%Operating Budget 20,167,485 21,833,184 23,800,589 24,263,292 462,703 1.9%Capital Budget 2,804,827 2,322,417 3,486,605 2,822,821 (663,784) -19.0%Sub-Total 23,429,130$ 24,368,666$ 27,972,080$ 27,788,244$ (183,836)$ -0.7%Less Reappropriated Capital b - - 931,202 - (931,202) -100%Resource Recovery & Recyc Fund Total 23,429,130$ 24,368,666$ 27,040,878$ 27,788,244$ 747,366$ 2.8%
(28) Community Broadband Fund d
Operating Budget -$ -$ -$ 1,634,640$ 1,634,640$ n/aSub-Total -$ -$ -$ 1,634,640$ 1,634,640$ n/aLess Reappropriated Capital b - - - 0 n/aCommunity Broadband Fund Total -$ -$ -$ 1,634,640$ 1,634,640$ n/ad. Staff and associated expenses related to the City's community broadband services were transferred from the General Fund to the newly-created Community Broadband Fund, effective FY 2016-17.
25

(1) (2) (3) (4) (5) (6)
FUND/DEPARTMENT BUDGET UNIT
Historical Expenditure Summary by Fund and Department/Type
2013-14Actual
2014-15Actual
2015-16 RevisedBudget a
2016-17 AdoptedBudget
Change Amount(4) - (3)
Change Percent(5) / (3)
(30) Pier FundAll Other Transactions (Non-Departmental) 7,976$ (37,005)$ 13,687$ 14,040$ 353$ 2.6%Interfund Transfers & Reimbursements 186,529 192,038 (5,081) (2,158) 2,923 -57.5%Operating Budget 5,218,770 6,044,495 6,366,532 6,259,762 (106,770) -1.7%Capital Budget 6,360,182 457,984 1,603,597 1,962,741 359,144 22.4%Sub-Total 11,773,457$ 6,657,512$ 7,978,735$ 8,234,385$ 255,650$ 3.2%Less Reappropriated Capital b - - 715,946 - (715,946) -100%Pier Fund Total 11,773,457$ 6,657,512$ 7,262,789$ 8,234,385$ 971,596$ 13.4%
(31) Wastewater Fund All Other Transactions (Non-Departmental) 44,791$ 14,472$ 22,109$ 22,780$ 671$ 3.0%Interfund Transfers & Reimbursements (584,857) (914,762) (605,182) (538,922) 66,260 -10.9%Operating Budget 11,187,972 11,270,261 11,585,855 12,955,026 1,369,171 11.8%Capital Budget 5,144,351 4,280,951 13,537,957 8,706,690 (4,831,267) -35.7%Sub-Total 15,792,257$ 14,650,922$ 24,540,739$ 21,145,574$ (3,395,165)$ -13.8%Less Reappropriated Capital b - - 5,067,634 - (5,067,634) -100%Wastewater Fund Total 15,792,257$ 14,650,922$ 19,473,105$ 21,145,574$ 1,672,469$ 8.6%
(33) Airport FundAll Other Transactions (Non-Departmental) 7,264$ 1,703$ 5,365$ 5,396$ 31$ 0.6%Interfund Transfers & Reimbursements - - - 127,314 127,314 n/aOperating Budget 3,893,878 4,159,416 6,308,164 5,946,610 (361,554) -5.7%Capital Budget 1,115,519 543,532 3,674,595 4,821,292 1,146,697 31.2%Sub-Total 5,016,661$ 4,704,651$ 9,988,124$ 10,900,612$ 912,488$ 9.1%
Less Reappropriated Capital b - - 1,365,175 - (1,365,175) -100%Airport Fund Total 5,016,661$ 4,704,651$ 8,622,949$ 10,900,612$ 2,277,663$ 26.4%
26

(1) (2) (3) (4) (5) (6)
FUND/DEPARTMENT BUDGET UNIT
Historical Expenditure Summary by Fund and Department/Type
2013-14Actual
2014-15Actual
2015-16 RevisedBudget a
2016-17 AdoptedBudget
Change Amount(4) - (3)
Change Percent(5) / (3)
(34) Stormwater Management FundAll Other Transactions (Non-Departmental) 349,520$ 99,746$ 76,721$ 69,195$ (7,526)$ -9.8%Interfund Transfers & Reimbursements 702,547 1,228,343 1,916,107 1,340,539 (575,568) -30.0%Sub-Total 1,052,067$ 1,328,089$ 1,992,828$ 1,409,734$ (583,094)$ -29.3%Less Reappropriated Capital b - - - - - n/aStormwater Management Fund Total 1,052,067$ 1,328,089$ 1,992,828$ 1,409,734$ (583,094)$ -29.3%
(37) Cemetery Fund All Other Transactions (Non-Departmental) 3,257$ (26,531)$ 2,579$ 2,579$ -$ 0.0%Interfund Transfers & Reimbursements (365,710) (554,261) (489,512) (423,337) 66,175 -13.5%Operating Budget 1,842,648 2,002,412 1,941,527 2,132,759 191,232 9.8%Capital Budget 38,526 33,279 151,043 156,829 5,786 3.8%Sub-Total 1,518,721$ 1,454,899$ 1,605,637$ 1,868,830$ 263,193$ 16.4%Less Reappropriated Capital b - - - - - n/aCemetery Fund Total 1,518,721$ 1,454,899$ 1,605,637$ 1,868,830$ 263,193$ 16.4%
(41) Big Blue Bus Fund All Other Transactions (Non-Departmental) 178,294$ (701,434)$ 373,236$ 384,233$ 10,997$ 2.9%Interfund Transfers & Reimbursements 36,637 (171,522) (211,132) (194,925) 16,207 -7.7%Operating Budget 60,975,736 65,265,320 70,897,604 74,410,338 3,512,734 5.0%Capital Budget 29,695,751 12,022,069 86,458,431 18,457,429 (68,001,002) -78.7%Sub-Total 90,886,418$ 76,414,433$ 157,518,139$ 93,057,075$ (64,461,064)$ -40.9%Less Reappropriated Capital b - - 73,404,454$ - (73,404,454)$ -100%Big Blue Bus Fund Total 90,886,418$ 76,414,433$ 84,113,685$ 93,057,075$ 8,943,390$ 10.6%
27

(1) (2) (3) (4) (5) (6)
FUND/DEPARTMENT BUDGET UNIT
Historical Expenditure Summary by Fund and Department/Type
2013-14Actual
2014-15Actual
2015-16 RevisedBudget a
2016-17 AdoptedBudget
Change Amount(4) - (3)
Change Percent(5) / (3)
(43) Gas Tax Fund All Other Transactions (Non-Departmental) 3,691$ 3,820$ 4,900$ 4,900$ -$ 0.0%Interfund Transfers & Reimbursements 2,778,327 2,581,823 1,959,004 1,567,000 (392,004) -20.0%Capital Budget 350,000 350,000 - 350,000 350,000 n/aSub-Total 3,132,018$ 2,935,643$ 1,963,904$ 1,921,900$ (42,004)$ -2.1%Less Reappropriated Capital b - - - - - n/aGas Tax Fund Total 3,132,018$ 2,935,643$ 1,963,904$ 1,921,900$ (42,004)$ -2.1%
(44) SCAQMD AB 2766 Fund All Other Transactions (Non-Departmental) 5,429$ 5,591$ -$ -$ -$ n/aInterfund Transfers & Reimbursements - 390,873 - - - n/aCapital Budget 19,666 165,561 357,059 (357,059) -100.0%Sub-Total 25,095$ 562,025$ 357,059$ -$ (357,059)$ -100.0%Less Reappropriated Capital b 357,059 - (357,059) -100%SCAQMD AB 2766 Fund Total 25,095$ 562,025$ (0)$ -$ 0$ -100.0%
(45) Local Return Fund e
Capital Budget -$ -$ -$ 1,776,049 1,776,049 n/aSub-Total -$ -$ -$ 1,776,049$ 1,776,049$ n/aLess Reappropriated Capital b - n/aLocal Return Fund Total -$ -$ -$ 1,776,049$ 1,776,049$ n/a
(53) Parks and Recreation Fund Operating Budget 17,000$ -$ -$ -$ -$ n/aCapital Budget 22,389 51,487 292,483 - (292,483) -100.0%Sub-Total 39,389$ 51,487$ 292,483$ -$ (292,483)$ -100.0%Less Reappropriated Capital b - - 179,252 - (179,252) -100%Parks and Recreation Fund Total 39,389$ 51,487$ 113,231$ -$ (113,231)$ -100.0%
e. Local Return Fund was created in FY 2016-17 to better manage the City's public transit, paratransit, and related transportation infrastructure projects funded by Proposition A, C, and Measure R sales tax measures.
28

(1) (2) (3) (4) (5) (6)
FUND/DEPARTMENT BUDGET UNIT
Historical Expenditure Summary by Fund and Department/Type
2013-14Actual
2014-15Actual
2015-16 RevisedBudget a
2016-17 AdoptedBudget
Change Amount(4) - (3)
Change Percent(5) / (3)
(54) Vehicle Management Fund f
All Other Transactions (Non-Departmental) 14,554$ (24,674)$ 31,976$ 32,990$ 1,014$ 3.2%Interfund Transfers & Reimbursements - (390,873) - - - n/aOperating Budget 6,292,226 6,387,210 6,306,354 6,886,852 580,498 9.2%Capital Budget 2,409,951 4,188,042 16,550,939 10,001,569 (6,549,370) -39.6%Sub-Total 8,716,731$ 10,159,705$ 22,889,269$ 16,921,411$ (5,967,858)$ -26.1%Less Reappropriated Capital b - - 9,788,029 - (9,788,029) -100%Vehicle Management Fund Total 8,716,731$ 10,159,705$ 13,101,240$ 16,921,411$ 3,820,171$ 29.2%f. FY 2016-17 amounts reflect the replacement need according to an established schedule, and are funded by prior year contributions from other funds.
(55) Info Tech Rplcmnt & Svcs Fund Capital Budget 1,677,581$ 1,997,361$ 4,412,379$ 2,000,000$ (2,412,379)$ -54.7%Sub-Total 1,677,581$ 1,997,361$ 4,412,379$ 2,000,000$ (2,412,379)$ -54.7%Less Reappropriated Capital b - - 2,663,395 - (2,663,395) -100%Info Tech Rplcmnt & Svcs Fund Total 1,677,581$ 1,997,361$ 1,748,984$ 2,000,000$ 251,016$ 14.4%
(56) Self-Insur, General Liab/Auto
All Other Transactions (Non-Departmental) 3,745,317$ 3,724,962$ 3,417,477$ 3,629,727$ 212,250$ 6.2%Interfund Transfers & Reimbursements 394,358 415,381 465,317 456,020 (9,297) -2.0%Capital Budget - - 332,600 - (332,600) -100.0%Sub-Total 4,139,675$ 4,140,343$ 4,215,394$ 4,085,747$ (129,647)$ -3.1%Less Reappropriated Capital b - - 332,600 - (332,600) -100%Self-insur, General Liab/Auto Total 4,139,675$ 4,140,343$ 3,882,794$ 4,085,747$ 202,953$ 5.2%
(57) Self-Insurance, Bus Fund All Other Transactions (Non-Departmental) 2,782,606$ 1,932,052$ 2,223,865$ 2,240,470$ 16,605$ 0.7%Interfund Transfers & Reimbursements 257,504 268,735 294,712 303,107 8,395 2.8%Capital Budget - - - - - n/aSub-Total 3,040,110$ 2,200,787$ 2,518,577$ 2,543,577$ 25,000$ 1.0%Less Reappropriated Capital b - - - - - n/a
29

(1) (2) (3) (4) (5) (6)
FUND/DEPARTMENT BUDGET UNIT
Historical Expenditure Summary by Fund and Department/Type
2013-14Actual
2014-15Actual
2015-16 RevisedBudget a
2016-17 AdoptedBudget
Change Amount(4) - (3)
Change Percent(5) / (3)
(58) Self-Insurance, Risk Management Admin Fund All Other Transactions (Non-Departmental) 7,603$ (51,022)$ 6,178$ 6,178$ -$ 0.0%Interfund Transfers & Reimbursements (1,912,697) (1,988,462) (2,026,969) (2,086,093) (59,124) 2.9%Operating Budget 4,297,523 4,572,194 4,933,545 5,261,321 327,776 6.6%Capital Budget - 3,332 3,448 30,826 27,378 794.0%Sub-Total 2,392,429$ 2,536,042$ 2,916,202$ 3,212,232$ 296,030$ 10.2%Less Reappropriated Capital b - - - - - n/aSelf-Insurance, Risk Management Admin Fund Total 2,392,429$ 2,536,042$ 2,916,202$ 3,212,232$ 296,030$ 10.2%
(59) Self-Insur, Workers' Comp Fund All Other Transactions (Non-Departmental) 8,099,437$ 7,954,205$ 9,103,100$ 9,628,100$ 525,000$ 5.8%Interfund Transfers & Reimbursements 1,397,689 1,450,992 1,437,545 1,479,879 42,334 2.9%Operating Budget 429 - - - - n/aCapital Budget 28,357 26,510 27,257 - (27,257) -100.0%Sub-Total 9,525,912$ 9,431,707$ 10,567,902$ 11,107,979$ 540,077$ 5.1%Less Reappropriated Capital b - - -$ - -$ n/aSelf-insur, Workers' Comp Fund Total 9,525,912$ 9,431,707$ 10,567,902$ 11,107,979$ 540,077$ 5.1%
(77) Parking Authority FundInterfund Transfers & Reimbursements -$ -$ 7,937,437$ 3,700,000$ (4,237,437)$ -53.4%Operating Budget 1,100 770 900 900 - 0.0%Capital Budget 51,888 2,525 1,255,602 2,131,690 876,088 69.8%Sub-Total 52,988$ 3,295$ 9,193,939$ 5,832,590$ (3,361,349)$ -36.6%Less Reappropriated Capital b - - 1,369,589 - (1,369,589) -100%Parking Authority Fund Total 52,988$ 3,295$ 7,824,350$ 5,832,590$ (1,991,760)$ -25.5%
30

(1) (2) (3) (4) (5) (6)
FUND/DEPARTMENT BUDGET UNIT
Historical Expenditure Summary by Fund and Department/Type
2013-14Actual
2014-15Actual
2015-16 RevisedBudget a
2016-17 AdoptedBudget
Change Amount(4) - (3)
Change Percent(5) / (3)
All FundsAll Other Transactions (Non-Departmental) 97,663,089$ 84,610,352$ 49,876,811$ 50,317,426$ 440,615$ 0.9%Interfund Transfers & Reimbursements (342,658) (695,961) (423,337) (419,885) 3,452 -0.8%Operating Budget 424,942,579 443,873,265 493,664,407 507,005,528 13,341,121 2.7%Capital Budget 114,627,715 78,229,292 339,310,410 121,475,631 (217,834,779) -64.2%Sub-Total 636,890,725$ 606,016,948$ 882,428,291$ 678,378,700$ (204,049,591)$ -23.1%Less Reappropriated Capital b - - 241,053,505 - (241,053,505) -100%Total All Funds 636,890,725$ 606,016,948$ 641,374,786$ 678,378,700$ 37,003,914$ 5.8%
Less Reimbursements and TransfersOperating (40,724,078)$ (47,879,318)$ (47,132,630)$ (48,911,553)$ (1,778,923)$ 3.8%Capital (7,825,044) (6,613,026) (7,917,041) (7,752,293) 164,748 -2.1%Sub-Total (48,549,122) (54,492,344) (55,049,671) (56,663,846) (1,614,175) 2.9%
Grand Total 588,341,603$ 551,524,604$ 586,325,115$ 621,714,854$ 35,389,739$ 6.0%
(13) Disaster Relief Fund g
Operating Budget 121$ -$ -$ -$ -$ n/aDisaster Relief Fund Total 121$ -$ -$ -$ -$ n/a
g. To account for Federal and State disaster relief grants and the City's related to the January 17, 1994 Northridge Earthquake. There are no anticipated expenditures in FY 2015-17.
31

32

DEPARTMENT SUMMARY TABLES
FY 2016-17 Adopted Budget
33

34

City Council
Budget Summary GENERAL FUND
EXPENDITURE CATEGORIES 2013-14 Actual
2014-15 Actual
2015-16 Revised Budget
2016-17 Adopted Budget
DIVISION
Direct Costs
City Council a $ 846,823 $ 1,094,613 $ 1,503,649 $ 947,051
Total Department $ 846,823 $ 1,094,613 $ 1,503,649 $ 947,051
MAJOR ACCOUNT GROUPS BY FUND
01 General Fund
Salaries and Wages $ 402,238 $ 415,573 $ 405,269 $ 424,392
Supplies and Expenses a 444,585 679,040 1,098,380 522,659
Total Department $ 846,823 $ 1,094,613 $ 1,503,649 $ 947,051
PERSONNEL (FULL-TIME EQUIVALENTS) BY FUND
2013-14 Revised Budget
2014-15 Revised Budget
2015-16 Revised Budget
2016-17 Adopted Budget
01 General Fund
Permanent Positions 1.0 1.0 1.0 1.0
Temporary Positions 0.0 0.0 0.0 0.0
Total Department 1.0 1.0 1.0 1.0
Footnotes a. FY 2015-16 Revised Budget includes $158,615 of Council Discretionary Funds that were
rolled over from FY 2014-15 and a one-time budget enhancement of $420,000 for an outside advisor to conduct a review of local government best practices.
35

36

City Manager
Budget Summary VARIOUS FUNDS
EXPENDITURE CATEGORIES 2013-14 Actual
2014-15 Actual
2015-16 Revised Budget
2016-17 Adopted Budget
DIVISION
Direct Costs
Administration a $ 2,076,832 $ 2,172,217 $ 2,632,069 $ 3,111,455
Office of Communications b 2,205,626 2,266,745 2,885,204 2,795,738 Office of Emergency
Management 739,196 2,833,256 5,155,365 5,339,564
Office of Pier Management c 2,156,081 2,744,667 2,712,178 - Office of Sustainability and the
Environment d 3,419,943 4,086,599 5,318,478 4,593,629
Total Department $10,597,678 $14,103,484 $18,703,294 $15,840,386
MAJOR ACCOUNT GROUPS BY FUND
01 General Fund
Salaries and Wages $ 5,735,356 $ 7,895,727 $11,265,315 $12,127,897
Supplies and Expenses 2,669,688 3,253,698 4,487,570 3,712,489
Subtotal $ 8,405,044 $11,149,425 $15,752,885 $15,840,386
20 Miscellaneous Grants Fund
Supplies and Expenses $ 36,553 $ 209,392 $ 238,231 -
Subtotal $ 36,553 $ 209,392 $ 238,231 -
30 Pier Fund
Salaries and Wages $ 279,404 $ 299,448 $ 307,948 -
Supplies and Expenses 1,876,677 2,445,219 2,404,230 -
Subtotal $ 2,156,081 $ 2,744,667 $ 2,712,178 -
Total All Funds
Salaries and Wages $ 6,014,760 $ 8,195,175 $11,573,263 $12,127,897
Supplies and Expenses 4,582,918 5,908,309 7,130,031 3,712,489
Total Department $10,597,678 $14,103,484 $18,703,294 $15,840,386
37

City Manager
Budget Summary VARIOUS FUNDS
PERSONNEL (FULL-TIME EQUIVALENTS) BY FUND
2013-14 Revised Budget
2014-15 Revised Budget
2015-16 Revised Budget
2016-17 Adopted Budget
01 General Fund
Permanent Positions 37.5 71.0 76.5 79.0
Temporary Positions 4.9 5.2 6.1 6.1
Subtotal 42.4 76.2 82.6 85.1
30 Pier Fund
Permanent Positions 2.0 2.0 2.0 0.0
Temporary Positions 0.0 0.0 0.0 0.0
Subtotal 2.0 2.0 2.0 0.0
Total All Funds
Permanent Positions 39.5 73.0 78.5 79.0
Temporary Positions 4.9 5.2 6.1 6.1
Total Department 44.4 78.2 84.6 85.1
Footnotes a. FY 2015-17 increase reflects the addition of 4.0 FTE positions (Chief Data Officer, Chief
Performance Officer, limited-term Senior Advisor to the City Manager on Airport Affairs, and limited-term Assistant Admin Analyst) offset by the transfer of 0.5 FTE Administrative Analyst position to Records & Election Services and 0.5 FTE Volunteer Program Coordinator to Community and Cultural Services.
b. FY 2015-17 increase reflects funding to support the reorganization of the Community and Government Relations Division to the Office of Communications, including the addition of 5.0 FTE permanent positions (Senior Marketing Manager, Public Information Officer, Marketing/Communications Assistant, Administrative Services Officer, and Staff Assistant II offset by the deletion of Community Relations Coordinator position).
c. FY 2016-17 decrease reflects transfer of the Office of Pier Management to Public Works. d. FY 2016-17 decrease reflects the deletion of 1.0 FTE Water Resources Specialist and 1.0 FTE
Sustainable Energy Engineer, offset by the extension of 4.0 FTE limited term water conservation positions through FY 2016-17, and the addition of a climate change team consisting of 1.0 FTE Senior Sustainability Analyst and 1.0 FTE Sustainability Analyst.
38

Records & Election Services (City Clerk)
Budget Summary GENERAL FUND
EXPENDITURE CATEGORIES 2013-14 Actual
2014-15 Actual
2015-16 Revised Budget
2016-17 Adopted Budget
DIVISION
Direct Costs
Administration a $ 1,242,678 $ 1,377,877 $ 1,498,364 $ 1,594,554
Elections b 13,696 366,184 23,207 505,156
Support Services 993,634 965,271 916,032 935,525
Total Department $ 2,250,008 $ 2,709,332 $ 2,437,603 $ 3,035,235
MAJOR ACCOUNT GROUPS BY FUND
01 General Fund a, b
Salaries and Wages $ 1,383,502 $ 1,531,671 $ 1,603,625 $ 1,692,471
Supplies and Expenses 866,506 1,177,661 833,978 1,342,764
Total Department $ 2,250,008 $ 2,709,332 $ 2,437,603 $ 3,035,235
PERSONNEL (FULL-TIME EQUIVALENTS) BY FUND
2013-14 Revised Budget
2014-15 Revised Budget
2015-16 Revised Budget
2016-17 Adopted Budget
01 General Fund
Permanent Positions a 13.0 13.0 13.5 13.5
Temporary Positions 0.0 0.0 0.0 0.0
Total Department 13.0 13.0 13.5 13.5
Footnotes a. In FY 2015-16, 0.5 FTE Administrative Analyst was transferred from the City Manager’s Office
for the administration of the City’s agenda management system. b. FY 2016-17 budget reflects costs in a General Election year.
39

40

Finance
Budget Summary VARIOUS FUNDS
EXPENDITURE CATEGORIES 2013-14 Actual
2014-15 Actual
2015-16 Revised Budget
2016-17 Adopted Budget
DIVISION
Direct Costs
Administration $ 4,605,471 $ 6,271,598 $ 3,043,044 $ 3,465,435
Budget a 688,488 699,631 808,425 887,924
Financial Operations 2,873,536 2,135,692 2,214,200 2,307,914
Internal Audit 450 - - -
Parking Authority 1,100 - - -
Revenue 2,840,019 2,190,532 6,571,081 6,854,584
Risk Management Administration 4,297,952 4,572,194 4,933,545 5,261,321
Total Department $15,307,016 $15,869,647 $17,570,295 $18,777,178
MAJOR ACCOUNT GROUPS BY FUND
01 General Fund
Salaries and Wages $ 7,210,498 $ 7,198,877 $ 8,218,364 $ 8,561,676
Supplies and Expenses 3,797,345 4,098,576 4,418,386 4,954,181
Subtotal $11,007,843 $11,297,453 $12,636,750 $13,515,857
13 Disaster Relief Fund
Supplies and Expenses $ 121 - - -
Subtotal $ 121 - - -
58 Risk Management-Admin Fund
Salaries and Wages $ 1,420,434 $ 1,542,779 $ 1,693,575 $ 1,742,236
Supplies and Expenses 2,877,518 3,029,415 3,239,970 3,519,085
Subtotal $ 4,297,952 $ 4,572,194 $ 4,933,545 $ 5,261,321
41

Finance
Budget Summary
VARIOUS FUNDS
EXPENDITURE CATEGORIES 2013-14 Actual
2014-15 Actual
2015-16 Revised Budget
2016-17 Adopted Budget
MAJOR ACCOUNT GROUPS BY FUND (continued)
77 Parking Authority Fund
Salaries and Wages $ 1,100 - - -
Subtotal $ 1,100 - - -
Total All Funds
Salaries and Wages $ 8,632,032 $ 8,741,656 $ 9,911,939 $ 10,303,912
Supplies and Expenses 6,674,984 7,127,991 7,658,356 8,473,266
Total Department $15,307,016 $15,869,647 $17,570,295 $18,777,178
PERSONNEL (FULL-TIME EQUIVALENTS) BY FUND
2013-14 Revised Budget
2014-15 Revised Budget
2015-16 Revised Budget
2016-17 Adopted Budget
01 General Fund
Permanent Positions 59.5 61.0 64.3 64.3
Temporary Positions 2.8 1.8 1.0 0.7
Subtotal 62.3 62.8 65.3 65.0
58 Risk Management-Admin Fund
Permanent Positions 12.0 12.0 13.0 13.0
Temporary Positions 0.0 0.0 0.0 0.0
Subtotal 12.0 12.0 13.0 13.0
Total All Funds
Permanent Positions 71.5 73.0 77.3 77.3
Temporary Positions 2.8 1.8 1.0 0.7
Total Department 74.3 74.8 78.3 78.0
Footnotes a. FY 2016-17 increase reflects the addition of 1.0 FTE Senior Budget Analyst offset by the
deletion of 1.0 FTE Administrative Analyst.
42

City Attorney
Budget Summary GENERAL FUND
EXPENDITURE CATEGORIES 2013-14 Actual
2014-15 Actual
2015-16 Revised Budget
2016-17 Adopted Budget
DIVISION
Direct Costs
City Attorney $ 9,273,348 $ 9,988,261 $10,448,009 $10,921,265
Total Department $ 9,273,348 $ 9,988,261 $10,448,009 $10,921,265
MAJOR ACCOUNT GROUPS BY FUND
01 General Fund
Salaries and Wages $ 8,912,718 $ 9,485,403 $10,036,025 $10,488,766
Supplies and Expenses 360,630 502,858 411,984 432,499
Total Department $ 9,273,348 $ 9,988,261 $10,448,009 $10,921,265
PERSONNEL (FULL-TIME EQUIVALENTS) BY FUND
2013-14 Revised Budget
2014-15 Revised Budget
2015-16 Revised Budget
2016-17 Adopted Budget
01 General Fund
Permanent Positions a 41.0 42.0 43.5 45.0
Temporary Positions b 0.1 0.3 0.4 0.7
Total Department 41.1 42.3 43.9 45.7
Footnotes a. FY 2016-17 increase reflects the addition of 1.5 FTE Deputy City Attorney III and 1.0 FTE
Legal Secretary II positions, offset by the deletion of 1.0 FTE Senior Advisor – Municipal Policies, Procedures and Innovation, to support multiple strategic goals.
b. FY 2016-17 increase reflects the addition of 0.3 FTE as-needed Deputy City Attorney III to assist with covering an additional courtroom for the Criminal Division and an anticipated increase in special hearings.
43

44

Human Resources
Budget Summary GENERAL FUND
EXPENDITURE CATEGORIES 2013-14 Actual
2014-15 Actual
2015-16 Revised Budget
2016-17 Adopted Budget
DIVISION
Direct Costs
Administrative Services $ 715,091 $ 776,629 $ 718,927 $ 736,898
Employee Relations and Benefits 1,541,504 1,568,684 1,838,338 1,893,151
Employment and Organizational Development 1,495,912 1,596,936 2,003,797 1,873,955
Total Department $ 3,752,507 $ 3,942,249 $ 4,561,062 $ 4,504,004
MAJOR ACCOUNT GROUPS BY FUND
01 General Fund
Salaries and Wages $ 3,190,953 $ 3,281,836 $ 3,557,913 $ 3,787,738
Supplies and Expenses 561,554 660,413 1,003,149 716,266
Total Department $ 3,752,507 $ 3,942,249 $ 4,561,062 $ 4,504,004
PERSONNEL (FULL-TIME EQUIVALENTS) BY FUND
2013-14 Revised Budget
2014-15 Revised Budget
2015-16 Revised Budget
2016-17 Adopted Budget
01 General Fund
Permanent Positions a 23.0 24.0 25.0 26.0
Temporary Positions 0.2 0.4 0.2 0.2
Total Department 23.2 24.4 25.2 26.2
Footnotes a. FY 2016-17 increase reflects the addition of 1.0 FTE Organizational Development and
Training Coordinator to expand and enhance staff training at the Santa Monica Institute.
45

46

Information Systems
Budget Summary VARIOUS FUNDS
EXPENDITURE CATEGORIES 2013-14 Actual
2014-15 Actual
2015-16 Revised Budget
2016-17 Adopted Budget
DIVISION
Direct Costs
Administration a $ 1,040,885 $ 1,220,169 $ 1,560,332 $ 1,401,189
Community Broadband b 1,136,977 1,252,792 1,534,484 1,634,640
Software Systems 1,735,368 1,601,537 1,563,715 1,597,332
Support Services 731,896 1,072,234 1,126,378 1,181,306
Systems and Networks 1,791,978 1,609,755 1,863,985 1,905,138
Web Development c 1,149,825 1,238,175 1,399,243 1,460,257
Total Department $ 7,586,929 $ 7,994,662 $ 9,048,137 $ 9,179,862
MAJOR ACCOUNT GROUPS BY FUND
01 General Fund b
Salaries and Wages $ 6,343,446 $ 6,675,732 $ 7,328,033 $ 6,748,040
Supplies and Expenses 1,243,483 1,318,930 1,720,104 797,182
Subtotal $ 7,586,929 $ 7,994,662 $ 9,048,137 $ 7,545,222
28 Community Broadband Fund b
Salaries and Wages - - - $ 640,137
Supplies and Expenses - - - 994,503
Subtotal - - - $ 1,634,640
Total All Funds
Salaries and Wages $ 6,343,446 $ 6,675,732 $ 7,328,033 $ 7,388,177
Supplies and Expenses 1,243,483 1,318,930 1,720,104 1,791,685
Total Department $ 7,586,929 $ 7,994,662 $ 9,048,137 $ 9,179,862
47

Information Systems
Budget Summary VARIOUS FUNDS
PERSONNEL (FULL-TIME EQUIVALENTS) BY FUND
2013-14 Revised Budget
2014-15 Revised Budget
2015-16 Revised Budget
2016-17 Adopted Budget
01 General Fund
Permanent Positions a, b 44.0 46.0 50.0 45.0
Temporary Positions 0.0 0.0 0.0 0.0
Subtotal 44.0 46.0 50.0 45.0
28 Community Broadband Fund
Permanent Positions b 0.0 0.0 0.0 4.0
Temporary Positions 0.0 0.0 0.0 0.0
Subtotal 0.0 0.0 0.0 4.0
Total All Funds
Permanent Positions 44.0 46.0 50.0 49.0
Temporary Positions 0.0 0.0 0.0 0.0
Total Department 44.0 46.0 50.0 49.0
Footnotes a. FY 2016-17 reflects the deletion of 1.0 FTE Director of Special Projects for Information
Services and suspension of funding for the 1.0 FTE Assistant Chief Information Officer. b. FY 2016-17 reflects the transfer of the Community Broadband division, including 4.0 FTE
positions and budget, from the General Fund to a new Community Broadband Fund (28) and the addition of rent for leased office space for Community Broadband at 429 Santa Monica Blvd.
c. FY 2016-17 reflects the addition of 1.0 FTE Web Developer to support the Office of Communications.
48

Planning and Community Development
Budget Summary VARIOUS FUNDS
EXPENDITURE CATEGORIES 2013-14 Actual
2014-15 Actual
2015-16 Revised Budget
2016-17 Adopted Budget
DIVISION
Direct Costs
Administration a $ 1,238,519 $ 1,273,845 $ 1,521,834 $ 1,501,607
Building and Safety 5,013,094 5,335,359 5,281,646 5,482,051
City Planning / Development Review b 3,468,526 3,387,768 3,860,837 4,690,049
Code Enforcement 1,811,456 2,075,309 2,595,555 2,676,788
Mobility c 2,733,105 2,866,223 5,896,818 5,384,164
Parking Authority - 770 900 900
Parking Operations d 13,046,661 12,718,408 13,628,214 14,803,547
Traffic Management 2,211,278 2,118,891 2,148,428 2,148,193
Total Department $29,522,639 $29,776,573 $34,934,232 $36,687,299
MAJOR ACCOUNT GROUPS BY FUND
01 General Fund
Salaries and Wages $15,893,278 $ 16,665,786 $ 18,005,351 $ 18,840,763
Supplies and Expenses 13,349,578 13,105,638 15,743,549 17,570,715
Subtotal $29,242,856 $29,771,424 $33,748,900 $36,411,478
04 Special Revenue Source Fund
Supplies and Expenses $ 231,855 $ 4,693 $ 309,432 $ 274,921
Subtotal $ 231,855 $ 4,693 $309,432 $ 274,921
20 Miscellaneous Grants Fund
Supplies and Expenses e $ 47,928 $ (314) $ 875,000 -
Subtotal $ 47,928 $ (314) $ 875,000 -
49

Planning and Community Development
Budget Summary VARIOUS FUNDS
EXPENDITURE CATEGORIES 2013-14 Actual
2014-15 Actual
2015-16 Revised Budget
2016-17 Adopted Budget
MAJOR ACCOUNT GROUPS BY FUND (continued)
77 Parking Authority Fund
Salaries and Wages - $ 770 $ 900 $ 900
Subtotal - $ 770 $ 900 $ 900
Total All Funds
Salaries and Wages $15,893,278 $16,666,556 $18,006,251 $18,841,663
Supplies and Expenses 13,629,361 13,110,017 16,927,981 17,845,636
Total Department $29,522,639 $29,776,573 $34,934,232 $36,687,299
PERSONNEL (FULL-TIME EQUIVALENTS) BY FUND
2013-14 Revised Budget
2014-15 Revised Budget
2015-16 Revised Budget
2016-17 Adopted Budget
01 General Fund
Permanent Positions 114.0 116.0 123.1 124.1
Temporary Positions 0.0 0.0 0.0 0.0
Total Department 114.0 116.0 123.1 124.1
Footnotes a. FY 2016-17 amount includes the addition of 1.0 FTE Neighborhood Preservation
Coordinator to serve as a central contact and facilitator for displaced tenants. b. FY 2016-17 amount includes one-time funds for the Pico Neighborhood Plan. c. FY 2016-17 amount includes the one-time funding to support the Gateway Access Master
Plan and implement the State of California Environmental Quality Act (CEQA) changes that alter the way circulation impacts are measured.
d. FY 2016-17 amount reflects increased parking operator costs for parking structures 7 and 8 due to increased revenue.
e. FY 2015-16 increase reflects the receipt of the Local Coastal Program grant, Active Transportation Program Safe Routes to School grant, and the Expo Open Streets Project grant.
50

Police
Budget Summary VARIOUS FUNDS
EXPENDITURE CATEGORIES 2013-14 Actual
2014-15 Actual
2015-16 Revised Budget
2016-17 Adopted Budget
DIVISION
Direct Costs
Administrative Services $ 17,011,861 $ 14,836,896 $ 15,082,155 $ 15,447,917
Animal Control Unit 1,310,609 - - -
Criminal Investigations 8,808,370 14,013,293 15,307,787 15,847,570
Harbor Unit 1,313,156 1,398,607 1,330,798 1,356,913
Operations 34,175,421 31,044,246 30,905,646 32,483,042
Strategic Services 13,485,617 17,820,993 21,310,363 21,528,705
Total Department $76,105,034 $79,114,035 $83,936,749 $86,664,147
MAJOR ACCOUNT GROUPS BY FUND
01 General Fund
Salaries and Wages $69,288,555 $71,649,300 $75,776,913 $78,624,735
Supplies and Expenses 4,859,247 5,259,294 5,991,011 6,582,499
Subtotal $74,147,802 $76,908,584 $81,767,924 $85,207,234
04 Special Revenue Source Fund
Supplies and Expenses - $ 8,455 $ 13,001 -
Subtotal - $ 8,455 $ 13,001 -
20 Miscellaneous Grants Fund
Salaries and Wages $ 228,320 $ 263,554 $ 396,935 -
Supplies and Expenses 179,131 227,172 328,091 -
Subtotal $ 407,451 $ 490,726 $ 725,026 -
51

Police
Budget Summary VARIOUS FUNDS
EXPENDITURE CATEGORIES 2013-14 Actual
2014-15 Actual
2015-16 Revised Budget
2016-17 Adopted Budget
MAJOR ACCOUNT GROUPS BY FUND (continued)
21 Asset Seizure Fund
Salaries and Wages $ 46,214 - - -
Supplies and Expenses 26,762 264,684 - -
Subtotal $ 72,976 $ 264,684 - -
22 COPS Fund
Supplies and Expenses $ 163,649 $ 73,371 $ 100,000 $ 100,000
Subtotal $ 163,649 $ 73,371 $ 100,000 $ 100,000
30 Pier Fund
Salaries and Wages $ 1,174,908 $ 1,220,424 $ 1,157,329 $ 1,186,233
Supplies and Expenses 138,248 147,781 173,469 170,680
Subtotal $ 1,313,156 $ 1,368,205 $ 1,330,798 $ 1,356,913
Total All Funds
Salaries and Wages $70,737,997 $73,133,278 $77,331,177 $79,810,968
Supplies and Expenses 5,367,037 5,980,757 6,605,572 6,853,179
Total Department $76,105,034 $79,114,035 $83,936,749 $86,664,147
52

Police
Budget Summary VARIOUS FUNDS
PERSONNEL (FULL-TIME EQUIVALENTS) BY FUND
2013-14 Revised Budget
2014-15 Revised Budget
2015-16 Revised Budget
2016-17 Adopted Budget
01 General Fund
Permanent Positions 402.0 387.0 392.0 395.0
Temporary Positions 31.4 31.4 31.4 31.4
Subtotal 433.4 418.4 423.4 426.4
30 Pier Fund
Permanent Positions 7.0 7.0 7.0 7.0
Temporary Positions 2.3 2.3 2.3 2.3
Subtotal 9.3 9.3 9.3 9.3
Total All Funds
Permanent Positions 409.0 394.0 399.0 402.0
Temporary Positions 33.7 33.7 33.7 33.7
Total Department 442.7 427.7 432.7 435.7
53

54

Fire
Budget Summary VARIOUS FUNDS
EXPENDITURE CATEGORIES 2013-14 Actual
2014-15 Actual
2015-16 Revised Budget
2016-17 Adopted Budget
DIVISION
Direct Costs
Administration $ 6,707,467 $ 6,399,128 $ 6,233,955 $ 5,682,883
Fire Prevention 2,344,808 2,666,664 3,190,092 3,314,174
Fire Suppression and Rescue a 23,947,124 24,947,970 26,871,407 29,606,958
Support Services 34,288 - - -
Training 835,275 1,041,702 911,565 1,065,165
Total Department $33,868,962 $35,055,464 $37,207,019 $39,669,180
MAJOR ACCOUNT GROUPS BY FUND
01 General Fund
Salaries and Wages $31,476,692 $32,274,927 $34,230,506 $37,224,481
Supplies and Expenses 1,868,397 2,196,583 2,161,745 2,444,699
Subtotal $33,345,089 $34,471,510 $36,392,251 $39,669,180
04 Special Revenue Source Fund
Supplies and Expenses $ 349 - - -
Subtotal $ 349 - - -
20 Miscellaneous Grants
Supplies and Expenses $ 523,524 $ 583,954 $ 814,768 -
Subtotal $ 523,524 $ 583,954 $ 814,768 -
Total All Funds
Salaries and Wages $31,476,692 $32,274,927 $34,230,506 $37,224,481
Supplies and Expenses 2,392,270 2,780,537 2,976,513 2,444,699
Total Department $33,868,962 $35,055,464 $37,207,019 $39,669,180
55

Fire
PERSONNEL (FULL-TIME EQUIVALENTS) BY FUND
2013-14 Revised Budget
2014-15 Revised Budget
2015-16 Revised Budget
2016-17 Adopted Budget
01 General Fund
Permanent Positions 129.0 129.8 129.8 135.8
Temporary Positions 0.0 0.0 0.0 0.0
Total Department 129.0 129.8 129.8 135.8
Footnotes a. FY 2015-16 increase reflects a reappropriation of unspent one-time funds related to the fire
training academy and paramedic school for the new deployment model.
56

Community and Cultural Services
Budget Summary VARIOUS FUNDS
EXPENDITURE CATEGORIES 2013-14 Actual
2014-15 Actual
2015-16 Revised Budget
2016-17 Adopted Budget
DIVISION
Direct Costs Administration and Planning
Services a $ 1,650,378 $ 2,284,213 $ 2,177,035 $ 2,186,290
Beach Administration 5,258,483 5,315,330 5,873,635 6,046,894
Beach House Operations b 2,349,219 2,222,339 2,873,690 2,819,087
Community Recreation c 6,270,383 6,106,595 6,649,931 6,953,086
Cultural Affairs 2,264,372 2,592,448 2,823,630 2,802,592
Human Services 14,975,368 15,107,647 16,556,637 16,503,512
Total Department $32,768,203 $33,628,572 $36,954,558 $37,311,461
MAJOR ACCOUNT GROUPS BY FUND
01 General Fund
Salaries and Wages $ 14,038,472 $14,099,772 $14,861,484 $15,553,043
Supplies and Expenses 10,295,196 10,839,154 12,090,489 12,438,291
Subtotal $ 24,333,668 $24,938,926 $26,951,973 $27,991,334
04 Special Revenue Source Fund
Supplies and Expenses $ 18,677 $ 5,124 $ 97,796 $ 97,796
Subtotal $ 18,677 $ 5,124 $ 97,796 $ 97,796
11 Beach Fund
Salaries and Wages b $ 1,261,169 $ 1,235,503 $ 1,404,081 $ 1,400,968
Supplies and Expenses 6,223,106 6,298,668 7,246,329 7,465,013
Subtotal $ 7,484,275 $ 7,534,171 $ 8,650,410 $ 8,865,981
57
Community and Cultural Services
Budget Summary VARIOUS FUNDS
EXPENDITURE CATEGORIES 2013-14 Actual
2014-15 Actual
2015-16 Revised Budget
2016-17 Adopted Budget
MAJOR ACCOUNT GROUPS BY FUND (continued)
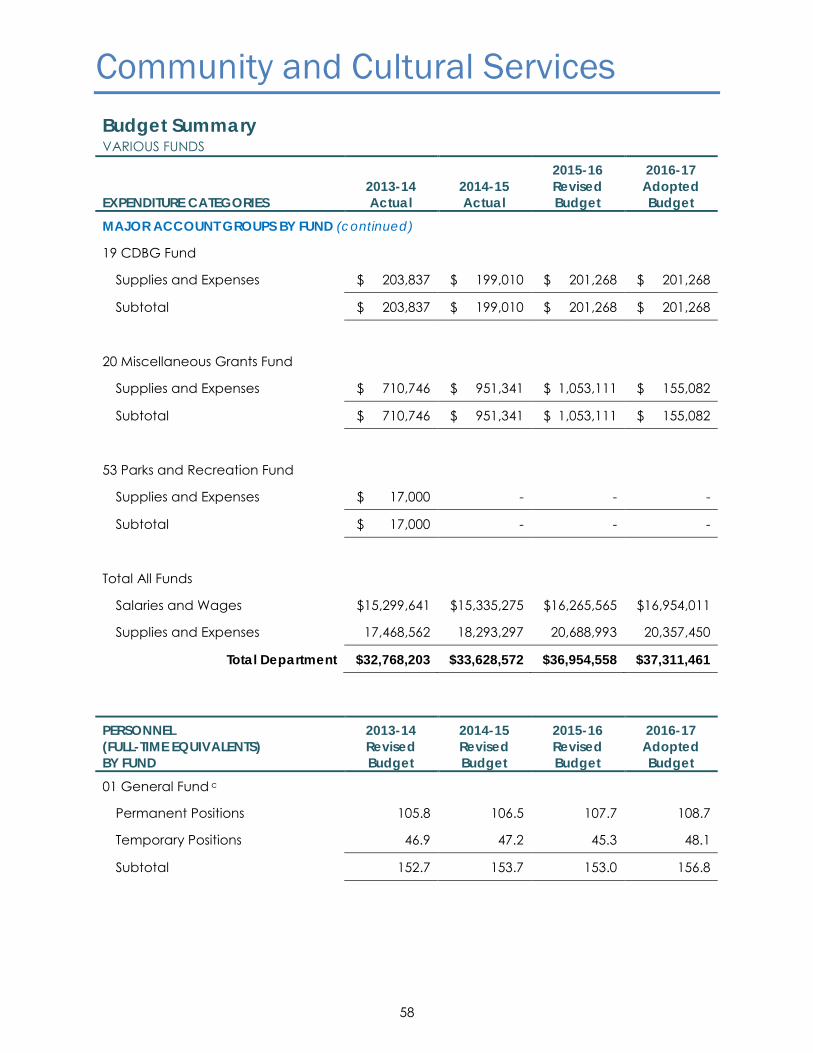
19 CDBG Fund
Supplies and Expenses $ 203,837 $ 199,010 $ 201,268 $ 201,268
Subtotal $ 203,837 $ 199,010 $ 201,268 $ 201,268
20 Miscellaneous Grants Fund
Supplies and Expenses $ 710,746 $ 951,341 $ 1,053,111 $ 155,082
Subtotal $ 710,746 $ 951,341 $ 1,053,111 $ 155,082
53 Parks and Recreation Fund
Supplies and Expenses $ 17,000 - - -
Subtotal $ 17,000 - - -
Total All Funds
Salaries and Wages $15,299,641 $15,335,275 $16,265,565 $16,954,011
Supplies and Expenses 17,468,562 18,293,297 20,688,993 20,357,450
Total Department $32,768,203 $33,628,572 $36,954,558 $37,311,461
PERSONNEL (FULL-TIME EQUIVALENTS) BY FUND
2013-14 Revised Budget
2014-15 Revised Budget
2015-16 Revised Budget
2016-17 Adopted Budget
01 General Fund c
Permanent Positions 105.8 106.5 107.7 108.7
Temporary Positions 46.9 47.2 45.3 48.1
Subtotal 152.7 153.7 153.0 156.8
58

Community and Cultural Services
Budget Summary VARIOUS FUNDS
PERSONNEL (FULL-TIME EQUIVALENTS) BY FUND
2013-14 Revised Budget
2014-15 Revised Budget
2015-16 Revised Budget
2016-17 Adopted Budget
11 Beach Fund
Permanent Positions b 6.0 8.5 9.3 9.5
Temporary Positions 8.9 5.9 5.5 5.5
Subtotal 14.9 14.4 14.8 15.0
Total All Funds
Permanent Positions 111.8 115.0 117.0 118.2
Temporary Positions 55.7 53.1 50.8 53.6
Total Department 167.5 168.1 167.8 171.8
Footnotes a. FY 2016-17 budget reflects funds for the Wellbeing Project, Airport Park rent, and the
addition of 0.5 FTE Volunteer Program Coordinator and 1.0 FTE as-needed Administrative Intern positions, offset by the termination of a one-time grant.
b. FY 2016-17 reflects the conversion of 0.5 FTE Event Coordinator from limited-term to permanent.
c. FY 2016-17 reflects the addition of 1.0 FTE Community Recreation Administrator and 0.5 FTE Community Garden Program Specialist, offset by the deletion of 1.0 FTE Community Services Program Supervisor and 1.0 FTE Community Services Program Coordinator.
59

60

Library
Budget Summary VARIOUS FUNDS
EXPENDITURE CATEGORIES 2013-14 Actual
2014-15 Actual
2015-16 Revised Budget
2016-17 Adopted Budget
DIVISION
Direct Costs
Administration and Facilities a $ 2,502,169 $ 2,627,103 $ 3,006,997 $ 3,119,341
Information Management b 2,270,854 2,341,870 2,678,929 2,820,454
Public and Branch Services c 3,265,372 3,625,592 3,667,533 3,949,756
Reference Services d 2,922,911 2,969,769 3,103,559 2,962,988
Total Department $10,961,306 $11,564,334 $12,457,018 $12,852,539
MAJOR ACCOUNT GROUPS BY FUND
01 General Fund
Salaries and Wages $ 8,972,141 $ 9,474,721 $ 9,857,859 $ 10,226,608
Supplies and Expenses 1,972,942 2,089,613 2,569,159 2,625,931
Subtotal $10,945,083 $11,564,334 $12,427,018 $12,852,539
20 Miscellaneous Grants Fund
Supplies and Expenses $ 16,223 - $ 30,000 -
Subtotal $ 16,223 - $ 30,000 -
Total All Funds
Salaries and Wages $ 8,972,141 $ 9,474,721 $ 9,857,859 $ 10,226,608
Supplies and Expenses 1,989,165 2,089,613 2,599,159 2,625,931
Total Department $10,961,306 $11,564,334 $12,457,018 $12,852,539
61

Library
Budget Summary VARIOUS FUNDS
PERSONNEL (FULL-TIME EQUIVALENTS) BY FUND
2013-14 Revised Budget
2014-15 Revised Budget
2015-16 Revised Budget
2016-17 Adopted Budget
01 General Fund
Permanent Positions 70.5 70.5 70.5 71.5
Temporary Positions 41.8 40.5 40.5 40.5
Total Department 112.3 111.0 111.0 112.0
Footnotes a. FY 2016-17 increase reflects the addition of 1.0 FTE Executive Administrative Assistant and
1.0 FTE Senior Administrative Analyst, offset by the deletion of 0.5 FTE Library Assistant II and 1.0 FTE Administrative Analyst, to implement the Library Strategic Plan.
b. FY 2016-17 increase reflects the transfer of 1.0 FTE Library Assistant II from Reference Services (615) Division.
c. FY 2016-17 increase reflects the transfer of 1.0 FTE Librarian I from Reference Services Division and the conversion of 0.5 FTE Librarian I to 1.0 FTE Librarian I to accommodate increased library programming.
d. FY 2016-17 decrease reflects the transfer of 1.0 FTE Librarian I to Public and Branch Services Division, and transfer of 1.0 FTE Library Assistant II to Information Management Division.
62

Public Works
Budget Summary
VARIOUS FUNDS
EXPENDITURE CATEGORIES
2013-14
Actual
2014-15
Actual
2015-16
Revised
Budget
2016-17
Adopted
Budget
DIVISION
Direct Costs
Administrative Services $ 1,742,398 $ 1,469,645 $ 1,317,599 $ 1,346,565
Airport 3,059,825 3,337,987 5,330,006 4,477,956
Airport Maintenance 834,053 821,429 978,158 1,468,654
Arcadia Treatment Plant 1,310,684 1,019,348 1,916,612 1,972,604
Architecture Services a 2,063,715 2,211,848 2,418,267 2,831,587
Beach House Maintenance 1,449,225 1,598,390 1,991,516 2,060,829
Beach Maintenance 2,390,840 2,805,933 3,347,656 3,510,261
Cemetery b 1,842,648 2,002,412 1,941,527 2,132,759
Charnock Treatment Plant 2,138,371 1,767,149 2,696,014 2,517,018
Civil Engineering 4,401,237 4,388,330 5,373,906 5,636,496
Facilities Maintenance c 13,143,094 14,227,133 15,478,538 14,371,260
Fleet Management d 6,292,226 6,387,210 6,361,354 6,886,852
Office of Pier Management e - - - 2,751,848
Pier Maintenance 1,749,533 1,931,623 2,323,556 2,151,001
Public Landscape f 11,209,486 12,157,172 13,095,342 13,754,969
Resource Recovery and
Recycling 20,209,510 21,986,912 24,116,760 24,289,019
Street and Fleet Services c 4,927,470 5,391,119 5,448,423 7,257,655
Wastewater 11,187,972 11,270,261 11,585,855 12,955,026
Water 18,677,527 17,217,035 21,625,227 18,271,329
Total Department $108,629,814 $111,990,936 $127,346,316 $130,643,688
63

Public Works
Budget Summary VARIOUS FUNDS
EXPENDITURE CATEGORIES 2013-14 Actual
2014-15 Actual
2015-16 Revised Budget
2016-17 Adopted Budget
MAJOR ACCOUNT GROUPS BY FUND
01 General Fund
Salaries and Wages $ 25,297,663 $ 27,035,735 $ 29,054,870 $ 30,972,140
Supplies and Expenses 11,833,816 12,478,453 13,232,399 13,392,885
Subtotal $ 37,131,479 $ 39,514,188 $ 42,287,269 $ 44,365,025
06 Clean Beaches and Ocean Parcel Tax Fund
Salaries and Wages - - $ 20,913 $ 21,227
Supplies and Expenses 280,021 330,919 823,893 812,280
Subtotal $ 280,021 $ 330,919 $ 844,806 $ 833,507
11 Beach Fund
Salaries and Wages $ 2,321,118 $ 2,567,797 $ 3,362,877 $ 3,494,550
Supplies and Expenses 1,518,947 1,790,237 1,936,295 2,036,540
Subtotal $ 3,840,065 $ 4,358,034 $ 5,299,172 $ 5,531,090
20 Miscellaneous Grants Fund
Supplies and Expenses $ 117,924 $ 200,158 $ 411,171 $ 65,727
Subtotal $ 117,924 $ 200,158 $ 411,171 $ 65,727
25 Water Fund
Salaries and Wages $ 5,214,865 $ 5,415,955 $ 5,974,470 $ 6,345,679
Supplies and Expenses 16,911,717 14,587,577 20,263,383 16,415,272
Subtotal $ 22,126,582 $ 20,003,532 $ 26,237,853 $ 22,760,951
64

Public Works
Budget Summary VARIOUS FUNDS
EXPENDITURE CATEGORIES 2013-14 Actual
2014-15 Actual
2015-16 Revised Budget
2016-17 Adopted Budget
MAJOR ACCOUNT GROUPS BY FUND (continued)
27 Resource Recovery and Recycling Fund
Salaries and Wages $ 9,431,121 $10,359,483 $ 10,149,502 $ 10,722,544
Supplies and Expenses 10,736,365 11,473,700 13,651,087 13,540,748
Subtotal $ 20,167,486 $ 21,833,183 $ 23,800,589 $ 24,263,292
30 Pier Fund
Salaries and Wages $ 510,215 $ 575,494 $ 738,866 $ 1,083,095
Supplies and Expenses 1,239,318 1,356,129 1,584,690 3,819,754
Subtotal $ 1,749,533 $ 1,931,623 $ 2,323,556 $ 4,902,849
31 Wastewater Fund
Salaries and Wages $ 2,024,818 $ 2,081,991 $ 2,472,251 $ 2,574,519
Supplies and Expenses 9,163,154 9,188,270 9,113,604 10,380,507
Subtotal $ 11,187,972 $ 11,270,261 $ 11,585,855 $ 12,955,026
33 Airport Fund
Salaries and Wages $ 1,113,551 $ 1,226,253 $ 1,394,986 $ 1,505,041
Supplies and Expenses 2,780,327 2,933,163 4,913,178 4,441,569
Subtotal $ 3,893,878 $ 4,159,416 $ 6,308,164 $ 5,946,610
37 Cemetery Fund
Salaries and Wages $ 643,930 $ 741,500 $ 765,643 $ 902,536
Supplies and Expenses 1,198,718 1,260,912 1,175,884 1,230,223
Subtotal $ 1,842,648 $ 2,002,412 $ 1,941,527 $ 2,132,759
65

Public Works
Budget Summary VARIOUS FUNDS
EXPENDITURE CATEGORIES 2013-14 Actual
2014-15 Actual
2015-16 Revised Budget
2016-17 Adopted Budget
MAJOR ACCOUNT GROUPS BY FUND (continued)
54 Vehicle Management Fund
Salaries and Wages $ 3,130,883 $ 3,153,758 $ 3,515,112 $ 3,675,539
Supplies and Expenses 3,161,343 3,233,452 2,791,242 3,211,313
Subtotal $ 6,292,226 $ 6,387,210 $ 6,306,354 $ 6,886,852
Total All Funds
Salaries and Wages $ 49,688,164 $ 53,157,966 $ 57,449,490 $ 61,296,870
Supplies and Expenses 58,941,650 58,832,970 69,896,826 69,346,818
Total Department $108,629,814 $111,990,936 $127,346,316 $130,643,688
PERSONNEL (FULL-TIME EQUIVALENTS) BY FUND
2013-14 Revised Budget
2014-15 Revised Budget
2015-16 Revised Budget
2016-17 Adopted Budget
01 General Fund
Permanent Positions 245.5 251.0 251.0 254.0
Temporary Positions 12.6 6.3 6.3 6.3
Subtotal 258.1 257.3 257.3 260.3
11 Beach Fund
Permanent Positions 18.5 34.5 35.5 35.5
Temporary Positions 16.5 0.0 0.0 0.0
Subtotal 35.0 34.5 35.5 35.5
66

Public Works
Budget Summary VARIOUS FUNDS
PERSONNEL (FULL-TIME EQUIVALENTS) BY FUND
2013-14 Revised Budget
2014-15 Revised Budget
2015-16 Revised Budget
2016-17 Adopted Budget
25 Water Fund
Permanent Positions 46.0 46.0 46.0 47.0
Temporary Positions 0.0 0.0 0.0 0.0
Subtotal 46.0 46.0 46.0 47.0
27 Resource Recovery and Recycling Fund
Permanent Positions 80.0 82.4 84.4 85.4
Temporary Positions 7.7 5.3 5.3 5.3
Subtotal 87.7 87.7 89.7 90.7
30 Pier Fund
Permanent Positions 6.0 6.0 8.0 10.0
Temporary Positions 0.5 0.5 0.0 0.0
Subtotal 6.5 6.5 8.0 10.0
31 Wastewater Fund
Permanent Positions 22.0 22.0 22.0 22.0
Temporary Positions 0.2 0.2 0.2 0.2
Subtotal 22.2 22.2 22.2 22.2
33 Airport Fund
Permanent Positions 12.0 11.0 12.0 12.0
Temporary Positions 0.5 1.4 0.9 0.9
Subtotal 12.5 12.4 12.9 12.9
67

Public Works
Budget Summary VARIOUS FUNDS
PERSONNEL (FULL-TIME EQUIVALENTS) BY FUND
2013-14 Revised Budget
2014-15 Revised Budget
2015-16 Revised Budget
2016-17 Adopted Budget
37 Cemetery Fund
Permanent Positions 6.0 7.0 7.0 8.0
Temporary Positions 1.1 0.1 0.1 0.1
Subtotal 7.1 7.1 7.1 8.1
54 Vehicle Management Fund
Permanent Positions 28.0 28.0 29.0 29.0
Temporary Positions 0.0 0.0 0.0 0.0
Subtotal 28.0 28.0 29.0 29.0
Total All Funds
Permanent Positions 464.0 487.9 494.9 502.9
Temporary Positions 39.1 13.8 12.8 12.8
Total Department 503.1 501.7 507.7 515.7
Footnotes a. FY 2016-17 increase reflects the addition of 1.0 FTE limited-term Public Works Construction
Specialist dedicated to Airport Capital Improvement Projects (to be reimbursed by the Airport Fund) and a reorganization of the Architecture Services to increase the capacity of staff to manage the City’s infrastructure maintenance projects.
b. FY 2016-17 increase reflects the addition of 1.0 FTE limited-term Maintenance Worker and expenses related to implementation of a new Green Burial program.
c. FY 2016-17 changes reflect a reorganization to consolidate maintenance functions in the right-of-way into a single maintenance group.
d. FY 2016-17 increase reflects an increase in commercial vehicle repairs and parts to reflect current operations.
e. FY 2016-17 increase reflects the transfer of the Office of Pier Management from the City Manager’s Office to Public Works.
f. FY 2016-17 increase reflects operating expenses related to the Expo Transit Oriented Development site and the addition of 1.0 FTE Equipment Operator I and 1.0 FTE Maintenance Worker to maintain hardscape at the Colorado Esplanade, Tongva Park, and Ken Genser Square.
68

Big Blue Bus
Budget Summary VARIOUS FUNDS
EXPENDITURE CATEGORIES 2013-14 Actual
2014-15 Actual
2015-16 Revised Budget
2016-17 Adopted Budget
DIVISION
Direct Costs
Planning and Community Engagement a $ 1,838,326 $ 2,084,342 $ 3,043,118 $ 3,478,012
Special Services 517,555 472,372 600,000 600,000
Transit Executive 8,564,146 9,922,712 11,406,924 11,405,842
Transit Finance and Grants b 1,476,345 2,197,475 1,535,709 1,620,550
Transit Maintenance c 10,726,842 11,086,931 11,853,038 12,569,330
Transit Operations d 37,028,148 38,587,532 41,369,432 43,645,547
Transit Safety and Training 1,247,157 1,347,557 1,572,921 1,574,595
Total Department $61,398,519 $65,698,921 $71,381,142 $74,893,876
MAJOR ACCOUNT GROUPS BY FUND
20 Miscellaneous Grants Fund
Supplies and Expenses $ 422,783 $ 433,601 $ 483,538 $ 483,538
Subtotal $ 422,783 $ 433,601 $ 483,538 $ 483,538
41 Big Blue Bus Fund
Salaries and Wages $44,501,162 $47,997,931 $49,004,829 $52,551,877
Supplies and Expenses 16,474,574 17,267,389 21,892,775 21,858,461
Subtotal $60,975,736 $65,265,320 $ 70,897,604 $74,410,338
Total All Funds
Salaries and Wages $44,501,162 $47,997,931 $49,004,829 $52,551,877
Supplies and Expenses 16,897,357 17,700,990 22,376,313 22,341,999
Total Department $61,398,519 $65,698,921 $71,381,142 $74,893,876
69

Big Blue Bus
Budget Summary BIG BLUE BUS FUND
PERSONNEL (FULL-TIME EQUIVALENTS) BY FUND
2013-14 Revised Budget
2014-15 Revised Budget
2015-16 Revised Budget
2016-17 Adopted Budget
41 Big Blue Bus Fund
Permanent Positions 420.7 420.7 449.2 456.2
Temporary Positions 14.8 15.3 15.3 6.7
Total Department 435.5 436.0 464.5 462.9
Footnotes a. FY 2016-17 increase reflects full-year funding of the 1.5 FTE service integration positions, the
addition of 1.4 FTE as-needed positions for administrative support, as well as funds for ongoing training opportunities.
b. FY 2016-17 increase reflects the addition of 1.0 FTE as-needed position for administrative support.
c. FY 2016-17 increase reflects the full-year funding of the 5.0 FTE service integration positions as well as the addition of 1.0 FTE position for oversight of the maintenance and repairs of the LCNG system.
d. FY 2016-17 increase reflects the full-year funding of the 19.0 FTE service integration positions, conversion of 11.0 FTE as-needed positions to 5.0 FTE permanent positions, and the addition of 1.0 FTE position dedicated to the service integration plan.
70

Housing and Economic Development
Budget Summary VARIOUS FUNDS
EXPENDITURE CATEGORIES 2013-14 Actual
2014-15 Actual
2015-16 Revised Budget
2016-17 Adopted Budget
DIVISION
Direct Costs
Administration $ 683,730 $ 648,061 $ 846,039 $ 809,547
Economic Development 1,869,880 1,934,572 2,115,552 2,184,411
Housing a 19,593,268 19,024,208 22,213,733 22,084,399
Total Department $22,146,878 $21,606,841 $25,175,324 $25,078,357
MAJOR ACCOUNT GROUPS BY FUND
01 General Fund
Salaries and Wages $ 2,960,913 $ 3,110,482 $ 3,336,830 3,463,979
Supplies and Expenses 1,744,529 1,673,553 2,459,049 2,433,576
Subtotal $ 4,705,442 $ 4,784,035 $ 5,795,879 $ 5,897,555
04 Special Revenue Source Fund
Supplies and Expenses - - - $ 300,000
Subtotal - - - $ 300,000
12 Housing Fund
Salaries and Wages $ 1,535,405 $ 1,570,894 $ 1,638,552 $ 1,690,185
Supplies and Expenses 15,615,291 14,993,693 16,969,101 16,708,825
Subtotal $17,150,696 $16,564,587 $18,607,653 $18,399,010
19 CDBG Fund
Supplies and Expenses - - $ 300,000 -
Subtotal - - $ 300,000 -
71
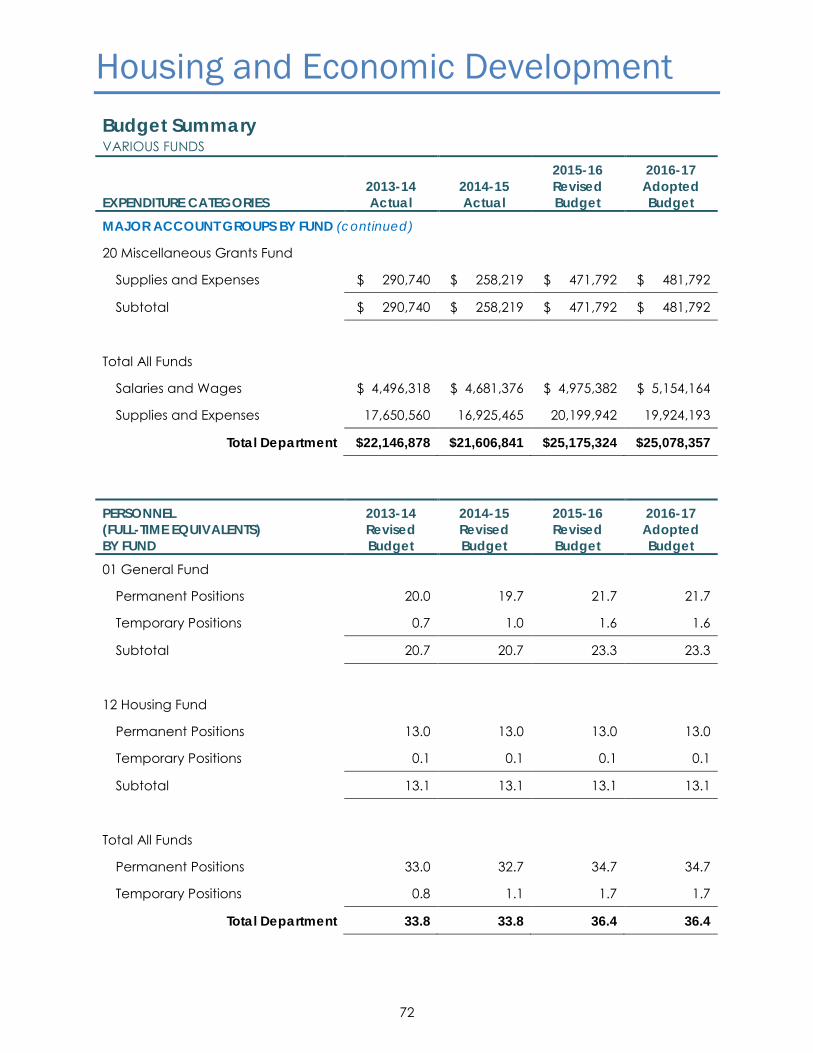
Housing and Economic Development
Budget Summary VARIOUS FUNDS
EXPENDITURE CATEGORIES 2013-14 Actual
2014-15 Actual
2015-16 Revised Budget
2016-17 Adopted Budget
MAJOR ACCOUNT GROUPS BY FUND (continued)
20 Miscellaneous Grants Fund
Supplies and Expenses $ 290,740 $ 258,219 $ 471,792 $ 481,792
Subtotal $ 290,740 $ 258,219 $ 471,792 $ 481,792
Total All Funds
Salaries and Wages $ 4,496,318 $ 4,681,376 $ 4,975,382 $ 5,154,164
Supplies and Expenses 17,650,560 16,925,465 20,199,942 19,924,193
Total Department $22,146,878 $21,606,841 $25,175,324 $25,078,357
PERSONNEL (FULL-TIME EQUIVALENTS) BY FUND
2013-14 Revised Budget
2014-15 Revised Budget
2015-16 Revised Budget
2016-17 Adopted Budget
01 General Fund
Permanent Positions 20.0 19.7 21.7 21.7
Temporary Positions 0.7 1.0 1.6 1.6
Subtotal 20.7 20.7 23.3 23.3
12 Housing Fund
Permanent Positions 13.0 13.0 13.0 13.0
Temporary Positions 0.1 0.1 0.1 0.1
Subtotal 13.1 13.1 13.1 13.1
Total All Funds
Permanent Positions 33.0 32.7 34.7 34.7
Temporary Positions 0.8 1.1 1.7 1.7
Total Department 33.8 33.8 36.4 36.4
72

Housing and Economic Development
Footnotes a. FY 2016-17 reflects the addition of 1.0 FTE Housing Program Manager, offset by the deletion
of 1.0 FTE Housing Administrator – Production and Preservation. FY 2016-17 also reflects a pilot program providing rental assistance to rent-burdened households living in rent-controlled apartments and a decrease to the City's Section 8 Housing Assistance Program (HAP) Voucher Program to reflect FY 2015-16 voucher utilization rates.
73

74

GOALS, OBJECTIVES & BENCHMARKS
FY 2016-17 Adopted Budget
75

76

Goals, Objectives, & Benchmarks
The FY 2015-17 Biennial Budget includes goals, objectives and service benchmarks for each department. This section provides updates made during the FY 2016-17 exception-based budget process.
City Manager Goal: Advance cutting edge sustainable practices and maintain the City’s leadership as a sustainable community.
o New Objective: Develop and begin implementation of a Climate Action and Adaptation Plan by June 30, 2017.
Goal: Provide focused and cohesive information to the public. o New Objective: Establish processes, standards and tools for effective communication. o New Objective: Identify best practices and guidelines for consistent use of the City’s brand. o New Objective: Implement a new City website and new intranet. o New Objective: Evaluate current City newsletters and e-newsletters to assess effectiveness and
recommendations to better utilize existing resources.
Records & Election Services (City Clerk) Goal: Impartially administer municipal and special elections, including elections for the City Council, Rent Control, School District and College District Boards.
o Updated Objective: To maintain an inclusive and diverse community by promoting voter participation and a sense of community and wellbeing through voter registration events.
o Updated Service Benchmark: Process and review Campaign Disclosure Statements from an average of 55 Campaign Committees per filing period, including posting non-electronic statements on the City’s filing system within 24 hours or as soon thereafter as practicable.
Goal: Record City Council proceedings, and maintain and distribute legislative information. o Updated Objective: Launch a new public portal for historical documents on website by June 30,
2016, and provide information on newly-approved Council contracts in Open Data by December 31, 2016, thereby increasing transparency and access to public documents.
o Updated Objective: Conduct the AB1234 Ethics Training for City officials by December 31, 2016. o Updated Service Benchmark: Answer questions from an average of 1,300 public speakers and
Council meeting attendees, and an average of 80 boards/commission applicants regarding participation in public meetings and local government to maintain an inclusive and diverse community.
o New Service Benchmark: Reduce the number of printed Council packets and agenda mailings in half by the end of FY 2016-17 to comply with the City’s sustainability policies and reduce metered postage costs.
Goal: Manage City documents as required by local and state laws. o Updated Service Benchmark: Offer regular trainings for new staff on the City’s electronic
document management system by December 31, 2016. o Remove Service Benchmark: Research and purchase an Electronic Records Retention Tracking
Software and incorporate a Department-Wide procedure in the Annual Records Retention Program by June 30, 2017.
77
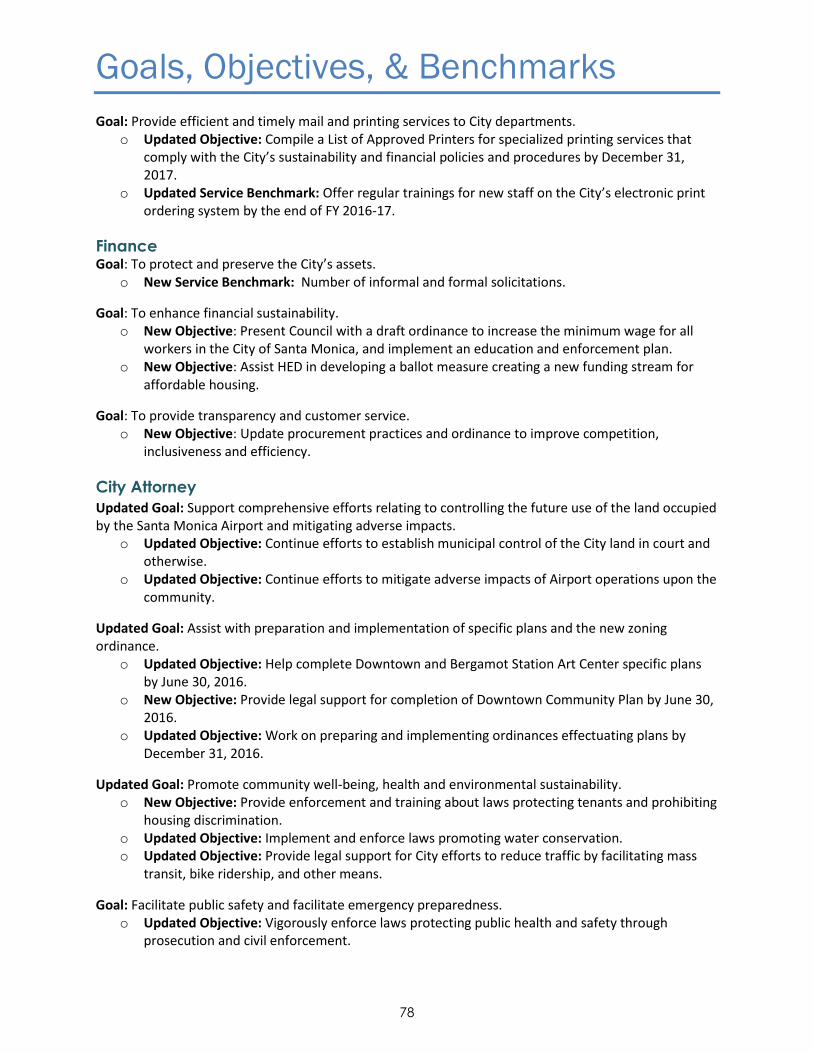
Goals, Objectives, & Benchmarks
Goal: Provide efficient and timely mail and printing services to City departments. o Updated Objective: Compile a List of Approved Printers for specialized printing services that
comply with the City’s sustainability and financial policies and procedures by December 31, 2017.
o Updated Service Benchmark: Offer regular trainings for new staff on the City’s electronic print ordering system by the end of FY 2016-17.
Finance Goal: To protect and preserve the City’s assets.
o New Service Benchmark: Number of informal and formal solicitations.
Goal: To enhance financial sustainability. o New Objective: Present Council with a draft ordinance to increase the minimum wage for all
workers in the City of Santa Monica, and implement an education and enforcement plan. o New Objective: Assist HED in developing a ballot measure creating a new funding stream for
affordable housing.
Goal: To provide transparency and customer service. o New Objective: Update procurement practices and ordinance to improve competition,
inclusiveness and efficiency.
City Attorney
Updated Goal: Support comprehensive efforts relating to controlling the future use of the land occupied by the Santa Monica Airport and mitigating adverse impacts.
o Updated Objective: Continue efforts to establish municipal control of the City land in court and otherwise.
o Updated Objective: Continue efforts to mitigate adverse impacts of Airport operations upon the community.
Updated Goal: Assist with preparation and implementation of specific plans and the new zoning ordinance.
o Updated Objective: Help complete Downtown and Bergamot Station Art Center specific plans by June 30, 2016.
o New Objective: Provide legal support for completion of Downtown Community Plan by June 30, 2016.
o Updated Objective: Work on preparing and implementing ordinances effectuating plans by December 31, 2016.
Updated Goal: Promote community well-being, health and environmental sustainability. o New Objective: Provide enforcement and training about laws protecting tenants and prohibiting
housing discrimination. o Updated Objective: Implement and enforce laws promoting water conservation. o Updated Objective: Provide legal support for City efforts to reduce traffic by facilitating mass
transit, bike ridership, and other means.
Goal: Facilitate public safety and facilitate emergency preparedness. o Updated Objective: Vigorously enforce laws protecting public health and safety through
prosecution and civil enforcement.
78

Goals, Objectives, & Benchmarks
Information Systems
Goal: Support and enhance wired and wireless broadband communications in the community. o Updated Service Benchmark: 10 multi-family dwelling unit buildings connected to municipal
broadband.
Goal: Implement automated business systems to enhance and modernize business practices financial sustainability.
o Remove Objective: Automate 5 high value workflows for internal processes within the City by June 30, 2017.
o Remove Objective: Identify and develop needed software resources to support e-signatures and workflows.
o New Objective: Implement new Payroll and Financial Management Systems by June 30, 2017. o New Objective: Implement new Electronic Patient Care Records and Records Management
Systems for the Fire Department by June 30, 2017. o New Objective: Implement new Criminal Prosecution System for the City Attorney’s Office by
June 30, 2016. o Remove Service Benchmark: 5 automated business forms with electronic signature.
Goal: Enhance public safety, mobility and livability through state-of-the-art technologies. o Updated Objective: Complete implementation of the Public Safety Radio Infrastructure project
that will also provide the BBB with new radio infrastructure. o New Service Benchmark: Farebox System. o New Service Benchmark: Complete infrastructure design and execute membership with the ICIS
JPA.
Goal: Facilitate citizen engagement and the delivery of government information and services through open data, mobile and web technologies.
o Remove Objective: Transition 3 websites to be responsive to mobile users by June 30, 2017. o New Objective: Rebuild City Homepage and Internet sites. o New Objective: Assist the Office of Communications in communication strategies, including
upgrades in the use of targeted email, text messaging and social media sites. o Updated Service Benchmark: New Homepage and 6 websites.
Goal: Engage in development and long-range sustainability of the Local Wellbeing Index and strategies for its use.
o Updated Objective: Continue assisting in implementation of Wellbeing Project through June 30, 2017.
o New Service Benchmark: Assist in development of on-line Wellbeing engagement tool.
Planning and Community Development
Goal: Implement the LUCE to enhance the character of Santa Monica, conserve neighborhoods, enhance public facilities and expand mobility options.
o New Objective: Create guidelines for distribution of Historic Preservation contributions from Development Agreements by December 31, 2016.
Goal: Ensure new development reflects the priorities established by Council and the community benefits identified in the LUCE.
79

Goals, Objectives, & Benchmarks
o New Objective: Continue making Zoning Ordinance minor clerical changes, corrections, and clarifications.
o New Objective: Prepare Zoning Ordinance Issues of Policy Annual Review and Monitoring Report by July 1, 2017.
Goal: Provide excellent customer service for development review and building plan check and inspections, to ensure coordination, consistency and efficiency.
o New Objective: Revise ARB and Landmarks Commission resolutions to increase staff purview to approve ARB applications and Certificates of Appropriateness by February 1, 2017.
o New Objective: Update application forms and procedures to accommodate new application types as a result of Zoning Ordinance Update by July 1, 2016.
o New Objective: Streamline workflow and simplify customer version of ProjectDox by March 1, 2017.
o New Objective: Develop and implement mobile technology for building inspections and code enforcement field actions. Mobile operations will allow instant access for staff and customers while in the performance of field work by February 1, 2017.
o New Objective: Adopt the 2016 State of California triennial building and fire codes by December 31, 2016.
o New Objective: Create framework for a Development Services Center to streamline the Development Review process and implement process improvements by June 30, 2017.
Goal: Ensure neighborhood quality of life including neighborhood conservation and urban design. o New Objective: Prepare Zoning Ordinance Design Guidelines by December 31, 2016.
New Goal: Create a new model for mobility consistent with Council strategic goals that increases choices for people to get where they are going, while helping to address vehicle congestion and climate change.
o New Objective: Develop interdepartmental team, work plan and metrics for mobility strategic goal, with Council presentation by September 2016.
o New Objective: Complete household travel survey to establish pre-Expo Light Rail travel baseline by June 30, 2016.
o New Objective: Initiate implementation of mobility strategic goal work plan by September 30, 2016.
o New Objective: Complete a Gateway Access Master Plan for the freeway adjacent areas in Downtown that addresses connections, open space, urban design and implementation phasing by December 31, 2017.
o New Objective: Complete post-Expo monitoring and policy response by June 30, 2017.
Community and Cultural Services
Goal: Address the needs and wellbeing of the Santa Monica community through human service programs that promote self-sufficiency and quality of life.
o Updated Objective: Lead the community-based Cradle to Career Initiative through June 2017 to improve the wellbeing of youth and families, including the following key initiatives: YRT 2.0 and the Building Blocks for Kindergarten Readiness Campaign.
o New Objective: Conduct outreach to low-income Santa Monica residents in an effort to increase access to employment opportunities, housing, childcare, and Department of Public Social Services benefits.
80
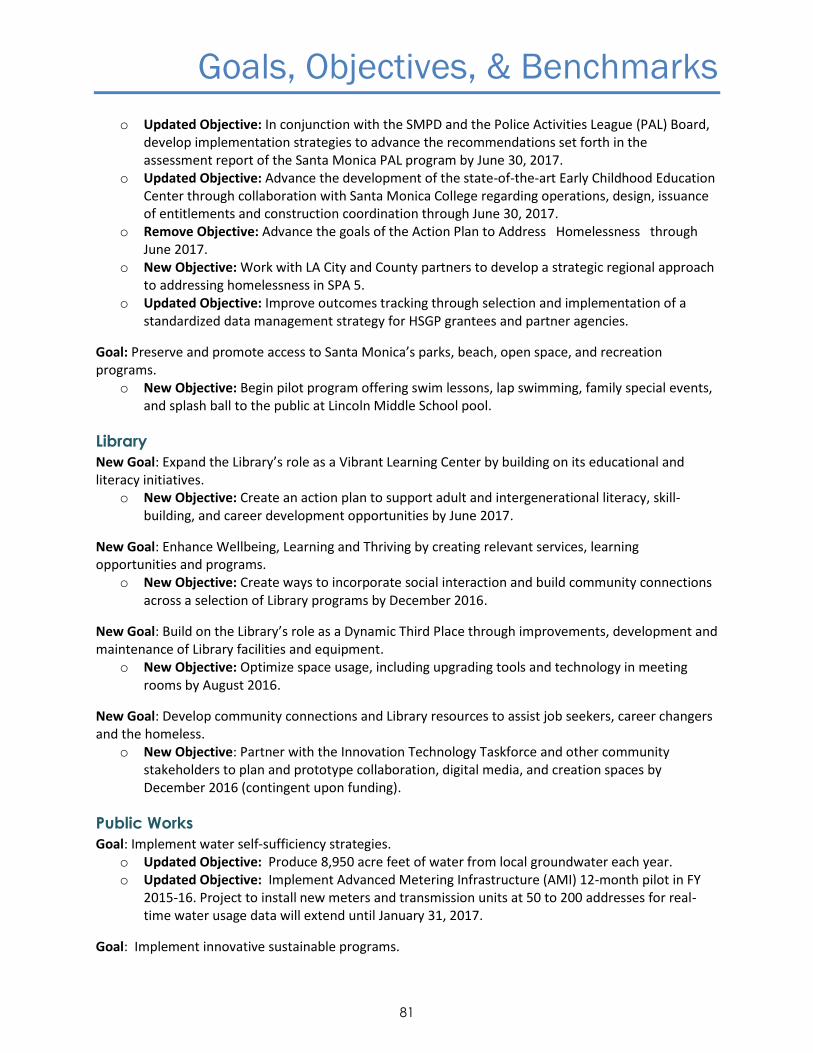
Goals, Objectives, & Benchmarks
o Updated Objective: In conjunction with the SMPD and the Police Activities League (PAL) Board, develop implementation strategies to advance the recommendations set forth in the assessment report of the Santa Monica PAL program by June 30, 2017.
o Updated Objective: Advance the development of the state-of-the-art Early Childhood Education Center through collaboration with Santa Monica College regarding operations, design, issuance of entitlements and construction coordination through June 30, 2017.
o Remove Objective: Advance the goals of the Action Plan to Address Homelessness through June 2017.
o New Objective: Work with LA City and County partners to develop a strategic regional approach to addressing homelessness in SPA 5.
o Updated Objective: Improve outcomes tracking through selection and implementation of a standardized data management strategy for HSGP grantees and partner agencies.
Goal: Preserve and promote access to Santa Monica’s parks, beach, open space, and recreation programs.
o New Objective: Begin pilot program offering swim lessons, lap swimming, family special events, and splash ball to the public at Lincoln Middle School pool.
Library
New Goal: Expand the Library’s role as a Vibrant Learning Center by building on its educational and literacy initiatives.
o New Objective: Create an action plan to support adult and intergenerational literacy, skill-building, and career development opportunities by June 2017.
New Goal: Enhance Wellbeing, Learning and Thriving by creating relevant services, learning opportunities and programs.
o New Objective: Create ways to incorporate social interaction and build community connections across a selection of Library programs by December 2016.
New Goal: Build on the Library’s role as a Dynamic Third Place through improvements, development and maintenance of Library facilities and equipment.
o New Objective: Optimize space usage, including upgrading tools and technology in meeting rooms by August 2016.
New Goal: Develop community connections and Library resources to assist job seekers, career changers and the homeless.
o New Objective: Partner with the Innovation Technology Taskforce and other community stakeholders to plan and prototype collaboration, digital media, and creation spaces by December 2016 (contingent upon funding).
Public Works
Goal: Implement water self-sufficiency strategies. o Updated Objective: Produce 8,950 acre feet of water from local groundwater each year. o Updated Objective: Implement Advanced Metering Infrastructure (AMI) 12-month pilot in FY
2015-16. Project to install new meters and transmission units at 50 to 200 addresses for real-time water usage data will extend until January 31, 2017.
Goal: Implement innovative sustainable programs.
81

Goals, Objectives, & Benchmarks
o New Objective: The development of a green burial section as an eco-friendly alternative to traditional burial by June 30, 2016.
o Updated Service Benchmark: Reduce illegal dumping by 10% by implementing and promoting a donation program to redistribute goods and materials using a program known as SM Swap or Share and by implementing a bi-monthly special event bulky item collection program.
o Updated Service Benchmark: Implement burial guidelines established by the Green Burial Council for a hybrid certified cemetery, and begin accepting/selling plots by July 1, 2016.
Goal: Maintain and Enhance Physical Infrastructure. o Updated Objective: Complete a GIS inventory of street signs, and roadway markings by June 30,
2017. o Updated Objective: Complete Phase IV of the Crosswalk Rehabilitation CIP plan by June 30,
2017. o Updated Service Benchmark: Repair 3 miles of streets per year. o Updated Service Benchmark: Repair 30,000 square feet of sidewalks per year. o Updated Service Benchmark: Apply 950 sidewalk patches and repair 650 potholes per year. o Updated Service Benchmark: Perform 30,000 square feet of general asphalt repairs per year. o New Service Benchmark: Perform 250,000 square feet of alley repairs per year. o New Service Benchmark: Convert 50 conventional street lights to low energy LED street lights
by June 30, 2017. Goal: Effectively manage City’s Capital Improvement Program (CIP) and project implementation.
o New Objective: Maintain final schedules and complete 80% of construction projects on time in FY 2016-17.
o New Objective: Implement recommended projects from the Citywide Facilities Condition Assessment each year, up to $1.5 million.
o Updated Objective: Manage 20 CIP projects in design, 5 projects in construction, and complete 19 projects in FY 2016-17.
Goal: Provide efficient and effective service delivery. o New Objective: Respond to category 1 requests resulting from inspections within 5 business
days. o Updated Objective: Complete 70% of facilities maintenance works orders within 5 days. o Updated Objective: Serve 90% of Public Works customers at the counter within 15 minutes. o Updated Objective: Complete 95% of Civil Engineering minor plan checks within 3 weeks and
major plan checks within 5 weeks. o New Objective: Maintain the current 100% Green Seal product usage for daily cleaning of City
Facilities while researching and evaluating non-green cleaning products that are occasionally utilized due to environmental conditions.
o New Objective: Complete street light repair requests within 5 business days.
Updated Goal: Provide a safe, secure, financially responsible, sustainable, and community responsive operation of the Airport.
o Updated Objective: Perform 730 facility inspections per year to ensure the security and safety of the airfield.
o Updated Objective: Advocate for the commercial distribution of biofuel to replace petroleum jet fuel at Santa Monica Airport.
82

Goals, Objectives, & Benchmarks
o Updated Objective: Continue to advocate for a faster availability of lead-free AVGAS fuel for piston-powered aircraft at Santa Monica Airport and other general aviation airports prior to the 2018 timeframe estimated by federal government.
o New Objective: Host an annual Santa Monica Art Walk and participate in the annual Santa Monica Festival.
o New Objective: Post relevant information, reports and data on SMO web site within 5 working days of availability.
Big Blue Bus
Goal: Identify, evaluate and execute needed changes associated with Expo integration and the changing physical environment to improve quality of life for people within our service area.
o Updated Objective: Develop strategies to attract choice riders; e.g., hosting community events – open house, scheduled tours, rider appreciation day.
o New Objective: Full integration of BBB system with Expo Phase II. o New Service Benchmark: Concept and develop a full-scale marketing campaign for Evolution of
Blue, conduct outreach activities and TAP card promotions. o New Service Benchmark: Further evaluate the formulation of a Transit Advisory Committee. o New Service Benchmark: Reduce dwell times and save staff resources by supporting the newly
refurbished fareboxes with continued strategies toward cashless boarding and use faster boarding fare media in order to speed boarding and save staffing time for pass sales.
Goal: Complete technology projects and software upgrades on time, within budget, and with full functionality.
o Updated Objective: NextBus real-time bus tracking tool implementation. o Updated Objective: Bus Stop Signage Improvement Project Completion (Phase I and Phase II).
o New Objective: Evolution of Blue Bus Stop Program. o New Service Benchmark: Complete Evolution of Blue Bus Stop Program by calendar year-end
2016.
Updated Goal: Ensure we are meeting our operating and capital financial goals through close communication between finance and operating divisions.
o Updated Service Benchmark: Passengers per revenue vehicle hour of 44 or greater. o Updated Service Benchmark: System-wide subsidy per passenger trip of $2.25 or less.
Goal: Adjust services offered and use data tracking to judge efficiency, effectiveness, and customer satisfaction.
o Updated Objective: Increase average speed by increasing bus stop spacing, obtaining a higher percentage of pre-paid fares, signal priority, re-routing, and use of bus rapid transit lanes.
o Updated Objective: Implement Expo Integration Plan and assess effectiveness of new routes and schedules twelve months after Expo opens.
o New Service Benchmark: Increase average stop spacing on local routes to 1,000-1,325 ft. and 2,600 feet on Rapid routes.
o New Service Benchmark: Reduce use of cash payment to no more than 40% of customers paying fares with cash versus pre-paid fare media.
o Updated Service Benchmark: Create systematic analysis process to analyze effectiveness of signal priority intersection effectiveness.
83

Goals, Objectives, & Benchmarks
o Updated Service Benchmark: Complete re-routing of service for Expo Integration Plan. Complete follow-up study to Expo Integration in Spring 2017 to judge effectiveness.
New Goal: Implement and improve organizational safety programs and practices to reduce work-related injuries and accidents.
o New Objective: Implement a hazard/near-miss program to address, track and analyze safety issues and hazardous conditions to reduce total accidents.
o New Objective: Develop and implement a program to reduce worker compensation claims. o New Service Benchmark: Reduce preventable vehicle accidents (as defined by the National
Safety Council) by 10% by June 30, 2017. o New Service Benchmark: Reduce worker compensation claims by 20% (cumulatively over the
five-years) through industrial accident investigations, root cause analysis and implementation of best practices.
New Goal: Increase promotional placement and organization development and training opportunities for staff.
o New Objective: Research and determine measures of success in recruitment and training. o New Objective: Develop a succession and retention plan. o New Service Benchmark: Complete development of the BBB succession and retention plan by
fall 2016.
84

PERSONNEL AND STAFFING
FY 2016-17 Adopted Budget
85

86

Fund/Department/Employee Type
2013-14
Revised
Budget
2014-15
Revised
Budget
2015-16
Revised
Budget
2016-17
Adopted
Budget
2016-17
Increase/
(Decrease)
TOTAL CITY
GENERAL FUND
Permanent Employees 1,305.8 1,338.5 1,369.5 1,384.5 15.0
Temporary Staffing 141.4 134.2 132.8 135.6 2.8
GENERAL FUND TOTAL 1,447.2 1,472.6 1,502.3 1,520.1 17.8
NON-GENERAL FUND
Permanent Employees 679.2 700.1 737.4 751.6 14.2
Temporary Staffing 52.6 31.0 29.7 21.1 (8.6)
NON-GENERAL FUND TOTAL 731.8 731.1 767.1 772.7 5.6
ALL FUNDS
Permanent Employees 1,985.0 2,038.6 2,106.9 2,136.1 29.2
Temporary Staffing 193.9 165.2 162.5 156.7 (5.8)
TOTAL PERSONNEL & STAFFING 2,178.9 2,203.8 2,269.4 2,292.8 23.4
01 - GENERAL FUND
CITY COUNCIL
Permanent Employees 1.0 1.0 1.0 1.0 -
Temporary Staffing - - - - -
CITY MANAGER
Permanent Employees 37.5 71.0 76.5 79.0 2.5
Temporary Staffing 4.9 5.2 6.1 6.1 -
RECORDS AND ELECTION SERVICES
Permanent Employees 13.0 13.0 13.5 13.5 -
Temporary Staffing - - - - -
FINANCE
Permanent Employees 59.5 61.0 64.3 64.3 -
Temporary Staffing 2.8 1.8 1.0 0.7 (0.3)
CITY ATTORNEY
Permanent Employees 41.0 42.0 43.5 45.0 1.5
Temporary Staffing 0.1 0.3 0.4 0.7 0.3
HUMAN RESOURCES
Permanent Employees 23.0 24.0 25.0 26.0 1.0
Temporary Staffing 0.2 0.4 0.2 0.2 -
INFORMATION SYSTEMS
Permanent Employees 44.0 46.0 50.0 45.0 (5.0)
Temporary Staffing - - - - -
PLANNING AND COMMUNITY DEVELOPMENT
Permanent Employees 114.0 116.0 123.1 124.1 1.0
Temporary Staffing - - - - -
Summary of Personnel (FTE) by Fund
87

Fund/Department/Employee Type
2013-14
Revised
Budget
2014-15
Revised
Budget
2015-16
Revised
Budget
2016-17
Adopted
Budget
2016-17
Increase/
(Decrease)
Summary of Personnel (FTE) by Fund
POLICE
Permanent Employees 402.0 387.0 392.0 395.0 3.0
Temporary Staffing 31.4 31.4 31.4 31.4 -
FIRE
Permanent Employees 129.0 129.8 129.8 135.8 6.0
Temporary Staffing - - - - -
COMMUNITY AND CULTURAL SERVICES
Permanent Employees 105.8 106.5 107.7 108.7 1.0
Temporary Staffing 46.9 47.2 45.3 48.1 2.8
LIBRARY
Permanent Employees 70.5 70.5 70.5 71.5 1.0
Temporary Staffing 41.8 40.5 40.5 40.5 -
PUBLIC WORKS
Permanent Employees 245.5 251.0 251.0 254.0 3.0
Temporary Staffing 12.6 6.3 6.3 6.3 -
HOUSING AND ECONOMIC DEVELOPMENT
Permanent Employees 20.0 19.7 21.7 21.7 -
Temporary Staffing 0.7 1.0 1.6 1.6 -
Fund Summary
Permanent Employees 1305.8 1338.5 1369.5 1384.5 15.0
Temporary Staffing 141.4 134.2 132.8 135.6 2.8
GENERAL FUND TOTAL 1,447.2 1,472.6 1,502.3 1,520.1 17.8
11 - BEACH
COMMUNITY AND CULTURAL SERVICES
Permanent Employees 6.0 8.5 9.3 9.5 0.2
Temporary Staffing 8.9 5.9 5.5 5.5 -
PUBLIC WORKS
Permanent Employees 18.5 34.5 35.5 35.5 -
Temporary Staffing 16.5 - - - -
Fund Summary
Permanent Employees 24.5 43.0 44.8 45.0 0.2
Temporary Staffing 25.4 5.9 5.5 5.5 -
11 - BEACH TOTAL 49.9 48.9 50.3 50.5 0.2
88

Fund/Department/Employee Type
2013-14
Revised
Budget
2014-15
Revised
Budget
2015-16
Revised
Budget
2016-17
Adopted
Budget
2016-17
Increase/
(Decrease)
Summary of Personnel (FTE) by Fund
12 - HOUSING AUTHORITY
HOUSING AND ECONOMIC DEVELOPMENT
Permanent Employees 13.0 13.0 13.0 13.0 -
Temporary Staffing 0.1 0.1 0.1 0.1 -
Fund Summary
Permanent Employees 13.0 13.0 13.0 13.0 -
Temporary Staffing 0.1 0.1 0.1 0.1 -
12 - HOUSING AUTHORITY TOTAL 13.1 13.1 13.1 13.1 -
25 - WATER
PUBLIC WORKS
Permanent Employees 46.0 46.0 46.0 47.0 1.0
Temporary Staffing - - - - -
Fund Summary
Permanent Employees 46.0 46.0 46.0 47.0 1.0
Temporary Staffing - - - - -
25 - WATER TOTAL 46.0 46.0 46.0 47.0 1.0
27 - RESOURCE REC & RECYCLING
PUBLIC WORKS
Permanent Employees 80.0 82.4 84.4 85.4 1.0
Temporary Staffing 7.7 5.3 5.3 5.3 -
Fund Summary
Permanent Employees 80.0 82.4 84.4 85.4 1.0
Temporary Staffing 7.7 5.3 5.3 5.3 -
27 - RESOURCE REC & RECYCLING TOTAL 87.7 87.7 89.7 90.7 3.0
28 - COMMUNITY BROADBAND
INFORMATION SYSTEMS
Permanent Employees - - - 4.0 4.0
Temporary Staffing - - - - -
Fund Summary
Permanent Employees - - - 4.0 4.0
Temporary Staffing - - - - -
28 - COMMUNITY BROADBAND TOTAL - - - 4.0 4.0
30 - PIER
CITY MANAGER
Permanent Employees 2.0 2.0 2.0 - (2.0)
Temporary Staffing - - - - -
89

Fund/Department/Employee Type
2013-14
Revised
Budget
2014-15
Revised
Budget
2015-16
Revised
Budget
2016-17
Adopted
Budget
2016-17
Increase/
(Decrease)
Summary of Personnel (FTE) by Fund
POLICE
Permanent Employees 7.0 7.0 7.0 7.0 -
Temporary Staffing 2.3 2.3 2.3 2.3 -
PUBLIC WORKS
Permanent Employees 6.0 6.0 8.0 10.0 2.0
Temporary Staffing 0.5 0.5 - - -
Fund Summary
Permanent Employees 15.0 15.0 17.0 17.0 -
Temporary Staffing 2.8 2.8 2.3 2.3 -
30 - PIER TOTAL 17.8 17.8 19.3 19.3 -
31 - WASTEWATER
PUBLIC WORKS
Permanent Employees 22.0 22.0 22.0 22.0 -
Temporary Staffing 0.2 0.2 0.2 0.2 -
Fund Summary
Permanent Employees 22.0 22.0 22.0 22.0 -
Temporary Staffing 0.2 0.2 0.2 0.2 -
31 - WASTEWATER TOTAL 22.2 22.2 22.2 22.2 -
33 - AIRPORT
PUBLIC WORKS
Permanent Employees 12.0 11.0 12.0 12.0 -
Temporary Staffing 0.5 1.4 0.9 0.9 -
Fund Summary
Permanent Employees 12.0 11.0 12.0 12.0 -
Temporary Staffing 0.5 1.4 0.9 0.9 -
33 - AIRPORT TOTAL 12.5 12.4 12.9 12.9 0.5
37 - CEMETERY
PUBLIC WORKS
Permanent Employees 6.0 7.0 7.0 8.0 1.0
Temporary Staffing 1.1 0.1 0.1 0.1 -
Fund Summary
Permanent Employees 6.0 7.0 7.0 8.0 1.0
Temporary Staffing 1.1 0.1 0.1 0.1 -
37 - CEMETERY TOTAL 7.1 7.1 7.1 8.1 1.0
90

Fund/Department/Employee Type
2013-14
Revised
Budget
2014-15
Revised
Budget
2015-16
Revised
Budget
2016-17
Adopted
Budget
2016-17
Increase/
(Decrease)
Summary of Personnel (FTE) by Fund
41 - BIG BLUE BUS
BIG BLUE BUS
Permanent Employees 420.7 420.7 449.2 456.2 7.0
Temporary Staffing 14.8 15.3 15.3 6.7 (8.6)
Fund Summary
Permanent Employees 420.7 420.7 449.2 456.2 7.0
Temporary Staffing 14.8 15.3 15.3 6.7 (8.6)
41 - BIG BLUE BUS TOTAL 435.5 436.0 464.5 462.9 (1.6)
54 - VEHICLE MANAGEMENT
PUBLIC WORKS
Permanent Employees 28.0 28.0 29.0 29.0 -
Temporary Staffing - - - - -
Fund Summary
Permanent Employees 28.0 28.0 29.0 29.0 -
Temporary Staffing - - - - -
54 - VEHICLE MANAGEMENT TOTAL 28.0 28.0 29.0 29.0 -
58 - RISK MANAGEMENT ADMINISTRATION
FINANCE
Permanent Employees 12.0 12.0 13.0 13.0 -
Temporary Staffing - - - - -
Fund Summary
Permanent Employees 12.0 12.0 13.0 13.0 -
Temporary Staffing - - - - -
58 - RISK MANAGEMENT ADMIN TOTAL 12.0 12.0 13.0 13.0 -
NON-GENERAL FUNDS SUMMARY
Permanent Employees 679.2 700.1 737.4 751.6 14.2
Temporary Staffing 52.6 31.0 29.7 21.1 (8.6)
NON-GENERAL FUNDS TOTAL 731.8 731.1 767.1 772.7 5.6
91

92

Department/Division/Title
2013-14
Revised
Budget
2014-15
Revised
Budget
2015-16
Revised
Budget
2016-17
Adopted
Budget
CITY COUNCIL
City Council - 01201
Council Office Coordinator 1.0 1.0 1.0 1.0
Division Summary
Permanent Employees 1.0 1.0 1.0 1.0
Temporary Staffing - - - -
City Council - 01201 Total 1.0 1.0 1.0 1.0
Department Summary
Permanent Employees 1.0 1.0 1.0 1.0
Temporary Staffing - - - -
CITY COUNCIL TOTAL 1.0 1.0 1.0 1.0
CITY MANAGER
Administration - 01202
City Manager 1.0 1.0 1.0 1.0
Assistant City Manager 1.0 1.0 1.0 1.0
Deputy City Manager 1.0 1.0 1.0 1.0
Internal Audit Manager 1.0 - - -
Senior Advisor to the City Manager on Airport Affairs - - 1.0 1.0
Assistant to the City Manager 1.0 1.0 1.0 1.0
Chief Data Officer - - - 1.0
Chief Performance Officer - - - 1.0
Executive Administrator to the City Manager - 1.0 1.0 1.0
Office Manager to the City Manager 1.0 - - -
Administrative Analyst 0.5 0.5 - - Assistant Administrative Analyst (limited term) - - - 1.0
Volunteer Program Coordinator - 0.5 0.5 -
Administrative Staff Assistant - City Manager's Office 1.0 1.0 1.0 1.0
Administrative Assistant - City Manager's Office 1.0 1.0 1.0 1.0
City Hall Receptionist 1.0 1.0 1.0 1.0
Division Summary
Permanent Employees 9.5 9.0 9.5 12.0
Temporary Staffing 0.2 0.2 0.1 0.1
Administration - 01202 Total 9.7 9.2 9.6 12.1
Personnel (FTE) by Department and Division
93

Department/Division/Title
2013-14
Revised
Budget
2014-15
Revised
Budget
2015-16
Revised
Budget
2016-17
Adopted
Budget
Personnel (FTE) by Department and Division
Office of Communications (formerly Community and Government Relations) - 01207
Deputy City Manager - Special Projects 1.0 - - -
Communications and Public Affairs Officer - 1.0 1.0 -
Chief Communications Officer - - - 1.0
Cable TV and Public Information Manager 1.0 1.0 - -
Administrative Services Officer - - 1.0 1.0
Public Information Officer - - 1.0 1.0
Cable TV Manager - - 1.0 1.0
Senior Marketing Manager - - 1.0 1.0
Public Information Coordinator 1.0 1.0 1.0 1.0
Community Relations Coordinator 1.0 1.0 - -
Cable TV Programming Specialist 1.0 1.0 1.0 1.0
Video Production Coordinator 3.0 3.0 3.0 3.0
Staff Assistant III 1.0 1.0 1.0 1.0
Marketing/Communications Assistant - - 1.0 1.0
Staff Assistant II - - 1.0 1.0
Division Summary
Permanent Employees 9.0 9.0 13.0 13.0
Temporary Staffing 4.4 4.7 5.7 5.7
Office of Communications - 01207 Total 13.4 13.7 18.7 18.7
Office of Pier Management - 30209
Pier Manager 1.0 1.0 1.0 -
Staff Assistant III 1.0 1.0 1.0 -
Division Summary
Permanent Employees 2.0 2.0 2.0 -
Temporary Staffing - - - -
Office of Pier Management - 30209 Total 2.0 2.0 2.0 -
94

Department/Division/Title
2013-14
Revised
Budget
2014-15
Revised
Budget
2015-16
Revised
Budget
2016-17
Adopted
Budget
Personnel (FTE) by Department and Division
Office of Sustainability and the Environment - 01226
Sustainability Manager 1.0 1.0 1.0 -
Chief Sustainability Officer - - - 1.0
Principal Sustainability Analyst 2.0 2.0 2.0 2.0
Sustainable Energy Engineer 1.0 1.0 1.0 -
Senior Sustainability Analyst 2.0 3.0 3.0 4.0
Sustainable Building Advisor 1.0 1.0 1.0 1.0
Sustainable Outreach Coordinator 1.0 - - -
Sustainability Outreach Coordinator - 1.0 1.0 1.0 Sustainability Analyst (1.0 FTE is limited term) 4.0 4.0 4.0 5.0 Water Resources Specialist (limited term) - 2.0 3.0 2.0
Administrative Staff Assistant - Environmental Programs 1.0 1.0 1.0 1.0 Project Support Assistant (1.0 FTE is limited term) 1.0 2.0 2.0 2.0
Recycling Assistant 1.0 1.0 1.0 1.0
Division Summary
Permanent Employees 15.0 19.0 20.0 20.0
Temporary Staffing 0.3 0.3 0.3 0.3
Office of Sustainability and the Environment - 01226 Total 15.3 19.3 20.3 20.3
Office of Emergency Management - 01227
Emergency Services Manager 1.0 1.0 1.0 -
Chief Resilience Officer - - - 1.0
Communications Center Administrator 1.0 1.0 1.0 1.0
Emergency Services Administrator - 1.0 1.0 1.0
Emergency Services Coordinator 1.0 - - -
Communications Center Supervisor - 5.0 5.0 5.0
Public Safety Dispatcher - 24.0 24.0 24.0
Administrative Staff Assistant 1.0 1.0 1.0 1.0
Staff Assistant II - 1.0 1.0 1.0
Division Summary
Permanent Employees 4.0 34.0 34.0 34.0
Temporary Staffing - - - -
Office of Emergency Management - 01227 Total 4.0 34.0 34.0 34.0
Department Summary
Permanent Employees 39.5 73.0 78.5 79.0
Temporary Staffing 4.9 5.2 6.1 6.1
CITY MANAGER TOTAL 44.4 78.2 84.6 85.1
95

Department/Division/Title
2013-14
Revised
Budget
2014-15
Revised
Budget
2015-16
Revised
Budget
2016-17
Adopted
Budget
Personnel (FTE) by Department and Division
RECORDS AND ELECTION SERVICES
Administration - 01211
Director of Records and Election Services (City Clerk) 1.0 1.0 1.0 1.0
Assistant Director of Records and Elections (Assistant Clerk) 1.0 1.0 1.0 1.0
Administrative Analyst 1.0 1.0 1.5 1.5
Records Management Coordinator 1.0 1.0 1.0 1.0
Deputy City Clerk 1.0 1.0 1.0 1.0
Staff Assistant III 2.0 2.0 2.0 2.0
Records Management Assistant 1.0 1.0 1.0 1.0
Division Summary
Permanent Employees 8.0 8.0 8.5 8.5
Temporary Staffing - - - -
Administration - 01211 Total 8.0 8.0 8.5 8.5
Support Services - 01214
Support Services Supervisor 1.0 1.0 1.0 1.0
Reprographics Specialist II 2.0 2.0 2.0 2.0
Mail Courier 2.0 2.0 2.0 2.0
Division Summary
Permanent Employees 5.0 5.0 5.0 5.0
Temporary Staffing - - - -
Support Services - 01214 Total 5.0 5.0 5.0 5.0
Department Summary
Permanent Employees 13.0 13.0 13.5 13.5
Temporary Staffing - - - -
RECORDS AND ELECTION SERVICES TOTAL 13.0 13.0 13.5 13.5
96

Department/Division/Title
2013-14
Revised
Budget
2014-15
Revised
Budget
2015-16
Revised
Budget
2016-17
Adopted
Budget
Personnel (FTE) by Department and Division
FINANCE
Administration - 01221
Director of Finance/City Treasurer 1.0 1.0 1.0 1.0
Assistant Director of Finance 1.0 - - -
Assistant City Treasurer 1.0 1.0 - -
Financial Systems and Payroll Administrator - - 1.0 1.0
Purchasing Services Manager 1.0 1.0 1.0 1.0
Principal Administrative Analyst - 1.0 1.0 1.0
Principal Treasury Analyst - 1.0 - -
Financial Systems Analyst - - 1.0 1.0
Payroll Analyst - - 2.0 2.0
Senior Administrative Analyst 1.0 1.0 - -
Senior Buyer 2.0 2.0 2.0 2.0
Contracts Coordinator 1.0 1.0 1.0 1.0
Buyer 1.0 1.0 1.0 1.0
Revenue Collections Supervisor - 1.0 - -
Payroll Specialist - - 2.0 2.0
Executive Administrative Assistant 1.0 1.0 1.0 1.0
Senior Revenue Operations Assistant 1.0 1.0 - -
Revenue Operations Assistant II 2.5 2.0 - -
Senior Revenue Collections Assistant - 1.0 - -
Staff Assistant III 1.0 1.0 1.0 1.0
Revenue Collections Assistant - 3.0 - -
Division Summary
Permanent Employees 14.5 20.0 15.0 15.0
Temporary Staffing - 1.8 0.5 0.2
Administration - 01221 Total 14.5 21.8 15.5 15.2
Budget - 01208
Budget Manager 1.0 1.0 1.0 1.0
Principal Budget Analyst 1.0 - - -
Senior Budget Analyst 2.0 3.0 3.0 4.0
Administrative Analyst - 1.0 1.0 -
Assistant Administrative Analyst 1.0 - - -
Division Summary
Permanent Employees 5.0 5.0 5.0 5.0
Temporary Staffing - - - -
Budget - 01208 Total 5.0 5.0 5.0 5.0
97

Department/Division/Title
2013-14
Revised
Budget
2014-15
Revised
Budget
2015-16
Revised
Budget
2016-17
Adopted
Budget
Personnel (FTE) by Department and Division
Financial Operations - 01222
Financial Operations Manager 1.0 - - -
Accounting Manager - 1.0 1.0 1.0
Financial Systems and Payroll Administrator 1.0 1.0 - -
Financial Reporting Administrator - 1.0 1.0 1.0
Accounts Payable Supervisor 1.0 1.0 1.0 1.0
Financial Reporting Supervisor 2.0 - - -
Financial Systems Analyst 2.0 1.0 - -
Payroll Analyst 1.0 1.0 - -
Payroll Systems Analyst - 1.0 - -
Senior Grants Analyst - 1.0 1.0 1.0
Senior Accountant 2.0 2.0 2.0 2.0
Accountant II 3.0 3.0 3.0 3.0
Accountant I 2.0 2.0 2.0 2.0
Payroll Specialist 2.0 2.0 - -
Fiscal Staff Assistant III 1.0 1.0 1.0 1.0
Fiscal Staff Assistant II 3.0 3.0 3.0 3.0
Division Summary
Permanent Employees 21.0 21.0 15.0 15.0
Temporary Staffing - - - -
Financial Operations - 01222 Total 21.0 21.0 15.0 15.0
98

Department/Division/Title
2013-14
Revised
Budget
2014-15
Revised
Budget
2015-16
Revised
Budget
2016-17
Adopted
Budget
Personnel (FTE) by Department and Division
Revenue (formerly Business and Revenue Operations) - 01224
Assistant City Treasurer - - 1.0 1.0
Business and Revenue Operations Manager 1.0 1.0 - -
Business License Administrator 1.0 1.0 1.0 1.0
Principal Treasury Analyst - - 1.0 1.0
Treasury Administrator - - 1.0 1.0
Billing and Collections Administrator 1.0 1.0 1.0 1.0
Senior Administrative Analyst - - 1.0 1.0
Accountant - Collections 1.0 1.0 1.0 1.0
Administrative Analyst - 1.0 1.0 1.0
Billing Supervisor - 1.0 1.0 1.0
Utilities Billing Supervisor 1.0 - - -
Treasury Operations Supervisor - - 1.0 1.0
Revenue Collections Supervisor 1.0 - 1.0 1.0
Administrative Staff Assistant 1.0 1.0 1.0 1.0
Billing Specialist - 3.0 3.0 3.0
Revenue Operations Specialist - - 6.0 6.0
Utilities Billing Specialist 3.0 - - -
Revenue Operations Assistant II 4.0 4.0 - -
Senior Revenue Collections Assistant 1.0 - 1.0 1.0
Staff Assistant III 1.0 - - -
Staff Assistant II - 1.0 1.0 1.0
Revenue Operations Assistant I - - 1.0 1.0
Revenue Collections Assistant 3.0 - 5.3 5.3
Division Summary
Permanent Employees 19.0 15.0 29.3 29.3
Temporary Staffing 2.8 - 0.5 0.5
Revenue - 01224 Total 21.8 15.0 29.8 29.8
99

Department/Division/Title
2013-14
Revised
Budget
2014-15
Revised
Budget
2015-16
Revised
Budget
2016-17
Adopted
Budget
Personnel (FTE) by Department and Division
Risk Management - 58229
Risk Manager 1.0 1.0 1.0 1.0
Workers' Compensation Administrator 1.0 1.0 1.0 1.0
Safety Officer 1.0 1.0 1.0 1.0
Supervising Workers' Compensation Claims Examiner 1.0 1.0 1.0 1.0
Liability Claims Adjuster 1.0 1.0 1.0 1.0
Workers' Compensation Claims Examiner 2.0 2.0 2.0 2.0
Risk Management Analyst - - 2.0 2.0
Risk Management Technician 3.0 3.0 2.0 2.0
Workers' Compensation Claims Technician 1.0 1.0 1.0 1.0
Staff Assistant III 1.0 1.0 1.0 1.0
Division Summary
Permanent Employees 12.0 12.0 13.0 13.0
Temporary Staffing - - - -
Risk Management - 58229 Total 12.0 12.0 13.0 13.0
Department Summary
Permanent Employees 71.5 73.0 77.3 77.3
Temporary Staffing 2.8 1.8 1.0 0.7
FINANCE TOTAL 74.3 74.8 78.3 78.0
100

Department/Division/Title
2013-14
Revised
Budget
2014-15
Revised
Budget
2015-16
Revised
Budget
2016-17
Adopted
Budget
Personnel (FTE) by Department and Division
CITY ATTORNEY
City Attorney - 01231
City Attorney 1.0 1.0 1.0 1.0
Assistant City Attorney 1.0 1.0 1.0 1.0
Deputy City Attorney 22.5 22.5 22.5 24.0
Senior Advisor - Municipal Policies, Procedures and Innovation - - 1.0 -
Office Administrator 1.0 1.0 1.0 1.0
Executive Assistant to the City Attorney - 1.0 1.0 1.0
Consumer Affairs Specialist 1.0 1.0 1.0 1.0
Legal Administrative Staff Assistant 1.0 - - -
Investigator - Criminal Division 1.0 1.0 1.0 1.0
Investigator - Consumer Protection Unit 1.0 1.0 1.0 1.0
Administrative Analyst - City Attorney's Office 1.0 1.0 1.0 1.0
Community Liaison - 0.5 1.0 1.0
Legal Assistant 4.0 4.0 4.0 4.0
Paralegal 1.0 1.0 1.0 1.0
Legal Secretary 3.0 3.0 3.0 4.0
Receptionist 1.0 1.0 1.0 1.0
Staff Assistant - City Attorney's Office 1.5 2.0 2.0 2.0
Division Summary
Permanent Employees 41.0 42.0 43.5 45.0
Temporary Staffing 0.1 0.3 0.4 0.7
City Attorney - 01231 Total 41.1 42.3 43.9 45.7
Department Summary
Permanent Employees 41.0 42.0 43.5 45.0
Temporary Staffing 0.1 0.3 0.4 0.7
CITY ATTORNEY TOTAL 41.1 42.3 43.9 45.7
HUMAN RESOURCES
Administrative Services - 01250
Director of Human Resources 1.0 1.0 1.0 1.0
Human Resources Analyst - 1.0 - -
Executive Administrative Assistant 1.0 1.0 1.0 1.0
Staff Assistant II 1.0 1.0 1.0 1.0
Division Summary
Permanent Employees 3.0 4.0 3.0 3.0
Temporary Staffing 0.2 0.2 0.2 0.2
Administrative Services - 01250 Total 3.2 4.2 3.2 3.2
101

Department/Division/Title
2013-14
Revised
Budget
2014-15
Revised
Budget
2015-16
Revised
Budget
2016-17
Adopted
Budget
Personnel (FTE) by Department and Division
Employment and Organizational Development - 01251
Human Resources Manager 1.0 1.0 1.0 1.0
Organizational Development and Training Administrator 1.0 1.0 1.0 1.0
Senior Human Resources Analyst 1.0 1.0 1.0 1.0
Human Resources Analyst 3.0 3.0 4.0 4.0
Organizational Development and Training Coordinator - - - 1.0
Human Resources Specialist 1.0 1.0 - -
Human Resources Technician 2.0 2.0 2.0 2.0
Staff Assistant III 1.0 1.0 1.0 1.0
Division Summary
Permanent Employees 10.0 10.0 10.0 11.0
Temporary Staffing - - - -
Employment and Organizational Development - 01251 Total 10.0 10.0 10.0 11.0
Employee Relations and Benefits - 01252
Human Resources Manager 1.0 1.0 1.0 1.0
Human Resources Systems/Employer-Employee Relations Analyst 1.0 - - - Human Resources Information Systems Analyst (limited term) - 1.0 1.0 1.0
Senior Human Resources Analyst 2.0 3.0 4.0 4.0
Senior Human Resources Analyst - Labor/Employee Relations 1.0 - - -
Human Resources Analyst 1.0 1.0 2.0 2.0
Employee Benefits Specialist - 1.0 1.0 1.0
Employee Benefits Technician 2.0 1.0 1.0 1.0
Staff Assistant III 1.0 1.0 1.0 1.0
Human Resources Assistant 1.0 1.0 1.0 1.0
Division Summary
Permanent Employees 10.0 10.0 12.0 12.0
Temporary Staffing - 0.2 - -
Employee Relations and Benefits - 01252 Total 10.0 10.2 12.0 12.0
Department Summary
Permanent Employees 23.0 24.0 25.0 26.0
Temporary Staffing 0.2 0.4 0.2 0.2
HUMAN RESOURCES TOTAL 23.2 24.4 25.2 26.2
102

Department/Division/Title
2013-14
Revised
Budget
2014-15
Revised
Budget
2015-16
Revised
Budget
2016-17
Adopted
Budget
Personnel (FTE) by Department and Division
INFORMATION SYSTEMS
Administration - 01243
Chief Information Officer 1.0 1.0 1.0 1.0
Director of Special Projects for Information Services - - 1.0 -
Assistant Chief Information Officer - - 1.0 1.0
Principal Administrative Analyst 1.0 - - -
Principal Administrative Analyst - Information Systems - 1.0 1.0 1.0
Administrative Analyst - Information Systems 1.0 1.0 1.0 1.0
Administrative Staff Assistant 1.0 1.0 1.0 1.0
Division Summary
Permanent Employees 4.0 4.0 6.0 5.0
Temporary Staffing - - - -
Administration - 01243 Total 4.0 4.0 6.0 5.0
Systems and Networks - 01244
Systems and Network Manager 1.0 1.0 1.0 1.0
Public Safety Communications and Technology Administrator - 1.0 - -
Principal Network Engineer - 1.0 1.0 1.0
Network Architect 1.0 - - -
Lead Systems Analyst - Library Systems 1.0 1.0 1.0 1.0
Communications Engineer 2.0 2.0 2.0 2.0
Network Engineer 1.0 1.0 1.0 1.0
Systems Administrator 3.0 3.0 3.0 3.0
Systems Policy Engineer 1.0 1.0 1.0 1.0
Communications System Technician - - 1.0 1.0
Computer Support Specialist 1.0 - - -
Division Summary
Permanent Employees 11.0 11.0 11.0 11.0
Temporary Staffing - - - -
Systems and Networks - 01244 Total 11.0 11.0 11.0 11.0
103
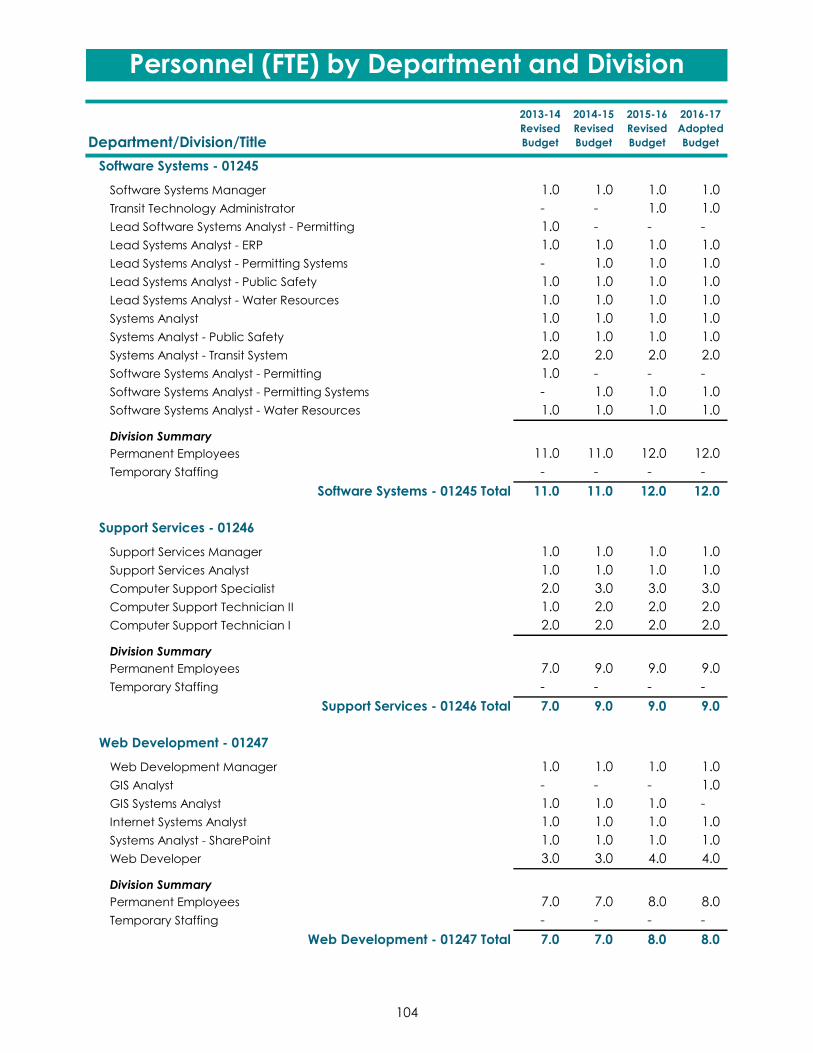
Department/Division/Title
2013-14
Revised
Budget
2014-15
Revised
Budget
2015-16
Revised
Budget
2016-17
Adopted
Budget
Personnel (FTE) by Department and Division
Software Systems - 01245
Software Systems Manager 1.0 1.0 1.0 1.0
Transit Technology Administrator - - 1.0 1.0
Lead Software Systems Analyst - Permitting 1.0 - - -
Lead Systems Analyst - ERP 1.0 1.0 1.0 1.0
Lead Systems Analyst - Permitting Systems - 1.0 1.0 1.0
Lead Systems Analyst - Public Safety 1.0 1.0 1.0 1.0
Lead Systems Analyst - Water Resources 1.0 1.0 1.0 1.0
Systems Analyst 1.0 1.0 1.0 1.0
Systems Analyst - Public Safety 1.0 1.0 1.0 1.0
Systems Analyst - Transit System 2.0 2.0 2.0 2.0
Software Systems Analyst - Permitting 1.0 - - -
Software Systems Analyst - Permitting Systems - 1.0 1.0 1.0
Software Systems Analyst - Water Resources 1.0 1.0 1.0 1.0
Division Summary
Permanent Employees 11.0 11.0 12.0 12.0
Temporary Staffing - - - -
Software Systems - 01245 Total 11.0 11.0 12.0 12.0
Support Services - 01246
Support Services Manager 1.0 1.0 1.0 1.0
Support Services Analyst 1.0 1.0 1.0 1.0
Computer Support Specialist 2.0 3.0 3.0 3.0
Computer Support Technician II 1.0 2.0 2.0 2.0
Computer Support Technician I 2.0 2.0 2.0 2.0
Division Summary
Permanent Employees 7.0 9.0 9.0 9.0
Temporary Staffing - - - -
Support Services - 01246 Total 7.0 9.0 9.0 9.0
Web Development - 01247
Web Development Manager 1.0 1.0 1.0 1.0
GIS Analyst - - - 1.0
GIS Systems Analyst 1.0 1.0 1.0 -
Internet Systems Analyst 1.0 1.0 1.0 1.0
Systems Analyst - SharePoint 1.0 1.0 1.0 1.0
Web Developer 3.0 3.0 4.0 4.0
Division Summary
Permanent Employees 7.0 7.0 8.0 8.0
Temporary Staffing - - - -
Web Development - 01247 Total 7.0 7.0 8.0 8.0
104

Department/Division/Title
2013-14
Revised
Budget
2014-15
Revised
Budget
2015-16
Revised
Budget
2016-17
Adopted
Budget
Personnel (FTE) by Department and Division
Community Broadband - 01248
Community Broadband Manager - 1.0 1.0 -
Broadband Program Administrator 1.0 - - -
Broadband Services Engineer 1.0 1.0 1.0 -
Network Construction Assistant 1.0 1.0 1.0 -
Broadband Program Analyst 1.0 1.0 - -
Community Broadband Analyst - - 1.0 -
Division Summary
Permanent Employees 4.0 4.0 4.0 -
Temporary Staffing - - - -
Community Broadband - 01248 Total 4.0 4.0 4.0 -
Community Broadband - 28248
Community Broadband Manager - - - 1.0
Broadband Services Engineer - - - 1.0
Network Construction Assistant - - - 1.0
Community Broadband Analyst - - - 1.0
Division Summary
Permanent Employees - - - 4.0
Temporary Staffing - - - -
Community Broadband - 28248 Total - - - 4.0
Department Summary
Permanent Employees 44.0 46.0 50.0 49.0
Temporary Staffing - - - -
INFORMATION SYSTEMS TOTAL 44.0 46.0 50.0 49.0
PLANNING AND COMMUNITY DEVELOPMENT
Administration - 01265
Director of Planning and Community Development 1.0 1.0 1.0 1.0
Assistant Director of Planning and Community Development 1.0 1.0 1.0 1.0
Parking Manager - 1.0 - -
City Urban Designer - - 1.0 1.0
Deputy Director - Special Projects 1.0 - - -
Special Projects and Communication Administrator - 1.0 - -
Principal Planning and Community Development Analyst 1.0 1.0 1.0 1.0
Neighborhood Preservation Coordinator - - - 1.0
Executive Administrative Assistant 1.0 1.0 1.0 1.0
Division Summary
Permanent Employees 5.0 6.0 5.0 6.0
Temporary Staffing - - - -
Administration - 01265 Total 5.0 6.0 5.0 6.0
105

Department/Division/Title
2013-14
Revised
Budget
2014-15
Revised
Budget
2015-16
Revised
Budget
2016-17
Adopted
Budget
Personnel (FTE) by Department and Division
City Planning/Development Review - 01266
Planning Manager 1.0 1.0 1.0 1.0
Principal Urban Designer 1.0 1.0 1.0 1.0
Special Projects Manager 1.0 1.0 - -
Principal Planner 2.0 2.0 4.0 4.0
Environmental Planner - - 1.0 1.0
Senior Planner 3.0 3.0 5.0 5.0
Associate Planner 8.0 8.0 8.0 8.0
Assistant Planner 1.0 1.0 1.6 1.6
Administrative Analyst - - 1.0 1.0
City Planning Division Assistant 1.0 1.0 - -
Staff Assistant III 2.0 2.0 3.0 3.0
City Planning Staff Assistant 1.0 1.0 1.0 1.0
Division Summary
Permanent Employees 21.0 21.0 26.6 26.6
Temporary Staffing - - - -
City Planning/Development Review - 01266 Total 21.0 21.0 26.6 26.6
Mobility (formerly Strategic and Transportation Planning) - 01267
Mobility Division Manager - - 1.0 -
Community and Strategic Planning Manager 1.0 1.0 - -
Mobility Manager - - - 1.0
Deputy Director - Special Projects 1.0 - - -
Principal Transportation Planner 1.0 1.0 2.0 2.0
Principal Planner 1.0 1.0 - -
Transportation Demand Program Manager 1.0 1.0 1.0 1.0
Environmental Planner 1.0 1.0 - -
Senior Transportation Planner 1.0 1.0 1.0 1.0
Senior Transportation Planner - Bicycle Program - - 1.0 1.0
Senior Transportation Planner - Bicycle and Pedestrian - 1.0 - -
Senior Planner 3.0 3.0 1.0 1.0
Transportation Management Coordinator 1.0 1.0 1.0 1.0
Bikeshare Coordinator - - 1.0 1.0
Transportation Planning Associate 2.0 2.0 2.0 2.0
Associate Planner 1.0 1.0 1.0 1.0
Transportation Planning Assistant 1.0 1.0 1.0 1.0
Administrative Analyst 1.0 1.0 1.0 1.0 Transportation Management Specialist (1.0 FTE is limited term) 1.0 1.0 2.5 2.5
Staff Assistant III 1.0 1.0 1.0 1.0
Division Summary
Permanent Employees 18.0 18.0 17.5 17.5
Temporary Staffing - - - -
Mobility - 01267 Total 18.0 18.0 17.5 17.5
106

Department/Division/Title
2013-14
Revised
Budget
2014-15
Revised
Budget
2015-16
Revised
Budget
2016-17
Adopted
Budget
Personnel (FTE) by Department and Division
Building and Safety - 01321
Building Officer 1.0 1.0 1.0 1.0
Assistant Building Officer 1.0 1.0 1.0 1.0
Plan Check Supervisor 1.0 1.0 1.0 1.0
Building Projects Engineer 1.0 1.0 1.0 1.0
Principal Plan Check Engineer 1.0 1.0 1.0 1.0
Senior Plan Check Engineer 3.0 3.0 4.0 4.0
Inspection Supervisor 1.0 1.0 1.0 1.0
Senior Administrative Analyst 1.0 1.0 1.0 1.0
Lead Combination Building Inspector 1.0 1.0 1.0 1.0
Building and Safety Supervisor 1.0 1.0 1.0 1.0
Assistant Plan Check Engineer 1.0 1.0 1.0 1.0
Combination Building Inspector I/II/III 10.0 10.0 10.0 10.0
Plans Examiner I/II/III - Electrical 1.0 1.0 - -
Plans Examiner I/II/III - Mechanical/Plumbing 1.0 1.0 1.0 1.0
Lead Building and Safety Permit Specialist - - 1.0 1.0
Administrative Staff Assistant 1.0 1.0 1.0 1.0
Building and Safety Permit Specialist I/II 7.0 7.0 6.0 6.0
Revenue Operations Assistant II 1.0 1.0 1.0 1.0
Staff Assistant II 1.0 1.0 1.0 1.0
Division Summary
Permanent Employees 35.0 35.0 35.0 35.0
Temporary Staffing - - - -
Building and Safety - 01321 Total 35.0 35.0 35.0 35.0
Code Enforcement (formerly Code Compliance) - 01322
Code Enforcement Manager 1.0 1.0 1.0 1.0
Senior Administrative Analyst - - 1.0 1.0
Code Enforcement Supervisor 1.0 1.0 1.0 1.0
Lead Code Enforcement Officer 2.0 2.0 2.0 2.0
Administrative Analyst - - 1.0 1.0
Code Enforcement Officer I/II 8.0 9.0 11.0 11.0
Administrative Staff Assistant 1.0 1.0 1.0 1.0
Code Enforcement Specialist 2.0 2.0 2.0 2.0
Staff Assistant II 1.0 1.0 1.0 1.0
Division Summary
Permanent Employees 16.0 17.0 21.0 21.0
Temporary Staffing - - - -
Code Enforcement - 01322 Total 16.0 17.0 21.0 21.0
107
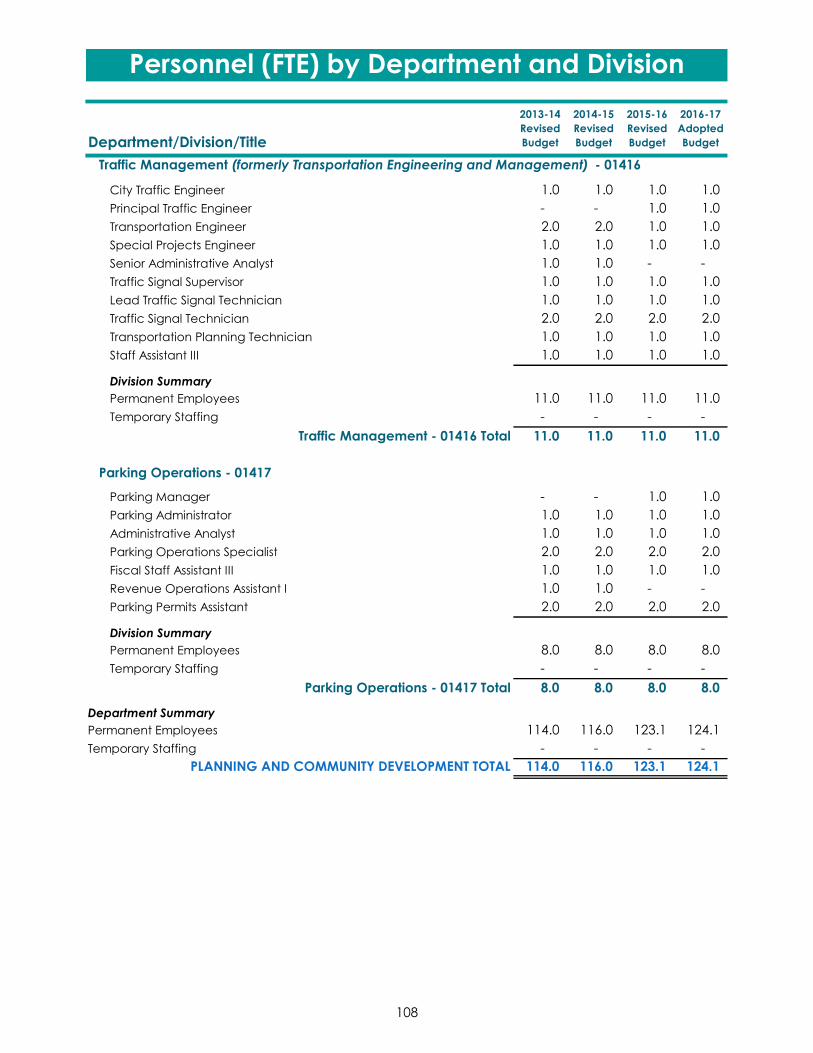
Department/Division/Title
2013-14
Revised
Budget
2014-15
Revised
Budget
2015-16
Revised
Budget
2016-17
Adopted
Budget
Personnel (FTE) by Department and Division
Traffic Management (formerly Transportation Engineering and Management) - 01416
City Traffic Engineer 1.0 1.0 1.0 1.0
Principal Traffic Engineer - - 1.0 1.0
Transportation Engineer 2.0 2.0 1.0 1.0
Special Projects Engineer 1.0 1.0 1.0 1.0
Senior Administrative Analyst 1.0 1.0 - -
Traffic Signal Supervisor 1.0 1.0 1.0 1.0
Lead Traffic Signal Technician 1.0 1.0 1.0 1.0
Traffic Signal Technician 2.0 2.0 2.0 2.0
Transportation Planning Technician 1.0 1.0 1.0 1.0
Staff Assistant III 1.0 1.0 1.0 1.0
Division Summary
Permanent Employees 11.0 11.0 11.0 11.0
Temporary Staffing - - - -
Traffic Management - 01416 Total 11.0 11.0 11.0 11.0
Parking Operations - 01417
Parking Manager - - 1.0 1.0
Parking Administrator 1.0 1.0 1.0 1.0
Administrative Analyst 1.0 1.0 1.0 1.0
Parking Operations Specialist 2.0 2.0 2.0 2.0
Fiscal Staff Assistant III 1.0 1.0 1.0 1.0
Revenue Operations Assistant I 1.0 1.0 - -
Parking Permits Assistant 2.0 2.0 2.0 2.0
Division Summary
Permanent Employees 8.0 8.0 8.0 8.0
Temporary Staffing - - - -
Parking Operations - 01417 Total 8.0 8.0 8.0 8.0
Department Summary
Permanent Employees 114.0 116.0 123.1 124.1
Temporary Staffing - - - -
PLANNING AND COMMUNITY DEVELOPMENT TOTAL 114.0 116.0 123.1 124.1
108

Department/Division/Title
2013-14
Revised
Budget
2014-15
Revised
Budget
2015-16
Revised
Budget
2016-17
Adopted
Budget
Personnel (FTE) by Department and Division
POLICE
Administrative Services - 01304
Police Chief 1.0 1.0 1.0 1.0
Deputy Police Chief 1.0 1.0 1.0 1.0
Police Lieutenant 2.0 2.0 2.0 2.0
Police Sergeant 5.0 4.0 4.0 4.0
Senior Administrative Analyst 2.0 2.0 2.0 2.0
Jail Management Supervisor 1.0 - - -
Police Services Management Supervisor 1.0 - - -
Police Officer 7.0 6.0 6.0 6.0
Lead Crime Prevention Coordinator 1.0 - - -
Crime Prevention Coordinator 3.0 - - -
CLETS Supervisor 1.0 - - -
Police Records Supervisor 3.0 - - -
Property/Evidence Supervisor 1.0 - - -
Police Range Master - - 1.0 1.0
Fiscal Staff Assistant III 1.0 1.0 1.0 1.0
Police Personnel Services Technician 2.0 3.0 3.0 3.0
Lead Jailer 2.0 - - -
Jailer 12.0 - - -
Police Property Evidence Clerk 2.0 - - -
Police Records Technician 15.0 - - -
Staff Assistant III 4.0 3.0 3.0 3.0
Jail Services Attendant 2.0 - - -
Division Summary
Permanent Employees 69.0 23.0 24.0 24.0
Temporary Staffing 6.0 6.0 6.0 6.0
Administrative Services - 01304 Total 75.0 29.0 30.0 30.0
Animal Control Unit - 01302
Police Sergeant 1.0 - - -
Animal Care and Control Administrator 1.0 - - -
Senior Animal Control Officer 1.0 - - -
Animal Control Officer 6.0 - - -
Animal Care Attendant 2.0 - - -
Staff Assistant II 1.0 - - -
Division Summary
Permanent Employees 12.0 - - -
Temporary Staffing - - - -
Animal Control Unit - 01302 Total 12.0 - - -
109

Department/Division/Title
2013-14
Revised
Budget
2014-15
Revised
Budget
2015-16
Revised
Budget
2016-17
Adopted
Budget
Personnel (FTE) by Department and Division
Operations Division - 01305
Police Captain 1.0 1.0 1.0 1.0
Police Lieutenant 5.0 4.0 4.0 4.0
Police Sergeant 18.0 14.0 15.0 15.0
Public Services Administrator - 1.0 1.0 1.0
Police Services Management Supervisor 1.0 - - -
Public Services Officer Supervisor 2.0 2.0 2.0 2.0
Police Officer 94.0 85.0 90.0 93.0
Communications Operator - Police 18.0 - - -
Lead Community Services Officer II 1.0 1.0 1.0 1.0
Community Services Officer 8.0 8.0 8.0 8.0
Lead Public Services Officer 3.0 3.0 3.0 3.0
Staff Assistant III 1.0 2.0 2.0 2.0
Public Services Officer 30.0 30.0 30.0 30.0
Court Services Coordinator 1.0 - - -
Staff Assistant II 2.0 1.0 - -
Division Summary
Permanent Employees 185.0 152.0 157.0 160.0
Temporary Staffing 3.8 - - -
Operations Division - 01305 Total 188.8 152.0 157.0 160.0
110

Department/Division/Title
2013-14
Revised
Budget
2014-15
Revised
Budget
2015-16
Revised
Budget
2016-17
Adopted
Budget
Personnel (FTE) by Department and Division
Strategic Services (formerly Special Enforcement) - 01306
Police Captain 1.0 1.0 1.0 1.0
Police Lieutenant 4.0 6.0 5.0 5.0
Police Sergeant 3.0 7.0 7.0 7.0
Public Services Administrator - Jail - 1.0 1.0 1.0
Public Services Administrator - 1.0 1.0 1.0
Jail Supervisor - - 1.0 1.0
Jail Management Supervisor - 1.0 - -
Police Officer 36.0 37.0 37.0 37.0
Lead Crime Prevention Coordinator - 1.0 1.0 1.0
Crime Prevention Coordinator - 3.0 3.0 3.0
Traffic Services Supervisor 3.0 3.0 3.0 3.0
Animal Control Supervisor - - 1.0 1.0
Lead Animal Control Officer - 1.0 1.0 1.0
Lead Traffic Services Officer 2.0 2.0 2.0 2.0
Lead Jailer - 2.0 2.0 2.0
Crossing Guard Supervisor 1.0 1.0 1.0 1.0
Parking Citation Review Officer 1.0 1.0 1.0 1.0
Jailer - 11.0 11.0 11.0
Traffic Services Officer 31.0 31.0 31.0 31.0
Animal Control Officer - 7.0 6.0 6.0
Staff Assistant III 2.0 2.0 2.0 2.0
Animal Care Attendant - 2.0 2.0 2.0
Staff Assistant II - 2.0 2.0 2.0
Jail Services Attendant - 2.0 2.0 2.0
Lead Crossing Guard 1.0 1.0 1.0 1.0
Division Summary
Permanent Employees 85.0 126.0 125.0 125.0
Temporary Staffing 19.0 22.8 22.8 22.8
Strategic Services - 01306 Total 104.0 148.8 147.8 147.8
111

Department/Division/Title
2013-14
Revised
Budget
2014-15
Revised
Budget
2015-16
Revised
Budget
2016-17
Adopted
Budget
Personnel (FTE) by Department and Division
Criminal Investigations - 01307
Police Captain 1.0 1.0 1.0 1.0
Police Lieutenant 2.0 1.0 1.0 1.0
Police Sergeant 4.0 6.0 6.0 6.0
Public Services Administrator - Forensics - 1.0 1.0 1.0
Police Records Administrator - 1.0 1.0 1.0
Forensic Supervisor - - 1.0 1.0
Forensic Section Supervisor 1.0 - - -
Police Officer 30.0 39.0 39.0 39.0
Youth Services Counselor 1.0 - - -
Lead Forensic Specialist 1.0 1.0 - -
Criminal Investigations Support Specialist 1.0 1.0 1.0 1.0
Forensic Specialist 6.0 7.0 7.0 7.0
Youth and Family Services Support Coordinator - 1.0 1.0 1.0
Crime Analyst I 2.0 2.0 2.0 2.0
Police Records Supervisor - 3.0 3.0 3.0
Property/Evidence Supervisor - 1.0 1.0 1.0
Forensic Technician 1.0 1.0 1.0 1.0
Lead Police Records Technician - 2.0 3.0 3.0
Police Property Evidence Clerk - 3.0 3.0 3.0
Police Records Technician - 13.0 12.0 12.0
Staff Assistant III - - 1.0 1.0
Court Services Coordinator - 1.0 1.0 1.0
Staff Assistant II 1.0 1.0 - -
Division Summary
Permanent Employees 51.0 86.0 86.0 86.0
Temporary Staffing 2.6 2.6 2.6 2.6
Criminal Investigations - 01307 Total 53.6 88.6 88.6 88.6
Harbor Unit - 30623
Pier and Harbor Services Supervisor - 1.0 1.0 1.0
Pier and Harbor Services Officer 7.0 6.0 6.0 6.0
Division Summary
Permanent Employees 7.0 7.0 7.0 7.0
Temporary Staffing 2.3 2.3 2.3 2.3
Harbor Unit - 30623 Total 9.3 9.3 9.3 9.3
Department Summary
Permanent Employees 409.0 394.0 399.0 402.0
Temporary Staffing 33.7 33.7 33.7 33.7
POLICE TOTAL 442.7 427.7 432.7 435.7
112

Department/Division/Title
2013-14
Revised
Budget
2014-15
Revised
Budget
2015-16
Revised
Budget
2016-17
Adopted
Budget
Personnel (FTE) by Department and Division
FIRE
Administration - 01312
Fire Chief 1.0 1.0 1.0 1.0
Deputy Fire Chief 2.0 2.0 2.0 2.0
Fire Captain 1.0 1.0 1.0 1.0
Fire Captain (Vehicle Maintenance Coordinator) 1.0 1.0 1.0 1.0
Fire Captain (Paramedic Coordinator) 1.0 1.0 1.0 1.0
Principal Administrative Analyst - Fire 1.0 1.0 1.0 1.0
EMS Coordinator 1.0 1.0 1.0 1.0
Administrative Analyst - - - 1.0
Communications Center Supervisor - Fire 1.0 - - -
Fire Safety Coordinator 1.0 1.0 1.0 1.0
Communications Operator - Fire 8.0 - - -
Assistant Administrative Analyst - 1.0 1.0 -
Executive Administrative Assistant 1.0 1.0 1.0 1.0
Fiscal Staff Assistant II 1.0 1.0 1.0 1.0
Staff Assistant III 1.0 1.0 1.0 1.0
Fire Equipment Specialist - 0.8 0.8 0.8
Division Summary
Permanent Employees 21.0 13.8 13.8 13.8
Temporary Staffing - - - -
Administration - 01312 Total 21.0 13.8 13.8 13.8
Fire Suppression and Rescue - 01313
Battalion Chief 3.0 3.0 3.0 3.0
Fire Captain 21.0 21.0 21.0 21.0
Fire Engineer 21.0 21.0 24.0 24.0
Firefighter 48.0 54.0 51.0 57.0
Division Summary
Permanent Employees 93.0 99.0 99.0 105.0
Temporary Staffing - - - -
Fire Suppression and Rescue - 01313 Total 93.0 99.0 99.0 105.0
113

Department/Division/Title
2013-14
Revised
Budget
2014-15
Revised
Budget
2015-16
Revised
Budget
2016-17
Adopted
Budget
Personnel (FTE) by Department and Division
Fire Prevention - 01314
Fire Marshal 1.0 1.0 1.0 1.0
Assistant Fire Marshal 1.0 1.0 1.0 1.0
Assistant Fire Marshal - Hazardous Materials 1.0 1.0 1.0 1.0
Senior Fire Inspector 2.0 2.0 2.0 2.0
Fire Inspector 2.0 2.0 2.0 2.0
Fire Code Enforcement Officer I/II 3.0 4.0 4.0 4.0
Environmental Compliance Specialist 1.0 1.0 1.0 1.0
Environmental Programs Analyst - Hazardous Materials 1.0 1.0 1.0 1.0
Business Assistant 1.0 1.0 1.0 1.0
Division Summary
Permanent Employees 13.0 14.0 14.0 14.0
Temporary Staffing - - - -
Fire Prevention - 01314 Total 13.0 14.0 14.0 14.0
Training - 01315
Battalion Chief (Division Chief) 1.0 1.0 1.0 1.0
Fire Captain (Training) 1.0 1.0 1.0 1.0
Staff Assistant II - 1.0 1.0 1.0
Division Summary
Permanent Employees 2.0 3.0 3.0 3.0
Temporary Staffing - - - -
Training - 01315 Total 2.0 3.0 3.0 3.0
Department Summary
Permanent Employees 129.0 129.8 129.8 135.8
Temporary Staffing - - - -
FIRE TOTAL 129.0 129.8 129.8 135.8
114

Department/Division/Title
2013-14
Revised
Budget
2014-15
Revised
Budget
2015-16
Revised
Budget
2016-17
Adopted
Budget
Personnel (FTE) by Department and Division
COMMUNITY AND CULTURAL SERVICES
Administration and Planning Services - 01501
Director of Community and Cultural Services 1.0 1.0 1.0 1.0
Assistant Director of Community and Cultural Services 1.0 1.0 1.0 1.0 Project Manager - Wellbeing (limited term) 1.0 1.0 1.0 1.0
Principal Administrative Analyst - - 1.0 1.0
Community Use Administrator 1.0 1.0 - -
Senior Administrative Analyst 1.0 1.0 1.0 1.0
Senior Administrative Analyst - Parks and Community Facility Planning 1.0 1.0 1.0 1.0 Administrative Analyst (limited term) 1.0 1.0 1.0 1.0
Executive Administrative Assistant 1.0 1.0 1.0 1.0
Volunteer Program Coordinator - - - 0.5
Division Summary
Permanent Employees 8.0 8.0 8.0 8.5
Temporary Staffing - - - 1.0
Administration and Planning Services - 01501 Total 8.0 8.0 8.0 9.5
Human Services - 01262
Human Services Manager 1.0 1.0 1.0 1.0
Human Services Administrator - Fiscal - 1.0 1.0 1.0
Human Services Administrator - Neighborhood and Parks Initiative 1.0 1.0 1.0 1.0
Human Services Administrator - Youth and Families - - 1.0 1.0
Human Services Administrator 2.0 1.0 1.0 1.0
Senior Administrative Analyst 1.0 1.0 - -
Senior Administrative Analyst - Child and Family Resources 1.0 1.0 2.0 2.0
Senior Administrative Analyst - Homeless Services 2.0 2.0 2.0 2.0
Senior Administrative Analyst - Human Services/Fiscal 1.0 1.0 1.0 1.0
Senior Human Services Program Analyst 2.0 2.0 1.0 1.0
Principal Community Services Supervisor - Youth/Family Services - - 1.0 1.0
Principal Community Services Supervisor 2.0 2.0 2.0 2.0
Administrative Analyst 2.0 2.0 2.0 1.0
Administrative Analyst - Homeless Services 1.0 1.0 1.0 1.0
Administrative Analyst - Youth and Family Services - - - 1.0
Community Services Program Supervisor - Youth/Family Services 5.0 5.0 4.0 4.0
Administrative Staff Assistant 2.0 2.0 2.0 2.0
Community Services Program Coordinator 12.3 12.3 12.3 12.3
Staff Assistant III 5.8 5.8 5.8 5.8
Community Services Program Specialist 15.6 15.6 15.6 15.6
Division Summary
Permanent Employees 56.7 56.7 56.7 56.7
Temporary Staffing 16.5 16.5 15.8 15.8
Human Services - 01262 Total 73.2 73.2 72.5 72.5
115

Department/Division/Title
2013-14
Revised
Budget
2014-15
Revised
Budget
2015-16
Revised
Budget
2016-17
Adopted
Budget
Personnel (FTE) by Department and Division
Beach Administration - 11522
Division Summary
Permanent Employees - - - -
Temporary Staffing 0.6 0.6 0.6 0.6
Beach Administration - 11522 Total 0.6 0.6 0.6 0.6
Beach House Operations - 11523
Beach House Venue Manager 1.0 1.0 1.0 1.0
Administrative Analyst 1.0 1.0 1.0 1.0
Sales and Marketing Coordinator 1.0 1.0 1.0 1.0
Beach Recreation Supervisor 1.0 1.0 1.0 1.0
Event Coordinator 1.0 1.5 1.5 1.5
Guest Services Coordinator 1.0 1.0 1.0 1.0
Venue Services Assistant - 2.0 2.0 2.0
Aquatics Program Coordinator - - 0.8 1.0
Division Summary
Permanent Employees 6.0 8.5 9.3 9.5
Temporary Staffing 8.3 5.3 4.9 4.9
Beach House Operations - 11523 Total 14.3 13.8 14.2 14.4
Beach House Operations - 24523
Division Summary
Permanent Employees - - - -
Temporary Staffing - - - -
Beach House Operations - 24523 Total - - - -
116

Department/Division/Title
2013-14
Revised
Budget
2014-15
Revised
Budget
2015-16
Revised
Budget
2016-17
Adopted
Budget
Personnel (FTE) by Department and Division
Community Recreation - 01544
Community Recreation Manager 1.0 1.0 1.0 1.0
Community Recreation Administrator - - - 1.0
Community Recreation Systems Coordinator 1.0 1.0 1.0 1.0
Senior Administrative Analyst 1.0 1.0 1.0 1.0
Senior Administrative Analyst - Community Use 1.0 1.0 1.0 1.0
Principal Community Services Supervisor 2.0 2.0 2.0 2.0
Principal Community Services Supervisor - Aquatics 1.0 1.0 1.0 1.0
Community Services Program Supervisor 3.0 3.0 3.0 2.0
Community Services Program Supervisor - Community Sports 1.0 1.0 1.0 1.0
Administrative Staff Assistant 1.0 1.0 1.0 1.0
Aquatics Site Supervisor 3.5 3.5 3.5 4.0
Community Services Program Coordinator 3.0 3.0 3.0 2.0
Staff Assistant III 4.0 4.0 4.0 4.0
Chief Pool Lifeguard 2.4 2.4 2.4 2.4
Guest Services Assistant 1.0 1.0 2.2 2.2
Staff Assistant II 0.6 0.6 0.6 0.6
Community Garden Program Specialist - - - 0.5
Community Services Program Specialist 3.4 3.4 3.4 3.4
Swim Instructor/Lifeguard 2.4 2.4 - -
Senior Lifeguard - - 2.4 2.4
Division Summary
Permanent Employees 32.3 32.3 33.5 33.5
Temporary Staffing 29.7 30.5 29.3 31.1
Community Recreation - 01544 Total 62.0 62.8 62.8 64.6
Cultural Affairs - 01560
Cultural Affairs Manager 1.0 1.0 1.0 1.0
Cultural Affairs Administrator 1.0 1.0 1.0 1.0
Senior Administrative Analyst 1.0 1.0 1.0 1.0
Cultural Affairs Venue Supervisor - - 1.0 1.0
Cultural Affairs Supervisor 4.0 4.0 3.0 3.0
Cultural Affairs Coordinator - 0.5 0.5 0.5
Staff Assistant III 1.0 1.0 1.0 1.0 Event Attendant II (0.5 FTE is limited term) 0.8 1.0 1.0 1.5
Division Summary
Permanent Employees 8.8 9.5 9.5 10.0
Temporary Staffing 0.7 0.2 0.2 0.2
Cultural Affairs - 01560 Total 9.5 9.7 9.7 10.2
Department Summary
Permanent Employees 111.8 115.0 117.0 118.2
Temporary Staffing 55.7 53.0 50.8 53.6
COMMUNITY AND CULTURAL SERVICES TOTAL 167.5 168.0 167.8 171.8
117

Department/Division/Title
2013-14
Revised
Budget
2014-15
Revised
Budget
2015-16
Revised
Budget
2016-17
Adopted
Budget
Personnel (FTE) by Department and Division
LIBRARY
Administration and Facilities - 01613
Director of Library Services/City Librarian 1.0 1.0 1.0 1.0
Assistant City Librarian 1.0 1.0 1.0 1.0
Senior Administrative Analyst - Library Administrative Services - - - 1.0
Senior Administrative Analyst - Library Fiscal Services Coordinator - 1.0 1.0 1.0
Administrative Analyst - Library Administrative Services 1.0 1.0 1.0 -
Administrative Analyst - Library Fiscal Services Coordinator 1.0 - - -
Executive Administrative Assistant - - - 1.0
Library Services Officer Supervisor 1.0 1.0 1.0 1.0
Staff Assistant III 1.0 1.0 1.0 1.0
Library Assistant II 0.5 0.5 0.5 -
Library Services Officer 4.0 4.0 4.0 4.0
Division Summary
Permanent Employees 10.5 10.5 10.5 11.0
Temporary Staffing 5.4 5.3 4.9 4.9
Administration and Facilities - 01613 Total 15.9 15.8 15.4 15.9
Information Management - 01614
Principal Librarian - Information Management 1.0 1.0 1.0 1.0
Librarian III - Information Management 1.0 1.0 1.0 1.0
Librarian II 1.0 1.0 1.0 1.0
Librarian I 2.0 2.0 2.0 2.0
Library Assistant III 2.0 2.0 2.0 2.0
Library Assistant II 3.5 3.5 3.5 4.5
Division Summary
Permanent Employees 10.5 10.5 10.5 11.5
Temporary Staffing 20.2 20.0 5.5 5.5
Information Management - 01614 Total 30.7 30.5 16.0 17.0
Reference Services - 01615
Principal Librarian - Reference Services 1.0 1.0 1.0 1.0
Librarian III - Reference Services 1.0 1.0 1.0 1.0
Librarian II 2.0 2.0 2.0 2.0
Circulation Supervisor 1.0 1.0 1.0 1.0
Librarian I 6.0 6.0 6.0 5.0
Library Assistant III 1.0 1.0 1.0 1.0
Library Assistant II 9.0 9.0 9.0 8.0
Division Summary
Permanent Employees 21.0 21.0 21.0 19.0
Temporary Staffing 5.3 4.7 19.2 19.2
Reference Services - 01615 Total 26.3 25.7 40.2 38.2
118

Department/Division/Title
2013-14
Revised
Budget
2014-15
Revised
Budget
2015-16
Revised
Budget
2016-17
Adopted
Budget
Personnel (FTE) by Department and Division
Public and Branch Services - 01616
Principal Librarian - Public and Branch Services 1.0 1.0 1.0 1.0
Librarian III 2.0 2.0 2.0 1.0
Librarian III - Branch Services 3.0 3.0 3.0 4.0
Librarian III - Youth Services 1.0 1.0 1.0 1.0
Librarian II 4.0 4.0 4.0 4.0
Librarian I 8.5 8.5 8.5 10.0
Library Assistant III 1.0 1.0 1.0 1.0
Library Assistant II 8.0 8.0 8.0 8.0
Division Summary
Permanent Employees 28.5 28.5 28.5 30.0
Temporary Staffing 10.9 10.5 10.9 10.9
Public and Branch Services - 01616 Total 39.4 39.0 39.4 40.9
Department Summary
Permanent Employees 70.5 70.5 70.5 71.5
Temporary Staffing 41.8 40.5 40.5 40.5
LIBRARY TOTAL 112.3 111.0 111.0 112.0
PUBLIC WORKS
Administrative Services - 01401
Director of Public Works/Airport Director 1.0 1.0 1.0 1.0
Assistant Director of Public Works 1.0 1.0 1.0 1.0
Principal Administrative Analyst 2.0 2.0 2.0 2.0
Executive Administrative Assistant 1.0 1.0 1.0 1.0
Division Summary
Permanent Employees 5.0 5.0 5.0 5.0
Temporary Staffing - - - -
Administrative Services - 01401 Total 5.0 5.0 5.0 5.0
119

Department/Division/Title
2013-14
Revised
Budget
2014-15
Revised
Budget
2015-16
Revised
Budget
2016-17
Adopted
Budget
Personnel (FTE) by Department and Division
Civil Engineering - 01402
City Engineer 1.0 1.0 1.0 1.0
Principal Civil Engineer 3.0 3.0 3.0 3.0
Supervising Civil Engineer 1.0 - - -
CIP Project Manager 1.0 1.0 1.0 1.0
Civil Engineer 6.0 6.0 6.0 6.0
Engineering Support Services Supervisor 1.0 1.0 1.0 1.0
Civil Engineering Associate 4.0 4.0 4.0 4.0
Public Works Construction Specialist 1.0 1.0 1.0 1.0
Civil Engineering Assistant 1.0 - - -
Administrative Analyst - Engineering 1.0 1.0 1.0 1.0
Senior Public Works Inspector 3.0 3.0 3.0 3.0
Public Works Utility Inspector 1.0 1.0 - -
Public Works Inspector - - 1.0 1.0
Engineering Technician 2.0 1.0 1.0 1.0
Project Support Assistant 3.0 3.0 3.0 3.0
Permit Specialist 1.0 1.0 1.0 1.0
Division Summary
Permanent Employees 30.0 27.0 27.0 27.0
Temporary Staffing - - - -
Civil Engineering - 01402 Total 30.0 27.0 27.0 27.0
Architecture Services - 01403
City Architect 1.0 1.0 1.0 1.0
Senior Architect 1.0 1.0 1.0 2.0
Supervising Civil Engineer - - - 1.0
Architect 2.0 2.0 2.0 1.0
CIP Project Manager 2.0 2.0 2.0 1.0
Civil Engineer 1.0 1.0 1.0 -
Project Manager 1.0 1.0 1.0 1.0
Architectural Associate 2.0 3.0 3.0 2.0
Senior Administrative Analyst - Architecture 1.0 1.0 1.0 1.0 Public Works Construction Specialist (1.0 FTE is limited term) - - - 3.0
Senior Drafting Technician 1.0 1.0 1.0 1.0
Project Support Assistant 3.0 3.0 3.0 3.0
Division Summary
Permanent Employees 15.0 16.0 16.0 17.0
Temporary Staffing - - - -
Architecture Services - 01403 Total 15.0 16.0 16.0 17.0
120

Department/Division/Title
2013-14
Revised
Budget
2014-15
Revised
Budget
2015-16
Revised
Budget
2016-17
Adopted
Budget
Personnel (FTE) by Department and Division
Street and Fleet Services - 01421
Street and Fleet Services Manager 1.0 1.0 1.0 1.0
Senior Administrative Analyst 1.0 1.0 1.0 1.0
Administrative Analyst 1.0 1.0 1.0 1.0
Electrical Crew Leader - - - 1.0
Street Services Supervisor 2.0 2.0 2.0 2.0
Traffic Painter Crew Leader - - - 1.0
Street Services Crew Leader 3.0 3.0 3.0 3.0
Electrician II - - - 1.0
Lead Parking Meter Technician 1.0 1.0 1.0 1.0
Lead Traffic Painter 1.0 1.0 1.0 -
Concrete Finisher 3.0 3.0 3.0 3.0
Street Services Worker II 3.0 3.0 3.0 3.0
Parking Meter Technician 2.0 2.0 2.0 2.0
Traffic Painter 6.0 6.0 6.0 5.0
Street Services Worker I 5.0 6.0 6.0 7.0
Staff Assistant II 1.0 1.0 1.0 1.0
Maintenance Worker - - - 1.0
Trades Intern - - 3.0 3.0
Division Summary
Permanent Employees 30.0 31.0 34.0 37.0
Temporary Staffing 0.9 - - -
Street and Fleet Services - 01421 Total 30.9 31.0 34.0 37.0
Airport - 33431
Airport Manager 1.0 1.0 1.0 1.0
Airport Operations Administrator 1.0 - - -
Administrative Analyst 1.0 1.0 1.0 1.0
Airport Operations Analyst - 1.0 1.0 1.0
Airport Operations Specialist - 1.0 1.0 1.0
Business Assistant 2.0 2.0 2.0 2.0
Airport Noise/Operations Specialist 2.0 - - -
Staff Assistant III 1.0 1.0 1.0 1.0
Staff Assistant II - - 1.0 1.0
Division Summary
Permanent Employees 8.0 7.0 8.0 8.0
Temporary Staffing 0.5 1.4 0.9 0.9
Airport - 33431 Total 8.5 8.4 8.9 8.9
121

Department/Division/Title
2013-14
Revised
Budget
2014-15
Revised
Budget
2015-16
Revised
Budget
2016-17
Adopted
Budget
Personnel (FTE) by Department and Division
Resource Recovery and Recycling - 27441
Resource Recovery and Recycling Manager 1.0 1.0 1.0 1.0
Resource Recovery and Recycling Administrator 1.0 1.0 1.0 1.0
Principal Public Works Analyst 1.0 1.0 1.0 1.0
Resource Recovery and Recycling Collections Superintendent 1.0 1.0 1.0 1.0
Recycling Coordinator 1.0 1.0 1.0 1.0
Administrative Analyst 1.0 1.0 1.0 1.0
Zero Waste Coordinator 1.0 1.0 1.0 1.0
Resource Recovery and Recycling Supervisor 3.0 3.0 5.0 5.0
Resource Recovery and Recycling Business Supervisor 1.0 1.0 1.0 1.0
Resource Recovery and Recycling Safety and Training Officer - - 1.0 1.0
Resource Recovery and Recycling Crew Leader 3.0 3.0 - -
Lead Resource Recovery and Recycling Billing Specialist 1.0 1.0 1.0 1.0
Motor Sweeper Operator 6.0 6.0 6.0 7.0
Resource Recovery and Recycling Billing Specialist 1.0 1.0 1.0 1.0
Hazardous Materials Technician 1.0 1.0 1.0 1.0
Lead Customer Services Assistant 1.0 1.0 1.0 1.0
Staff Assistant III 1.0 1.0 1.0 1.0
Resource Recovery and Recycling Equipment Operator 35.0 37.4 39.4 40.4
Customer Services Assistant 1.0 1.0 1.0 1.0
Dispatcher 3.0 3.0 3.0 3.0
Equipment Operator I 6.0 6.0 6.0 5.0
Maintenance Worker 10.0 10.0 10.0 10.0
Division Summary
Permanent Employees 80.0 82.4 84.4 85.4
Temporary Staffing 7.7 5.3 5.3 5.3
Resource Recovery and Recycling - 27441 Total 87.7 87.7 89.7 90.7
122

Department/Division/Title
2013-14
Revised
Budget
2014-15
Revised
Budget
2015-16
Revised
Budget
2016-17
Adopted
Budget
Personnel (FTE) by Department and Division
Facilities Maintenance - 01452
Facilities Maintenance Manager 1.0 1.0 1.0 1.0
Facilities Services Administrator 1.0 1.0 1.0 1.0
Custodial Services Administrator 1.0 1.0 1.0 1.0
Facilities Maintenance Contracts Administrator 1.0 1.0 1.0 1.0
Senior Administrative Analyst 1.0 1.0 1.0 1.0
Facilities Supervisor 2.0 2.0 2.0 2.0
Administrative Analyst 1.0 1.0 1.0 1.0
Electrical Crew Leader 1.0 1.0 1.0 1.0
HVAC Crew Leader 1.0 1.0 1.0 1.0
Custodial Supervisor 6.0 6.0 6.0 6.0
Plumber Crew Leader 1.0 1.0 1.0 1.0
HVAC Technician 3.0 3.0 4.0 4.0
Carpenter Crew Leader 1.0 1.0 1.0 1.0
Building Systems Technician 1.0 1.0 1.0 1.0
Electrician II 6.0 6.0 6.0 4.0
Painter Crew Leader 1.0 1.0 1.0 1.0
Plumber 3.0 3.0 3.0 3.0
Carpenter 3.0 3.0 3.0 3.0
Painter 2.0 2.0 2.0 2.0
Staff Assistant III 2.0 2.0 2.0 2.0
Graffiti Removal Technician 3.0 3.0 4.0 4.0
Aquatics Maintenance Worker 1.5 1.5 1.5 1.5
Staff Assistant II 1.0 1.0 1.0 1.0
Maintenance Worker - 1.0 1.0 -
Custodian II 8.0 8.0 8.0 8.0
Custodian I 31.0 33.5 33.5 33.5
Trades Intern 9.0 9.0 5.0 5.0
Division Summary
Permanent Employees 92.5 96.0 94.0 91.0
Temporary Staffing 9.7 6.3 6.3 6.3
Facilities Maintenance - 01452 Total 102.2 102.3 100.3 97.3
Office of Pier Management - 30454
Pier Manager - - - 1.0
Staff Assistant III - - - 1.0
Division Summary
Permanent Employees - - - 2.0
Temporary Staffing - - - -
Office of Pier Management - 30454 Total - - - 2.0
123

Department/Division/Title
2013-14
Revised
Budget
2014-15
Revised
Budget
2015-16
Revised
Budget
2016-17
Adopted
Budget
Personnel (FTE) by Department and Division
Pier Maintenance - 30455
Pier Maintenance Crew Leader 1.0 1.0 1.0 1.0
Carpenter 1.0 1.0 1.0 1.0
Painter - - 1.0 1.0
Pier Maintenance Worker 2.0 2.0 2.0 2.0
Custodian I 2.0 2.0 2.0 2.0
Trades Intern - - 1.0 1.0
Division Summary
Permanent Employees 6.0 6.0 8.0 8.0
Temporary Staffing 0.5 0.5 - -
Pier Maintenance - 30455 Total 6.5 6.5 8.0 8.0
Airport Maintenance - 33457
Airport Maintenance Crew Leader 1.0 1.0 1.0 1.0
Airport Maintenance Worker 3.0 3.0 3.0 3.0
Division Summary
Permanent Employees 4.0 4.0 4.0 4.0
Temporary Staffing - - - -
Airport Maintenance - 33457 Total 4.0 4.0 4.0 4.0
Fleet Management - 54459
Fleet Maintenance Administrator - 1.0 - -
Fleet Services Administrator - - 1.0 1.0
Fleet Maintenance Superintendent 1.0 - - -
Fleet Maintenance Supervisor 2.0 2.0 2.0 2.0
Administrative Analyst 1.0 1.0 1.0 1.0
Senior Mechanic 1.0 2.0 2.0 2.0
Mechanic I/II 18.0 17.0 17.0 17.0
Welder Fabricator 1.0 1.0 1.0 1.0
Fleet Storekeeper - - 1.0 1.0
Storekeeper II 1.0 1.0 - -
Staff Assistant III 1.0 1.0 1.0 1.0
Fleet Services Writer - - 1.0 1.0
Storekeeper I 1.0 1.0 1.0 1.0
Staff Assistant II 1.0 1.0 - -
Trades Intern - - 1.0 1.0
Division Summary
Permanent Employees 28.0 28.0 29.0 29.0
Temporary Staffing - - - -
Fleet Management - 54459 Total 28.0 28.0 29.0 29.0
124

Department/Division/Title
2013-14
Revised
Budget
2014-15
Revised
Budget
2015-16
Revised
Budget
2016-17
Adopted
Budget
Personnel (FTE) by Department and Division
Beach House Maintenance - 11497
Aquatics Maintenance Worker 1.5 1.5 1.5 1.5
Custodian II 2.0 2.0 2.0 2.0
Custodian I 4.0 8.0 8.0 8.0
Division Summary
Permanent Employees 7.5 11.5 11.5 11.5
Temporary Staffing 4.0 - - -
Beach House Maintenance - 11497 Total 11.5 11.5 11.5 11.5
Public Landscape - 01498
Public Landscape Manager 1.0 1.0 1.0 1.0
Public Landscape Superintendent 1.0 1.0 1.0 1.0
Senior Administrative Analyst - Open Space Management 1.0 1.0 1.0 1.0
Urban Forester 1.0 1.0 1.0 1.0
Community Forest Supervisor 1.0 - - -
Urban Forest Supervisor - 2.0 2.0 2.0
Administrative Analyst 1.0 1.0 1.0 1.0
Parks Maintenance Supervisor 5.0 5.0 5.0 5.0
Promenade Maintenance Supervisor 1.0 1.0 1.0 1.0
Maintenance Crew Leader 2.0 2.0 2.0 2.0
Parks Maintenance Crew Leader 4.0 4.0 4.0 4.0
Irrigation Crew Leader 1.0 1.0 1.0 1.0
Parks Equipment Technician 1.0 1.0 1.0 1.0
Irrigation Technician 4.0 4.0 4.0 4.0
Tree Trimmer 2.0 2.0 2.0 2.0
Staff Assistant III 1.0 1.0 1.0 1.0
Equipment Operator I 13.0 13.0 13.0 14.0
Staff Assistant II 1.0 1.0 1.0 1.0
Groundskeeper 21.0 21.0 22.0 22.0
Maintenance Worker 9.0 11.0 11.0 12.0
Field Attendant 1.0 1.0 - -
Trades Intern 1.0 1.0 - -
Division Summary
Permanent Employees 73.0 76.0 75.0 77.0
Temporary Staffing 2.0 - - -
Public Landscape - 01498 Total 75.0 76.0 75.0 77.0
125

Department/Division/Title
2013-14
Revised
Budget
2014-15
Revised
Budget
2015-16
Revised
Budget
2016-17
Adopted
Budget
Personnel (FTE) by Department and Division
Beach Maintenance - 11499
Beach Maintenance Supervisor 1.0 1.0 1.0 1.0
Equipment Operator II 4.0 4.0 5.0 5.0
Equipment Operator I 1.0 1.0 1.0 1.0
Maintenance Worker 4.0 6.0 6.0 6.0
Custodian II 1.0 2.0 2.0 2.0
Maintenance Assistant - 9.0 9.0 9.0
Division Summary
Permanent Employees 11.0 23.0 24.0 24.0
Temporary Staffing 12.5 - - -
Beach Maintenance - 11499 Total 23.5 23.0 24.0 24.0
Cemetery - 37641
Cemetery Administrator 1.0 1.0 1.0 1.0
Administrative Analyst - Cemetery 1.0 1.0 1.0 1.0
Funeral Services Technician 1.0 1.0 1.0 1.0
Equipment Operator II 1.0 1.0 1.0 1.0
Cemetery Services Representative 1.0 1.0 1.0 1.0
Equipment Operator I 1.0 1.0 1.0 1.0 Maintenance Worker (limited term) - - - 1.0
Maintenance Assistant - 1.0 1.0 1.0
Division Summary
Permanent Employees 6.0 7.0 7.0 8.0
Temporary Staffing 1.1 0.1 0.1 0.1
Cemetery - 37641 Total 7.1 7.1 7.1 8.1
Wastewater - 31661
Water Resources Protection Program Coordinator 1.0 1.0 1.0 1.0
Senior Water Resources Protection Specialist 1.0 1.0 1.0 1.0
Wastewater Supervisor 1.0 1.0 1.0 1.0
Water Resources Protection Specialist 3.0 3.0 3.0 3.0
Wastewater Treatment Plant Operator 1.0 1.0 1.0 2.0
Wastewater Crew Leader 2.0 2.0 2.0 1.0
Staff Assistant III 1.0 1.0 1.0 1.0
Sewer Maintenance Worker II 6.0 6.0 6.0 6.0
Sewer Maintenance Worker I 6.0 6.0 6.0 6.0
Division Summary
Permanent Employees 22.0 22.0 22.0 22.0
Temporary Staffing 0.2 0.2 0.2 0.2
Wastewater - 31661 Total 22.2 22.2 22.2 22.2
126

Department/Division/Title
2013-14
Revised
Budget
2014-15
Revised
Budget
2015-16
Revised
Budget
2016-17
Adopted
Budget
Personnel (FTE) by Department and Division
Water Resources - 25671
Water Resources Manager 1.0 1.0 1.0 1.0
Water Production and Treatment Administrator 1.0 1.0 1.0 1.0
Water/Wastewater Administrator 1.0 1.0 1.0 1.0
Civil Engineer 1.0 1.0 1.0 1.0
Environmental Remediation Coordinator 1.0 1.0 1.0 1.0
SCADA Software Analyst - - - 1.0
Lead Water Chemist 1.0 1.0 1.0 1.0
Senior Administrative Analyst 1.0 1.0 1.0 1.0
Water Chemist 2.0 2.0 2.0 2.0
Water Production and Treatment Plant Supervisor 1.0 1.0 1.0 1.0
Water Supervisor - Construction 1.0 1.0 1.0 1.0
Water Supervisor - Meters 1.0 1.0 1.0 1.0
Administrative Analyst 1.0 1.0 1.0 1.0
Water Quality Analyst I/II 1.0 1.0 1.0 1.0
Lead Water Production and Treatment Plant Operator 1.0 1.0 1.0 1.0
Field Inspector II 1.0 1.0 1.0 1.0
Water Production and Treatment Plant Operator 6.0 6.0 6.0 6.0
Water Resources Crew Leader - - 1.0 1.0
Water Construction Crew Leader 1.0 1.0 - -
Water Crew Leader 3.0 3.0 3.0 3.0
Water System Equipment Operator 3.0 3.0 3.0 3.0
Underground Utilities Locator 1.0 1.0 1.0 -
Underground Utility Safety Coordinator - - - 1.0
Pipe Fitter 2.0 2.0 2.0 2.0
Field Inspector I 1.0 1.0 1.0 1.0
Water Resources Technician 5.0 5.0 5.0 5.0
Water Maintenance Worker 5.0 5.0 5.0 5.0
Staff Assistant III 2.0 2.0 2.0 2.0
Groundskeeper 1.0 1.0 1.0 1.0
Division Summary
Permanent Employees 46.0 46.0 46.0 47.0
Temporary Staffing - - - -
Water Resources - 25671 Total 46.0 46.0 46.0 47.0
Department Summary
Permanent Employees 464.0 487.9 494.9 502.9
Temporary Staffing 39.1 13.8 12.8 12.8
PUBLIC WORKS TOTAL 503.1 501.7 507.7 515.7
127

Department/Division/Title
2013-14
Revised
Budget
2014-15
Revised
Budget
2015-16
Revised
Budget
2016-17
Adopted
Budget
Personnel (FTE) by Department and Division
BIG BLUE BUS
Transit Executive - 41640
Director of Transit Services 1.0 1.0 1.0 1.0
Chief Operations Officer 1.0 1.0 1.0 1.0
Transit Chief Administrative Officer - 1.0 1.0 1.0
Chief Financial Officer 1.0 - - -
Administrative Services Officer 1.0 1.0 1.0 1.0
Senior Administrative Analyst 1.0 1.0 1.0 1.0
Executive Administrative Assistant 1.0 1.0 1.0 1.0 Administrative Staff Assistant (limited term) - - 1.0 1.0
Division Summary
Permanent Employees 6.0 6.0 7.0 7.0
Temporary Staffing - - - -
Transit Executive - 41640 Total 6.0 6.0 7.0 7.0
Transit Finance and Grants - 41642
Transit Finance and Grants Manager 1.0 1.0 1.0 1.0
Senior Administrative Analyst 1.0 1.0 1.0 1.0
Senior Administrative Analyst - Transit Grants 1.0 1.0 1.0 1.0
Accountant I 1.0 1.0 1.0 1.0
Fiscal Staff Assistant III 1.0 1.0 1.0 1.0
Fiscal Staff Assistant II 1.0 1.0 1.0 1.0
Staff Assistant III 1.0 1.0 1.0 1.0
Division Summary
Permanent Employees 7.0 7.0 7.0 7.0
Temporary Staffing - - - 1.0
Transit Finance and Grants - 41642 Total 7.0 7.0 7.0 8.0
128

Department/Division/Title
2013-14
Revised
Budget
2014-15
Revised
Budget
2015-16
Revised
Budget
2016-17
Adopted
Budget
Personnel (FTE) by Department and Division
Transit Planning and Community Engagement - 41643
Transit Planning and Community Engagement Manager - - 1.0 1.0
Transit Government and Community Relations Manager 1.0 1.0 - -
Transit Planning Administrator - - 1.0 1.0
Transit Government Relations Officer 1.0 1.0 1.0 1.0
Senior Transit Scheduler - - 1.0 1.0
Transit Planner - - 1.0 1.0
Transit Community Relations Officer 1.0 1.0 - -
Transit Community Engagement Officer - - 1.0 1.0
Administrative Analyst - - 1.0 1.0
Transit Advertising Coordinator - - - 1.0
Transit Community Relations Coordinator 1.0 1.0 - -
Transit Community Engagement Coordinator - - 1.0 1.0
Transit Marketing Coordinator 1.0 1.0 1.0 1.0
Transit Scheduler - - 1.0 1.0
Customer Service Supervisor 1.0 1.0 1.0 1.0
Administrative Staff Assistant 1.0 1.0 1.0 -
Graphic Designer 1.0 1.0 1.0 1.0
Customer Services Assistant 5.3 5.3 6.8 6.8
Division Summary
Permanent Employees 13.3 13.3 19.8 19.8
Temporary Staffing 0.7 0.7 1.5 2.9
Transit Planning and Community Engagement - 41643 Total 14.0 14.0 21.3 22.7
129

Department/Division/Title
2013-14
Revised
Budget
2014-15
Revised
Budget
2015-16
Revised
Budget
2016-17
Adopted
Budget
Personnel (FTE) by Department and Division
Transit Maintenance - 41657
Transit Maintenance Manager 1.0 1.0 1.0 1.0
Transit Facilities Maintenance Officer - - 1.0 1.0
Transit Maintenance Officer 1.0 1.0 1.0 1.0
Transit Maintenance Training Coordinator 1.0 1.0 1.0 1.0
Transit Mechanic Supervisor 6.0 6.0 6.0 6.0
Administrative Analyst 1.0 1.0 1.0 1.0
LCNG Technician - - - 1.0
Transit Facilities Maintenance Supervisor 1.0 1.0 - -
Procurement Supervisor 1.0 1.0 1.0 1.0
Electronic Communications/Farebox Technician 1.0 1.0 1.0 1.0
Transit Mechanic I/II 44.0 44.0 47.0 47.0
Administrative Staff Assistant 1.0 1.0 1.0 1.0
Storekeeper II 2.0 2.0 2.0 2.0
Senior Transit Maintenance Worker - 1.0 2.0 2.0
Transit Maintenance Worker 2.0 2.0 2.0 2.0
Warehouse Worker 3.0 3.0 3.0 3.0
Motor Coach Cleaner 18.0 18.0 20.0 20.0
Custodian I 1.0 1.0 1.0 1.0
Division Summary
Permanent Employees 84.0 85.0 91.0 92.0
Temporary Staffing 2.1 2.6 2.3 1.9
Transit Maintenance - 41657 Total 86.1 87.6 93.3 93.9
Transit Operations - 41658
Transit Operations Manager 1.0 1.0 - -
Transit Planning Administrator 1.0 1.0 - -
Transit Operations Superintendent - - 2.0 2.0
Senior Transit Scheduler 1.0 1.0 - -
Transit Planner 1.0 1.0 - -
Senior Motor Coach Operator Supervisor 1.0 1.0 - -
Administrative Analyst 1.0 1.0 - -
Transit Scheduler 1.0 1.0 - -
Motor Coach Operator Supervisor 16.0 18.0 19.0 20.0
Staff Assistant III 2.0 2.0 2.0 2.0
Transit Operations Assistant 3.0 - - -
Motor Coach Operator 275.4 275.4 293.4 298.4
Division Summary
Permanent Employees 303.4 302.4 316.4 322.4
Temporary Staffing 12.0 12.0 11.5 0.9
Transit Operations - 41658 Total 315.4 314.4 327.9 323.3
130

Department/Division/Title
2013-14
Revised
Budget
2014-15
Revised
Budget
2015-16
Revised
Budget
2016-17
Adopted
Budget
Personnel (FTE) by Department and Division
Transit Safety and Training - 41670
Transit Safety and Training Manager 1.0 1.0 1.0 1.0
Lead Transit Training Coordinator - - 1.0 1.0
Transit Training Coordinator - - 3.0 3.0
Motor Coach Operator Training Coordinator 3.0 3.0 - -
Transit Safety and Security Coordinator 1.0 1.0 1.0 1.0
Staff Assistant II 2.0 2.0 2.0 2.0
Division Summary
Permanent Employees 7.0 7.0 8.0 8.0
Temporary Staffing - - - -
Transit Safety and Training - 41670 Total 7.0 7.0 8.0 8.0
Department Summary
Permanent Employees 420.7 420.7 449.2 456.2
Temporary Staffing 14.8 15.3 15.3 6.7
BIG BLUE BUS TOTAL 435.5 436.0 464.5 462.9
HOUSING AND ECONOMIC DEVELOPMENT
Administration - 01263
Director of Housing and Economic Development 1.0 1.0 1.0 1.0
Principal Administrative Analyst 1.0 1.0 1.0 1.0
Executive Administrative Assistant 1.0 1.0 1.0 1.0
Division Summary
Permanent Employees 3.0 3.0 3.0 3.0
Temporary Staffing 0.1 0.1 0.1 0.1
Administration - 01263 Total 3.1 3.1 3.1 3.1
Housing - 01264
Housing Manager 1.0 1.0 1.0 1.0
Housing Program Manager - - - 1.0
Housing Administrator - Production and Preservation 1.0 1.0 1.0 -
Successor Agency Administrator 1.0 1.0 1.0 1.0 Senior Development Analyst (1.0 FTE is limited term) 1.0 1.0 2.0 2.0
Construction Specialist 1.0 - - -
Administrative Analyst - Housing/Loan Portfolio Monitoring 1.0 1.0 1.0 1.0 Housing Specialist (limited term) - - 1.0 1.0
Staff Assistant III 1.0 1.0 1.0 1.0
Division Summary
Permanent Employees 7.0 6.0 8.0 8.0
Temporary Staffing - - - -
Housing - 01264 Total 7.0 6.0 8.0 8.0
131

Department/Division/Title
2013-14
Revised
Budget
2014-15
Revised
Budget
2015-16
Revised
Budget
2016-17
Adopted
Budget
Personnel (FTE) by Department and Division
Economic Development - 01268
Economic Development Manager 1.0 1.0 1.0 1.0
Economic Development Administrator 1.0 1.0 1.0 1.0
Senior Development Analyst 3.0 3.0 3.0 3.0
Farmers' Market Supervisor 1.0 1.0 1.0 1.0
Farmers' Market Coordinator II 1.0 1.0 1.0 1.0
Farmers' Market Coordinator I 1.0 0.5 0.5 0.5
Staff Assistant III 1.0 1.0 1.0 1.0
Farmers' Market Attendant - 1.2 1.2 1.2
Farmers' Market Assistant 1.0 1.0 1.0 1.0
Division Summary
Permanent Employees 10.0 10.7 10.7 10.7
Temporary Staffing 0.6 0.9 1.5 1.5
Economic Development - 01268 Total 10.6 11.6 12.2 12.2
Housing Services - 12269
Housing Authority Administrator 1.0 1.0 1.0 1.0
Senior Administrative Analyst - Financial Analyst 1.0 1.0 1.0 1.0
Senior Administrative Analyst - Housing Authority 1.0 1.0 1.0 1.0
Administrative Analyst 1.0 1.0 1.0 1.0
Housing Specialist 5.0 5.0 5.0 5.0
Technical Staff Assistant 1.0 1.0 1.0 1.0
Housing Inspector 1.0 1.0 1.0 1.0
Staff Assistant III 1.0 1.0 1.0 1.0
Staff Assistant II 1.0 1.0 1.0 1.0
Division Summary
Permanent Employees 13.0 13.0 13.0 13.0
Temporary Staffing 0.1 0.1 0.1 0.1
Housing Services - 12269 Total 13.1 13.1 13.1 13.1
Department Summary
Permanent Employees 33.0 32.7 34.7 34.7
Temporary Staffing 0.8 1.1 1.7 1.7
HOUSING AND ECONOMIC DEVELOPMENT TOTAL 33.8 33.8 36.4 36.4
132


