103
Coal Seam Water Monitoring and Management Annual Report 2015 Santos GLNG

Coal Seam WaterMonitoring andManagementAnnual Report 2015
Santos GLNG

Santos GLNG Coal Seam Water Monitoring and Management Annual Report 2015
March 2016 i
Executive Summary Purpose
The Coal Seam Water Monitoring and Management Annual Report 2015 for the Santos GLNG Project, is required by the Commonwealth Department of the Environment (DOTE). This Annual Report:
Has been prepared in accordance with Conditions 49 i) and 53 c)ix) of the Environment Protection and Biodiversity Conservation Act 1999 (Commonwealth) (EPBC Act) Approval 2008/4059;
Reports progress against the Santos GLNG Stage 2 CSG Water Management and Monitoring Plan (Revision 2) (Stage 2 CWMMP Rev 2); and
Covers the period 1 January 2015 to 31 December 2015.
Approval Context In October 2010, the Minister for the former Department of Sustainability, Environment, Water, Population and Communities (now DOTE) granted the EPBC Approval under the EPBC Act, with various conditions. Conditions included the submission of a Stage 1 and Stage 2 Coal Seam Gas Water Monitoring and Management Plan (CWMMP) in which Santos GLNG made commitments for addressing the EPBC Act Approval conditions. The Stage 1 CWMMP and Stage 2 CWMMP Rev 2 were approved by the Minister for the Environment on 29 November 2013.
Features of this Annual Report Santos GLNG is progressing as planned against the commitments in the Stage 2 CWMMP Rev 2. The Santos GLNG project continues to be developed and operated in a sustainable manner, with the appropriate mitigation measures implemented. The potential risk of adverse impact to Matters of National Environmental Significance (MNES) remains low.
Table A provides a summary of Santos GLNG’s commitments made for the period covered in the Stage 2 CWMMP Rev 2 and provides a status update of progress up to the end of December 2015.

Santos GLNG Coal Seam Water Monitoring and Management Annual Report 2015
March 2016 ii
Table A: Stage 2 CWMMP Rev 2 Commitments & Progress Update
● Commitment Complete; ► Commitment In Progress; ♦ Continuous Commitment Condition Commitment Target Completion Date Specified in
Stage 2 CWMMP Rev 2 Status Annual Report
Reference 49a, 49d,53c.vi
Groundwater Drawdown Drawdown limits are now defined for the source aquifer at selected locations. These limits are subject to periodic updates.
Completed. ● Section 3
Installation of Early Warning Spring (EWS) monitoring network. End 2016. ► Section 3
Ground truthing of a selection of springs to assess the presence of EPBC listed species and EPBC communities.
On and off tenure springs baseline initiated as part of the JIP, to be reported April 2015. ● Section 3
Santos GLNG will assume responsibility of mitigation (if required) for on-tenure springs and those off-tenement springs as will be assigned by the Surat Underground Water Impact Report (UWIR)/DOTE.
Ongoing. ♦ Section 3
Comparison of drawdown to UWIR predictions will occur on a quarterly basis. This methodology has evolved since the Stage 2 CWMMP – once groundwater level reference values are defined, Santos GLNG is assessing the feasibility of programming a system of alerts in the database. Until then, three monthly data checks will be completed.
Quarterly once groundwater baseline is completed and reference value is defined.
► Section 3

Santos GLNG Coal Seam Water Monitoring and Management Annual Report 2015
March 2016 iii
● Commitment Complete; ► Commitment In Progress; ♦ Continuous Commitment Condition Commitment Target Completion Date Specified in
Stage 2 CWMMP Rev 2 Status Annual Report
Reference 49b, 53b, 53d(i)4)
Aquifer Connectivity Santos GLNG commits to provide further characterisation on the level of connectivity between the formations, including undertaking the following upcoming and ongoing hydraulic connectivity programs. Note that the results will be presented in future updates to the CWMMP. Multi-level monitoring bores. Ongoing monitoring and data assessment. ► Section 4
Contact Zone Program. Ongoing after installation. ► Section 4
Wallumbilla Fault Program. Installation planned for 2014. ● Section 4
Aquifer Response. Ongoing. ► Section 4
Isotope and geochemical signature. Ongoing. ► Section 4
Pumping response observations and assessments. Annually from 2014. ♦ Section 4
The outcomes of the conventional oil and gas well and water bore risk assessment will be presented in an update to the CWMMP.
2014. Updated CWMMP is due for submission four months after the revised UWIR as agreed with DOTE in 2015.
► Section 4

Santos GLNG Coal Seam Water Monitoring and Management Annual Report 2015
March 2016 iv
● Commitment Complete; ► Commitment In Progress; ♦ Continuous Commitment Condition Commitment Target Completion Date Specified in
Stage 2 CWMMP Rev 2 Status Annual Report
Reference 49c, 53a, 53 d)ii
Aquifer Re-injection Santos GLNG has developed a Managed Aquifer Recharge (MAR) pilot program and schedule for gas field piloting of aquifer reinjection. Fairview CSG Field Stage 1– Desktop Study. Completed March 2012. ● Section 5
Roma CSG Field Stage 1– Desktop Study. Completed January 2011. ● Section 5
Roma CSG Field Stage 2 – Investigations and Assessment. Completed January 2011. ● Section 5
Roma CSG Field pilot trial (Hermitage) Stage 3 – Construction and Commissioning.
Completed Q1/Q2 2012. ● Section 5
Roma CSG Field pilot trial (Hermitage) Stage 4 – Operation. Completed Q4 2012. ● Section 5
Roma CSG Field (The Bend) Stage 3 – Construction and Commissioning.
Due for completion Q3 2014. Ongoing, due for completion 04 2016.
► Section 5
Roma CSG Field (The Bend) Stage 4 – Operation. Due to commence Q3/Q4 2014. Ongoing, due to commence Q1 2017.
► Section 5
Arcadia Valley CSG Field Stage 1 – Desktop Study. Completed September 2013. ● Section 5
All approved Injection Management Plans will be provided in an update to the CWMMP.
Ongoing. ♦ Section 5

Santos GLNG Coal Seam Water Monitoring and Management Annual Report 2015
March 2016 v
● Commitment Complete; ► Commitment In Progress; ♦ Continuous Commitment Condition Commitment Target Completion Date Specified in
Stage 2 CWMMP Rev 2 Status Annual Report
Reference 49e Hydraulic Fracturing
Santos GLNG will provide a projection of the anticipated number of wells to be hydraulically stimulated during each year (up to and including 2015) as well as the number of hydraulic stimulations completed in the preceding year. Additional details to be reported will also include location information and the depth of each respective hydraulic stimulation.
Annually, submitted within the first quarter of each year. ●
Section 6
49f Santos GLNG has agreed with the DOTE to undertake additional Direct Toxicity Assessment that will include: • an ecotoxicological program, involving, for example, a
comparison of (i) coal seam water, (ii) coal seam water with hydraulic fracturing chemicals, and (iii) hydraulic fracturing chemicals in freshwater;
• assessing the risk of individual hydraulic fracturing chemicals of concern; and
• assessing contribution of hydraulic fracturing chemicals to toxicity of hydraulic fracturing fluids and flowback waters (mixture toxicity).
Santos GLNG is committed to undertaking these assessments, as part of the joint industry Ecotoxicity Work Program; the result of which will be provided to the DOTE upon completion.
December 2013 Ongoing, due for completion 2016.
► Section 6
Santos GLNG Coal Seam Water Monitoring and Management Annual Report 2015
March 2016 vi
● Commitment Complete; ► Commitment In Progress; ♦ Continuous Commitment Condition Commitment Target Completion Date Specified in
Stage 2 CWMMP Rev 2 Status Annual Report
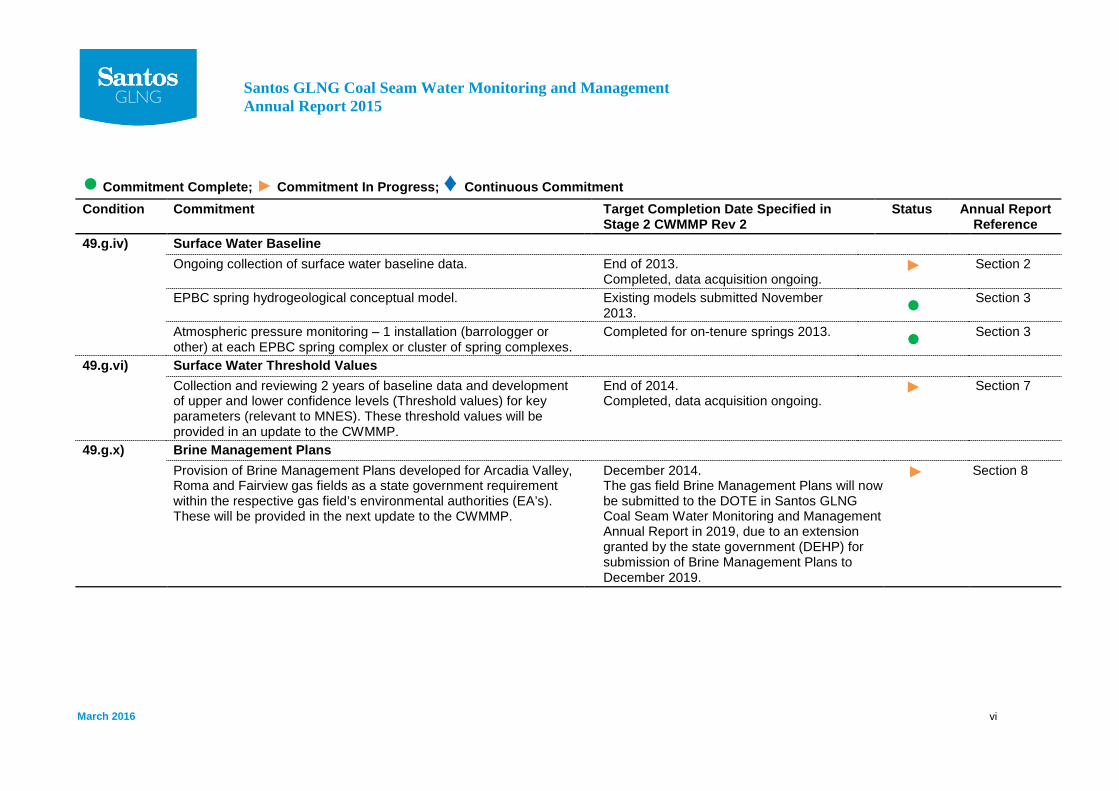
Reference 49.g.iv) Surface Water Baseline
Ongoing collection of surface water baseline data. End of 2013. Completed, data acquisition ongoing.
► Section 2
EPBC spring hydrogeological conceptual model. Existing models submitted November 2013. ●
Section 3
Atmospheric pressure monitoring – 1 installation (barrologger or other) at each EPBC spring complex or cluster of spring complexes.
Completed for on-tenure springs 2013. ● Section 3
49.g.vi) Surface Water Threshold Values Collection and reviewing 2 years of baseline data and development of upper and lower confidence levels (Threshold values) for key parameters (relevant to MNES). These threshold values will be provided in an update to the CWMMP.
End of 2014. Completed, data acquisition ongoing.
► Section 7
49.g.x) Brine Management Plans Provision of Brine Management Plans developed for Arcadia Valley, Roma and Fairview gas fields as a state government requirement within the respective gas field’s environmental authorities (EA’s). These will be provided in the next update to the CWMMP.
December 2014. The gas field Brine Management Plans will now be submitted to the DOTE in Santos GLNG Coal Seam Water Monitoring and Management Annual Report in 2019, due to an extension granted by the state government (DEHP) for submission of Brine Management Plans to December 2019.
► Section 8

Santos GLNG Coal Seam Water Monitoring and Management Annual Report 2015
March 2016 vii
● Commitment Complete; ► Commitment In Progress; ♦ Continuous Commitment Condition Commitment Target Completion Date Specified in
Stage 2 CWMMP Rev 2 Status Annual Report
Reference 49i, 53c)ix) Reporting
A Coal Seam Water Monitoring and Management Annual Report will be developed for each calendar year and submitted to the DOTE within the first quarter of the following year.
31 March 2016 and annually thereafter. ♦ Section 10
Digital data can be provided to the DOTE on request. Ongoing. ♦ Section 10
Santos GLNG will publish the following reports on the internet (via the Santos Water Portal): Coal Seam Water Monitoring and Management Annual Report;
and Link to the latest Surat Cumulative Management Area (CMA)
Underground Water Impact Report (UWIR).
31 March 2016. ● Section 10
Santos GLNG will regularly publish data from the water monitoring network on the Santos Water Portal.
Ongoing ♦ Section 10
55 The next revision of the CWMMP is currently planned to be submitted to the DOTE 3 months prior to first LNG cargo.
3 months prior to first LNG cargo in 2015. Updated CWMMP is due for submission four months after the revised UWIR as agreed with the DOTE in 2015.
► Section 10

Santos GLNG Coal Seam Water Monitoring and Management Annual Report 2015
March 2016 viii
● Commitment Complete; ► Commitment In Progress; ♦ Continuous Commitment Condition Commitment Target Completion Date Specified in
Stage 2 CWMMP Rev 2 Status Annual Report
Reference 53.c)iv) Groundwater Baseline
Groundwater baseline data collection completion. End of 2014. Completed, data acquisition ongoing.
► Section 2
Santos GLNG, in collaboration with the other Proponents (APLNG and QGC), will by the end of 2013 develop a statistical methodology to enable definition of significant exceedences from the baseline water pressure and water quality levels. The establishment of this methodology can only reasonably be commenced once the three Projects all have sufficient confirmation of their EPBC conditions being met by the respective CWMMPs.
Completed. The Joint Industry Plan (JIP) provides a statistical methodology for groundwater level trend analysis.
● Section 3
53.d.i.III Subsidence The Subsidence Management Plan provides a response plan into exceedance of the defined subsidence trigger. The Subsidence Management Plan describes the monitoring undertaken to establish variation of ground level over time.
Completed. ● Section 9
Subsidence baseline. Completed. ● Section 9
Monitoring through satellite measurements. Ongoing. ♦ Section 9

Santos GLNG Coal Seam Water Monitoring and Management Annual Report 2015
Table of Contents
Executive Summary .................................................................................................................................... i
Purpose ................................................................................................................................................. i
Approval Context ................................................................................................................................... i
Features of this Annual Report .............................................................................................................. i
1.0 Introduction ........................................................................................................................................ 1
1.1 Scope of the Annual Report ................................................................................................... 1
1.2 Project Context ...................................................................................................................... 1
2.0 Surface Water and Groundwater Baseline Monitoring ................................................................... 3
2.1 Overview........................................................................................................................................ 3
2.2 Coal Seam Water Monitoring and Management Plan Commitments ............................................. 3
2.3 Surface Water Baseline Monitoring ............................................................................................... 4
2.4 Baseline for Regional Groundwater Pressure and Quality ............................................................ 6
2.6 Baseline for Springs and Wetlands ................................................................................................ 8
3.0 EPBC Springs .................................................................................................................................. 10
3.1 Overview .............................................................................................................................. 10
3.2 Coal Seam Water Monitoring and Management Plan Commitments ................................... 10
3.3 EPBC Springs Monitoring Progress ..................................................................................... 12
3.3.1 Progress on the EPBC Springs Early Warning System Implementation ........................ 12
3.3.2 Spring Baseline Acquisition ............................................................................................ 12
3.4 EPBC Spring Hydrogeological Conceptual Models .............................................................. 13
3.5 Assessment of Trends for Analysis of Groundwater Data .................................................... 13
3.5.1 Yebna 2 Spring Complex................................................................................................ 13
3.5.2 Abyss / Lucky Last Spring Complexes ........................................................................... 14
3.5.3 Cockatoo Creek Spring Complexes ............................................................................... 16
4.0 Aquifer Connectivity ....................................................................................................................... 18
4.1 Overview .............................................................................................................................. 18
4.2 Coal Seam Water Monitoring and Management Plan Commitments ................................... 18
4.3 Multi-level monitoring ........................................................................................................... 19
4.4 Contact Zone near the Fairview Field .................................................................................. 19

Santos GLNG Coal Seam Water Monitoring and Management Annual Report 2015
4.5 Hutton-Wallumbilla Fault ...................................................................................................... 20
4.6 Aquifer Response to Depressurisation ................................................................................. 21
4.7 Isotope and Geochemical Signature .................................................................................... 21
4.8 Pumping Response to Depressurisation .............................................................................. 21
4.9 Support of OGIA Research .................................................................................................. 21
4.9.1 Condamine Connectivity Project .................................................................................... 22
4.9.2 Walloon Connectivity Project .......................................................................................... 22
4.9.3 Geological Modelling Project .......................................................................................... 22
4.9.4 Modelling Methodology Project ...................................................................................... 23
4.9.5 Geological Structures Project ......................................................................................... 23
4.9.6 Spring Knowledge Project .............................................................................................. 23
5.0 Managed Aquifer Recharge ............................................................................................................ 24
5.1 Overview .............................................................................................................................. 24
5.2 Coal Seam Water Monitoring and Management Plan Commitments ................................... 24
5.3 Status of Feasibility and Regulatory Approval ...................................................................... 25
6.0 Hydraulic Fracturing ....................................................................................................................... 26
6.1 Overview .............................................................................................................................. 26
6.2 Coal Seam Water Monitoring and Management Plan Commitments ................................... 26
6.3 Hydraulic Fracturing in 2015 ................................................................................................ 27
6.4 Direct Toxicity Assessment .................................................................................................. 32
7.0 Surface Water Monitoring ............................................................................................................... 35
7.1 Overview .............................................................................................................................. 35
7.2 Coal Seam Water Monitoring and Management Plan Commitments ................................... 35
7.2.1 Surface Water Threshold Values .................................................................................... 35
8.0 Brine Management .......................................................................................................................... 36
8.1 Overview .............................................................................................................................. 36
8.2 Coal Seam Water Monitoring and Management Plan Commitments ................................... 36
8.3 Brine Management Progress ............................................................................................... 36
9.0 Subsidence ...................................................................................................................................... 38
9.1 Overview .............................................................................................................................. 38
9.2 Coal Seam Water Monitoring and Management Plan Commitments ................................... 38
9.3 Findings to Date ................................................................................................................... 38
Santos GLNG Coal Seam Water Monitoring and Management Annual Report 2015
9.4 Ongoing Studies and Monitoring .......................................................................................... 39
10.0 Reporting.......................................................................................................................................... 40
10.1 Overview .............................................................................................................................. 40
10.2 Coal Seam Water Monitoring and Management Plan Commitments ................................... 40
10.3 2015 Reporting .................................................................................................................... 41
10.3.1 CWMMP Annual Report ................................................................................................. 41
10.3.2 Digital Data Requests ..................................................................................................... 41
10.3.3 Santos Water Portal ....................................................................................................... 41
10.3.4 Future Reporting ............................................................................................................ 41
11.0 References ....................................................................................................................................... 42
Appendix A – Summary of Stage 2 CWMMP Rev 2 Commitments and Progress Update .................. 43
Appendix B – Surface Water Baseline Threshold Report ..................................................................... 50
Santos GLNG Coal Seam Water Monitoring and Management Annual Report 2015
Tables Table A: Stage 2 CWMMP Rev 2 Commitments & Progress Update ............................................................ ii
Table 2-1: Stage 2 CWMMP Rev 2 Commitments – Surface Water and Groundwater Baseline Monitoring 3
Table 2-2: Automated Surface Water Gauging Stations and Period of Record ............................................ 4
Table 2-3: Surface Water Sampling Period of Record .................................................................................. 5
Table 2-4: Summary of Regional Groundwater Level Monitoring Points Active in 2015 ............................... 6
Table 2-5: Summary of the Number of Regional Groundwater Quality Monitoring Sampling Points in 2015 7
Table 2-6 Spring Baseline Monitoring Program Summary – Second and Subsequent Monitoring Events ... 9
Table 3-1: Stage 2 CWMMP Rev 2 Commitments – EPBC Springs ........................................................... 10
Table 3-2: Progress on EPBC Springs Early Warning System Monitoring Implementation ........................ 12
Table 4-1: Stage 2 CWMMP Rev 2 Commitments – Aquifer Connectivity .................................................. 18
Table 4-2: Number of Active Multi-level Groundwater Level Monitoring Installations ................................. 19
Table 4-3: Status of Groundwater Level Monitoring Installations Investigating the Contact Zone in Fairview ..................................................................................................................................... 20
Table 5-1: Stage 2 CWMMP Rev 2 Commitments – MAR ......................................................................... 24
Table 6-1: Stage 2 CWMMP Rev 2 Commitments – Hydraulic Fracturing ................................................. 26
Table 6-2: Hydraulic Fracturing Locations and Perforation Details Completed in 2015 .............................. 28
Table 7-1: Stage 2 CWMMP Rev 2 Commitments – Surface Water Monitoring ......................................... 35
Table 8-1: Stage 2 CWMMP Rev 2 Commitments – Brine Management ................................................... 36
Table 9-1: Stage 2 CWMMP Rev 2 Commitments – Subsidence ............................................................... 38
Table 10-1: Stage 2 CWMMP Rev 2 Commitments – Reporting ................................................................ 40
Figures Figure 1-1: Santos GLNG Project Area ........................................................................................................ 2
Figure 3-1: Yebna 2 EWS Groundwater Pressure Data ............................................................................. 14
Figure 3-2: Abyss and Lucky Last EWS Groundwater Pressure Data at MHTGWP01 and MHTGWH01 .. 15
Figure 3-3: Abyss and Lucky Last EWS Groundwater Pressure Data at MNHGWP02 .............................. 15
Figure 3-4: Cockatoo Creek Spring Complex EWS Groundwater Pressure Data ....................................... 16
Figure 6-1: Hydraulic Fracturing Locations - Completed ............................................................................ 33
Figure 6-2: Hydraulic Fracturing Locations - Scheduled ............................................................................. 34

Santos GLNG Coal Seam Water Monitoring and Management Annual Report 2015
1
March 2016
1.0 Introduction 1.1 Scope of the Annual Report The Santos Gladstone Liquefied Natural Gas (GLNG) Coal Seam Water Monitoring and Management Annual Report 2015 (Annual Report) has been prepared in accordance with Condition 49 i) and 53 c)ix) of the Environmental Protection and Biodiversity Conservation Act 1999 (EPBC Act) Approval 2008/4059 (EPBC Approval). This Annual Report provides progress against commitments made in the Santos GLNG Stage 2 Coal Seam Gas Water Management and Monitoring Plan (Revision 2) (Stage 2 CWMMP Rev 2) for the period 1 January 2015 to 31 December 2015.
Annual Reports will be submitted to the Department of the Environment (DOTE) by 31 March of each calendar year. Each Annual Report will cover the progress for the previous calendar year (January to December) against commitments made in the Stage 2 CWMMP Rev 2. The focus of this annual report is to:
Document the progress against each commitment summarised in Table-A (Appendix A) from 1 January 2015 to 31 December 2015; and
Provide commentary on findings from completed work.
The report has been structured to present progress on commitments under the following subject areas:
Section 1 Introduction;
Section 2 Surface Water and Groundwater Baseline Monitoring;
Section 3 EPBC Springs;
Section 4 Aquifer Connectivity;
Section 5 Managed Aquifer Recharge;
Section 6 Hydraulic Fracturing;
Section 7 Surface Water Monitoring;
Section 8 Brine Management;
Section 9 Subsidence; and
Section 10 Reporting.
1.2 Project Context In May 2010, the Queensland Coordinator-General approved the project under the State Development and Public Works Organisation Act 1971. In October 2010, the Minister for the former Department of Sustainability, Environment, Water, Population and Communities (now DOTE) granted approval under the EPBC Act. The GLNG project area location is shown in Figure 1-1.
The EPBC Act provides a legal framework to protect and manage nationally and internationally important flora, fauna, ecological communities and heritage places — defined in the EPBC Act as Matters of National Environmental Significance (MNES). Accordingly, the CWMMP has been developed to manage the risk of adverse impact to MNES in relation to coal seam water management.
Santos GLNG prepared both Stage 1 and Stage 2 CWMMPs within the specified timeframes to meet the requirements of these conditions. The Stage 1 CWMMP and Stage 2 CWMMP Rev 2 were approved by the Minister for the Environment on 29 November 2013. The Stage 2 CWMMP Rev 2 fulfils the requirements of Conditions 49, 52 and 53 and covers the proposed management activities from 2013 to the first LNG cargo scheduled for 2015.

Santos GLNG Coal Seam Water Monitoring and Management Annual Report 2015
2
March 2016
Figure 1-1: Santos GLNG Project Area

Santos GLNG Coal Seam Water Monitoring and Management Annual Report 2015
3
March 2016
2.0 Surface Water and Groundwater Baseline Monitoring 2.1 Overview Baseline surface water and groundwater data is information which establishes attributes of the water environment prior to the onset of gas field development. This information can be used for comparison in the future to establish if changes have occurred. It may also be possible, dependent upon the nature of the change, to utilise baseline in order to establish a cause, i.e. being potentially related to gas field development activities or not. In relation to MNES, baseline data may also be useful in determining meaningful targets for impact mitigation and management controls.
The water quality baseline data that has been collected over several years, comprises:
Baseline for surface water quantity and quality; Baseline for groundwater pressure and quality; and Baseline for springs and wetlands.
The period of data collection that may be required to establish baseline will be location specific, and depend upon the nature of the environment being monitored. This is the case where ambient groundwater conditions are inter- and intra-seasonally dynamic, and affected by a number of interdependent variables such as rainfall, evapotranspiration potential, localised and regional groundwater abstraction activity, land-use changes and more.
Groundwater monitoring may be ongoing throughout the life of Santos GLNG development. It is expected that in most instances, monitoring will continue to gather data many years in advance of potential discernible changes that may be linked to gas field activities, and therefore such data will continue to be considered baseline data. The need for and extent of ongoing monitoring, however, is dictated by the need to monitor and manage specific risks and therefore the potential need for impact mitigation to manage the risk of adverse impact to MNES. Groundwater monitoring proposed in respect of such risks, is described in more detail in the relevant chapters (Chapter 3 – EPBC Springs, Chapter 4 - Aquifer Connectivity and Chapter 5 - Managed Aquifer Recharge).
2.2 Coal Seam Water Monitoring and Management Plan Commitments Table 2-1 provides an outline of the commitments made in the Stage 2 CWMMP Rev 2 specific to surface water and groundwater baseline monitoring and progress against each commitment.
Table 2-1: Stage 2 CWMMP Rev 2 Commitments – Surface Water and Groundwater Baseline Monitoring
Condition Commitment Target Completion Date Specified in Stage 2 CWMMP Rev 2
Status
53.c)iv) Groundwater Baseline Groundwater baseline data collection completion.
End of 2014. Completed. Data acquisition ongoing.
49.g.iv) Surface Water Baseline Ongoing collection of surface water
baseline data. End of 2013. Completed.
Data acquisition ongoing.

Santos GLNG Coal Seam Water Monitoring and Management Annual Report 2015
4
March 2016
2.3 Surface Water Baseline Monitoring A surface water monitoring network has been in place since 2003, with the network increasing significantly in 2009-2012 and includes a number of perennial, ephemeral and spring sampling locations across the Roma, Fairview and Arcadia Valley gas fields. A total of 16 grab samples were collected throughout 2015 from perennial sampling points, across Roma and Fairview gas fields.
Site descriptions and location references are listed in Table 2-2 and Table 2-3 below. Monitoring has included continuous automated flow records, manual and automated water quality sampling, as well as continuous electrical conductivity (EC) and temperature measurements.
Table 2-2: Automated Surface Water Gauging Stations and Period of Record Site No. Location Period of Record
S2 Upstream of Dawson River Discharge Scheme - Dawson Downstream of confluence with Hutton River 01/04/2009 - Present
S4 Downstream of Dawson River Discharge Scheme - Downstream Dawson River at Yebna Crossing 06/12/2011 - Present
S8 Downstream Baffle Creek U/S confluence of Dawson River 13/04/2009 - 13/11/2013 S12 Upstream Baffle Creek near Waterview 30/04/2009 - Present S13 Upstream Dawson River at north lease boundary 02/04/2009 - 11/04/2013 S15 Upstream Hutton Creek at Springrock Crossing 19/06/2009 - Present S16 Midstream Hutton Creek (IWS) (moved to become S16A) 09/07/2009 - 7/11/2013 S16A Midstream Hutton Creek (Relocation) 07/11/2013 - Present S17 Downstream Hutton Creek 01/04/2009 - Present ES1 Fairview plateau 07/03/2009 - 14/01/2014 ES2 Eastern side of leucaena area, IR4 08/03/2009 - 01/12/2014 ES3 Eastern side of IR5 18/02/2009 -14/01/2014 ES4 Western side of IR5 08/03/2009 - 14/01/2014 ES5 West of leucaena area, IR4 08/03/2009 - 14/01/2014 ES6 West of Springwater Plateau, IR6 08/03/2009 - 14/01/2014 ES7 Eastern side of Springwater plateau, IR6 08/03/2009 - 17/01/2014 ES8 North East of Springwater plateau, IR6 08/03/2009 - 14/01/2014 ES9 East of pivot plateau 20/07/2009 - 14/01/2014 BLCS1 Blyth Creek S1 - Upstream Mount Hope Irrigation 18/11/2011 - Present BLCS2 Blyth Creek S2 - Mount Hope Irrigation 17/11/2011 - Present BLCS3 Blyth Creek S3 - Downstream Mount Hope Irrigation 23/11/2011 - Present DRMP1 Dawson River Monitoring Point 1 (Formerly DRS1) 07/03/2014 - Present DRR1 Dawson River Referable Wetland (Formerly DRS2) 06/03/2014 - Present WLMP1 Wetland Monitoring Point 1 (Formerly DWS1) 06/03/2014 - Present R014 Roma Water Quality Station 15/01/2009 - Present R002 Bungil Creek – Downstream Burtons Road Crossing 16/08/2012 - Present R012 Bungil Creek – Downstream Dunkeld Road Crossing 21/08/2012 - Present R019 Yuleba Creek - Yuleba 25/10/2012 - Present RS25 Blyth Creek - The Bend 20/12/2012 - Present SC3 Glasby Spring 22/07/2009 - Present SC2 Grandpa Spring 22/07/2009 - Present SC1 Junction Spring 21/07/2009 - Present
Note: Period of record timeframes may differ to those listed in 2014 Annual Report due to last sampling date and station decommissioning date.

Santos GLNG Coal Seam Water Monitoring and Management Annual Report 2015
5
March 2016
Table 2-3: Surface Water Sampling Period of Record Site No. Location Period of Record
AS01 Midstream Dawson River at Arcadia Valley Road Crossing detailing baseline for Arcadia Valley surface waters 20/04/2010 - Present
BSNS01 Basin Creek (flows into Arcadia Creek) 01/06/2013 - Present BMIS01 Barramundi Creek 01/06/2013 - Present HGPS01 Highland Plains Creek 01/06/2013 - Present DEPS01 Deep Creek 01/06/2013 - Present SHOS01 Shotover Creek 01/06/2013 - Present DFYS01 Drafting Yard Creek 01/06/2013 - Present BLCS1 Blyth Creek S1 - Upstream Mount Hope Irrigation 14/11/2011 - 10/11/2015 BLCS2 Blyth Creek S2 - Mount Hope Irrigation 11/12/2011 - 02/02/2012 BLCS3 Blyth Creek S3 - Downstream Mount Hope Irrigation 19/12/2011- 14/01/2015 I14 Midstream Hutton Creek 03/03/2009 - 03/03/2009 I16 Midstream Hutton Creek 02/08/2007 - 02/08/2007 R001 Midstream Bungil Creek at Warrego Hwy (EIS) (S&B Site 5) 17/05/2010 - 09/11/2015 R002 Upstream Bungil Creek at Burtons Rd 11/04/2011 - 04/04/2014 R011 Downstream Blyth Creek at Carnarvon Hwy 28/04/2011 - 04/04/2014 R012 Downstream Bungil Creek at Dunkeld Road (EIS) (S&B Site 8) 18/05/2010 - 04/04/2014
R014 Downstream Wallumbilla Creek at Roma Condamine Road (EIS) (S&B Site 16) 18/05/2010 - 05/04/2014
R019 Upstream Yuleba Creek at Roma Condamine Rd (EIS) (S&B Site 21) 20/05/2010 - 01/06/2014
R021 Upstream Yuleba Creek at Warrego Hwy (EIS) (S&B Site 22) 20/05/2010 - 23/02/2016 R025 Midstream Blyth Creek at North Pickanjinnie Road 28/04/2011 - 10/03/2013 RES1 Midstream Bungeworgorai Creek 20/05/2010 - 20/05/2010 RES10 Downstream Blyth Creek 18/05/2010 - 04/04/2014 RES13 Upstream Wallumbilla Creek 19/05/2010 - 05/04/2014 RES15 Downstream Wallumbilla Creek 20/05/2010 - 20/05/2010 RES17 Midstream Cattle Creek Ephemeral 19/05/2010 - 19/05/2010 RES4 Upstream Bungil Creek 17/05/2010 - 17/05/2010 RES6 Downstream Bungil Creek 18/05/2010 - 18/05/2010 RS11 Midstream Blyth Creek 19/05/2010 - 10/03/2013 RS12 Upstream Blyth at Apple Tree Creek 19/05/2010 - 10/03/2013 RS14 Downstream Wallumbilla Creek 19/05/2010 - 05/04/2014 RS20 Downstream Balonne River 20/05/2010 - 10/08/2014 RS23 Midstream Bony Creek 18/05/2010 - 04/04/2014 RS24 Upstream Balonne River (Warkon) 08/07/2010 - 10/08/2014 RS25 Midstream Blyth Creek 02/11/2010 - 23/03/2015 RS7 Midstream Bungil Creek 18/05/2010 - 18/05/2010 S1 Downstream Dawsons Bend (S&B) 11/09/2003 - 18/04/2013
S10 Dawson River Downstream of confluence with Baffle Creek (S&B) 06/10/2006 - 17/11/2011
S11 Upstream Hutton Creek 05/10/2006 - 19/08/2014 S11a Upstream Hutton Creek in Kevington (S&B) 11/09/2003 - 21/04/2013

Santos GLNG Coal Seam Water Monitoring and Management Annual Report 2015
6
March 2016
Site No. Location Period of Record S14a Dawson River Upstream Hutton Creek outflow (S&B) 23/04/2004 - 22/05/2008 S2a Baffle Creek - 50m Downstream FV12 discharge (S&B) 09/09/2003 - 09/09/2003 S2b Baffle Creek - 5m Upstream FV12 discharge (S&B) 09/09/2003 - 09/09/2003 S3 Dawson River Downstream Hutton Creek (S&B) 23/04/2004 - 17/04/2013 S5 Downstream Utopia Downs (S&B) 25/05/2005 - 14/11/2013 S6 Midstream Hutton Creek (FV66) (S&B) 19/04/2004 - 15/04/2013
S6a Upstream Hutton Creek (Carnarvon Development Road) (S&B) 10/09/2003 - 10/09/2003
S7 Upstream Baffle Creek (S&B) 09/09/2003 - 16/04/2013 S9 Upstream Dawson River road crossing #2 (S&B) 09/05/2006 - 16/04/2013 SC1 Glasby Spring 03/11/2009 - Present SC2 Grandpas Springs 03/11/2009 - 13/05/2014 SC3 Junction Spring 03/11/2009 - Present
Note: Period of record timeframes may differ to those listed in 2014 Annual Report due to last sampling date and monitoring cessation date.
Surface water baseline monitoring requirements have been met for both Fairview and Roma fields and associated surface water threshold values have been calculated, see Section 7.0 (Surface Water Monitoring) for details. As a result, surface water monitoring stations and/or surface water sample locations are no longer required to be monitored at a pre-determined frequency as seasonal trends have been established. However, as Santos GLNG continues to undertake CSG related activities in each of the gas fields, a surface water monitoring program will be implemented on a regional scale with the objective of identifying potential impacts to surface waters relating to Santos GLNG’s activities during long-term operations.
Surface water monitoring locations for the Arcadia Valley field have been established to monitor surface water during the phases of exploration and appraisal.
2.4 Baseline for Regional Groundwater Pressure and Quality Santos GLNG has implemented a program for the regional groundwater level monitoring of private bores, dedicated groundwater monitoring bores and multi-level monitoring installations (such as vibrating wire piezometers (VWPs)) since 2008. The groundwater level monitoring network extends across Santos GLNG tenures and across all relevant aquifers. Development of the monitoring network is ongoing based on field development, a summary of the currently active water level monitoring points, and the number of bores that have become active throughout 2015 are summarised in Table 2-4. Table 2-4: Summary of Regional Groundwater Level Monitoring Points Active in 2015 Formation Private Water
Bores GLNG Multi-
level Monitoring
Points
GLNG Dedicated Monitoring
Bores
Total
Alluvium 2 - - 2 Volcanics 1 - - 1 Bungil Formation 1 - - 1 Mooga Sandstone 7 10 3 20 Orallo Formation 9 3 3 15 Gubberamunda Sandstone
7 16 11 (4) 34
Westbourne Formation - 6 - 6

Santos GLNG Coal Seam Water Monitoring and Management Annual Report 2015
7
March 2016
Formation Private Water Bores
GLNG Multi-level
Monitoring Points
GLNG Dedicated Monitoring
Bores
Total
Springbok Sandstone - 5 (1) 4 (4) 9 Walloon Coal Measures (WCM, targeting various seams)
3 44 (3)
- 47
Eurombah Formation - 2 - 2 Hutton Sandstone 2 4 (1) 3 (3) 9 Evergreen Formation 1 2 - 3 Boxvale Sandstone - 2 - 2 Precipice Sandstone 8 5 10 (1) 23 Clematis Sandstone 2 - 2 (2) 4 Rewan Formation 2 - - 2 Bandanna Formation - 1 1 Unknown* 3 - 3 TOTAL 48 99 37 184
Notes: These numbers may differ from those in the 2014 Annual Report due to ongoing refinement of the monitoring network. Number of bores that became operational in 2015 shown in brackets. - no bores present. * unknown indicates that the aquifer is to be confirmed through ongoing assessment. Data source: Santos GLNG (as of December 2015).
Details of the groundwater quality monitoring program undertaken during 2015 are provided below. The summary includes groundwater quality samples taken from dedicated monitoring bores across Roma, Fairview and Arcadia Valley gas fields. Table 2-5 provides a summary of the number of currently active water quality monitoring points.
During January 2015 to December 2015, a total of 127 samples have been collected as part of the groundwater quality monitoring program.
65 samples from the Roma field; 52 samples from the Fairview field; and 10 samples for the Arcadia Valley field.
Table 2-5: Summary of the Number of Regional Groundwater Quality Monitoring Sampling Points in 2015 Formation Private Bores GLNG Dedicated
Monitoring Bores Total
Alluvium 1 0 1 Mooga Sandstone 3 2 5 Orallo Formation 1 1 2 Gubberamunda Sandstone 0 6 (1) 6 Springbok Sandstone 0 4 (3) 4 Hutton Sandstone 0 3 (1) 3 Evergreen Formation 1 0 1 Precipice Sandstone 7 9 (3) 16 Clematis Sandstone 2 1 3

Santos GLNG Coal Seam Water Monitoring and Management Annual Report 2015
8
March 2016
Formation Private Bores GLNG Dedicated Monitoring Bores
Total
Rewan Formation 1 0 1 Bandanna Formation 0 0 0 Unknown* 4 0 4 TOTAL 20 26 46
Notes: These numbers may differ from those in the 2014 Annual Report due to ongoing refinement of the monitoring network. Number of bores that became operational in 2015 shown in brackets. * unknown indicates that the aquifer is to be confirmed through ongoing assessment. Data source: Santos GLNG (as of December 2015).
2.6 Baseline for Springs and Wetlands Baseline conditions at EPBC-listed and non EPBC-listed springs have been established by the Office of Groundwater Impact Assessment (OGIA) on behalf of the CSG industry and are presented within reports by KCB (2012) and Queensland Herbarium (2012), outlined in the Surat Cumulative Management Area (CMA) Underground Water Impact Report (UWIR 2012). In addition to this baseline, Santos GLNG has initiated spring monitoring as required under the Surat UWIR and Santos GLNG approval conditions on Santos GLNG tenures. A joint industry spring baseline program is being implemented consisting of quarterly monitoring events and inclusive of ecological and hydrogeological parameters monitoring. The findings of this monitoring is provided by Jacobs (2015). A summary of the spring complexes that were monitored throughout 2015, is shown in Table 2-6. Monitoring has been conducted in accordance with the monitoring approach identified during the first round of baseline monitoring in 2014. Chapter 3 (EPBC Springs) provides an update on additional activities related to springs commitments.

Santos GLNG Coal Seam Water Monitoring and Management Annual Report 2015
9
March 2016
Table 2-6 Spring Baseline Monitoring Program Summary – Second and Subsequent Monitoring Events Complex Spring Vent Monitoring Type Complex Spring Vent Monitoring Type Complex Spring Vent Monitoring Type Complex
Spring Vent or Bore RN
Monitoring Type
311 (non-MNES spring)
353 No Further Monitoring
Boggomoss (5)
53 No Further Monitoring
Cockatoo Creek (9)
321.6 No Further Monitoring
Lucky Last (230)
340 Full Monitoring
536 Full Monitoring 54 No Further Monitoring 321.7 No Further Monitoring 686 Visual
537 Visual Only 55 No Further Monitoring 321.8 No Further Monitoring 687 Visual
693 Full Monitoring 56 No Further Monitoring 684 No Further Monitoring 687.1 Visual
704 Full Monitoring 56.1 Visual Only Dawson River (2) 42 Full Monitoring incl adjacent RN89695 687.2 Visual
Abyss (592)
286 Full Monitoring 57 Visual Only
Dawson River (6)
1 Full Monitoring 687.3 Visual
286.1 Visual Only 58 Visual Only 4 No Monitoring 687.4 Visual
286.2 Full Monitoring 61 Visual Only 5 No Monitoring 687.5 Visual
286.3 Visual Only 62 No Further Monitoring 6 No Monitoring 687.6 Visual
682 Visual Only 63 No Further Monitoring 22 No Monitoring 688 Full Monitoring
716 Visual Only 68 No Further Monitoring 23 No Monitoring 689 Full Monitoring
Barton (283) (non-MNES spring)
702 Full Monitoring incl adjacent Barton Well 68.1 No Further Monitoring 24 Visual Only
Orana (non-MNES spring)
Orana1 Full Monitoring
703 No Further Monitoring 683 No Further Monitoring 25 Visual Only Ponies (229)
(non-MNES spring)
284 No Further Monitoring
Boggomoss (5)
2 No Further Monitoring 691 No Further Monitoring 27 No Further Monitoring 284.1 Full Monitoring
3 No Further Monitoring
Cockatoo Creek (9)
64 Full Monitoring incl adjacent RN67229 30 No Further Monitoring
Prices (580)
40 No Further Monitoring
7 No Further Monitoring 64.1 No Further Monitoring 31 Visual Only 41 No Further Monitoring
8 Visual Only 65 Visual Only 32 Visual Only 52 Full Monitoring
9 No Further Monitoring 65.1 No Further Monitoring 43 No Further Monitoring 67 Visual
10 No Further Monitoring 65.2 No Further Monitoring 59 No Further Monitoring
Scott's Creek (260)
189 Full Monitoring
11 Visual Only 66 No Further Monitoring 60 Full Monitoring 190 Visual
12 Visual Only 319 No Further Monitoring 681 No Further Monitoring 191 Full Monitoring
13 No Further Monitoring 320 Visual Only
Dawson River (8)
26 No Further Monitoring 192 Visual
14 No Further Monitoring 320.1 No Further Monitoring 28 Full Monitoring 192.1 No Further Monitoring
15 Visual Only 321 No Further Monitoring 38 Visual Only
RN14881 RN14200 RN14203 RN31097
Full Monitoring
29 Visual Only 321.1 No Further Monitoring Elgin 2 (594) 540 Full Monitoring incl adjacent RN67137
Spring Rock Creek (561) (non-MNES spring)
285 Full Monitoring
33 Visual Only 321.2 No Further Monitoring
Kangaroo Creek (non-MNES spring)
Kangaroo Creek 1 Initial baseline visit required Wambo (584)
(non-MNES spring)
711 Full Monitoring
37 No Further Monitoring 321.3 No Further Monitoring Kangaroo Creek 2 Initial baseline visit required 711.1 No Further Monitoring
37.1 No Further Monitoring 321.4 No Further Monitoring Spring Creek Initial baseline visit required Yebna 2 (591)
(non-MNES spring) 534 Full Monitoring
44 No Further Monitoring 321.5 No Monitoring Lucky Last (230) 287 Full Monitoring
Notes: “Full monitoring” comprises assessment of: wetland discharge, wetland area, wetland water quality, groundwater level estimation (as a proxy for groundwater flux), and ecosystem condition (flora survey, marco-invertebrate survey, photography). “Visual” comprises assessment of: wetland area, and ecosystem condition (flora survey and photograph). “No Further Monitoring” based on assessment methodology these locations are highly physically disturbed, any potential impacts to these sites from gas field development activities are likely to be undiscernible compared to pre-existing impacts.

Santos GLNG Coal Seam Water Monitoring and Monitoring Annual Report 2015
March 2016 10
3.0 EPBC Springs 3.1 Overview Groundwater drawdown propagating from production in gas fields has the potential to impact springs hosting ecological communities that are listed as MNES under the EPBC Act, or springs that are sourced from the Great Artesian Basin (GAB). These are known as “EPBC Springs”.
Operators in the southern Bowen and Surat Basins (Santos GLNG, Origin Energy and Origin Energy on behalf of APLNG and the Queensland Gas Company (QGC)) have developed a Joint Industry Plan (JIP) for a groundwater monitoring and management system to ensure EPBC Springs are not adversely impacted by groundwater drawdown associated with gas production.
The methodology for monitoring and management of EPBC Springs is defined in the JIP, which was approved by the Minister for the Environment in November 2013 and provided as an appendix to the Santos GLNG Stage 2 CWMMP Rev 2.
3.2 Coal Seam Water Monitoring and Management Plan Commitments Table 3-1 provides an outline of Santos GLNG’s commitments presented in the Stage 2 CWMMP Rev 2, specific to EBPC Springs and progress against each commitment.
Table 3-1: Stage 2 CWMMP Rev 2 Commitments – EPBC Springs Condition Commitment Target Completion
Date Specified in the Stage 2 CWMMP Rev 2
Status
49a, 49d,53c.vi
Drawdown limits are now defined for the source aquifer at selected locations. These limits are subject to periodic updates.
Completed. Completed (2013).
Installation of Early Warning Spring (EWS) monitoring network.
End 2016. Ongoing.
Ground truthing of a selection of springs to assess the presence of EPBC listed species and EPBC communities.
On and off tenure springs baseline initiated as part of the (JIP), to be reported in April 2015.
Completed (2013).
Santos GLNG will assume responsibility of mitigation (if required) for on-tenure springs and those off-tenement springs as will be assigned by the Surat Underground Water Impact Report (UWIR)/DOTE.
Ongoing. Ongoing.
Santos GLNG Coal Seam Water Monitoring and Monitoring Annual Report 2015
March 2016 11
Condition Commitment Target Completion Date Specified in the Stage 2 CWMMP Rev 2
Status
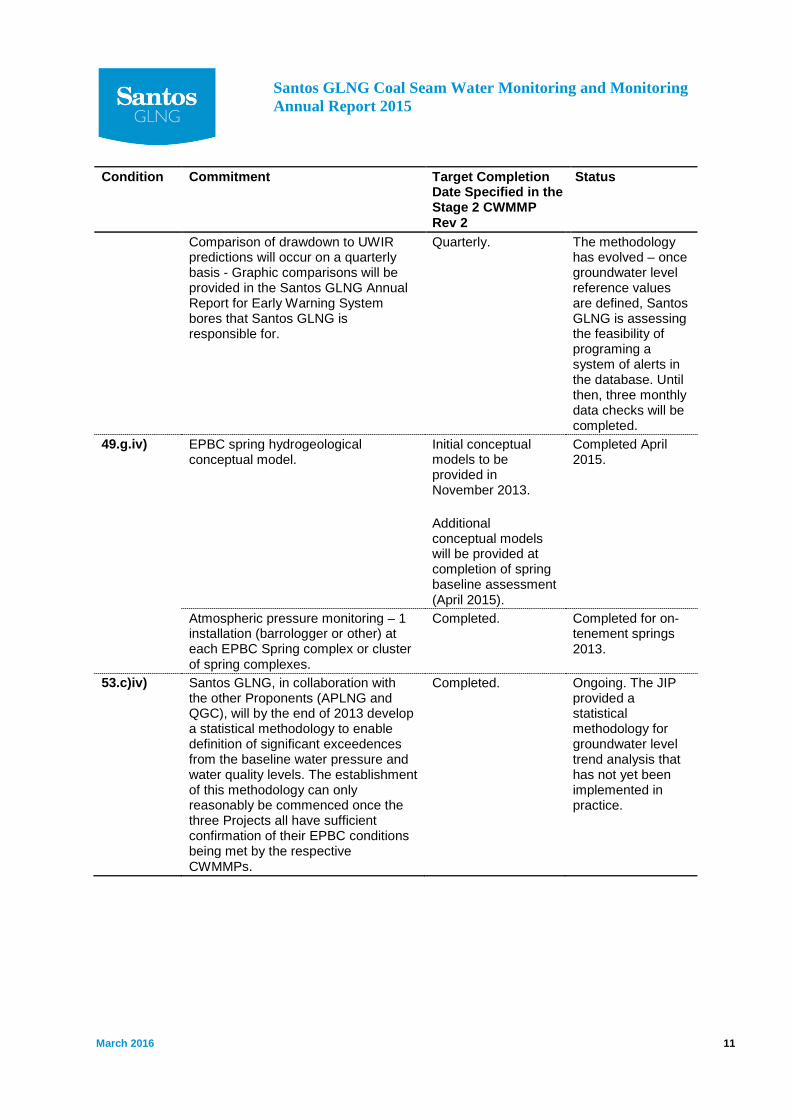
Comparison of drawdown to UWIR predictions will occur on a quarterly basis - Graphic comparisons will be provided in the Santos GLNG Annual Report for Early Warning System bores that Santos GLNG is responsible for.
Quarterly. The methodology has evolved – once groundwater level reference values are defined, Santos GLNG is assessing the feasibility of programing a system of alerts in the database. Until then, three monthly data checks will be completed.
49.g.iv) EPBC spring hydrogeological conceptual model.
Initial conceptual models to be provided in November 2013. Additional conceptual models will be provided at completion of spring baseline assessment (April 2015).
Completed April 2015.
Atmospheric pressure monitoring – 1 installation (barrologger or other) at each EPBC Spring complex or cluster of spring complexes.
Completed. Completed for on-tenement springs 2013.
53.c)iv) Santos GLNG, in collaboration with the other Proponents (APLNG and QGC), will by the end of 2013 develop a statistical methodology to enable definition of significant exceedences from the baseline water pressure and water quality levels. The establishment of this methodology can only reasonably be commenced once the three Projects all have sufficient confirmation of their EPBC conditions being met by the respective CWMMPs.
Completed. Ongoing. The JIP provided a statistical methodology for groundwater level trend analysis that has not yet been implemented in practice.

Santos GLNG Coal Seam Water Monitoring and Monitoring Annual Report 2015
March 2016 12
3.3 EPBC Springs Monitoring Progress Details of activities undertaken during 2015 are summarised in the following subsections.
3.3.1 Progress on the EPBC Springs Early Warning System Implementation Potential impacts on EPBC Springs continue to be monitored through a network of groundwater monitoring bores, providing early warning of potential impact propagating from the production gas fields towards the EPBC Spring in the source aquifer. The JIP defines the responsibilities for the implementation and monitoring of the groundwater monitoring bores.
There are 12 groundwater level monitoring installations which fall under Santos GLNG responsibility within the JIP, of which five are operational and the remaining seven were scheduled for completion in 2015. A summary status is provided in Table 3-2.
Table 3-2: Progress on EPBC Springs Early Warning System Monitoring Implementation
Bore Lat. (WGS84)
Long. (WGS84) Aquifer EPBC
Spring
Date Water Level Monitoring Commenced
Status
Contact Zone -25.8098 148.8276 Precipice Sandstone
Abyss, Lucky Last - Construction
planned 2016
MHTGWH01 -25.8250 148.7916 Hutton Sandstone Abyss Nov 2014 Active
MHTGWP01 -25.8250 148.7916 Precipice Sandstone Lucky Last Dec 2013 Active
MNHGWP02* -25.7881 148.9233 Precipice Sandstone
Abyss, Lucky Last Aug 2015 Active
AVLOP01 -25.9419 150.0742 Precipice Sandstone
Cockatoo Creek Dec 2015 Active
AVLGWH -25.9141 150.0736 Hutton Sandstone
Cockatoo Creek Dec 2013 Active
AVLVWH1 AVLVWH2 -25.9379 150.0739 Hutton
Sandstone Cockatoo Creek Dec 2012 Active
AVLVWP1 AVLVWP2 -25.9379 150.0739 Precipice
Sandstone Cockatoo Creek Dec 2012 Active
EWMI7 -24.6074 149.0761 Clematis Sandstone Elgin 2 - To be equipped in
2016
SBNGWH01 -25.8263 149.0370 Hutton Sandstone Yebna 2 - No groundwater
present
SBNGWP01 -25.8263 149.0370 Precipice Sandstone Yebna 2 Nov 2014 Active
MW0902 -25.7347 149.0829 Precipice Sandstone Yebna 2 Jan 2011 Active
Notes: * MNHGWP02 replaces MW0905 as originally specified in the JIP.
3.3.2 Spring Baseline Acquisition The Industry has delivered quarterly spring baseline surveys throughout 2015, these will continue throughout 2016 in accordance with the requirements of the Spring Impact Monitoring Strategy outlined in the UWIR for the Surat CMA.

Santos GLNG Coal Seam Water Monitoring and Monitoring Annual Report 2015
March 2016 13
3.4 EPBC Spring Hydrogeological Conceptual Models GLNG was required to reconceptualise springs associated with EPBC values by 30th April 2015. Using information collected during the baseline monitoring and additional research conducted both by the OGIA and by GLNG, the OGIA prepared conceptualisation reports for the EPBC listed spring sites. These conceptualisation reports were submitted to the DOTE in a letter from the OGIA dated 30th April 2015.
3.5 Assessment of Trends for Analysis of Groundwater Data The definition of reference values is ongoing based on the period that the equipped monitoring bores have been able to gather data. Of the bores that have been equipped with monitoring, there are monitoring locations that have data over a period of more than a year. Whilst assessment of the groundwater level trends in these bores is ongoing, a summary of the assessment to date is summarised for each of these bores.
To date apparent generalised upward or downward trends that seem or are conclusively typical across the periods in which monitoring data has been collected have not been identified. Most trends appear to be seasonal, with seasonal (i.e. intra-annual) groundwater pressure variations being less than inter-annual variations.
A statistical methodology is being defined which can objectively define the meaningful threshold values against which the significance of groundwater pressure variations can be assessed against baseline water pressures. It is predicted that several years of data collection before baseline values and threshold trigger values for a change to groundwater pressures at an Early Warning Spring (EWS) can be objectively determined.
The following sections present a summary of the observed groundwater level trends data collected to date.
3.5.1 Yebna 2 Spring Complex MW0902 and SBNGWP01 are EWS bores for the Yebna 2 EPBC spring complex. Groundwater pressure data for these bores is displayed graphically in Figure 3-1.
MW0902 has been monitoring the Precipice Sandstone since January 2011 and has shown a general upward trend in groundwater level since Q4 in 2012. The groundwater level has increased by approximately 1 metre (m) through 2015, therefore at a rate of approximately 1 m increase per year. Within a year, the groundwater level may vary by up to around 0.5 m more or less than the long-term mean groundwater level.
SBNGWP01 has been monitoring the Precipice Sandstone since December 2014 and has shown a general upward trend in groundwater level since that time. The groundwater level has increased by approximately 1 metre (m) through 2015, therefore at a rate of approximately 1 m increase per year. Within a year, the groundwater level may vary by up to around 0.5 m more or less than the long-term mean groundwater level.

Santos GLNG Coal Seam Water Monitoring and Monitoring Annual Report 2015
March 2016 14
Figure 3-1: Yebna 2 EWS Groundwater Pressure Data
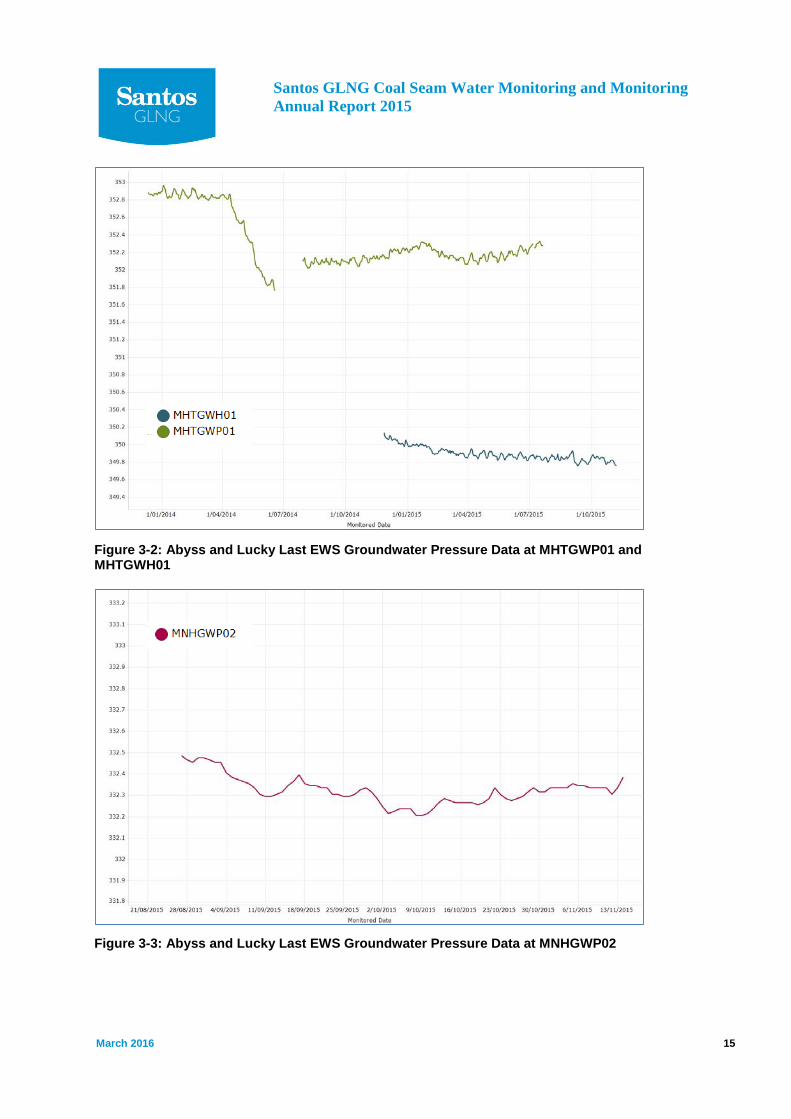
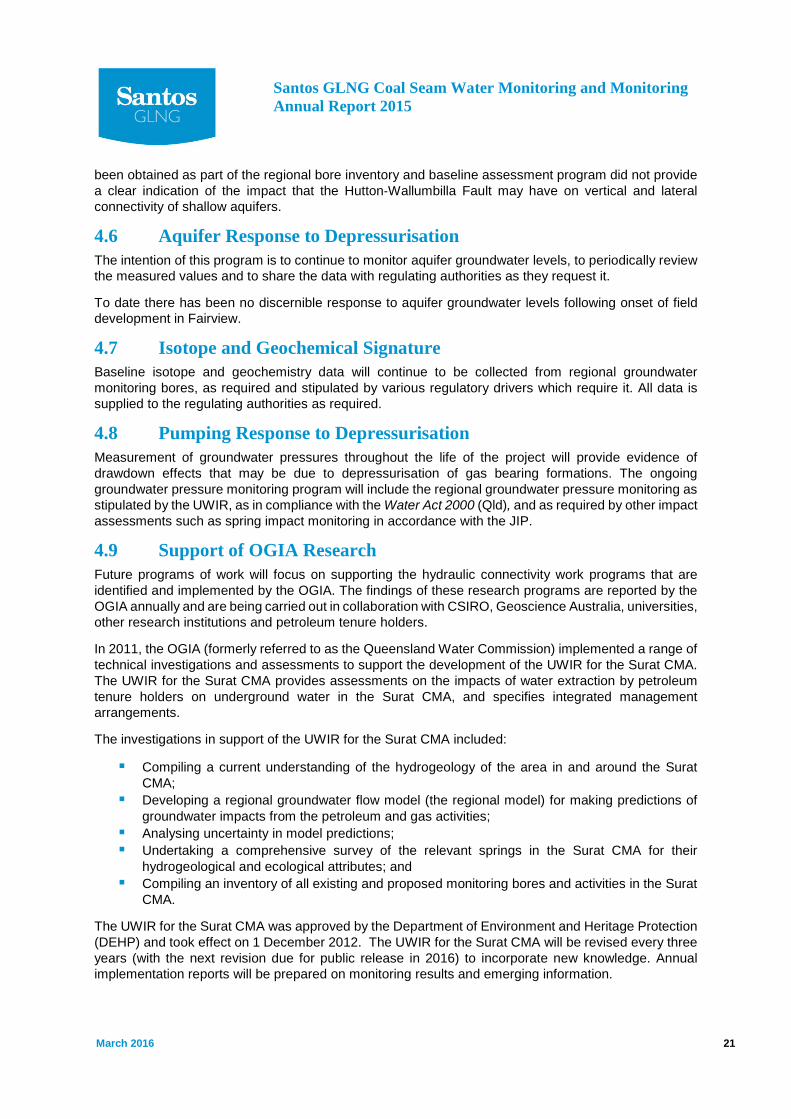
3.5.2 Abyss / Lucky Last Spring Complexes MHTGWP01, MHTGWH01 and MNHGWP02 are EWS bores for the Abyss and Lucky Last EPBC spring complexes. Groundwater pressure data for these bores is displayed graphically in Figure 3-2 and Figure 3-3.
MHTGWP01 has been monitoring the Precipice Sandstone since December 2013, and is located more than 10 km west of any active gas field development. It generally shows a downward trend since April 2014, and a stable to rising trend since August 2014. Throughout 2015, groundwater pressures vary by up to around 0.2 m.
MHTGWH01 has been monitoring the Hutton Sandstone since November 2014, and is located more than 10 km west of any active gas field development. It generally shows a downward to stable trend since monitoring commenced. Throughout 2015, groundwater pressures vary by up to around 0.2 m.
MNHGWP02 has been monitoring the Precipice Sandstone since August 2015, and is also located more than 10 km west of any active gas field development. It generally shows a downward to stable trend since monitoring commenced. Throughout 2015, groundwater pressures vary by up to around 0.3 m.
Santos GLNG Coal Seam Water Monitoring and Monitoring Annual Report 2015
March 2016 15
Figure 3-2: Abyss and Lucky Last EWS Groundwater Pressure Data at MHTGWP01 and MHTGWH01
Figure 3-3: Abyss and Lucky Last EWS Groundwater Pressure Data at MNHGWP02

Santos GLNG Coal Seam Water Monitoring and Monitoring Annual Report 2015
March 2016 16
3.5.3 Cockatoo Creek Spring Complexes AVLGWH01, AVLVWH1, AVLVWH2, AVLVWP1 and AVLVWP2 are EWS bores for the Cockatoo Creek Spring Complex. Groundwater pressure data for these bores is displayed graphically in Figure 3-4.
Figure 3-4: Cockatoo Creek Spring Complex EWS Groundwater Pressure Data
3.5.3.1 AVLGWH01 AVLGWH01 has been monitoring the Hutton Sandstone since January 2013, and is located more than 30 km north of Santos GLNG gas field development areas. AVLGWH01 is a landholder bore that is understood to remain in operation as an active extraction bore.
The observed groundwater pressures in the bore generally show a downward trend since the record began in January 2013. Throughout 2013 the rate of decline was approximately 0.2 m/year, in 2014 the rate of decline was approximately 0.7 m/year.
It is not possible to know if the decrease in groundwater level represents seasonal variation, or longer term decline. Throughout 2015 the water level varied by more than 20 m which most likely comprises the water pressure response to pumping of the bore. The increased rate of decline of the bore water level throughout 2014 most likely corresponds to a period of increased abstraction intensity, rather than gas field development activities. In 2015 it appears that abstraction abated and the water pressures appear more stable, varying around 3 m for the latter half of 2015.
3.5.3.2 AVLVWH1/ AVLVWH2 AVLVWH1 and AVLVWH2 are monitoring points located within the same Vibrating Wire Piezometer (VWP) monitoring location. There is no Santos GLNG gas field development area in close proximity to

Santos GLNG Coal Seam Water Monitoring and Monitoring Annual Report 2015
March 2016 17
this location. The two monitoring points are monitoring different depths in the Hutton Sandstone, with H1 being at 155 mbgl and H2 at 250 mbgl.
The VWP has been monitoring the Hutton Sandstone since December 2012. The two monitoring depths show different groundwater level trends.
H1 (the shallowest) shows a general downward trend in groundwater level since records began. The groundwater level has decreased by approximately 5 m from December 2012 to May 2014. Since May 2014, water levels appeared to have stabilised at approximately 247 mAHD, and increased from around May 2015. Groundwater levels vary around the longer term average water level by up to 4 m seasonally.
H2 (the deeper) shows a period of increasing groundwater levels from December 2012 to June 2013 (13 m increase), prior to demonstrating a period of decline from June 2013 to April 2015, and appear stable throughout the remainder of 2015. Groundwater levels vary around the longer term average water level by up to 4 m seasonally.
3.5.3.3 AVLVWP1/AVLVWP2 AVLVWP1 and AVLVWP2 are monitoring points located within the same VWP monitoring location. The two monitoring points are monitoring different depths in the Precipice Sandstone, with P1 being at 490 mbgl and P2 at 528 mbgl.
The VWP has been monitoring the Precipice Sandstone since December 2012. The two monitoring depths show different groundwater level trends.
P1 (the shallowest) shows a general upward trend in groundwater levels, with a more recent decline. The groundwater level has increased by approximately 12 m from December 2012 to December 2014, approximately 6 m/year. In August 2015, groundwater levels dropped rapidly by around 15 m and appear broadly stable throughout the rest of 2015. Within any single year, the groundwater level may vary by up to around 10 m more or less than the long-term mean groundwater level.
P2 (the deeper) shows a period of decreasing but stabilising groundwater levels from December 2012 to December 2015. Over this period the water level decreased by approximately 3.5 m/year. Within any single year, the groundwater level may vary by up to around 1 m more or less than the long-term mean groundwater level.

Santos GLNG Coal Seam Water Monitoring and Monitoring Annual Report 2015
March 2016 18
4.0 Aquifer Connectivity 4.1 Overview In accordance with approval conditions Santos GLNG has undertaken its own primary data collection and interpretation related to aquifer connectivity. Santos GLNG has also provided data to various work programs being undertaken by State and Federal Government departments, including the OGIA, Commonwealth Scientific and Industrial Research Organisation (CSIRO) and the Office of Water Science.
Santos GLNG activities and results to October 2013 were reported in the Stage 2 CWMMP Rev 2. No major additional results have been collected since the submission of the Stage 2 CWMMP Rev 2, however the forward work program is outlined in the following sections.
4.2 Coal Seam Water Monitoring and Management Plan Commitments Table 4-1 provides an outline of Santos GLNG’s commitments presented in the Stage 2 CWMMP Rev 2, specific to aquifer connectivity and progress against each commitment.
Table 4-1: Stage 2 CWMMP Rev 2 Commitments – Aquifer Connectivity Condition Commitment Target
Completion Date Specified in the Stage 2 CWMMP Rev 2
Status
49b, 53b, 53d(i)4)
Santos GLNG committed to provide further characterisation on the level of connectivity between the formations. Most of the studies, at this stage, are ongoing and not yet conclusive. Note that the results, where available, will be presented in future updates to the CWMMP. Multi-level monitoring bores. Ongoing
monitoring and data assessment.
Completion of monitoring bores in 2014, ongoing data collection and further installations scheduled for 2016.
Contact Zone Program. Ongoing after installation.
Initial monitoring data available, further installations on hold pending results.
Wallumbilla Fault Program. Installation planned for 2014, scope currently under development.
Complete. Additional monitoring data not feasible.
Aquifer response to CSG depressurisation.
Ongoing. Ongoing.
Isotope and geochemical signature. Ongoing. Ongoing. Pumping response observations and assessments.
Annually from 2014.
Ongoing.
The outcomes of the conventional oil and gas well and water bore risk assessment will be presented in an update to the CWMMP.
2014. Ongoing. Updated CWMMP is due four months after the revised UWIR.

Santos GLNG Coal Seam Water Monitoring and Monitoring Annual Report 2015
March 2016 19
4.3 Multi-level monitoring The Santos GLNG monitoring network includes multi-level piezometers and nested single-zone groundwater level monitoring bores. These piezometers target aquifers and specific monitoring zone depths to pre-defined data acquisition objectives. The number of multi-level monitoring locations is summarised in the Table 4-2.
Table 4-2: Number of Active Multi-level Groundwater Level Monitoring Installations Gas Field Number of Active, Multi-level Installations or Nested
Bore Sites Roma 21
Fairview 3
Multi-level monitoring data will continue to be collected, such data are provided to the OGIA.
4.4 Contact Zone near the Fairview Field Erosion of the Rewan Formation in the south western corner of Fairview prior to deposition of the Precipice Sandstone has resulted in an unconformity where the Precipice Sandstone directly overlies the Bandanna Formation. This area is referred to as a contact zone. The contact zone does not underlie an area that is proposed to be an operational gas field for the Bandanna Formation. The nearest potentially producing gas well in the Bandanna Formation is located approximately 3 km from the contact zone.
Since the initial definition of this study program, the location and extent of the contact zone in Fairview has been reviewed using more recently acquired geological data. This has reduced the size of the contact zone.
The project plan was to investigate the geological stratigraphy and monitor the contact zone through the construction of a number of groundwater monitoring bores as defined in Table 4-3. Two vibrating wire piezometers were installed in 2009 (VWP0902 and VWP0903), and one monitoring bore was installed in 2013 (QWC129, also referred to as MTGWP01 or the Mount Hutton bore). Given the revised location of the contact zone, the Mount Hutton bore, VW0902 and VW0903 are no longer interpreted to be in the contact zone. The closest monitoring point is VW0902 which is expected to be less than 400 m from the contact zone.
Santos GLNG has been negotiating to secure the land access agreement required to allow it to drill the location labelled “Contact Zone”. An agreement has not been achieved and alternative solutions are being investigated including the possibility of equipping a private bore nearby with a water level sensor once the target aquifer is confirmed (e.g. by groundwater sampling and downhole geophysics).
The completion and/or equipment of groundwater monitoring location in the Precipice Sandstone will also address a commitment of the JIP for the management and monitoring of EPBC Springs.

Santos GLNG Coal Seam Water Monitoring and Monitoring Annual Report 2015
March 2016 20
Table 4-3: Status of Groundwater Level Monitoring Installations Investigating the Contact Zone in Fairview
*Proposed bore location is to be delivered by APLNG, drilling and completion schedule not known.
4.5 Hutton-Wallumbilla Fault The Hutton-Wallumbilla Fault (also called the Wallumbilla Fault) is defined as a complex faulting system. The fault system consists of a main fault to which are associated a number of secondary significant faults. The fault system spreads in width of approximately two kilometres. The main fault is not a straight box offset fault type and its characteristics vary along the fault profile. The main fault offset can be made of a number of offsets with varying displacements. The amplitude of the displacement varies from a few metres to the south to about 50 m to the north of the Roma field.
The fracturing and the displacement do not affect the full stratigraphic profile. The main faulting occurred during a compressive phase of mid-Triassic. The faults were reactivated during the mid-cretaceous causing minor faulting throughout the Secondary sequences or causing folding. Fractures affecting the Secondary could also result from differential sediments compaction and as such be tension fractures.
Using the Boxgrove Ironstone Member (a reliable geophysical/seismic marker) at the top of the Boxvale Sandstone, seismic sections show that the formations above the Evergreen Formation are continuous across the fault. Therefore it is now interpreted that the coal beds of the Walloon Coal Measures and all the aquifers above them are continuous across the fault zone.
Beneath the Walloon Coal Measure, the Precipice Sandstone would have been deposited, over the structure prior to the significant displacement and therefore is hydrogeologically a non-continuous structure across the Roma Shelf. The displacement of the Precipice Sandstone appears to be over 50 m, whereas the Precipice Sandstone at this location is not more than 25 m thick. Besides discontinuity, lateral permeability is limited by lithology with the Precipice Sandstone comprising well cemented fine-grained sands, less typical of the highly permeable, coarse sandstone depositions of Precipice Sandstone observed in other areas of the Surat Basin, away from the Roma Shelf.
In terms of its hydraulic properties, the Hutton-Wallumbilla Fault is not necessarily considered to be a barrier to horizontal flow through aquifers that are younger than the Evergreen Formation. Conversely, lateral extent and integrity of lower permeability aquitards layers above the Evergreen Formation are also considered to be continuous, and as such provide a continuous throttle to vertical pressure prorogation and fluid flow. As such, the fault is not expected to play a major role in controlling drawdown resulting from coal seam depressurisation neither vertically (i.e. between formations) and horizontally (i.e. across formations).
A hydrogeochemistry review was undertaken of bore water chemistries around the Hutton-Wallumbilla Fault in the Roma field to understand whether this data might elude to the presence of vertical flow and connectivity pathways between the shallow (above coal) water bearing formations of the Bungil, Mooga, Orallo and Gubberamunda sandstones. The review concluded that the water chemistry data that had
Bore name Monitored Formation Status VW0902 Precipice Sandstone Completed
VW0903 Precipice Sandstone Completed
Contact Zone (Ok Station) Precipice Sandstone Planned 2016
Hutton Sandstone -
QWC 129 – Mount Hutton Precipice Sandstone Completed
Hutton Sandstone Completed
Spring Gully – PB1 Precipice Sandstone Completed
Hutton Sandstone Not completed*
Santos GLNG Coal Seam Water Monitoring and Monitoring Annual Report 2015
March 2016 21
been obtained as part of the regional bore inventory and baseline assessment program did not provide a clear indication of the impact that the Hutton‐Wallumbilla Fault may have on vertical and lateral connectivity of shallow aquifers.
4.6 Aquifer Response to Depressurisation The intention of this program is to continue to monitor aquifer groundwater levels, to periodically review the measured values and to share the data with regulating authorities as they request it.
To date there has been no discernible response to aquifer groundwater levels following onset of field development in Fairview.
4.7 Isotope and Geochemical Signature Baseline isotope and geochemistry data will continue to be collected from regional groundwater monitoring bores, as required and stipulated by various regulatory drivers which require it. All data is supplied to the regulating authorities as required.
4.8 Pumping Response to Depressurisation Measurement of groundwater pressures throughout the life of the project will provide evidence of drawdown effects that may be due to depressurisation of gas bearing formations. The ongoing groundwater pressure monitoring program will include the regional groundwater pressure monitoring as stipulated by the UWIR, as in compliance with the Water Act 2000 (Qld), and as required by other impact assessments such as spring impact monitoring in accordance with the JIP.
4.9 Support of OGIA Research Future programs of work will focus on supporting the hydraulic connectivity work programs that are identified and implemented by the OGIA. The findings of these research programs are reported by the OGIA annually and are being carried out in collaboration with CSIRO, Geoscience Australia, universities, other research institutions and petroleum tenure holders.
In 2011, the OGIA (formerly referred to as the Queensland Water Commission) implemented a range of technical investigations and assessments to support the development of the UWIR for the Surat CMA. The UWIR for the Surat CMA provides assessments on the impacts of water extraction by petroleum tenure holders on underground water in the Surat CMA, and specifies integrated management arrangements.
The investigations in support of the UWIR for the Surat CMA included:
Compiling a current understanding of the hydrogeology of the area in and around the Surat CMA;
Developing a regional groundwater flow model (the regional model) for making predictions of groundwater impacts from the petroleum and gas activities;
Analysing uncertainty in model predictions; Undertaking a comprehensive survey of the relevant springs in the Surat CMA for their
hydrogeological and ecological attributes; and Compiling an inventory of all existing and proposed monitoring bores and activities in the Surat
CMA.
The UWIR for the Surat CMA was approved by the Department of Environment and Heritage Protection (DEHP) and took effect on 1 December 2012. The UWIR for the Surat CMA will be revised every three years (with the next revision due for public release in 2016) to incorporate new knowledge. Annual implementation reports will be prepared on monitoring results and emerging information.
Santos GLNG Coal Seam Water Monitoring and Monitoring Annual Report 2015
March 2016 22
OGIA is carrying out research to build new knowledge about the groundwater flow systems to support the revision of the UWIR. The research projects are being carried out in collaboration with CSIRO, Geoscience Australia, universities and petroleum tenure holders.
The following sections provide a summary of OGIA research projects being developed and implemented by the OGIA. The descriptions are largely taken directly from OGIA literature.
4.9.1 Condamine Connectivity Project Although the impact on the Condamine Alluvium (CA) from depressurisation of the underlying Walloon Coal Measures (WCM) is expected to be relatively small, the alluvium is an essential resource that is heavily developed. Therefore improving understanding about interconnectivity between the formations is important.
Improving understanding of the connectivity between the CA and the WCM involves improving understanding of the geology of the contact zone between the formations, and the hydraulic properties of the contact zone. Multiple lines of investigation are being pursued including:
Water level mapping; Aquifer pump testing; Geological mapping; and Synthesis (updated hydrogeological conceptualisation).
Santos GLNG is not required to contribute data to the project since the Condamine Alluvium is not located on or near (>50 km) GLNG tenures.
4.9.2 Walloon Connectivity Project The Walloon Coal Measures will be extensively depressurised during gas production. The hydraulic properties and distribution of the overlying and underlying material are the primary factors affecting the extent to which associated aquifers will be affected. For this project, a similar approach is being used to that for the Condamine Connectivity Project. Due to the extent of the area, the project is focused at both regional and local scales. Local scale investigations are being carried out in collaboration with tenure holders.
Improving understanding of the connectivity between the gas bearing areas of the WCM and the overlying and underlying aquifers involves improving understanding of the geology and hydraulic properties of the aquitards. Because the aquitards cover such a large area, investigations are being carried out at both local and regional scales.
Santos GLNG contributes by providing available subsurface data to OGIA that is requested in relation to this research project, where such data are available.
4.9.3 Geological Modelling Project A new geological model is being prepared as a basis for the later construction of the new groundwater flow model. The geological model is being developed principally by stratigraphic interpretation and correlation of downhole geophysical data (wireline logs) from petroleum and gas wells. Building upon existing approaches, a regionally consistent stratigraphic framework has been developed as the basis for correlation. Initially the data available from the bore holes is interpreted and then the framework is used to make a consistent and robust interpretation between these points across the extent of the model area.
Santos GLNG contributes by providing available subsurface data to OGIA that is requested in relation to this research project, where such data are available.
Santos GLNG Coal Seam Water Monitoring and Monitoring Annual Report 2015
March 2016 23
4.9.4 Modelling Methodology Project A groundwater flow model for the Surat Cumulative Management Area needs to represent complex multilayered geology and the movement of groundwater in gaseous coal formations. Improved techniques for modelling are being identified and tested. Such areas for improvement and testing include dual phase flow modelling, regional versus local scale representation, and optimising the simplification of complex systems.
Santos GLNG contributes by providing available subsurface data to OGIA that is requested in relation to this research project, where such data are available.
4.9.5 Geological Structures Project Geological structures, such as faults, have the potential to affect the flow of groundwater. The project will update the mapping of structures and assess their hydraulic characteristics.
Santos GLNG contributes by providing any available subsurface data to OGIA that is requested in relation to this research project, where such data are available.
4.9.6 Spring Knowledge Project Improved understanding of the risk to springs requires improved understanding of spring function. Conceptual options for the hydrogeological setting of representative springs have been developed and field data is being collected to refine understandings. Spring monitoring methodologies are being reviewed and a field trial is currently being designed.
In parallel with other research projects, OGIA is carrying out the Spring Knowledge Project (SKP) to advance understanding in relation to springs. Major component subprojects are:
Enhancing knowledge about the hydrogeological setting of springs; Improving the techniques for monitoring springs; and Identifying watercourse sections that are receiving a groundwater contribution.
The outcomes from the SKP will be used to inform the future assessments of risks to springs and the monitoring and management arrangements when the UWIR is reviewed in December 2015.
Santos GLNG contributes by providing relevant available data to OGIA that is requested in relation to this research project, where such data are available. More detail regarding the spring monitoring program that is directly financed by Santos GLNG is provided in Chapter 3 (EPBC Springs).

Santos GLNG Coal Seam Water Monitoring and Monitoring Annual Report 2015
March 2016 24
5.0 Managed Aquifer Recharge 5.1 Overview Managed aquifer recharge (MAR) is the purposeful recharge (or injection) of water to aquifers for subsequent recovery. In the case of the proposed Santos GLNG MAR trial in Roma, the injected water comprises treated coal seam water.
This section provides an update on the water monitoring and management strategies that Santos GLNG proposes to implement for MAR. This reiterates the work that has been completed to date, and provides an update to the development schedule that was outlined in the Stage 2 CWMMP Rev 2.
5.2 Coal Seam Water Monitoring and Management Plan Commitments Table 5-1 provides an outline of Santos GLNG’s commitments presented in the Stage 2 CWMMP Rev 2, specific to MAR and progress against each commitment.
Table 5-1: Stage 2 CWMMP Rev 2 Commitments – MAR Condition Commitment Target Completion
Date Specified in the Stage 2 CWMMP Rev 2
Status
49c, 53a, 53d)ii
Santos GLNG has developed a MAR pilot program and schedule for gas field piloting of aquifer reinjection:
Fairview CSG Field Stage 1– Desktop Study.
Completed March 2012.
Completed March 2012.
Roma CSG Field Stage 1– Desktop Study. Completed January 2011.
Completed January 2011.
Roma CSG Field Stage 2 – Investigations and Assessment.
Completed January 2011.
Completed January 2011.
Roma CSG Field pilot trial (Hermitage) Stage 3 – Construction and Commissioning.
Completed in Q1/Q2 2012.
Completed Q1/Q2 2012.
Roma CSG Field pilot trial (Hermitage) Stage 4 – Operation.
Completed Q4 2012. Completed Q4 2012.
Roma CSG Field (The Bend) Stage 3 – Construction and Commissioning.
Due for completion Q3 2014.
Due for completion Q4 2016.
Roma CSG Field (The Bend) Stage 4 – Operation.
Due to commence Q3/Q4 2014.
Due to commence Q1 2017.
Arcadia CSG Field Stage 1 – Desktop Study.
Completed September 2013.
Completed September 2013.
All approved Injection Management Plans will be provided in an update to the CWMMP.
Ongoing. Ongoing.

Santos GLNG Coal Seam Water Monitoring and Monitoring Annual Report 2015
March 2016 25
5.3 Status of Feasibility and Regulatory Approval Santos GLNG is assessing the feasibility of implementation of MAR within the Roma field at the location of water treatment and gas compressor station Roma Hub Compressor Station 2 (HCS-02).
MAR in Roma would comprise injection of treated water into a number of injection wells, as few as four and as many as 12 injection wells may be used. The number of wells will depend upon the total volume of water produced by Santos GLNG activities; less the demands for coal seam water from the portfolio of alternative beneficial re-use strategies such as construction, dust suppression and irrigation.
An application to the Queensland Government was sought to amend Environmental Authority (EA) conditions to permit the operation of MAR in the Roma field. This amendment was approved in 2014 following the submission including an Injection Management Plan (IMP) in support of the amendment application.
The IMP adopts a risk management framework consistent with the “National Water Quality Management Strategy, Australian Guidelines for Water Recycling Managing Health and Environmental Risks (Phase 2), Managed Aquifer Recharge”. The finalised IMP that was submitted to DEHP on 15 January 2014 was provided in the 2013 CWMMP Annual Report (Santos GLNG, 2014).
There are no new findings regarding MAR feasibility to those presented in the Stage 2 CWMMP Rev 2.

Santos GLNG Coal Seam Water Monitoring and Monitoring Annual Report 2015
March 2016 26
6.0 Hydraulic Fracturing 6.1 Overview Hydraulic fracturing is employed in the petroleum industry to improve the production efficiency of appraisal and production wells (i.e. more efficient and more economical extraction of gas from the coal seams). Hydraulic fracturing is not carried out on all wells as the process is only necessary at locations with low permeability.
Hydraulic fracturing is carried out as one of the last activities in the construction of an appraisal and/or production well and prior to bringing the well into service. It is typically performed on newly drilled and constructed appraisal and production wells after the final well casing pipe has been inserted and the bore annulus cemented and after the casing has been perforated (i.e. the well is opened to access specific coal seams).
Hydraulic fracturing uses a mix of water, sand and minor concentrations of other fluids mixed on the surface and then injected down into the well and then through the perforations into the coal seam. The water and sand are typically up to around 99% of the volumes of the hydraulic fracturing fluids, the remainder being the added chemical used to enhance the process.
The hydraulic fracturing process occurs under varying positive high hydraulic pressures (ranging from approximately 7,000 to 34,500 KPa) in order to open existing fractures in the coal matrix. The hydraulic fracturing fluids are injected through the perforations in the steel well casing pipe via wellhead works on the surface and coil-tube pipe down to a device which isolates the coal seam to be fractured.
After completion of the stimulation, the well is put into production. The initial produced fluids (often referred to "flow-back") largely comprises the water used in the hydraulic fracturing fluid mixture, degraded additives as well as coal seam water and other geo-genic constituents sourced from the target formation.
6.2 Coal Seam Water Monitoring and Management Plan Commitments Table 6-1 provides an outline of Santos GLNG’s commitments presented in the Stage 2 CWMMP Rev 2, specific to hydraulic fracturing and progress against conditions.
Table 6-1: Stage 2 CWMMP Rev 2 Commitments – Hydraulic Fracturing Condition Commitment Target Completion
Date Specified in Stage 2 CWMMP Rev 2
Status
49e Santos GLNG will provide a projection of the anticipated number of wells to be hydraulically stimulated during each year (up to and including 2015) as well as the number of hydraulic stimulations completed in the preceding year. Additional details to be reported will also include location information and the depth of each respective hydraulic stimulation.
Annually. Complete Provided in Figure 6-1, Figure 6-2 and Table 6.2 of this Annual Report.
49f
Santos GLNG has agreed with the Department of the Environment to undertake additional Direct Toxicity Assessment that will include:
December 2013. Ongoing, due for completion 2016.
Santos GLNG Coal Seam Water Monitoring and Monitoring Annual Report 2015
March 2016 27
Condition Commitment Target Completion Date Specified in Stage 2 CWMMP Rev 2
Status
• an ecotoxicological program, involving, for example, a comparison of (i) coal seam water, (ii) coal seam water with fraccing chemicals, and (iii) fraccing chemicals in freshwater;
• assessing the risk of individual fraccing chemicals of concern; and
• assessing contribution of fraccing chemicals to toxicity of fraccing fluids and flow-back waters (mixture toxicity).
Santos GLNG is committed to undertaking these assessments, as part of the joint industry Ecotoxicity Work Program; the result of which will be provided to the Department of the Environment upon completion.
6.3 Hydraulic Fracturing in 2015 As of December 2015, 51 wells within the Santos GLNG gas fields had been hydraulically fractured in 2015, a total of 152 hydraulic fracturing events/stages were completed within these 51 wells. The location and depth of the hydraulic fracturing stages are presented in Table 6-2.
The spatial distribution of wells that have been hydraulically fractured to the end of 2015 within the Santos GLNG gas fields are presented in Figure 6-1. Figure 6-2 contains the anticipated number of wells to be hydraulically fractured throughout the gas fields in 2016.
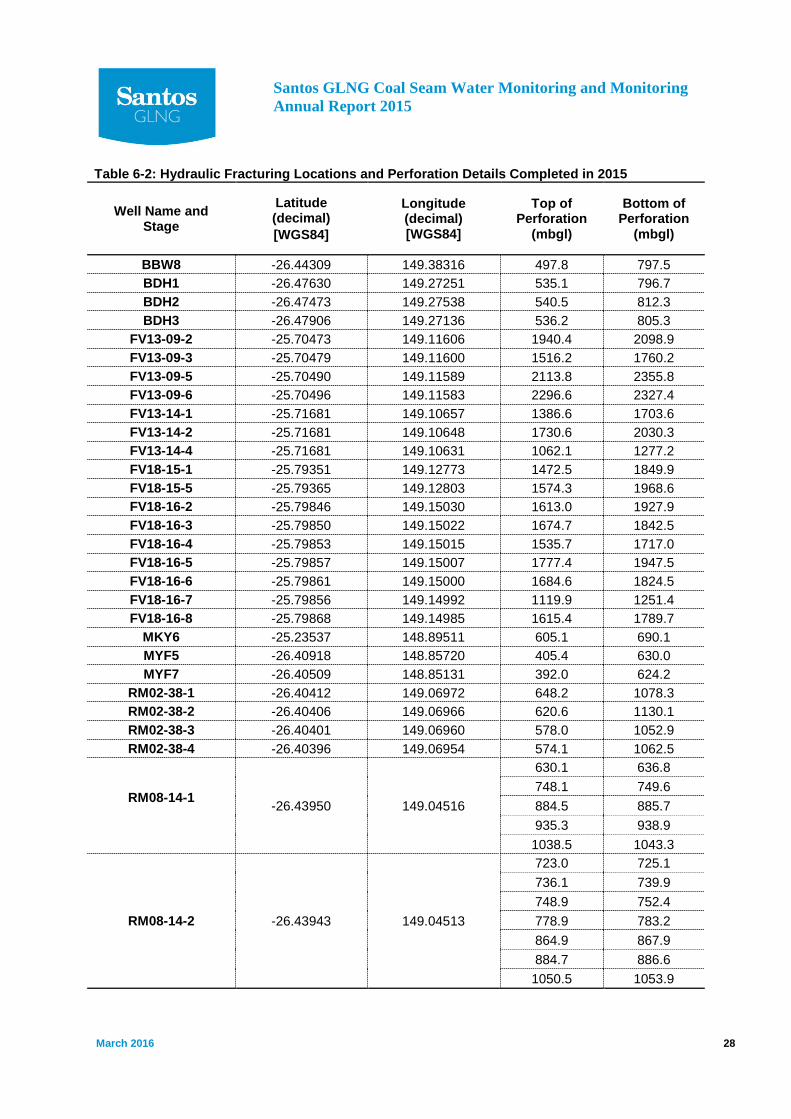
Santos GLNG Coal Seam Water Monitoring and Monitoring Annual Report 2015
March 2016 28
Table 6-2: Hydraulic Fracturing Locations and Perforation Details Completed in 2015
Well Name and Stage
Latitude (decimal) [WGS84]
Longitude (decimal) [WGS84]
Top of Perforation
(mbgl)
Bottom of Perforation
(mbgl)
BBW8 -26.44309 149.38316 497.8 797.5 BDH1 -26.47630 149.27251 535.1 796.7 BDH2 -26.47473 149.27538 540.5 812.3 BDH3 -26.47906 149.27136 536.2 805.3
FV13-09-2 -25.70473 149.11606 1940.4 2098.9 FV13-09-3 -25.70479 149.11600 1516.2 1760.2 FV13-09-5 -25.70490 149.11589 2113.8 2355.8 FV13-09-6 -25.70496 149.11583 2296.6 2327.4 FV13-14-1 -25.71681 149.10657 1386.6 1703.6 FV13-14-2 -25.71681 149.10648 1730.6 2030.3 FV13-14-4 -25.71681 149.10631 1062.1 1277.2 FV18-15-1 -25.79351 149.12773 1472.5 1849.9 FV18-15-5 -25.79365 149.12803 1574.3 1968.6 FV18-16-2 -25.79846 149.15030 1613.0 1927.9 FV18-16-3 -25.79850 149.15022 1674.7 1842.5 FV18-16-4 -25.79853 149.15015 1535.7 1717.0 FV18-16-5 -25.79857 149.15007 1777.4 1947.5 FV18-16-6 -25.79861 149.15000 1684.6 1824.5 FV18-16-7 -25.79856 149.14992 1119.9 1251.4 FV18-16-8 -25.79868 149.14985 1615.4 1789.7
MKY6 -25.23537 148.89511 605.1 690.1 MYF5 -26.40918 148.85720 405.4 630.0 MYF7 -26.40509 148.85131 392.0 624.2
RM02-38-1 -26.40412 149.06972 648.2 1078.3 RM02-38-2 -26.40406 149.06966 620.6 1130.1 RM02-38-3 -26.40401 149.06960 578.0 1052.9 RM02-38-4 -26.40396 149.06954 574.1 1062.5
RM08-14-1
-26.43950
149.04516
630.1 636.8 748.1 749.6 884.5 885.7 935.3 938.9 1038.5 1043.3
RM08-14-2 -26.43943 149.04513
723.0 725.1 736.1 739.9 748.9 752.4 778.9 783.2 864.9 867.9 884.7 886.6 1050.5 1053.9

Santos GLNG Coal Seam Water Monitoring and Monitoring Annual Report 2015
March 2016 29
Well Name and Stage
Latitude (decimal) [WGS84]
Longitude (decimal) [WGS84]
Top of Perforation
(mbgl)
Bottom of Perforation
(mbgl)
RM08-14-2 -26.43943 149.04513 1156.5 1160.6
RM08-14-3 -26.43936 149.04510
644.0 645.5 651.3 653.9 700.5 706.8 734.3 739.0 752.5 753.7 872.6 874.0 925.5 929.6 1021.0 1027.2
RM08-14-4 -26.43929 149.04507
694.0 697.0 707.0 711.2 743.7 749.2 805.7 808.7 859.0 861.2 959.0 965.7 1050.2 1051.7 1172.4 1179.1
RM08-16-1 -26.45044 149.03221 833.0 1386.7 RM08-16-2 -26.45039 149.03215 766.9 1169.7 RM08-16-3 -26.45034 149.03209 885.7 1247.9 RM08-16-4 -26.45028 149.03203 649.2 1011.9
RM09-04-1 -26.41089 149.06259
538.4 994.2 569.0 575.7 613.7 615.6 682.4 683.9 711.6 713.1 736.0 737.5 762.0 762.9 892.5 898.4 925.2 931.4 974.3 979.4 993.3 994.2
RM09-04-2 -26.411 149.063
522.5 523.5 571.0 575.8 641.5 642.6 664.7 669.0 772.6 773.5 793.3 794.7 815.8 817.5

Santos GLNG Coal Seam Water Monitoring and Monitoring Annual Report 2015
March 2016 30
Well Name and Stage
Latitude (decimal) [WGS84]
Longitude (decimal) [WGS84]
Top of Perforation
(mbgl)
Bottom of Perforation
(mbgl)
RM09-04-2 -26.411 149.063 876.2 878.8 894.3 901.0
RM09-05-1 -26.414 149.083
438.7 445.4 566.3 570.3 589.0 591.6 748.0 752.8 772.8 774.8 828.1 834.1
RM09-05-2 -26.414 149.083
480.1 486.7 600.9 601.9 620.7 627.4 652.7 659.4 791.7 792.9 833.2 838.2 920.7 917.4 934.7 941.4
RM09-05-3 -26.414 149.083
641.8 648.5 692.0 698.7 720.0 724.9 756.0 761.0 799.0 802.0 819.0 820.5 833.1 839.8 902.6 904.1 950.3 952.2 1036.7 1041.3 1076.3 1077.5 1122.2 1127.0 1143.4 1147.6
RM09-05-4 -26.414 149.083
682.6 683.6 760.2 766.9 765.2 793.0 815.4 816.4 839.3 843.7 923.8 928.2 943.2 946.9 975.5 982.2 1009.1 1013.6 1166.1 1167.8

Santos GLNG Coal Seam Water Monitoring and Monitoring Annual Report 2015
March 2016 31
Well Name and Stage
Latitude (decimal) [WGS84]
Longitude (decimal) [WGS84]
Top of Perforation
(mbgl)
Bottom of Perforation
(mbgl)
RM09-05-4 -26.414 149.083
1230.1 1231.6 1260.4 1264.0 1287.6 1289.9 1306.2 1311.7
RM09-09-1 -26.426 149.071 690.0 1009.9 RM09-09-2 -26.427 149.071 602.8 1132.7 RM09-09-3 -26.427 149.071 587.5 1093.1 RM09-09-4 -26.427 149.071 636.3 1171.9 RM09-14-1 -26.432 149.057 609.2 833.6 RM09-14-2 -26.432 149.057 641.9 1045.3
RM09-24-1 -26.446 149.058
770.7 773.7 789.1 795.8 828.6 835.3 884.0 890.7 941.5 948.2 1087.8 1094.5 1153.5 1154.3 1197.0 1203.7
RM09-24-2 -26.446 149.058
788.7 789.7 799.7 800.7 872.6 874.1 922.7 924.2 973.2 974.7 999.5 1000.3 1062.4 1068.4 1103.7 1104.9 1126.7 1129.7 1195.7 1197.2 1216.7 1223.4
RM09-24-3 -26.446 149.058
492.1 498.3 537.9 540.9 555.0 556.5 641.2 644.2 703.4 704.9
SYH5 -25.295 148.899 674.7 740.8 mbgl – metres below ground level
Santos GLNG Coal Seam Water Monitoring and Monitoring Annual Report 2015
March 2016 32
6.4 Direct Toxicity Assessment As detailed in the Stage 2 CWMMP Rev 2, Santos GLNG committed to undertake additional Direct Toxicity Assessments as part of the joint Industry Working Group (IWG) CSG Fracturing Fluid Ecotoxicology Work Plan (Hydrobiology, June 2013). The Ecotoxicology Work Plan, prepared by Hydrobiology and approved by the former Department of Sustainability, Environment, Water, Population and Communities (now DOTE) and the Expert Panel for major coal seam gas projects, was developed to assess the incremental toxicity of fracturing fluids in the context of the natural ecotoxicity of coal seam gas water to surface water organisms. The direct toxicity assessment for various waters and fluids commenced in December 2015, this involves testing representative coal seam waters from wells to be fractured and testing the hydraulic fracturing fluid and coal seam water as formulated for injection. Although the direct toxicity assessment has commenced, due to reservoir characteristics limiting the speed at which wells selected for the toxicity assessment can be pumped, the final sample required to complete the process has been delayed. Based on the delay in collecting the final sample and the extended laboratory turnaround times, the Direct Toxicity Assessment is scheduled to be completed by the end of 2016.


Date: March 2016, File No. GLNG 612b
FIGURE 6-2
0 10 20 30 40 50 kmGLNG CSG WMMP
ANNUAL REPORT 2015
Santos GLNG
HYDRAULIC FRACTURING
LOCATIONS - SCHEDULED
Map Area
148° 149° 150°
148° 149° 150°
-27°
-26°
-25°
-27°
-26°
-25°
Number of ScheduledHydraulic Fracturing Locations
State Controlled Roads
© State of Queensland (Department of Transport and Main Roads) 2015
Hydrology
© Commonwealth of Australia (Geoscience Australia) 2009

Santos GLNG Coal Seam Water Monitoring and Monitoring Annual Report 2015
March 2016 35
7.0 Surface Water Monitoring 7.1 Overview The Fairview and Arcadia Valley fields are located within the Fitzroy Basin, whilst the Roma field is located in the upper catchment area of the Murray Darling Basin (MDB). The main water systems within the Fairview field are the Dawson River and its tributaries Baffle Creek and Hutton Creek. There are five creeks running through the Roma field which drain south to the Balonne River (Condamine-Balonne River system), including Dargal Creek, Bungil Creek, Blyth Creek, Wallumbilla Creek, and Yuleba Creek and from there into the MDB. The Arcadia Valley field lies within both the Comet River and Dawson River catchments, where the surface water network is largely limited to ephemeral streams.
Santos GLNG has established surface water monitoring programs for springs, treated coal seam water discharge points, ephemeral streams and permanent watercourses within these catchment systems.
7.2 Coal Seam Water Monitoring and Management Plan Commitments Table 7-1 provides an outline of the commitments made in the Stage 2 CWMMP Rev 2, specific to surface water monitoring and progress against each commitment.
Table 7-1: Stage 2 CWMMP Rev 2 Commitments – Surface Water Monitoring Condition Commitment Target Completion
Date Specified in Stage 2 CWMMP Rev 2
Status
49.g.vi) Surface Water Threshold Values Collection and reviewing 2 years of baseline data and development of upper and lower confidence levels (Threshold values) for key parameters (relevant to MNES).
End of 2014. Completed. Data acquisition ongoing.
7.2.1 Surface Water Threshold Values The review of baseline data and the development of threshold values for Fairview and Roma fields was completed in February 2015. Methodology for threshold derivation included the selection of sites from each key watercourse, evaluation of high and low flow data and statistical analysis using the Environmental Protection (Water) Policy 2009 and associated Water Quality Objectives (WQO’s) for regional comparison. The Surface Water Baseline Threshold Report is provided by URS (2015), refer to Appendix B.
A summary of the surface water monitoring program, including monitoring location, sub-catchment, relevant watercourses and period of record is also provided within the report. It is noted that the period of record may differ between the Baseline Threshold Report and Chapter 2 (Surface Water and Groundwater Baseline) due to surface water program establishment and decommissioning dates.
Ongoing collection of water quality sampling will be conducted within the Arcadia gas field until such time that threshold values have been established. The development of surface water threshold values for the Arcadia Valley gas field will be development at the time in which sufficient baseline data has been collected.
Santos GLNG Coal Seam Water Monitoring and Monitoring Annual Report 2015
March 2016 36
8.0 Brine Management 8.1 Overview Brine is defined as the concentrated reverse osmosis waste stream (RO concentrate). Once RO concentrate reaches above 40,000 mg/L total dissolved solids (TDS), it is then defined by DEHP as ‘brine’. Santos GLNG has the following mechanisms currently in place for RO concentrate management:
Fairview field: Santos GLNG stores and manages RO concentrate production in brine containment ponds.
Roma field: Santos GLNG stores and manages RO concentrate production in brine containment ponds.
Arcadia Valley field: No RO concentrate will be produced in Arcadia Valley field within the scope of the Santos GLNG Stage 2 CWMMP Rev 2.
Further brine management options or expansion of current options may be required as gas fields develop, Santos GLNG is currently assessing options for the long-term management of RO concentrate and/or brine.
8.2 Coal Seam Water Monitoring and Management Plan Commitments Table 8-1 provides an outline of Santos GLNG’s commitments presented in the Stage 2 CWMMP Rev 2, specific to brine management and progress against each commitment. Table 8-1: Stage 2 CWMMP Rev 2 Commitments – Brine Management Condition
Commitment Target Completion Date Specified in Stage 2 CWMMP Rev 2
Status
49.g.x) Brine Management Plans Provision of Brine Management Plans developed for Arcadia Valley, Roma and Fairview gas fields as a state government requirement within the respective gas field’s EA’s. These will be provided in an update to the CWMMP.
December 2014. March 2020 Due to an extension granted by the state government (DEHP) for provision of Brine Management Plans to December 2019.
8.3 Brine Management Progress As stated in the 2014 CWMMP Annual Report there has been a significant reduction in water volumes (approximately 30%-50%) then originally predicted in the CWMMP Rev 2, for the Roma and Fairview gas fields. This has therefore significantly reduced estimated brine production volumes.
During 2015, the focus on brine management studies included maximising beneficial use options for CSG and proposed uses, as well as increased focus on fit for purpose use of water that meets relevant standards, understanding and capitalising on these opportunities as priority will minimise brine and solid salt production.
The outcomes of brine and salt management feasibility assessments are ongoing; however, based on current sanctioned Development Projects, Santos GLNG has constructed sufficient storage capacity in the Fairview field for brine management to 2025, and 2019 in the Roma field. The Arcadia Valley field is not estimated to start production until 2018 and therefore there will be no brine to manage during the scope of the Stage 2 CWMMP Rev 2.
Santos GLNG Coal Seam Water Monitoring and Monitoring Annual Report 2015
March 2016 37
Extension was previously granted by the state government (DEHP) for provision of Brine Management Plans for Roma field and Fairview and Arcadia Valley fields by December 2019.

Santos GLNG Coal Seam Water Monitoring and Monitoring Annual Report 2015
March 2016 38
9.0 Subsidence 9.1 Overview Pressure reductions in the subsurface due to coal seam water production have the potential to cause subsidence within the coal seam and a risk of deformation at the ground surface. Santos GLNG is required by EPBC Act Approval Condition 65 to undertake:
a) baseline and ongoing geodetic monitoring programs to quantify deformation at the land surface within the proponent’s tenures. This should link from the tenement scale to the wider region across which groundwater extraction activities are occurring as well as to any relevant regional program of monitoring;
b) modelling to estimate the potential hydrological implications of the predicted surface and subsurface deformation; and
c) methods for linking surface and sub-surface deformation arising from CSG activities.
Santos GLNG has developed a Subsidence Management Plan which defines the process for identifying a reportable subsidence occurrence. The Subsidence Management Plan was provided as an Appendix to the Santos GLNG Stage 2 CWMMP Rev 2.
Santos GLNG is using InSAR (interferometric synthetic aperture radar) technology to detect ground movement and deformation across the entire extent of its fields.
9.2 Coal Seam Water Monitoring and Management Plan Commitments Table 9-1 provides an outline of Santos GLNG’s commitments presented in the Stage 2 CWMMP Rev 2, specific to subsidence monitoring and progress against each commitment.
Table 9-1: Stage 2 CWMMP Rev 2 Commitments – Subsidence Condition Commitment Target Completion
Date Specified in the Stage 2 CWMMP Rev 2
Status
53.d.i.III Subsidence The Subsidence Management Plan provides a response plan into any exceedance of the defined subsidence trigger. The Subsidence Management Plan describes the monitoring undertaken to establish variation of ground level over time.
Completed. Completed.
Subsidence baseline. Completed. Completed. Monitoring through satellite measurements.
Ongoing. Ongoing.
9.3 Findings to Date Stage 1 of the monitoring program comprised collection and interpretation of baseline ground motion conditions across the Surat and Bowen basins where gas field development activity is expected to occur at some point in the future. The findings were used to inform the Subsidence Management Plan.
Santos GLNG Coal Seam Water Monitoring and Monitoring Annual Report 2015
March 2016 39
Stage 2 of the InSAR monitoring program commenced in July 2012. An Interim report on the Stage 2 InSAR monitoring program was submitted to the DOTE in November 2013 as per the commitment made in the Stage 2 CWMMP Rev 2 and described the interim findings of Stage 2 of the monitoring program. Stage 2 was completed in April 2015.
Stage 3 of the current InSAR monitoring program commenced in April 2015. The first interim report for Stage 3 is due in April 2016.
To date, the results show a stability pattern over time for the whole Santos GLNG tenures. No direct correlation between ground deformation and exact locations of the gas activities is evident. The localised displacements measured over the Santos GLNG fields (accumulated values of up to 20 mm) are likely due to superficial processes. Such processes might include natural processes such as erosion, sediment deposition, and soil wetting/drying, as well as anthropogenic activity such as large civil construction projects and agricultural activities.
9.4 Ongoing Studies and Monitoring InSAR image data acquisition for Stage 2 commenced in April 2015 and will run for 3 years. The data acquisition rate is every 48 days with periodic reporting scheduled for April 2016, March 2017 and February 2018 when Stage 3 of the data acquisition is programmed to stop.
Four Quarterly Reports have been delivered since the start of data acquisition in April 2015, up to December 2015. The next quarterly report is due in Q1 2016.
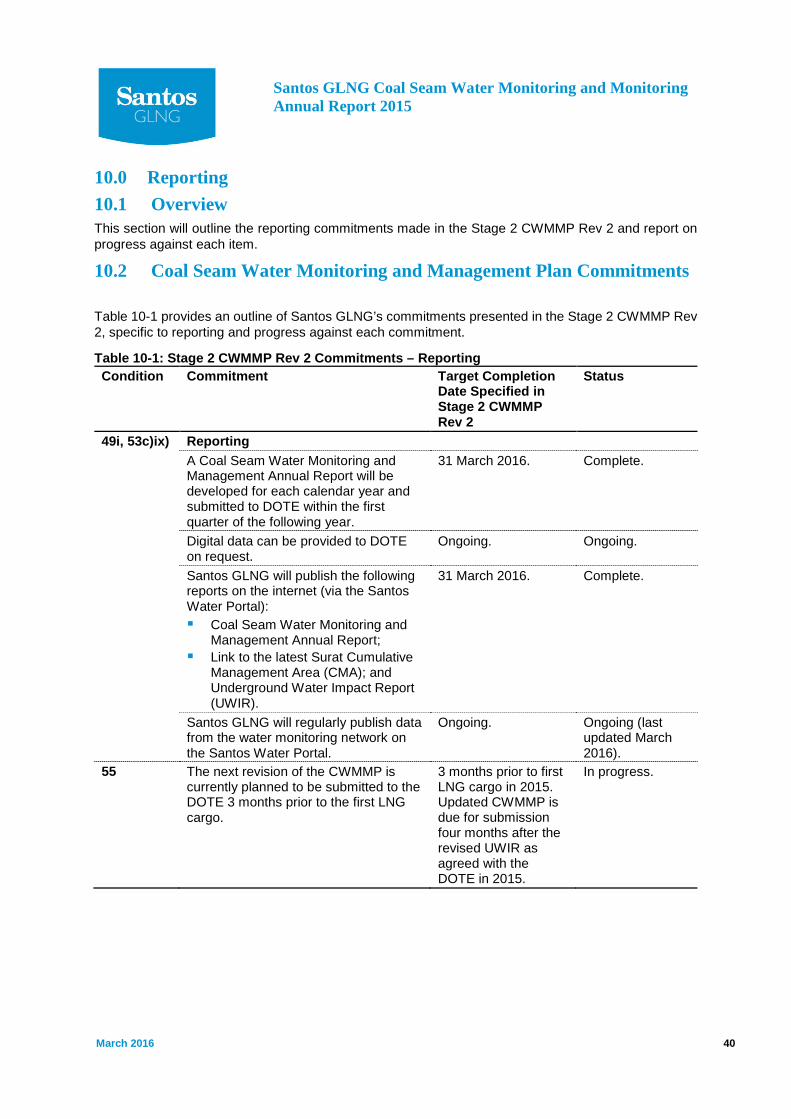
Santos GLNG Coal Seam Water Monitoring and Monitoring Annual Report 2015
March 2016 40
10.0 Reporting 10.1 Overview This section will outline the reporting commitments made in the Stage 2 CWMMP Rev 2 and report on progress against each item.
10.2 Coal Seam Water Monitoring and Management Plan Commitments
Table 10-1 provides an outline of Santos GLNG’s commitments presented in the Stage 2 CWMMP Rev 2, specific to reporting and progress against each commitment.
Table 10-1: Stage 2 CWMMP Rev 2 Commitments – Reporting Condition Commitment Target Completion
Date Specified in Stage 2 CWMMP Rev 2
Status
49i, 53c)ix) Reporting A Coal Seam Water Monitoring and Management Annual Report will be developed for each calendar year and submitted to DOTE within the first quarter of the following year.
31 March 2016. Complete.
Digital data can be provided to DOTE on request.
Ongoing. Ongoing.
Santos GLNG will publish the following reports on the internet (via the Santos Water Portal): Coal Seam Water Monitoring and
Management Annual Report; Link to the latest Surat Cumulative
Management Area (CMA); and Underground Water Impact Report (UWIR).
31 March 2016. Complete.
Santos GLNG will regularly publish data from the water monitoring network on the Santos Water Portal.
Ongoing. Ongoing (last updated March 2016).
55 The next revision of the CWMMP is currently planned to be submitted to the DOTE 3 months prior to the first LNG cargo.
3 months prior to first LNG cargo in 2015. Updated CWMMP is due for submission four months after the revised UWIR as agreed with the DOTE in 2015.
In progress.

Santos GLNG Coal Seam Water Monitoring and Monitoring Annual Report 2015
March 2016 41
10.3 2015 Reporting 10.3.1 CWMMP Annual Report The first Annual Report was submitted to the DOTE on 31 March 2014. The 2013 Annual Report included progress updates from October 2013 to December 2013 which incorporated the 2013 period since submission of Stage 2 CWMMP Rev 2. The 2014 Annual Report was previously submitted reporting on progress from the 1 January 2014 to the 31 December 2015.
This 2015 Annual Report has been developed to provide progress against commitments from 1 January 2015 to 31 December 2015 and will be made available on the Santos Water Portal as required by Conditions 49 and 53 of the EPBC approval by the 31 March 2016.
10.3.2 Digital Data Requests No digital data was requested by the DOTE during this reporting period.
10.3.3 Santos Water Portal Updates to the water monitoring network were published on the Santos Water Portal, this included updated water level and water quality results for a range of groundwater bores and surface water monitoring locations. These were most recently updated in March 2016.
The Santos Water Portal can be accessed via http://www.santoswaterportal.com.au/.
10.3.4 Future Reporting The forward work plan to meet reporting commitments is outlined below:
Provision of digital data to the DOTE upon request;
Updates to water monitoring network and data on the Santos Water Portal on a quarterly basis with Q1 2016 data being uploaded in April 2016;
Submission of the update to the CWMMP, this is due for submission four months after the revised UWIR as agreed with the DOTE in 2015; and
Commencement of the Annual Report 2016 covering January 2016 to December 2016.
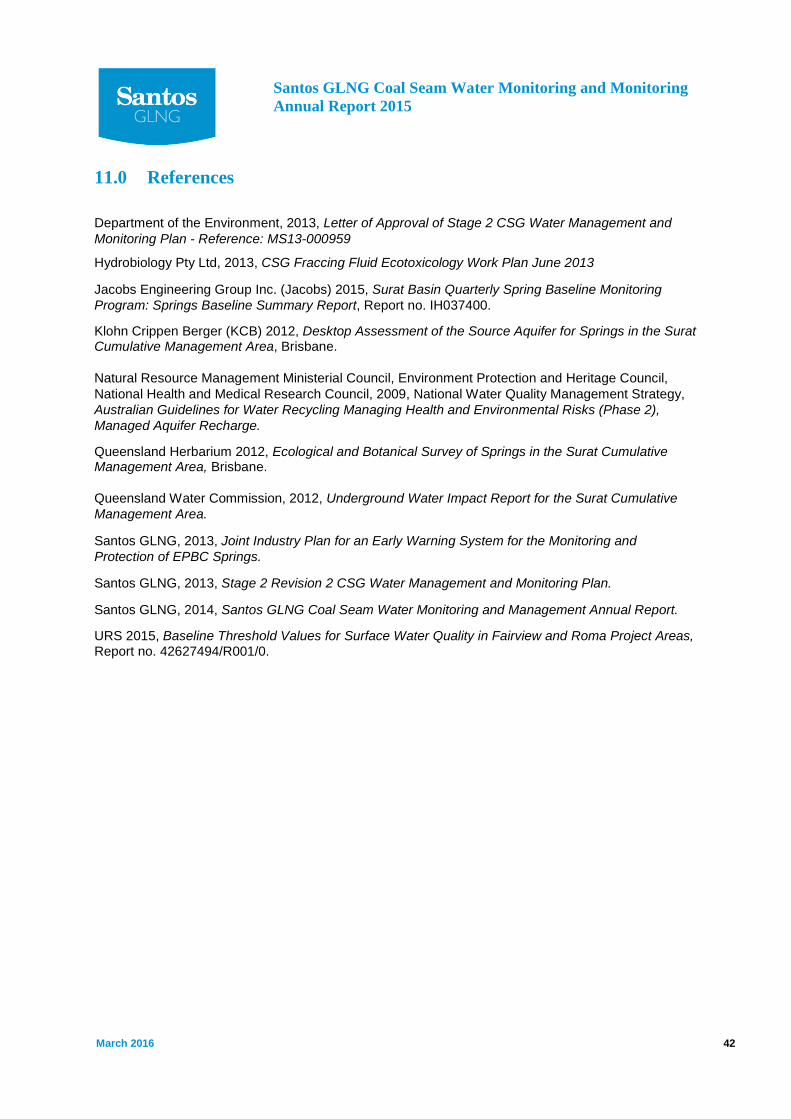
Santos GLNG Coal Seam Water Monitoring and Monitoring Annual Report 2015
March 2016 42
11.0 References
Department of the Environment, 2013, Letter of Approval of Stage 2 CSG Water Management and Monitoring Plan - Reference: MS13-000959
Hydrobiology Pty Ltd, 2013, CSG Fraccing Fluid Ecotoxicology Work Plan June 2013
Jacobs Engineering Group Inc. (Jacobs) 2015, Surat Basin Quarterly Spring Baseline Monitoring Program: Springs Baseline Summary Report, Report no. IH037400.
Klohn Crippen Berger (KCB) 2012, Desktop Assessment of the Source Aquifer for Springs in the Surat Cumulative Management Area, Brisbane. Natural Resource Management Ministerial Council, Environment Protection and Heritage Council, National Health and Medical Research Council, 2009, National Water Quality Management Strategy, Australian Guidelines for Water Recycling Managing Health and Environmental Risks (Phase 2), Managed Aquifer Recharge.
Queensland Herbarium 2012, Ecological and Botanical Survey of Springs in the Surat Cumulative Management Area, Brisbane. Queensland Water Commission, 2012, Underground Water Impact Report for the Surat Cumulative Management Area.
Santos GLNG, 2013, Joint Industry Plan for an Early Warning System for the Monitoring and Protection of EPBC Springs.
Santos GLNG, 2013, Stage 2 Revision 2 CSG Water Management and Monitoring Plan.
Santos GLNG, 2014, Santos GLNG Coal Seam Water Monitoring and Management Annual Report.
URS 2015, Baseline Threshold Values for Surface Water Quality in Fairview and Roma Project Areas, Report no. 42627494/R001/0.
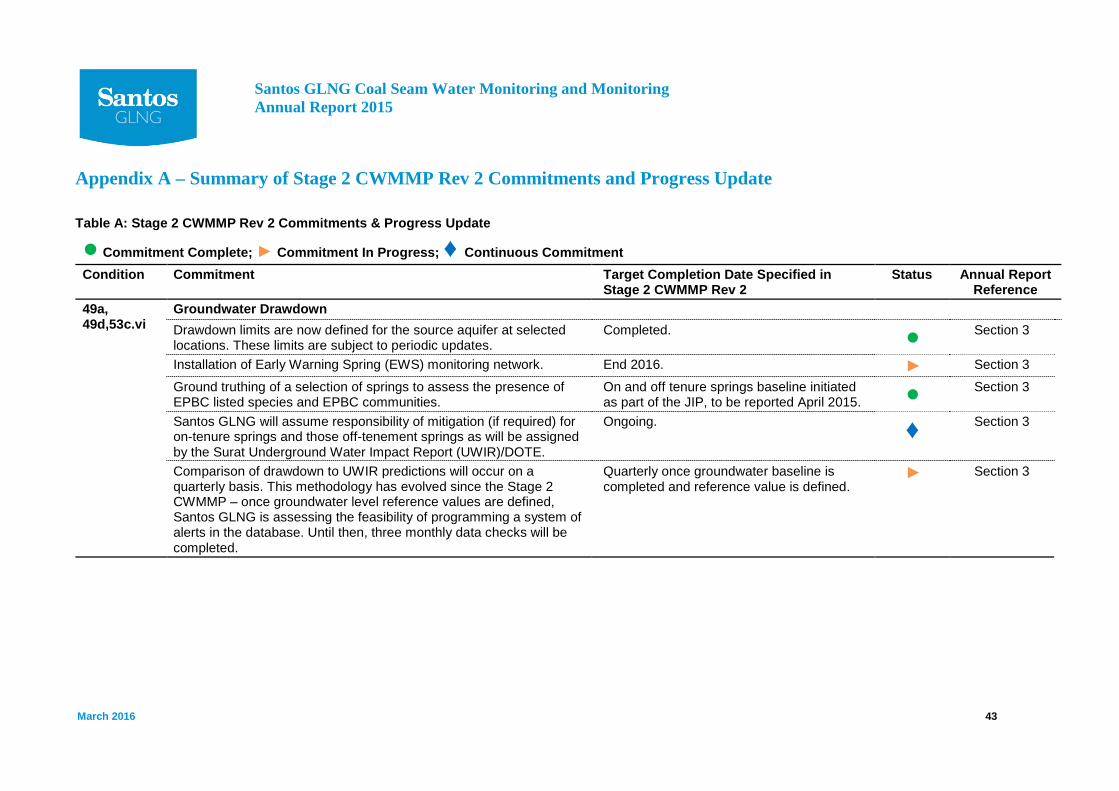
Santos GLNG Coal Seam Water Monitoring and Monitoring Annual Report 2015
March 2016 43
Appendix A – Summary of Stage 2 CWMMP Rev 2 Commitments and Progress Update
Table A: Stage 2 CWMMP Rev 2 Commitments & Progress Update
● Commitment Complete; ► Commitment In Progress; ♦ Continuous Commitment Condition Commitment Target Completion Date Specified in
Stage 2 CWMMP Rev 2 Status Annual Report
Reference 49a, 49d,53c.vi
Groundwater Drawdown Drawdown limits are now defined for the source aquifer at selected locations. These limits are subject to periodic updates.
Completed. ● Section 3
Installation of Early Warning Spring (EWS) monitoring network. End 2016. ► Section 3
Ground truthing of a selection of springs to assess the presence of EPBC listed species and EPBC communities.
On and off tenure springs baseline initiated as part of the JIP, to be reported April 2015. ● Section 3
Santos GLNG will assume responsibility of mitigation (if required) for on-tenure springs and those off-tenement springs as will be assigned by the Surat Underground Water Impact Report (UWIR)/DOTE.
Ongoing. ♦ Section 3
Comparison of drawdown to UWIR predictions will occur on a quarterly basis. This methodology has evolved since the Stage 2 CWMMP – once groundwater level reference values are defined, Santos GLNG is assessing the feasibility of programming a system of alerts in the database. Until then, three monthly data checks will be completed.
Quarterly once groundwater baseline is completed and reference value is defined.
► Section 3
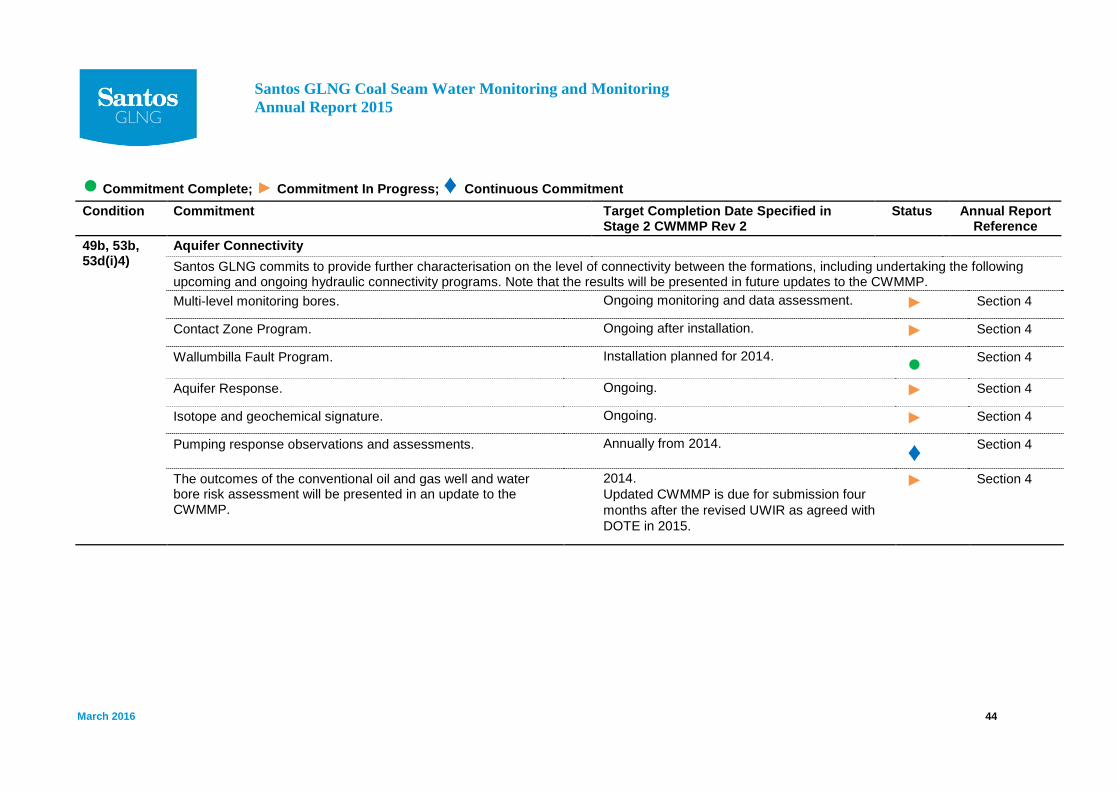
Santos GLNG Coal Seam Water Monitoring and Monitoring Annual Report 2015
March 2016 44
● Commitment Complete; ► Commitment In Progress; ♦ Continuous Commitment Condition Commitment Target Completion Date Specified in
Stage 2 CWMMP Rev 2 Status Annual Report
Reference 49b, 53b, 53d(i)4)
Aquifer Connectivity Santos GLNG commits to provide further characterisation on the level of connectivity between the formations, including undertaking the following upcoming and ongoing hydraulic connectivity programs. Note that the results will be presented in future updates to the CWMMP. Multi-level monitoring bores. Ongoing monitoring and data assessment. ► Section 4
Contact Zone Program. Ongoing after installation. ► Section 4
Wallumbilla Fault Program. Installation planned for 2014. ● Section 4
Aquifer Response. Ongoing. ► Section 4
Isotope and geochemical signature. Ongoing. ► Section 4
Pumping response observations and assessments. Annually from 2014. ♦ Section 4
The outcomes of the conventional oil and gas well and water bore risk assessment will be presented in an update to the CWMMP.
2014. Updated CWMMP is due for submission four months after the revised UWIR as agreed with DOTE in 2015.
► Section 4

Santos GLNG Coal Seam Water Monitoring and Monitoring Annual Report 2015
March 2016 45
● Commitment Complete; ► Commitment In Progress; ♦ Continuous Commitment Condition Commitment Target Completion Date Specified in
Stage 2 CWMMP Rev 2 Status Annual Report
Reference 49c, 53a, 53 d)ii
Aquifer Re-injection Santos GLNG has developed a Managed Aquifer Recharge (MAR) pilot program and schedule for gas field piloting of aquifer reinjection. Fairview CSG Field Stage 1– Desktop Study. Completed March 2012. ● Section 5
Roma CSG Field Stage 1– Desktop Study. Completed January 2011. ● Section 5
Roma CSG Field Stage 2 – Investigations and Assessment. Completed January 2011. ● Section 5
Roma CSG Field pilot trial (Hermitage) Stage 3 – Construction and Commissioning.
Completed Q1/Q2 2012. ● Section 5
Roma CSG Field pilot trial (Hermitage) Stage 4 – Operation. Completed Q4 2012. ● Section 5
Roma CSG Field (The Bend) Stage 3 – Construction and Commissioning.
Due for completion Q3 2014. Ongoing, due for completion 04 2016.
► Section 5
Roma CSG Field (The Bend) Stage 4 – Operation. Due to commence Q3/Q4 2014. Ongoing, due to commence Q1 2017.
► Section 5
Arcadia Valley CSG Field Stage 1 – Desktop Study. Completed September 2013. ● Section 5
All approved Injection Management Plans will be provided in an update to the CWMMP.
Ongoing. ♦ Section 5

Santos GLNG Coal Seam Water Monitoring and Monitoring Annual Report 2015
March 2016 46
● Commitment Complete; ► Commitment In Progress; ♦ Continuous Commitment Condition Commitment Target Completion Date Specified in
Stage 2 CWMMP Rev 2 Status Annual Report
Reference 49e Hydraulic Fracturing
Santos GLNG will provide a projection of the anticipated number of wells to be hydraulically stimulated during each year (up to and including 2015) as well as the number of hydraulic stimulations completed in the preceding year. Additional details to be reported will also include location information and the depth of each respective hydraulic stimulation.
Annually, submitted within the first quarter of each year. ●
Section 6
49f Santos GLNG has agreed with the DOTE to undertake additional Direct Toxicity Assessment that will include: • an ecotoxicological program, involving, for example, a
comparison of (i) coal seam water, (ii) coal seam water with hydraulic fracturing chemicals, and (iii) hydraulic fracturing chemicals in freshwater;
• assessing the risk of individual hydraulic fracturing chemicals of concern; and
• assessing contribution of hydraulic fracturing chemicals to toxicity of hydraulic fracturing fluids and flowback waters (mixture toxicity).
Santos GLNG is committed to undertaking these assessments, as part of the joint industry Ecotoxicity Work Program; the result of which will be provided to the DOTE upon completion.
December 2013 Ongoing, due for completion 2016.
► Section 6

Santos GLNG Coal Seam Water Monitoring and Monitoring Annual Report 2015
March 2016 47
● Commitment Complete; ► Commitment In Progress; ♦ Continuous Commitment Condition Commitment Target Completion Date Specified in
Stage 2 CWMMP Rev 2 Status Annual Report
Reference 49.g.iv) Surface Water Baseline
Ongoing collection of surface water baseline data. End of 2013. Completed, data acquisition ongoing.
► Section 2
EPBC spring hydrogeological conceptual model. Existing models submitted November 2013. ●
Section 3
Atmospheric pressure monitoring – 1 installation (barrologger or other) at each EPBC spring complex or cluster of spring complexes.
Completed for on-tenure springs 2013. ● Section 3
49.g.vi) Surface Water Threshold Values Collection and reviewing 2 years of baseline data and development of upper and lower confidence levels (Threshold values) for key parameters (relevant to MNES). These threshold values will be provided in an update to the CWMMP.
End of 2014. Completed, data acquisition ongoing.
► Section 7
49.g.x) Brine Management Plans Provision of Brine Management Plans developed for Arcadia Valley, Roma and Fairview gas fields as a state government requirement within the respective gas field’s environmental authorities (EA’s). These will be provided in the next update to the CWMMP.
December 2014. The gas field Brine Management Plans will now be submitted to the DOTE in Santos GLNG Coal Seam Water Monitoring and Management Annual Report in 2019, due to an extension granted by the state government (DEHP) for submission of Brine Management Plans to December 2019.
► Section 8

Santos GLNG Coal Seam Water Monitoring and Monitoring Annual Report 2015
March 2016 48
● Commitment Complete; ► Commitment In Progress; ♦ Continuous Commitment Condition Commitment Target Completion Date Specified in
Stage 2 CWMMP Rev 2 Status Annual Report
Reference 49i, 53c)ix) Reporting
A Coal Seam Water Monitoring and Management Annual Report will be developed for each calendar year and submitted to the DOTE within the first quarter of the following year.
31 March 2016 and annually thereafter. ♦ Section 10
Digital data can be provided to the DOTE on request. Ongoing. ♦ Section 10
Santos GLNG will publish the following reports on the internet (via the Santos Water Portal): Coal Seam Water Monitoring and Management Annual Report;
and Link to the latest Surat Cumulative Management Area (CMA)
Underground Water Impact Report (UWIR).
31 March 2016. ● Section 10
Santos GLNG will regularly publish data from the water monitoring network on the Santos Water Portal.
Ongoing ♦ Section 10
55 The next revision of the CWMMP is currently planned to be submitted to the DOTE 3 months prior to first LNG cargo.
3 months prior to first LNG cargo in 2015. Updated CWMMP is due for submission four months after the revised UWIR as agreed with the DOTE in 2015.
► Section 10

Santos GLNG Coal Seam Water Monitoring and Monitoring Annual Report 2015
March 2016 49
● Commitment Complete; ► Commitment In Progress; ♦ Continuous Commitment Condition Commitment Target Completion Date Specified in
Stage 2 CWMMP Rev 2 Status Annual Report
Reference 53.c)iv) Groundwater Baseline
Groundwater baseline data collection completion. End of 2014. Completed, data acquisition ongoing.
► Section 2
Santos GLNG, in collaboration with the other Proponents (APLNG and QGC), will by the end of 2013 develop a statistical methodology to enable definition of significant exceedences from the baseline water pressure and water quality levels. The establishment of this methodology can only reasonably be commenced once the three Projects all have sufficient confirmation of their EPBC conditions being met by the respective CWMMPs.
Completed. The Joint Industry Plan (JIP) provides a statistical methodology for groundwater level trend analysis.
● Section 3
53.d.i.III Subsidence The Subsidence Management Plan provides a response plan into exceedance of the defined subsidence trigger. The Subsidence Management Plan describes the monitoring undertaken to establish variation of ground level over time.
Completed. ● Section 9
Subsidence baseline. Completed. ● Section 9
Monitoring through satellite measurements. Ongoing. ♦ Section 9

Santos GLNG Coal Seam Water Monitoring and Monitoring Annual Report 2015
March 2016 50
Appendix B – Surface Water Baseline Threshold Report

a
Report Coal Seam Water Monitoring and Management Plan
Baseline Threshold Values for Surface Water Quality in Fairview and Roma Project Areas
17 February 2015 42627494/R001/0
Prepared for: Santos
Prepared by URS Australia Pty Ltd
AUSTRALIA

42627494/R001/0 J:\BNE\42627494\6 Deliv\42627494_R001_ Rev0_CWMMP_TVs_Final_20150217.docx
DOCUMENT PRODUCTION / APPROVAL RECORD
Issue No. Name Signature Date Position Title
Prepared by
Dr. Adrian Zammit
17/2/2015 Principal Water Quality Scientist
Checked by
Nicky Lee
17/2/2015 Associate Water Quality Scientist
Approved by
Rob Storrs
17/2/2015 Principal Environmental Scientist
Report Name: Coal Seam Water Monitoring and Management Plan Sub Title: Baseline Threshold Values for Surface Water Quality in Fairview and Roma Project Areas Report No. 42627494/R001/0 Status: Final Client Contact Details: Josh Cooper Santos Turbot Street Brisbane 4000
DOCUMENT REVISION RECORD
Issue No. Date Details of Revisions
Issued by: URS Australia Pty Ltd Level 17, 240 Queen Street Brisbane, QLD 4000 GPO Box 302, QLD 4001 Australia T: +61 7 3243 2111 F: +61 7 3243 2199 © Document copyright of URS Australia Pty Limited. No use of the contents, concepts, designs, drawings, specifications, plans etc. included in this report is permitted unless and until they are the subject of a written contract between URS Australia and the addressee of this report. URS Australia accepts no liability of any kind for any unauthorised use of the contents of this report and URS Australia reserves the right to seek compensation for any such unauthorised use. Document Delivery. URS Australia provides this document in either printed format, electronic format or both. URS Australia considers the printed version to be binding. The electronic format is provided for the client’s convenience and URS Australia requests that the client ensures the integrity of this electronic information is maintained. Storage of this electronic information should at a minimum comply with the requirements of the Electronic Transactions Act 2000 (Cth).

42627494/R001/0
TABLES
Table 2-1 Santos GLNG monitoring locations by sub-catchment ............................................................... 4
Table 3-1 List of monitoring sites selected for baseline threshold value derivation .................................... 9
Table 4-1 EC levels for low and high flow conditions at S2 (Dawson River) ............................................ 12
Table 4-2 EC levels for low and high flow conditions at S4 (Dawson River) ............................................ 13
Table 4-3 EC levels for low and high flow conditions at S15 (Hutton Creek) ........................................... 14
Table 4-4 EC levels for waters at S17 (Hutton Creek) under low and high flow conditions...................... 15
Table 4-5 Water quality in the Dawson River, Hutton Creek and Baffle Creek measured by grab sampling between 2003 and 2013............................................................................................................ 16
Table 4-6 EC values for water at RS25 (Blyth Creek) under low and high flow conditions ...................... 22
TABLE OF CONTENTS 1 INTRODUCTION ............................................................................................................................. 1 1.1 Background ................................................................................................................................... 1 1.2 Project Scope ................................................................................................................................ 1 2 BACKGROUND INFORMATION ................................................................................................... 2 2.1 Legislation and Guidelines .......................................................................................................... 2 2.1.1 Environmental Protection (Water) Policy 2009 .......................................................................... 2 2.1.2 Australian and New Zealand guidelines for fresh and marine water quality
(ANZECC/ARMCANZ 2000) ........................................................................................................... 2 2.1.3 Queensland Water Quality Guidelines ........................................................................................ 2 2.2 Surface Water Environment ......................................................................................................... 3 2.2.1 Fairview Project Area (FPA) ......................................................................................................... 3 2.2.2 Roma Project Area (RPA) ............................................................................................................. 3 2.3 Surface Water Monitoring ............................................................................................................ 3 3 THRESHOLD VALUE ASSESSMENT METHODOLOGY ............................................................. 8 3.1 Monitoring data selection ............................................................................................................. 8 3.2 Monitoring data analysis .............................................................................................................. 8 4 BASELINE THRESHOLD VALUES ............................................................................................. 12 4.1 Fairview Project Area .................................................................................................................. 12 4.1.1 Flow and EC Gauge Data ............................................................................................................ 12 4.1.2 Grab Sampling Data .................................................................................................................... 15 4.2 Roma Project Area ...................................................................................................................... 21 4.2.1 Flow and EC Gauge Data ............................................................................................................ 21 4.2.2 Grab Sampling Data .................................................................................................................... 25 5 SUMMARY OF RESULTS ............................................................................................................ 30
6 REFERENCES .............................................................................................................................. 32
7 LIMITATIONS ............................................................................................................................... 33

42627494/R001/0
Table 4-7 EC levels for water at RO12 (Bungil Creek) under low and high flow conditions ..................... 22
Table 4-8 EC levels for monitoring point R002 (Bungil Creek) under low flow and high flow conditions . 23
Table 4-9 EC levels for waters at R014 (Wallumbilla Creek) under low and high flow conditions ........... 24
Table 4-10 EC levels for waters at R019 (Yuleba Creek) under low and high flow conditions ................... 25
Table 4-11 Water quality in Blyth Creek, Bungil Creek, Wallumbilla Creek and Yuleba Creek measured by grab sampling between 2010 and 2014 .................................................................................... 26
Table 5-1 Baseline Threshold Values for Fairview and Roma Project Areas Surface Waters ................. 31
FIGURES
Figure 3-1 Selected Stream flow and EC data used for EC threshold value calculations for waters at S2 (Dawson River) under low flow conditions ................................................................................ 11
Figure 3-2 Selected Stream flow and EC data used for EC threshold value calculations for waters at S2 (Dawson River) under high flow conditions............................................................................... 11

42627494/R001/0 i
ABBREVIATIONS
Abbreviation Description
ANZECC Australian and New Zealand Environment Conservation Council
ARMCANZ Agriculture and Resource Management Council of Australia and New Zealand
CSG Coal seam gas
DO Dissolved Oxygen
EC Electrical Conductivity
EHP Department of Environment and Heritage Protection
EIS Environmental Impact Statement
EPBC Environment Protection and Biodiversity Conservation
EPP Water Environmental Protection (Water) Policy 2009
FPA Fairview Project Area
LNG Liquefied Natural Gas
MNES Matters of National Environmental Significance
NTU Nephelometric Turbidity Unit
QWQG Queensland Water Quality Guidelines
RPA Roma Project Area
TN Total Nitrogen
TSS Total Suspended Solids
URS URS Australia Pty Ltd
WQO Water quality objective

42627494/R001/0 1
1 INTRODUCTION
1.1 Background
The Santos GLNG project will convert coal seam gas (CSG) to liquefied natural gas (LNG) for export to global markets. As part of the approval for this project, the Minister for the former Department of Sustainability, Environment, Water, Population and Communities (now Department of the Environment) granted approval under the Environment Protection and Biodiversity Act 1999, with various conditions that require the submission and approval of a Stage 1 and Stage 2 Coal Seam Water and Monitoring and Management Plan Report.
1.2 Project Scope
This report, which will form part of the latest update to the Santos GLNG Coal Seam Water Monitoring and Management Plan Stage 3 Report, provides threshold values for the surface waters within the Fairview and Roma Project Areas that are aimed to protect water quality, aquatic ecosystems and Matters of National Environmental Significance (MNES), as conditioned by Condition 49 (g) of the Environment Protection and Biodiversity Conservation (EPBC) Act Approval. The purpose of deriving threshold values is to specify levels at which management actions will be initiated to respond to escalating levels of risk to relevant MNES.

42627494/R001/0 2
2 BACKGROUND INFORMATION
2.1 Legislation and Guidelines
2.1.1 Environmental Protection (Water) Policy 2009
The Environmental Protection (Water) Policy 2009 (EPP Water) is an instrument of the Environmental Protection Act 1994 (EP Act). Amongst other functions, EPP Water governs the discharge of wastewater to land, surface water, and groundwater, aims to protect environmental values (EVs) and sets water quality objectives (WQOs) to provide guidance to protect EVs.
2.1.2 Australian and New Zealand guidelines for fresh and marine water quality (ANZECC/ARMCANZ 2000)
The Australian and New Zealand guidelines for fresh and marine water quality guidelines were developed in 2000 under the National water quality management strategy by the Australian and New Zealand Environment Conservation Council (ANZECC) and Agriculture and Resource Management Council of Australia and New Zealand (ARMCANZ) and provide a framework for assessing water quality by comparison with guidelines derived from local reference values. Guideline values were developed and classified on the following criteria:
• Level of environmental disturbance of surface waters (e.g. highly or slightly to moderately disturbed waters)
• Freshwater or saline surface water
• Waterbody elevation i.e. upland or lowland aquatic environments
• Biogeographic region such as southeast or tropical Australia.
The guidelines also state that “the old single number guidelines [1992; incorporated into current 2000 guidelines] are regarded as guideline trigger values that can be modified into regional, local or site specific guidelines by taking into account factors such as the variability of the particular ecosystem or environment, soil type, rainfall and level of exposure to contaminants. Trigger values are concentrations that, if exceeded, would indicate a potential environmental problem, and so ‘trigger’ a management response e.g. further investigation and subsequent refinement of the guidelines according to local conditions” (Volume 1, Chapter 2, p2-10). This report refers to both physicochemical and toxicant guideline values from ANZECC/ARMCANZ 2000.
2.1.3 Queensland Water Quality Guidelines
The Queensland Water Quality Guidelines (QWQG) (EHP 2009) provide a framework for assessing water quality in Queensland through the setting of WQOs to protect or enhance EVs for Queensland waters.
42627494/R001/0 3
2.2 Surface Water Environment
2.2.1 Fairview Project Area (FPA)
The surface water environment in the FPA lies within the Upper Dawson River subcatchment that forms part of the Fitzroy River Basin. This environment comprises of three main watercourses, namely the Upper Dawson River, Hutton Creek and Baffle Creek. The reaches of the Dawson River that lie within the FPA are either semi-permanent (upstream of Dawson’s Bend) or permanent, being fed by springs at Dawson’s bend. The watercourses have been slightly to moderately impacted by historical and current landuse in the region, namely agriculture. Further details on the surface water environment of the Upper Dawson Catchment can be found in the Santos GLNG Gas Field Development Project EIS Appendix N (Surface Water Technical Report), August 2014.
2.2.2 Roma Project Area (RPA)
The surface water environment in the RPA comprises of the Upper Balonne tributaries that form part of the Balonne Condamine Basin. The main watercourses within the RPA include Yuleba Creek, Blyth Creek, Bungil Creek and Wallumbilla Creek which are ephemeral and therefore flow only after significant rain events. Like the watercourses in the Upper Dawson River catchment, the surface water environment is slightly to moderately impacted by historical and current landuses. Further details on the surface water environment of the Upper Dawson Catchment can be found in the Santos GLNG Gas Field Development Project EIS Appendix N (Surface Water Technical Report), August 2014.
2.3 Surface Water Monitoring
A summary of the Santos GLNG surface water monitoring locations within the FPA and RPA is provided in Table 2-1 below, including information on their location within each study-sub-catchment, relevant watercourses, and importantly the period of record and sample frequency.

42627494/R001/0 4
Table 2-1 Santos GLNG monitoring locations by sub-catchment
Catchment Sub-catchment Watercourse Gas field Site ID Location type (from Santos GLNG)
GIS coordinates Period of record Sample count n Latitude Longitude
Upper Dawson River
Upper Dawson – main channel (Headwaters to junction with Hutton Creek)
Dawson River Arcadia AS01 Perennial stream -25.48722 148.83083 20/4/2010 - 5/12/2012 22 Dawson River Fairview S9 Perennial stream -25.38450 148.64880 9/5/2006 - 17/11/2011 16 Dawson River Fairview S10 Perennial stream -25.61900 148.99100 6/10/2006 - 17/11/2011 25 Dawson River Fairview S13 Perennial stream
-25.58400 148.98100 10/9/2003 - 12/8/2012 157
Upper Dawson – main channel (Hutton Creek to Taroom)
Dawson River Scotia DAW01 Perennial stream -25.79776 149.55930 19/7/2012 - 31/10/2012 2 Dawson River Fairview S1 Perennial stream -25.72464 149.10405 11/9/2003 - 18/11/2011 23 Dawson River Fairview S2 Perennial stream -25.72900 149.09400 28/8/2009 - 16/3/2013 228 Dawson River Fairview S3 Perennial stream -25.72570 149.09200 23/4/2004 - 18/11/2011 20 Dawson River Fairview S4 Perennial stream -25.69233 149.21476 8/9/2003 - 19/3/2013 66 Dawson River Fairview S5 Perennial stream -25.74630 149.33140 25/5/2005 - 14/11/2011 15 Dawson River Fairview S5a Perennial stream -25.79760 149.55770 29/5/2011 1 Dawson River Fairview S14a Perennial stream -25.71667 149.11000 23/4/2004 - 22/5/2008 9 Dawson River Fairview S18D Surface water
quality -25.68308 149.15050 27/5/2012 - 5/6/2012 2
Dawson River Fairview S18U Surface water quality
-25.72869 149.09848 27/5/2012 - 5/6/2012 3
Dawson River Fairview SC1 Spring -25.72507 149.08765 3/11/2009 - 3/10/2012 17 Juandah Creek/Dawson River junction
Fairview SS2 Perennial stream -25.66767 149.78749 20/9/2011 - 20/9/2011 1
Dawson River Fairview TAR Perennial stream -25.63750 149.79010 11/11/2010 - 31/10/2012 5 Baffle Creek Baffle Creek Fairview S2a Perennial stream -25.58333 148.96000 9/9/2003 1
Baffle Creek Fairview S2b Perennial stream -25.58333 148.96000 9/9/2003 1 Baffle Creek Fairview S7 Perennial stream -25.59440 148.81060 9/9/2003 - 16/11/2011 23 Baffle Creek Fairview S8 Perennial stream -25.58899 148.98215 10/9/2003 - 17/3/2013 215 Baffle Creek Fairview S12 Perennial stream -25.59397 148.81060 4/11/2009 - 17/3/2013 133

42627494/R001/0 5
Catchment Sub-catchment Watercourse Gas field Site ID Location type (f S t
GIS coordinates Period of record Sample t Hutton Creek Hutton Creek Fairview SW536 Spring -25.71470 149.06513 12/5/2011 1
Hutton Creek Fairview ES4 Ephemeral stream
-25.72605 148.98333 1/3/2013 1
Hutton Creek Fairview I14 Perennial stream -25.68991 148.96558 3/3/2009 1 Hutton Creek Fairview I16 Perennial stream -25.68400 148.93968 2/8/2007 - 3/3/2009 3 Hutton Creek Fairview S6 Perennial stream -25.72570 148.92100 19/4/2004 - 15/11/2011 21 Hutton Creek Fairview S6a Perennial stream -25.73333 148.67667 10/9/2003 1 Hutton Creek Fairview S11 Perennial stream -25.77100 148.74800 5/10/2006 - 25/2/2013 35 Hutton Creek Fairview S11a Perennial stream -25.80300 148.91070 11/9/2003 - 15/11/2011 15 Hutton Creek Fairview S14 Perennial stream -25.71372 149.07982 3/8/2007 - 1/8/2010 7 Hutton Creek Fairview S15 Perennial stream -25.78930 148.90955 28/11/2009 - 25/3/2013 398 Hutton Creek Fairview S16 Perennial stream -25.70687 148.97216 3/3/2009 - 28/3/2013 263 Hutton Creek Fairview S17 Perennial stream -25.70167 149.05092 27/12/2009 - 27/3/2013 205 Fairview Fairview S19D Surface water
quality -25.76135 148.77732 28/8/2012 1
Fairview Fairview S19U Surface water quality
-25.76133 148.77675 4/1/2010 1
Hutton Creek Fairview SC3 Spring -25.71961 149.02898 3/11/2009 - 22/2/2013 16 Hutton Creek Fairview SC2 Spring -25.71470 149.06513 3/11/2009 - 3/10/2012 21
Juandah and Bungaban Creeks
Juandah Creek Scotia SS3 Perennial stream -25.67973 149.80450 24/10/2011 - 18/4/2012 8 Juandah Creek Scotia SS4 Perennial stream -25.84193 149.82595 24/10/2011 - 14/3/2012 8 Bungaban Creek Scotia SS5 Perennial stream -25.82708 149.92210 24/10/2011 - 16/11/2011 4 Juandah Creek Scotia SS6 Perennial stream -25.68026 149.80511 18/7/2012 1
Robinson Creek Robinson Creek Scotia ROB01 Perennial stream -25.49386 149.52100 18/7/2012 - 31/10/2012 2 Robinson Creek Scotia ROB02 Perennial stream -25.48985 149.64140 18/7/2012 - 1/11/2012 2
Lower Dawson River
Lower Dawson – main channel
Dawson River Fairview THEOW Ephemeral stream
-24.93788 150.06728 11/11/2010 - 30/11/2010 4
Upper Balonne River tributaries
Upper Balonne – main channel
Balonne River Roma RS20 Perennial stream -27.01900 149.37640 20/5/2010 - 7/4/2013
20

42627494/R001/0 6
Catchment Sub-catchment Watercourse Gas field Site ID Location type (f S t
GIS coordinates Period of record Sample t Balonne River Roma RS24 Perennial stream -27.01958 149.48298 8/7/2010 - 7/4/2013
23
Upper Balonne – Yuleba Creek
Yuleba Creek Roma R019 Perennial stream -26.88820 149.44810 20/5/2010 - 7/4/2013 31 Yuleba Creek Roma R021 Perennial stream -26.61110 149.38960 20/5/2010 - 7/4/2013 29 Yuleba Creek Roma RES17 Ephemeral
stream -26.29230 149.35040 19/5/2010 1
Upper Balonne – Wallumbilla Creek
Wallumbilla Creek Roma R014 Perennial stream -26.92120 149.22410 18/5/2010 - 5/2/2013 18 Wallumbilla Creek Roma RES15 Ephemeral
stream -26.69040 149.20550 20/5/2010 1
Wallumbilla Creek Roma RES13 Ephemeral stream
-26.52120 149.12710 19/5/2010 - 5/7/2012 12
Wallumbilla Creek Roma RS14 Perennial stream -26.58580 149.18230 2/11/2010 - 10/3/2013 2 Upper Balonne – Blyth Creek
Blyth Creek Roma BLCS1 Perennial stream -26.36192 149.10934 14/11/2011 - 8/5/2012 23 Blyth Creek Roma BLCS2 Perennial stream -26.35953 149.10116 11/12/2011 - 2/2/2012 5 Blyth Creek Roma BLCS3 Perennial stream -26.38736 149.08925 19/12/2011 - 7/3/2012 17 Blyth Creek Roma R011 Perennial stream -26.72941 148.90181 28/4/2011 - 5/5/2012 10 Blyth Creek Roma R025 Perennial stream -26.43890 149.07755 28/4/2011 - 11/3/2012 7 Blyth Creek Roma RES10 Ephemeral
stream -26.68250 148.90640 18/5/2010 - 1/9/2012 19
Blyth Creek Roma RS7 Perennial stream -26.71820 148.90350 18/5/2010 1 Blyth Creek Roma RS11 Perennial stream -26.44400 149.06220 19/5/2010 - 12/4/2012 11 Appletree Creek Roma RS12 Perennial stream -26.34390 149.12970 19/5/2010 - 5/10/2011 5 Blyth Creek Roma RS25 Perennial stream -26.46839 149.01429 2/11/2010 - 7/4/2013 5
Upper Balonne – Bungil Creek
Bony Creek Roma RS23 Perennial stream -26.83560 148.94860 18/5/2010 - 2/3/2013 14 Bungil Creek Roma R001 Perennial stream -26.57370 148.81440 17/5/2010 - 8/4/2013 23 Bungil Creek Roma R002 Perennial stream -26.51086 148.81182 11/4/2011 - 24/9/2012 18 Bungil Creek Roma R012 Perennial stream -26.89610 148.98140 18/5/2010 - 5/6/2012 21 Bungeworgerai Creek
Roma RES1 Ephemeral stream
-26.59050 148.69310 20/5/2010 1
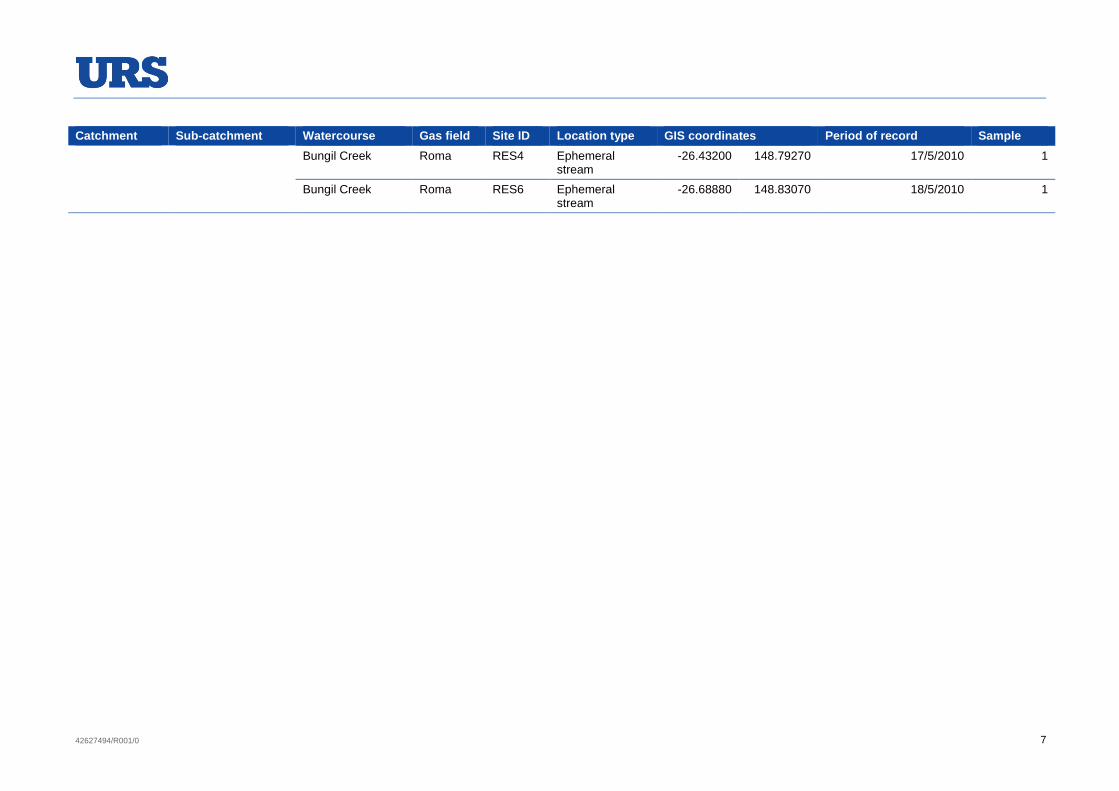
42627494/R001/0 7
Catchment Sub-catchment Watercourse Gas field Site ID Location type (f S t
GIS coordinates Period of record Sample t Bungil Creek Roma RES4 Ephemeral
stream -26.43200 148.79270 17/5/2010 1
Bungil Creek Roma RES6 Ephemeral stream
-26.68880 148.83070 18/5/2010 1

42627494/R001/0 8
3 THRESHOLD VALUE ASSESSMENT METHODOLOGY
3.1 Monitoring data selection
Water quality data used in this assessment was provided to URS directly by Santos GLNG. It has been assumed that the data had been previously subjected to appropriate quality assurance/ quality control procedures both during sample collection (in terms of sampling protocols) and initial data analysis, and is therefore suitable for interpretative use.
The key temporal and spatial considerations (in accordance with the QWQG 2009) that were made during the monitoring data selection process were as follows;
• Monitoring data was selected from each of the key watercourses within each of the project areas;
• Monitoring data that represented both upstream and downstream reaches of watercourses was selected wherever available;
• Monitoring sites were selected on the basis of the size of the monitoring data sets available (sites with larger data sets spanning longer time periods were preferred).
• Monitoring sites that had automatic gauge data for both electrical conductivity (EC) and stream flows were selected so as to allow for the derivation of EC threshold values for both low flow (baseflow) and high flow conditions.
The monitoring sites whose data were selected for derivation of baseline surface water threshold values are presented in Table 3-1.
3.2 Monitoring data analysis
The entire data set of selected monitoring sites obtained by automatic gauges was initially plotted to ascertain overall trends in water quality (using EC as a surrogate of water quality) in relation to stream flows, other temporal trends, and changes in water quality that could not be explained by changes in stream flow and were therefore deemed as landuse impacts. The overall data set was then manipulated by:
• Separating water quality data in terms of high flow and low (base) flow. High flow data was that which coincided with distinct peaks in stream discharge or stream water level. Conversely, intervening periods which normally coincided with the period of May to October, were deemed to represent low flow conditions. An example of this is shown in Figure 3-1 and Figure 3-2.
• Data of sections of the EC plots that represented obvious gauge error or was interpreted as impacts from unknown anthropogenic activity was not included in the baseline threshold value derivations.
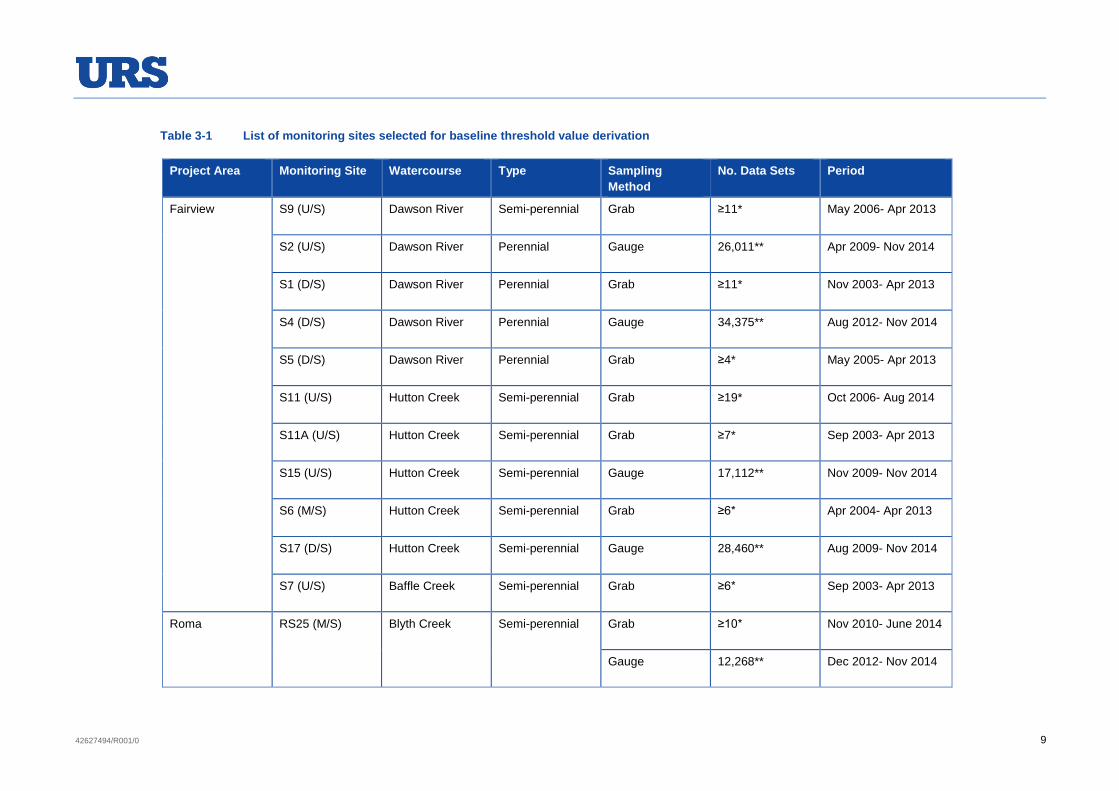
42627494/R001/0 9
Table 3-1 List of monitoring sites selected for baseline threshold value derivation
Project Area Monitoring Site Watercourse Type Sampling Method
No. Data Sets Period
Fairview S9 (U/S) Dawson River Semi-perennial Grab ≥11* May 2006- Apr 2013
S2 (U/S) Dawson River Perennial Gauge 26,011** Apr 2009- Nov 2014
S1 (D/S) Dawson River Perennial Grab ≥11* Nov 2003- Apr 2013
S4 (D/S) Dawson River Perennial Gauge 34,375** Aug 2012- Nov 2014
S5 (D/S) Dawson River Perennial Grab ≥4* May 2005- Apr 2013
S11 (U/S) Hutton Creek Semi-perennial Grab ≥19* Oct 2006- Aug 2014
S11A (U/S) Hutton Creek Semi-perennial Grab ≥7* Sep 2003- Apr 2013
S15 (U/S) Hutton Creek Semi-perennial Gauge 17,112** Nov 2009- Nov 2014
S6 (M/S) Hutton Creek Semi-perennial Grab ≥6* Apr 2004- Apr 2013
S17 (D/S) Hutton Creek Semi-perennial Gauge 28,460** Aug 2009- Nov 2014
S7 (U/S) Baffle Creek Semi-perennial Grab ≥6* Sep 2003- Apr 2013
Roma RS25 (M/S) Blyth Creek Semi-perennial Grab ≥10* Nov 2010- June 2014
Gauge 12,268** Dec 2012- Nov 2014
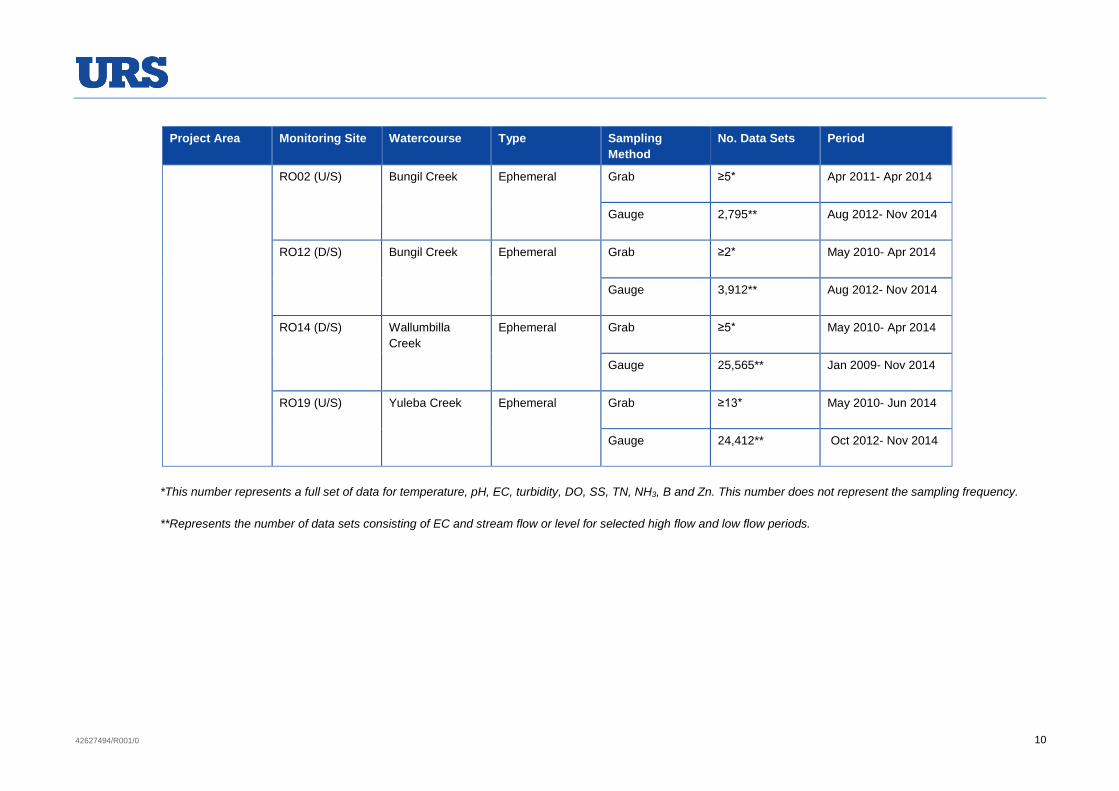
42627494/R001/0 10
Project Area Monitoring Site Watercourse Type Sampling Method
No. Data Sets Period
RO02 (U/S) Bungil Creek Ephemeral Grab ≥5* Apr 2011- Apr 2014
Gauge 2,795** Aug 2012- Nov 2014
RO12 (D/S) Bungil Creek Ephemeral Grab ≥2* May 2010- Apr 2014
Gauge 3,912** Aug 2012- Nov 2014
RO14 (D/S) Wallumbilla Creek
Ephemeral Grab ≥5* May 2010- Apr 2014
Gauge 25,565** Jan 2009- Nov 2014
RO19 (U/S) Yuleba Creek Ephemeral Grab ≥13* May 2010- Jun 2014
Gauge 24,412** Oct 2012- Nov 2014
*This number represents a full set of data for temperature, pH, EC, turbidity, DO, SS, TN, NH3, B and Zn. This number does not represent the sampling frequency.
**Represents the number of data sets consisting of EC and stream flow or level for selected high flow and low flow periods.

42627494/R001/0 11
Figure 3-1 Selected Stream flow and EC data used for EC threshold value calculations for waters at S2 (Dawson River) under low flow conditions
Figure 3-2 Selected Stream flow and EC data used for EC threshold value calculations for
waters at S2 (Dawson River) under high flow conditions

42627494/R001/0 12
4 BASELINE THRESHOLD VALUES
4.1 Fairview Project Area
4.1.1 Flow and EC Gauge Data
4.1.1.1 Dawson River
Monitoring Site S2
Results from the statistical low flow and high flow data for the Dawson River at monitoring site S2 is presented in Table 4-1.
Table 4-1 EC levels for low and high flow conditions at S2 (Dawson River)
S2 (Dawson River) Discharge Conductivity Cumecs µS/cm
Low Flow High Flow Low Flow High Flow Number of data points
23465 2546 23465 2546
Maximum 2.7 2557.4 387 239 Minimum 0.0 2.9 220 91 Median 0.1 90.6 310 151 Average 0.5 331.6 317 155 20th Percentile 0.1 21.5 292 125 80th Percentile 1.5 504.4 344 183 Standard Deviation 0.7 518.1 27 36
Both high flow and low flow water quality statistics were derived from a large data set. The high flow data was derived from three separate rain events spanning 12 months and two wet seasons, whereas low flow data was obtained between July 2009 and October 2012. The median for EC in the Dawson River at S2 under high flow (151 µS/cm) was significantly lower than that in low flow conditions (310 µS/cm), which were both lower than the WQOs set in EPP Water for the Upper Dawson Catchment; the EC WQOs for the protection of aquatic ecosystems in the moderately disturbed waters of the Upper Dawson River is 210 µS/cm and 370 µS/cm for high flow and low flow conditions, respectively.
Monitoring Site S4
Results from the statistical analysis of low flow and high flow data for the Dawson River at monitoring site S2 is presented in Table 4-2.
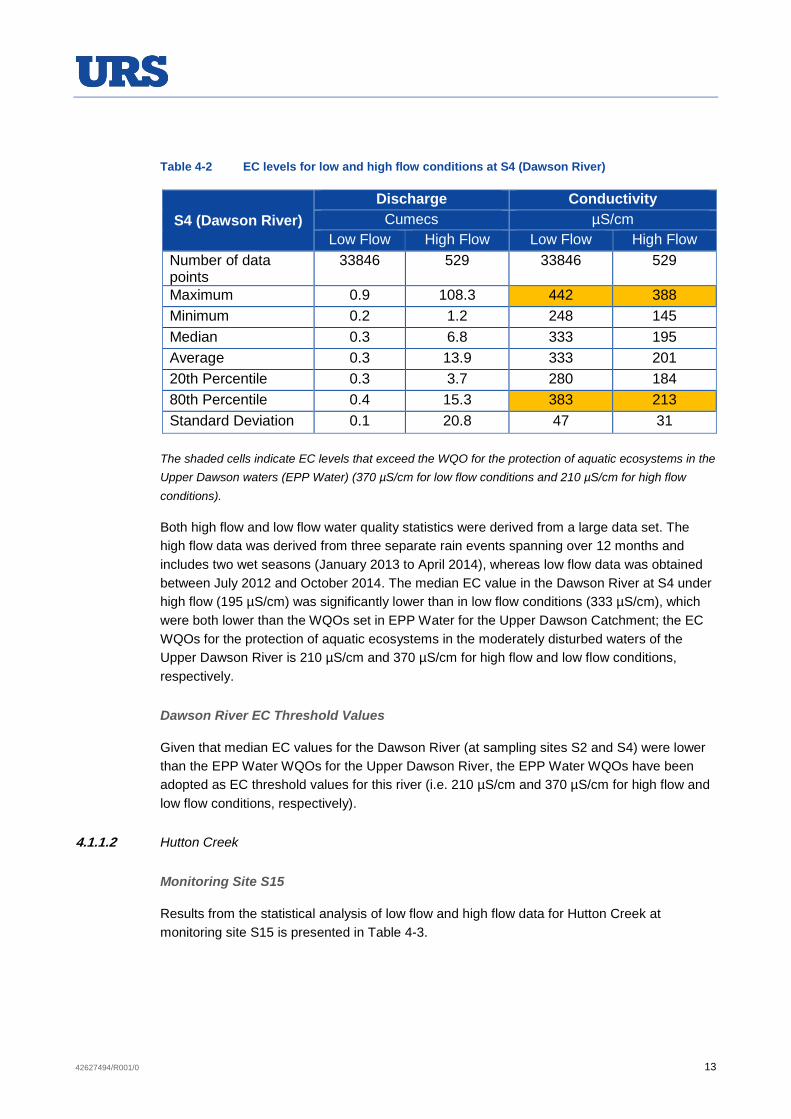
42627494/R001/0 13
Table 4-2 EC levels for low and high flow conditions at S4 (Dawson River)
S4 (Dawson River) Discharge Conductivity
Cumecs µS/cm Low Flow High Flow Low Flow High Flow
Number of data points
33846 529 33846 529
Maximum 0.9 108.3 442 388 Minimum 0.2 1.2 248 145 Median 0.3 6.8 333 195 Average 0.3 13.9 333 201 20th Percentile 0.3 3.7 280 184 80th Percentile 0.4 15.3 383 213 Standard Deviation 0.1 20.8 47 31
The shaded cells indicate EC levels that exceed the WQO for the protection of aquatic ecosystems in the Upper Dawson waters (EPP Water) (370 µS/cm for low flow conditions and 210 µS/cm for high flow conditions).
Both high flow and low flow water quality statistics were derived from a large data set. The high flow data was derived from three separate rain events spanning over 12 months and includes two wet seasons (January 2013 to April 2014), whereas low flow data was obtained between July 2012 and October 2014. The median EC value in the Dawson River at S4 under high flow (195 µS/cm) was significantly lower than in low flow conditions (333 µS/cm), which were both lower than the WQOs set in EPP Water for the Upper Dawson Catchment; the EC WQOs for the protection of aquatic ecosystems in the moderately disturbed waters of the Upper Dawson River is 210 µS/cm and 370 µS/cm for high flow and low flow conditions, respectively.
Dawson River EC Threshold Values
Given that median EC values for the Dawson River (at sampling sites S2 and S4) were lower than the EPP Water WQOs for the Upper Dawson River, the EPP Water WQOs have been adopted as EC threshold values for this river (i.e. 210 µS/cm and 370 µS/cm for high flow and low flow conditions, respectively).
4.1.1.2 Hutton Creek
Monitoring Site S15
Results from the statistical analysis of low flow and high flow data for Hutton Creek at monitoring site S15 is presented in Table 4-3.
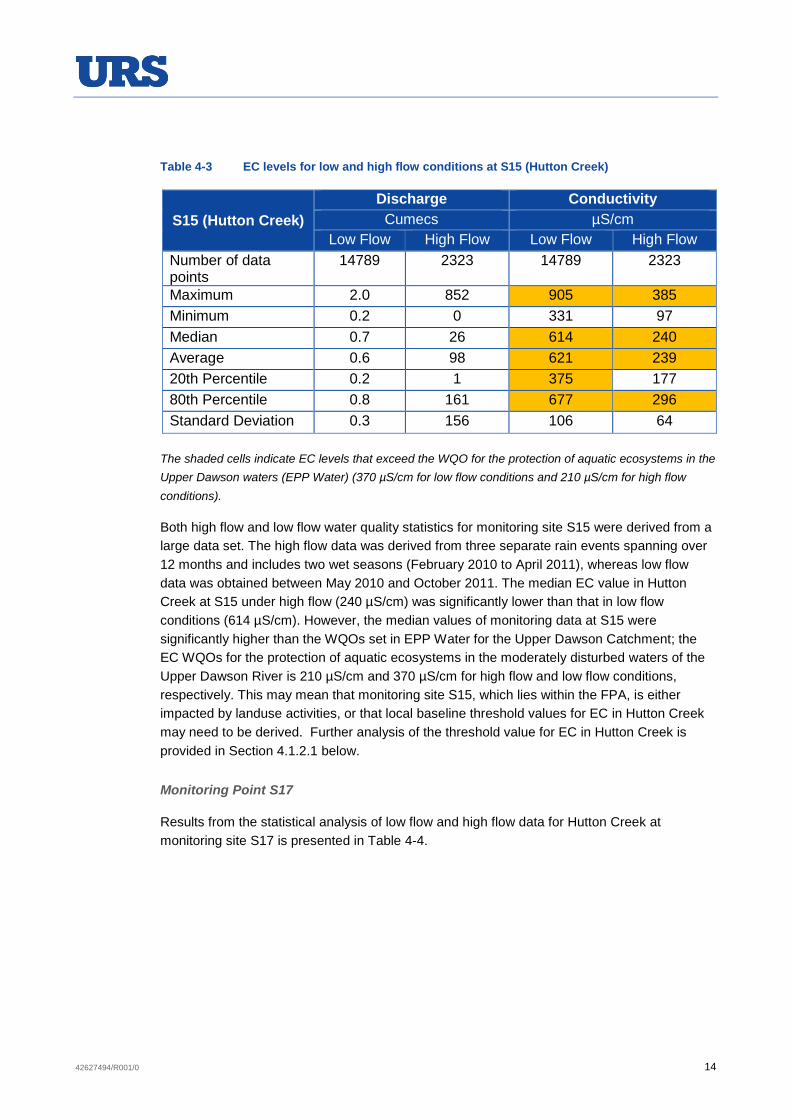
42627494/R001/0 14
Table 4-3 EC levels for low and high flow conditions at S15 (Hutton Creek)
S15 (Hutton Creek) Discharge Conductivity
Cumecs µS/cm Low Flow High Flow Low Flow High Flow
Number of data points
14789 2323 14789 2323
Maximum 2.0 852 905 385 Minimum 0.2 0 331 97 Median 0.7 26 614 240 Average 0.6 98 621 239 20th Percentile 0.2 1 375 177 80th Percentile 0.8 161 677 296 Standard Deviation 0.3 156 106 64
The shaded cells indicate EC levels that exceed the WQO for the protection of aquatic ecosystems in the Upper Dawson waters (EPP Water) (370 µS/cm for low flow conditions and 210 µS/cm for high flow conditions).
Both high flow and low flow water quality statistics for monitoring site S15 were derived from a large data set. The high flow data was derived from three separate rain events spanning over 12 months and includes two wet seasons (February 2010 to April 2011), whereas low flow data was obtained between May 2010 and October 2011. The median EC value in Hutton Creek at S15 under high flow (240 µS/cm) was significantly lower than that in low flow conditions (614 µS/cm). However, the median values of monitoring data at S15 were significantly higher than the WQOs set in EPP Water for the Upper Dawson Catchment; the EC WQOs for the protection of aquatic ecosystems in the moderately disturbed waters of the Upper Dawson River is 210 µS/cm and 370 µS/cm for high flow and low flow conditions, respectively. This may mean that monitoring site S15, which lies within the FPA, is either impacted by landuse activities, or that local baseline threshold values for EC in Hutton Creek may need to be derived. Further analysis of the threshold value for EC in Hutton Creek is provided in Section 4.1.2.1 below.
Monitoring Point S17
Results from the statistical analysis of low flow and high flow data for Hutton Creek at monitoring site S17 is presented in Table 4-4.

42627494/R001/0 15
Table 4-4 EC levels for waters at S17 (Hutton Creek) under low and high flow conditions
S17 (Hutton Creek) Discharge Conductivity
Cumecs µS/cm Low Flow High Flow Low Flow High Flow
Number of data points
26546 1914 26546 1914
Maximum 11.2 2013.1 496 256 Minimum 0.0 2.2 357 68 Median 0.0 34.0 413 131 Average 0.1 195.1 423 134 20th Percentile 0.0 10.1 379 97 80th Percentile 0.3 260.9 479 173 Standard Deviation 0.3 369.6 44 36
The shaded cells indicate EC levels that exceed the WQO for the protection of aquatic ecosystems in the Upper Dawson waters (EPP Water) (370 µS/cm for low flow conditions and 210 µS/cm for high flow conditions).
Both high flow and low flow water quality statistics for monitoring site S17 were derived from a large data set. The high flow data was derived from three separate rain events spanning over 12 months and includes two wet seasons (October 2010 to February 2012), whereas low flow data was obtained between August 2009 and October 2013. The median for EC in Hutton Creek at S17 under high flow (131 µS/cm) was significantly lower than that in low flow conditions (413 µS/cm). The median values of EC measured at S17 under high flow conditions were significantly lower than the WQOs set in EPP Water for the Upper Dawson Catchment (210 µS/cm). In contrast, the median for EC in Hutton Creek under low flow conditions measured at site S17 exceeded the corresponding EC WQOs for low flow conditions (370 µS/cm). This may mean that the waters in Hutton Creek at monitoring site S17, which lies within the FPA, is either impacted by landuse activities such as cattle grazing, or that local baseline threshold values for EC in Hutton Creek under low flow conditions may need to be derived. Further analysis of the threshold value for EC in Hutton Creek is provided in Section 4.1.2.1 below.
4.1.2 Grab Sampling Data
Results from the statistical analysis of grab sampling data for the Dawson River, Hutton Creek and Baffle Creek is presented in Table 4-5.

42627494/R001/0 16
Table 4-5 Water quality in the Dawson River, Hutton Creek and Baffle Creek measured by grab sampling between 2003 and 2013
Site Stream Parameter
Ambient Temp - Field
pH - Field EC - Field Turbidity -
Field DO - Field Suspended Solids
Total Nitrogen NH3-N Boron
(total) Zinc
(dissolved)
Unit °C pH Unit µS/cm NTU mg/L mg/L mg/L mg/L mg/L mg/L
Published WQO* NA 6.5-8.5
low flow- 370 50 7-9 30 0.62 0.02 0.37 0.008 high flow- 210
S11 Hutton Creek (U/S)
Count 9 28 23 19 22 44 39 40 39 40 Median 18.3 7.5 379 12 7.85 14 0.5 0.03 0.025 0.0025 20th %ile 15.48 7.2 359 1.2 4.996 6.6 0.4 0.005 0.025 0.0025 80th %ile 24.94 8.0 596 38 8.592 44.2 0.9 0.04 0.06 0.0086
S11A Hutton Creek (U/S)
Count 7 11 10 8 7 9 9 9 10 9 Median 22.5 7.2 591 48 7.3 61 0.84 0.017 0.0305 0.01 20th %ile 14.56 6.8 155 21 4.82 23 0.63 0.005 0.025 0.0052 80th %ile 25.56 7.6 664 168 8.4 368 1.42 0.0402 0.0438 0.0208
S6 Hutton Creek (M/S)
Count 12 11 15 6 11 10 14 10 13 11 Median 22.6 7.2 358 23 5.6 61 0.9 0.0135 0.044 0.0025 20th %ile 14.18 6.7 179 9.5 5 5.8 0.63 0.005 0.025 0.0025 80th %ile 23.2 7.4 465 116 7.5 128.4 1.31 0.0478 0.069 0.014
S7 Baffle Creek (U/S)
Count 13 12 16 6 12 12 15 12 16 12 Median 24 7.2 155 64 8.75 36 0.81 0.01 0.025 0.0185 20th %ile 16.6 6.7 134 17 7.2 15.6 0.58 0.005 0.025 0.0044 80th %ile 31.34 7.8 196 101 9.776 73.6 1.02 0.0432 0.046 0.0248
S9 Dawson River (U/S)
Count 9 8 11 6 8 11 11 11 11 11 Median 20.6 6.7 140 74 7 33 0.9 0.03 0.025 0.011 20th %ile 13.28 6.5 84 22 2.32 16 0.48 0.01 0.025 0.0025 80th %ile 28.36 7.6 163 94 10.14 67 2.5 0.4 0.038 0.018
S5 Dawson River (D/S)
Count 7 6 10 4 7 9 10 9 9 9 Median 19.8 7.4 346 11.7 8.1 10 0.34 0.005 0.025 0.004 20th %ile 12.44 7.1 274 6.04 6.2 5.6 0.18 0.005 0.023 0.0025 80th %ile 22.92 7.7 520 118 12.2 23 0.56 0.0174 0.0624 0.0082

42627494/R001/0 17
Site Stream Parameter
Ambient Temp - Field
pH - Field EC - Field Turbidity -
Field DO - Field Suspended Solids
Total Nitrogen NH3-N Boron
(total) Zinc
(dissolved)
Unit °C pH Unit µS/cm NTU mg/L mg/L mg/L mg/L mg/L mg/L
S1 Dawson River (D/S)
Count 11 11 16 5 12 12 15 11 15 12 Median 21.2 6.9 267 9.5 6.6 11 0.37 0.005 0.025 0.0085 20th %ile 16.7 6.7 228 4.4 5.1 5.4 0.15 0.005 0.025 0.0025 80th %ile 24.6 7 382 93 7.72 29.8 0.54 0.02 0.054 0.0164
*WQOs for the protection of the aquatic ecosystem in the moderately disturbed waters of the Upper Dawson River Catchment are found in EPP Water, with the exception of those for boron and zinc- these are derived from the ANZECC (2000) guidelines for the 95% protection of aquatic ecosystems.
Cells shaded in gold depict parameter values that exceed their corresponding WQOs. Only medians were assessed in accordance with the QWQG (2009).

42627494/R001/0 18
4.1.2.1 Electrical Conductivity
Median levels of EC sampled in Hutton Creek at three different monitoring locations were found to exceed the WQO for the Upper Dawson waters (370 µS/cm). The results for EC levels in Hutton Creek obtained by grab sampling are consistent with those obtained by automatic flow gauges. It is important to note that the grab sampling data did not include data on stream flows at the time of sampling, thereby precluding any assessments with regards to EC levels and flows in Hutton Creek. Furthermore, whilst the grab sampling data point to elevated EC levels in Hutton Creek, the number of grab samples taken (9, 7 and 12 for S11, S11a and S6, respectively), are insufficient for the derivation of robust EC baseline threshold values.
EC levels in Baffle Creek and Dawson River measured by grab sampling were below the EC WQOs for the Upper Dawson River. The results for the Dawson River taken at monitoring points S9, S5 and S1 were consistent with those obtained by automatic flow gauges taken at sites S2 and S4.
The large amounts of data collected by automatic gauges at S15 and S17 allow for the derivation of threshold values with a high degree of confidence, which strongly suggest that the EC levels in Hutton Creek are indeed elevated above the WQOs for the Upper Dawson waters set in the EPP Water. Whether an interim local baseline threshold values for EC in Hutton Creek is required was verified using the EC 80th percentiles as follows;
• Average 80th percentile for EC (low flow) = (6771 +4792)/2
= 578 µS/cm
• Standard deviation = 140 µS/cm
Given that the average of the 80th percentile for EC levels ± two times the standard deviation [578 – (140 x 2) equals 298 µS/cm] is not greater than the regional guideline value for EC of 370 µS/cm, then a local baseline threshold value for Hutton Creek should not be adopted.
Adoption of sub-regional WQOs set out for the Upper Dawson River catchment is recommended for both the Dawson and Hutton Rivers (210 µS/cm for high flow conditions and 370 µS/cm for low flow conditions).
4.1.2.2 pH
Medians of pH of waters sampled from numerous monitoring points on the Dawson River, Hutton Creek and Baffle Creek were all within the WQO of 6.5 to 8.5 for the Upper Dawson catchment. The published sub-regional WQO of pH 6.5 to 8.5 has therefore been adopted as the baseline threshold value for pH for surface water in these watercourses.
4.1.2.3 Turbidity
The surface water in Baffle Creek (at location S7) and Dawson River (at location S9) had median turbidity levels that exceeded the 50 Nephelometric Turbidity Unit (NTU) WQO for the Upper Dawson catchment. Both data sets consisted of only six separate sampling events;
1 80th percentile low flow EC value for automatic gauging station S15. 2 80th percentile low flow EC value for automatic gauging station S17.
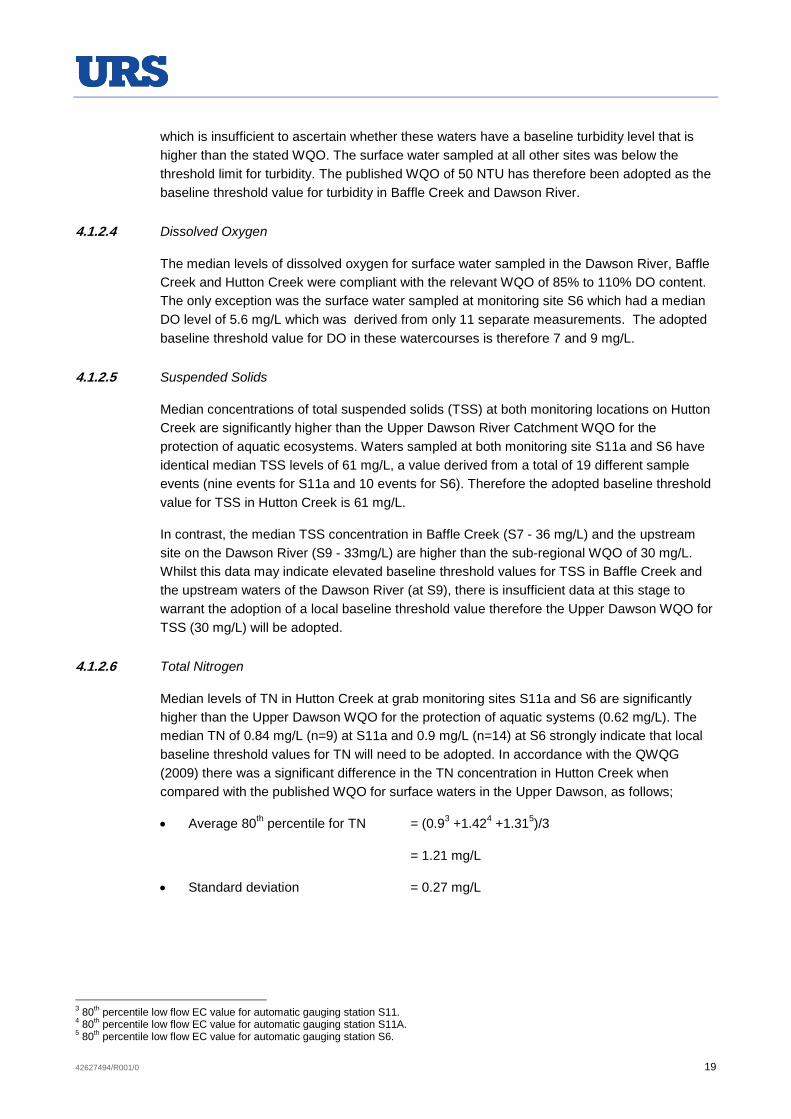
42627494/R001/0 19
which is insufficient to ascertain whether these waters have a baseline turbidity level that is higher than the stated WQO. The surface water sampled at all other sites was below the threshold limit for turbidity. The published WQO of 50 NTU has therefore been adopted as the baseline threshold value for turbidity in Baffle Creek and Dawson River.
4.1.2.4 Dissolved Oxygen
The median levels of dissolved oxygen for surface water sampled in the Dawson River, Baffle Creek and Hutton Creek were compliant with the relevant WQO of 85% to 110% DO content. The only exception was the surface water sampled at monitoring site S6 which had a median DO level of 5.6 mg/L which was derived from only 11 separate measurements. The adopted baseline threshold value for DO in these watercourses is therefore 7 and 9 mg/L.
4.1.2.5 Suspended Solids
Median concentrations of total suspended solids (TSS) at both monitoring locations on Hutton Creek are significantly higher than the Upper Dawson River Catchment WQO for the protection of aquatic ecosystems. Waters sampled at both monitoring site S11a and S6 have identical median TSS levels of 61 mg/L, a value derived from a total of 19 different sample events (nine events for S11a and 10 events for S6). Therefore the adopted baseline threshold value for TSS in Hutton Creek is 61 mg/L.
In contrast, the median TSS concentration in Baffle Creek (S7 - 36 mg/L) and the upstream site on the Dawson River (S9 - 33mg/L) are higher than the sub-regional WQO of 30 mg/L. Whilst this data may indicate elevated baseline threshold values for TSS in Baffle Creek and the upstream waters of the Dawson River (at S9), there is insufficient data at this stage to warrant the adoption of a local baseline threshold value therefore the Upper Dawson WQO for TSS (30 mg/L) will be adopted.
4.1.2.6 Total Nitrogen
Median levels of TN in Hutton Creek at grab monitoring sites S11a and S6 are significantly higher than the Upper Dawson WQO for the protection of aquatic systems (0.62 mg/L). The median TN of 0.84 mg/L (n=9) at S11a and 0.9 mg/L (n=14) at S6 strongly indicate that local baseline threshold values for TN will need to be adopted. In accordance with the QWQG (2009) there was a significant difference in the TN concentration in Hutton Creek when compared with the published WQO for surface waters in the Upper Dawson, as follows;
• Average 80th percentile for TN = (0.93 +1.424 +1.315)/3
= 1.21 mg/L
• Standard deviation = 0.27 mg/L
3 80th percentile low flow EC value for automatic gauging station S11. 4 80th percentile low flow EC value for automatic gauging station S11A. 5 80th percentile low flow EC value for automatic gauging station S6.

42627494/R001/0 20
Given that the average of the 80th percentile for TN concentrations ± two times the standard deviation of the average [1.21 – (0.27 x 2) equals 0.67 mg/L] is greater than the EPP Water WQO for TN of 0.62 mg/L, then a local baseline threshold value for Hutton Creek of 1.21 mg/L for TN should be adopted.
The median value for TN in Baffle Creek (S7) also exceeded the Upper Dawson WQO for the protection of aquatic ecosystems, however this is based on a data set size that is considered to be inadequate to firmly conclude whether a local baseline threshold value for TN in Baffle Creek is required. The adopted TN threshold value for Baffle Creek will therefore be 0.62 mg/L, in-line with the sub-regional WQO.
Medians and 80th percentiles of TN in the surface waters in Dawson River at monitoring sites S5 and S1 were below the Upper Dawson WQO. However, surface water at the upstream site of S9 was found to contain elevated levels of TN, such that the median TN level (0.9 mg/L) was significantly higher than the corresponding WQO (0.62 mg/L). Assessment of the average of the 80th percentiles ± 2 x standard deviation of the TN levels measured at S5, S1 and S9 indicated that the adoption of a local baseline threshold value for TN in the Dawson River was not warranted. Therefore the TN baseline threshold value for the Dawson River is 0.62 mg/L.
4.1.2.7 Ammonia
The median levels for ammonia measured in the Hutton Creek were below the Upper Dawson WQO for sites S6 and S11a, but exceeding the WQO at site S11. However, the 80th percentile for ammonia measured at all these three sites exceeded the WQO of 0.02 mg/L. In accordance with the QWQG (2009) there was a significant difference in the ammonia concentration in Hutton Creek when compared with the published WQO for surface waters in the Upper Dawson, as follows;
• Average 80th percentile for ammonia = (0.046 +0.04027 +0.04788)/3
=0.0427 mg/L
• Standard deviation =0.004 mg/L
Given that the average of the 80th percentile for ammonia concentrations ± two times the standard deviation of the average [0.0427 – (0.004 x 2) equals 0.0347 mg/L] is greater than the EPP Water WQO for ammonia of 0.02 mg/L, then a local baseline threshold value for Hutton Creek of 0.0427 mg/L for ammonia should be adopted.
The median value for ammonia in Baffle Creek (S7) did not exceed the Upper Dawson WQO for the protection of aquatic ecosystems. This median is based on a set of 14 different sampling events, a data set that is considered to be inadequate in size to allow for the adoption of a local baseline threshold value for Baffle Creek. Until further data becomes available, the ammonia threshold value for Baffle Creek will therefore be 0.02 mg/L.
6 80th percentile low flow EC value for automatic gauging station S11. 7 80th percentile low flow EC value for automatic gauging station S11A. 8 80th percentile low flow EC value for automatic gauging station S6.

42627494/R001/0 21
Similar to the results for TN, medians and 80th percentiles of ammonia in the surface waters in Dawson River at monitoring sites S5 and S1 were compliant with the Upper Dawson WQO. However, surface water at the upstream site of S9 was found to contain elevated levels of ammonia, such that the median ammonia level (0.03 mg/L) was significantly higher than the corresponding WQO. Assessment of the average of the 80th percentiles ± 2 x standard deviation of the ammonia levels measured at S5, S1 and S9 indicated that the adoption of a local baseline threshold value for ammonia in the Dawson River was not warranted. Therefore the ammonia baseline threshold value for the Dawson River is 0.02 mg/L.
4.1.2.8 Boron
Surface water sampled in the Dawson River, Hutton Creek and Baffle Creek all had levels of boron that were well below the WQO for the protection of aquatic ecosystems of 0.37 mg/L, therefore this concentration is the adopted boron baseline threshold vale for the surface water environment within the FPA.
4.1.2.9 Zinc
Surface waters monitored in Hutton Creek for levels of total zinc indicated median concentrations that were below the WQO of 0.008 mg/L, with the exception of site S11a. The 80th percentiles for these waters were all above the WQO, however, assessment of the average of the 80th percentiles ± 2 x standard deviation of the total levels of zinc measured at S11, S11a and S6 indicated that the adoption of a local baseline threshold value for total zinc in Hutton Creek was not warranted. Furthermore, soluble levels of zinc in Hutton Creek were well below the WQO. Therefore the zinc baseline threshold value for Hutton Creek is 0.008 mg/L (the sub-regional WQO).
Median and 80th percentile of total zinc levels in Baffle Creek (S7) were also in exceedance of the WQO. The data set comprised only of 12 separate sampling events, whereas soluble zinc was measured only once; therefore insufficient data is available to ascertain whether a local baseline threshold value is warranted. A baseline threshold value of 0.008 mg/L for zinc in Baffle Creek (the sub-regional WQO) should therefore be adopted.
4.2 Roma Project Area
4.2.1 Flow and EC Gauge Data
4.2.1.1 Blyth Creek at Monitoring Point RS25
Results from the statistical analysis of low flow and high flow data for Blyth Creek at monitoring site RS25 is presented in Table 4-6.
Both high flow and low flow water quality statistics were derived from a large data set. The median for EC in Blyth Creek at RS25 under high flow (592 µS/cm) was significantly lower than that in low flow conditions (6456 µS/cm), which were both significantly higher than the guideline value (350 µS/cm) for upland freshwater streams for south-east Australia set in the ANZECC/ARMCANZ (2000) guidelines.

42627494/R001/0 22
Given that Blyth Creek is an ephemeral watercourse, EC levels during no-flow conditions reflect deteriorating water quality in isolated pools; this data should therefore not be considered when assessing baseline EC threshold values for Blyth Creek. The 80th percentile value for EC in Blyth Creek was 676 µS/cm, significantly higher than the ANZECC/ARMCANZ (2000) guideline value for the protection of aquatic ecosystems. A concentration of 676 µS/cm should therefore be adopted as an interim EC baseline threshold value for Blyth Creek.
Table 4-6 EC values for water at RS25 (Blyth Creek) under low and high flow conditions
RS25 (Blyth Creek) Discharge Conductivity Cumecs µS/cm
Low Flow High Flow Low Flow High Flow Number of data points
12240 229 12039 229
Maximum 0.2 1.5 12187 11397 Minimum 0.0 0.0 3100 382 Median 0.0 0.4 6456 592 Average 0.0 0.5 6855 1209 20th Percentile 0.0 0.3 4674 458 80th Percentile 0.0 0.6 9171 676 Standard Deviation 0.0 0.2 2325 229
The shaded cells indicate EC levels that exceed the guideline value (350 µS/cm) for upland freshwater streams for south-east Australia set in the ANZECC/ARMCANZ (2000) guidelines.
4.2.1.2 Bungil Creek (Bungil Creek at Monitoring Site RO12
Results from the statistical analysis of low flow and high flow data for Blyth Creek at monitoring site RO12 is presented in Table 4-7.
Table 4-7 EC levels for water at RO12 (Bungil Creek) under low and high flow conditions
RO12 (Bungil Creek)
Water Level Conductivity m µS/cm
Low Flow High Flow Low Flow High Flow Number of data points
3504 408 3504 408
Maximum 0.5 3.8 395 232 Minimum 0.1 0.5 331 76 Median 0.3 2.0 350 171 Average 0.3 2.1 352 170 20th Percentile 0.2 1.1 339 144 80th Percentile 0.4 3.3 357 200 Standard Deviation 0.1 1.0 15 36
The shaded cells indicate EC levels that exceed the guideline value (350 µS/cm) for upland freshwater streams for south-east Australia set in the ANZECC/ARMCANZ (2000) guidelines.

42627494/R001/0 23
Both high flow and low flow water quality statistics were derived from a large data set. The high flow data was derived from two separate rain events spanning over three months during the 2014 wet season, whereas low flow data was obtained between April 2014 and July 2014. The median for EC in Bungil Creek at R012 under high flow (171 µS/cm) was significantly lower than that in low flow conditions (350 µS/cm), which were compliant with the regional guideline. Therefore the EC baseline threshold value for Bungil Creek is 350 µS/cm.
4.2.1.3 Bungil Creek at Monitoring Point R002
Results from the statistical analysis of low flow and high flow data for Bungil Creek at monitoring site R002 is presented in Table 4-8.
Table 4-8 EC levels for monitoring point R002 (Bungil Creek) under low flow and high flow conditions
R002 (Bungil Creek)
Discharge Conductivity Cumecs µS/cm
Low Flow High Flow Low Flow High Flow Number of data points
2666 129 2666 129
Maximum 0.0 22.2 2304 257 Minimum 0.0 1.0 1131 33 Median 0.0 5.6 1902 99 Average 0.0 6.4 1882 100 20th Percentile 0.0 2.1 1735 58 80th Percentile 0.0 8.8 2013 121 Standard Deviation 0.0 4.8 168 46
The shaded cells indicate EC levels that exceed the guideline value (350 µS/cm) for upland freshwater streams for south-east Australia set in the ANZECC/ARMCANZ (2000) guidelines. The median for EC in Bungil Creek at R002 under high flow (99 µS/cm) was significantly lower than that in low/no flow conditions (1902 µS/cm). The median and 80th percentile values for EC measured at this monitoring point on Bungil Creek were significantly lower than the regional EC guideline value. Given that EC levels measured during no flow conditions probably reflect deteriorating water quality in isolated pools, this data was not considered when assessing baseline EC threshold values for Bungil Creek. The regional EC guideline value of 350 µS/cm will be adopted as EC baseline threshold value for Bungil Creek at R002.
4.2.1.4 Wallumbillla Creek at Monitoring Point R014
Results from the statistical analysis of low flow and high flow data for Wallumbilla Creek at monitoring site R014 is presented in Table 4-9.
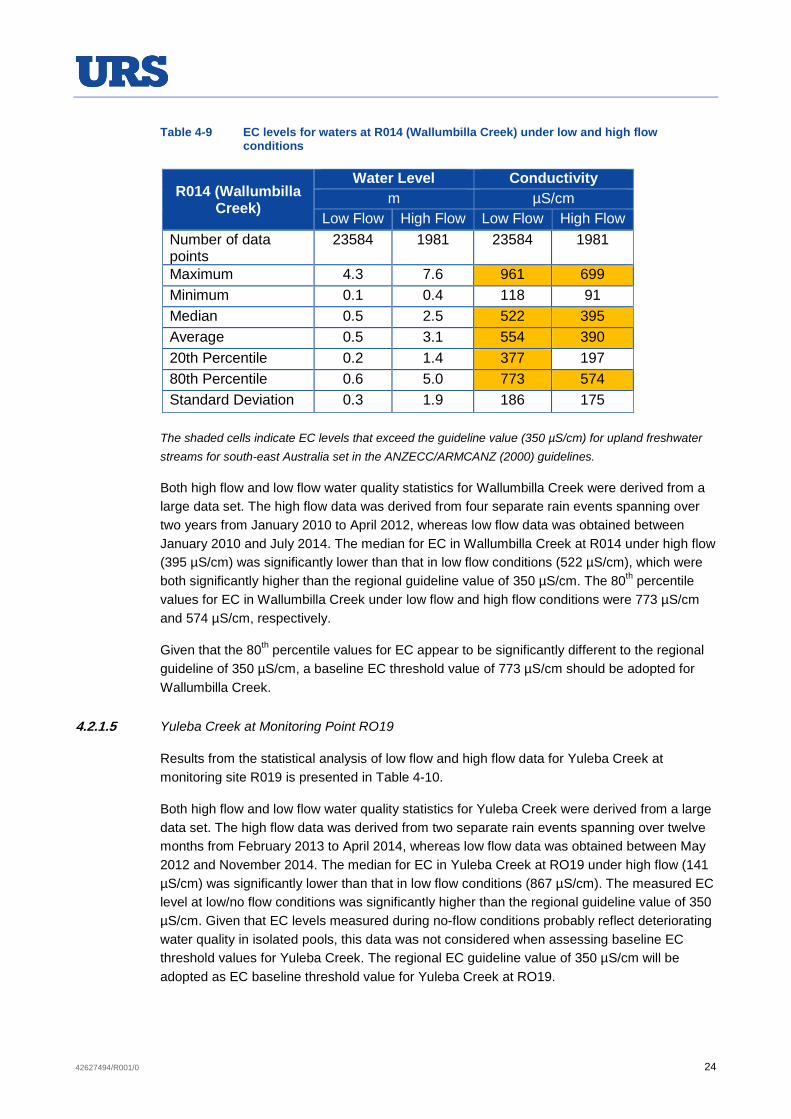
42627494/R001/0 24
Table 4-9 EC levels for waters at R014 (Wallumbilla Creek) under low and high flow conditions
R014 (Wallumbilla Creek)
Water Level Conductivity m µS/cm
Low Flow High Flow Low Flow High Flow Number of data points
23584 1981 23584 1981
Maximum 4.3 7.6 961 699 Minimum 0.1 0.4 118 91 Median 0.5 2.5 522 395 Average 0.5 3.1 554 390 20th Percentile 0.2 1.4 377 197 80th Percentile 0.6 5.0 773 574 Standard Deviation 0.3 1.9 186 175
The shaded cells indicate EC levels that exceed the guideline value (350 µS/cm) for upland freshwater streams for south-east Australia set in the ANZECC/ARMCANZ (2000) guidelines.
Both high flow and low flow water quality statistics for Wallumbilla Creek were derived from a large data set. The high flow data was derived from four separate rain events spanning over two years from January 2010 to April 2012, whereas low flow data was obtained between January 2010 and July 2014. The median for EC in Wallumbilla Creek at R014 under high flow (395 µS/cm) was significantly lower than that in low flow conditions (522 µS/cm), which were both significantly higher than the regional guideline value of 350 µS/cm. The 80th percentile values for EC in Wallumbilla Creek under low flow and high flow conditions were 773 µS/cm and 574 µS/cm, respectively.
Given that the 80th percentile values for EC appear to be significantly different to the regional guideline of 350 µS/cm, a baseline EC threshold value of 773 µS/cm should be adopted for Wallumbilla Creek.
4.2.1.5 Yuleba Creek at Monitoring Point RO19
Results from the statistical analysis of low flow and high flow data for Yuleba Creek at monitoring site R019 is presented in Table 4-10.
Both high flow and low flow water quality statistics for Yuleba Creek were derived from a large data set. The high flow data was derived from two separate rain events spanning over twelve months from February 2013 to April 2014, whereas low flow data was obtained between May 2012 and November 2014. The median for EC in Yuleba Creek at RO19 under high flow (141 µS/cm) was significantly lower than that in low flow conditions (867 µS/cm). The measured EC level at low/no flow conditions was significantly higher than the regional guideline value of 350 µS/cm. Given that EC levels measured during no-flow conditions probably reflect deteriorating water quality in isolated pools, this data was not considered when assessing baseline EC threshold values for Yuleba Creek. The regional EC guideline value of 350 µS/cm will be adopted as EC baseline threshold value for Yuleba Creek at RO19.

42627494/R001/0 25
Table 4-10 EC levels for waters at R019 (Yuleba Creek) under low and high flow conditions
R019 (Yuleba Creek)
Discharge Conductivity Cumecs µS/cm
Low Flow High Flow Low Flow High Flow Number of data points
23904 508 23904 508
Maximum 0.1 43.7 1298 426 Minimum 0.0 0.6 322 73 Median 0.0 1.9 867 141 Average 0.0 9.1 804 148 20th Percentile 0.0 1.1 635 91 80th Percentile 0.0 20.2 980 184 Standard Deviation 0.0 12.1 225 55
The shaded cells indicate EC levels that exceed the guideline value (350 µS/cm) for upland freshwater streams for south-east Australia set in the ANZECC/ARMCANZ (2000) guidelines.
4.2.2 Grab Sampling Data
Results from the statistical analysis of grab sampling data for the Blyth Creek, Bungil Creek, Wallumbilla Creek and Yuleba Creek are presented in Table 4-11.

42627494/R001/0 26
Table 4-11 Water quality in Blyth Creek, Bungil Creek, Wallumbilla Creek and Yuleba Creek measured by grab sampling between 2010 and 2014
Site Site Description Parameter
Field Ambient Temp
pH - Field
EC - Field
Turbidity - Field
DO - Field
Suspended Solids
Total Nitrogen as N
Ammonia as N
Boron Zinc
Unit °C pH Unit µS/cm NTU mg/L mg/L mg/L mg/L mg/L mg/L Guideline Value 6.5-7.5 350 25 7-9 na 0.25 0.9 0.37 0.008
RS25 Blyth Creek (M/S)
Count 10 12 10 12 12 25 25 25 13 13 Median 23.1 8.3 3428 49.1 8.9 94 2.2 0.02 0.24 0.0025 20th %ile 18.9 7.6 1086 29.6 6.9 32 0.96 0.005 0.108 0.0025 80th %ile 28.9 8.6 4890 71.9 10.0 1612 3.2 0.03 0.352 0.0058
R012 Bungil Creek (D/S)
Count 6 2 4 11 9 19 19 18 18 19 Median 19.2 7.1 818 87.1 8.5 51 0.9 0.04 0.06 0.006 20th %ile 14.4 6.6 485 25 4.6 25.8 0.56 0.024 0.025 0.0025 80th %ile 22.6 7.6 1110 454 11.9 202.2 1.44 0.066 0.08 0.0178
RO02 Bungil Creek (U/S)
Count 1 13 5 9 9 18 19 18 19 19 Median 27.4 7.9 1373 56.9 10.1 19 0.4 0.03 0.09 0.006 20th %ile 27.4 7.19 1256 31.24 6.302 9.4 0.3 0.014 0.08 0.0025 80th %ile 27.4 8.13 1763.6 142.5 10.6 29.6 0.76 0.056 0.124 0.0088
R014 Wallumbilla Creek (D/S)
Count 5 12 5 11 8 16 16 16 16 16 Median 24 7.2 187 142 4.8 82.5 1.2 0.03 0.025 0.016 20th %ile 21.2 7.1 151 116 2.2 44 1 0.02 0.025 0.008 80th %ile 27.1 7.7 266 533 6.5 136 1.9 0.06 0.025 0.024
R019 Yuleba Creek (U/S)
Count 13 22 13 15 16 31 31 31 24 24 Median 22 7.4 244 287 5.1 167 1.3 0.05 0.025 0.017 20th %ile 16.6 6.9 164 100.2 3.8 44 0.9 0.02 0.025 0.006 80th %ile 25.3 7.7 403 562.6 6.9 390 1.9 0.08 0.06 0.0264
*Guideline values for the protection of the aquatic ecosystem in the moderately disturbed waters of the Condamine-Balonne Basin are found in the ANZECC (2000) guidelines.
Cells shaded in gold depict parameter values that exceed their corresponding WQOs. Only medians were assessed in accordance with the QWQG (2009).
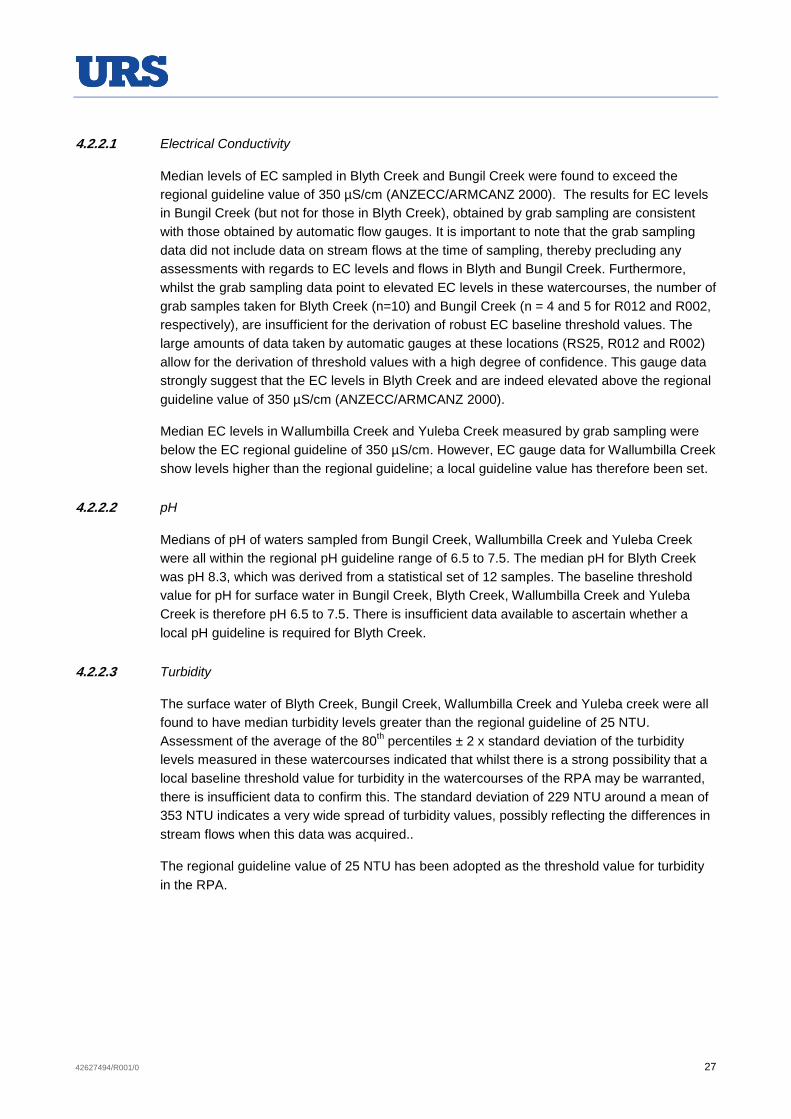
42627494/R001/0 27
4.2.2.1 Electrical Conductivity
Median levels of EC sampled in Blyth Creek and Bungil Creek were found to exceed the regional guideline value of 350 µS/cm (ANZECC/ARMCANZ 2000). The results for EC levels in Bungil Creek (but not for those in Blyth Creek), obtained by grab sampling are consistent with those obtained by automatic flow gauges. It is important to note that the grab sampling data did not include data on stream flows at the time of sampling, thereby precluding any assessments with regards to EC levels and flows in Blyth and Bungil Creek. Furthermore, whilst the grab sampling data point to elevated EC levels in these watercourses, the number of grab samples taken for Blyth Creek (n=10) and Bungil Creek (n = 4 and 5 for R012 and R002, respectively), are insufficient for the derivation of robust EC baseline threshold values. The large amounts of data taken by automatic gauges at these locations (RS25, R012 and R002) allow for the derivation of threshold values with a high degree of confidence. This gauge data strongly suggest that the EC levels in Blyth Creek and are indeed elevated above the regional guideline value of 350 µS/cm (ANZECC/ARMCANZ 2000).
Median EC levels in Wallumbilla Creek and Yuleba Creek measured by grab sampling were below the EC regional guideline of 350 µS/cm. However, EC gauge data for Wallumbilla Creek show levels higher than the regional guideline; a local guideline value has therefore been set.
4.2.2.2 pH
Medians of pH of waters sampled from Bungil Creek, Wallumbilla Creek and Yuleba Creek were all within the regional pH guideline range of 6.5 to 7.5. The median pH for Blyth Creek was pH 8.3, which was derived from a statistical set of 12 samples. The baseline threshold value for pH for surface water in Bungil Creek, Blyth Creek, Wallumbilla Creek and Yuleba Creek is therefore pH 6.5 to 7.5. There is insufficient data available to ascertain whether a local pH guideline is required for Blyth Creek.
4.2.2.3 Turbidity
The surface water of Blyth Creek, Bungil Creek, Wallumbilla Creek and Yuleba creek were all found to have median turbidity levels greater than the regional guideline of 25 NTU. Assessment of the average of the 80th percentiles ± 2 x standard deviation of the turbidity levels measured in these watercourses indicated that whilst there is a strong possibility that a local baseline threshold value for turbidity in the watercourses of the RPA may be warranted, there is insufficient data to confirm this. The standard deviation of 229 NTU around a mean of 353 NTU indicates a very wide spread of turbidity values, possibly reflecting the differences in stream flows when this data was acquired..
The regional guideline value of 25 NTU has been adopted as the threshold value for turbidity in the RPA.

42627494/R001/0 28
4.2.2.4 Dissolved Oxygen
The median levels of dissolved oxygen for surface water sampled in Bungil Creek were compliant with the relevant guideline of 7 to 9 mg/L DO. However, surface waters sampled from Wallumbilla Creek, Yuleba Creek and from one sampling point on Bungil Creek, all had median DO concentrations that were not compliant with the guideline value.
The regional guideline value of 7 to 9 mg/L has been adopted as the threshold value for DO in the RPA.
4.2.2.5 Suspended Solids
There are no guideline values for TSS for the watercourses in the RPA. The baseline threshold values for these watercourses are therefore derived from the 80th percentile levels of grab sampling data (See Table 4-11).
4.2.2.6 Total Nitrogen
Median levels of TN in Blyth Creek, Bungil Creek, Wallumbilla Creek and Yuleba Creek for waters grab sampled at monitoring sites depicted in Table 4-11 are significantly higher than the regional guideline value for the protection of aquatic systems (0.25 mg/L). These results strongly indicate that a local baseline threshold values for TN will need to be adopted. In accordance with the QWQG (2009), the local baseline threshold value for TN was calculated as follows;
• Average 80th percentile for TN = (3.29 +1.4410 +0.7611 + 1.912 + 1.913)/5
= 1.84 mg/L
• Standard deviation = 0.52 mg/L
Given that the average of the 80th percentile for TN concentrations ± two times the standard deviation of the average [1.84 – (0.52 x 2) equals 0.8 mg/L] is greater than the regional guideline for TN of 0.25 mg/L, then a local baseline threshold value for the watercourses in the RPA of 1.84 mg/L for TN should be adopted.
4.2.2.7 Ammonia
The median levels for ammonia measured in Blyth Creek, Bungil Creek, Wallumbilla Creek and Yuleba Creek were all below the regional guideline for ammonia of 0.9 mg/L. However, the 80th percentile levels of ammonia measured in these watercourses was much less than the regional guideline. Therefore it is prudent to use a local baseline threshold value for ammonia which is derived as follows;
• Average 80th percentile for ammonia = (0.039 +0.06610 +0.05611 + 0.0612 + 0.0813)/5
= 0.058 mg/L
9 80th percentile low flow EC value for automatic gauging station RS25. 10 80th percentile low flow EC value for automatic gauging station R012. 11 80th percentile low flow EC value for automatic gauging station R002. 12 80th percentile low flow EC value for automatic gauging station R014. 13 80th percentile low flow EC value for automatic gauging station R019.

42627494/R001/0 29
• Standard deviation = 0.018 mg/L
A local baseline threshold value for the watercourses in the RPA of 0.058 mg/L for ammonia should be adopted.
4.2.2.8 Boron
Surface water sampled in Blyth Creek, Bungil Creek, Wallumbilla Creek and Yuleba Creek all had levels of boron that were well within the guideline the protection of aquatic ecosystems of 0.37 mg/L. This concentration of boron is the adopted boron baseline threshold value for the surface water environment within the RPA.
4.2.2.9 Zinc
Surface waters in Wallumbilla Creek and Yuleba Creek, but not those of Blyth Creek and Bungil Creek, had median levels of total zinc that were higher than the regional guideline for the protection of aquatic ecosystems of 0.008 mg/L. However, median levels of dissolved zinc were found to be compliant with the regional guideline, which is adopted as the baseline threshold value for zinc in surface waters of the RPA.

42627494/R001/0 30
5 SUMMARY OF RESULTS
The baseline threshold values for surface waters within the FPA and RPA are shown in Table 5-1. The values found in cells shaded in green indicate locally derived threshold values. All other values correspond to the sub-regional WQOs (for Upper Dawson River catchment as per EPP Water) and regional guideline values (ANZECC/ARMCANZ 2000).

42627494/R001/0 31
Table 5-1 Baseline Threshold Values for Fairview and Roma Project Areas Surface Waters
Fairview Project Area Roma Project Area
Parameter Units Dawson River
Hutton Creek
Baffle Creek
Blyth Creek
Bungil Creek
Wallum-billa Creek
Yuleba Creek
EC (High Flow)
µS/cm
210 210 210
676 350 773 350
EC (Low Flow)
370 370 370
pH 6.5 - 8.5 6.5 - 8.5 6.5 - 8.5 6.5 - 7.5 6.5 - 7.5 6.5 - 7.5 6.5 - 7.5
Turbidity NTU 50 50 50 25 25 25 25
TSS mg/L 30 30 30 1612 202 136 390
DO mg/L 7-9 7-9 7-9 7-9
TN mg/L 0.62 1.21 0.62 1.84 1.84 1.84 1.84
Ammonia-N
mg/L 0.02 0.0427 0.02 0.058 0.058 0.058 0.058
Boron mg/L 0.37 0.37 0.37 0.37 0.37 0.37 0.37
Zinc (dissolved)
mg/L 0.008 0.008 0.008 0.008 0.008 0.008 0.008
Note: The values found in cells shaded in green indicate locally derived threshold values. All other values correspond to the sub-regional WQOs (for Upper Dawson River catchment as per EPP Water) and regional guideline values (ANZECC/ARMCANZ 2000).

42627494/R001/0 32
6 REFERENCES
ANZECC/ARMCANZ 2000. Australian and New Zealand Guidelines for Fresh and Marine Water Quality, Australian and New Zealand Environment Conservation Council and Agriculture and Resource Management Council of Australia and New Zealand, October 2000, Canberra.
EHP 2009. Queensland Water Quality Guidelines, Version 3, Department of Environment and Heritage Protection, Queensland Government, re-published July 2013.
EHP 2011. Environmental Protection (Water) Policy 2009. Dawson River Sub-basin Environmental Values and Water Quality Objectives Basin No. 130 (part), including all waters of the Dawson River Sub-basin except the Callide Creek Catchment.
URS 2014. Santos GLNG Gas Field Development Project EIS Appendix N (Surface Water Technical Report)

42627494/R001/0 33
7 LIMITATIONS
URS Australia Pty Ltd (URS) has prepared this report in accordance with the usual care and thoroughness of the consulting profession for the use of Santos Limited and only those third parties who have been authorised in writing by URS to rely on this Report.
It is based on generally accepted practices and standards at the time it was prepared. No other warranty, expressed or implied, is made as to the professional advice included in this Report.
It is prepared in accordance with the scope of work and for the purpose outlined in the URS memorandum dated 28 January 2015 and Contract Number 971591, Variation 2.
Where this Report indicates that information has been provided to URS by third parties, URS has made no independent verification of this information except as expressly stated in the Report. URS assumes no liability for any inaccuracies in or omissions to that information.
This Report was prepared between 2 February 2015 and 9 February 2015 and is based on the information reviewed at the time of preparation. URS disclaims responsibility for any changes that may have occurred after this time.
This Report should be read in full. No responsibility is accepted for use of any part of this report in any other context or for any other purpose or by third parties. This Report does not purport to give legal advice. Legal advice can only be given by qualified legal practitioners.
Except as required by law, no third party may use or rely on this Report unless otherwise agreed by URS in writing. Where such agreement is provided, URS will provide a letter of reliance to the agreed third party in the form required by URS.
To the extent permitted by law, URS expressly disclaims and excludes liability for any loss, damage, cost or expenses suffered by any third party relating to or resulting from the use of, or reliance on, any information contained in this Report. URS does not admit that any action, liability or claim may exist or be available to any third party.
Except as specifically stated in this section, URS does not authorise the use of this Report by any third party.
It is the responsibility of third parties to independently make inquiries or seek advice in relation to their particular requirements and proposed use of the site.
Any estimates of potential costs which have been provided are presented as estimates only as at the date of the Report. Any cost estimates that have been provided may therefore vary from actual costs at the time of expenditure.

G O V E R N M E N T O I L & G A S I N F R A S T R U C T U R E P O W E R I N D U S T R I A L
URS is a leading provider of engineering, construction, technical and environmental services for public agencies and private sector companies around the world. We offer a full range of program management; planning, design and engineering; systems engineering and technical assistance; construction and construction management; operations and maintenance; and decommissioning and closure services for power, infrastructure, industrial and commercial, and government projects and programs. © 2015 URS
URS Australia Pty Ltd Level 17, 240 Queen Street Brisbane, QLD 4000 GPO Box 302, QLD 4001 Australia T: +61 7 3243 2111 F: +61 7 3243 2199
www.urs.com.au

Brisbane ofÔceSantos PlaceLevel 2232 Turbot StreetBrisbane Queensland 4000


