32
SAP – The World’s Leading Business Software Company July 2015, Investor Presentation

SAP – The World’s Leading Business Software Company
July 2015, Investor Presentation
Vision & Strategy1

© 2015 SAP SE or an SAP affiliate company. All rights reserved. 3Customer
For 43 years, SAP has helped businesses at every major inflection point:
Globalization
SAP R/2: Helped customers successfully manage large global enterprises on a mainframe architecture, while retaining the integration and real-time processing capabilities of SAP R/1.
Data processing
SAP R/1: Enabled customers to get a complete view of their business with real-time processing of data across integrated modules for materials, procurement, and accounting.
Internet
SAP R/3 and SAP ECC: Enabled customers to take advantage of client-server and Internet technologies. Created a unified graphical user interface and new functional components.
1972 1982 1992 2015
Digital
SAP S/4HANA: Helps
customers get ahead of the
next inflection point –
the Digital Economy.
We are now focused on
eradicating complexity with
SAP S/4HANA.

© 2015 SAP SE or an SAP affiliate company. All rights reserved. 4Customer
Today, a new digital economy powered by real-time data is emerging, and SAP is guiding its customers through unprecedented change.
mobile devices
social media
big data
connected businesses
Cloud
Internet of Things
By 2020
44 trilliongigabytes of data generated
2.55 billionsocial media users
75 billionconnected devices in the
Internet of Things
$65 trillion in global trade through connected businesses
© 2015 SAP SE or an SAP affiliate company. All rights reserved. 5Customer
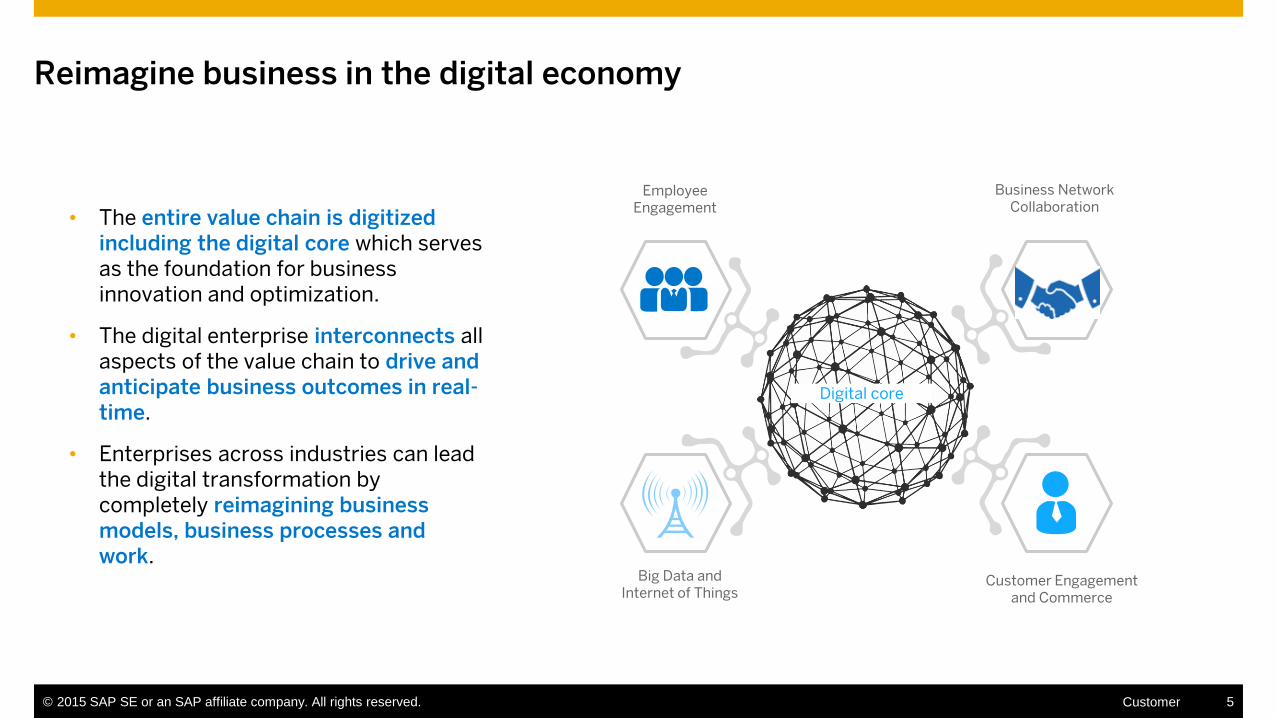
Reimagine business in the digital economy
• The entire value chain is digitized including the digital core which serves as the foundation for business innovation and optimization.
• The digital enterprise interconnects all aspects of the value chain to drive and anticipate business outcomes in real-time.
• Enterprises across industries can lead the digital transformation by completely reimagining business models, business processes and work.
Customer Engagementand Commerce
EmployeeEngagement
Big Data and Internet of Things
Business NetworkCollaboration
Digital core
© 2015 SAP SE or an SAP affiliate company. All rights reserved. 6Customer
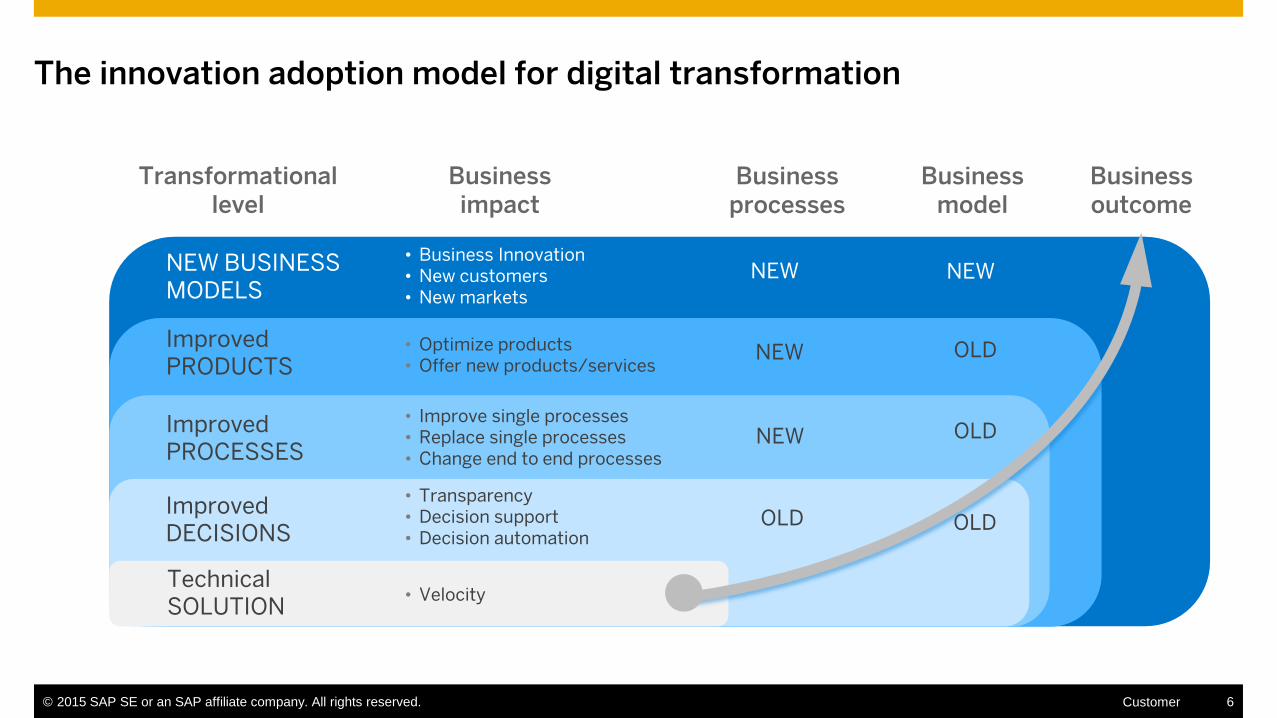
ImprovedDECISIONS
ImprovedPROCESSES
NEW BUSINESS MODELS
Technical SOLUTION
• Transparency• Decision support • Decision automation
• Optimize products• Offer new products/services
• Business Innovation• New customers• New markets
NEW
NEW
OLD
NEW
ImprovedPRODUCTS
NEW OLD
• Improve single processes• Replace single processes• Change end to end processes
• Velocity
Transformational level
Businessimpact
Businessoutcome
Businessprocesses
Businessmodel
OLD
OLD
The innovation adoption model for digital transformation

© 2015 SAP SE or an SAP affiliate company. All rights reserved. 7Customer
Infrastructure as a Service
Platform
Big Data(e.g. Hadoop, Spark)
HANAData Platform
(e.g., HANA DB, ASE)
Infrastructure Delivery
Integration (e.g., HANA Cloud
Integration,)
IoTLibraries (e.g., graph, predictive)
UX (e.g., Mobile/
Fiori)
Applications (examples) ISV & Partner
APPS
SAP Data Centers
Partner DCs Customer DCs
SAP HANA platform is:
• Real-time, In Memory
• Open, Developer Friendly
• Embeds Mobile and Analytics
• Secure
• Cloud Ready
Analytics (e.g.,, Lumira)
Security (e.g., SSO,
Identify)
Elastic Deployment
Open Programming Containers (e.g., Java, XS2)
NEW APPS EXTENSION INTEGRATION
HANA success:
>7,200SAP HANA customers (unique)
>900S/4HANA customers (released Q2/15)
>8,600trained partners
1,900Startups developing on HANA platformSince 2010, SAP tripled its addressable market: $350bn
SAP HANA architecture is revolutionary Speed and agility require a modern technology platform

© 2015 SAP SE or an SAP affiliate company. All rights reserved. 8Customer
SAP S/4HANA valueDigitize beyond the core, embrace the digital economy
Internet of Things
Business networks
Social networks
Devices
Big Data
People
Process EnrichedScalability I Real time I Prediction I Simulation
Live DataGranular I Responsive I Accurate
User EmpoweredInstant insight I Contextual information I Personalized experience
Segment of 1
Lot size of 1
No latency
Traditional core value play
SAP S/4HANA value play
At s
ca
le
Leading-edge processes I Integrated system
Digital transformation of business models
Digital CoreDigital Economy Digital Transformation

© 2015 SAP SE or an SAP affiliate company. All rights reserved. 9Customer
Run simple with the digital business foundation of the 21st century
Customer Engagementand Commerce
Employee Engagement
Business NetworkCollaboration
Big Data andInternet of Things
• Leverage the broadest business network for travel and entertainment, direct and indirect material, labor and services
• Leverage services from partners to vastly extend the value of core offerings
• Operate on a global basis, meet data security standards and operate at industry best standards
• Drive digitized mission-critical business processes across all operations
• Get instant business insight on one single source of live information on any device
• Predict and simulate to anticipate future business outcomes
• Orchestrate business processes across marketing, commerce, sales and service
• Deliver personalized experiences in context for each interaction
• Build a golden customer profile, with an enriched view of the customer from multiple data sources
• Recruit and on-board the best workforce, simplify their work, and ensure regulatory and compliance
• Manage the total workforce lifecycle from recruiting, on-boarding, performance, compensation and learning
• Enable the workforce to easily access the right information across any device
• Drive new business insight by capturing and analyzing real-time information on big data
• Embed device data across the value chain to create new business models
• Leverage an open innovation platform to quickly integrate, extend and build innovative apps (on-premise, in the cloud)
Digital Core
SAP HANA Cloud Platform

© 2015 SAP SE or an SAP affiliate company. All rights reserved. 10Customer
Marketing in real time to the Segment of ONE based on individual customer activities on all channels
Individualized advertise-ments, discounts, product configurations, product recommendations, etc.
Mass customization supported by real time
• fulfillment monitoring• processing of customer
change requests• responses to unplanned
downtimes• responses to changed
parts availability• etc.
Digitization of core processes is critical to scale upExample: Digital commerce – fulfillment example
Digital store is a typical MVP for fast market entry
Digitized core is needed for consistent customer experience
Digital store front Batch fulfillment
Digital shopper experience • Mobile commerce• In store navigation• Easy ordering• Personalized coupons• Curated experience
Limited number of variants
Weekly or daily planning, fulfillment and delivery tact
Low flexibility for order changes and responses to unplanned down time, supply problems, etc.
Lot size one
✓Auto-replenishment/
Subscription
Personalized
Coupons
Plan Your Trip to
the Store
Personalized
Communication
Easy
Ordering
from app Curated
Experience
In-Store
Navigation
Auto-replenishment/
Subscription
Personalized
Coupons
Plan Your Trip to
the Store
Personalized
Communication
Easy
Ordering
from app Curated
Experience
In-Store
Navigation
Digital store front
Minimum viable product End-to-end digitized

Shift to more subscription-based revenue2
© 2015 SAP SE or an SAP affiliate company. All rights reserved. 12Customer
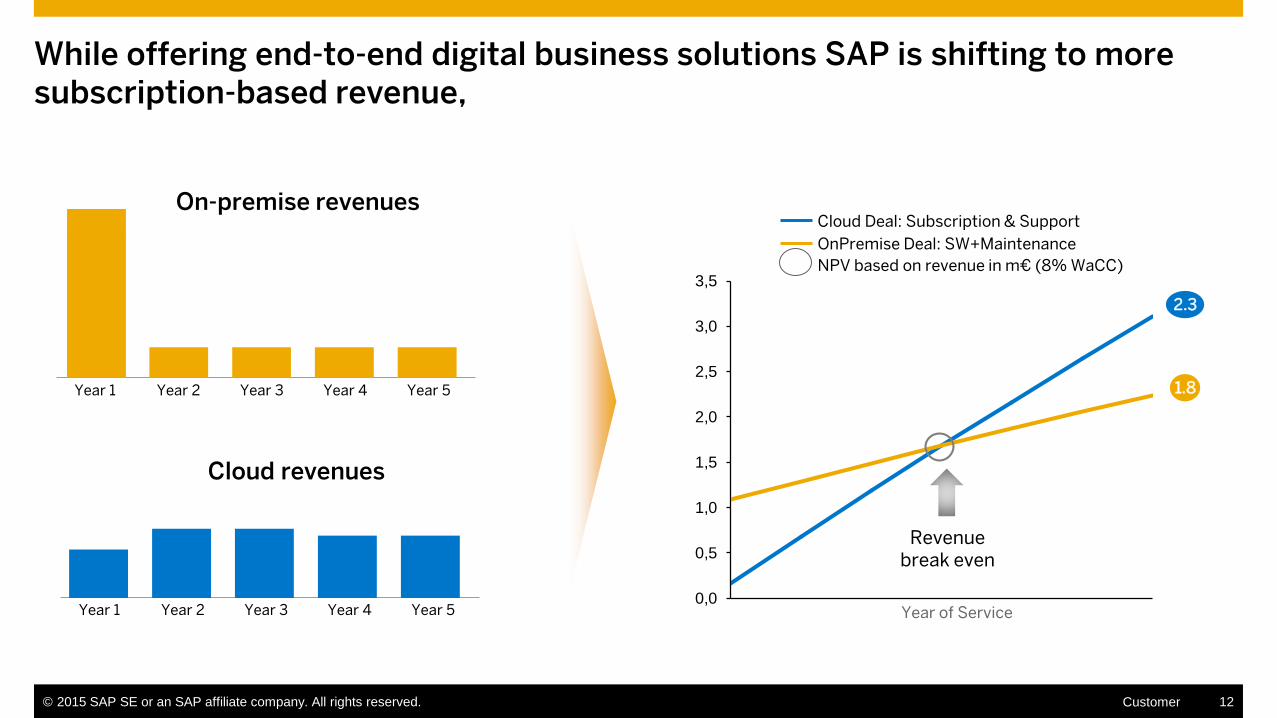
While offering end-to-end digital business solutions SAP is shifting to more subscription-based revenue,
OnPremise Deal: SW+Maintenance
Cloud Deal: Subscription & Support
0,0
0,5
1,0
1,5
2,0
2,5
3,0
3,5
Year of Service
2.3
1.8
NPV based on revenue in m€ (8% WaCC)
Revenue break even
On-premise revenues
Cloud revenues
Year 1 Year 2 Year 3 Year 4 Year 5
Year 1 Year 2 Year 3 Year 4 Year 5

© 2015 SAP SE or an SAP affiliate company. All rights reserved. 13Customer
Public Cloud
Classical subscription SaaS model for cloud applications
Most comparable cloud offering to pure cloud vendors
Mostly 3 years contracts
Massively scaling while continuing to improve efficiency
Primarily annual pre-billing which results in deferred revenue
Private Cloud
Start-up business supporting large customers’ transition to HANA and Cloud (significant cross selling potential)
Mission critical processes
High set-up costs and significant ramp up weighs on margins short term – while scaling & leveraging partnerships in future
Pre-billing with short (monthly) billing terms, consequently lower deferred revenues
Business Network
The world’s largest network of its kind, with Ariba, Concur, and Fieldglass
Steady predictable revenue stream with a very high stickiness
Primarily ‘Pay-as-you-go’ model with contractual commitments
Stable revenue growth rates
321
with a broad Cloud offering with three different business models.

© 2015 SAP SE or an SAP affiliate company. All rights reserved. 14Customer
SAP will have a much larger cloud business in 2020 relative to the core business – change in revenue mix weighs on blended operating margin for the group in short/medium term
6%
94%
€17.5 bn
2014
Cloud subscription and support revenue
All other revenue
71%
29%
€26-28 bn
2020ambition
+22pp
Total revenue mix
A fast growing Cloud business changes SAP’s revenue mix,

© 2015 SAP SE or an SAP affiliate company. All rights reserved. 15Customer
Software license revenue
• Driven by innovations – next generation Business Suite S/4HANA, Customer Engagement Commerce and strategic industries
• Dependent on macroeconomic environment, in particular in emerging markets
• SAP outlook implies moderate decline in software revenue due to secular shift to cloud and assumption of unchanged market conditions
Support revenue• High renewal rates of ~97-98%
• Enterprise support is today our de facto standard with an acceptance rate of net new customers of 99% in Q4/14
Cloud revenue• Cloud profitability ramps as share of new
bookings reduces over time
2014
New & upsell cloud bookings
Existing bookings (incl. renewals)
Maturestate
~40%
~60% ~80%
~20%
together with solid license revenue and growing support revenue.

© 2015 SAP SE or an SAP affiliate company. All rights reserved. 16Customer
SAP plans for fast cloud growth, as well as growing predictable revenue and operating profit.
€3.5 to €3.6bn Cloud subscription
€21 to €22bn Total revenue
65% to 70% Support + Cloud
subscription(share of revenue)
€6.3 to €7bn Operating profit
€7.5 to €8bn Cloud subscription
€26 to €28bn Total revenue
70% to 75% Support + Cloud
subscription(share of revenue)
€8 to €9bnOperating profit
ambition
2020ambition Fast growing Cloud business
Growing cloud business 7X (2014–2020), reflecting organic growth rates unmatched for a company of our scale
Adding close to €10bn total revenue by 2020
Cloud subscription and support expected to overtake software licenses in 2018. At that time SAP expects to reach a scale in its cloud business that will clear the way for accelerated operating profit expansion.
Solid core business with resilient support revenue stream
Mid-term Ambition
€1.95bn to €2.05bn @ccCloud subscription
8% to 10% @cc Cloud & software growth
€5.6 to €5.9bn @cc Operating profit
2015guidance

Financial Performance & Outlook3

© 2015 SAP SE or an SAP affiliate company. All rights reserved. 18Customer
Key performance metrics Q2/15 – Strong start in 2015
* At constant currencies
Operating Profit (€ bn)IFRS Non-IFRS
Cloud Subscriptions and Support Revenue (€ bn)IFRS Non-IFRS
+129%(+92%*)
Software Licenses and Support Revenue (€ bn)IFRS Non-IFRS
+129%0.550.24
Cloud and Software Revenue (€ bn)IFRS Non-IFRS
Q2/14 Q2/15
0.550.24
Q2/14 Q2/15
3.513.12
Q2/14 Q2/15
3.513.12
Q2/14 Q2/15
+13%+13%(+3%*)
+21%(+9%*)+21%4.06
3.36
Q2/14 Q2/15
4.06
3.36
Q2/14 Q2/15
+13%(+1%*)
+1%0.70
Q2/14 Q2/15
1.391.24
Q2/14 Q2/15
0.70

© 2015 SAP SE or an SAP affiliate company. All rights reserved. 19Customer
Transitioning to the cloud
Non-IFRS cloud subscriptions and support revenue: +129% yoy to 555m (+92% at cc)1)
New cloud bookings – key measure for SAP’s sales success in the cloud: +162% to €203m2)
Cloud subscriptions and support backlog3): €2.3bn as of Dec 31, 2014, +94% yoy
Cloud applications total subscribers: ~82 million
SAP Business Network:
– the world’s largest network of its kind
– brings together Ariba, Concur and Fieldglass into one operating unit which is reported as a separate business
segment
– total segment revenue was €400m (€333m at cc) in Q2, yoy +194% (+145% at cc)
– ~1.9m connected companies trade >$800bn of commerce4) on this network.
1) For Q2/15, Fieldglass contributed €21 million and Concur contributed €137 million to SAP’s Non-IFRS cloud subscriptions and support revenue at constant currencies. Fieldglass closed on May 2, 2014. 2) New cloud bookings consist of all order entry of a given period that is expected to be classified as cloud subscription and support revenue and results from purchases by new customers and from
incremental purchases by existing customers. The order amount must be contractually committed (i.e. variable amounts from pay-per-use and similar arrangements are not included). Consequently, due to their uncommitted pay-per-use nature Ariba and Fieldglass network transaction fees are not reflected in the new cloud bookings metric. Amounts included in the measure are annualized. Concur contributed €46 million to SAP’s new cloud bookings in the second quarter.
3) Cloud subscription and support backlog represents expected future cloud subscriptions&support revenue that is contracted but not yet invoiced and thus not recorded in deferred revenue.4) Network spend volume is the total value of purchase orders transacted on the Ariba, Concur and Fieldglass Networks in the trailing 12 months.

© 2015 SAP SE or an SAP affiliate company. All rights reserved. 20Customer
€ millions, unless otherwise stated
Revenue Numbers Q2/15 Q2/14 ∆% Q2/15 Q2/14 ∆% ∆% at cc
Cloud subscriptions and support 552 241 129 555 242 129 92
Software licenses 979 957 2 979 957 2 -7
Software support 2,531 2,158 17 2,531 2,160 17 7
Software licenses and support 3,510 3,116 13 3,510 3,117 13 3
Cloud and software 4,062 3,357 21 4,065 3,359 21 9
Services revenue 908 794 14 908 794 14 3
Total revenue 4,970 4,151 20 4,972 4,153 20 8
Operating Expense Numbers
Total operating expenses -4,269 -3,453 24 -3,578 -2,917 23 11
Profit Numbers
Operating profit 701 698 1 1,394 1,236 13 1
Finance income, net -11 17 <-100 -11 17 <-100
Profit before tax 637 719 -11 1,330 1,257 6
Income tax expense -168 -163 3 -369 -319 16
Profit after tax 469 556 -16 960 938 2
Operating margin in % 14.1 16.8 -2,7pp 28.0 29.8 -1,7pp -2,0pp
Basic earnings per share, in € 0.39 0.47 -16 0.8 0.79 2
IFRS Non-IFRS
SAP is able to drive the combination of fast cloud topline growth and expanding profit at the same time
© 2015 SAP SE or an SAP affiliate company. All rights reserved. 21Customer
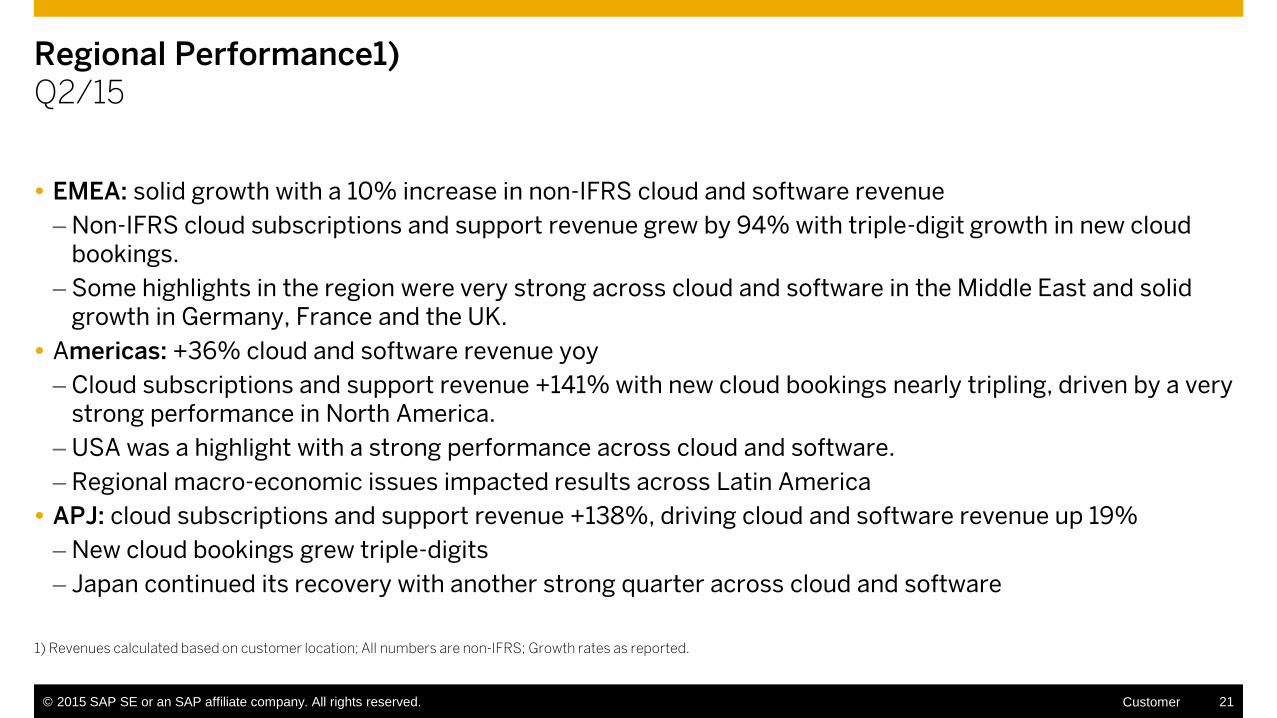
Regional Performance1) Q2/15
EMEA: solid growth with a 10% increase in non-IFRS cloud and software revenue
– Non-IFRS cloud subscriptions and support revenue grew by 94% with triple-digit growth in new cloud bookings.
– Some highlights in the region were very strong across cloud and software in the Middle East and solid growth in Germany, France and the UK.
Americas: +36% cloud and software revenue yoy
– Cloud subscriptions and support revenue +141% with new cloud bookings nearly tripling, driven by a very strong performance in North America.
– USA was a highlight with a strong performance across cloud and software.
– Regional macro-economic issues impacted results across Latin America
APJ: cloud subscriptions and support revenue +138%, driving cloud and software revenue up 19%
– New cloud bookings grew triple-digits
– Japan continued its recovery with another strong quarter across cloud and software
1) Revenues calculated based on customer location; All numbers are non-IFRS; Growth rates as reported.

© 2015 SAP SE or an SAP affiliate company. All rights reserved. 22Customer
Gross margin declined by 130 bps Q2/15
Gross Margin70.6% | -1,3pp
Cloud and Software Margin 83.4% | -0,6pp
Services-related Margin13.0% | -7,3pp
Non-IFRS
* Cloud & Software revenues / expenses
Total revenue
€4.2bn
Q2/14
C&SW* + servicesexpenses
€1.2bn
Total revenue
€5.0bn
Q2/15
C&SW* + servicesexpenses
€1.5bn
C&SW* revenue
€3.4bn
Q2/14
C&SW* + expenses
€0.5bn
C&SW* revenue
€4.1bn
Q2/15
C&SW* + expenses
€0.7bn
Servicesrevenue
€0.8bn
Q2/14
Servicesexpenses
€0.6bn
Servicesrevenue
€0.9bn
Q2/15
Servicesexpenses
€0.8bn
© 2015 SAP SE or an SAP affiliate company. All rights reserved. 23Customer
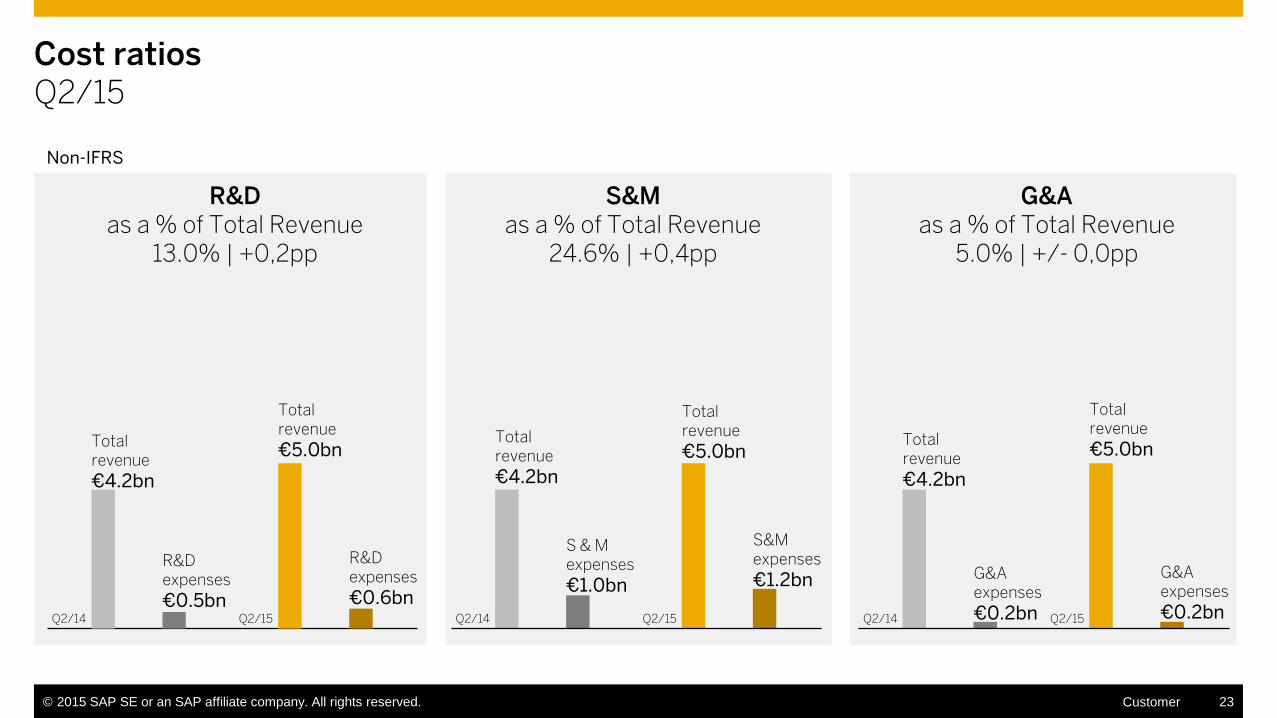
Cost ratiosQ2/15
Non-IFRS
Total revenue
€4.2bn
Q2/14
R&Dexpenses
€0.5bn
Total revenue
€5.0bn
Q2/15
R&Dexpenses
€0.6bn
Totalrevenue
€4.2bn
Q2/14
S & Mexpenses
€1.0bn
Totalrevenue
€5.0bn
Q2/15
S&Mexpenses
€1.2bn
Totalrevenue
€4.2bn
Q2/14
G&Aexpenses
€0.2bn
Totalrevenue
€5.0bn
Q2/15
G&Aexpenses
€0.2bn
R&D as a % of Total Revenue
13.0% | +0,2pp
S&M as a % of Total Revenue
24.6% | +0,4pp
G&A as a % of Total Revenue
5.0% | +/- 0,0pp

© 2015 SAP SE or an SAP affiliate company. All rights reserved. 24Customer
Operating cash flow increased by 8% to €2.8bn
€ millions, unless otherwise stated01/01/15
- 06/30/1501/01/14
- 06/30/14 ∆
Operating cash flow 2,775 2,575 +8%
- Capital expenditure -276 -304 -9%
Free cash flow 2,500 2,271 +10%
Free cash flow as a percentage of total revenue 26% 29% -3pp
Cash conversion rate 3.15 2.36 +33%
Days sales outstanding (DSO in days) 68 64 +4

© 2015 SAP SE or an SAP affiliate company. All rights reserved. 25Customer
Total group liquidity improved by more than €750m while reducing group debt by more than €650m
€ millions
1) Cash and cash equivalents + current investments2) Includes positive effect resulting from cash receipts from derivate financial instruments related to business combinations of EUR 266m 3) Group Net Liquidity defined as Total Group Liquidity minus Group debt– for more details see second quarter 2015 Interim Report
Total group netliquidity3)
06/30/15
-6,251
Other+70
Operating cash flow
Net change
debt-775Total
groupliquidity1)
12/31/14
+3,423
Total group
liquidity1)
06/30/15
+2,775Group debt
Capitalexpenditure
-276
+4,180 -10,432
Businesscombi-
nations2)
+256 Dividend-1,316
Net proceeds from treasury
shares+24

© 2015 SAP SE or an SAP affiliate company. All rights reserved. 26Customer
Outlook for the full-year 2015
Cloud and Software Revenue(Non-IFRS at cc)
Basis for Comparison 2014
Operating Profit (Non-IFRS at cc) €5.64bn
€14.33bn
Cloud subscription and support revenue (Non-IFRS at cc)
€1.10bn
* The upper end of this range represents a growth rate of 86% at constant currencies. Concur and Fieldglass are expected to contribute approximately 50 percentage points to this growth.
+ 10%
€2.15bn
€896m(+93%)
+ 8% to 10%
SAP’s Outlook FY 2015
€5.6bn to €5.9bn
€1.95bn to €2.05bn(upper end +86%*)
If exchange rates stay at the June 2015 average level for the rest of the year, the Company would expect approximately a positive 5 to 8pp
currency benefit on cloud and software growth and a positive 5 to 8pp currency benefit on operating profit growth for the third quarter of 2015 and a
positive 6 to 9pp and a 7 to 10pp respectively for the full-year 2015.
The above mentioned indication for the expected currency exchange rate impact on actual currency reported figures replaces the earlier indication disclosed in SAP’s Earnings announcement on April 21, 2015.
Actual Performance
H1/15

© 2015 SAP SE or an SAP affiliate company. All rights reserved. 27Customer
Additional outlook information and non-IFRS adjustments
IFRS Profit Measure
Revenue adjustments
TomorrowNow and Versata Litigation
Share-based payment expenses
Acquisition-related charges
Restructuring charges
Sum of all adjustments
Est. Amounts for FY/2015
<€20m
€0m
€610m to €650m
€730m to €780m
€470m to €530m
€1,830m to €1,980m
€8m
€0m
€314m
€371m
€418m
€1,112m
Actual AmountsH1/2015
€5m
€290m
€124m
€261m
€54m
€735m
Actual AmountsH1/2014
The company continues to expect a full-year 2015 effective tax rate (IFRS) between 25.0% to 26.0% (2014: 24.7%) and an effective tax rate (non-IFRS) between 26.5% to 27.5% (2014: 26.1%).

Appendix3

© 2015 SAP SE or an SAP affiliate company. All rights reserved. 29Customer
Balance sheet, condensedJune 30, 2015, IFRS
Assets€ millions
06/30/15 12/31/14
Cash, cash equivalents and other financial assets
4,304 4,006
Trade and other receivables 4,521 4,342
Other non-financial assets and tax assets
886 650
Total current assets 9,710 8,999
Goodwill 22,157 20,866
Intangible assets 4,557 4,604
Property, plant, and equipment 2,145 2,102
Other non-current assets 2,374 1,747
Total non-current assets 31,233 29,319
Total assets 40,944 38,318
Equity and liabilities€ millions
06/30/15 12/31/14
Trade and other payables 989 1,035
Deferred income 4,196 1,680
Provisions 494 150
Other liabilities 4,091 5,710
Current liabilities 9,769 8,575
Financial liabilities 9,097 8,980
Provisions 154 151
Deferred income 63 78
Other non-current liabilities 1,058 1,001
Non current liabilities 10,373 10,210
Total liabilities 20,142 18,785
Total equity 20,802 19,533
Equity and liabilities 40,944 38,318

© 2015 SAP SE or an SAP affiliate company. All rights reserved. 30Customer
How to look at Cloud subscription dealsKey measures of success (simplified business example)
New and Upsell Bookings (ACV)
Period KPI
Order Entry measure
Logic: Average Contract Value per
year
Decisive factor: Customer
signature
14
Q1 Y4Q4
5
4
Q3Q2Q1 Y3Q4Q3Q2Q1 Y2Q4Q3Q2Q1 Y131.12.
Renewal
Upsell
New
111111111111
Q1 Y4
1
Q4Q3Q2Q1 Y3Q4Q3Q2Q1 Y2Q4Q3Q2Q1 Y131.12.
Renewal
Upsell
NewRevenue Recognition:
Period KPI
Steadily over the course of the contract
term / delivery
Backlog (unbilled):
Point in time KPI
Firm future revenue
Decisive factors
signed contract
Invoicing
000
3
4444
8888
12
Q1 Y4
10
8
2
Q4
15
12
Q3Q2Q1 Y3Q4Q3Q2Q1 Y2Q4Q3Q2Q1 Y131.12.
Renewal
Upsell
New
1444
Q1 Y4
5
4
Q4Q3Q2Q1 Y3Q4Q3Q2Q1 Y2Q4Q3Q2Q1 Y131.12.
Renewal
Upsell
NewInvoicing (Billings):
Point in time KPI
Invoicing usually once per year upfront
1
2
3
1
2
3
1
2
3
3
Q1 Y4Q3 Q4Q2Q1 Y3Q4Q3Q2Q1 Y2Q4Q3Q2Q1 Y131.12.
Renewal
Upsell
New
Deferred Revenue:
Period KPI
Revenue recognition needs to be in line
with delivery (IFRS); too early invoiced
part of the deal needs to be parked in
B/S
0,75
3,75
0,25
1,25
Initial term Renewal term
Renewal
signature
Order
EntryRenewal Rate:
100%Main Cloud
performance indicator

© 2015 SAP SE or an SAP affiliate company. All rights reserved. 31Customer
Safe Harbor Statement and contacts
Stefan GruberHead of Investor RelationsPhone: +49 6227 7-44872
Johannes BuerkleRetail Investors, EuropePhone: +49 6227 7-70157
John DuncanInstitutional Investors and AnalystsPhone: +1 212 653 1413
James DymondSocially Responsible Investing (SRI)Phone: +49 6227 7-61823
Scott SmithInstitutional Investors and AnalystsPhone: +1 650 461 2905
Astrid StroemerInstitutional Investors and AnalystsPhone: +49 6227 7-52167
Any statements contained in this document that are not historical facts are forward-looking statements as defined in the U.S. Private Securities Litigation Reform Act of 1995. Words such as “anticipate,” “believe,” “estimate,” “expect,” “forecast,” “intend,” “may,” “plan,” “project,” “predict,” “should” and “will” and similar expressions as they relate to SAP are intended to identify such forward-looking statements. SAP undertakes no obligation to publicly update or revise any forward-looking statements. All forward-looking statements are subject to various risks and uncertainties that could cause actual results to differ materially from expectations. The factors that could affect SAP’s future financial results are discussed more fully in SAP’s filings with the U.S. Securities and Exchange Commission (“SEC”), including SAP’s most recent Annual Report on Form 20-F filed with the Securities and Exchange Commission. Readers are cautioned not to place undue reliance on these forward-looking statements, which speak only as of their dates.
SAP SE Investor RelationsDietmar-Hopp-Allee 1669190 WalldorfGermany
Investor Hotline: +49 6227 7-67336Telefax: +49 6227 7-40805E-Mail: [email protected]: www.sap.com/investorTwitter: @SAPinvestor

Run Simple
© 2015 SAP SE Investor Relations. All rights reserved.The Best-Run Businesses Run SAP®


