150
Product Costing
| Date post: | 28-Oct-2014 |
| Category: |
Documents |
| Upload: | ramamurali |
| View: | 3,702 times |
| Download: | 415 times |
Product Costing

Product Costing Overview
Acquire an overall perspective of Product Cost Planning within R/3.
Observe a product life cycle from the perspective of Product Cost Planning.
Acquire an overall perspective of product cost object controlling within R/3.
Understand the period oriented product cost controlling.
Obtain an understanding of the functions in the material ledger.
Analysis of product costs.

Material Ledger Overview
Obtain an understanding of the actual costing function in the material ledger.
Know how to revaluate inventories of semi finished products, and finished products with calculated actual costs or accrue variances.
Analysis of actual product costs.

SAP Modules - Overview
Sales &Distribution
SD
MM
PP
QM
PM
HR
FI
CO
AM
PS
OC
IS
MaterialsMgmt.
ProductPlanning
QualityMgmt.
Plant Maint.
HumanResources
FinancialAccounting
Controlling
Fixed AssetMgmt.
ProjectSystem
Office &Comm.
IndustrySolutions
SAP R/3

Profitability AnalysisProfitability Analysis
Pro
fit Cen
ter Acco
un
ting
HumanResources
Financial Accounting
FI
S&DSales andMaterials
ManagementMaterials
Management
COCOPAPA
COCOOMOM
ECEC -PCAPCA
Distribution
CO Components
Cost Element AccountingCOCOCELCEL
HR MM SD
Financial Accounting
Cost Element Accounting
Cost centers Internalorders
Profitabilitysegment
Asset RevenuesExpense
Activitytypes
Internal Orders
Company Code (9100 A Ltd)
Operating concern (9100 – A Ltd)
Overhead Cost Controlling Product CostControlling
StandardCost Estimate
CO ProductionOrder
Controlling area (9100 – A Ltd)

Why utilize Product Costing?
•Product Costing is the backbone of a strong standard cost system. This is the process by which production activities are recorded at standard values and variances from actual costs are isolated.
•For planning purposes, the corporation wants a preliminary target of what they think it will cost to produce X units of a product.
•To set attainable standards by which efficiencies within the production operations can be measured.
•To provide feedback to management on the actual performance of the production process in relation to those targets. Identified variances may indicate inefficiencies that have to be investigated. Corrective action may have to be taken.

Product Costing
Improve and ControlOperations
Disposition &Contain Product
PrepareProduction
Plan & CommitResources
MakeProduct
Manage Process and
Product Documentation
OPTIMIZED& FIRM
SCHEDULE
Process ends with initial containment (packout)
Optimized Production Operations

Costing Methodology
Material MasterMaterial Master Price ControlPrice Control
Standard Price(S-Price)
- Constant- Recommended for all material types
Moving average price(V- Price)
- Adjusted with every receipt- If at all, only to be used for raw materials and materials procured externally

Costing Methodology
The method of valuing inventory of a material is determined when extending/creating the material master.
The method of valuing inventory of a material is determined when extending/creating the material master.
Price that changes in consequence of usage and entry of invoices. Calculated by dividing the value of material by the quantity in stock. Automatically recalculated based on activity.
Constant price without considering usage or invoices. Material stock valued at the same price over an extended period. Price variances are posted to price difference accounts; not affecting the standard price.

Posting Example: Moving average price 1
StockStock GR/IR AccountGR/IR Account
VendorVendor
Procedure Stock Stock value V price
Begin. inventory: 100 PC at 2.00 100 200.- 2.00
Goods receipt: 100 PC at 3.00 200 500.- 2.50
Invoice receipt: 100 PC at 4.00 200 600.- 3.00
Goods issue: 150 PC at 3.00 50 150.- 3.00
Procedure Stock Stock value V price
Begin. inventory: 100 PC at 2.00 100 200.- 2.00
Goods receipt: 100 PC at 3.00 200 500.- 2.50
Invoice receipt: 100 PC at 4.00 200 600.- 3.00
Goods issue: 150 PC at 3.00 50 150.- 3.00
11
22
33
300,-300,- 22
400,-400,-
300,-300,-
44
3311 200,-
300,-
100,-
200,-
300,-
100,-
22
44
33
450,-450,-
ConsumptionConsumption
450,-450,-44
If the invoice receipt is for 100 units, the stock
coverageis 200 units:
all differences stock
If the invoice receipt is for 100 units, the stock
coverageis 200 units:
all differences stock
33
Stock Coverage
ok
Stock

With a delayed invoice receiptOf 100 units:
a shortage of 50 units price differences despite MAP
With a delayed invoice receiptOf 100 units:
a shortage of 50 units price differences despite MAP
Posting Example: Moving average price 2
StockStock
Price differencePrice difference
GR/IR accountGR/IR account
VendorVendor
Procedure Stock Stock Value V Price
Begin. inventory: 100 200.- 2.00
Goods receipt: 100 PC at 3.00 200 500.- 2.50
Goods issue: 150 PC at 2.50 50 125.- 2.50
Invoice receipt: 100 PC at 4.00 50 175.- 3.50
Procedure Stock Stock Value V Price
Begin. inventory: 100 200.- 2.00
Goods receipt: 100 PC at 3.00 200 500.- 2.50
Goods issue: 150 PC at 2.50 50 125.- 2.50
Invoice receipt: 100 PC at 4.00 50 175.- 3.50
11
22
33
11 200.-
300.-
50.-
200.-
300.-
50.-
22300.-300.- 22
50.- 50.-
44
44400.-400.-
300.-300.-
44
ConsumptionConsumption
375.-375.-33
33 375.-375.-
44
44
Stock Shortage

Posting Example: Moving average price 3
Procedure Stock Stock Value V Price
Begin. inventory: 100 200.- 2.00
Goods receipt: 100 PC at 2.20 200 420.- 2.10
Goods receipt: 100 PC at 2.40 300 660.- 2.20
Goods issue: 200 PC at 2.20 100 220.- 2.20
Invoice receipt: 100 PC at 3.00 100 300.- 3.00
Invoice receipt: 100 PC at 3.00 100 360.- 3.60
Procedure Stock Stock Value V Price
Begin. inventory: 100 200.- 2.00
Goods receipt: 100 PC at 2.20 200 420.- 2.10
Goods receipt: 100 PC at 2.40 300 660.- 2.20
Goods issue: 200 PC at 2.20 100 220.- 2.20
Invoice receipt: 100 PC at 3.00 100 300.- 3.00
Invoice receipt: 100 PC at 3.00 100 360.- 3.60
With multiple delayed invoice receipts: Danger of Incorrect Valuation!
With multiple delayed invoice receipts: Danger of Incorrect Valuation!
Even though all receipts between 2.- and 3.- were
valuated!
Even though all receipts between 2.- and 3.- were
valuated!
Δ 80.- in stockΔ 80.-
in stock
Δ 60.- in stockΔ 60.-
in stock
Stock Coverage

Characteristics of Price Control V
+ The stock value is adjusted each time goods are received
+ Real-time price fluctations are posted to stock
+ Price difference postings only take place in exceptional cases
- Price fluctuations cannot be adjusted to the finished products of higher levels (S price)
- Only recommended for raw materials or goods procured externally (real-time price for goods receipt known)
- False entries with severe consequences (compounded errors)
- Danger of incorrect valuations with delayed invoice receipt
Moving average price

Posting Example: Standard Price
StockStock
Price differencePrice difference
GR/IR accountGR/IR account
VendorVendor
Procedure Stock Stock Value Standard Price
Initial situation: 100 200.- 2.00
Goods receipt: 100 at 2.40 200 400.- 2.00
Invoice receipt: 100 at 2.20200 400.- 2.00
Procedure Stock Stock Value Standard Price
Initial situation: 100 200.- 2.00
Goods receipt: 100 at 2.40 200 400.- 2.00
Invoice receipt: 100 at 2.20200 400.- 2.00
11
22
33
11 200.-
200.-
200.-
200.-22240.-240.- 22
22 40.-40.-
33
333320.-20.-
220.-220.-
240.-240.-

Characteristics of Price Control S
+ All stock postings take place at the standard price
+ Prices remain constant throughout at least one period
+ Price fluctuations do not debit/credit the cost objects (e.g. orders)
consistant controlling with the standard price as a bench mark
+ Calculation of the standard prices with cost component splits
+ Recommended for all material types
- Price differences cannot be subsequently adjusted to the ending
inventories or the consumed products (sales, production
withdrawals)
Standard Price
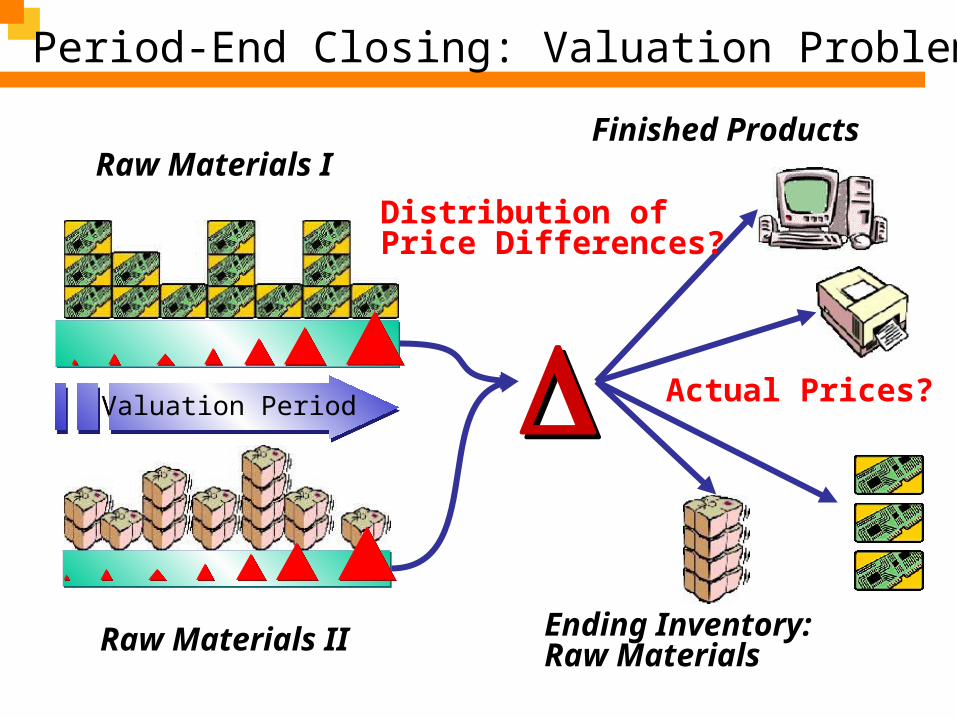
Period-End Closing: Valuation Problems
Valuation PeriodValuation Period
Distribution of Price Differences?
Actual Prices?
Finished Products
Ending Inventory: Raw MaterialsRaw Materials II
Raw Materials I
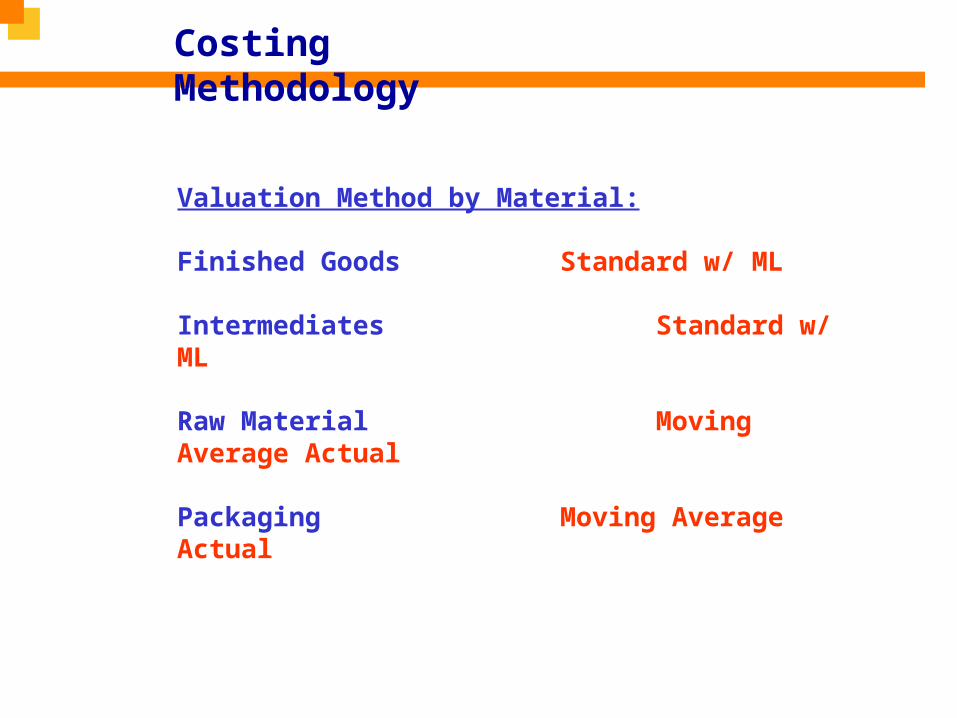
Costing Methodology
Valuation Method by Material:
Finished Goods Standard w/ ML
Intermediates Standard w/ ML
Raw Material Moving Average Actual
Packaging Moving Average Actual

Organizational unit dividing up a company for the purpose of valuating stocks in a standardized and consistent manner.
• Level at which material value is managed.
• The valuation area may is defined:- by plant
Valuation Area

Cost
Object
CostCenter X
CostCenter 1
CostCenter2
F. Goods Inventory
BOM
Routing
Productionorders
CO-CCA
CO-PA
CO-PC
MAT Manufacturing Cost MM: RM
Act1Act1
CostCenter Y
CostCenter 3
ProductionCost Center
VAR.
VAR...
VAR...
Act2Act2
Product Cost Flow

Product Cost Flow
Plant Cost View Sales & Mktg. View
Mfg. Cost Center
(Activity Types)
UtilitiesSalariesSuppliesMaintenanceDepreciationTraining Direct ConversionInsur. & TaxesLaboratory/QC Waste TreatmentShops & StoresGeneral Services Indirect ConversionTotal Product Cost
Mach. Hrs. orlbs.ProducedLab testsSetup Hrs.
P A(Profitability Analysis)
Raw Mat’l 1 & 2 Costs Pkg. Mat’l Costs
Costs to ProduceProduct testing costsChange Over costs (setup costs)
Routing
Product Unit Cost
Cost of Goods Mfg. Raw Mat’l 1 Costs Raw Mat’l 2 Costs Pkg. Mat’l Costs
Routing Mach. Hr. Costs Lab Tests Costs Mach. Setup Costs
Process Order
Raw Mat’l 1Raw Mat’l 2Pkg Mat’l
BOM(Cost Component View) (SAP Value Fields)
Three Views Available: 1. Cost Component 2. Cost Element 3. Cost Itemization
Cost of Goods Sold
Fixed & Variable Cost Fixed & Variable Cost

Product Costing A Ltd.
Product Cost Planning
Yes
Execute costingrun
AutomaticRelease
ofStandard Price
Mark StandardCost Estimate
Activitytype
planningcompleted
Quantitystructure
in PPcreated
Overheadcost
planningcompleted
Plan pricesof raw
materialswere
entered
StandardCost
Calculated
Review forApproval
Adjust costingmaster data/parameters
Standardprice hase
beenreleased
OK
Not OK
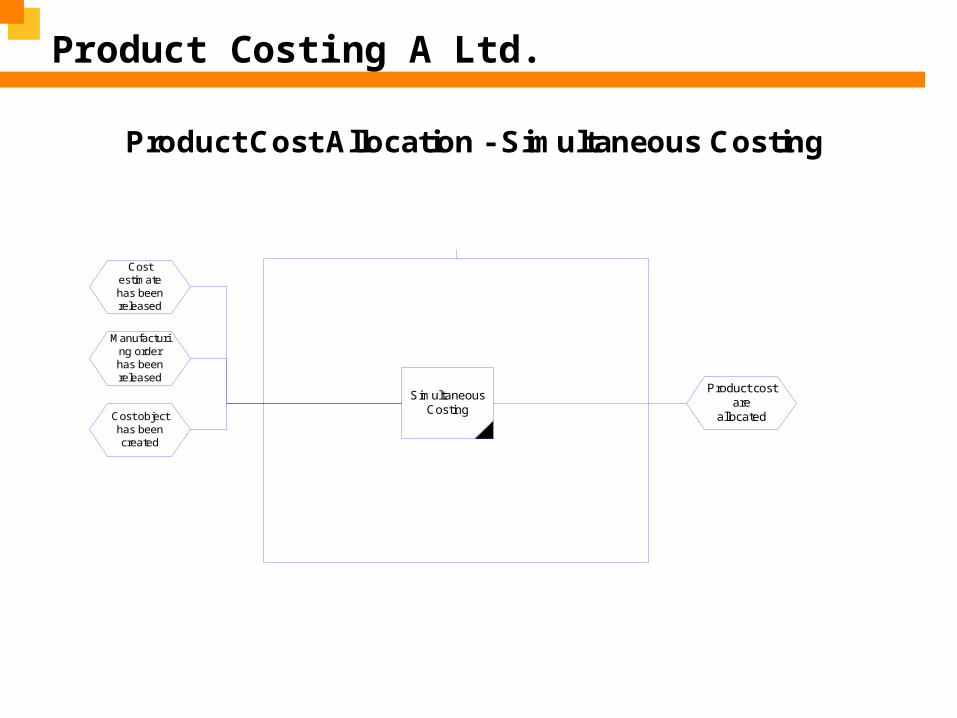
Product Costing A Ltd.
Product Cost Allocation - Simultaneous Costing
Yes
SimultaneousCosting
Costestimatehas beenreleased
Manufacturing orderhas beenreleased
Cost objecthas beencreated
Product costare
allocated

Product Costing A Ltd.
Period End Closing Product Costing
Yes
Revaluationactivity types at
actual prices
Productcost areallocated
PE ProductCosting hasbeen done
Calculation ofWIP
PeriodicVaraiancecalculation
Settle costobject
Product Costing A Ltd.
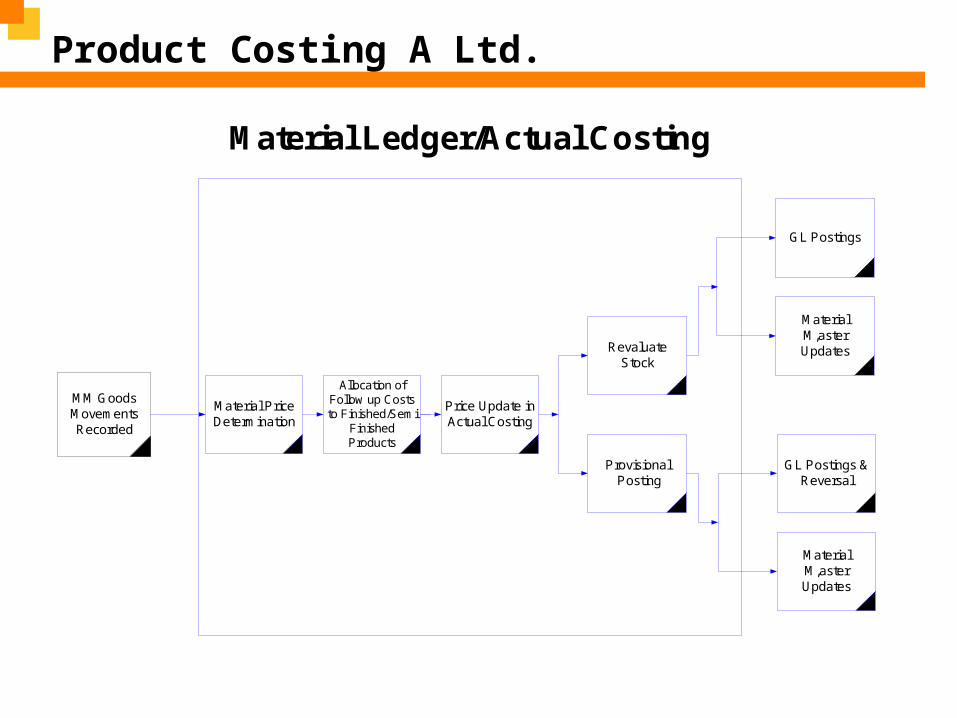
Material Ledger/Actual Costing
Allocation ofFollow up Coststo Finished/Semi
FinishedProducts
Price Update inActual Costing
Material PriceDetermination
GL Postings
MM GoodsMovementsRecorded
MaterialM,asterUpdates
GL Postings &Reversal
MaterialM,asterUpdates
RevaluateStock
Provisional Posting
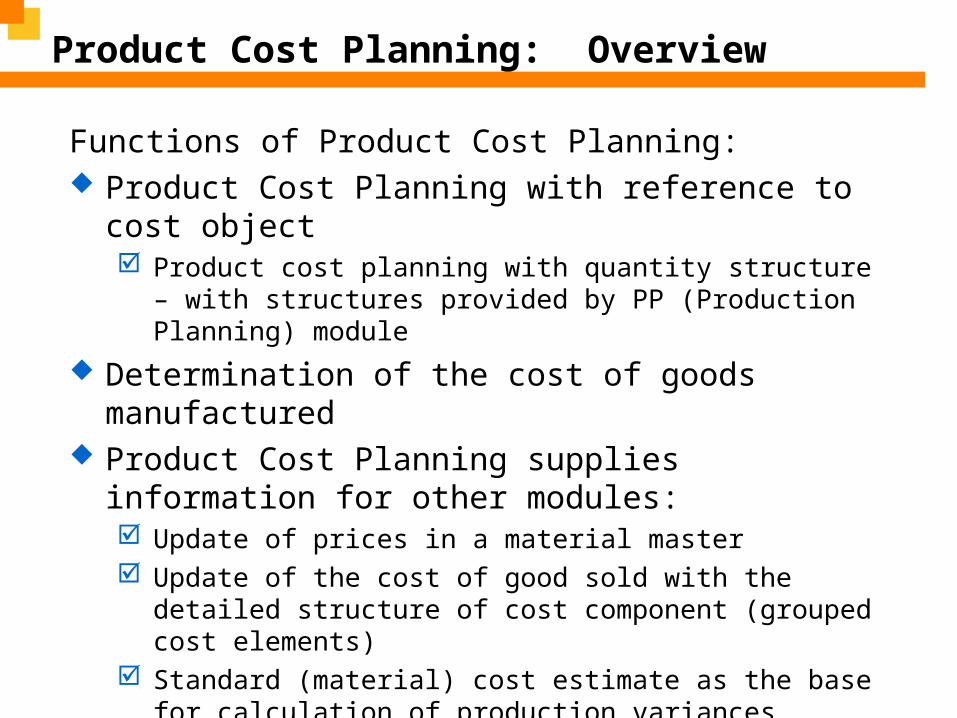
Product Cost Planning: Overview
Functions of Product Cost Planning: Product Cost Planning with reference to cost object
Product cost planning with quantity structure – with structures provided by PP (Production Planning) module
Determination of the cost of goods manufactured Product Cost Planning supplies information for other
modules: Update of prices in a material master Update of the cost of good sold with the detailed structure of
cost component (grouped cost elements) Standard (material) cost estimate as the base for calculation
of production variances

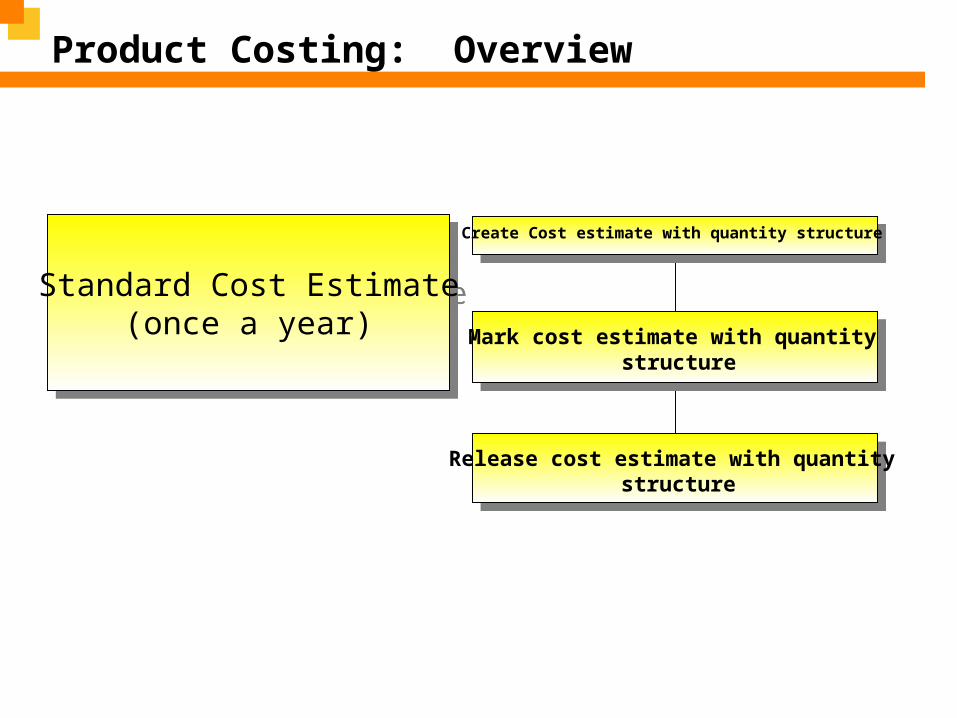
Product Costing: Overview
Standard Cost Estimate(once a year)
Standard Cost Estimate(once a year)
Prepare Product Cost Collector
Prepare Product Cost Collector
Production CostsProduction Costs
Receive Finished StocksReceive Finished Stocks
Month End ClosingMonth End Closing
Post Materials Costs
Debit Secondary cost
Credit Production Output
WIP Calculation
Variance Calculation
Settlement
Preliminary Costing
Create Cost Object
Release cost estimate with quantity structure
Mark cost estimate with quantity structure
Create Cost estimate with quantity structure

What is a Product Cost Estimate?
Cost Estimate With Quantity StructureUtilizes a Bill of Material (BOM) and routing, I.e. Master Recipe for costing purposes. Integrated with Production Planning (PP).
Additive You use additive costing to enable you to manually add costs that cannot be calculated by the system to a material cost estimate.
A tool for planning costs and establishing prices for materials. It is used to calculate the cost of goods sold for each product unit.
Cost Estimate WITHOUT Quantity StructureUtilizes a material master data and activity types entered manually into cost estimate.

Product Cost Planning: Overview
Quantity structure Quantity structure
Valuation
Cost estimateCost estimate with quantitywith quantity structurestructure
Cost estimateCost estimate without qtywithout qty structurestructure
PricePrice updateupdate
CostingCosting variantvariant
Report
Material costs
Production costs
Overhead
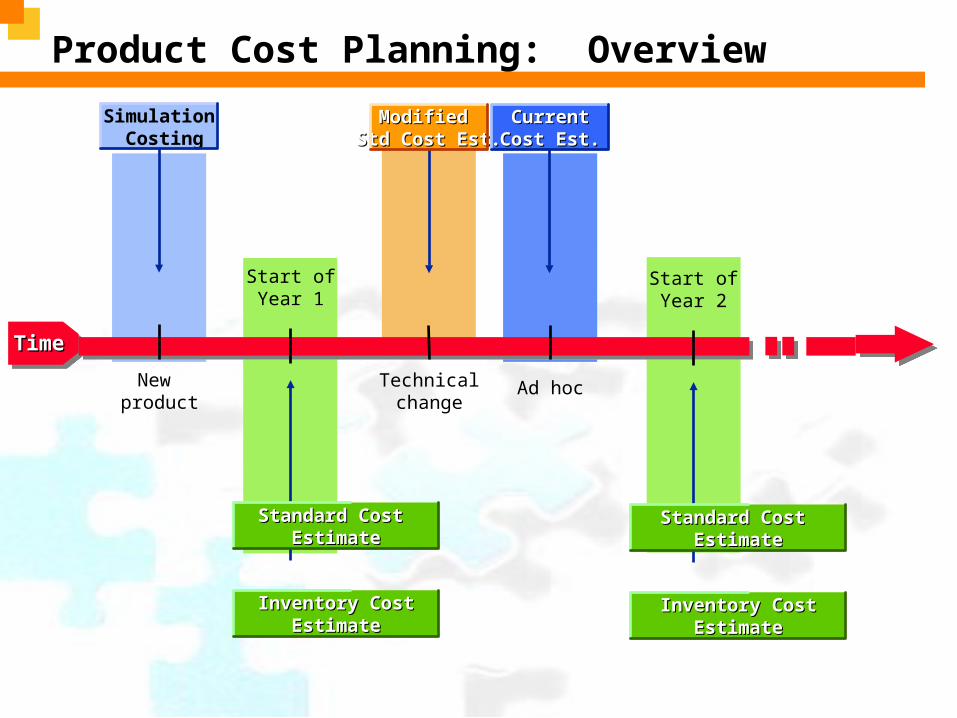
Product Cost Planning: Overview
Start ofYear 2
Ad hocNew product
Start ofYear 1
Technicalchange
Simulation Costing
Standard Cost Standard Cost EstimateEstimate
CurrentCurrentCost Est.Cost Est.
Modified Modified Std Cost Est.Std Cost Est.
Inventory CostInventory CostEstimateEstimate
Standard Cost Standard Cost EstimateEstimate
Inventory CostInventory CostEstimateEstimate
TimeTime

Product Costing: Overview
Standard Cost Estimate(once a year)
Standard Cost Estimate(once a year)
Release cost estimate with quantity structure
Mark cost estimate with quantity structure
Create Cost estimate with quantity structure

Material cost estimates with q. s.
Use
d f
or:
Use
d f
or:
Use
d f
or:
Use
d f
or:
Standard CostStandard Cost Estimate Estimate
Stock ValuationStock Valuation
Profit & Loss Profit & Loss StatementStatement
Standard CostStandard Cost Estimate Estimate
Stock ValuationStock Valuation
Profit & Loss Profit & Loss StatementStatement
BOM RoutingRouting
Quantity StructureQuantity StructureQuantity StructureQuantity Structure
Costing ResultsCosting ResultsCosting ResultsCosting Results
Items
M MaterialE ActivityE ActivityG Overhead
Cost Elements
400000 Raw materials943201 Production hours943901 UT: Cooling Var.…
CostingCosting
Values
600 000 SAR610 000 SAR612 000 SAR… SAR
Purchase price
Activity Type PriceActivity Type Price
Overhead
ValuationValuationValuationValuation

Material cost estimates with q. s.
InternalActivity
OverheadsMaterialExternalActivity
InternalActivity
Overheads-ExternalActivity
InternalActivity
OverheadsMaterialExternalActivity
InternalActivity
OverheadsMaterialExternalActivity
- -Material -
Product WProduct W
Product ZProduct Z
Product SProduct S
WWWW
Z1Z1Z1Z1 Z 2Z 2Z 2Z 2
S1S1S1S1 S2S2S2S2 S3S3S3S3
Costing structure - TotalCosting structure - Total
Costing structure – Upper levelCosting structure – Upper level
Costing structure – Lower levelCosting structure – Lower level
Costing structure - TotalCosting structure - Total
Costing structure - TotalCosting structure - Total

Costing Variant
Valuation Valuation VariantVariant
Quantity StructureQuantity StructureDeterminationDetermination
Costing Variant Costing Variant
PricesPricesQuantitiesQuantities
Cost of GoodsCost of GoodsManufacturedManufactured
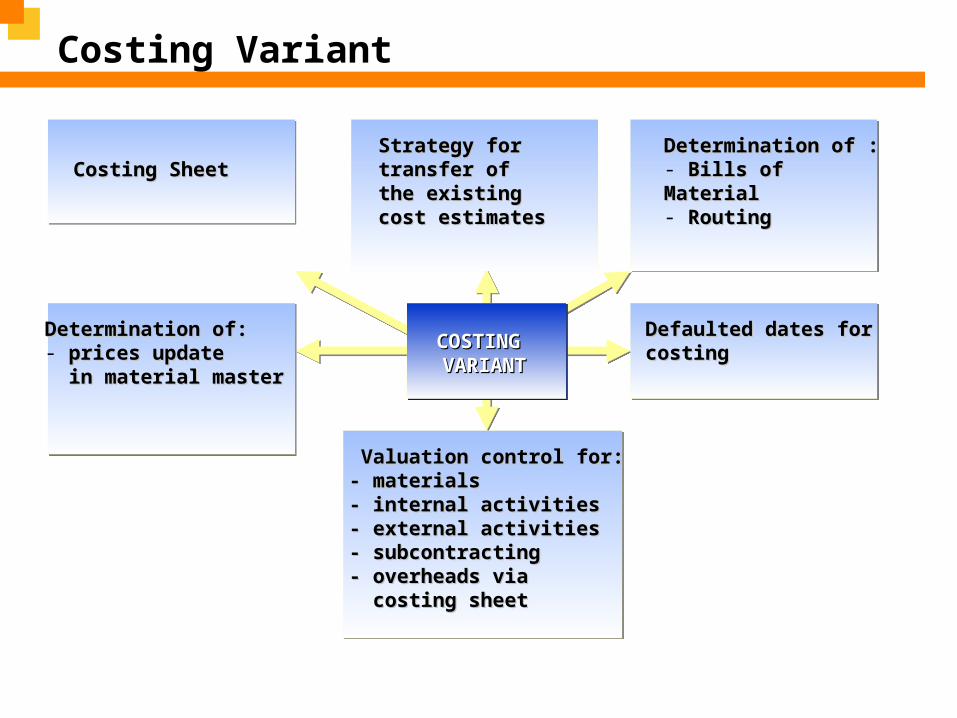
Costing Variant
COSTING COSTING VARIANTVARIANT
Strategy for Strategy for transfer of transfer of the existing the existing cost estimatescost estimates
Determination of :Determination of :- Bills of MaterialBills of Material- RoutingRouting
Defaulted dates for Defaulted dates for costingcosting
Costing SheetCosting Sheet
Determination of:Determination of:- prices update prices update in material master in material master
Valuation control for:Valuation control for:- materials- materials- internal activities- internal activities- external activities- external activities- subcontracting- subcontracting- overheads via - overheads via costing sheet costing sheet
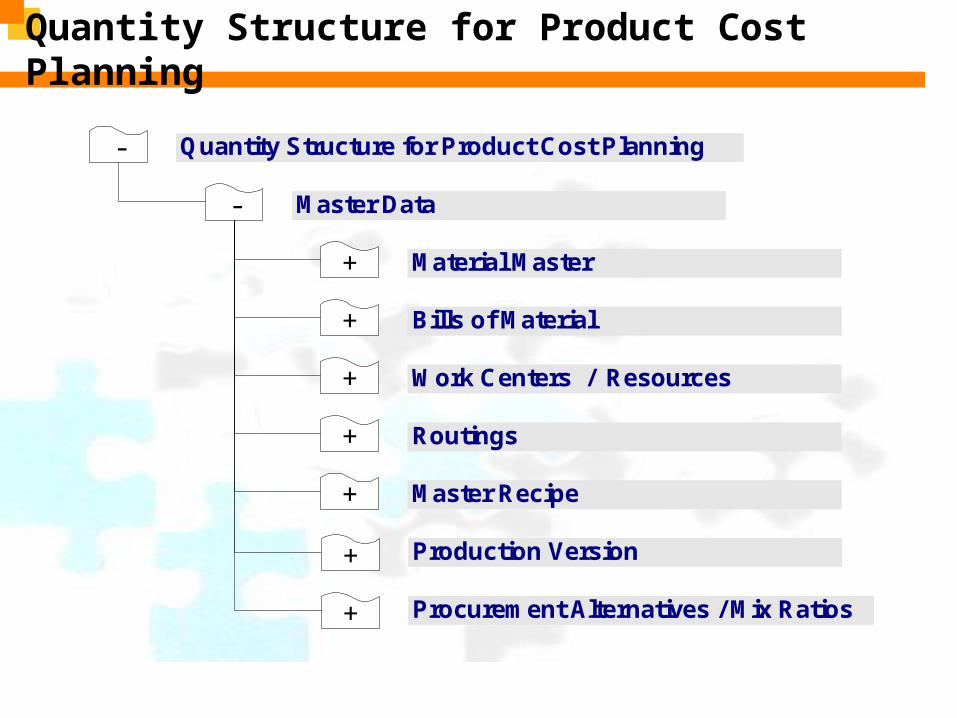
Quantity Structure for Product Cost Planning
-
-
Quantity Structure for Product Cost Planning
Master Data
+
+
+
+
+
Material Master
Bills of Material
Work Centers / Resources
Routings
Master Recipe
+ Production Version
+ Procurement Alternatives / Mix Ratios

Quantity Structure for Product Cost Planning
Material master data Accounting views Costing views MRP views
BOM - Bill of Material BOM type & identification BOM header Material data
Routing - tasks list Routing type & identification Routing header Operation data
Master Recipe Recipe header Operations Materials list
Work Centers / Resources Basic data Costing …
Production Version Validity Period Production line
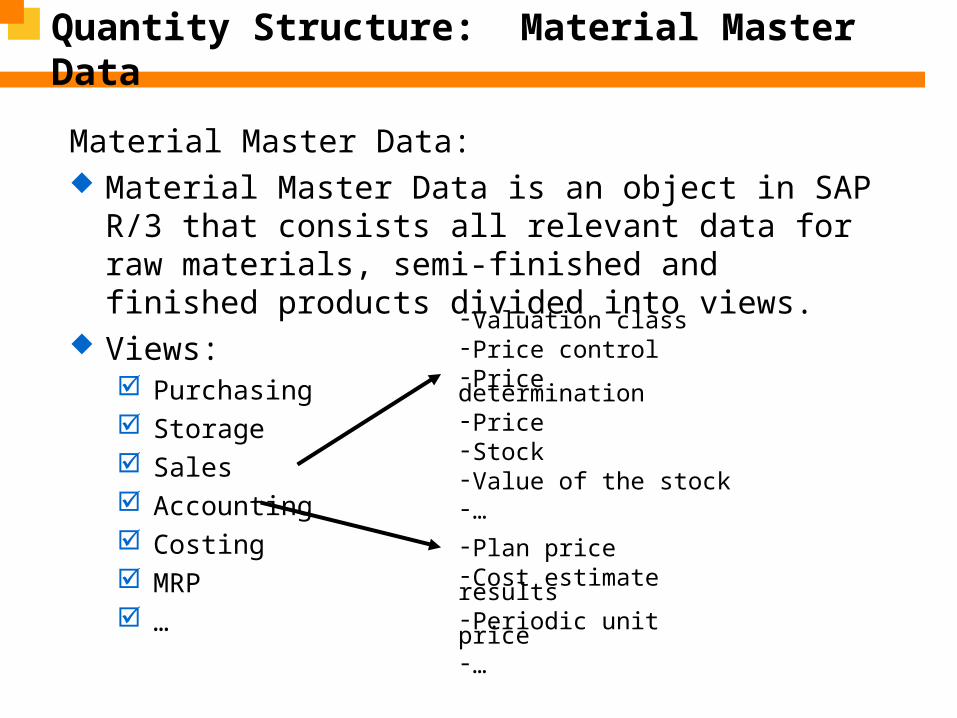
Quantity Structure: Material Master Data
Material Master Data: Material Master Data is an object in SAP R/3 that
consists all relevant data for raw materials, semi-finished and finished products divided into views.
Views: Purchasing Storage Sales Accounting Costing MRP …
-Valuation class-Price control-Price determination-Price-Stock-Value of the stock-…
-Plan price-Cost estimate results-Periodic unit price-…
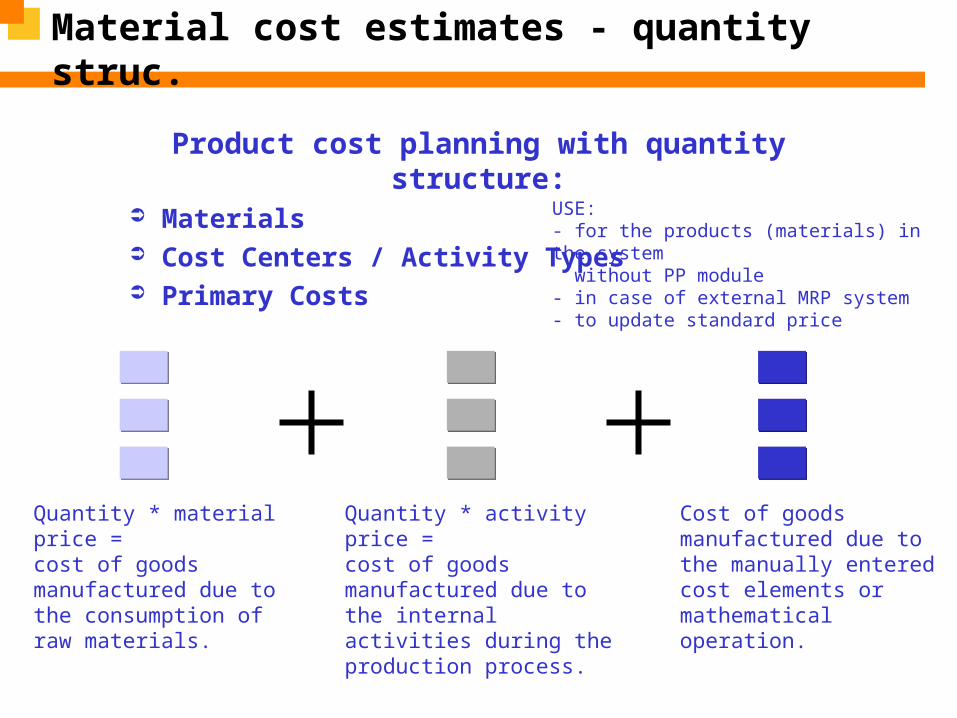
Material cost estimates - quantity struc.
Product cost planning with quantity structure: Materials Cost Centers / Activity Types Primary Costs
Quantity * material price =cost of goods manufactured due to the consumption of raw materials.
Quantity * activity price =cost of goods manufactured due to the internal activities during the production process.
Cost of goods manufactured due to the manually entered cost elements or mathematical operation.
USE:- for the products (materials) in the system without PP module- in case of external MRP system - to update standard price
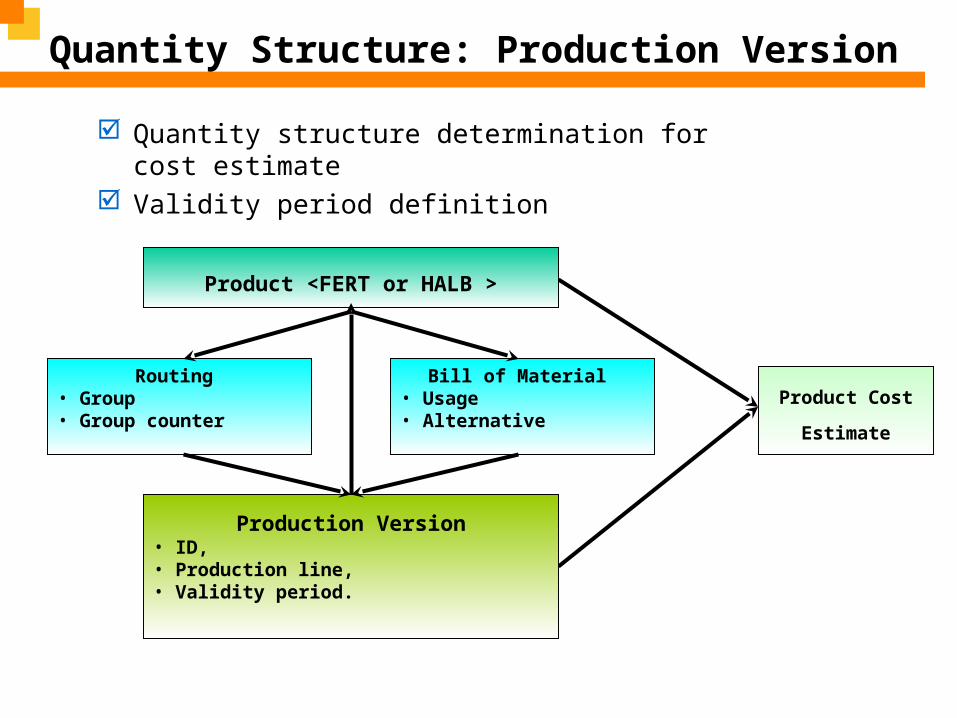
Quantity Structure: Production Version
Product <FERT or HALB >
Bill of Material • Usage• Alternative
Routing • Group• Group counter
Production Version• ID, • Production line, • Validity period.
Product Cost
Estimate
Quantity structure determination for cost estimate Validity period definition

Costing vs. Quantity Structure
Consumables
Maintenance
Labor
Depreciation
RAW MATERIALS
Electricity SERVICE COST CENTER
BILLS OF
MATERIAL
PRODUCTION COST
CENTER
Utilities OverheadACTIVITY TYPES
WORK CENTER /RESOURCE
ROUTING
PRODUCT COST
ESTIMATE
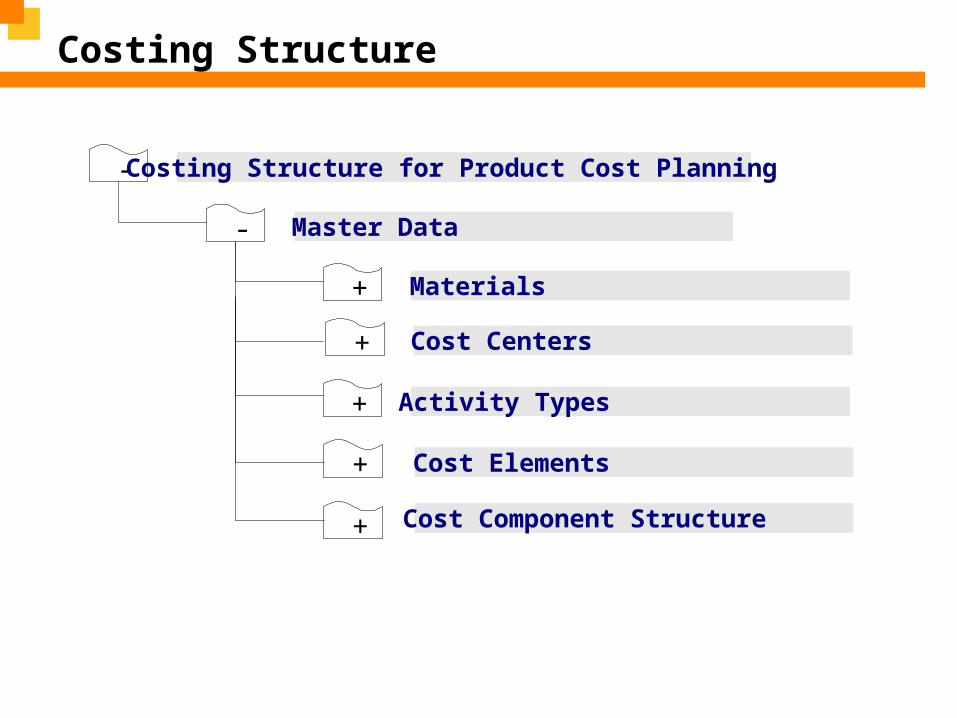
Costing Structure
-
-
Costing Structure for Product Cost Planning
Master Data
+
+
Materials
Activity Types
+ Cost Elements
+ Cost Component Structure
+ Cost Centers
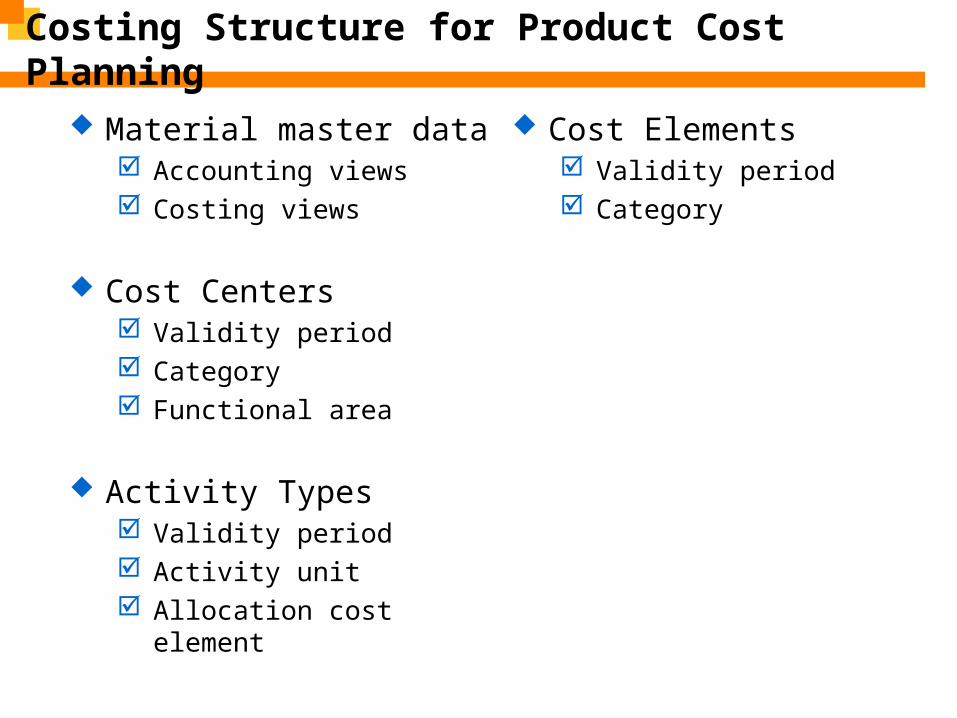
Costing Structure for Product Cost Planning
Material master data Accounting views Costing views
Cost Centers Validity period Category Functional area
Activity Types Validity period Activity unit Allocation cost element
Cost Elements Validity period Category

Costing Structure
Cost Center
Cost Elements
A cost centers is an organizational unit within a controlling area that represents a clearly delimited area of responsibility where costs are monitored against a plan.
They represent a defined location of cost incurrence.
Items in a chart of accounts that are relevant to cost, are referred to as cost elements. They are used for entering all costs within the entire cost accounting system.
Secondary costs elements are used exclusively in CO to identify internal cost flows such as assessments or settlements. They do not have corresponding general ledger accounts in FI and are defined in CO only.

Planning Overview
Profitability Segment
CompanyGeneral
Service
C. Center
Executive Management
Admin. C. Center
Maintenance
Prod. Support
Production C. Center
Product Cost
EstimateCOGS
Projects

Costing Structure
Activity Type
Activity types define the type of activity that can be provided
by a cost center (work activity, production hours, and so on).

Cost center
h
Cost center: R&T
Planned costs:
430000 (salaries) 44,000
440000 (miscl.) 10,000
473120 (telephone) 30,000
Plan activity qty: 100 h
Planned costs: 84,000
Calculated Price: 840
Activity Price Calculation:Apportionment of cost center costs to activity types according toparticular criteria
Activity Price Calculation
1PDH01
1
2100

Costing Structure
Steam service 1203004
943954 UT: Steam fix
Product22000057 - TEG
Product 22000058 - LLDPE
1203000
…..
…..
…..
DistributionAct
ivity
Alloca
tion
9439
54vi
aRou
ting
Cost SplittingPlanning1203000
Utilities (Common)Product
Cost Estimate
Activity Types Used:1UTSTF Steam - fixed
Original CE
1UTSTF Steam - fixed
1UTSTV Steam – var.
2
3
5
Primary costs planning on allCost Centers.
1Planned Price CalculationPrices for 1UTSTF arecalculated.
4
1. Assign CC 1203004 to SplittingStructure U4 Steam service2. Perform cost splitting

Cost Component Structure
Use
d f
or:
Use
d f
or:
Use
d f
or:
Use
d f
or:
Standard CostStandard Cost Estimate Estimate
Stock ValuationStock Valuation
Profit & Loss Profit & Loss StatementStatement
Standard CostStandard Cost Estimate Estimate
Stock ValuationStock Valuation
Profit & Loss Profit & Loss StatementStatement
Costing ResultsCosting ResultsCosting ResultsCosting Results
ID
101110111
…
Cost Component
Raw MaterialsCatalystChemicals…
CostingCosting
ValuesFixed & Variable
600 000 SAR0 SAR0 SAR… SAR
Purchase price
Activity Type PriceActivity Type Price
Overhead
ValuationValuationValuationValuation
x QuantityQuantityQuantityQuantity

Cost Component Structure
Raw Materials
Utilities
Personnel Exp.
Depreciation
Raw MaterialsRaw Materials
Variable ProductionVariable Production
Primary cost elements
Product Cost Planning
Structure of manufacturing costs
Cost Centers
Utilities
Personnel Exp.
Depreciation
Structure of primary costs
CO-PC
CO-OM
Raw Materials
InternalActivityAllocation
Structure of primary costs
Fix ProductionFix Production
Z9 -Primary
ZZ Process view
Product Costing: Overview
Standard Cost Estimate(once a year)
Standard Cost Estimate(once a year)
Release cost estimate with quantity structure
Mark cost estimate with quantity structure
Create Cost estimate with quantity structure

Price update
Standard price Only one validated standard price per product per period, The price represents most desired (or most likely) costs Only one price per product over the year (recommended) Determined during costing runs - standard cost estimate is populated in
appropriate valuation views Includes variable and fix cost elements Base for variances calculation; which is then posted to FI and CO-PA Used for stock valuation of finished goods and semi-finished products Stored in material master data (accounting view) in Legal, Group and Profit
Center valuation views after releasing the cost estimate

Price update
Future price Future standard price Stored in material master data (accounting & costing view) in Legal,
Group and Profit Center valuation views after marking the cost estimate.
Previous price Replaced standard price by current one due to releasing the cost
estimate Stored in material master data (accounting & costing view).
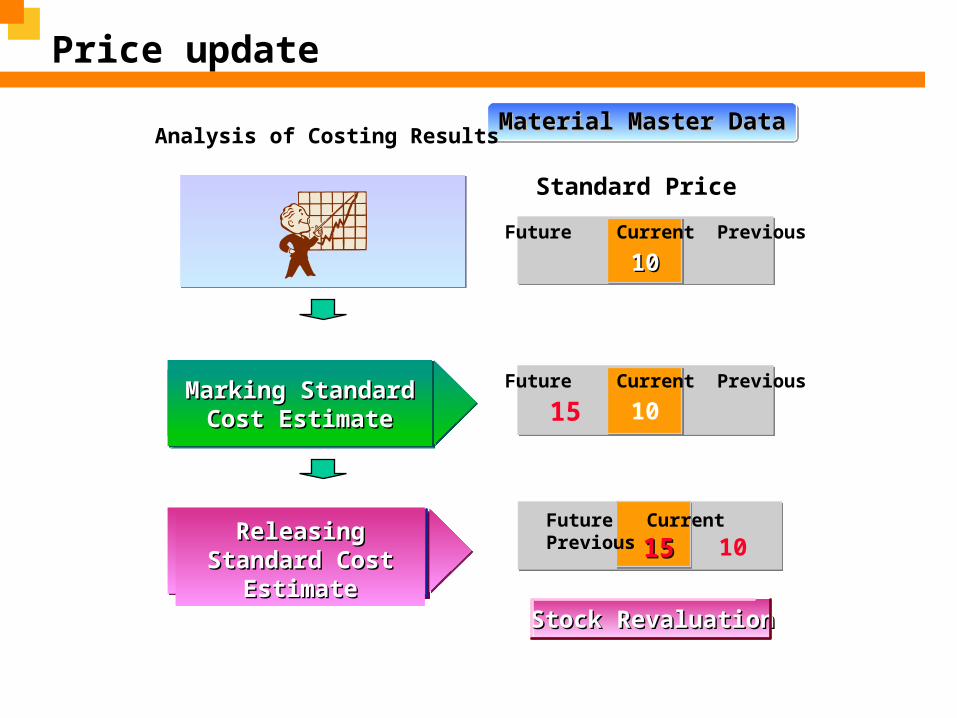
Price update
Material Master DataMaterial Master DataMaterial Master DataMaterial Master Data
Standard Price
Future Current Previous
1010
Future Current PreviousMarking Standard Marking Standard Cost EstimateCost Estimate 1015
Future Current Previous
101515
Stock RevaluationStock Revaluation
Releasing Standard Releasing Standard Cost EstimateCost Estimate
Analysis of Costing Results
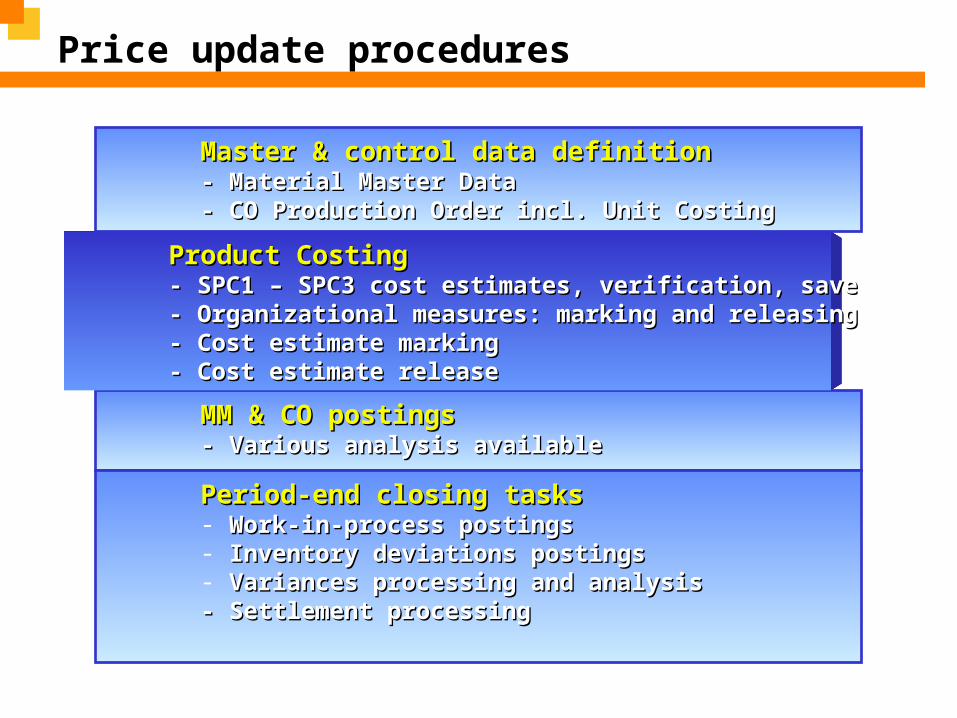
Price update procedures
MM & CO postings MM & CO postings - Various analysis available- Various analysis available
Product CostingProduct Costing- SPC1 – SPC3 cost estimates, verification, save- SPC1 – SPC3 cost estimates, verification, save- Organizational measures: marking and releasing- Organizational measures: marking and releasing- Cost estimate marking- Cost estimate marking- Cost estimate release- Cost estimate release
Master & control data definitionMaster & control data definition- Material Master Data- Material Master Data- CO Production Order incl. Unit Costing - CO Production Order incl. Unit Costing
Period-end closing tasksPeriod-end closing tasks- Work-in-process postingsWork-in-process postings- Inventory deviations postingsInventory deviations postings- Variances processing and analysis Variances processing and analysis - Settlement processing- Settlement processing

Costing run
Costing run You can use the costing run to process mass data. It enables you to cost, mark, and
release more than one material at the same time. Every processing step involved in costing with quantity structure is performed by the
costing run, from the same screen.
Costing run consists of: General data (organizational units, selection criteria) Selected materials Exploded BOMs Costing run results Price update results
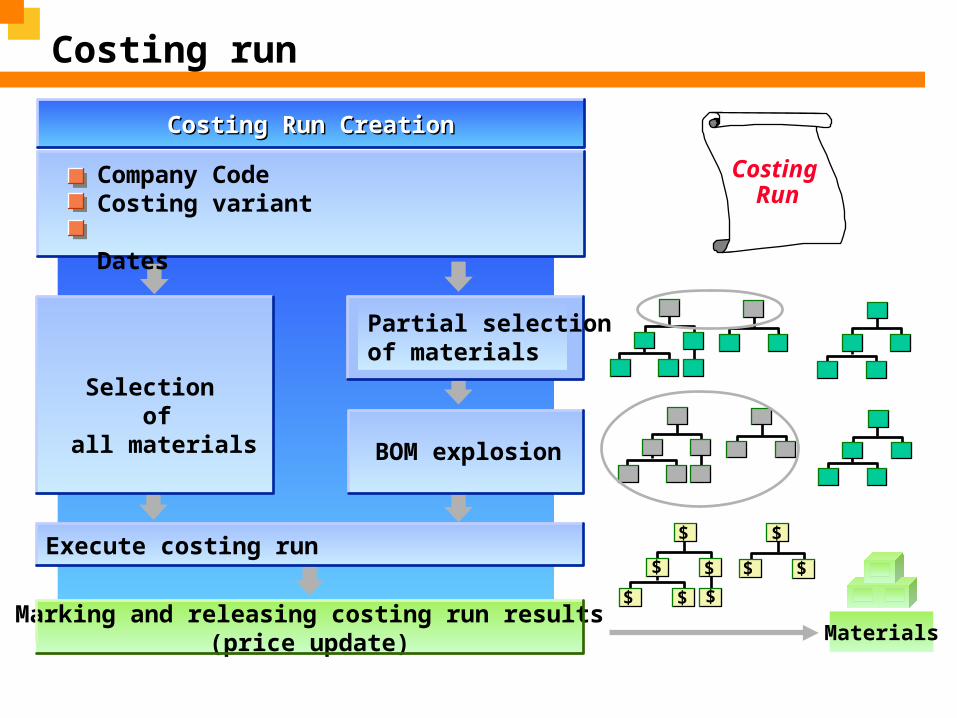
Costing run
Marking and releasing costing run results (price update)
Execute costing run
Selection of
all materials
Partial selection of materials
BOM explosion
Costing Run CreationCosting Run Creation
Company CodeCosting variant Dates
Costing Run
$
$ $
$
$
$
$
$ $
Materials

Product Costing: Overview
Prepare Cost ObjectPrepare Cost Object
Production CostsProduction Costs
Receive Finished StocksReceive Finished Stocks
Month End ClosingMonth End Closing
Post Materials Costs
Debit Secondary cost
Credit Production Output
WIP Calculation
Variance Calculation
Settlement
Preliminary costing
Create cost object

Cost Object Controlling: Overview
Functions of Cost Object Controlling:
Supporting make-or-buy decisions Determining price floors Performing complex cost analysis Determining inventory values

Cost Object Controlling: Overview
Cost Object Controlling Scenarios:
Product Cost by Period Product Cost by Period is used for recurring periodic cost
control of products that are manufactured in the same way over a longer period of time.
Product Cost by Order Product Cost by Order is mainly used to control the costs of
individual production lots.

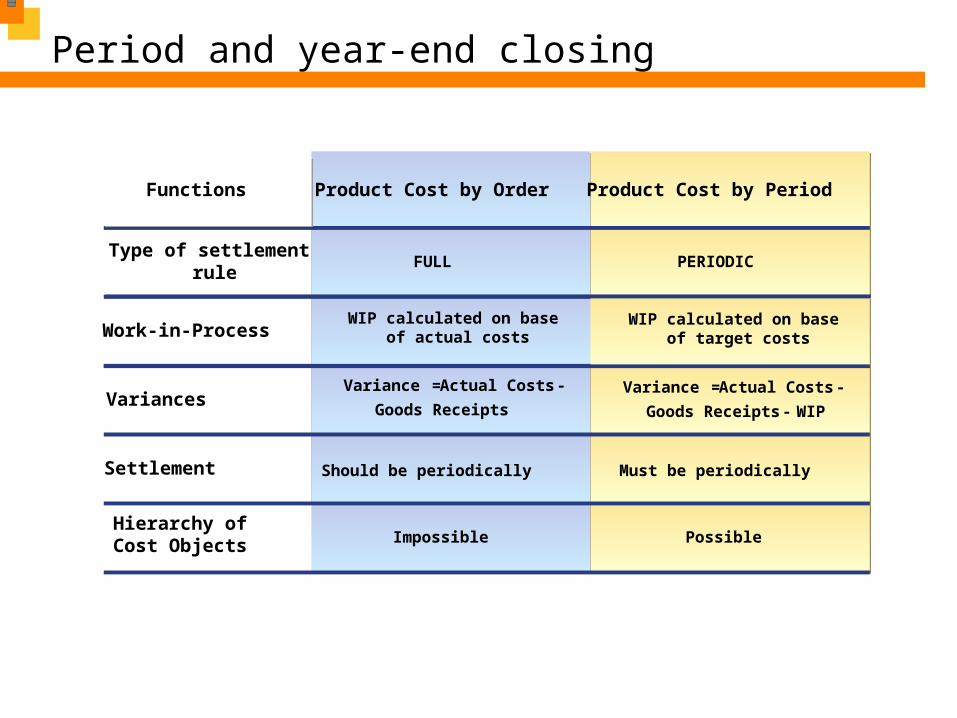
Cost Object Controlling: Overview
Product Cost by Order or by Period Full settlement (by Order)
Periodic settlement ( by Period)
Actual costs =Work in process
Actual costs -Goods receipts = Work in process
Actual costs -Goods receipts =Variances
Releasing an order
Partial delivery Delivered /Technically completed
Actual costs -Goods receipts =Work in process +Variances
Period 1 Period 2 Period 3
Actual costs -Goods receipts =Work in process +Variances
Actual costs -Goods receipts =Work in process +Variances
TimeTime
TimeTime

Cost Object Controlling: Overview
Product Cost by Order
Type of settlement rule
Work-in-Process
Variances
Settlement
Hierarchy ofCost Objects
FULL PERIODIC
WIP calculated on base of actual costs
Variance = Actual Costs -
Goods Receipts
Variance = Actual Costs -
Goods Receipts - WIP
Should be periodically
Impossible Possible
FunkcjeFunctions Product Cost by Period
WIP calculated on base of target costs
Must be periodically

Cost Object Controlling: Overview
Functions of Product Costs by Period:
Create product cost collectors. Create a preliminary cost estimate for product cost
collectors. Calculate and analyze target costs and actual costs for
product cost collectors. Calculate or update the work-in-process inventory and
the finished goods inventory. Calculate and analyze variances for each period. Transfer data to: Financial Accounting, Profitability
Analysis, Profit Center Accounting and Material Ledger.
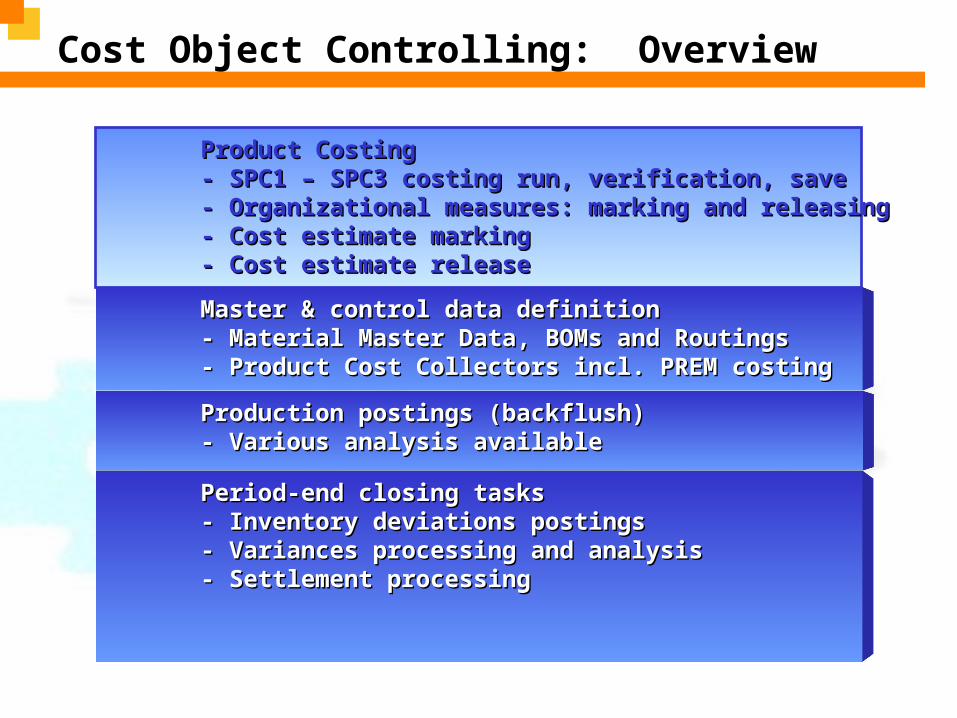
Cost Object Controlling: Overview
Production postings (backflush)Production postings (backflush)- Various analysis available- Various analysis available
Product CostingProduct Costing- SPC1 – SPC3 costing run, verification, save- SPC1 – SPC3 costing run, verification, save- Organizational measures: marking and releasing- Organizational measures: marking and releasing- Cost estimate marking- Cost estimate marking- Cost estimate release- Cost estimate release
Master & control data definitionMaster & control data definition- Material Master Data, BOMs and Routings - Material Master Data, BOMs and Routings - Product Cost Collectors incl. PREM costing - Product Cost Collectors incl. PREM costing
Period-end closing tasksPeriod-end closing tasks- Inventory deviations postings- Inventory deviations postings- Variances processing and analysis - Variances processing and analysis - Settlement processing- Settlement processing

Actual Overview
Profitability Segment
CompanyGeneral
CommonServices
Executive Management
SBU / Sales
C. Center
R&TC. Center
Maintenance
Production C. Center
Product Cost
CollectorVariances
ProjectsOverheadVariances

Product Costing: Overview
Prepare Cost ObjectPrepare Cost Object
Preliminary costing
Create Product Cost Collector
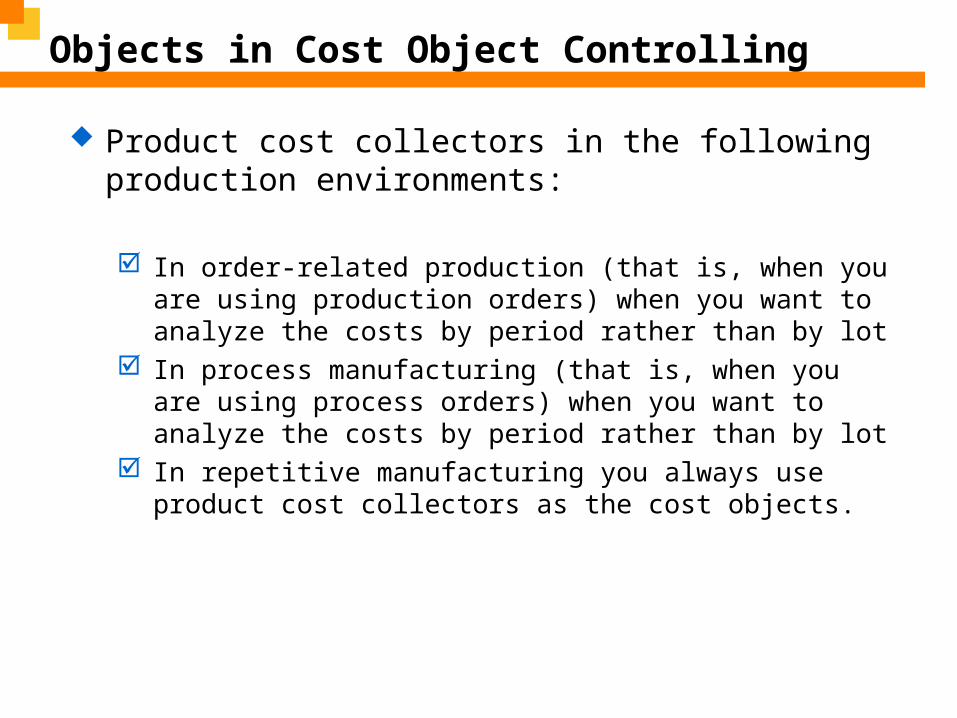
Objects in Cost Object Controlling
Product cost collectors in the following production environments:
In order-related production (that is, when you are using production orders) when you want to analyze the costs by period rather than by lot
In process manufacturing (that is, when you are using process orders) when you want to analyze the costs by period rather than by lot
In repetitive manufacturing you always use product cost collectors as the cost objects.

Objects in Cost Object Controlling
Product <FERT or HALB >
Bill of Material • Usage• Alternative
Routing • Group• Group counter
Production Version• ID, • Production line, • Validity period.
Product Cost
Collector
Product Cost Collector
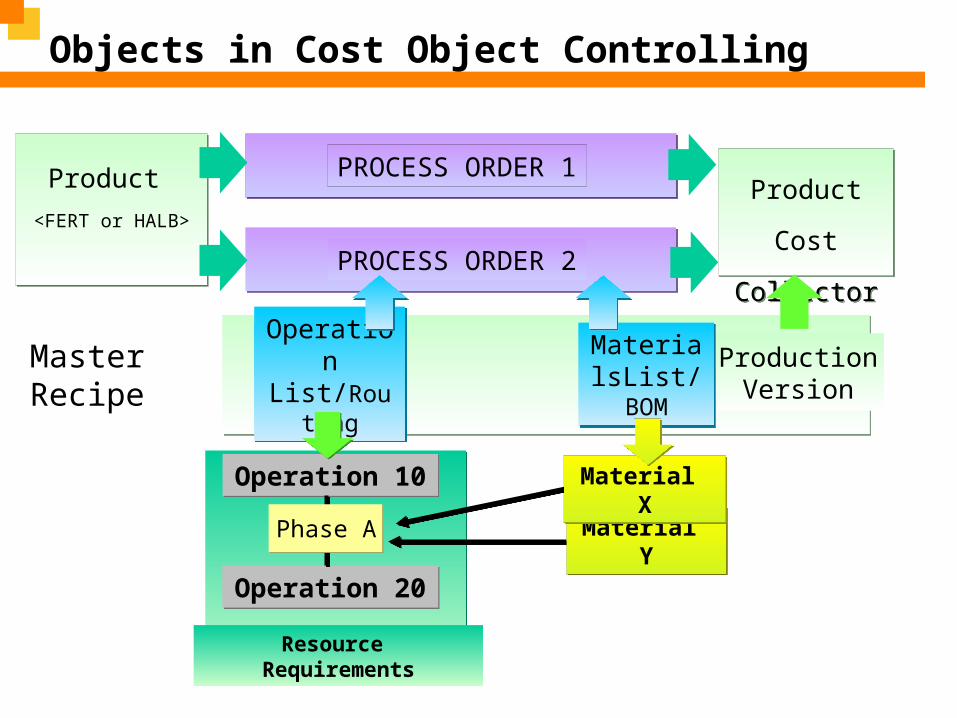
Objects in Cost Object Controlling
MasterRecipe
ProductionVersion
PROCESS ORDER 2
Operation List/RoutingOperation List/Routing
MaterialsList/BOMMaterialsList/BOM
Resource Requirements
Operation 10Operation 10
Operation 20Operation 20
Phase AMaterial YMaterial Y
Material XMaterial X
Product Cost
Collector
Product Cost
Collector
PROCESS ORDER 1Product
<FERT or HALB>
Product
<FERT or HALB>

Preliminary costing
Production postings (backflush)Production postings (backflush)- Various analysis available- Various analysis available
Product CostingProduct Costing- SPC1 – SPC3 costing run, verification, save- SPC1 – SPC3 costing run, verification, save- Organizational measures: marking and releasing- Organizational measures: marking and releasing- Cost estimate marking- Cost estimate marking- Cost estimate release- Cost estimate release
Master & control data definitionMaster & control data definition- Material Master Data, BOMs and Routings - Material Master Data, BOMs and Routings - Product Cost Collectors with Preliminary costing (PREM) - Product Cost Collectors with Preliminary costing (PREM)
Period-end closing tasksPeriod-end closing tasks- Inventory deviations postings- Inventory deviations postings- Variances processing and analysis - Variances processing and analysis - Settlement processing- Settlement processing

Preliminary costing
Costing variant PREM - preliminary costing: Created during product cost collector creation Created per each production version Provides split and balanced information of cost items, quantities
and prices that are planned to occur during production of a product Variable costs coming from BOM and routing Result used mainly for actual activities postings May be used for further analysis up to cost management
requirements May be changed all the time in the way of changing (updating)
Product Cost Collector; i.e. different quantity structures allowed over the period
Changes in BOMs take effect immediately, i.e. cost estimate update not required
Changes in routings take effect after cost estimate update
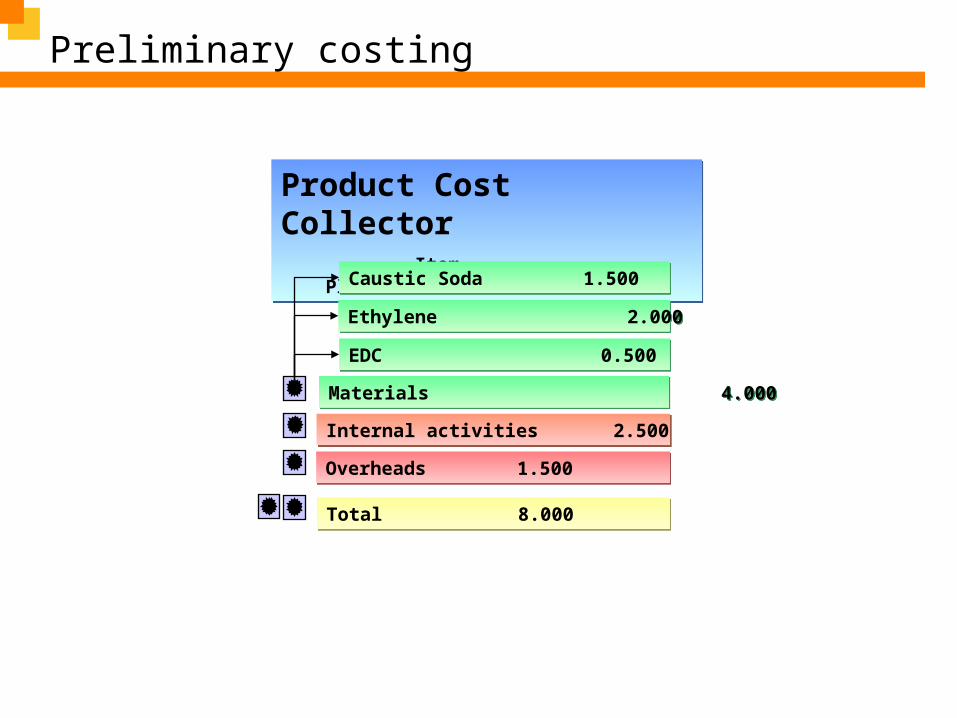
Preliminary costing
Product Cost Collector Item Plan Actual
Product Cost Collector Item Plan Actual
Materials 4.000Materials 4.000
Internal activities 2.500Internal activities 2.500
Overheads 1.500Overheads 1.500
EDC 0.500EDC 0.500
Ethylene 2.000Ethylene 2.000
Caustic Soda 1.500Caustic Soda 1.500
Total 8.000 Total 8.000
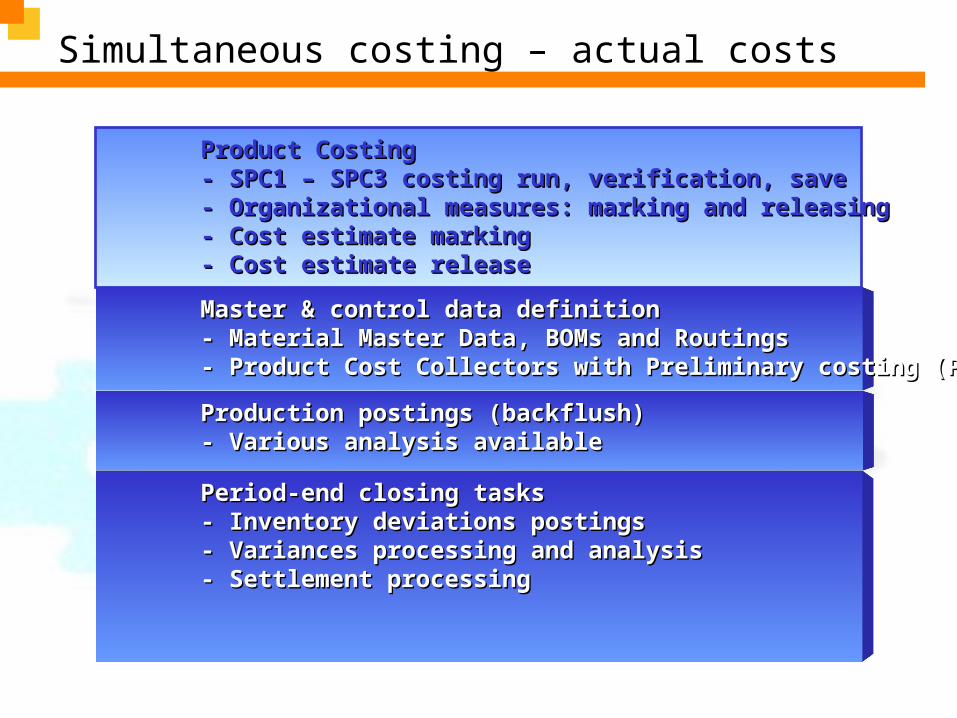
Simultaneous costing – actual costs
Production postings (backflush)Production postings (backflush)- Various analysis available- Various analysis available
Product CostingProduct Costing- SPC1 – SPC3 costing run, verification, save- SPC1 – SPC3 costing run, verification, save- Organizational measures: marking and releasing- Organizational measures: marking and releasing- Cost estimate marking- Cost estimate marking- Cost estimate release- Cost estimate release
Master & control data definitionMaster & control data definition- Material Master Data, BOMs and Routings - Material Master Data, BOMs and Routings - Product Cost Collectors with Preliminary costing (PREM) - Product Cost Collectors with Preliminary costing (PREM)
Period-end closing tasksPeriod-end closing tasks- Inventory deviations postings- Inventory deviations postings- Variances processing and analysis - Variances processing and analysis - Settlement processing- Settlement processing

Simultaneous costing – actual costs
Product Cost Collector Item Plan Actual
Product Cost Collector Item Plan Actual
Materials 4,000 4,600Materials 4,000 4,600
Internal activities 2.500 2.800Internal activities 2.500 2.800
Overheads 1.500Overheads 1.500
EDC 0.500 0.600EDC 0.500 0.600
Ethylene 2.000 2.200Ethylene 2.000 2.200
Caustic Soda 1.500 1.800Caustic Soda 1.500 1.800
Total 8.000 7.400 Total 8.000 7.400
Confirm order operation
Record consumption & output
Record process data & batch
characteristics
Final Confirmation & Back Flush
Production output & Back Flush
Deal with Back Flush & transaction errors
Adjust theoretical yield & consumption to actual
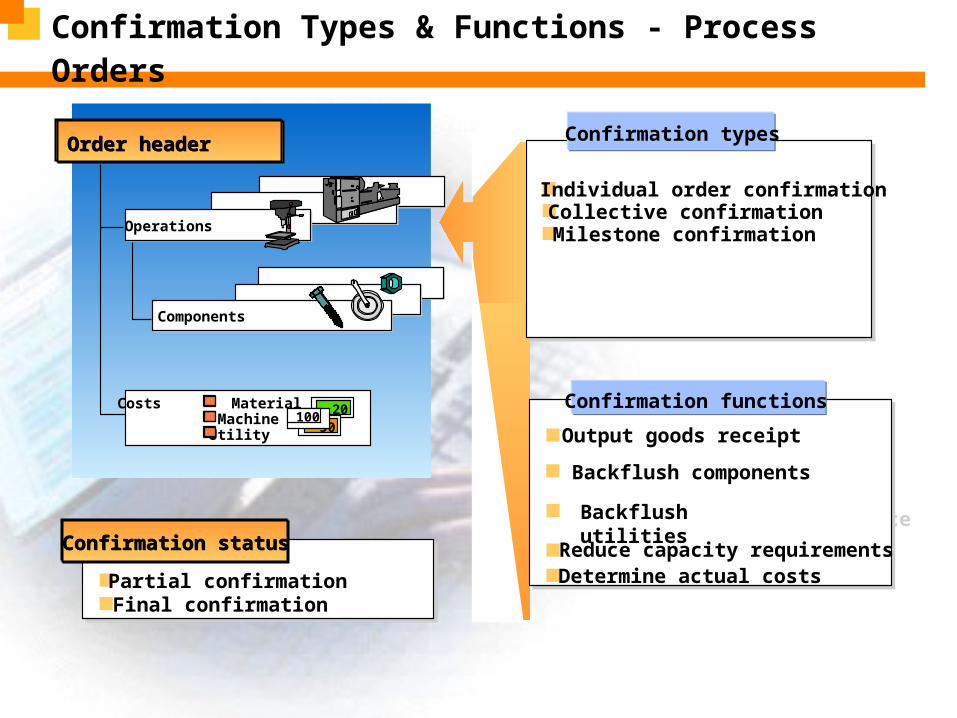
Confirmation Types & Functions - Process Orders
Individual confirmation Collective confirmation Milestone confirmation Progress confirmation Order confirmation Confirmation with reference
Individual order confirmation Collective confirmation Milestone confirmation
Confirmation types
Partial confirmation Final confirmation Partial confirmation Final confirmation
Confirmation statusConfirmation status
Order headerOrder header
OperationsOperations
ComponentsComponents
Costs MaterialLabor...
Costs MaterialMachineUtility
2050
100
Confirm with goods movement Defaults for remaining time Check operation sequence Check delivery tolerances Plant data collection interface Backflushing Reduce capacity requirements Determine actual costs
Output goods receipt
Determine actual costs
Confirmation functions
Backflush components
Backflush utilitiesReduce capacity requirements

Back Flushing (Repetitive Orders)
Warehouse
Order quantity = 10 PC
Required qty = 20 PC
Operation 30
Component XY
Back Flushing
Operation 30
Yield = 5 PC
10 PC of Component XYto be back flushed
Goods issue
Component XY = 10 PC
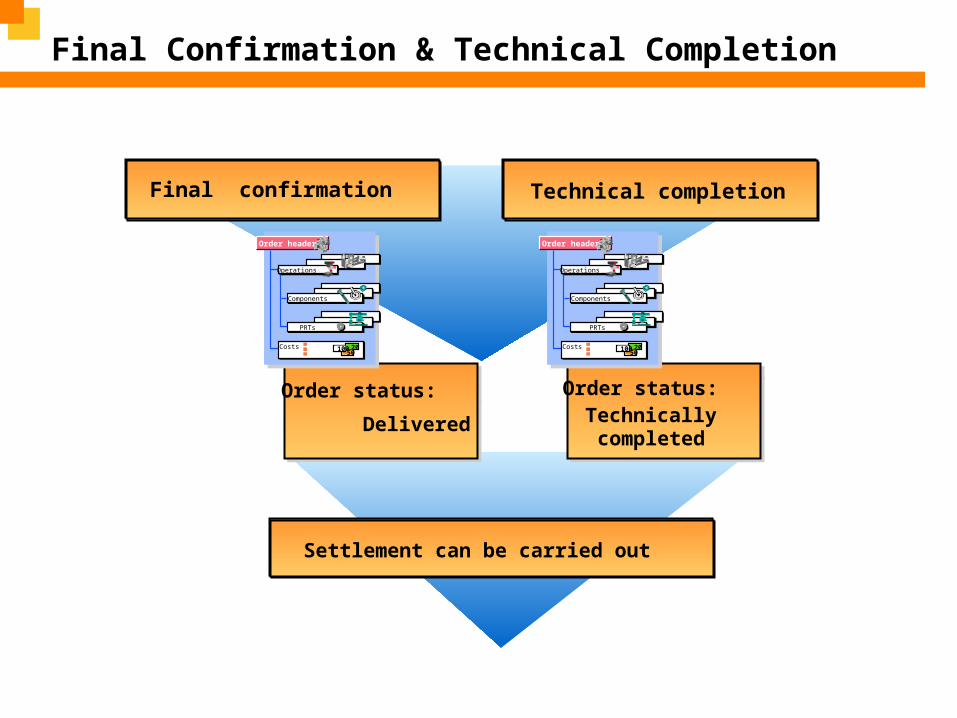
Final Confirmation & Technical Completion
Final confirmation
Settlement can be carried out
Technical completion
Production orderstatus: Delivered
Order status:
Delivered
Order header
OperationsOperations
ComponentsComponents
PRTsPRTs
Costs Costs 2050
100
Production orderstatus:
Technicallycompleted
Order status:Technicallycompleted
Order header
OperationsOperations
ComponentsComponents
PRTsPRTs
Costs Costs 2050
100

Failed Transactions and Corrections
Incorrect or missing data for components and activities prevents processing of the back flush transaction
These errors must be corrected before postings can be made for materials and activities
When the errors have been eliminated, the theoretical yield and consumption may be adjusted and the results recorded

Summary
Non-feedstock raw materials are staged daily to the production area for planned manufacture
As each production quantity is confirmed, a back flush of the proportional quantities of raw materials and utilities consumed is recorded
The results from the output receipts, plus material & resource consumptions, update the stock records and provide valuation of production according to standard cost approach.
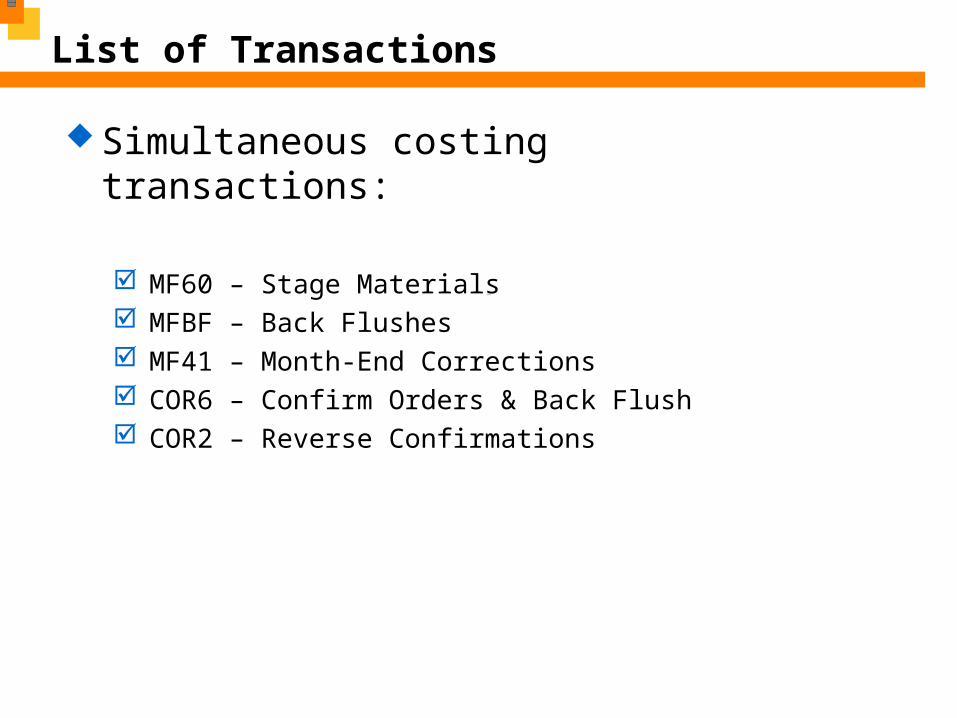
List of Transactions
Simultaneous costing transactions:
MF60 – Stage Materials MFBF – Back Flushes MF41 – Month-End Corrections COR6 – Confirm Orders & Back Flush COR2 – Reverse Confirmations
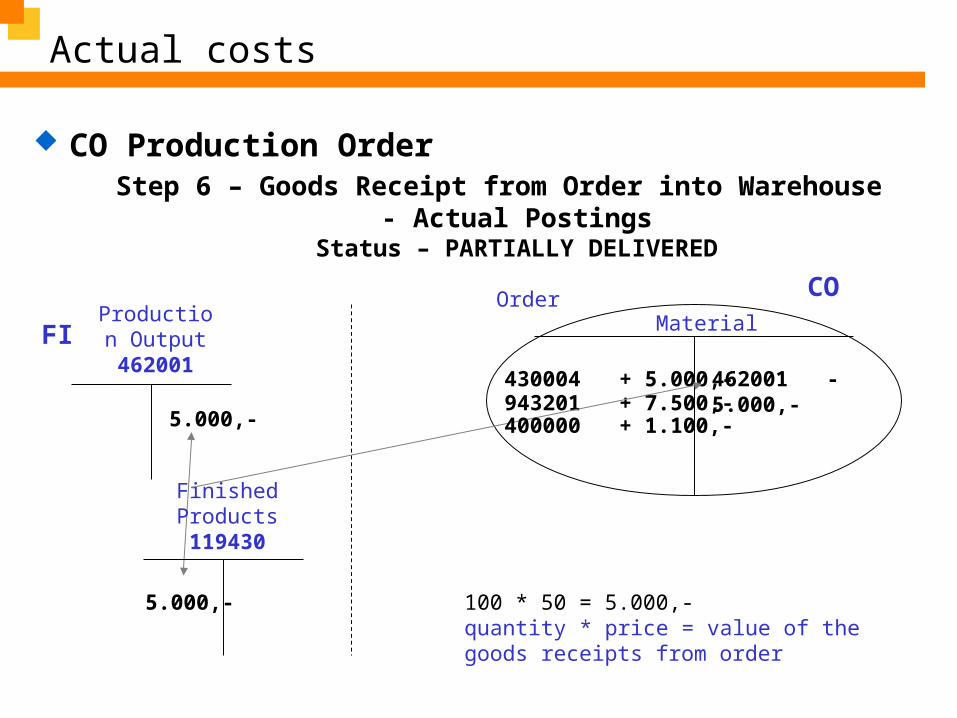
Actual costs
CO Production OrderStep 6 – Goods Receipt from Order into Warehouse
- Actual PostingsStatus – PARTIALLY DELIVERED
MaterialOrder
430004 + 5.000,-943201 + 7.500,-
100 * 50 = 5.000,-quantity * price = value of the goods receipts from order
Production Output462001
Finished Products119430
5.000,-
5.000,-
400000 + 1.100,-
462001 - 5.000,-
FI
CO

Actual costs - Summary
The results from the output receipts, plus material & resource consumptions, update the stock records and provide valuation of production according to standard cost approach.
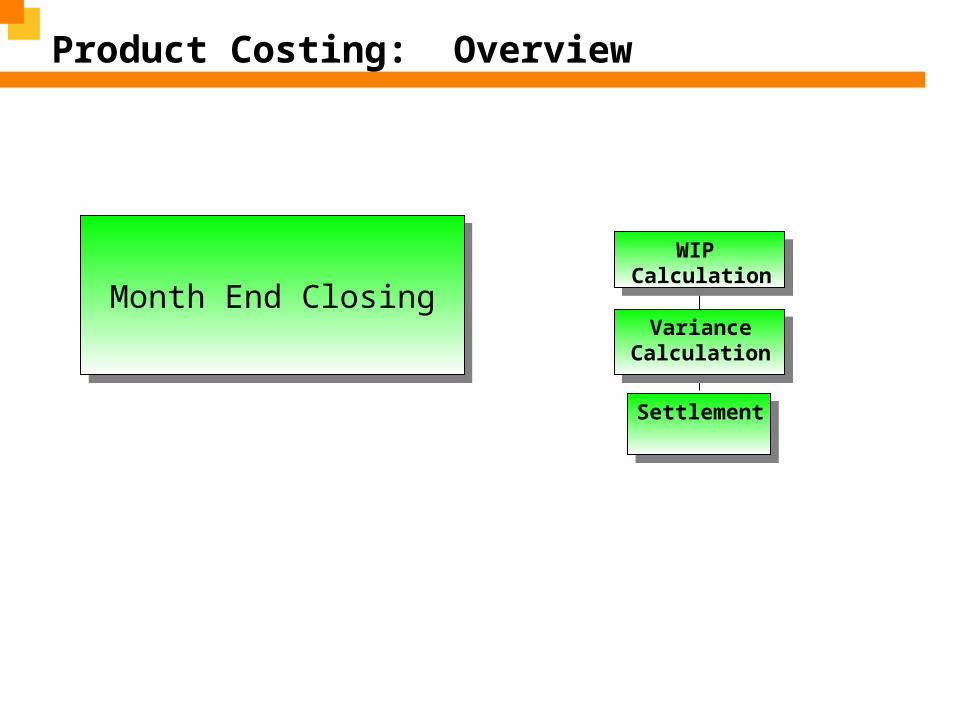
Product Costing: Overview
Month End ClosingMonth End Closing
Settlement
Variance Calculation
WIP Calculation

Period and year-end closing
Period-end closing:
Product Cost Collectors are only included in the period-end closing process if the status of the order is not one of the following: LKD (Locked), CLSD (Closed), DLFL (Deletion flag), DLT (Deleted).
If you don’t enter a production process in the individual processing mode of the period-end closing transaction, but only enter the data for the material and plant, this period-end closing transaction will be performed for all production processes for that material.
Functions available in period-end closing: overhead calculation, WIP calculation, variance calculation, settlement.
Period and year-end closing
Product Cost by Order
Type of settlement rule
Work-in-Process
Variances
Settlement
Hierarchy ofCost Objects
FULL PERIODIC
WIP calculated on base of actual costs
Variance = Actual Costs -
Goods Receipts
Variance = Actual Costs -
Goods Receipts - WIP
Should be periodically
Impossible Possible
FunkcjeFunctions Product Cost by Period
WIP calculated on base of target costs
Must be periodically
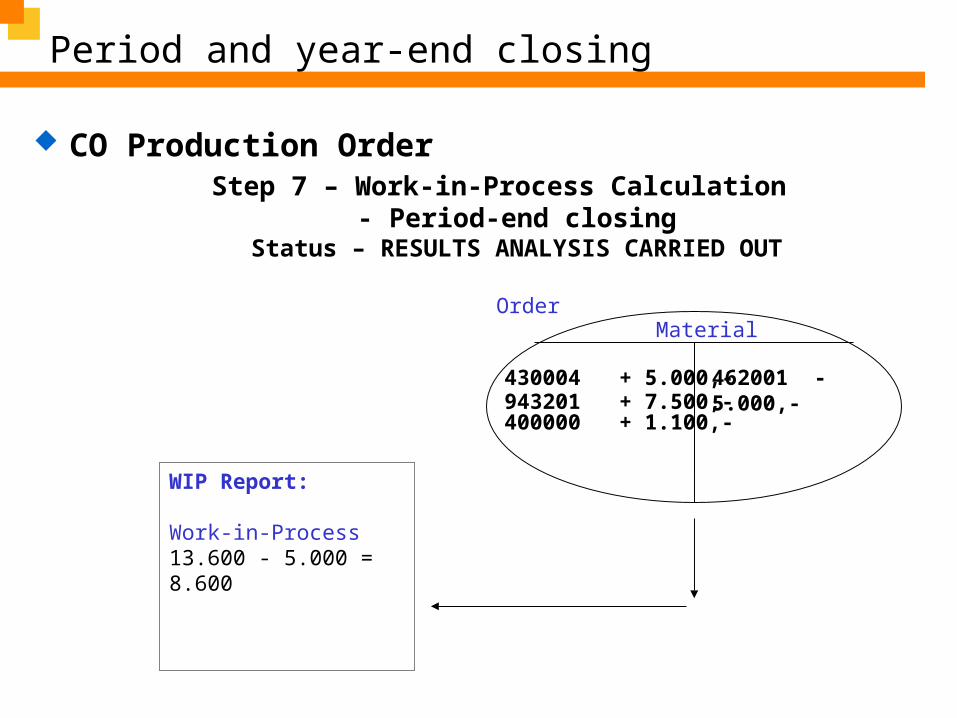
Period and year-end closing
CO Production OrderStep 7 – Work-in-Process Calculation
- Period-end closingStatus – RESULTS ANALYSIS CARRIED OUT
MaterialOrder
430004 + 5.000,-943201 + 7.500,-400000 + 1.100,-
462001 - 5.000,-
WIP Report:
Work-in-Process 13.600 - 5.000 = 8.600

Period and year-end closing
CO Production OrderStep 8 – Settlementof - Period-end closing
Status – RESULTS ANALYSIS CARRIED OUT
MaterialOrder
430004 + 5.000,-943201 + 7.500,-400000 + 1.100,-
462001 - 5.000,-
Work In Progress
(WIP)462201
Work In Progress
(WIP)119460
8.600,-
FI
8.600,-
CO
WIP is being updated on the order as statistical value for information purposes.

Period and year-end closing
CO Production Order – new periodStep 9 – Repetition of the steps from 3 to 7
- Actual Postings Status – PARTIALLY DELIVERED or DELIVERED
Order
As a result of the actual postings in the new period there is a new balance on the order.
Material
430004 + 5.000,-943201 + 7.500,-400000 + 1.100,-
462001 - 5.000,-
400000 + 5.000,-
462001 - 7.000,-

Period and year-end closing
CO Production Order – period 2Step 10 – Work-in-Process Calculation (variant 1)
- Period-end closingStatus – PARTIALLY DELIVERED
WIP Report (cumulated):Work-in-Process 18.600 - 12.000 = 6.600
Work-in-Process in previous period 13.600 - 5.000 = 8.600 Cumulative: 15.200
OrderMaterial
430004 + 5.000,-943201 + 7.500,-400000 + 1.100,-
462001 - 5.000,-
400000 + 5.000,-
462001 - 7.000,-

Period and year-end closing
CO Production Order – Period 2Step 11 – Settlement (variant 1)
- Period-end closingStatus – RESULTS ANALYSIS CARRIED
Material
OrderWork In Progress
(WIP) 119460
Work In Progress
(WIP)462201
FI
6.600,-
6.600,-
CO
430004 + 5.000,-943201 + 7.500,-400000 + 1.100,-
462001 - 5.000,-
400000 + 5.000,-
462001 - 7.000,-
As WIP is reported as cumulative value.

Period and year-end closing
CO Production Order – period 2Step 12 – Calculation of Variances and Settlement (variant 2)
- Period-end closingStatus – TECHNICALLY COMPLETED
Price Difference - Production Difference
464018
Production Output462001
FI
6.600,-
6.600,-
Material
Order CO
430004 + 5.000,-943201 + 7.500,-400000 + 1.100,-
462001 - 5.000,-
400000 + 5.000,-
462001 - 7.000,-
Negative variance:
Actuals > Plan.
As a result of a posting the balance of the order was posted to production difference account and cumulated WIP was reversed.
WIP 462201
WIP119460
8.600 8.600

Period and year-end closing
Variance: Integration
MaterialsMaterialsLabourLabourDepreciationDepreciation
Goods Receipt Goods Receipt VarianceVariance
8008001.2001.200
4004002.4002.400
- 2.000- 2.000 400400
MaterialMaterial CATALYST CATALYSTQuantity prod.:Quantity prod.: 10 10 pcs pcs
Actual CostsActual Costs
Product Cost CollectorProduct Cost Collector
Material MasterMaterial MasterAccounting ViewAccounting ViewStandard PriceStandard Price
200 200
SettlementSettlement
Target Cost Ver. 0
Price 150Quantity 50Structure 200
Profitability Analysis
Variance 400
CO-CO-PAPA
AccountingStock Price difference
2.000 400
FIFI
StockMMMM
CO-CO-PCPC
MaterialsMaterials600 600
LabourLabour1.100 1.100
DepreciationDepreciation300 300
Standard Cost Estimate
10pcs * 200

Period and year-end closing
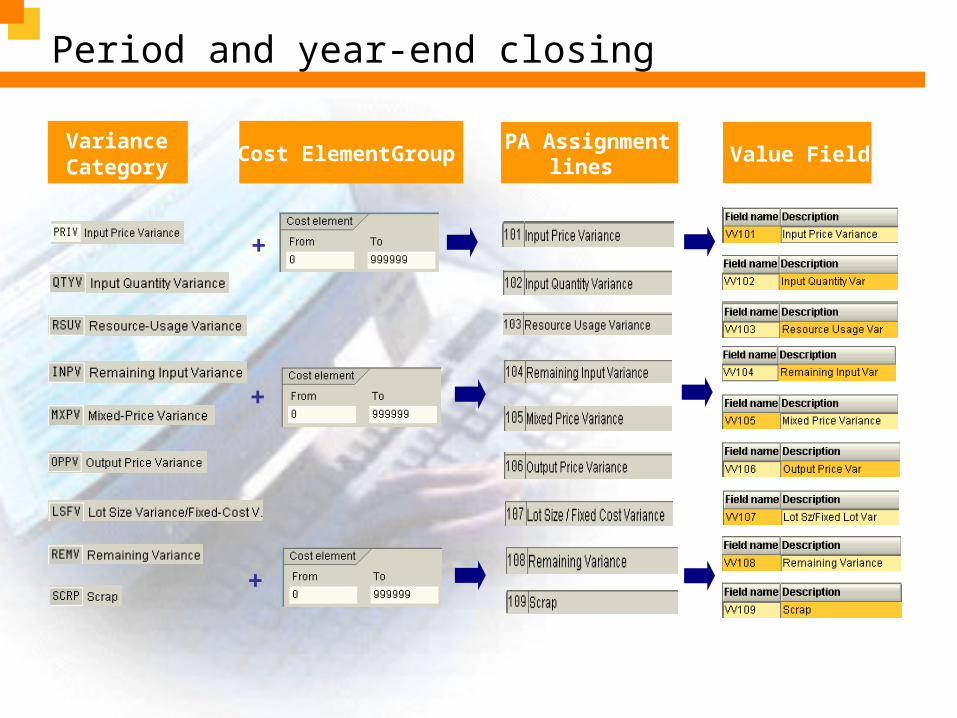
VarianceCategory
PA Assignmentlines
Value FieldCost Element Group
+
+
+

Period and year-end closing
CO-CO-PCPC
Material: MEGQuantity: 10 pieces
Actual costs 2.400,-
Goods receipt -2.000,-
Variances/WIP 400,-
Actual costs
CO-PC
Product cost collector
Period accounting
Revenue
– Sales deductions
– Overheads plus Variances
+/- Change in Stock
= Result of a periodResult of a period
Company Code
PrCtr 1PrCtr 1
Profit CenterFI
EC-PCA
Cost of goods sold
Revenue
– Sales deductions
– Manufacturing costs by standard price (Contribution margin I)
– Variances
= Result of a periodResult of a period
Company Code ProfitabilitySegment
CO-PA
SettlementFI

Period and year-end closing-
PRF
PRA
PRU
PRDCost (price)differences
-
PRF
PRA
PRU
PRYCost (price)differences(mater.ledg
er)
-
PRF
PRA
PRU
PRVMaterialledger
fr.low.levels price dif.
UMBGain/loss
fromrevaluation
LKWAccruals and
defer.acct(material ledger)
GL (PL) 464017Price Diff -Purchasing
GL (PL) 464018Production Variance
GL (PL) 464019Price Diff - Good
Issue
GL (PL) 4640020Price Diff -Transfer
Postings
GL (PL) 464021Gains/Loss on
Inventory Revaluation
GL (BS) 119610ML Provisions
Purchasing,Stock
Movement,Production
Material LedgerClosing - Single
Level
Material LedgerClosing - Multi
Level Level
Material LedgerClosing -
Release FuturePrice
Material LedgerClosing - Do notrevaluate Stock
FI PA
Revenue Revenue
COGS
Input pricevariance
Input quantityvariance
Resource-usagevariance
Remaining inputvariance
Mixed-pricevariance
Output pricevariance
Lot size-/fixed-cost variance
Remainingvariance
Scrap
Price Diff -Purchasing
Price Diff - GoodIssue
Price Diff -Transfer Postings
Gains/Loss onInventory
Revaluation
COGS
ProductionVariances
Adjustmentto COGS
fromcapitalisingVariances
Adjustment toCOGS from
InventoryRevaluation
Gross margin
*
*
*
*
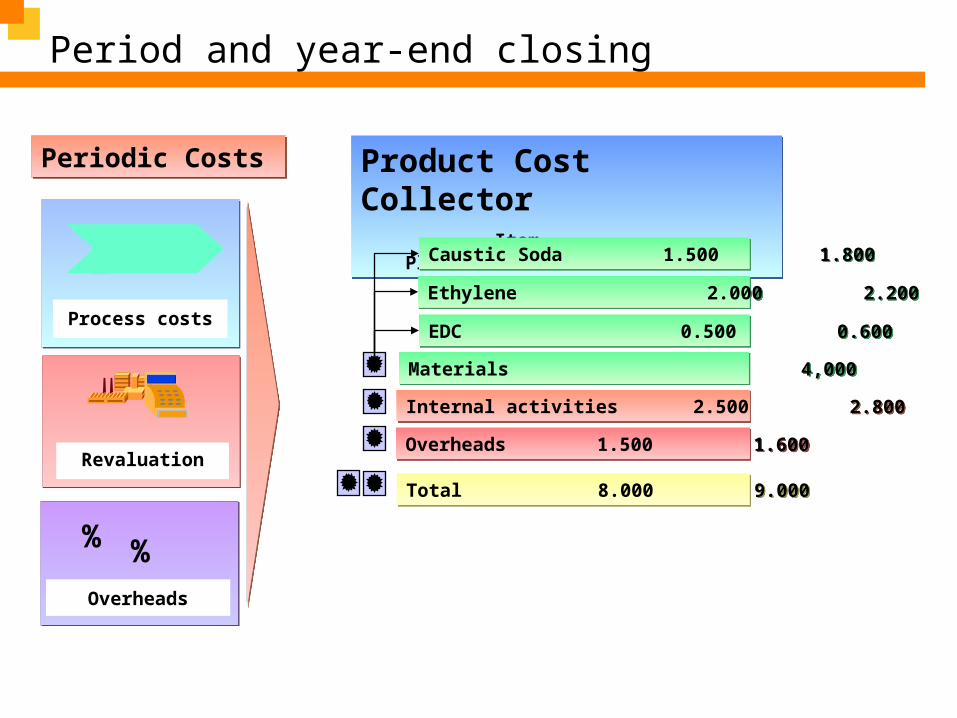
Period and year-end closing
Product Cost Collector Item Plan Actual
Product Cost Collector Item Plan Actual
Materials 4,000 4,600Materials 4,000 4,600
Internal activities 2.500 2.800Internal activities 2.500 2.800
Overheads 1.500 1.600Overheads 1.500 1.600
EDC 0.500 0.600EDC 0.500 0.600
Ethylene 2.000 2.200Ethylene 2.000 2.200
Caustic Soda 1.500 1.800Caustic Soda 1.500 1.800
Total 8.000 9.000 Total 8.000 9.000
Revaluation
Process costs
Overheads
Periodic CostsPeriodic Costs
% %

Period and year-end closing
Work-in-Process
Overheads
Process costs
Revaluation
Periodiccosts
Calculations and
analysis
Postings FI/CO
Settlement
ScrapVariances
Period-end closingPeriod-end closing
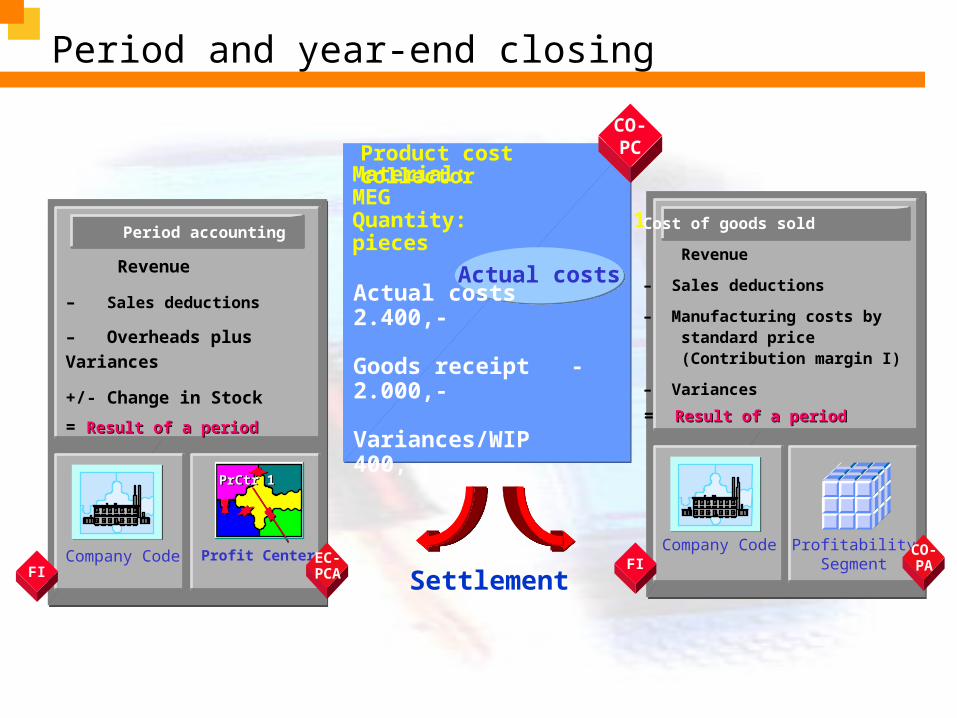
Period and year-end closing
CO-CO-PCPC
Material: MEGQuantity: 10 pieces
Actual costs 2.400,-
Goods receipt -2.000,-
Variances/WIP 400,-
Actual costs
CO-PC
Product cost collector
Period accounting
Revenue
– Sales deductions
– Overheads plus Variances
+/- Change in Stock
= Result of a periodResult of a period
Company Code
PrCtr 1PrCtr 1
Profit CenterFI
EC-PCA
Cost of goods sold
Revenue
– Sales deductions
– Manufacturing costs by standard price (Contribution margin I)
– Variances
= Result of a periodResult of a period
Company Code ProfitabilitySegment
CO-PA
SettlementFI

Period and year-end closing-
PRF
PRA
PRU
PRDCost (price)differences
-
PRF
PRA
PRU
PRYCost (price)differences(mater.ledg
er)
-
PRF
PRA
PRU
PRVMaterialledger
fr.low.levels price dif.
UMBGain/loss
fromrevaluation
LKWAccruals and
defer.acct(material ledger)
GL (PL) 464017Price Diff -Purchasing
GL (PL) 464018Production Variance
GL (PL) 464019Price Diff - Good
Issue
GL (PL) 4640020Price Diff -Transfer
Postings
GL (PL) 464021Gains/Loss on
Inventory Revaluation
GL (BS) 119610ML Provisions
Purchasing,Stock
Movement,Production
Material LedgerClosing - Single
Level
Material LedgerClosing - Multi
Level Level
Material LedgerClosing -
Release FuturePrice
Material LedgerClosing - Do notrevaluate Stock
FI PA
Revenue Revenue
COGS
Input pricevariance
Input quantityvariance
Resource-usagevariance
Remaining inputvariance
Mixed-pricevariance
Output pricevariance
Lot size-/fixed-cost variance
Remainingvariance
Scrap
Price Diff -Purchasing
Price Diff - GoodIssue
Price Diff -Transfer Postings
Gains/Loss onInventory
Revaluation
COGS
ProductionVariances
Adjustmentto COGS
fromcapitalisingVariances
Adjustment toCOGS from
InventoryRevaluation
Gross margin
*
*
*
*
Period and year-end closing
VarianceCategory
PA Assignmentlines
Value FieldCost Element Group
+
+
+
Material Ledger: Overview
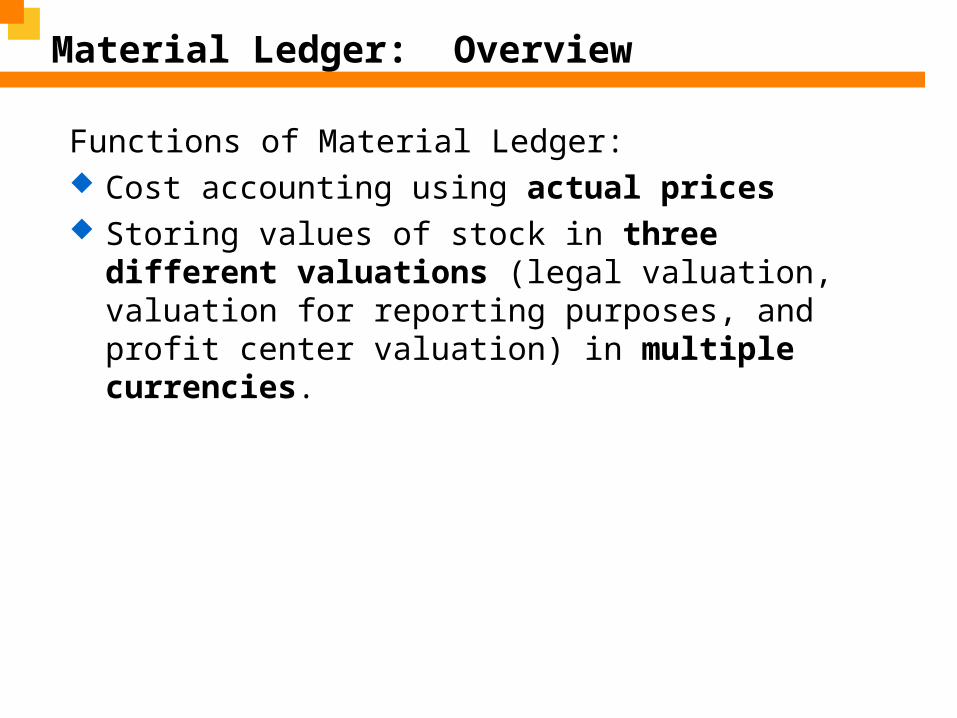
Functions of Material Ledger: Cost accounting using actual prices Storing values of stock in three different valuations
(legal valuation, valuation for reporting purposes, and profit center valuation) in multiple currencies.

Material Ledger: Overview
Functions of Material Ledger: Cost accounting using actual prices Storing values of stock in three different valuations
(legal valuation, group valuation for reporting purposes, and profit center valuation) in multiple currencies.

What is the Material Ledger/Actual Cost Concept?
The Material Ledger(ML) is a tool within the CO Module that collects all transactional data for materials whose master data is stored in the material master. It acts as a subledger for selected materials that captures all goods movements, invoice values, transfers and price changes. On the basis of this data, the material ledger calculates and maintains the actual cost for these materials. This actual cost can then be utilized to valuate the material stock accounts.
Objectives of the Material Ledger
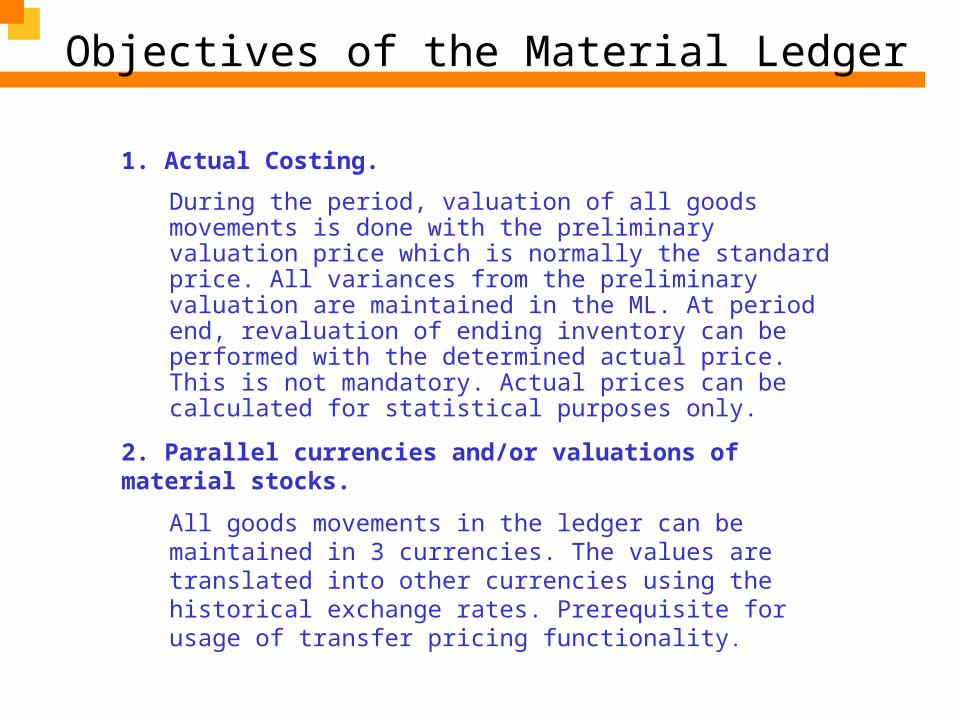
1. Actual Costing.
During the period, valuation of all goods movements is done with the preliminary valuation price which is normally the standard price. All variances from the preliminary valuation are maintained in the ML. At period end, revaluation of ending inventory can be performed with the determined actual price. This is not mandatory. Actual prices can be calculated for statistical purposes only.
2. Parallel currencies and/or valuations of material stocks.
All goods movements in the ledger can be maintained in 3 currencies. The values are translated into other currencies using the historical exchange rates. Prerequisite for usage of transfer pricing functionality.

Benefits of the Material Ledger
►Variances of Finished Goods
Variances from external procurement (purchase orders) as well as from production activities are rolled up from raw and semi-finished materials to the finished goods level.
►To provide support for procurement related decisions.
Detailed reporting for procurement processes and sources possible. Make vs.. Buy, Vendor A vs.. Vendor B. Price History.
►Combines the benefits of Moving Average and Standard Price
Stable prices used for controlling purposes (standard) and actual prices used for valuation purposes (average).
►Easy to use display and error finding by consolidating the views.
Allows quick access to detailed views of material master, standard costs and documents
Benefits of the Material Ledger
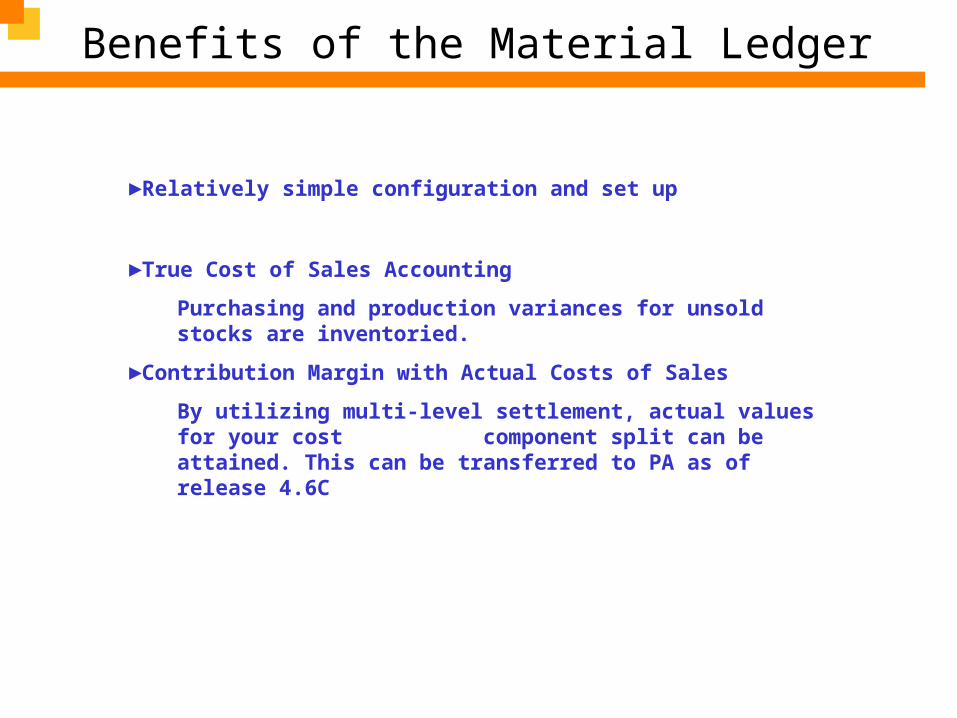
►Relatively simple configuration and set up
►True Cost of Sales Accounting
Purchasing and production variances for unsold stocks are inventoried.
►Contribution Margin with Actual Costs of Sales
By utilizing multi-level settlement, actual values for your cost component split can be attained. This can be transferred to PA as of release 4.6C

Single Level Settlement
ProductionProduction
ProductionProduction
LevelLevelLevelLevel
LevelLevelLevelLevel
LevelLevelLevelLevelExternal ProcurementExternal Procurement
External ProcurementExternal Procurement
LevelLevelLevelLevel
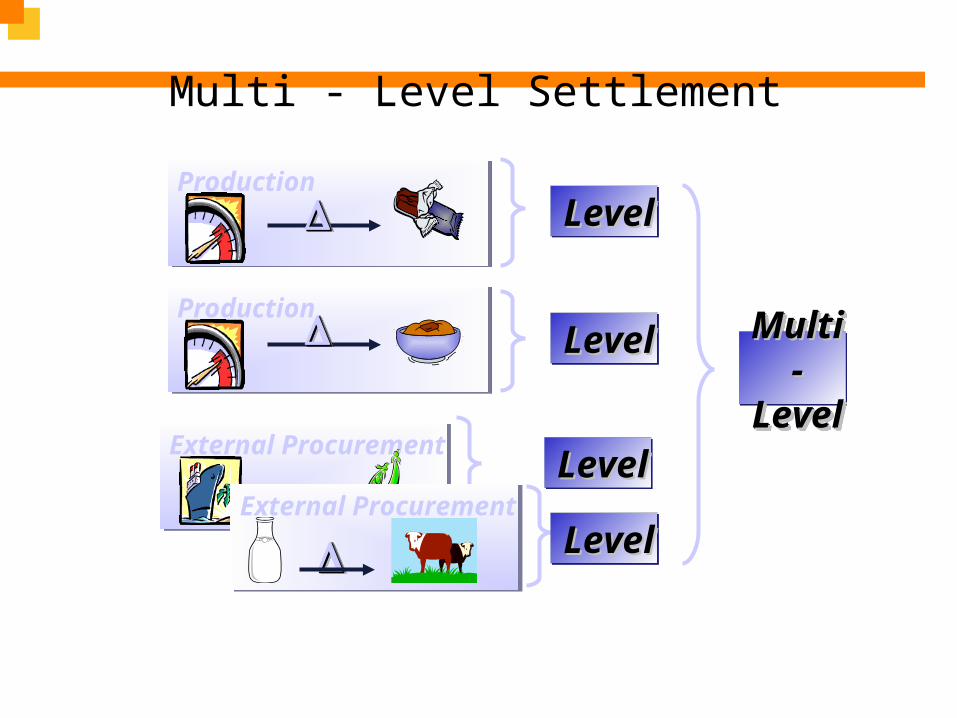
Multi - Level Settlement
ProductionProduction
ProductionProduction
LevelLevelLevelLevel
LevelLevelLevelLevel
LevelLevelLevelLevel
MultiMulti-Level-LevelMultiMulti-Level-Level
External ProcurementExternal Procurement
External ProcurementExternal Procurement
LevelLevelLevelLevel
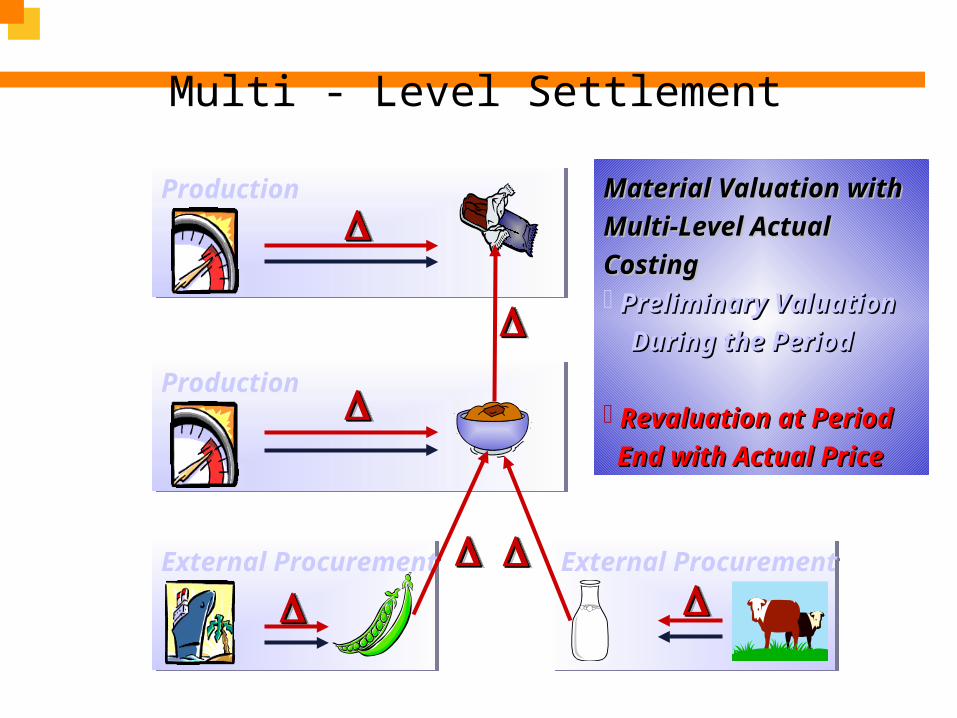
Multi - Level Settlement
External ProcurementExternal Procurement External ProcurementExternal Procurement
ProductionProduction
ProductionProduction
Material Valuation with Material Valuation with
Multi-Level Actual Multi-Level Actual
CostingCosting Preliminary ValuationPreliminary Valuation
During the Period During the Period
Revaluation at Period Revaluation at Period
End with Actual Price End with Actual Price

The ML updates the Material Master
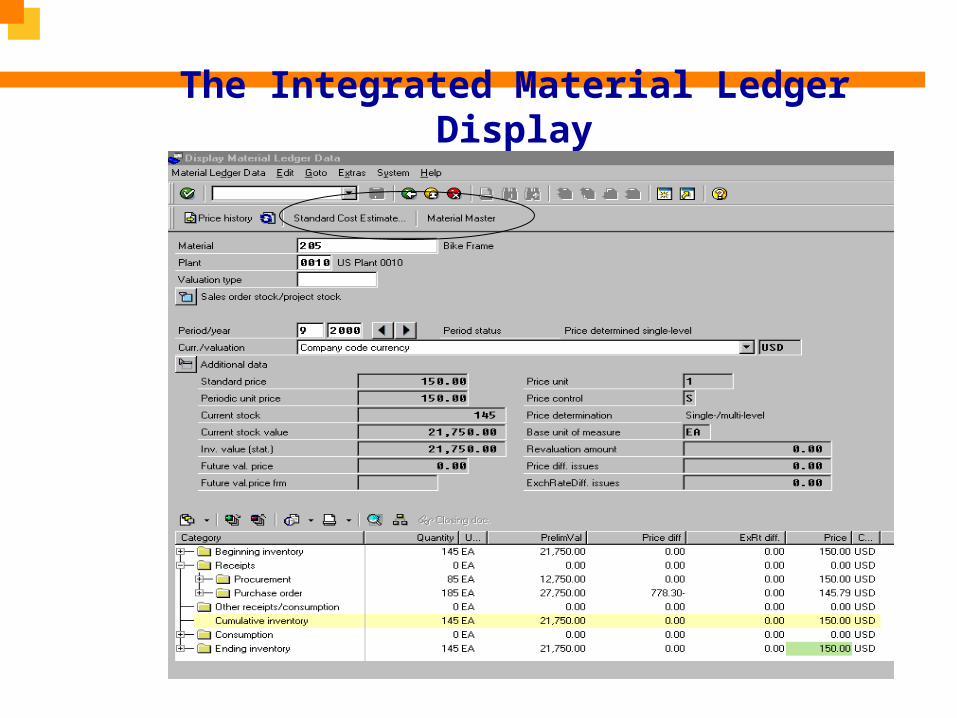
The Integrated Material Ledger Display

Material Ledger Overview
Material LedgerMATERIAL STOCK
Parallel Currencies Translation at historic rates
(up to three)
Parallel Valuations(Transfer Prices) Group Legal Profit Center
Actual CostingRevaluation of stock at
actual prices or accrual of variances.

ML Overview – Parallel Currencies
Material Ledger(Valuation Area / Plant)
• 10 Local currency
• 30 Group currency
Financial Accounting (Company Code)
• 10 Local currency
• 30 Group currency
Controlling (Controlling Area)
• 10 Local currency
• 30 Group currency

Price Control
Price control
Moving average price (V Price)
• Changed after every receipt
• Recommended for raw and externally procured
materials.
Standard Price (S Price)
• Stable for long period
• Recommended for finished and semi-finished
products.
MaterialMaster

Price control
Moving average price
The stock value is adjusted each time are received Real-time price fluctuations are posted to stock Price difference postings only takes place in exceptional cases
Price fluctuations can not be adjusted to the finished products of higher levels (in case S price)
Only recommended for raw materials or goods procured externally (real-time price for goods receipt known)
False entries with severe consequences (compounded errors) Danger of incorrect valuations with delayed invoice receipt

Price control
Standard Price
All stock postings takes place with the standard price Price remains constant by at least one period Price fluctuations do not debit / credit the cost object Consistent controlling with the standard price as a bench mark Estimations of the standard prices with cost component split Recommended for all materials types
Price differences can not be subsequently adjusted to the ending inventories or the consumed products (very important in the Cost of Goods Sold accounting)
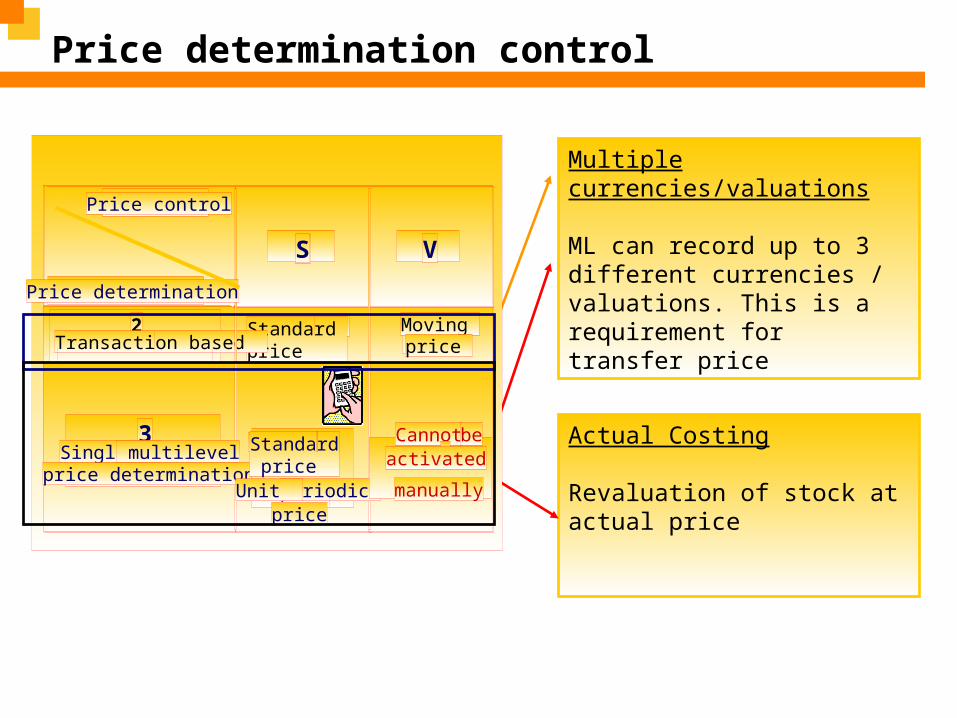
Price determination control
Multiple currencies/valuations
ML can record up to 3 different currencies / valuations. This is a requirement for transfer price
Actual Costing
Revaluation of stock at actual price
SS VV
Standard price
Moving price
2Transaction based
Price control
Price determination
3Single-/ multilevel
price determination
Standard Standard price
periodic Unit price
Cannot
beactivated
manually

Price determination control
Cost centers Internalorders
Activitytypes
Orders
Cost centers Internalorders
Activitytypes
Orders
External Procurement
Level 3
Level 2
Level 1
‘V’
‘S’
‘S’‘3’
‘3’
‘2’

Actual Values Overview
Actual data -> Actual Costing Overview Preliminary valuation price Actual Costing
Price differences
Updating single-level variances Single-level price determination Multilevel price determination

Actual Values Overview
Actual data -> Actual Costing Overview Preliminary valuation price Actual Costing
Price differences
Updating single-level variances Single-level price determination Multilevel price determination

Preliminary valuation price
Cost centers Internalorders
Activitytypes
Orders
Cost centers Internalorders
Activitytypes
Orders
External Procurement
Level 2
Level 1
Actual Costs Preliminary valuation
‘V’
‘S’
‘S’

Actual Values Overview
Actual data -> Actual Costing Overview Preliminary valuation price Actual Costing
Price differences
Updating single-level variances Single-level price determination Multilevel price determination
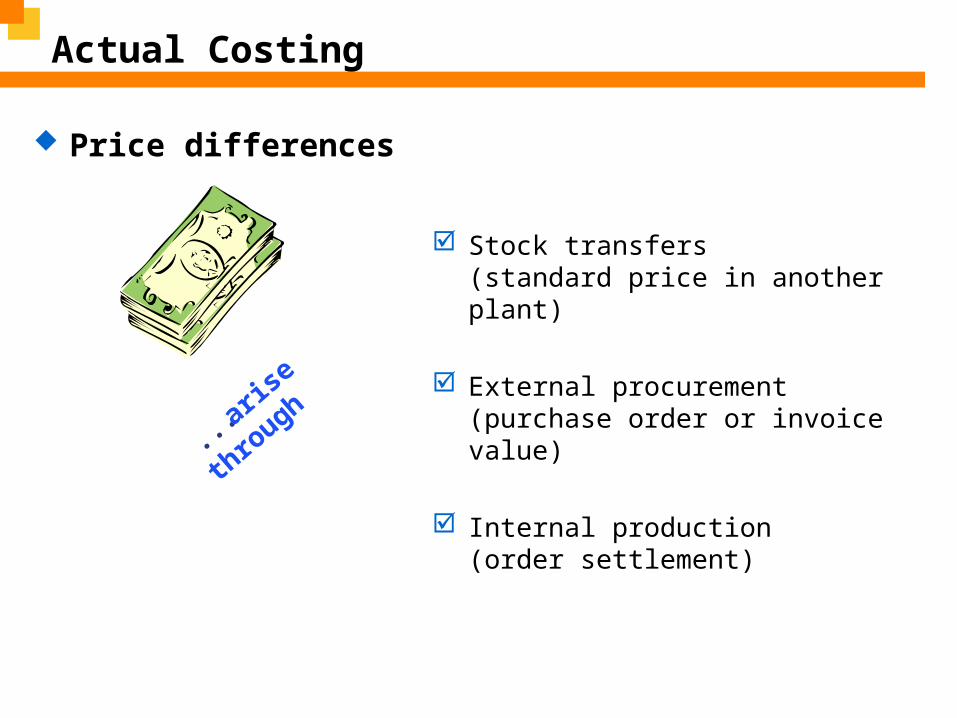
Actual Costing
Price differences
...arise
through
Stock transfers(standard price in another plant)
External procurement(purchase order or invoice value)
Internal production(order settlement)

Actual Values Overview
Actual data -> Actual Costing Overview Preliminary valuation price Actual Costing
Price differences
Updating single-level variances Single-level price determination Multilevel price determination
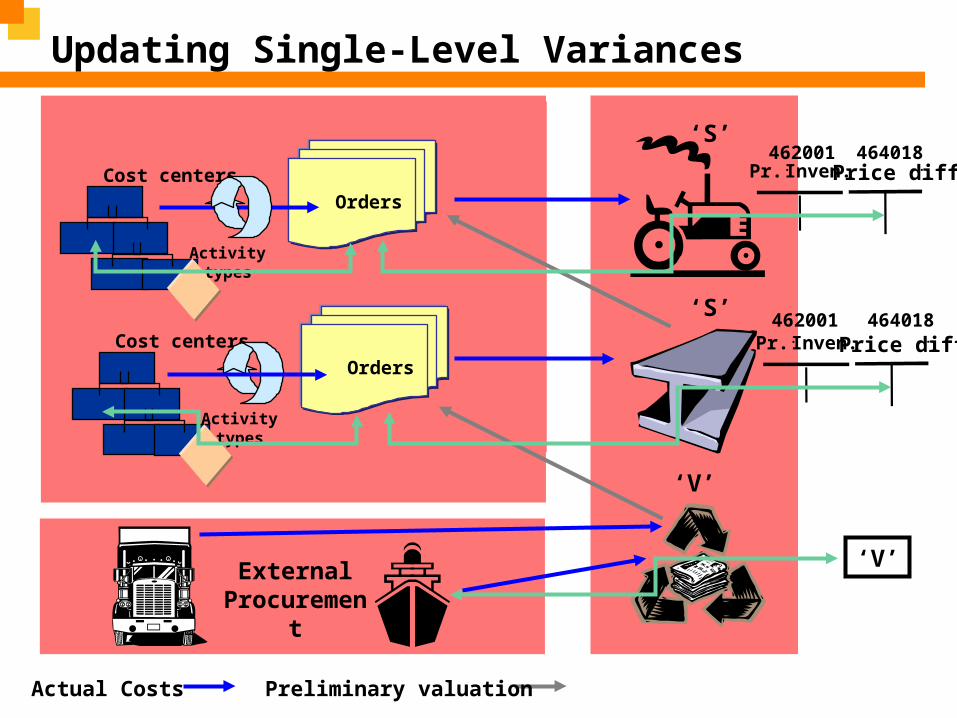
Updating Single-Level Variances
Cost centers Internalorders
Activitytypes
Orders
Cost centers Internalorders
Activitytypes
Orders
External Procurement
Actual Costs Preliminary valuation
‘V’
‘S’
‘S’
Pr. . Inven.. Price diff..
Pr. . Inven.. Price diff..
462001 464018
464018462001
‘V’

Actual Values Overview
Actual data -> Actual Costing Overview Preliminary valuation price Actual Costing
Price differences
Updating single-level variances Single-level price determination Multilevel price determination

Single-Level Price Determination
Cost centers Internalorders
Activitytypes
Orders
Cost centers Internalorders
Activitytypes
Orders
External Procurement
Actual Costs Preliminary valuation
‘V’
‘S’
‘S’
End. Inven.. Price diff..
End. Inven.. Price diff..
119490 464017
464017119430
Price differences
are not applicable

Actual Values Overview
Actual data -> Actual Costing Overview Preliminary valuation price Actual Costing
Price differences
Updating single-level variances Single-level price determination Multilevel price determination
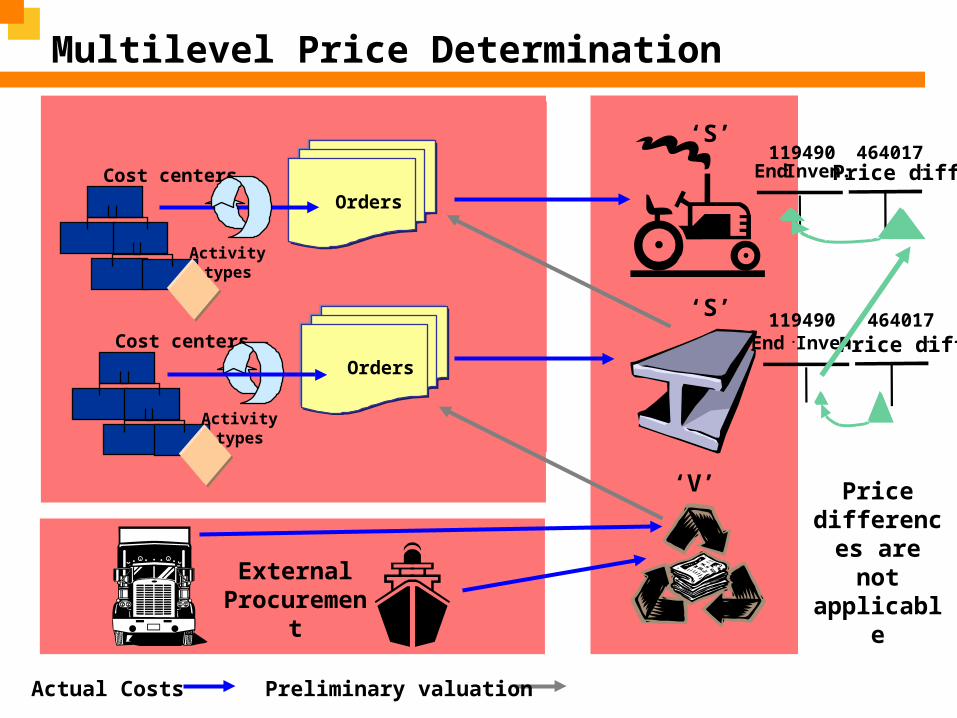
Multilevel Price Determination
Cost centers Internalorders
Activitytypes
Orders
Cost centers Internalorders
Activitytypes
Orders
External Procurement
Actual Costs Preliminary valuation
‘V’
‘S’
‘S’
End. Inven.. Price diff..
End Inven.. . Price diff..
119490 464017
464017119490
Price differences
are not applicable

Period End Overview
Actual Costing – Period End Closing Procedure Collecting price differences
On price difference accounts or in material ledger within categories Period closing program
Open new period in MM (transaction MMPV) Determining prices
Single-level, later multilevelV price is calculated
Making closing entryMust be made for each periodPosting to prior period is no longer possibleReversal if required
With revaluationPrice differences are proportionally posted to the remaining stock -> Price indicator ‘V’
Without revaluationPrice differences are proportionally posted to the accruals account -> Price indicator ‘S’
Marking future price

Period End Overview – Closing Entry (1)
Beginning inventory (BI): 1000 PC / 250 SARGoods receipt/purchase order : 1000 PC / 260 SARInvoice receipt : 1000 PC / 280 SARConsumption: 1300 PC / 325 SAREnding inventory: 700 PC
Material: ACT-LCD##
VB 325
Material stock (119400)325 250
250
GR/IR allocation
260 260
Vendor
280
Price difference (464017)
10 20
Status: Closing entry performedPrice control: V (only old periods)
V price: 26.50 SAR / 100 units
ML accrual (119610)
10.5
Stock value :185.5 SAR
(700 PC * 26.50/100)
10.5CL
CL
locked
With Revaluation
Material consumption(400002)
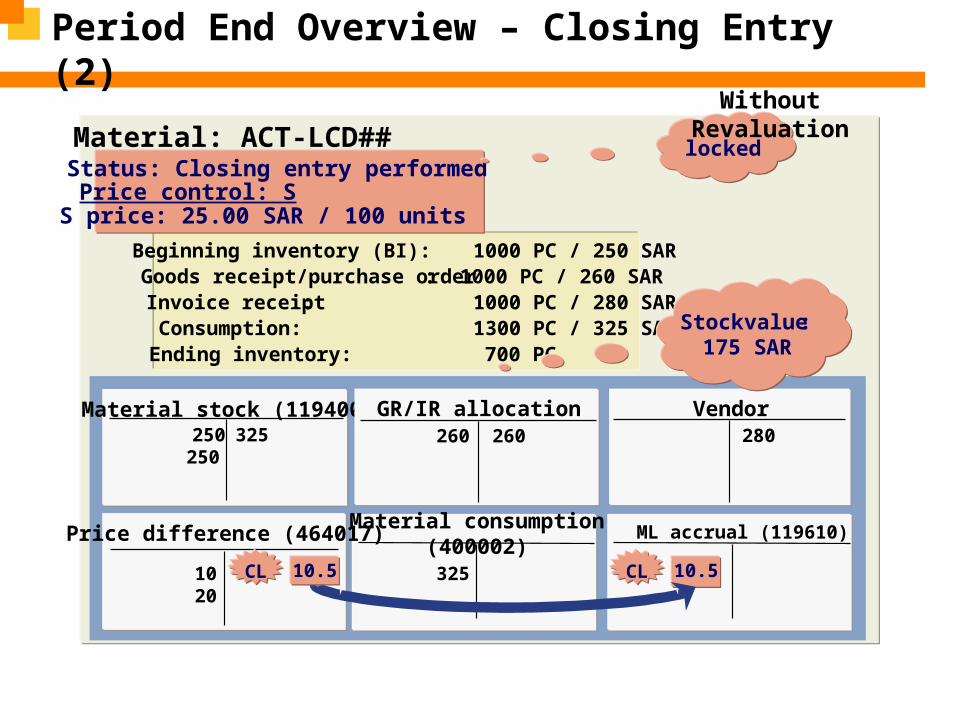
Period End Overview – Closing Entry (2)
Beginning inventory (BI): 1000 PC / 250 SARGoods receipt/purchase order: 1000 PC / 260 SARInvoice receipt: 1000 PC / 280 SAR Consumption: 1300 PC / 325 SAREnding inventory: 700 PC
Material: ACT-LCD##
325
Material stock (119400)325 250
250
GR/IR allocation 260 260
Vendor280
Price difference (464017)
10 20
ML accrual (119610)
Stock value:175 SAR
10.5CL CL
Status: Closing entry performedPrice control: SS price: 25.00 SAR / 100 units
locked
10.5
Without Revaluation
Material consumption(400002)
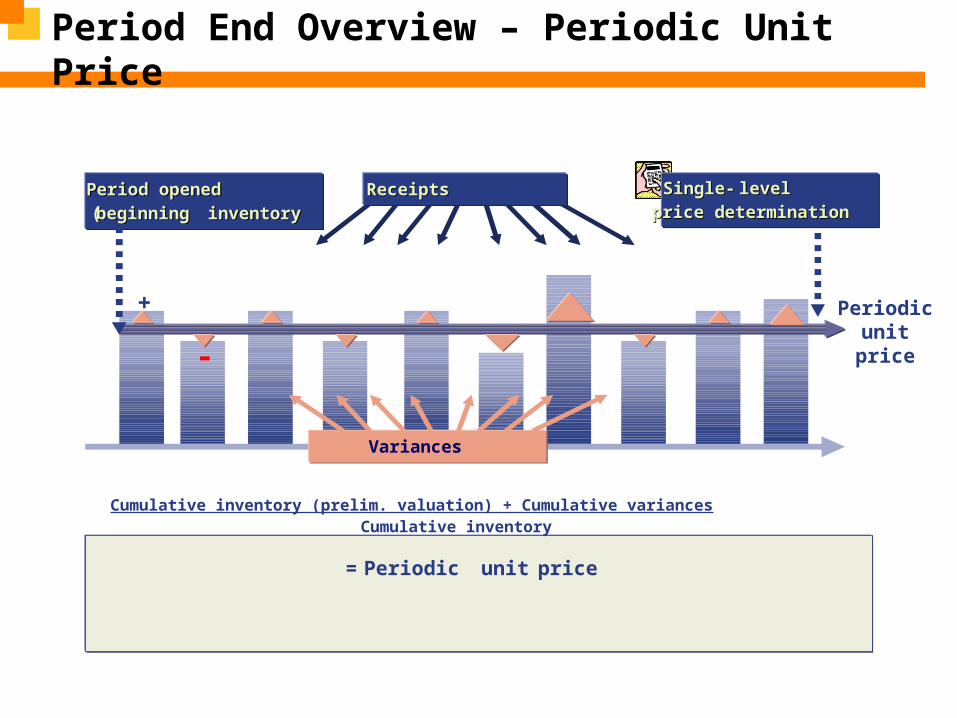
Period End Overview – Periodic Unit Price
ReceiptsReceiptsPeriod openedPeriod opened
(( beginningbeginning inventoryinventory
Single-Single- levellevel
price determinationprice determination
Variances
Cumulative inventory (prelim. valuation) + Cumulative variancesCumulative inventory
= Periodic unit price
Periodicunit
price
+
-
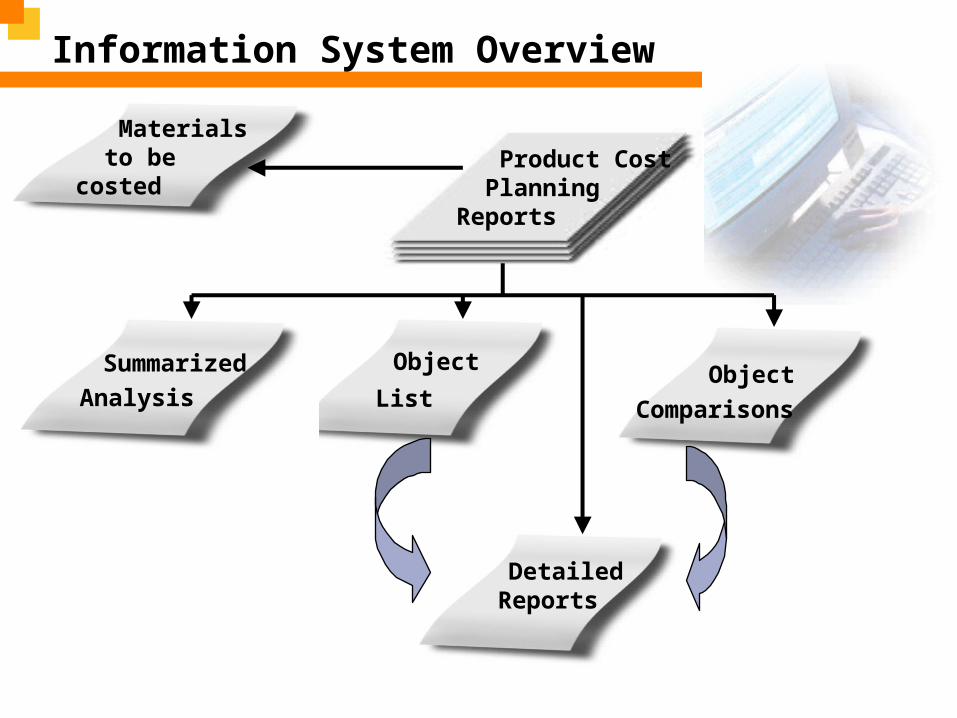
DetailedReports
Object
ListObject
Comparisons
Materials to be costed
Summarized
Analysis
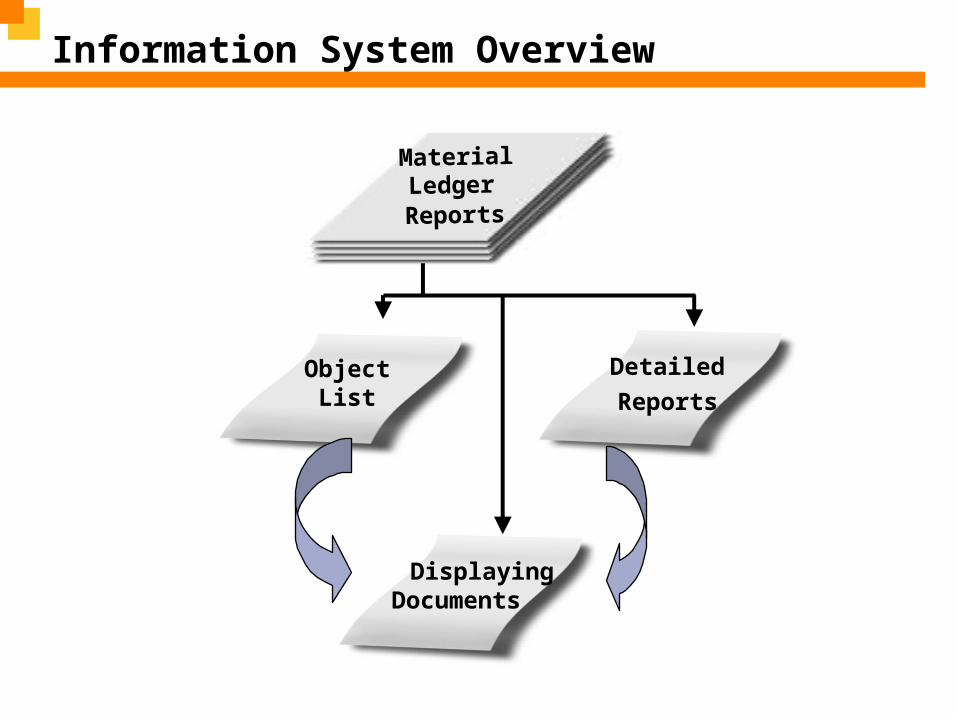
Information System Overview
Product Cost PlanningReports
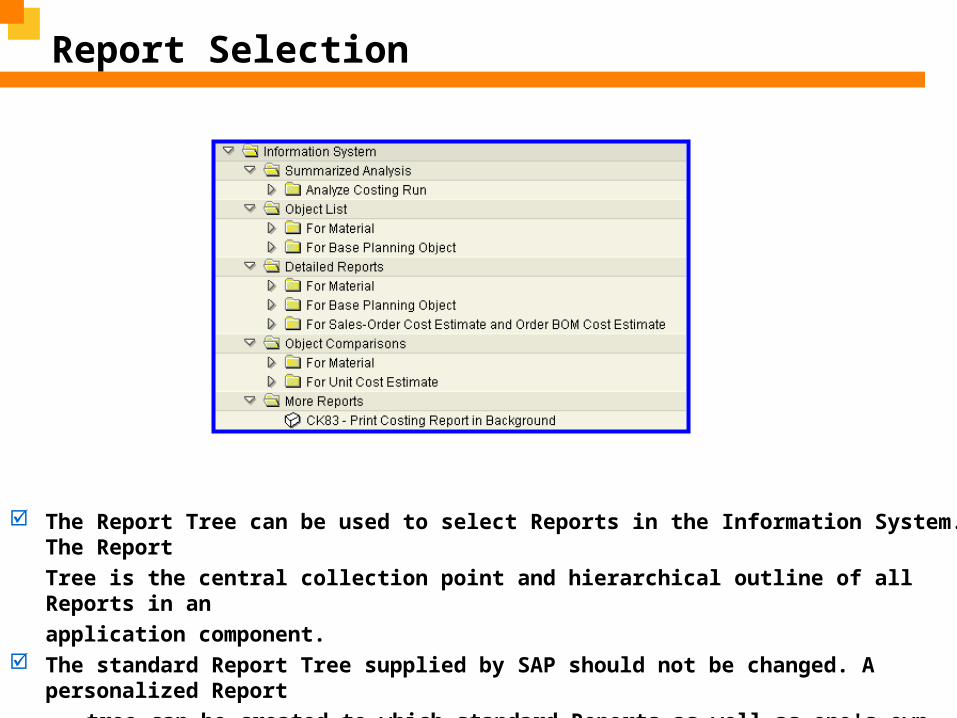
Report Selection
The Report Tree can be used to select Reports in the Information System. The Report
Tree is the central collection point and hierarchical outline of all Reports in an
application component. The standard Report Tree supplied by SAP should not be changed. A personalized Report
tree can be created to which standard Reports as well as one's own creations can be assigned.

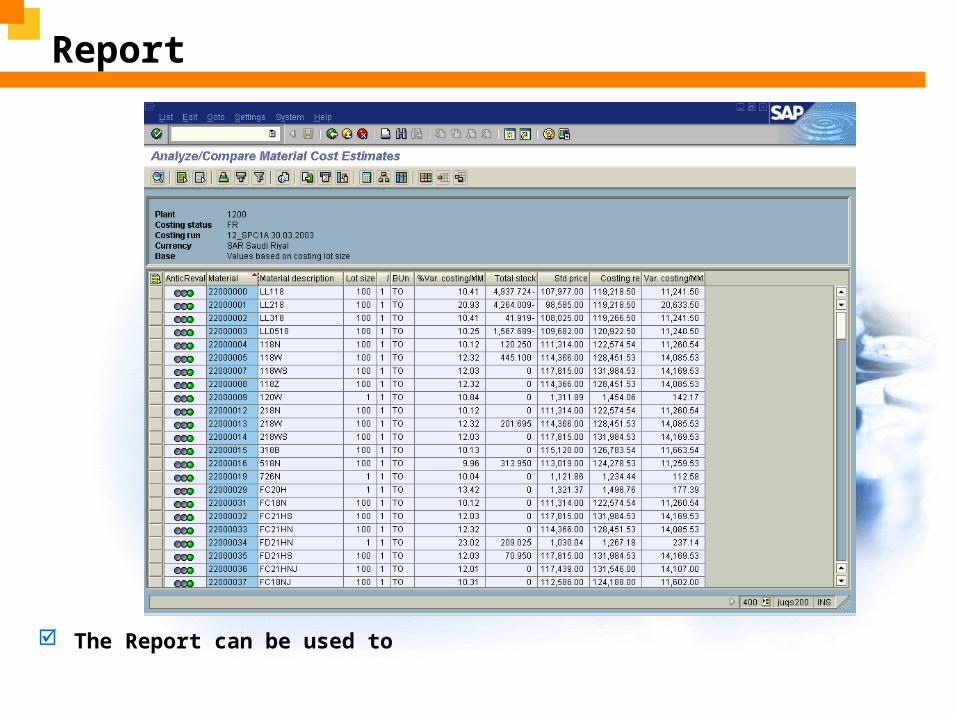
Report
The Report can be used to

Report
The Report can be used to
Report
The Report can be used to

Report
The Report can be used to

DetailedReports
Object
ListObject
Comparisons
Materials to be costed
Summarized
Analysis
Information System Overview
Product Cost PlanningReports

Information System Overview

DisplayingDocuments
MaterialLedgerReports
ObjectList Reports
Detailed
Information System Overview

DetailedReports
Object
ListObject
Comparisons
Materials to be costed
Summarized
Analysis
Information System Overview
Product Cost PlanningReports

Report Selection
The Report Tree can be used to select Reports in the Information System. The Report
Tree is the central collection point and hierarchical outline of all Reports in an
application component. The standard Report Tree supplied by SAP should not be changed. A personalized Report
tree can be created to which standard Reports as well as one's own creations can be assigned.

Information System Overview
DisplayingDocuments
MaterialLedgerReports
ObjectList Reports
Detailed
Information System Overview

Report Output Types
Graphical report-output Variable output areas HTML-header Navigation by drag and drop and
context menu
Object List (ALV) Various leads columns Standard ALV Functions
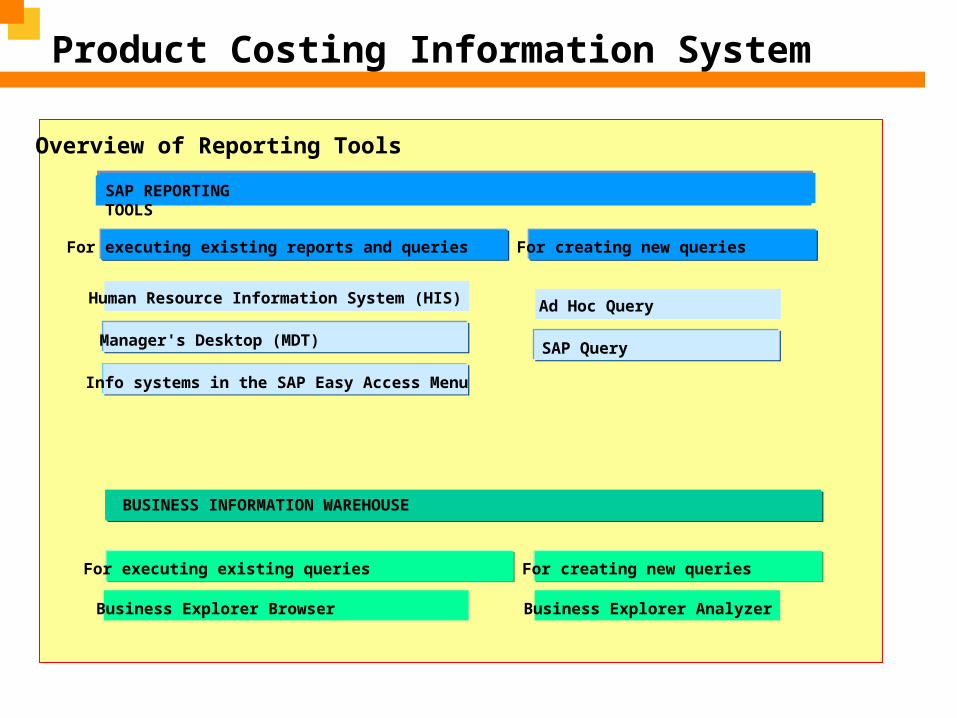
Product Costing Information System
Overview of Reporting Tools
SAP REPORTING TOOLS
For executing existing reports and queries For creating new queries
Human Resource Information System (HIS)
Manager's Desktop (MDT)
Info systems in the SAP Easy Access Menu
Ad Hoc Query
SAP Query
BUSINESS INFORMATION WAREHOUSE
For executing existing queries For creating new queries
Business Explorer Browser Business Explorer Analyzer

Product Cost Planning Reporting
SAP Standard Reports
SAP report: Employee List
SAP report: Birthday List
SAP report: Events
SAP report: Org. Units
SAP report: Telephone List
Customer report: Vehicles
Customer report:Distribution Channels
Customer report: Buildings
Customer report: Insurance
Ad Hoc Queries Custom-built Reports
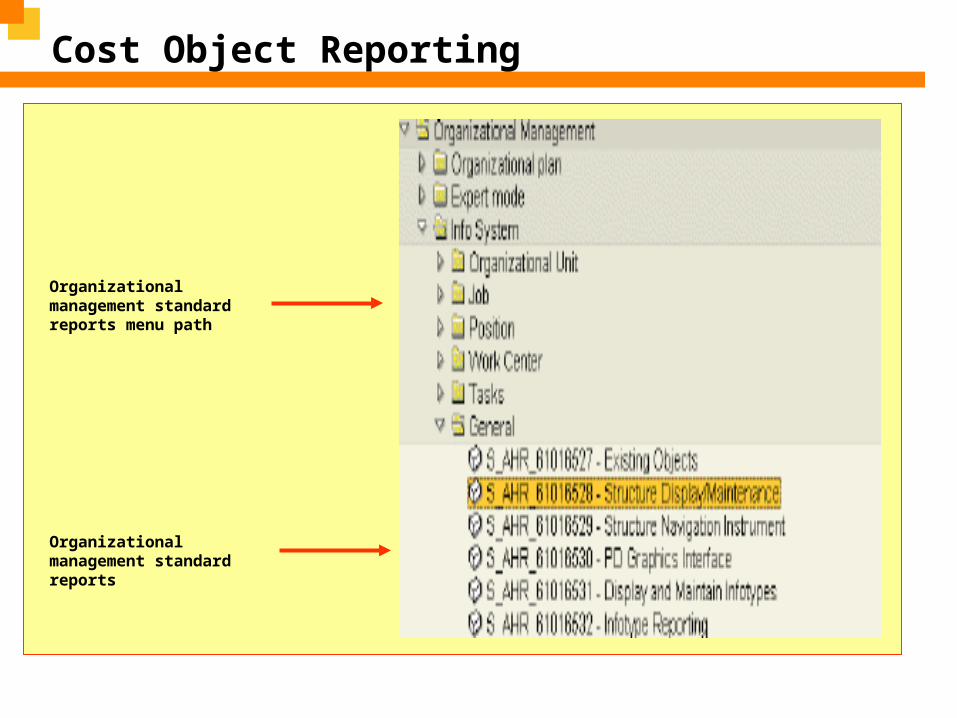
Cost Object Reporting
SAP Standard Reports
Organizational management standard reports menu path
Organizational management standard reports
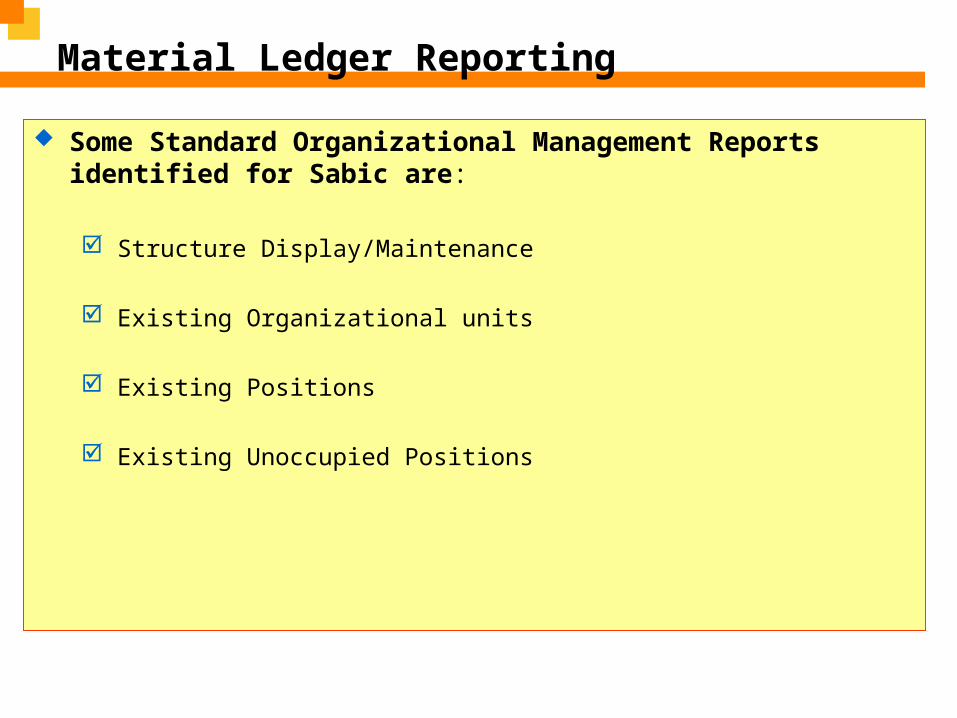
Material Ledger Reporting
Some Standard Organizational Management Reports identified for Sabic are:
Structure Display/Maintenance
Existing Organizational units
Existing Positions
Existing Unoccupied Positions


