12
1 © De Villiers Walton Limited 2014 SAP LUMIRA VS. MICROSOFT POWERPIVOT
| Date post: | 20-Aug-2015 |
| Category: |
Software |
| Upload: | de-villiers-walton |
| View: | 535 times |
| Download: | 6 times |

1 © De Villiers Walton Limited 2014
SAP LUMIRA VS.
MICROSOFT
POWERPIVOT

2 © De Villiers Walton Limited 2014
TABLE OF CONTENTS
Introduction ................................................................................................................ 3
Data Sources ............................................................................................................. 3
Look and Feel ............................................................................................................ 3
Data Acquisition Steps ............................................................................................... 5
SAP Lumira ............................................................................................................. 5
Microsoft PowerPivot .............................................................................................. 7
SAP Lumira ........................................................................................................... 10
Microsoft PowerPivot ............................................................................................ 11
Conclusion ............................................................................................................... 11
About De Villiers Walton ........................................................................................... 12

3 © De Villiers Walton Limited 2014
INTRODUCTION
In our recent blogs, we’ve been banging the drum for Microsoft PowerPivot as a
cost-effective enabler of flexible reporting and self-service BI. As an SAP consulting
partner that specializes in SAP Business Intelligence it would be remiss of us to
ignore SAP Lumira, the latest incarnation of the data visualisation tool formerly
known as SAP Visual Intelligence.
In this article then, we will compare the features offered within Lumira with those
offered in PowerPivot.
DATA SOURCES
The table below shows that SAP Lumira and Microsoft PowerPivot provide access to
similar datasets.
Out of the box, Lumira does offer better connection to SAP data, providing it is either
in HANA or accessible via a Business Objects Universe. Other SAP databases have
to be accessed via the Freehand SQL option.
While PowerPivot does not offer out of box integration with SAP this can easily be
resolved using tools such as the DVW PowerPivot Connector for SAP.
SAP Lumira Microsoft Excel PowerPivot
.CSV .CSV
Microsoft Excel Microsoft Excel
All Relational Databases via Freehand SQL (this includes SAP databases)
All Relational Databases (specific links for Microsoft)
SAP HANA Analysis Services
SAP Business Objects Universe Reporting Services
Azure DataMarket
Text Files
SAP – via PPCS (includes BW query data)
LOOK AND FEEL
SAP Lumira is an HTML5 based tool and, as such, the user interface is in our
opinion more pleasing than that of the Microsoft Excel based PowerPivot. Having
said that Excel is Excel and is so well established with business users globally that
the look and feel is probably irrelevant.

4 © De Villiers Walton Limited 2014
The SAP Lumira welcome screen is shown in the next screenshot:
The Microsoft PowerPivot add-in window is follows:

5 © De Villiers Walton Limited 2014
DATA ACQUISITION STEPS
SAP LUMIRA
In SAP Lumira, the steps to import data are logical and are explained on the
welcome screen so the user is clear on what to do. First, click the
button, which presents the choices for which Data Source is to be used as follows:
Click on the choice, in this example MS Excel, and browse for the file to be imported.
Once the file is located, you are presented with the following information.
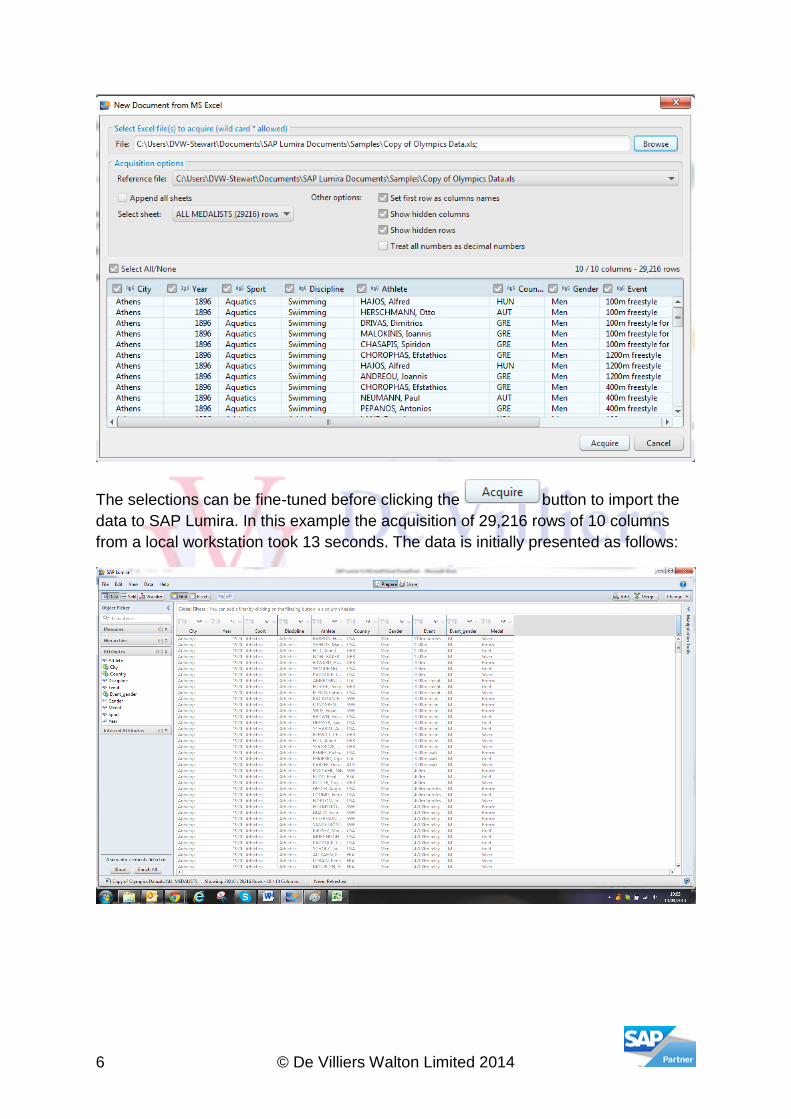
6 © De Villiers Walton Limited 2014
The selections can be fine-tuned before clicking the button to import the
data to SAP Lumira. In this example the acquisition of 29,216 rows of 10 columns
from a local workstation took 13 seconds. The data is initially presented as follows:

7 © De Villiers Walton Limited 2014
MICROSOFT POWERPIVOT
In Microsoft PowerPivot, the initial selection of data source is from the ‘Get External
Data’ section of the toolbar.
To import a new Excel file click the icon. You are then able to
select which data source to be imported via the table import wizard.

8 © De Villiers Walton Limited 2014
Click the option to Import data from an Excel file and you are then asked to browse
for the file. Once found and selected the wizard presents you with a selection screen
where you select which files relating to the Excel file should be imported. You can
also preview the data prior to importing it by clicking the button.

9 © De Villiers Walton Limited 2014
The following is the Preview and Filter screen.
Once you have selected the columns click OK and return to the selection screen
where clicking the wizard continues to the final screen and clicking finish will start the
data acquisition. Note that at this stage, unlike SAP Lumira, you are not advised how
much data will be imported.
In this example, the acquisition of 29,216 rows of 10 columns from a local
workstation took 6 seconds, which is twice as fast as SAP Lumira.
The data is initially presented as follows:

10 © De Villiers Walton Limited 2014
SAP LUMIRA
The data imported did not have any measures so in order to obtain the required
analysis the column medal was converted to allow a count. This was a simple
exercise using manipulation tools provided on the right side of the screen. Filtering
allowed the drilldown to the required level and a split screen option allowed the
results to be displayed in tabular and graphical format.

11 © De Villiers Walton Limited 2014
MICROSOFT POWERPIVOT
The data was taken into an Excel Pivot Table and standard pivot table functionality
was utilised to filter and drill the data to the appropriate level.
A graph was added in the same view. We were able to add a further graph in the
same window, which was not possible with SAP Lumira.
CONCLUSION
Both tools offer excellent data analysis capability albeit through different user
interface approaches. For users who are used to pivot tables in Excel then
PowerPivot offers a friendly and familiar interface. The look and feel of Lumira
however, is much more contemporary. Lumira also offers some additional graph
options that are not available in PowerPivot.
Microsoft PowerPivot is a free add-in to Microsoft Excel 2010. So, if your business is
already invested in Microsoft then PowerPivot seems a very logical choice. For SAP
and Microsoft customers the key weakness is easy access to SAP data within
PowerPivot. There are a few methods to enable this. We recommend you consider
the PowerPivot Connector for SAP.
SAP Lumira offers a free personal edition, which allows connectivity to Excel and
.CSV files. A licence is required for a standard edition, which allows database
connections. We do feel that SAP HANA customers are best placed to get the most
out of SAP Lumira at this stage. Take a look at the SAP website for current pricing.

12 © De Villiers Walton Limited 2014
ABOUT DE VILLIERS WALTON
De Villiers Walton is an SAP services partner. We design, implement, and integrate
SAP solutions; optimize business processes; and provide strategic business
consultation for our customers.
We have proven expertise in SAP Business ByDesign, SAP Business Intelligence,
SAP Customer for Cloud, SAP Customer Relationship Management, SAP E-
Commerce, and SAP HANA.
Visit our website: www.dvwsolutions.com
Read our blog: http://www.dvwsolutions.com/blog.html
Contact us: http://www.dvwsolutions.com/contact-us.html
Email us: [email protected]


