17
| Sappi | Debt Update | March 2013 1 Sappi Limited Debt Update March 2013
| Sappi | Debt Update | March 2013 1
Sappi Limited
Debt Update
March 2013
| Sappi | Debt Update | March 2013 2
Forward looking statements
Certain non-GAAP financial information is contained in this presentation that management believe may be useful in comparing the company’s
operating results from period to period. Reconciliation's of certain of the non-GAAP measures to the corresponding GAAP measures can be
found in the quarterly results booklet for the relevant period. These booklets are located in the ‘Investor Info’ section of www.sappi.com.
Regulation G disclosure
Certain statements in this release that are neither reported financial results nor other historical information, are forward-looking statements, including
but not limited to statements that are predictions of or indicate future earnings, savings, synergies, events, trends, plans or objectives. The words
“believe”, “anticipate”, “expect”, “intend”, “estimate”, “plan”, “assume”, “positioned”, “will”,
“may”, “should”, “risk” and other similar expressions, which are predictions of or indicate future events and future trends, which do not relate to
historical matters, identify forward-looking statements. You should not rely on forward-looking statements because they involve known and unknown
risks, uncertainties and other factors which are in some cases beyond our control and may cause our actual results, performance or achievements to
differ materially from anticipated future results, performance or achievements expressed or implied by such forward-looking statements (and from
past results, performance or achievements). Certain factors that may cause such differences include but are not limited to:
• the highly cyclical nature of the pulp and paper industry (and the factors that contribute to such cyclicality, such as levels of demand, production
capacity, production, input costs including raw material, energy and employee costs, and pricing);
• the impact on our business of the global economic downturn;
• unanticipated production disruptions (including as a result of planned or unexpected power outages);
• changes in environmental, tax and other laws and regulations;
• adverse changes in the markets for our products;
• the emergence of new technologies and changes in consumer trends including increased preferences for digital media;
• consequences of our leverage, including as a result of adverse changes in credit markets that affect our ability to raise capital when needed;
• adverse changes in the political situation and economy in the countries in which we operate or the effect of governmental efforts to address
present or future economic or social problems;
• the impact of restructurings, investments, acquisitions, dispositions and other strategic initiatives (including related financing), any delays,
unexpected costs or other problems experienced in connection with dispositions or with integrating acquisitions or implementing restructuring or
strategic initiatives (including our announced dissolving wood pulp conversion projects), and achieving expected savings and synergies; and
• currency fluctuations.
We undertake no obligation to publicly update or revise any of these forward-looking statements, whether to reflect new information or future events
or circumstances or otherwise.
| Sappi | Debt Update | March 2013 3
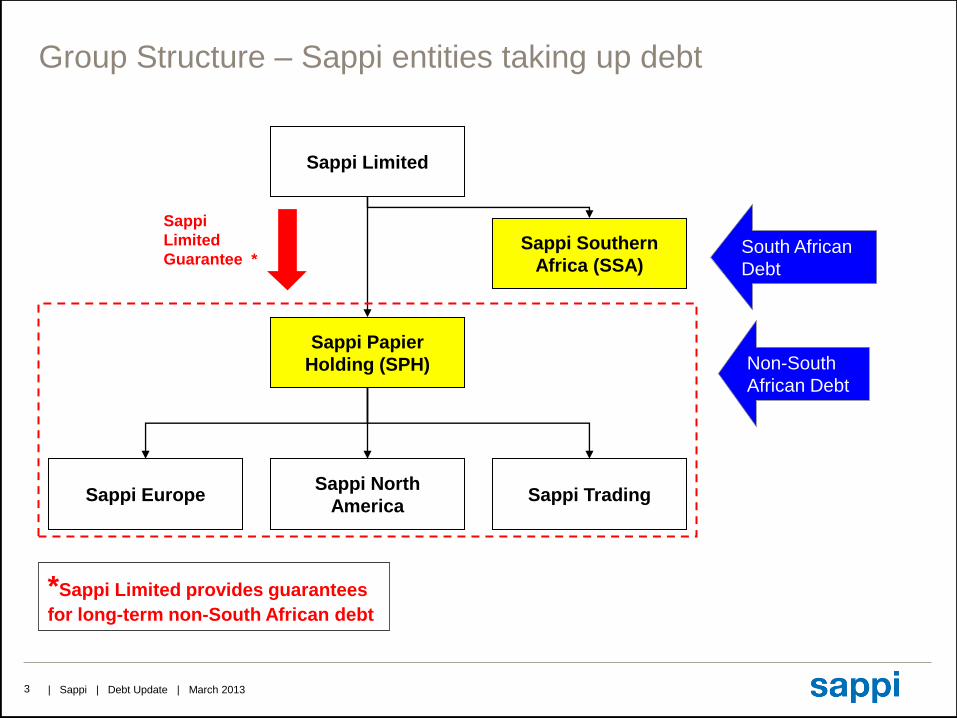
Group Structure – Sappi entities taking up debt
Sappi Limited
Sappi Southern
Africa (SSA)
Sappi Papier
Holding (SPH)
Sappi Trading Sappi North
America Sappi Europe
Sappi
Limited
Guarantee * South African
Debt
Non-South
African Debt
*Sappi Limited provides guarantees
for long-term non-South African debt
| Sappi | Debt Update | March 2013 4
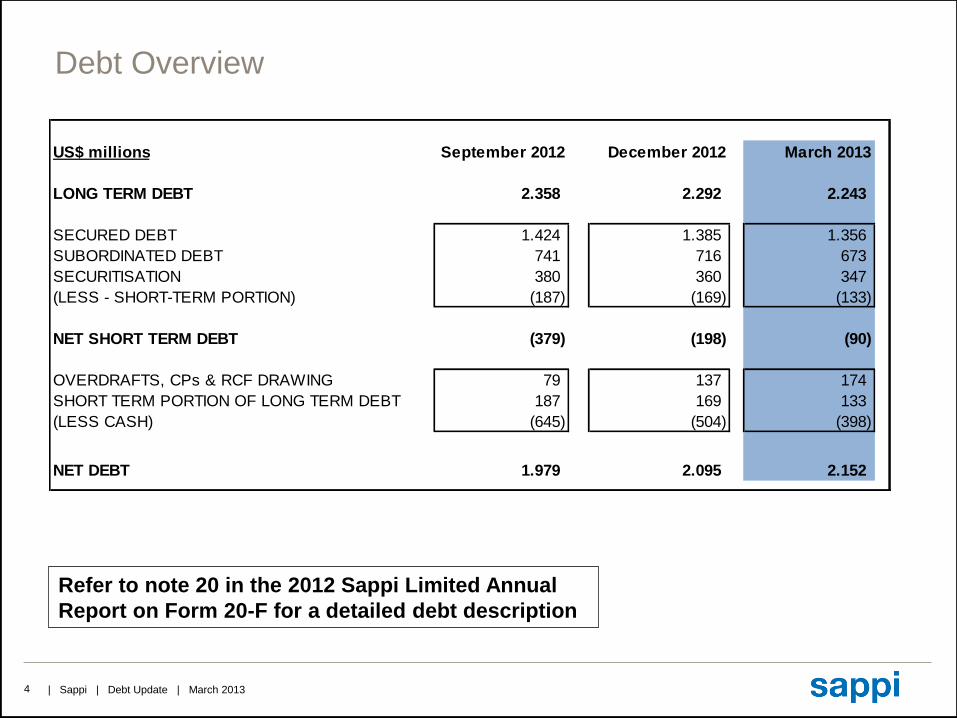
Debt Overview
Refer to note 20 in the 2012 Sappi Limited Annual
Report on Form 20-F for a detailed debt description
US$ millions September 2012 December 2012 March 2013
LONG TERM DEBT 2.358 2.292 2.243
SECURED DEBT 1.424 1.385 1.356
SUBORDINATED DEBT 741 716 673
SECURITISATION 380 360 347
(LESS - SHORT-TERM PORTION) (187) (169) (133)
NET SHORT TERM DEBT (379) (198) (90)
OVERDRAFTS, CPs & RCF DRAWING 79 137 174
SHORT TERM PORTION OF LONG TERM DEBT 187 169 133
(LESS CASH) (645) (504) (398)
NET DEBT 1.979 2.095 2.152

| Sappi | Debt Update | March 2013 5
Detailed Debt Summary – March 2013
US$ millions
Non USD
Debt
USD
Amount
Sappi Southern Africa Long Term Debt R2,565 278
2017 Bond - US$ (swapped to €) 400
2018 Bond - Euro € 250 321
2019 Bond - US$ (swapped to €) 300
2021 Bond - US$ 350
2032 Bond 221
OeKB Term Loan € 136 174
Securitised Receivables EUR € 176 226
Securitised Receivables USD 121
Sappi Europe Leases € 3 4
IFRS Adjustments (upfront fees and discounts on Bonds) (18)
Long Term Debt 2.376
less Short Term Portion of Long Term Debt (133)
Total Long Term Debt 2.243
Short Term Loans & Overdrafts (excl. South Africa) 75
Short Term Loans & Overdrafts South Africa 99
Short Term Portion of Long Term Debt (All South Africa) 133
LESS Cash - Sappi South Africa (92)
LESS Cash - Sappi Group (excl. South Africa) (306)
NET DEBT AT MARCH 2013 2.152
Consists of an
OeKB Trade
Finance facility in
Austria, which is
rolled quarterly
Debt secured by security package, see slide 12
Consists mainly of
a South African
RCF drawing and
commercial paper
issued in South
Africa.

| Sappi | Debt Update | March 2013 6
Net Debt Movement
US$ million
Q2 Mar 2013
Net Debt - beginning of period 2.095
Net Cash utilised during the period 99
Currency, fair value and other (42)
Net Debt - March 2013 2.152
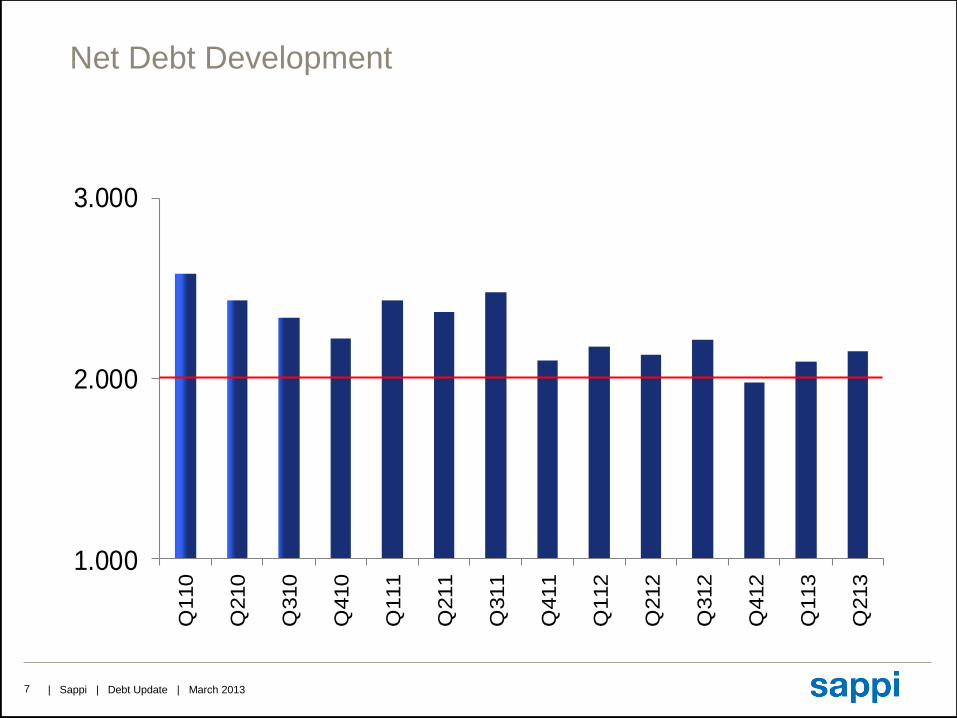
| Sappi | Debt Update | March 2013 7
Net Debt Development
1.000
2.000
3.000Q
110
Q210
Q310
Q410
Q111
Q211
Q311
Q411
Q112
Q212
Q312
Q412
Q113
Q213
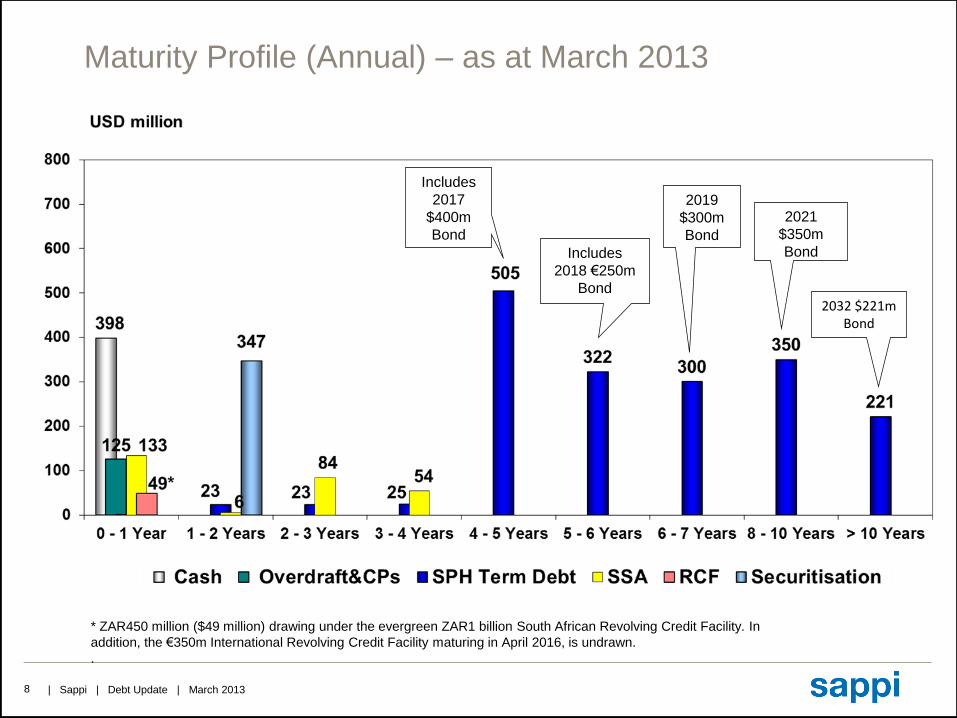
| Sappi | Debt Update | March 2013 8
Maturity Profile (Annual) – as at March 2013
2032 $221m Bond
Includes
2018 €250m
Bond
2021
$350m
Bond
2019
$300m
Bond
Includes
2017
$400m
Bond
* ZAR450 million ($49 million) drawing under the evergreen ZAR1 billion South African Revolving Credit Facility. In
addition, the €350m International Revolving Credit Facility maturing in April 2016, is undrawn.
.
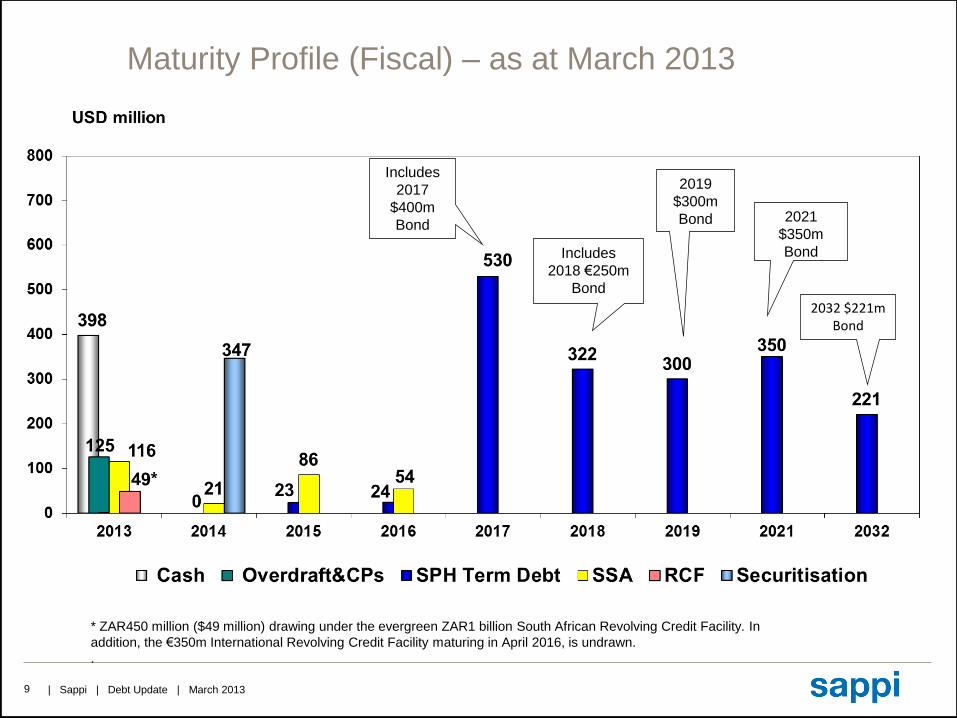
| Sappi | Debt Update | March 2013 9
Maturity Profile (Fiscal) – as at March 2013
2032 $221m Bond
Includes
2018 €250m
Bond
2021
$350m
Bond
2019
$300m
Bond
Includes
2017
$400m
Bond
* ZAR450 million ($49 million) drawing under the evergreen ZAR1 billion South African Revolving Credit Facility. In
addition, the €350m International Revolving Credit Facility maturing in April 2016, is undrawn.
.
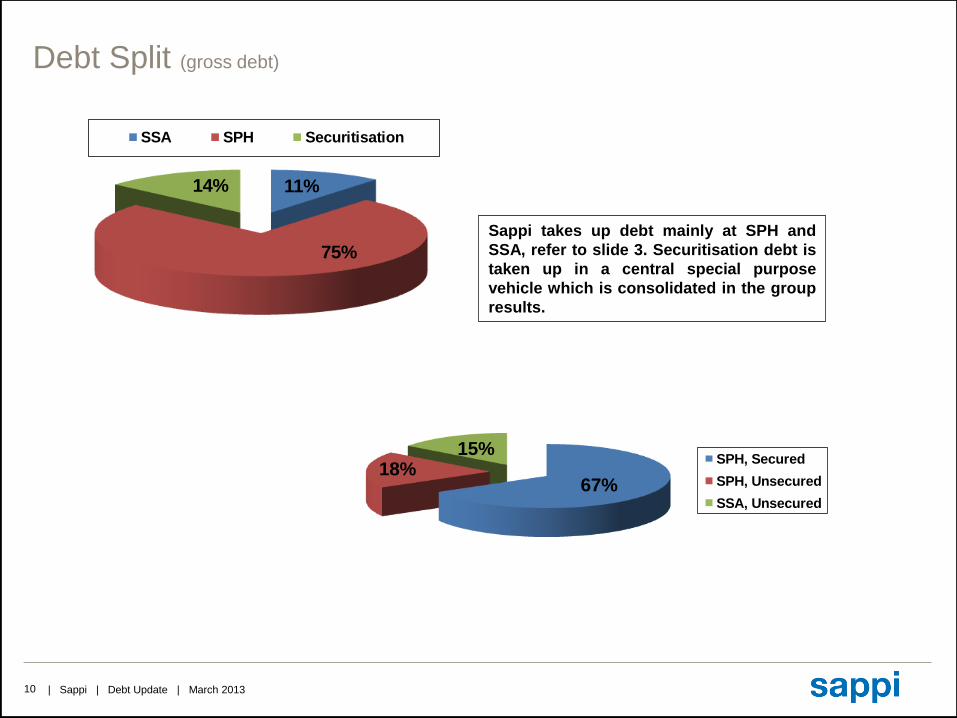
| Sappi | Debt Update | March 2013 10
Debt Split (gross debt)
11%
75%
14%
SSA SPH Securitisation
Sappi takes up debt mainly at SPH and
SSA, refer to slide 3. Securitisation debt is
taken up in a central special purpose
vehicle which is consolidated in the group
results.
67%18%
15%SPH, Secured
SPH, Unsecured
SSA, Unsecured
| Sappi | Debt Update | March 2013 11
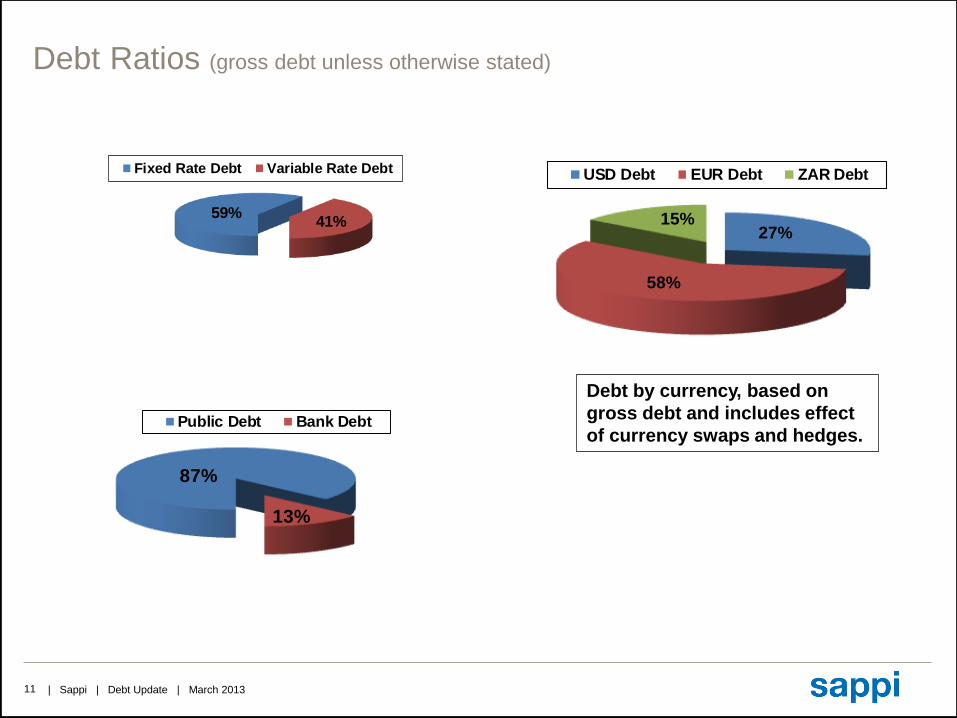
Debt Ratios (gross debt unless otherwise stated)
59%41%
Fixed Rate Debt Variable Rate Debt
27%
58%
15%
USD Debt EUR Debt ZAR Debt
87%
13%
Public Debt Bank Debt
Debt by currency, based on
gross debt and includes effect
of currency swaps and hedges.

| Sappi | Debt Update | March 2013 12
Security Package for Secured Debt
Pledge of Inventory
Share Pledges
U.S. Inventory, with certain exceptions
Pledges of the following shares:
Material Holding Companies within the Sappi Papier Holding group and other material subsidiaries.
Loans in excess of $25 million between guarantor companies
and other Sappi group companies.
Cession of Intercompany Loans
First charge over Property, Plant and Equipment
Mill Country
Gratkorn Austria
Kirkniemi Finland
Maastricht Netherlands
Nijmegen Netherlands
Mill State
Somerset Maine
Cloquet Minnesota
Total debt secured by the PP&E assets is limited to an
amount of 15% of consolidated net tangible assets of
SPH as required under the limitation of liens contained in
the 2032 Notes.
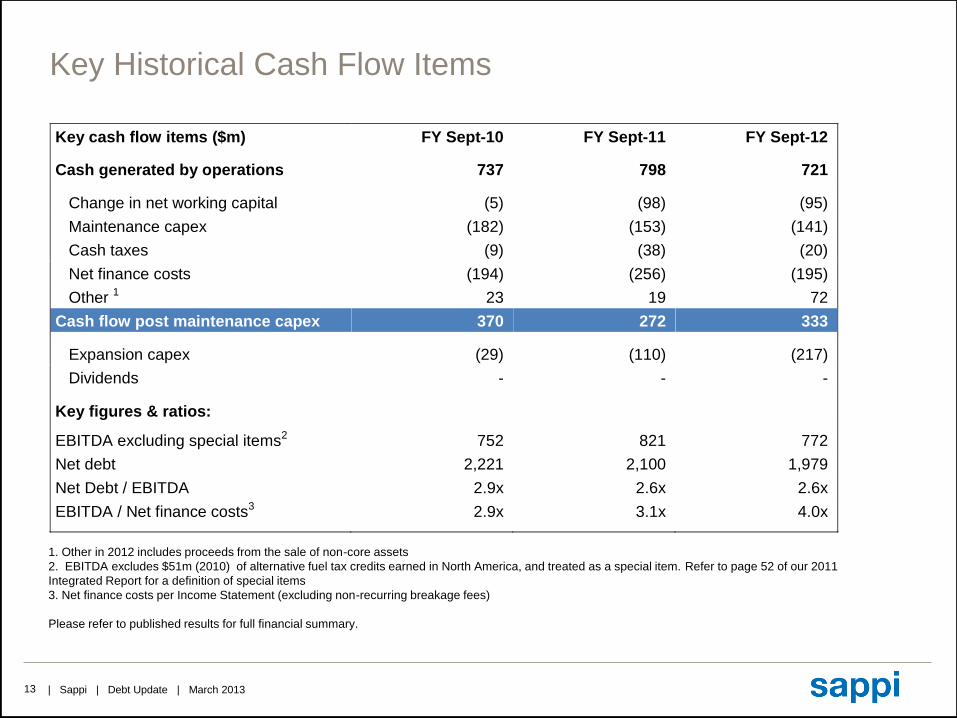
| Sappi | Debt Update | March 2013 13
Key cash flow items ($m) FY Sept-10 FY Sept-11 FY Sept-12
Cash generated by operations 737 798 721
Change in net working capital (5) (98) (95)
Maintenance capex (182) (153) (141)
Cash taxes (9) (38) (20)
Net finance costs (194) (256) (195)
Other 1 23 19 72
Cash flow post maintenance capex 370 272 333
Expansion capex (29) (110) (217)
Dividends - - -
Key figures & ratios:
EBITDA excluding special items2 752 821 772
Net debt 2,221 2,100 1,979
Net Debt / EBITDA 2.9x 2.6x 2.6x
EBITDA / Net finance costs3 2.9x 3.1x 4.0x
Key Historical Cash Flow Items
1. Other in 2012 includes proceeds from the sale of non-core assets
2. EBITDA excludes $51m (2010) of alternative fuel tax credits earned in North America, and treated as a special item. Refer to page 52 of our 2011
Integrated Report for a definition of special items
3. Net finance costs per Income Statement (excluding non-recurring breakage fees)
Please refer to published results for full financial summary.

| Sappi | Debt Update | March 2013 14
Bank Covenants
Three bank covenants exist at the consolidated Sappi Limited level, i.e. two debt
covenants and an interest coverage covenant. In addition, two bank covenants exist at
the Sappi Southern Africa level for its own bank facilities, i.e. a debt covenant and an
interest covenant.
At the end of March 2013 all covenants were met.
Regular monitoring of compliance with the covenants occurs. In the event of a possible
future breach of a financial covenant, negotiations would commence with the applicable
institutions before such breach occurs.

| Sappi | Debt Update | March 2013 15
Rating Agency Ratings
S&P and Moody’s have assigned the following credit
ratings:
Fitch has assigned the following credit rating to Sappi Southern Africa
(Pty) Ltd:
Fitch SSA Local Rating
November 2009 A/Negative/F1
March 2011 A/Stable/F1
January 2013 A+/Stable/F1
Moody's Sappi Group Rating Secured Debt Unsecured Debt
February 2009 Ba2/Negative/NP
June 2009 Ba3/Stable/NP
September 2009 Ba2 B2
April 2011 to present Ba3/Positive/NP Ba2 B2
S&P Sappi Group Rating Secured Debt Unsecured Debt
February 2009 BB/Negative/B
May 2009 BB-/Stable/B
September 2009 BB B+
April 2011 to present BB-/Stable/B BB B

| Sappi | Debt Update | March 2013 16
Contacts
Jörg Pässler Stephen Blyth
Group Treasurer Deputy Group Treasurer
Sappi Group Treasury Sappi Group Treasury
Sappi International S.A. Sappi International S.A.
Tel +32 2676 9621 Tel +32 2676 9617
[email protected] [email protected]
For further information contact:

| Sappi | Debt Update | March 2013 17


