72
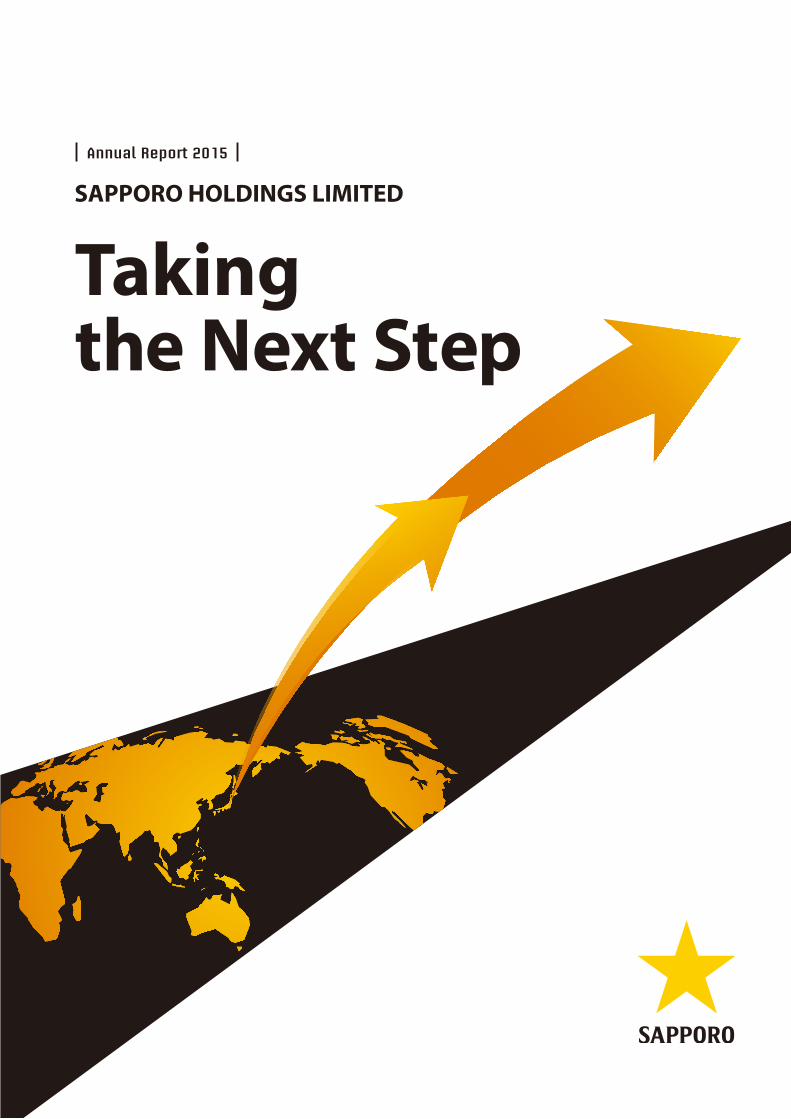
SAPPORO HOLDINGS LIMITED Annual Report 2015 Taking the Next Step
SAPPORO HOLDINGS LIMITED
Annual Report 2015
Taking the Next Step
“As an intrinsic part of people’s lives, Sapporo will contribute
to the evolution of creative, enriching and rewarding lifestyles”
Management Philosophy
The Sapporo Shining Star is a motif representing a polestar. The Group has used this logo since its predecessor, the Kaitakushi (the national government Hokkaido
development commission) Brewery, was established in 1876. It is a symbol of the pioneering spirit in which the Group was founded.
About the Group’s corporate logo, the Sapporo Shining Star
The Sapporo Group strives to maintain integrity in corporate conduct that reinforces stakeholder trust and
aims to achieve continuous growth in corporate value.
Fundamental Management Policy
Statements in this annual report with respect to the Company’s plans, strategies, forecasts and other statements that are not historical facts are forward-looking statements that are based on management’s judgment in light of currently available information. Factors that could cause actual results to differ materially from our earnings forecasts include, without limitation, global economic conditions, our response to market demand for and competitive pricing pressure on products and services and currency exchange rate fluctuations.
Forward-looking Statements
All figures in this annual report are rounded to the nearest applicable unit.
01 Profile
02 Our History of Development over 140 Years
Taking the Next Step04 Our Business
06 Financial Highlights
08 To Our Stakeholders
13 Value Creation for the Future
14 Performance Review and Plan 14 Japanese Alcoholic Beverages 16 International 18 Food & Soft Drinks 20 Restaurants 21 Real Estate
22 CSR Activities
28 Corporate Governance
32 Board of Directors and Audit & Supervisory Board Members
34 Financial Section
69 Corporate Data
Annual Report 2015
Contents

Taking the Next Step
140th
The Sapporo Group has been brewing beer since 1876. Throughout its history, the Group has diligently created products using only carefully selected ingredients. In the areas of food and surroundings, the Group continues to provide products and services designed to satisfy customers in Japan and overseas, especially North America and Southeast Asia.
Sapporo Group
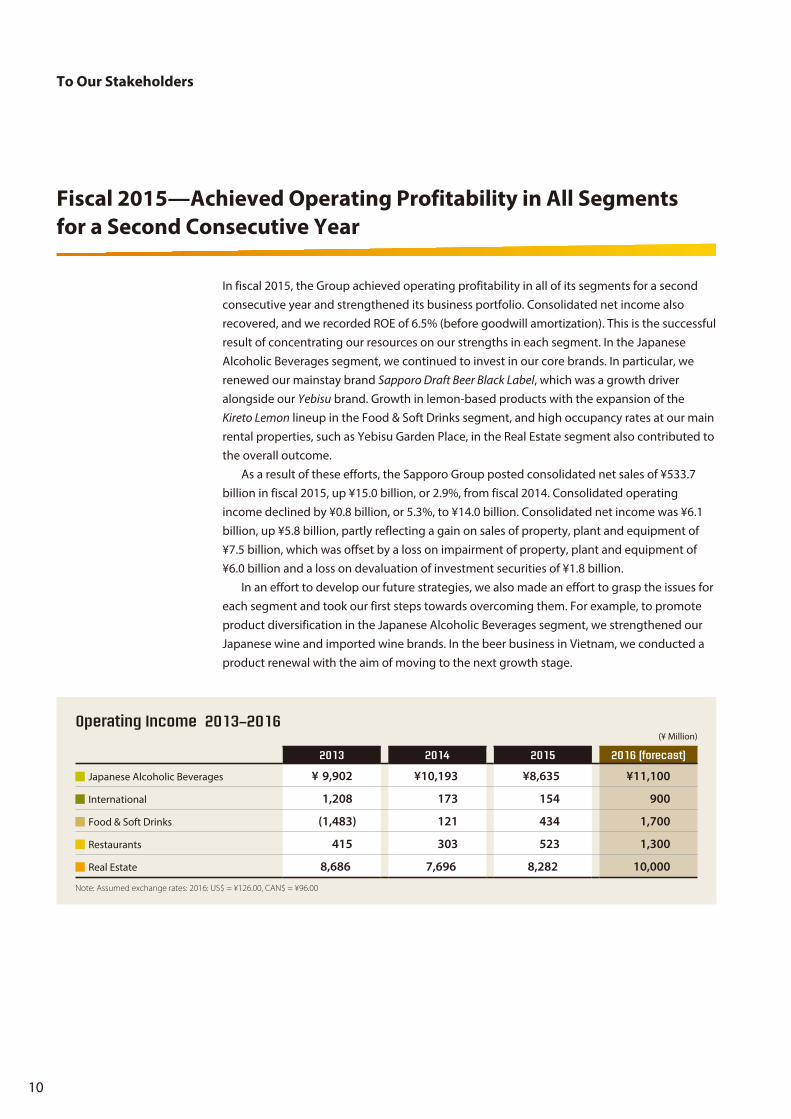
The Group posted consolidated net sales of ¥533.7 billion, up 2.9% year on year. The result mainly reflected higher sales volumes in the Food & Soft Drinks segment and the new consolidation of Country Pure Foods, Inc. in the International segment. These factors outweighed a year-on-year decline in sales volumes of beer-type beverages in the Japanese Alcoholic Beverages segment. Consolidated operating income declined 5.3% year on year; however, all operations achieved profitability for a result of ¥14.0 billion.
2015 Business Results
1876Founded
7,484(Consolidated)
Number of employees
117 (Parent company)
Consolidated subsidiaries and equity-method affiliates
54Consolidated subsidiaries
2Equity-method affiliates
¥533.7 billionNet sales
(+2.9% YoY)
¥14.0 billionOperating income
(–5.3% YoY)
SAPPORO HOLDINGS LIMITED Annual Report 2015 01

Our History of Development over 140 Years
The Sapporo Group has marked 140 years since its foundation. The Group will continue to leverage the qualities of its founding DNA to maximize Group synergies and strive for sustained growth.
Taking the Next Step
1985: Renamed Sapporo Beverage Co., Ltd.
1957: Established Kokusai Inryo Co., Ltd., which later became Sapporo Beverage Co., Ltd.
Citron remains popular today. The launch of Citron (Soda) marked the Sapporo Group’s entry into the soft drinks business.
Started manufacture and sales of Citron1906
1993: Completed construction of the Sapporo Factory on the former site of SAPPORO BREWERIES’ Sapporo Brewery
1994: Completed construction of Yebisu Garden Place on the former site of SAPPORO BREWERIES’ Ebisu Brewery
Provides real estate services starting from real estate development of former factory sites. Provides a stable base that contributes significantly to the Group’s growth
Established Seiwa Real Estate Co., Ltd.1988
1890: Launched Yebisu Beer
1964: Company name changed to SAPPORO BREWERIES LIMITED
Established the Kaitakushi Brewery
1876
Established Japan Beer Brewery Company
1887
1877: Launched Sapporo Lager Beer, the first product
1956: Revival of Sapporo Beer
The Kaitakushi Brewery was launched in Sapporo as a government-operated brewery of the Hokkaido Development Commission.
Japan Beer Brewery Company was established in Ginza, Tokyo.
1979: Changed Company name to SAPPORO LION LIMITED
1934: Opened the Beer Hall Lion Ginza 7-Chome, now the oldest existing beer hall in Japan
The highly modern beer hall has flourished since its opening. More than 100 years have passed since it was opened in Ginza. Its history of continued development is also a history of continuing support from customers.
Opened YEBISU BEER HALL, Japan’s first beer hall1899
SAPPORO BREWERIES started overseas expansion in this year. Later, it expanded sales channels throughout North America and Southeast Asia, creating a foundation for further growth.
Began exporting beer to the United States1964
1984: Established SAPPORO U.S.A. INC. and strengthened the foothold for business expansion in North America
02
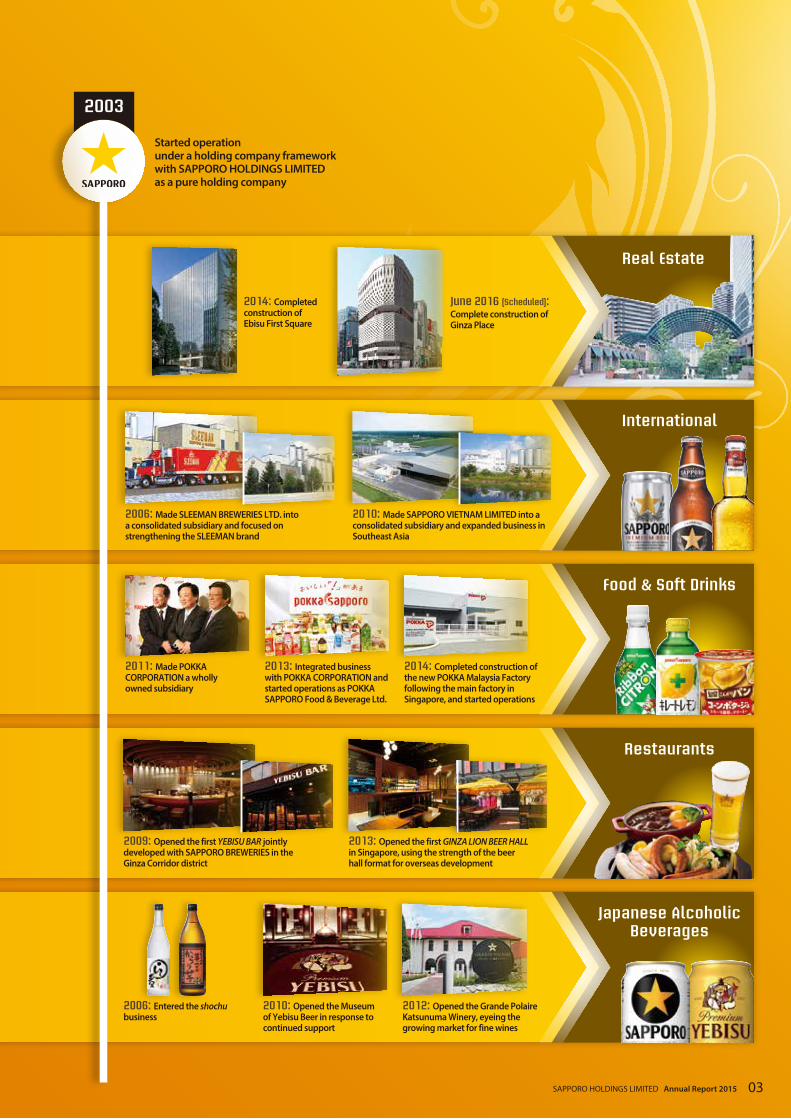
Food & Soft Drinks
2011: Made POKKA CORPORATION a wholly owned subsidiary
2013: Integrated business with POKKA CORPORATION and started operations as POKKA SAPPORO Food & Beverage Ltd.
2014: Completed construction of the new POKKA Malaysia Factory following the main factory in Singapore, and started operations
Real Estate
2014: Completed construction of Ebisu First Square
June 2016 (Scheduled): Complete construction of Ginza Place
Japanese Alcoholic Beverages
2006: Entered the shochu business
2010: Opened the Museum of Yebisu Beer in response to continued support
2012: Opened the Grande Polaire Katsunuma Winery, eyeing the growing market for fine wines
Restaurants
2009: Opened the first YEBISU BAR jointly developed with SAPPORO BREWERIES in the Ginza Corridor district
2013: Opened the first GINZA LION BEER HALL in Singapore, using the strength of the beer hall format for overseas development
International
2006: Made SLEEMAN BREWERIES LTD. into a consolidated subsidiary and focused on strengthening the SLEEMAN brand
2010: Made SAPPORO VIETNAM LIMITED into a consolidated subsidiary and expanded business in Southeast Asia
Started operation under a holding company framework with SAPPORO HOLDINGS LIMITED as a pure holding company
2003
SAPPORO HOLDINGS LIMITED Annual Report 2015 03

Our Business
The Sapporo Group is dedicated to utilizing its assets and strengths in the pursuit of operations in the two business domains of “Creating value in food” and “Creating comfortable surroundings.” “Creating value in food” means providing a wide range of food products with genuine value tailored to customer demand, in line with the key principles of safety, security and health. “Creating comfortable surroundings” means providing relaxed and appealing venues as part of the general urban fabric comprising restaurants and bars, commercial precincts, office buildings and residential districts. The Group’s businesses are divided into five segments: Japanese Alcoholic Beverages, International, Food & Soft Drinks, Restaurants, and Real Estate. The Japanese Alcoholic Beverages and Real Estate segments are positioned as stable earnings pillars, while the Group also promotes the International and Food & Soft Drinks segments as future growth drivers.
Business segment
Operating income(billions of yen)
YoY
Strength, market, etc.
Net sales(billions of yen)
YoY
Business overview
Creating value in foodThe core domain driving the Group’s dynamic growth
Pillar contributing stable earnings
Japanese Alcoholic Beverages
Growth driver
International
With a vision of “Seek No. 1 by accumulating one-of-a-kind products,” the Group is focused mainly on the beer business, but is also involved in other areas, including the wine and spirits business and the Japanese liquors business. The Group will continue to propose products and services that represent the distinctive Sapporo value.
Main BrandsBeer and beer-type beverages: Yebisu Beer, Sapporo Draft Beer Black Label, Mugi to Hop The gold, Goku Zero Wine: Grande Polaire, Penfolds Champagne: TaittingerShochu: Shochu Kokuimo (Imo Shochu) Spirits: Bacardi, Dewar’s
273.7 (2.6)%
8.6 (15.3)%
The Group operates the International business offering alcoholic beverages and soft drinks, mainly in North America and Southeast Asia. In the North American market, we are aiming to take another leap forward, while working to expand our beer business in Vietnam and use it as a base for strengthening our exports to surrounding countries.
Main BrandsSAPPORO PREMIUM, SLEEMAN
Main Sales AreasNorth America, Canada, Vietnam, South Korea, Australia, Singapore
70.5 41.9%
0.2 (10.8)%
04

Creating comfortable surroundingsThe business domain expected to contribute stable profits backed by prime properties
Share of consolidated sales
3.9%5.1
%
25.4% 51.3
%
13.2%
1.1%
Japanese Alcoholic BeveragesInternational Food & Soft DrinksRestaurants Real EstateOther
¥533.7 billion
Net sales
Food & Soft Drinks
To become a third pillar for the Group
Pillar contributing stable earnings
Real Estate
Contact point with customers
Restaurants
The Group operates its Food & Soft Drinks business primarily in Japan and Southeast Asia. It will carefully nurture the bonds it has built up with customers as it continues to create a stream of delicious new products that enrich and brighten people’s lives.
Main BrandsSoft drinks: Kireto Lemon, Ribbon, GEROLSTEINER (natural mineral water), aromax (canned coffee)Soups: Jikkuri KotokotoLemon-based products: Pokka Lemon 100Restaurants: Café de Crié (coffee shop)
Number of Café de Crié Outlets189 (as of December 31, 2015)
Main Sales AreasJapan, Singapore, Malaysia, Indonesia, Myanmar
135.7 1.7%
0.4 258.5%
The Group operates Japan’s largest beer hall chains, GINZA LION and YEBISU BAR, along with various restaurants. In addition to providing delicious draft beer, we will continue to develop menus based on the theme of “safety, security, authenticity, and health.”
Main BrandsGINZA LION BEER HALL, YEBISU BAR
Number of Outlets178 in Japan, 14 overseas (As of December 31, 2015)
27.0 (0.5)%
0.5 72.2%
The Group’s Real Estate segment includes leasing, management, operation, and development. We operate and manage three commercial complexes—Yebisu Garden Place, Sapporo Factory, and GINZA PLACE (scheduled to open in summer 2016)—as well as office buildings and others. We will continue to maintain high occupancy rates and strive to increase rent levels.
Main FacilitiesYebisu Garden Place, Sapporo Factory
Main Areas Ebisu, Ginza, Sapporo
20.9 (3.0)%
8.3 7.6%
SAPPORO HOLDINGS LIMITED Annual Report 2015 05
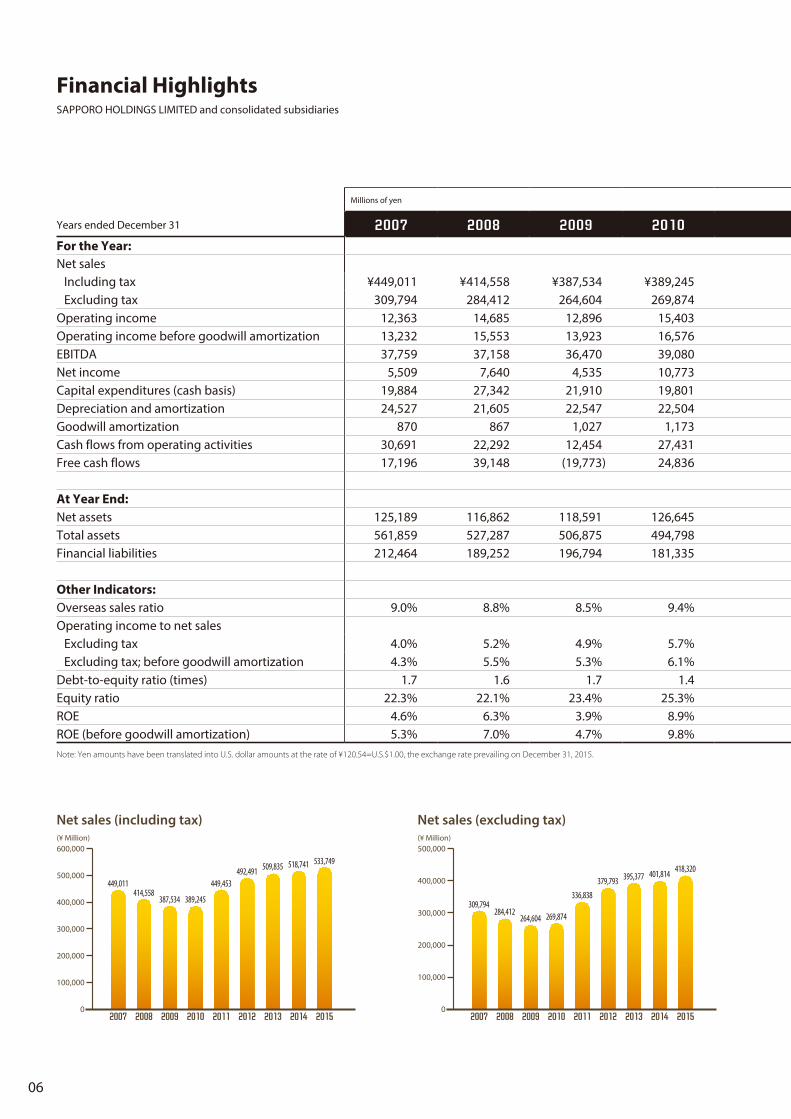
Millions of yen Thousands of U.S. dollars
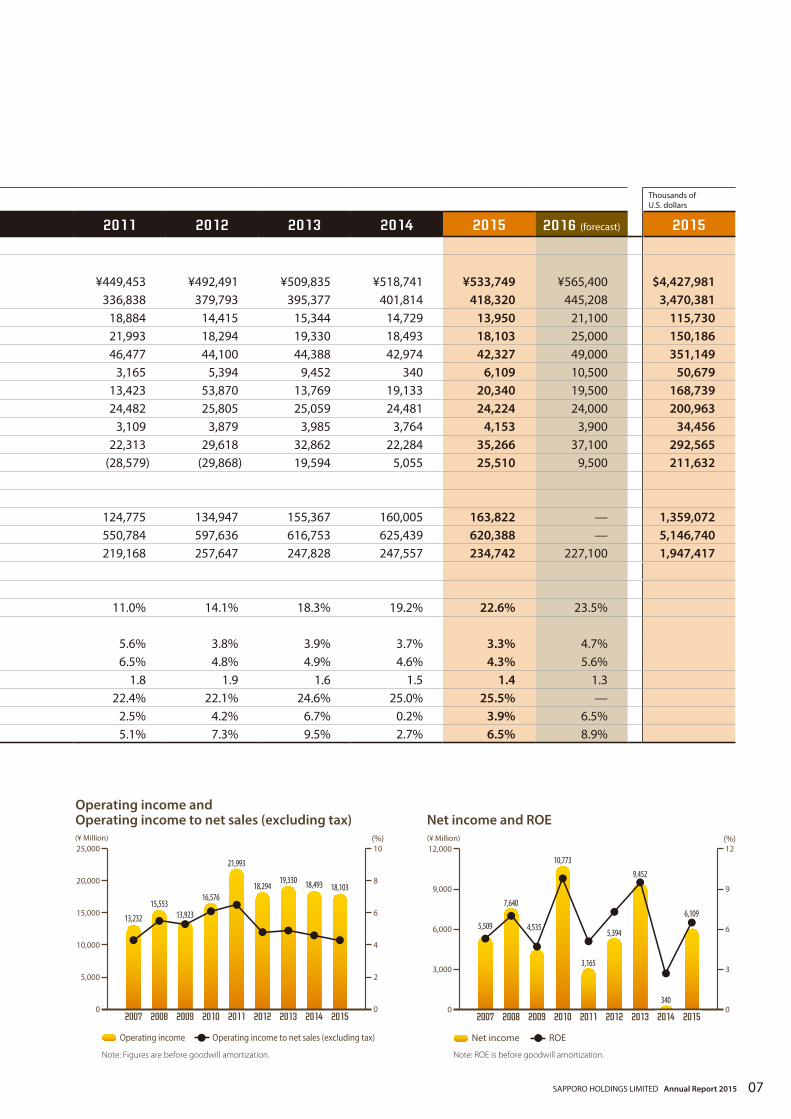
Years ended December 31 2007 2008 2009 2010 2011 2012 2013 2014 2015 2016 (forecast) 2015For the Year:Net sales
Including tax ¥449,011 ¥414,558 ¥387,534 ¥389,245 ¥449,453 ¥492,491 ¥509,835 ¥518,741 ¥533,749 ¥565,400 $4,427,981Excluding tax 309,794 284,412 264,604 269,874 336,838 379,793 395,377 401,814 418,320 445,208 3,470,381
Operating income 12,363 14,685 12,896 15,403 18,884 14,415 15,344 14,729 13,950 21,100 115,730Operating income before goodwill amortization 13,232 15,553 13,923 16,576 21,993 18,294 19,330 18,493 18,103 25,000 150,186EBITDA 37,759 37,158 36,470 39,080 46,477 44,100 44,388 42,974 42,327 49,000 351,149Net income 5,509 7,640 4,535 10,773 3,165 5,394 9,452 340 6,109 10,500 50,679Capital expenditures (cash basis) 19,884 27,342 21,910 19,801 13,423 53,870 13,769 19,133 20,340 19,500 168,739Depreciation and amortization 24,527 21,605 22,547 22,504 24,482 25,805 25,059 24,481 24,224 24,000 200,963Goodwill amortization 870 867 1,027 1,173 3,109 3,879 3,985 3,764 4,153 3,900 34,456Cash flows from operating activities 30,691 22,292 12,454 27,431 22,313 29,618 32,862 22,284 35,266 37,100 292,565Free cash flows 17,196 39,148 (19,773) 24,836 (28,579) (29,868) 19,594 5,055 25,510 9,500 211,632
At Year End:Net assets 125,189 116,862 118,591 126,645 124,775 134,947 155,367 160,005 163,822 — 1,359,072Total assets 561,859 527,287 506,875 494,798 550,784 597,636 616,753 625,439 620,388 — 5,146,740Financial liabilities 212,464 189,252 196,794 181,335 219,168 257,647 247,828 247,557 234,742 227,100 1,947,417
Other Indicators:Overseas sales ratio 9.0% 8.8% 8.5% 9.4% 11.0% 14.1% 18.3% 19.2% 22.6% 23.5%Operating income to net sales
Excluding tax 4.0% 5.2% 4.9% 5.7% 5.6% 3.8% 3.9% 3.7% 3.3% 4.7%Excluding tax; before goodwill amortization 4.3% 5.5% 5.3% 6.1% 6.5% 4.8% 4.9% 4.6% 4.3% 5.6%
Debt-to-equity ratio (times) 1.7 1.6 1.7 1.4 1.8 1.9 1.6 1.5 1.4 1.3Equity ratio 22.3% 22.1% 23.4% 25.3% 22.4% 22.1% 24.6% 25.0% 25.5% —ROE 4.6% 6.3% 3.9% 8.9% 2.5% 4.2% 6.7% 0.2% 3.9% 6.5%ROE (before goodwill amortization) 5.3% 7.0% 4.7% 9.8% 5.1% 7.3% 9.5% 2.7% 6.5% 8.9%Note: Yen amounts have been translated into U.S. dollar amounts at the rate of ¥120.54=U.S.$1.00, the exchange rate prevailing on December 31, 2015.
(¥ Million)
389,245387,534414,558
449,011 449,453492,491 509,835 518,741 533,749
0
100,000
200,000
300,000
400,000
500,000
600,000
201520142013201220112010200920082007
(¥ Million)
269,874264,604284,412
309,794336,838
379,793 395,377 401,814 418,320
0
100,000
200,000
300,000
400,000
500,000
201520142013201220112010200920082007
Net sales (including tax) Net sales (excluding tax)
Financial HighlightsSAPPORO HOLDINGS LIMITED and consolidated subsidiaries
06
Millions of yen Thousands of U.S. dollars
Years ended December 31 2007 2008 2009 2010 2011 2012 2013 2014 2015 2016 (forecast) 2015For the Year:Net sales
Including tax ¥449,011 ¥414,558 ¥387,534 ¥389,245 ¥449,453 ¥492,491 ¥509,835 ¥518,741 ¥533,749 ¥565,400 $4,427,981Excluding tax 309,794 284,412 264,604 269,874 336,838 379,793 395,377 401,814 418,320 445,208 3,470,381
Operating income 12,363 14,685 12,896 15,403 18,884 14,415 15,344 14,729 13,950 21,100 115,730Operating income before goodwill amortization 13,232 15,553 13,923 16,576 21,993 18,294 19,330 18,493 18,103 25,000 150,186EBITDA 37,759 37,158 36,470 39,080 46,477 44,100 44,388 42,974 42,327 49,000 351,149Net income 5,509 7,640 4,535 10,773 3,165 5,394 9,452 340 6,109 10,500 50,679Capital expenditures (cash basis) 19,884 27,342 21,910 19,801 13,423 53,870 13,769 19,133 20,340 19,500 168,739Depreciation and amortization 24,527 21,605 22,547 22,504 24,482 25,805 25,059 24,481 24,224 24,000 200,963Goodwill amortization 870 867 1,027 1,173 3,109 3,879 3,985 3,764 4,153 3,900 34,456Cash flows from operating activities 30,691 22,292 12,454 27,431 22,313 29,618 32,862 22,284 35,266 37,100 292,565Free cash flows 17,196 39,148 (19,773) 24,836 (28,579) (29,868) 19,594 5,055 25,510 9,500 211,632
At Year End:Net assets 125,189 116,862 118,591 126,645 124,775 134,947 155,367 160,005 163,822 — 1,359,072Total assets 561,859 527,287 506,875 494,798 550,784 597,636 616,753 625,439 620,388 — 5,146,740Financial liabilities 212,464 189,252 196,794 181,335 219,168 257,647 247,828 247,557 234,742 227,100 1,947,417
Other Indicators:Overseas sales ratio 9.0% 8.8% 8.5% 9.4% 11.0% 14.1% 18.3% 19.2% 22.6% 23.5%Operating income to net sales
Excluding tax 4.0% 5.2% 4.9% 5.7% 5.6% 3.8% 3.9% 3.7% 3.3% 4.7%Excluding tax; before goodwill amortization 4.3% 5.5% 5.3% 6.1% 6.5% 4.8% 4.9% 4.6% 4.3% 5.6%
Debt-to-equity ratio (times) 1.7 1.6 1.7 1.4 1.8 1.9 1.6 1.5 1.4 1.3Equity ratio 22.3% 22.1% 23.4% 25.3% 22.4% 22.1% 24.6% 25.0% 25.5% —ROE 4.6% 6.3% 3.9% 8.9% 2.5% 4.2% 6.7% 0.2% 3.9% 6.5%ROE (before goodwill amortization) 5.3% 7.0% 4.7% 9.8% 5.1% 7.3% 9.5% 2.7% 6.5% 8.9%Note: Yen amounts have been translated into U.S. dollar amounts at the rate of ¥120.54=U.S.$1.00, the exchange rate prevailing on December 31, 2015.
(¥ Million)
16,576
13,92315,553
13,232
21,993
18,29419,330 18,493 18,103
0
5,000
10,000
15,000
20,000
25,000
0
2
4
6
8
10(%)
Operating income to net sales (excluding tax)Operating income
201520142013201220112010200920082007
(¥ Million)
10,773
4,535
7,640
5,509
3,165
5,394
9,452
340
6,109
(%)
ROENet income
0
3,000
6,000
9,000
12,000
0
3
6
9
12
2013201220112010200920082007 20152014
Operating income and Operating income to net sales (excluding tax) Net income and ROE
Note: Figures are before goodwill amortization. Note: ROE is before goodwill amortization.
SAPPORO HOLDINGS LIMITED Annual Report 2015 07

As we mark the 140th anniversary of our founding, we, the Sapporo Group, are looking ahead to our 150th anniversary, aiming to grow even further over the next ten years and increase our presence as a distinctive food company group.
Tsutomu Kamijo President, Representative Director and Group CEO
To Our StakeholdersTo Our Stakeholders
08

A New Start Leveraging the Qualities of Our Founding DNA
Profit Growth and Profit Management (Consolidated Operating Income)
(¥ Billion)
12.012.912.412.5
13.514.7
13.515.4
18.018.9
20.0
14.415.3 15.3 15.0 14.7
16.3
14.0
Initial target Result
0
5
10
15
20
25Impact of competitive sales promotions within the industry in reaction to the earthquake disaster
Current �scal year
201520142013201220112010200920082007
Steady pro�t growth after the �nancial crisis
At Sapporo Holdings, we look forward to marking our 140th anniversary in September 2016. The roots of our company stretch back to 1876, with the construction of the Kaitakushi Brewery by Hokkaido development commission. Since then, we have continuously researched selective breeding and improved cultivation methods of barley suitable for brewing beer. This was the origin of the Collaborative Contract Farming System that we operate today, and it is also our DNA. We created a number of hit products beloved by customers, such as Yebisu and Black Label. We have also provided leading products for their times, such as Hokkaido Namashibori and Draft One. Since entering the new millennium, we have continued to expand our overseas operations aggressively in North America and Southeast Asia. In 2011, we expanded our presence in the food industry through a business integration with POKKA CORPORATION, aiming to consolidate our position as a distinctive food company group. Looking back over a long, 140-year history, I feel profoundly moved and have a great sense of responsibility as the Group CEO. As we move forward, we will make every effort to achieve steady growth, leveraging the qualities of our founding DNA. This year is the final year of our New Management Framework, which we announced in 2007. Under the Group’s strategy of creating high-value-added products and services, we are investing in the Japanese Alcoholic Beverages segment and Real Estate segment, which produce stable income. We are also making investments for future growth in the International segment and Food & Soft Drinks segment, and are increasing our investments in R&D to foster future growth. Right now, we aim to be a group of companies that is essential for customers to enjoy rich lives throughout the world by continuing to create and supply new products and services, in an effort to become No. 1 in the market. To this end, we are currently formulating our next long-term management framework targeting 2026, the year of our 150th anniversary. We plan to announce this in autumn.
SAPPORO HOLDINGS LIMITED Annual Report 2015 09
To Our Stakeholders
In fiscal 2015, the Group achieved operating profitability in all of its segments for a second consecutive year and strengthened its business portfolio. Consolidated net income also recovered, and we recorded ROE of 6.5% (before goodwill amortization). This is the successful result of concentrating our resources on our strengths in each segment. In the Japanese Alcoholic Beverages segment, we continued to invest in our core brands. In particular, we renewed our mainstay brand Sapporo Draft Beer Black Label, which was a growth driver alongside our Yebisu brand. Growth in lemon-based products with the expansion of the Kireto Lemon lineup in the Food & Soft Drinks segment, and high occupancy rates at our main rental properties, such as Yebisu Garden Place, in the Real Estate segment also contributed to the overall outcome. As a result of these efforts, the Sapporo Group posted consolidated net sales of ¥533.7 billion in fiscal 2015, up ¥15.0 billion, or 2.9%, from fiscal 2014. Consolidated operating income declined by ¥0.8 billion, or 5.3%, to ¥14.0 billion. Consolidated net income was ¥6.1 billion, up ¥5.8 billion, partly reflecting a gain on sales of property, plant and equipment of ¥7.5 billion, which was offset by a loss on impairment of property, plant and equipment of ¥6.0 billion and a loss on devaluation of investment securities of ¥1.8 billion. In an effort to develop our future strategies, we also made an effort to grasp the issues for each segment and took our first steps towards overcoming them. For example, to promote product diversification in the Japanese Alcoholic Beverages segment, we strengthened our Japanese wine and imported wine brands. In the beer business in Vietnam, we conducted a product renewal with the aim of moving to the next growth stage.
Fiscal 2015—Achieved Operating Profitability in All Segments for a Second Consecutive Year
Operating Income 2013–2016
Note: Assumed exchange rates: 2016: US$ = ¥126.00, CAN$ = ¥96.00
2013 2014 2015 2016 (forecast)
Japanese Alcoholic Beverages ¥ 9,902 ¥10,193 ¥8,635 ¥11,100
International 1,208 173 154 900
Food & Soft Drinks (1,483) 121 434 1,700
Restaurants 415 303 523 1,300
Real Estate 8,686 7,696 8,282 10,000
(¥ Million)
10

Outlook for 2016
The Company is forecasting consolidated operating income of ¥21.1 billion for fiscal 2016, with consolidated net income of ¥10.5 billion. Looking ahead, we plan to continue achieving consolidated operating income at the ¥20.0 billion level and consolidated net income at the ¥10.0 billion level. We are confident that we will be able to maintain this level by expanding as a distinctive food company group in the food sector as well as in alcoholic beverages, and achieving further growth centered on the North American and Southeast Asian markets. If there is one challenge to be met, I believe it is securing human resources for our growth areas. One measure for this is to promote diversity. We will establish systems for developing global personnel through our plan to promote personnel exchanges among our local subsidiaries in countries around the world. Our outlook for each segment is as follows:
In beer and beer-type beverages, for the first year of our campaign to strengthen beer, we aim to bolster the brand value of our core Sapporo Draft Beer Black Label and Yebisu Beer brands in line with our vision of “Seek No. 1 by accumulating one-of-a-kind products.” We are also expecting to widen the circle of new-genre and happoshu consumers by developing and nurturing products that meet customers’ needs. We have already conducted a renewal of Mugi to Hop The gold, which is seeing strong shipments. We will promote our product diversification strategy in the Japanese Alcoholic Beverages segment, strengthening our range of fine wines, such as the Japanese wine Grande Polaire, and leveraging the brand power of Penfolds imported wine, Taittinger champagne, and others to increase profitability.
Japanese Alcoholic Beverages Segment
In North America, we will strengthen our premium brands for the Canadian market, and look to sustain growth of the SLEEMAN brand. In the U.S. market, we will focus on enhancing the presence of the SAPPORO PREMIUM brand for the Asian-American market. In the Vietnamese market, we will maximize the favorable impact of the Sapporo Premium relaunch, bolster our brand strength, and expand our sales area.
International Segment
2016 Targets Based on Current Businesses
Note: Assumed exchange rates: 2016: US$ = ¥126.00, CAN$ = ¥96.00
(¥ Billion)
2016 New Management
Framework2014 2015 2016 forecast
Net sales (including liquor tax) ¥518.7 ¥533.7 ¥565.4 ¥600.0
Operating income 14.7 14.0 21.140.0
Operating income (before goodwill amortization) 18.5 18.1 25.0
Net income 0.3 6.1 10.5 —
Debt-to-equity ratio (times) 1.5 1.4 1.3 around 1.0
ROE 0.2% 3.9% 6.5% 8.0% or higherROE (before goodwill amortization) 2.7% 6.5% 8.9%
SAPPORO HOLDINGS LIMITED Annual Report 2015 11

To Our Stakeholders
In this segment, we are planning to strengthen our mainstay brands in lemon-based products and soups, for instance by launching new products offering unique value from the Kireto Lemon brand. We are also developing a foundation for growth and reforming our cost structure by ensuring low-cost operations.
Food & Soft Drinks Segment
We will seek to improve store efficiency in Japan and overseas, while also aspiring to be the world’s No. 1 beer hall chain by delivering 100% satisfaction to customers. In Japan, we are currently opening new outlets, with a primary emphasis on GINZA LION and YEBISU BAR outlets, including the reopening of our large-scale flagship outlet which had been closed for two years. Overseas, we will examine expanding into new regions of operation centered on the GINZA LION BEER HALL format.
Restaurants Segment
In the Real Estate segment, we will continue to enhance the corporate brand by increasing the value of our properties, and will work to maintain a high occupancy rate and bolster rent levels. At GINZA PLACE, we are steadily making preparations for the start of operations in the summer of 2016, with plans to contribute to revenues from an early stage.
Real Estate Segment
Providing appropriate returns to shareholders is one of our key management priorities. Our basic policy is to maintain a stable dividend. For fiscal 2015, we paid an annual dividend of ¥7 per share, the same as in fiscal 2014. For the dividend from surplus for fiscal 2016, we aim to pay an annual dividend of ¥7 or greater per share by steadily executing our management plan, while making strategic investments and strengthening our financial foundation. Japanese stock exchanges aim to consolidate 100 shares of common stock of listed domestic companies into single trading units. To comply with this aim and adjust its trading unit to an appropriate level, Sapporo Holdings has decided to change the trading unit of its shares to 100 shares from July 1, 2016, and simultaneously conduct a consolidation of its common stock at a ratio of one share for five shares. In conjunction with this, the per-share dividend is expected to become ¥35. In 2026, the Sapporo Group will mark its 150th anniversary. We are taking steps to prepare for this milestone and to realize our vision for the kind of company we should be. We will strive to strengthen corporate governance even further; position CSR-focused management as one of the key strategies for realizing the sustained growth of the Group; and promote initiatives on “quality of food and spaces,” “fair and just dealings,” “conservation of the global environment,” “harmonious coexistence with society,” “development of human resources and enhancement of the working environment,” and “sound corporate management.” In particular, as a food company group, we will attach importance to “CSR in quality of food and spaces,” aiming to be a company that provides security and safety while delighting customers. As we accelerate our growth investments and progress to 150 years, 160 years, and further into the future, we will strive to increase our presence as a distinctive food company group. We kindly ask for your continued understanding and support.
To Our Shareholders
12
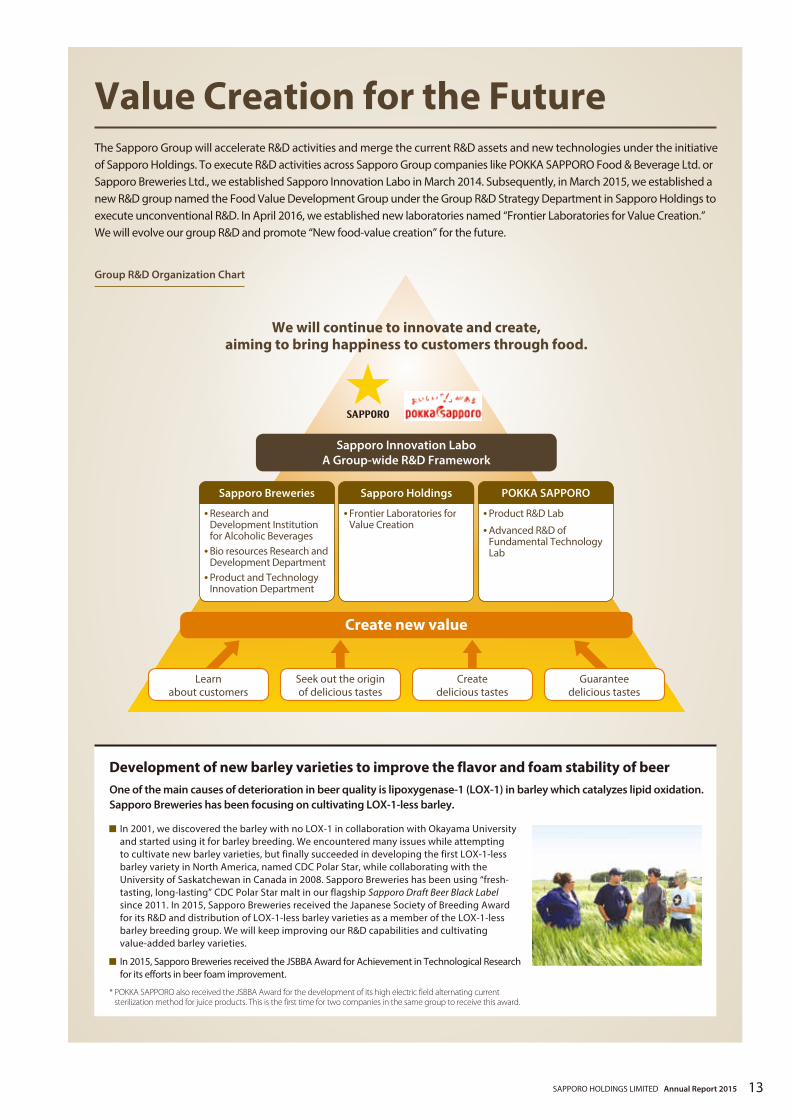
Sapporo Innovation LaboA Group-wide R&D Framework
Create new value
Seek out the origin of delicious tastes
Create delicious tastes
Learn about customers
Guarantee delicious tastes
Sapporo Breweries
Research and Development Institution for Alcoholic Beverages Bio resources Research and Development Department Product and Technology Innovation Department
Sapporo Holdings
Frontier Laboratories for Value Creation
POKKA SAPPORO
Product R&D Lab
Advanced R&D of Fundamental Technology Lab
We will continue to innovate and create, aiming to bring happiness to customers through food.
Value Creation for the FutureThe Sapporo Group will accelerate R&D activities and merge the current R&D assets and new technologies under the initiative of Sapporo Holdings. To execute R&D activities across Sapporo Group companies like POKKA SAPPORO Food & Beverage Ltd. or Sapporo Breweries Ltd., we established Sapporo Innovation Labo in March 2014. Subsequently, in March 2015, we established a new R&D group named the Food Value Development Group under the Group R&D Strategy Department in Sapporo Holdings to execute unconventional R&D. In April 2016, we established new laboratories named “Frontier Laboratories for Value Creation.” We will evolve our group R&D and promote “New food-value creation” for the future.
In 2001, we discovered the barley with no LOX-1 in collaboration with Okayama University and started using it for barley breeding. We encountered many issues while attempting to cultivate new barley varieties, but finally succeeded in developing the first LOX-1-less barley variety in North America, named CDC Polar Star, while collaborating with the University of Saskatchewan in Canada in 2008. Sapporo Breweries has been using “fresh-tasting, long-lasting” CDC Polar Star malt in our flagship Sapporo Draft Beer Black Label since 2011. In 2015, Sapporo Breweries received the Japanese Society of Breeding Award for its R&D and distribution of LOX-1-less barley varieties as a member of the LOX-1-less barley breeding group. We will keep improving our R&D capabilities and cultivating value-added barley varieties.
In 2015, Sapporo Breweries received the JSBBA Award for Achievement in Technological Research for its efforts in beer foam improvement.
* POKKA SAPPORO also received the JSBBA Award for the development of its high electric field alternating current sterilization method for juice products. This is the first time for two companies in the same group to receive this award.
One of the main causes of deterioration in beer quality is lipoxygenase-1 (LOX-1) in barley which catalyzes lipid oxidation. Sapporo Breweries has been focusing on cultivating LOX-1-less barley.
Development of new barley varieties to improve the flavor and foam stability of beer
Group R&D Organization Chart
SAPPORO HOLDINGS LIMITED Annual Report 2015 13
Performance Review and Plan
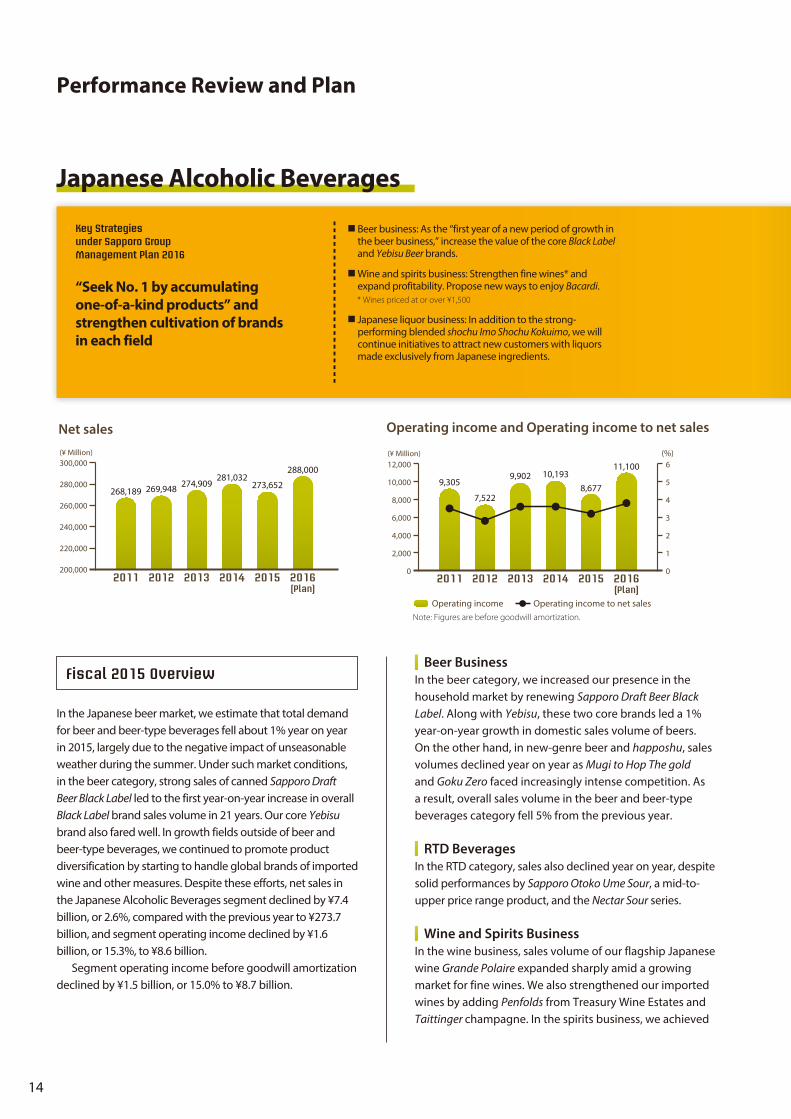
Net sales(¥ Million)
200,000
220,000
240,000
260,000
280,000
300,000
268,189 269,948 274,909281,032
273,652
288,000
2016(Plan)
20152014201320122011
Operating income to net salesOperating income
(¥ Million) (%)
9,305
7,522
9,902 10,1938,677
11,100
2016(Plan)
201520142013201220110
2,000
4,000
6,000
8,000
10,000
12,000
0
1
2
3
4
5
6
Operating income and Operating income to net sales
Note: Figures are before goodwill amortization.
Beer BusinessIn the beer category, we increased our presence in the household market by renewing Sapporo Draft Beer Black Label. Along with Yebisu, these two core brands led a 1% year-on-year growth in domestic sales volume of beers. On the other hand, in new-genre beer and happoshu, sales volumes declined year on year as Mugi to Hop The gold and Goku Zero faced increasingly intense competition. As a result, overall sales volume in the beer and beer-type beverages category fell 5% from the previous year.
RTD BeveragesIn the RTD category, sales also declined year on year, despite solid performances by Sapporo Otoko Ume Sour, a mid-to-upper price range product, and the Nectar Sour series.
Wine and Spirits BusinessIn the wine business, sales volume of our flagship Japanese wine Grande Polaire expanded sharply amid a growing market for fine wines. We also strengthened our imported wines by adding Penfolds from Treasury Wine Estates and Taittinger champagne. In the spirits business, we achieved
In the Japanese beer market, we estimate that total demand for beer and beer-type beverages fell about 1% year on year in 2015, largely due to the negative impact of unseasonable weather during the summer. Under such market conditions, in the beer category, strong sales of canned Sapporo Draft Beer Black Label led to the first year-on-year increase in overall Black Label brand sales volume in 21 years. Our core Yebisu brand also fared well. In growth fields outside of beer and beer-type beverages, we continued to promote product diversification by starting to handle global brands of imported wine and other measures. Despite these efforts, net sales in the Japanese Alcoholic Beverages segment declined by ¥7.4 billion, or 2.6%, compared with the previous year to ¥273.7 billion, and segment operating income declined by ¥1.6 billion, or 15.3%, to ¥8.6 billion. Segment operating income before goodwill amortization declined by ¥1.5 billion, or 15.0% to ¥8.7 billion.
Japanese Alcoholic Beverages
Fiscal 2015 Overview
“Seek No. 1 by accumulating one-of-a-kind products” and strengthen cultivation of brands in each field
Key Strategies under Sapporo Group Management Plan 2016
■ Beer business: As the “first year of a new period of growth in the beer business,” increase the value of the core Black Label and Yebisu Beer brands.
■ Japanese liquor business: In addition to the strong-performing blended shochu Imo Shochu Kokuimo, we will continue initiatives to attract new customers with liquors made exclusively from Japanese ingredients.
■ Wine and spirits business: Strengthen fine wines* and expand profitability. Propose new ways to enjoy Bacardi.* Wines priced at or over ¥1,500
14

solid sales of many major international brands such as Bombay Sapphire, Dewar’s, and Martini.
Japanese Liquor BusinessIn the Japanese liquor business, overall sales declined from the previous year despite continued strong sales of Imo Shochu Kokuimo, Japan’s No. 1 selling blended imo shochu.
We expect the market for our Japanese Alcoholic Beverages segment to remain challenging, mainly because of a decline in the drinking population. Nevertheless, we have designated fiscal 2016 as the “first year of a new
■ SAPPORO BREWERIES LIMITED■ SAPPORO WINES LIMITED■ YEBISU WINEMART CO., LTD.■ TANOSHIMARU SHUZO CO., LTD.■ SAPPORO ENGINEERING LIMITED■ STARNET CO., LTD.■ SHINSEIEN CO.,LTD.
period of growth in the beer business,” and will work to further enhance the value of our core brands, Black Label and Yebisu, and promote efforts to create new value for beers such as craft beer. We also plan to aggressively expand sales of our RTD, wine, shochu, spirits, and Japanese liquor offerings, driving product diversification in the Japanese Alcoholic Beverages segment to expand earnings capabilities. In particular, we will continue to strengthen fine wine brands, including the Japanese wine Grande Polaire and our imported wines. We will also continue to propose new ways to enjoy the world’s No. 1 rum brand, Bacardi, and intensify our development of collaborative products for increasing unique value in RTD beverages, such as Otoko Ume Sour.
Outlook for 2016
The Sapporo Group started activities to support recovery in disaster-affected areas immediately following the Great East Japan Earthquake that struck on March 11, 2011. In 2012, Sapporo Breweries set up the “Tohoku Future Project” inside its Tohoku Headquarters and has since been engaged in support activities to meet the needs of the affected areas under three priority themes: (1) promoting consumption of local products, (2) disseminating information, and (3) raising the next generation. In 2015, Sapporo Breweries launched sales of Sapporo Draft Beer Black Label Tohoku Hop 100%, which uses hops solely from Tohoku produced through the Collaborative Contract Farming System. The product was only sold in the six prefectures of the Tohoku region, and part of the proceeds were donated to the Smile Tohoku Project, which aims to grow flowers in disaster-affected areas. Sapporo Breweries will continue to engage in support activities to bring smiles to the faces of people in disaster-affected areas.
Activities Supporting Recovery in Tohoku
ESG TOPIC
Promoting consumption of local products
We support the economy and lifestyles of the Tohoku region by promoting consumption of products produced in Tohoku.
Disseminating information
We disseminate information to enable people throughout Japan to always be aware of Tohoku.
Raising the next generation
We support the young generation that will carry the future for Tohoku.
Three priority themes for support activities
SAPPORO HOLDINGS LIMITED Annual Report 2015 15
Developing a strong presence in the premium markets of North America and Southeast Asia
Key Strategies under Sapporo Group Management Plan 2016
■ North America: Strengthen premium brands of SLEEMAN in the Canadian beer market and sustain growth.
■ Strengthen the SAPPORO PREMIUM brand of Sapporo U.S.A. by increasing focus on the Asian-American market.
■ Southeast Asia: Maximize the impact of the renewal of SAPPORO PREMIUM at Sapporo Vietnam, bolster brand strength, and expand the sales area.
■ Pursue synergies with Silver Spring Citrus and Country Pure Foods in the U.S. soft drinks business.
Performance Review and Plan
Net sales Operating income and Operating income to net sales
Note: Figures are before goodwill amortization.
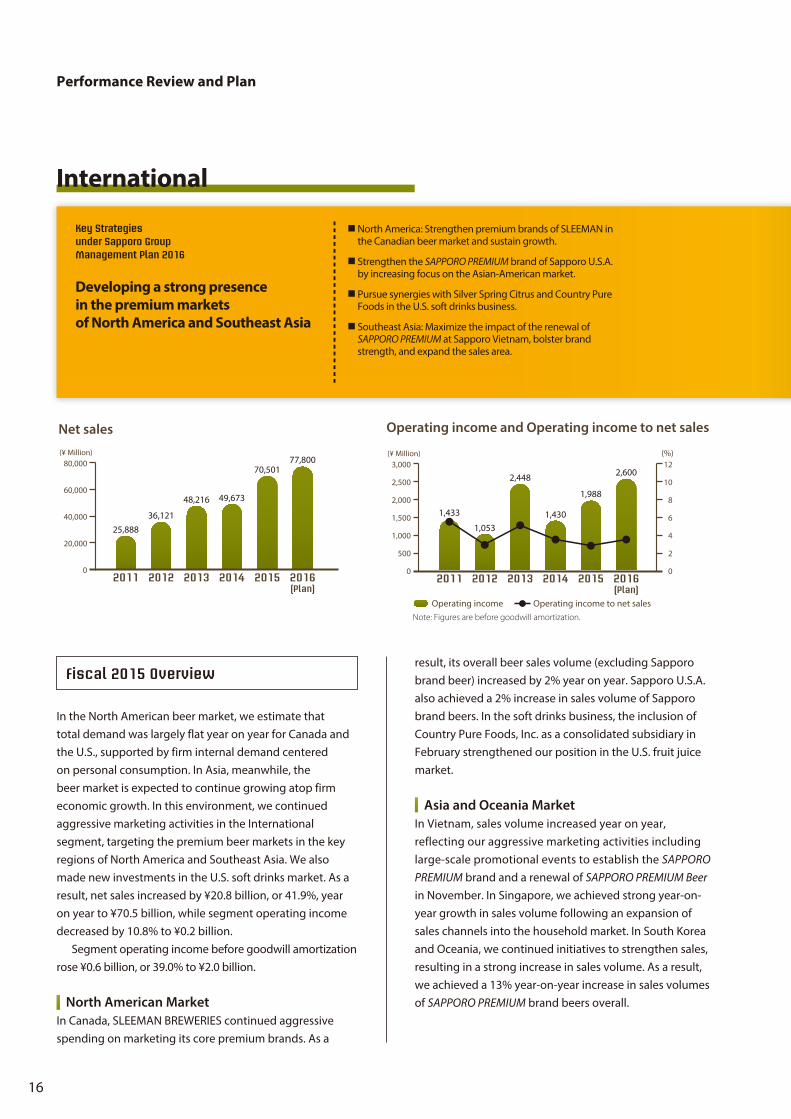
result, its overall beer sales volume (excluding Sapporo brand beer) increased by 2% year on year. Sapporo U.S.A. also achieved a 2% increase in sales volume of Sapporo brand beers. In the soft drinks business, the inclusion of Country Pure Foods, Inc. as a consolidated subsidiary in February strengthened our position in the U.S. fruit juice market.
Asia and Oceania MarketIn Vietnam, sales volume increased year on year, reflecting our aggressive marketing activities including large-scale promotional events to establish the SAPPORO PREMIUM brand and a renewal of SAPPORO PREMIUM Beer in November. In Singapore, we achieved strong year-on-year growth in sales volume following an expansion of sales channels into the household market. In South Korea and Oceania, we continued initiatives to strengthen sales, resulting in a strong increase in sales volume. As a result, we achieved a 13% year-on-year increase in sales volumes of SAPPORO PREMIUM brand beers overall.
In the North American beer market, we estimate that total demand was largely flat year on year for Canada and the U.S., supported by firm internal demand centered on personal consumption. In Asia, meanwhile, the beer market is expected to continue growing atop firm economic growth. In this environment, we continued aggressive marketing activities in the International segment, targeting the premium beer markets in the key regions of North America and Southeast Asia. We also made new investments in the U.S. soft drinks market. As a result, net sales increased by ¥20.8 billion, or 41.9%, year on year to ¥70.5 billion, while segment operating income decreased by 10.8% to ¥0.2 billion. Segment operating income before goodwill amortization rose ¥0.6 billion, or 39.0% to ¥2.0 billion.
North American MarketIn Canada, SLEEMAN BREWERIES continued aggressive spending on marketing its core premium brands. As a
(¥ Million)
25,88836,121
48,216 49,673
77,80070,501
2016(Plan)
201520142013201220110
20,000
40,000
60,000
80,000
Operating income to net salesOperating income
(¥ Million) (%)
2016(Plan)
20152014201320122011
1,433
1,053
2,448
1,430
2,600
1,988
0
500
1,000
1,500
2,000
2,500
3,000
0
2
4
6
8
10
12
Fiscal 2015 Overview
International
16
pursuing synergies between them, and to expand their sales and profits by acquiring new sales channels and other measures. The Southeast Asian beer market is expected to continue growing. In the Vietnamese market, we aim to expand sales and profits through effective and efficient investment in marketing and sales activities with clearly defined targets, as well as through the renewal of Sapporo Premium Beer.
■ SAPPORO INTERNATIONAL INC.■ SAPPORO U.S.A., INC.■ SAPPORO CANADA INC.■ SLEEMAN BREWERIES LTD.■ SAPPORO ASIA PRIVATE LIMITED■ SAPPORO VIETNAM LIMITED■ SILVER SPRINGS CITRUS, INC.■ COUNTRY PURE FOODS, INC
Despite expectations for economic expansion in North America, overall demand in the beer market is expected to remain largely flat in 2016. In the Canadian market, SLEEMAN BREWERIES plans to focus marketing expenditure on enhancing the value of its core premium brands, while aiming to achieve its profit goals and expand its market share by introducing value brands that meet needs in areas that are expected to grow. In the U.S. market, Sapporo U.S.A. plans to build a wider presence for the Sapporo Premium brand by strengthening marketing to the Asian-American population. In the U.S. soft drinks market, we plan to strengthen the business foundations of Silver Springs Citrus, Inc. and Country Pure Foods, Inc. by
Outlook for 2016
Safety and Quality Certification Acquired for a Beverage Production Factory in the U.S.
In the U.S., the Sapporo Group entered the soft drinks business in 2012, in addition to the alcohol beverages business. Silver Springs Citrus, Inc., a beverage manufacturer, acquired certification at Level 3, the highest level, of SQF* for management of food safety and quality. Country Pure Foods, Inc., which was added to the Group in February 2015, has also acquired certification at its four factories.
* Safe Quality Food (SQF): A comprehensive food safety and quality management system implemented mainly by the U.S. National Retail Federation.
ESG TOPIC
Silver Springs Citrus quality controllers
SAPPORO HOLDINGS LIMITED Annual Report 2015 17

Performance Review and Plan
Net sales Operating income and Operating income to net sales
Note: Figures are before goodwill amortization.
Segment operating income before goodwill amortization rose ¥0.1 billion, or 3.2% to ¥2.7 billion.
Domestic Food and Soft Drinks BusinessIn domestic soft drinks, we created new markets with strong sales of Kireto Lemon (bottled) and the launch of the energy drink Kireto Lemon-ENERGIE. In domestic products, POKKA LEMON 100 retained its strong performance even after a price revision, and sales volume for lemon-based products increased 4% year on year. Instant soup sales volume grew 10% year on year, with a successful renewal of Jikkuri Kotokoto boxed soup.
Domestic Restaurants BusinessAmid a continuing adverse environment marked by increasing procurement costs and personnel expenses, the Café de Crié coffee shop chain achieved year-on-year sales growth atop solid sales at existing shops and aggressively opened shops in collaboration with bookstores and inside hospitals.
We estimate that domestic demand for soft drinks edged up 1%, with demand for lemon-based products (flavorings) also estimated to have increased. However, we estimate that demand for instant soups fell back owing to the impact of warm weather from November onwards. The Food & Soft Drinks segment began its third year of operations at POKKA SAPPORO Food & Beverage Ltd. We concentrated investments on core brands in order to strengthen and cultivate them, while working on our management priorities of strengthening our sales capabilities and reducing costs. In the overseas soft drinks business, the POKKA brand retained top share in the tea drinks category in the Singapore market and also achieved the top share in the non-chilled fruit juices category, which grew into a second business pillar to follow tea drinks. As a result of the above, the Food & Soft Drinks segment recorded net sales of ¥135.7 billion, up ¥2.2 billion, or 1.7%, year on year, and posted segment operating income of ¥0.4 billion, up ¥0.3 billion, or 258.5%.
0
50,000
100,000
150,000(¥ Million)
108,061
129,017 130,672 133,439 135,671 143,700
2016(Plan)
20152014201320122011
Operating income to net salesOperating income
(%)
0
1,000
2,000
3,000
6,000
5,000
4,000
0
1
2
3
6
4
5
(¥ Million)5,745
3,117
1,245
2,628
3,900
2,713
2016(Plan)
20152014201320122011
Food & Soft Drinks
Fiscal 2015 Overview
Move on to the next stage through enhancement of core brand strengths with a focus on lemon-based products and soups and earnings structure reforms
Key Strategies under Sapporo Group Management Plan 2016
■ Domestic soft drinks: Plan introduction of new products offering new values from the Kireto Lemon brand.
■ Domestic food: Disseminate the health value of lemons by expanding the customer base for lemon-based flavorings, clarify targets for introducing new soup brand series.
■ Overseas soft drinks: Maintain the top share in the tea drinks and non-chilled fruit juice drinks markets in Singapore, and nurture the next pillar of the business.
■ Expand sales by developing the model of local production in sales areas such as Indonesia and Myanmar.
18

enrich and brighten people’s lives.” In the domestic food and soft drinks business, we will launch new products that offer new value from our core Kireto Lemon brand and enhance its earnings capability by ensuring a low-cost operation to develop the foundation for growth. In the instant soup category, we will strengthen the Jikkuri Kotokoto lineup and strive to stimulate demand growth in the soup market by launching a new brand. In the soy milk drinks and soy milk yogurt category, which we entered in 2015, we will aim to expand sales by disseminating the health value of these products alongside that of lemon. In the domestic restaurants business, the Café de Crié chain will undertake detailed marketing at the individual shop level to boost brand value and accelerate growth. In the overseas soft drinks business, we plan to increase our advantage in tea beverages and fruit juices in our mainstay Singapore market. We will also strengthen our partnerships with leading brands to expand sales and increase efficiency.
■ POKKA SAPPORO FOOD & BEVERAGE LTD.
■ POKKA CREATE CO., LTD.■ PS BEVERAGE LTD.■ STAR BEVERAGE SERVICE CO., LTD.■ POKKA SAPPORO HOKKAIDO LTD.■ NIHON BEANS CO., LTD.■ POKKA CORPORATION
(SINGAPORE) PTE. LTD.■ POKKA INTERNATIONAL PTE LTD. ■ PT. POKKA DIMA INTERNATIONALand another 8 companies
Overseas Soft Drinks BusinessIn Indonesia, where sales expansion is expected, POKKA CORPORATION (Singapore) PTE. LTD. and PT. Dima Indonesia established a joint venture to manufacture and sell soft drinks. The joint venture began construction of a new plant, which it plans to start up in 2016. Furthermore, the Restaurants business in Hong Kong was sold in December 2014.
Japan’s soft drinks industry is expected to continue experiencing challenging conditions with lackluster demand overall, intense competition, the impact of foreign exchange rates, and so forth. In this environment, we plan to deliver new value to customers in areas where we have distinctive advantages with a thorough understanding of the customers’ perspectives, under our vision to “continue to create new delicious products that
Outlook for 2016
We introduced the industry’s first sterilization technology, high electric field alternating current (HEF-AC)*, for the POKKA Lemon 100 production line at POKKA SAPPORO’s No. 3 Factory in Nagoya and improved the quality of lemon-based products compared with conventional heat-sterilization methods.
* High electric field alternating current (HEF-AC): A technology that sterilizes food quickly and efficiently by running an electric current through it.
Industry-First Sterilization Technology Improves the Quality of Lemon-Based Products
ESG TOPIC
POKKA Lemon 100 production line
SAPPORO HOLDINGS LIMITED Annual Report 2015 19
Performance Review and Plan
Net sales Operating income and Operating income to net sales
Note: Figures are before goodwill amortization.
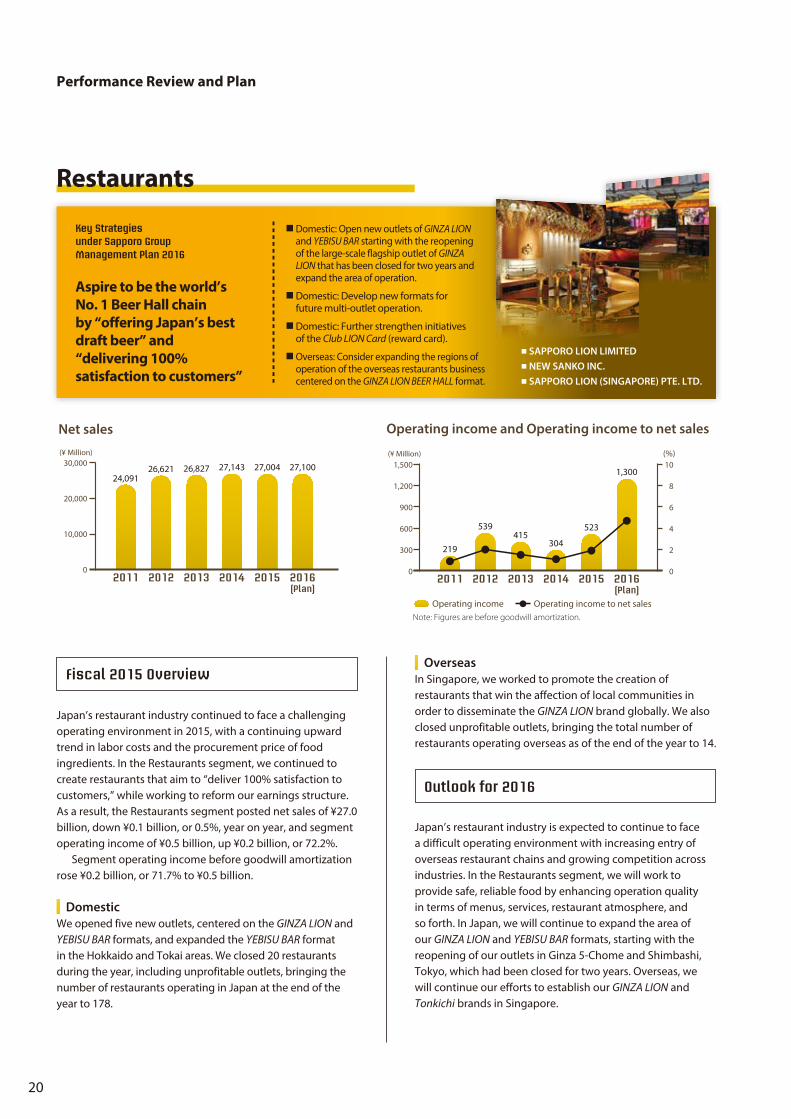
OverseasIn Singapore, we worked to promote the creation of restaurants that win the affection of local communities in order to disseminate the GINZA LION brand globally. We also closed unprofitable outlets, bringing the total number of restaurants operating overseas as of the end of the year to 14.
Japan’s restaurant industry is expected to continue to face a difficult operating environment with increasing entry of overseas restaurant chains and growing competition across industries. In the Restaurants segment, we will work to provide safe, reliable food by enhancing operation quality in terms of menus, services, restaurant atmosphere, and so forth. In Japan, we will continue to expand the area of our GINZA LION and YEBISU BAR formats, starting with the reopening of our outlets in Ginza 5-Chome and Shimbashi, Tokyo, which had been closed for two years. Overseas, we will continue our efforts to establish our GINZA LION and Tonkichi brands in Singapore.
Japan’s restaurant industry continued to face a challenging operating environment in 2015, with a continuing upward trend in labor costs and the procurement price of food ingredients. In the Restaurants segment, we continued to create restaurants that aim to “deliver 100% satisfaction to customers,” while working to reform our earnings structure. As a result, the Restaurants segment posted net sales of ¥27.0 billion, down ¥0.1 billion, or 0.5%, year on year, and segment operating income of ¥0.5 billion, up ¥0.2 billion, or 72.2%. Segment operating income before goodwill amortization rose ¥0.2 billion, or 71.7% to ¥0.5 billion.
DomesticWe opened five new outlets, centered on the GINZA LION and YEBISU BAR formats, and expanded the YEBISU BAR format in the Hokkaido and Tokai areas. We closed 20 restaurants during the year, including unprofitable outlets, bringing the number of restaurants operating in Japan at the end of the year to 178.
0
10,000
20,000
30,000(¥ Million)
24,09126,621 26,827 27,143 27,004 27,100
2016(Plan)
20152014201320122011
(¥ Million) (%)
219
539415
304
523
1,300
2016(Plan)
201520142013201220110
2
4
6
8
10
Operating income to net salesOperating income
0
300
600
900
1,200
1,500
Restaurants
Fiscal 2015 Overview
Outlook for 2016
Aspire to be the world’s No. 1 Beer Hall chain by “offering Japan’s best draft beer” and “delivering 100% satisfaction to customers”
Key Strategies under Sapporo Group Management Plan 2016
■ Domestic: Open new outlets of GINZA LION and YEBISU BAR starting with the reopening of the large-scale flagship outlet of GINZA LION that has been closed for two years and expand the area of operation.
■ Domestic: Develop new formats for future multi-outlet operation.
■ Overseas: Consider expanding the regions of operation of the overseas restaurants business centered on the GINZA LION BEER HALL format.
■ Domestic: Further strengthen initiatives of the Club LION Card (reward card).
■ SAPPORO LION LIMITED■ NEW SANKO INC.■ SAPPORO LION (SINGAPORE) PTE. LTD.
20
(¥ Million)
22,468 23,217 22,76821,510
22,80020,872
2016(Plan)
201520142013201220110
5,000
10,000
15,000
20,000
25,000(¥ Million) (%)
0
2,000
4,000
6,000
8,000
10,000
0
10
20
30
40
508,553
9,3968,703
7,696
10,000
8,282
2016(Plan)
20152014201320122011
Operating income to net salesOperating income
Operating income and Operating income to net sales
Note: Figures are before goodwill amortization.
new design based on the concept of “Quality of Daily Life,” as we sought to re-energize and reinvigorate the area.
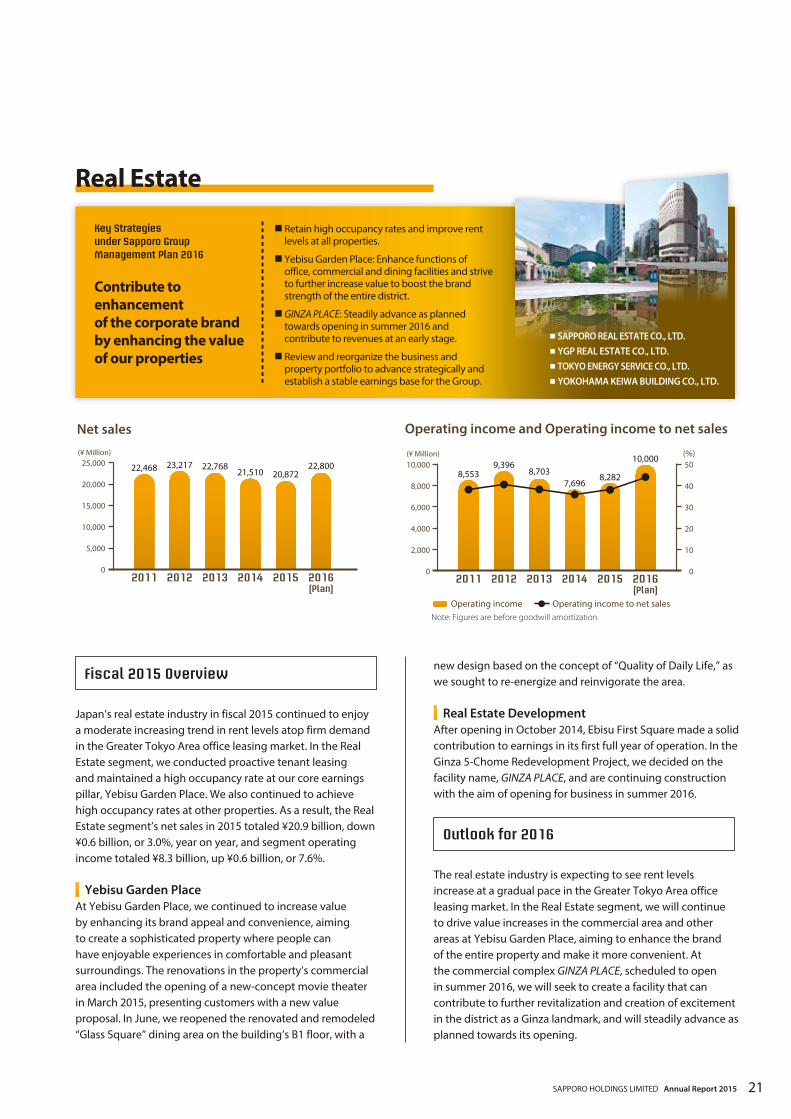
Real Estate DevelopmentAfter opening in October 2014, Ebisu First Square made a solid contribution to earnings in its first full year of operation. In the Ginza 5-Chome Redevelopment Project, we decided on the facility name, GINZA PLACE, and are continuing construction with the aim of opening for business in summer 2016.
The real estate industry is expecting to see rent levels increase at a gradual pace in the Greater Tokyo Area office leasing market. In the Real Estate segment, we will continue to drive value increases in the commercial area and other areas at Yebisu Garden Place, aiming to enhance the brand of the entire property and make it more convenient. At the commercial complex GINZA PLACE, scheduled to open in summer 2016, we will seek to create a facility that can contribute to further revitalization and creation of excitement in the district as a Ginza landmark, and will steadily advance as planned towards its opening.
Japan’s real estate industry in fiscal 2015 continued to enjoy a moderate increasing trend in rent levels atop firm demand in the Greater Tokyo Area office leasing market. In the Real Estate segment, we conducted proactive tenant leasing and maintained a high occupancy rate at our core earnings pillar, Yebisu Garden Place. We also continued to achieve high occupancy rates at other properties. As a result, the Real Estate segment’s net sales in 2015 totaled ¥20.9 billion, down ¥0.6 billion, or 3.0%, year on year, and segment operating income totaled ¥8.3 billion, up ¥0.6 billion, or 7.6%.
Yebisu Garden PlaceAt Yebisu Garden Place, we continued to increase value by enhancing its brand appeal and convenience, aiming to create a sophisticated property where people can have enjoyable experiences in comfortable and pleasant surroundings. The renovations in the property’s commercial area included the opening of a new-concept movie theater in March 2015, presenting customers with a new value proposal. In June, we reopened the renovated and remodeled “Glass Square” dining area on the building’s B1 floor, with a
Net sales
Real Estate
Fiscal 2015 Overview
Outlook for 2016
Contribute to enhancement of the corporate brandby enhancing the value of our properties
Key Strategies under Sapporo Group Management Plan 2016
■ Retain high occupancy rates and improve rent levels at all properties.
■ Yebisu Garden Place: Enhance functions of office, commercial and dining facilities and strive to further increase value to boost the brand strength of the entire district.
■ GINZA PLACE: Steadily advance as planned towards opening in summer 2016 and contribute to revenues at an early stage.
■ Review and reorganize the business and property portfolio to advance strategically and establish a stable earnings base for the Group.
■ SAPPORO REAL ESTATE CO., LTD.■ YGP REAL ESTATE CO., LTD.■ TOKYO ENERGY SERVICE CO., LTD.■ YOKOHAMA KEIWA BUILDING CO., LTD.
SAPPORO HOLDINGS LIMITED Annual Report 2015 21
CSR Activities
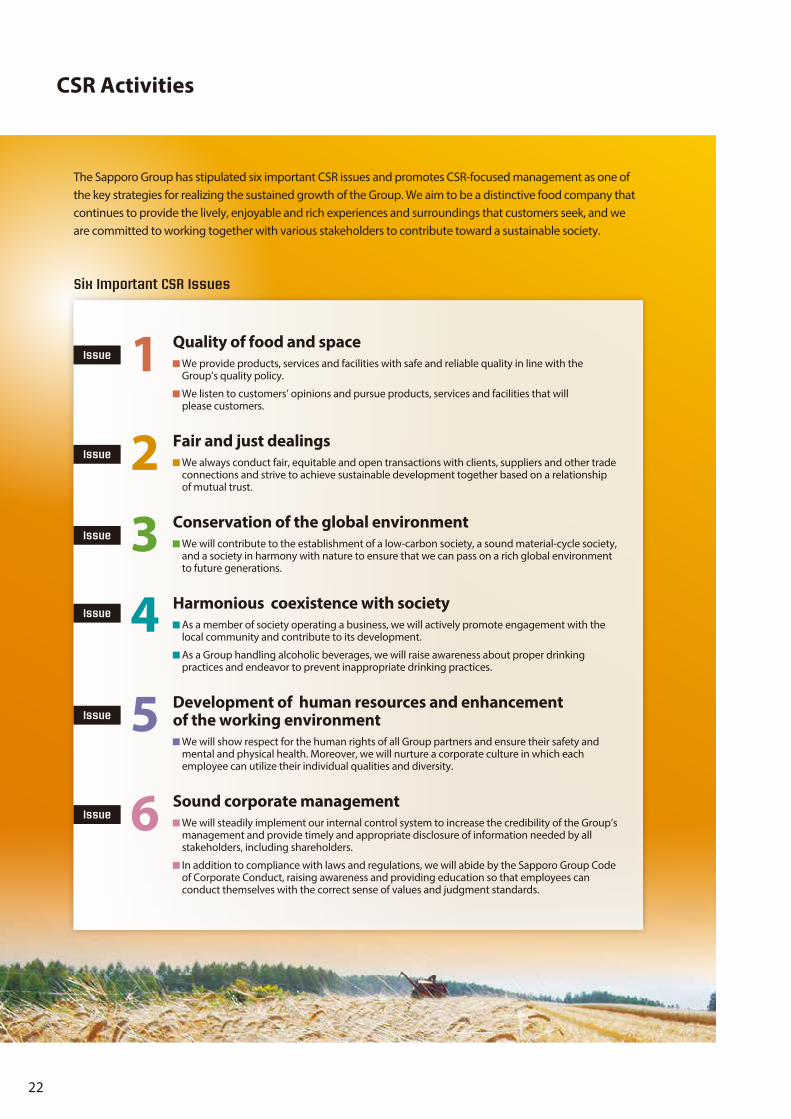
The Sapporo Group has stipulated six important CSR issues and promotes CSR-focused management as one of the key strategies for realizing the sustained growth of the Group. We aim to be a distinctive food company that continues to provide the lively, enjoyable and rich experiences and surroundings that customers seek, and we are committed to working together with various stakeholders to contribute toward a sustainable society.
6Issue
5Issue
4Issue
3Issue
2Issue
1Issue
We will steadily implement our internal control system to increase the credibility of the Group’s management and provide timely and appropriate disclosure of information needed by all stakeholders, including shareholders.
In addition to compliance with laws and regulations, we will abide by the Sapporo Group Code of Corporate Conduct, raising awareness and providing education so that employees can conduct themselves with the correct sense of values and judgment standards.
Sound corporate management
We will show respect for the human rights of all Group partners and ensure their safety and mental and physical health. Moreover, we will nurture a corporate culture in which each employee can utilize their individual qualities and diversity.
Development of human resources and enhancement of the working environment
As a member of society operating a business, we will actively promote engagement with the local community and contribute to its development.
As a Group handling alcoholic beverages, we will raise awareness about proper drinking practices and endeavor to prevent inappropriate drinking practices.
Harmonious coexistence with society
We will contribute to the establishment of a low-carbon society, a sound material-cycle society, and a society in harmony with nature to ensure that we can pass on a rich global environment to future generations.
Conservation of the global environment
We always conduct fair, equitable and open transactions with clients, suppliers and other trade connections and strive to achieve sustainable development together based on a relationship of mutual trust.
Fair and just dealings
We provide products, services and facilities with safe and reliable quality in line with the Group’s quality policy.
We listen to customers’ opinions and pursue products, services and facilities that will please customers.
Quality of food and space
Six Important CSR Issues
22
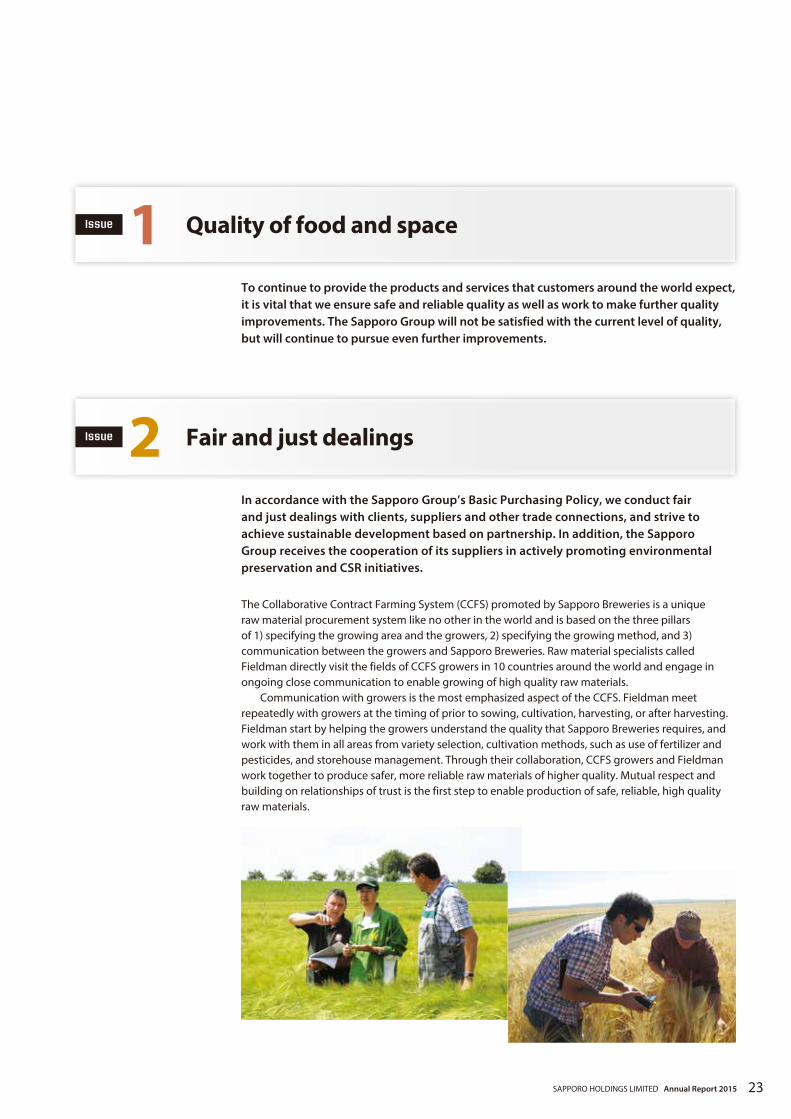
The Collaborative Contract Farming System (CCFS) promoted by Sapporo Breweries is a unique raw material procurement system like no other in the world and is based on the three pillars of 1) specifying the growing area and the growers, 2) specifying the growing method, and 3) communication between the growers and Sapporo Breweries. Raw material specialists called Fieldman directly visit the fields of CCFS growers in 10 countries around the world and engage in ongoing close communication to enable growing of high quality raw materials. Communication with growers is the most emphasized aspect of the CCFS. Fieldman meet repeatedly with growers at the timing of prior to sowing, cultivation, harvesting, or after harvesting. Fieldman start by helping the growers understand the quality that Sapporo Breweries requires, and work with them in all areas from variety selection, cultivation methods, such as use of fertilizer and pesticides, and storehouse management. Through their collaboration, CCFS growers and Fieldman work together to produce safer, more reliable raw materials of higher quality. Mutual respect and building on relationships of trust is the first step to enable production of safe, reliable, high quality raw materials.
1 Quality of food and spaceIssue
To continue to provide the products and services that customers around the world expect, it is vital that we ensure safe and reliable quality as well as work to make further quality improvements. The Sapporo Group will not be satisfied with the current level of quality, but will continue to pursue even further improvements.
2 Fair and just dealingsIssue
In accordance with the Sapporo Group’s Basic Purchasing Policy, we conduct fair and just dealings with clients, suppliers and other trade connections, and strive to achieve sustainable development based on partnership. In addition, the Sapporo Group receives the cooperation of its suppliers in actively promoting environmental preservation and CSR initiatives.
SAPPORO HOLDINGS LIMITED Annual Report 2015 23

CSR Activities
At every stage of our products and services in every one of our business domains, all of our employees are giving consideration to the global environment and making proactive efforts to help realize a sustainable society. In August 2015, the Sapporo Group formulated its medium-term environmental policy, “Activities to Protect the Global Environment 2030.” To realize a sustainable society looking toward 2030, the Sapporo Group will collaborate with various regions around the world where it engages in business and strive to employ innovative technologies and methods, aiming to consider the environment in all business activities, including development and provision of products and services.
3 Conservation of the global environmentIssue
The Sapporo Group’s Activities to Protect the Global Environment 2030
Prevention of global warming
Due to a deterioration of the emissions coefficient, the CO2 emission intensity in 2014 was reduced by 4.1%, but as a result of energy-saving measures implemented at each operating company the energy consumption intensity was reduced by 11.4% compared to 2009, which exceeded plans.
Reduce CO2 emissions generated in business activities by 12% compared to 2013
2010 2011 2012 2013 2014
Reduction of CO2 emission intensity (compared to 2009) 94.1% 90.5% 97.6% 99.3% 95.9%
Reference: Reduction of energy consumption intensity (compared to 2009)
97.0% 93.1% 91.9% 88.2% 85.6%
* Under its previous environmental medium-term objective, the Sapporo Group aimed for a 7% reduction of its overall CO2
emission intensity compared to fiscal 2009.
Coexistence with natureWe will take full advantage of the strengths of each business and endeavor to beautify the environment and preserve biodiversity.
Promoting the 3Rs (Reduce/Reuse/Recycle)The Sapporo Group strives to promote reducing, reusing and recycling in all business activities from raw materials procurement through to disposal and recycling.
Sapporo Breweries has been moving ahead with initiatives to lighten aluminum beer cans since 2012. The amount of aluminum used has been reduced by 4.4% in 350 ml cans and 3.2% in 500 ml cans. All beer products will be switched to lighter cans by 2016.
Topic
24

4 Harmonious coexistence with societyIssue
5 Development of human resources and enhancement of the working environment
Issue
We consider all employees to be corporate assets, and strive to provide workplaces that are comfortable. To enable each employee to fully utilize their strengths, we are promoting diversity and building an organization that will utilize it.
Promotion of Diversity in the Sapporo Group
2011 2012 2013 2014 2015
No. of employees
Total 3,987 4,029 4,048 3,920 4,019
No. of women 606 631 648 623 694
No. of managers
Total 1,002 1,027 997 927 931
No. of women 18 25 27 22 24Ratio of women in management 1.8% 2.4% 2.7% 2.4% 2.6%
* Until 2012, the data shows the total from Sapporo Holdings, Sapporo Breweries, Sapporo Beverage, POKKA CORPORATION, Sapporo Lion, and Sapporo Real Estate (including employees on assignment at subsidiaries or affiliated companies).
* From 2013, the data shows the total from Sapporo Holdings, Sapporo Breweries, POKKA SAPPORO Food & Beverage, Sapporo Lion, and Sapporo Real Estate (including employees on assignment at subsidiaries or affiliated companies).
Fair employment of human resourcesThe Sapporo Group upholds the principle of fair employment of human resources based on a spirit of openness and fairness, disregarding matters such as nationality, gender, and academic background. Each Group company formulates an employment policy that considers the characteristics and environment of its business to employ diverse human resources.
The Sapporo Group is grateful for the support of local communities and works to communicate and deepen relations with local communities while continuing various activities to contribute to society. Moreover, taking responsibility as a corporate group involved in the alcoholic beverages business, the Group continues awareness-raising activities regarding proper drinking practices.
Topic The Sapporo Group undertakes various activities in the area where it was founded. It holds beer festivals in Sapporo and Ebisu, two areas in which it has historically deep ties, and each year over 250,000 people enjoy beer at these events.
Holding the Sapporo Beer Festival and Yebisu Beer Festival
SAPPORO HOLDINGS LIMITED Annual Report 2015 25
CSR Activities
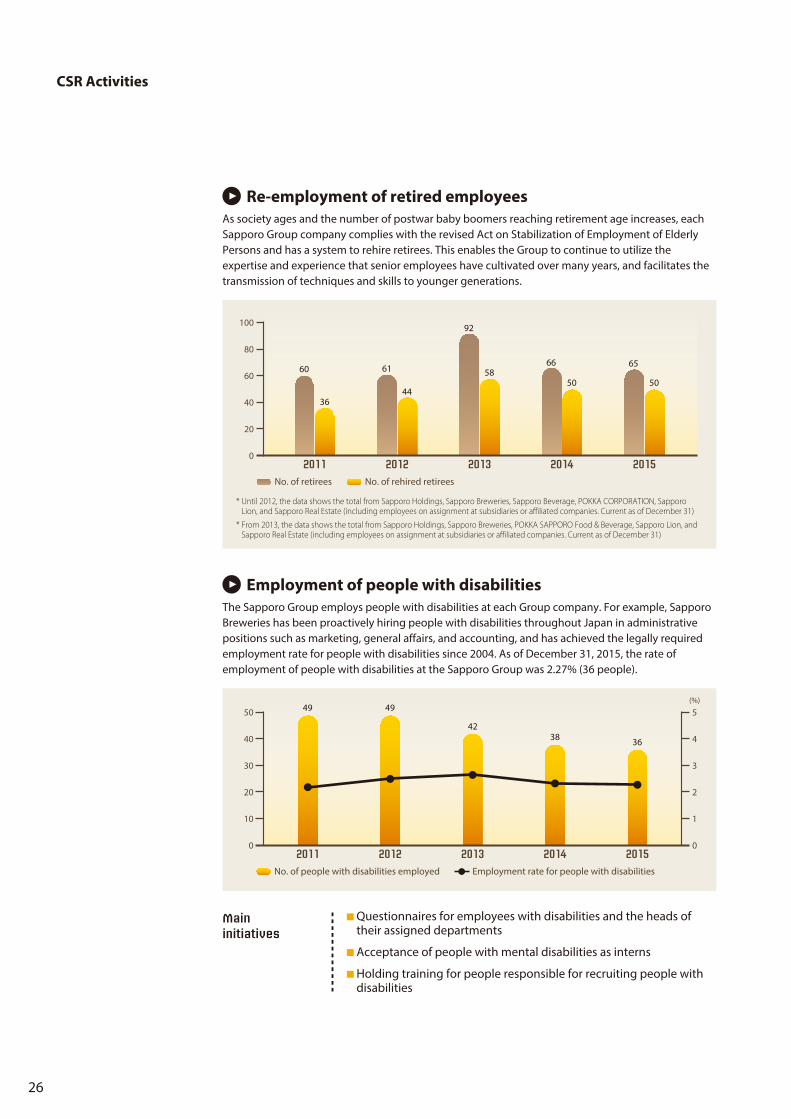
Re-employment of retired employeesAs society ages and the number of postwar baby boomers reaching retirement age increases, each Sapporo Group company complies with the revised Act on Stabilization of Employment of Elderly Persons and has a system to rehire retirees. This enables the Group to continue to utilize the expertise and experience that senior employees have cultivated over many years, and facilitates the transmission of techniques and skills to younger generations.
(%)
No. of people with disabilities employed
49 49
4238 36
201520142013201220110
10
20
30
40
50
0
1
2
3
4
5
Employment rate for people with disabilities
Employment of people with disabilitiesThe Sapporo Group employs people with disabilities at each Group company. For example, Sapporo Breweries has been proactively hiring people with disabilities throughout Japan in administrative positions such as marketing, general affairs, and accounting, and has achieved the legally required employment rate for people with disabilities since 2004. As of December 31, 2015, the rate of employment of people with disabilities at the Sapporo Group was 2.27% (36 people).
Main initiatives
Questionnaires for employees with disabilities and the heads of their assigned departments
Acceptance of people with mental disabilities as interns
Holding training for people responsible for recruiting people with disabilities
No. of retirees No. of rehired retirees
60
36
61
44
92
5866
50
65
50
201520142013201220110
20
40
60
80
100
* Until 2012, the data shows the total from Sapporo Holdings, Sapporo Breweries, Sapporo Beverage, POKKA CORPORATION, Sapporo Lion, and Sapporo Real Estate (including employees on assignment at subsidiaries or affiliated companies. Current as of December 31)
* From 2013, the data shows the total from Sapporo Holdings, Sapporo Breweries, POKKA SAPPORO Food & Beverage, Sapporo Lion, and Sapporo Real Estate (including employees on assignment at subsidiaries or affiliated companies. Current as of December 31)
26

6 Sound corporate managementIssue
The Sapporo Group is strengthening corporate governance to ensure sound corporate management and transparency, as well as striving for timely and appropriate information disclosure. We also conduct training and awareness-raising programs for all employees to increase their awareness and understanding of compliance issues.
Interview with a Director
The Sapporo Group has positioned promotion of diversity as an important CSR issue to contribute toward a sustainable society, and proactively implements it. This approach is based on our belief that diversity within the Company is extremely important for a Group that deals in consumer goods and strives to provide value by offering products and services that respond to customers’ diverse needs. The Group’s concept for personnel is the directive “Go Beyond Boundaries” and we are continuing to convey the message that employees should overcome personal barriers, take on organizational obstacles, cross national borders and move outside of their own boundaries. I believe this is an indispensable element in realizing our management philosophy “As an intrinsic part of people’s lives, Sapporo will contribute to the evolution of creative, enriching and rewarding lifestyles.” Moreover, I don’t think a high degree of homogeneity among employees is always something to rate highly nowadays. In the Sapporo Group, all employees are highly loyal toward the Company and products. That is absolutely wonderful. Furthermore, mixing a variety of opinions creates value and combining diverse skills is needed to create innovation. Promoting roles for women is an element of diversity and in this regard the Group can be praised for initiatives that exceed legal requirements in areas such as measures to enable work while raising children. However, there is still the situation where the ratio of female managers in Japan is still only a few percent. On the other hand, there has been an increase in the number of women recruited and the base
has been laid to boost the number of female managers going forward. Of course, it goes without saying that the objective is not simply to raise the number, but also to aim for new value creation. The Group is also fastidious about employee training. In addition to grade-based and divisional training there are also original Sapporo Group programs for career formation, for example, global training to nurture young employees and experiential training such as making proposals to management and new business creation for employees in their early 30s and other topics. My theory is that for a company’s business to succeed, its human resources department must toil and moil. Looking ahead therefore, I will actively take a hands-on approach with employees and will exchange opinions with them. Doing this will lead to ensuring things happen at the right time with the right people in the right positions. We are confronting a time when it is perfectly natural to be active on the global stage, and creating the blueprint for globally oriented personnel will be a key priority going forward. I want to create opportunities for discussions among human resources from overseas Group companies. Finally, I happen to be the Sapporo Group’s first ever female director. I will not let that end here. I will continue to back-up women following me and make it my priority to speed up the pace of developing and appointing women. By promoting diversity in various ways such as these, it will be possible to provide customers with a wide variety of services and products. Please have high expectations for our activities moving forward.
Based on a Message of “Go Beyond Boundaries,” Promote Diversity and Aim for New Value Creation
Mayumi FukuharaDirector (Member of the Board), Director of Human Resources Department of the Company
SAPPORO HOLDINGS LIMITED Annual Report 2015 27
Corporate Governance
One year has passed since being appointed as an outside director of Sapporo Holdings and I was reminded just how important to view things from the consumer’s perspective in a group engaged mainly in a B-to-C business. I recognized this again at the General Meeting of Shareholders when I observed the sheer number of those in attendance, in addition to how many questions were made from the perspective of consumers. Those aspects made me feel acutely aware of the extreme importance of the issues of quality and safety for a food manufacturer. Last year, during an executives’ retreat, we went on a tour of the Shizuoka Brewery, and I’m grateful we were provided with the opportunity to gain a greater understanding of the details of Sapporo’s business, including through the regular business briefings. I have conveyed my request to the Group to directly look around some overseas bases, such as the one in Vietnam. This is because I think developments in places such as Vietnam and North America will be important for Sapporo in the future. At the Board of Directors’ meetings there were lively exchanges of opinions, so they are functioning well. There has also been proactive engagement with outside directors. In addition, the Group’s actions show that it is approaching disclosure from the viewpoint of overseas investors and with International Financial Reporting Standards in mind. An example of this would be the disclosing of operating results before amortization of goodwill. I would like to make a request for more opportunities to exchange opinions with operating officers, not just those from Sapporo Holdings, but also from various operating companies such as SAPPORO BREWERIES and POKKA SAPPORO Food & Beverage. Now, the Group has a preponderance of younger
executives, so I think it could be useful to have somewhere for them to have discussions with those of us who have more experience. I think it’s important to have a variety of types of dialogue. One epoch-making event is that due to an internal promotion, Sapporo Holdings has a female director from this fiscal year. Unfortunately, there are still only a few examples of this to be seen among Japanese companies. It is not only enviable, to be honest, that the working environment at Sapporo Holdings is so open-minded, but it is also a testament to the many capable employees at the Group. I take pride in outside directors being supervisors for the Group. Our role is to support business activities and corporate operations while occasionally voicing critical opinions. There are various factors to consider, such as a fiercely competitive industry, overseas development, implementation of various initiatives and M&As. I would like to provide advice from an external viewpoint on matters such as global cash management. Furthermore, there is a need for the “Corporate Governance Code” to be introduced and for management to show a greater understanding of investors’ viewpoints. I believe Japanese companies are all seeking ways to be able to do this, but their responses vary depending on their type of business, and it is necessary to think about this while taking into account the Group’s characteristics. In this regard, the multifaceted view of an outside director will act as a monitor that can support the sound growth of a company.
Interview with an Outside Director
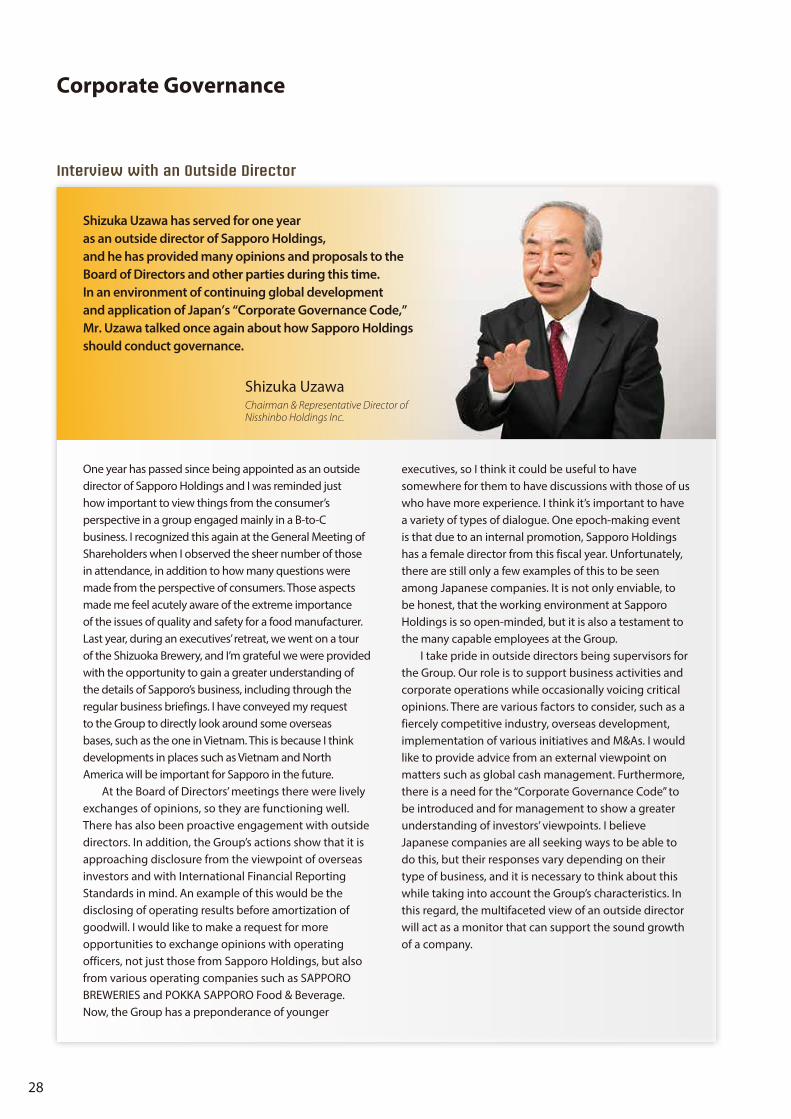
Shizuka UzawaChairman & Representative Director ofNisshinbo Holdings Inc.
Shizuka Uzawa has served for one year as an outside director of Sapporo Holdings, and he has provided many opinions and proposals to the Board of Directors and other parties during this time. In an environment of continuing global development and application of Japan’s “Corporate Governance Code,” Mr. Uzawa talked once again about how Sapporo Holdings should conduct governance.
28

Basic Governance ApproachThe Sapporo Group has enacted the “Basic Policy on Corporate Governance”* for the purpose of specifying its thinking and operational policy regarding corporate governance with the goal of attaining sustained growth and enhancement of corporate value over the medium to long term, and in light of the purport and spirit of the “Corporate Governance Code” set forth in the Listing Rules of the Tokyo Stock Exchange. As part of the policy, the Group’s basic philosophy is to regard strengthening and enhancing corporate governance as one of its top management priorities. The Group is working to clarify supervisory, business execution and auditing functions throughout the Group under the holding company framework. The Group is also working to strengthen management supervisory functions to increase management transparency and achieve management goals.* Basic Policy on Corporate Governance http://www.sapporoholdings.jp/english/ir/management/pdf/basic_governance_
approach.pdf
Basic Policy on Corporate Governance
I. General ProvisionsII. Ensuring Shareholders’ Rights and EqualityIII. Appropriate Collaborations with StakeholdersIV. Ensuring Appropriate Disclosures of Information
and TransparencyV. Duties of the Board of Directors, etc.VI. Dialogue with Shareholders
Corporate Functions and Internal Control Relationships
Election/Supervision
Monitoring
Appointment/Dismissal Appointment/Dismissal
Advice
Internal Control/Risk Management
Report
Audit & Supervisory BoardAudit & Supervisory Board MembersOutside Audit & Supervisory Board Members
Board of DirectorsDirectorsOutside Directors
General Meeting of Shareholders
President, Representative Director andGroup CEO
Management CouncilGroup Management Council
Group Companies
Group Audit Department
Group Risk Management CommitteeGroup Information Protection CommitteeGroup CSR CommitteeOther Expert Committees
Nominating CommitteeCompensation CommitteeIndependent Outside Directors Committee
Supervision
Audit
Legal Advisor(Law Firm)
Accounting Auditor Independent
Auditor
Board of DirectorsThe Board of Directors performs a supervisory role and makes decisions on statutory matters and important matters relating to business execution stipulated by the Board’s regulations. The Board of Directors also elects and supervises the business execution of the President and Representative Director, who serves concurrently as Group CEO, as well as the Group operating officers, and other key personnel.
About Outside DirectorsThree of the nine members of the Company’s Board of Directors are outside directors. All three have submitted notification to the Tokyo Stock Exchange of their independent director status as stipulated by the exchange regulations. The outside directors are expected to objectively advise and supervise the management team from a neutral standpoint, based on their high perception. The outside directors offer advice and suggestions from their independent and objective standpoints and are expected to fulfill a role raising corporate value.
President, Representative Director and Group CEO, and Group Operating OfficersThe President, Representative Director and Group CEO controls business execution across the entire Group based on the resolutions of the Board of Directors. The Group operating officers, under the direct authority of the President, Representative Director and Group CEO, control business execution in the main business segments.
SAPPORO HOLDINGS LIMITED Annual Report 2015 29

Name Reasons for appointment
<Directors>
Shigehiko Hattori
Mr. Shigehiko Hattori has a wealth of experience, a rich track record and great insight as the president of a business corporation. He also has a wealth of overseas management experience. Mr. Hattori offers pertinent opinions and advice to the Company’s Board of Directors from his objective standpoint, independent of the management team engaged in executing the operations of the Company. The Company has determined that he will contribute greatly to the corporate governance of the Company, which is moving forward with overseas expansion, and he has been appointed as an outside director.
Teruhiko Ikeda
Mr. Teruhiko Ikeda has a wealth of experience, a rich track record and great insight as the manager of a financial institution. Mr. Ikeda offers pertinent opinions and advice to the Company’s Board of Directors from his objective standpoint, independent of the management team engaged in executing the operations of the Company. The Company has determined that he will contribute greatly to the corporate governance of the Company in such areas as the strengthening of risk management, and he has been appointed as an outside director.
Shizuka Uzawa
Mr. Shizuka Uzawa has a wealth of experience, a rich track record and great insight as the president of a holding company as well as an extensive insight in treasury and corporate management fields. Mr. Uzawa offers pertinent opinions and advice to the Company’s Board of Directors from his objective standpoint, independent of the management team engaged in executing the operations of the Company. The Company has determined that he will contribute greatly to the corporate governance of the Company in such areas as the strengthening of the Group’s management structure, and he has been appointed as an outside director.
<Audit & Supervisory Board Members>
Junya Sato Although Mr. Junya Sato has no experience directly managing a company aside from becoming an outside director or an outside corporate auditor, he has a wealth of practical experience as an attorney, particularly regarding corporate law. The Company has determined that Mr. Sato will be able to monitor the performance of duties by directors of the Company from an objective and fair perspective, and he has been appointed as an outside Audit & Supervisory Board member.
Kazuo Sugie As the president of a business corporation, Mr. Kazuo Sugie has a wealth of experience and highly developed insight based on extensive knowledge and information. The Company has determined that, from his objective and neutral position as an outside audit & supervisory board member, Mr. Sugie will monitor the performance of duties by directors of the Company and contribute greatly in strengthening the Company’s Audit & Supervisory Board member system, and he has been appointed as an outside Audit & Supervisory Board member.
Nominating and Compensation CommitteesAlthough Sapporo Holdings uses the Audit & Supervisory Board Member system, it has also established a Nominating Committee and a Compensation Committee with the goals of increasing transparency with respect to the nomination and remuneration of directors and preserving a sound management structure. The three outside directors and one inside director form the four members of both committees. The committee chair is selected from the outside directors.
Compensation for Directors and Audit & Supervisory Board MembersCompensation for directors is decided within remuneration limits set by the Annual Meeting of Shareholders. Compensation consists of a base salary for each director, determined by the duties performed, and that may, based on predetermined criteria, be adjusted in line with job performance in the previous fiscal year. Compensation for Audit & Supervisory Board members is also decided within remuneration limits set by the Annual Meeting of Shareholders, and consists of a base salary for each Audit & Supervisory Board Member calculated in accordance with standards decided by the Audit & Supervisory Board.
Audit & Supervisory BoardSapporo Holdings Ltd. uses the Audit & Supervisory Board Member system, in which Audit & Supervisory Board members, who are completely independent from the Board of Directors, audit the job performance of directors from an independent standpoint. The Company has therefore established an Audit & Supervisory Board. In accordance with audit policy and allocated auditing duties decided by the Audit & Supervisory Board, each Audit & Supervisory Board Member attends important meetings such as the Board of Directors meeting and the Management Council, reads over requests for approval, audits subsidiaries, and performs other related duties. The Audit & Supervisory Board members also receive an explanation of the audit plan from the independent auditors and the independent auditors’ report. This system allows proper auditing of the execution of duties by directors.
About Outside Audit & Supervisory Board MembersSapporo Holdings has four Audit & Supervisory Board members, two of whom are outside Audit & Supervisory Board members. Both outside Audit & Supervisory Board members have submitted notification to the Tokyo Stock Exchange of their independent auditor status as stipulated by the exchange regulations. The outside Audit & Supervisory Board members audit the duties executed by the directors from an objective and neutral standpoint, and offer input where fitting to preserve the propriety and appropriateness of decisions by the directors. Similarly, the outside Audit & Supervisory Board members are expected to provide input where needed during discussion on proposals and fulfill a role to secure healthy management.
Standards and Policies regarding Independence of Outside Directors and Outside Audit & Supervisory Board MembersThe Sapporo Group does not have standards or the like regarding the independence of outside directors or outside Audit & Supervisory Board members, but to ensure there is no conflict of interest with general shareholders, appointment requires people to satisfy the standards for independence stipulated and applied by financial instruments exchanges. In addition, none of the outside directors are concurrently in positions that comprise a special interest with the Sapporo Group.
Name Important concurrent occupations or positions at other organizations
<Directors>
Shigehiko Hattori
Senior Advisor of Shimadzu Corporation, Outside Director of Mitsubishi Tanabe Pharma Corporation, Outside Director of Brother Industries, Ltd., Outside Director of Meiji Yasuda Life Insurance Company, Outside Auditor of Nikkei Inc.
Teruhiko Ikeda
Advisor of Mizuho Trust & Banking Co., Ltd., Outside Audit & Supervisory Board Member of TOKYO FM Broadcasting Co., Ltd., Independent Director of NSK Ltd.
Shizuka Uzawa
Chairman & Representative Director of Nisshinbo Holdings, Inc., Director of Japan Radio Co., Ltd., Director of New Japan Radio Co., Ltd., Director of Nagano Japan Radio Co., Ltd., External Executive Director of Japan Finance Corporation
<Audit & Supervisory Board Members>
Junya Sato Lawyer at the Law Offices of Ishizawa, Ko & Sato, Outside Director of Nikki Co., Ltd., Outside Director of Mitsui Mining & Smelting Co., Ltd., Outside Audit & Supervisory Board Member of Taisho Pharmaceutical Holdings, Co., Ltd.
Kazuo Sugie Senior Advisor of DIC Corporation
Corporate Governance
30
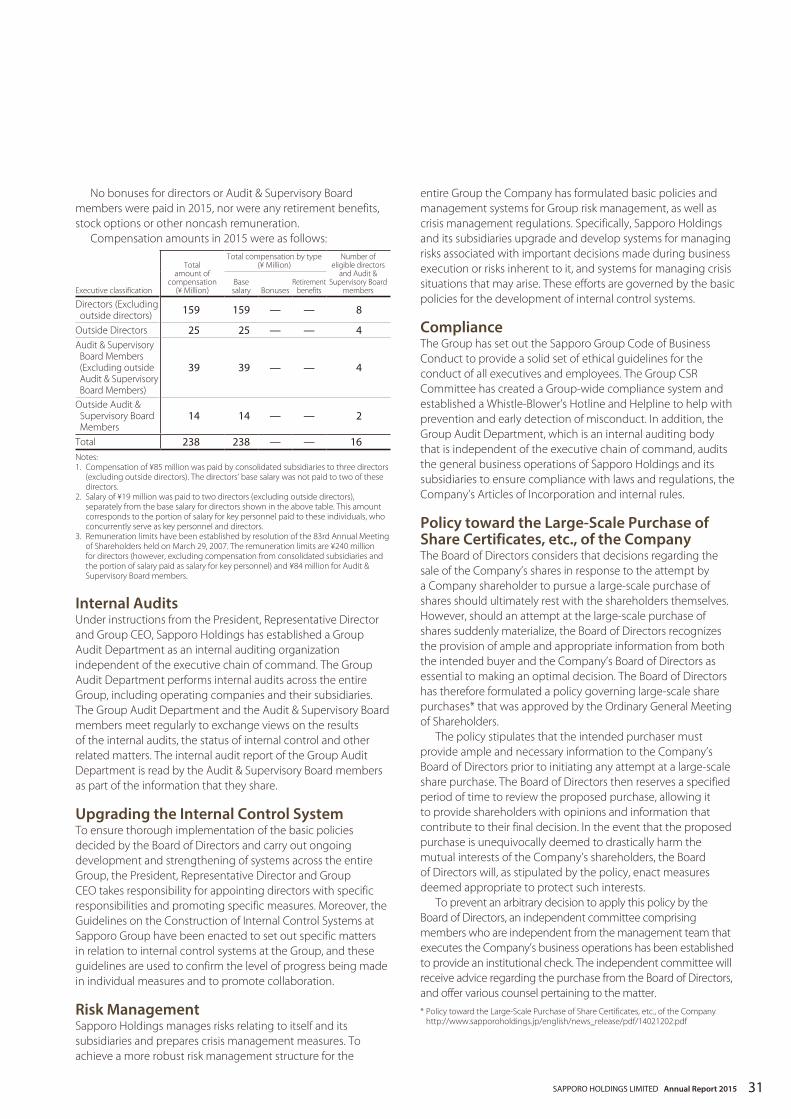
No bonuses for directors or Audit & Supervisory Board members were paid in 2015, nor were any retirement benefits, stock options or other noncash remuneration. Compensation amounts in 2015 were as follows:
Executive classification
Total amount of
compensation (¥ Million)
Total compensation by type (¥ Million)
Number of eligible directors
and Audit & Supervisory Board
membersBase salary Bonuses
Retirement benefits
Directors (Excluding outside directors) 159 159 — — 8
Outside Directors 25 25 — — 4Audit & Supervisory Board Members (Excluding outside Audit & Supervisory Board Members)
39 39 — — 4
Outside Audit & Supervisory Board Members
14 14 — — 2
Total 238 238 — — 16Notes:1. Compensation of ¥85 million was paid by consolidated subsidiaries to three directors
(excluding outside directors). The directors’ base salary was not paid to two of these directors.
2. Salary of ¥19 million was paid to two directors (excluding outside directors), separately from the base salary for directors shown in the above table. This amount corresponds to the portion of salary for key personnel paid to these individuals, who concurrently serve as key personnel and directors.
3. Remuneration limits have been established by resolution of the 83rd Annual Meeting of Shareholders held on March 29, 2007. The remuneration limits are ¥240 million for directors (however, excluding compensation from consolidated subsidiaries and the portion of salary paid as salary for key personnel) and ¥84 million for Audit & Supervisory Board members.
Internal AuditsUnder instructions from the President, Representative Director and Group CEO, Sapporo Holdings has established a Group Audit Department as an internal auditing organization independent of the executive chain of command. The Group Audit Department performs internal audits across the entire Group, including operating companies and their subsidiaries. The Group Audit Department and the Audit & Supervisory Board members meet regularly to exchange views on the results of the internal audits, the status of internal control and other related matters. The internal audit report of the Group Audit Department is read by the Audit & Supervisory Board members as part of the information that they share.
Upgrading the Internal Control SystemTo ensure thorough implementation of the basic policies decided by the Board of Directors and carry out ongoing development and strengthening of systems across the entire Group, the President, Representative Director and Group CEO takes responsibility for appointing directors with specific responsibilities and promoting specific measures. Moreover, the Guidelines on the Construction of Internal Control Systems at Sapporo Group have been enacted to set out specific matters in relation to internal control systems at the Group, and these guidelines are used to confirm the level of progress being made in individual measures and to promote collaboration.
Risk ManagementSapporo Holdings manages risks relating to itself and its subsidiaries and prepares crisis management measures. To achieve a more robust risk management structure for the
entire Group the Company has formulated basic policies and management systems for Group risk management, as well as crisis management regulations. Specifically, Sapporo Holdings and its subsidiaries upgrade and develop systems for managing risks associated with important decisions made during business execution or risks inherent to it, and systems for managing crisis situations that may arise. These efforts are governed by the basic policies for the development of internal control systems.
ComplianceThe Group has set out the Sapporo Group Code of Business Conduct to provide a solid set of ethical guidelines for the conduct of all executives and employees. The Group CSR Committee has created a Group-wide compliance system and established a Whistle-Blower’s Hotline and Helpline to help with prevention and early detection of misconduct. In addition, the Group Audit Department, which is an internal auditing body that is independent of the executive chain of command, audits the general business operations of Sapporo Holdings and its subsidiaries to ensure compliance with laws and regulations, the Company’s Articles of Incorporation and internal rules.
Policy toward the Large-Scale Purchase of Share Certificates, etc., of the CompanyThe Board of Directors considers that decisions regarding the sale of the Company’s shares in response to the attempt by a Company shareholder to pursue a large-scale purchase of shares should ultimately rest with the shareholders themselves. However, should an attempt at the large-scale purchase of shares suddenly materialize, the Board of Directors recognizes the provision of ample and appropriate information from both the intended buyer and the Company’s Board of Directors as essential to making an optimal decision. The Board of Directors has therefore formulated a policy governing large-scale share purchases* that was approved by the Ordinary General Meeting of Shareholders. The policy stipulates that the intended purchaser must provide ample and necessary information to the Company’s Board of Directors prior to initiating any attempt at a large-scale share purchase. The Board of Directors then reserves a specified period of time to review the proposed purchase, allowing it to provide shareholders with opinions and information that contribute to their final decision. In the event that the proposed purchase is unequivocally deemed to drastically harm the mutual interests of the Company’s shareholders, the Board of Directors will, as stipulated by the policy, enact measures deemed appropriate to protect such interests. To prevent an arbitrary decision to apply this policy by the Board of Directors, an independent committee comprising members who are independent from the management team that executes the Company’s business operations has been established to provide an institutional check. The independent committee will receive advice regarding the purchase from the Board of Directors, and offer various counsel pertaining to the matter.* Policy toward the Large-Scale Purchase of Share Certificates, etc., of the Company http://www.sapporoholdings.jp/english/news_release/pdf/14021202.pdf
SAPPORO HOLDINGS LIMITED Annual Report 2015 31
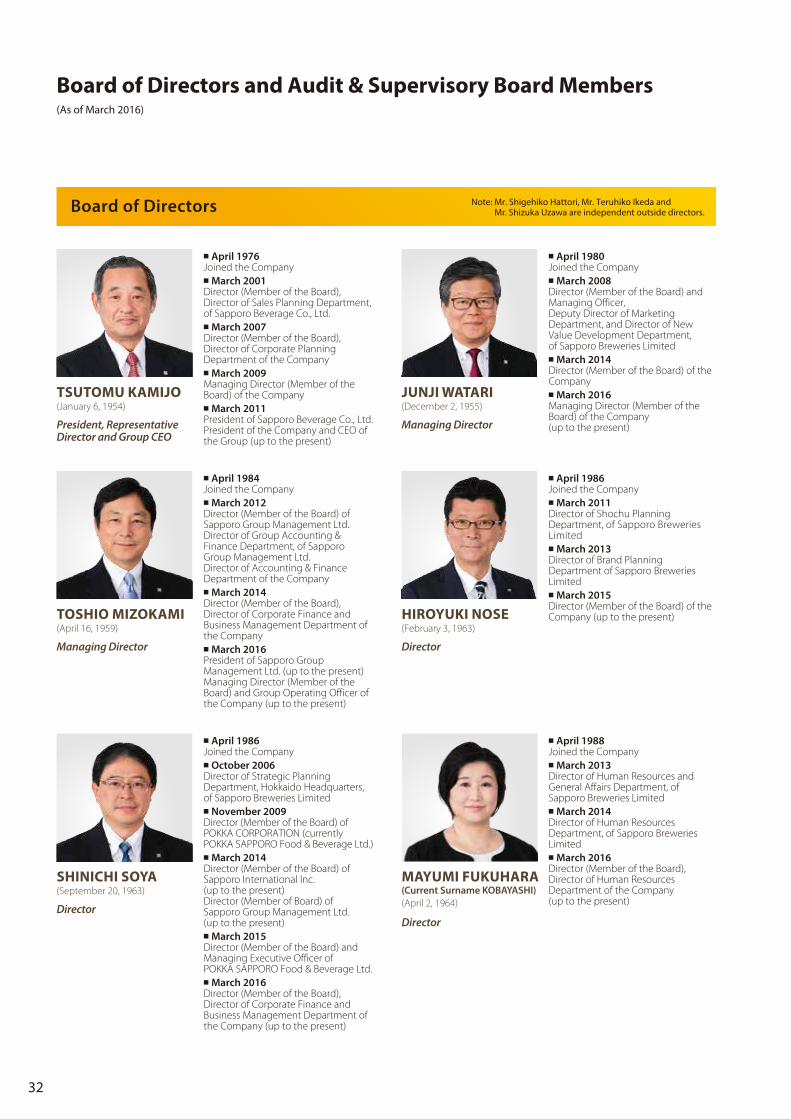
Board of Directors and Audit & Supervisory Board Members(As of March 2016)
Board of Directors Note: Mr. Shigehiko Hattori, Mr. Teruhiko Ikeda and Mr. Shizuka Uzawa are independent outside directors.
◾ April 1976Joined the Company◾ March 2001Director (Member of the Board), Director of Sales Planning Department, of Sapporo Beverage Co., Ltd.◾ March 2007Director (Member of the Board), Director of Corporate Planning Department of the Company◾ March 2009Managing Director (Member of the Board) of the Company◾ March 2011President of Sapporo Beverage Co., Ltd. President of the Company and CEO of the Group (up to the present)
TSUTOMU KAMIJO (January 6, 1954)
President, Representative Director and Group CEO
◾ April 1980Joined the Company◾ March 2008Director (Member of the Board) and Managing Officer,Deputy Director of Marketing Department, and Director of New Value Development Department, of Sapporo Breweries Limited◾ March 2014Director (Member of the Board) of the Company◾ March 2016Managing Director (Member of the Board) of the Company (up to the present)
JUNJI WATARI(December 2, 1955)
Managing Director
◾ April 1986Joined the Company◾ October 2006Director of Strategic Planning Department, Hokkaido Headquarters, of Sapporo Breweries Limited◾ November 2009Director (Member of the Board) of POKKA CORPORATION (currently POKKA SAPPORO Food & Beverage Ltd.)◾ March 2014Director (Member of the Board) of Sapporo International Inc. (up to the present)Director (Member of Board) of Sapporo Group Management Ltd. (up to the present)◾ March 2015Director (Member of the Board) and Managing Executive Officer of POKKA SAPPORO Food & Beverage Ltd.◾ March 2016Director (Member of the Board), Director of Corporate Finance and Business Management Department of the Company (up to the present)
◾ April 1988Joined the Company◾ March 2013Director of Human Resources and General Affairs Department, of Sapporo Breweries Limited◾ March 2014Director of Human Resources Department, of Sapporo Breweries Limited◾ March 2016Director (Member of the Board), Director of Human Resources Department of the Company (up to the present)
MAYUMI FUKUHARA(Current Surname KOBAYASHI)(April 2, 1964)
Director
◾ April 1986Joined the Company◾ March 2011Director of Shochu Planning Department, of Sapporo Breweries Limited◾ March 2013Director of Brand Planning Department of Sapporo Breweries Limited◾ March 2015Director (Member of the Board) of the Company (up to the present)HIROYUKI NOSE
(February 3, 1963)
Director
◾ April 1984Joined the Company◾ March 2012Director (Member of the Board) of Sapporo Group Management Ltd.Director of Group Accounting & Finance Department, of Sapporo Group Management Ltd.Director of Accounting & Finance Department of the Company◾ March 2014Director (Member of the Board), Director of Corporate Finance and Business Management Department of the Company◾ March 2016President of Sapporo Group Management Ltd. (up to the present) Managing Director (Member of the Board) and Group Operating Officer of the Company (up to the present)
TOSHIO MIZOKAMI(April 16, 1959)
Managing Director
SHINICHI SOYA(September 20, 1963)
Director
32

◾ April 1969Joined Nisshinbo Industries, Inc. (currently Nisshinbo Holdings, Inc.)◾ June 2001Director (Member of the Board), Chief of Accounting and Finance Division of Nisshinbo Industries, Inc.◾ June 2009President & Representative Director of Nisshinbo Holdings, Inc.◾ June 2013Chairman & Representative Director of Nisshinbo Holdings, Inc. (up to the present)◾ March 2015Director (Member of the Board) of the Company (up to the present)Director
SHIZUKA UZAWA(January 30, 1946)
Outside
◾ April 1964Joined Shimadzu Corporation◾ June 1993Director (Member of the Board) of Shimadzu Corporation (seconded to the United States of America)◾ June 2003President and CEO of Shimadzu Corporation◾ June 2009Chairman of the Board of Directors of Shimadzu Corporation ◾ March 2012Director (Member of the Board) of the Company (up to the present)◾ June 2015Senior Advisor of Shimadzu Corporation (up to the present)
Director
SHIGEHIKO HATTORI(August 21, 1941)
◾ April 1982Registered as a lawyer (Daiichi Tokyo Bar Association) Joined the Law Offices of Furness, Sato & Ishizawa (currently the Law Offices of Ishizawa, Ko & Sato) (up to the present)◾ October 1990Registered as a lawyer in the state of New York◾ April 2011Vice Chairman of Daiichi Tokyo Bar Association◾ March 2012Audit & Supervisory Board Member of the Company (up to the present)
JUNYA SATO(May 4, 1953)
Audit & Supervisory Board Member
Outside ◾ August 1970Joined Dainippon Ink and Chemicals, Inc. (currently DIC Corporation)◾ June 2001Director of Dainippon Ink and Chemicals, Inc.◾ April 2009Representative Director, President and CEO of DIC Corporation◾ April 2012Chairman of the Board of DIC Corporation◾ March 2013Audit & Supervisory Board Member of the Company (up to the present)◾ March 2015Senior Advisor of DIC Corporation (up to the present)
KAZUO SUGIE(October 5, 1945)
Audit & Supervisory Board Member
Outside
◾ April 1969Joined The Fuji Bank, Ltd. (currently Mizuho Bank, Ltd.)◾ April 2002Deputy President of Mizuho Corporate Bank, Ltd. (currently Mizuho Bank, Ltd.)◾ June 2004President and Chief Executive Officer of Mizuho Trust & Banking Co., Ltd.◾ June 2010Advisor of Mizuho Trust & Banking Co., Ltd. (up to the present)◾ March 2012Director (Member of the Board) of the Company (up to the present)Director
TERUHIKO IKEDA(December 5, 1946)
Outside
Audit & Supervisory Board Members Note: Mr. Junya Sato and Mr. Kazuo Sugie are outside Audit & Supervisory Board Members.
◾ April 1963Joined Yawata Iron & Steel Co., Ltd. (currently NIPPON STEEL & SUMITOMO METAL CORPORATION)◾ June 1993Director (Member of the Board) of Nippon Steel Corporation (currently NIPPON STEEL & SUMITOMO METAL CORPORATION)◾ April 1997Managing Director (Member of the Board) of Nippon Steel Corporation◾ October 2007Chairperson of the Japan Audit & Supervisory Board Members Association◾ October 2008President and Representative Director of The Shoko Chukin Bank, Ltd.◾ June 2015Honorary Advisor of The Shoko Chukin Bank, Ltd. (up to the present)◾ March 2016Audit & Supervisory Board Member of the Company (up to the present)
TETSUO SEKI(July 29, 1938)
Audit & Supervisory Board Member
◾ April 1979Joined the Company◾ March 2010Managing Officer and Director of Tokai Hokuriku District Headquarters, of Sapporo Breweries Limited◾ March 2013Standing Audit & Supervisory Board Member of POKKA SAPPORO Food & Beverage Ltd.◾ March 2015Standing Audit & Supervisory Board Member of the Company (up to the present)
SHOUJI OSAKI(August 17, 1955)
Standing Audit & Supervisory Board Member
Outside
SAPPORO HOLDINGS LIMITED Annual Report 2015 33
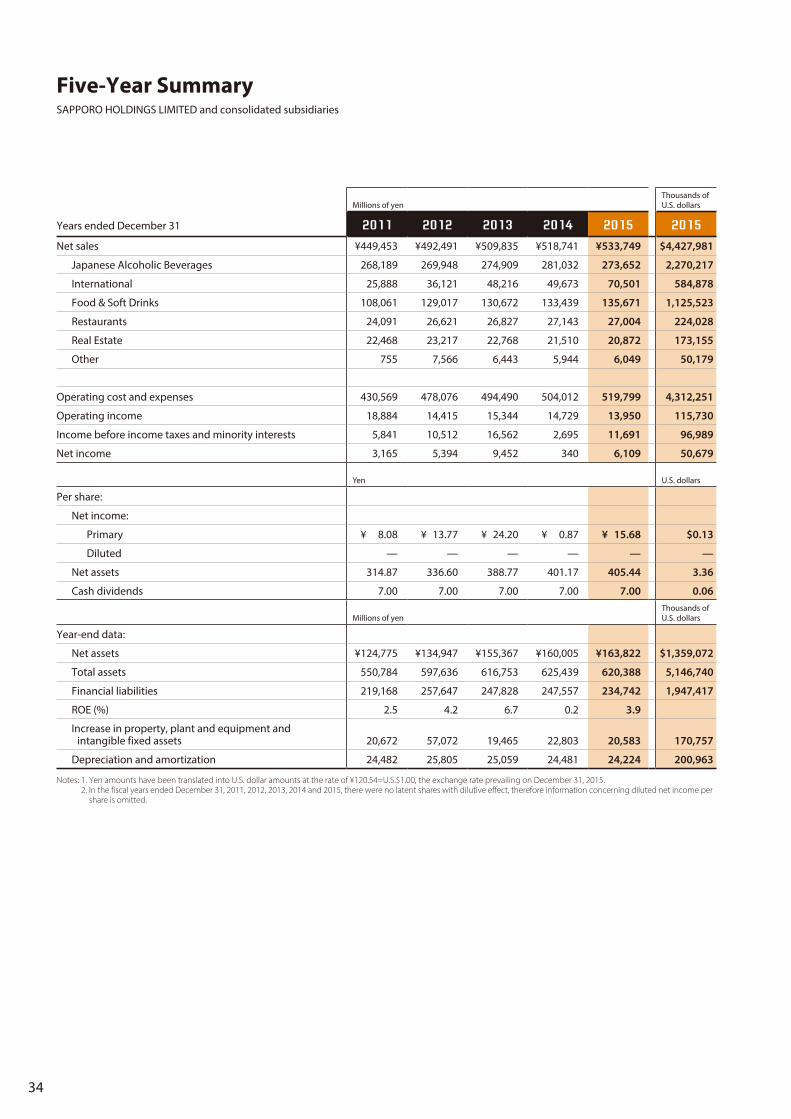
Millions of yenThousands of U.S. dollars
Years ended December 31 2011 2012 2013 2014 2015 2015
Net sales ¥449,453 ¥492,491 ¥509,835 ¥518,741 ¥533,749 $4,427,981
Japanese Alcoholic Beverages 268,189 269,948 274,909 281,032 273,652 2,270,217
International 25,888 36,121 48,216 49,673 70,501 584,878
Food & Soft Drinks 108,061 129,017 130,672 133,439 135,671 1,125,523
Restaurants 24,091 26,621 26,827 27,143 27,004 224,028
Real Estate 22,468 23,217 22,768 21,510 20,872 173,155
Other 755 7,566 6,443 5,944 6,049 50,179
Operating cost and expenses 430,569 478,076 494,490 504,012 519,799 4,312,251
Operating income 18,884 14,415 15,344 14,729 13,950 115,730
Income before income taxes and minority interests 5,841 10,512 16,562 2,695 11,691 96,989
Net income 3,165 5,394 9,452 340 6,109 50,679
Yen U.S. dollars
Per share:
Net income:
Primary ¥ 8.08 ¥ 13.77 ¥ 24.20 ¥ 0.87 ¥ 15.68 $0.13
Diluted — — — — — —
Net assets 314.87 336.60 388.77 401.17 405.44 3.36
Cash dividends 7.00 7.00 7.00 7.00 7.00 0.06
Millions of yenThousands of U.S. dollars
Year-end data:
Net assets ¥124,775 ¥134,947 ¥155,367 ¥160,005 ¥163,822 $1,359,072
Total assets 550,784 597,636 616,753 625,439 620,388 5,146,740
Financial liabilities 219,168 257,647 247,828 247,557 234,742 1,947,417
ROE (%) 2.5 4.2 6.7 0.2 3.9
Increase in property, plant and equipment and intangible fixed assets 20,672 57,072 19,465 22,803 20,583 170,757
Depreciation and amortization 24,482 25,805 25,059 24,481 24,224 200,963
Notes: 1. Yen amounts have been translated into U.S. dollar amounts at the rate of ¥120.54=U.S.$1.00, the exchange rate prevailing on December 31, 2015. 2. In the fiscal years ended December 31, 2011, 2012, 2013, 2014 and 2015, there were no latent shares with dilutive effect, therefore information concerning diluted net income per
share is omitted.
Five-Year SummarySAPPORO HOLDINGS LIMITED and consolidated subsidiaries
34
Management’s Discussion and Analysis
Sapporo Holdings Limited and the Sapporo GroupThe Sapporo Group’s management philosophy is “As an intrinsic
part of people’s lives, Sapporo will contribute to the evolution of
creative, enriching and rewarding lifestyles,” and we strive to increase
stakeholder satisfaction by maintaining integrity in corporate conduct
that reinforces stakeholder trust and by aiming to achieve continuous
growth in corporate value.
In 2015, the Group accelerated its growth strategies based on
Sapporo Group Management Plan 2015–2016 to establish its presence
as a distinctive manufacturer of food products, aiming to achieve its
financial targets for 2016.
In the Japanese Alcoholic Beverages segment, the Group
continued to invest in its core brands in the domestic beer and
beer-type beverage market. The Group released an improved version
of Sapporo Draft Beer Black Label, which is its core brand, to enhance
its presence in the household market. In non-beer growth categories,
the Group started offering a world-class brand of imported wine to
promote further diversification.
In the International segment, SLEEMAN BREWERIES LTD. in Canada
and SAPPORO U.S.A. INC. in the U.S. aggressively implemented sales
promotions in the premium beer market in North America. In the
North American beverage market, the Group included Country Pure
Foods, Inc. as a consolidated subsidiary to expand sales. In Vietnam,
the Group continued marketing investments to establish the Sapporo
brand, and released improved versions of its bottled and canned
products in November.
In the Food & Soft Drinks segment, the Group endeavored to
strengthen marketing and lower costs in its Japan operations as
part of a management initiative while concentrating investments on
core brands, especially lemon-based products and soups, two areas
where the Group has a strong competitive edge. Overseas, the Group
established a joint venture company that is engaged in production
and sales in Indonesia to strengthen its soft drinks business from its
Southeast Asian base. The Group also entered the soy milk business to
expand its business domains.
In the Restaurants segment in Japan, the Group continued to open
outlets, focusing on its key Ginza Lion and YEBISU BAR formats, while
closing or changing the formats of unprofitable outlets in a bid to
improve profitability. In Singapore, the Group improved its restaurants
to meet regional demand by changing the formats.
In the Real Estate segment, occupancy rates at the Group’s rental
properties remained high. The Group enhanced the property value
of Yebisu Garden Place, which is its core property, by improving the
dining area to raise the attraction level of the city area. With regard
to the Ginza 5-Chome Redevelopment Project, “GINZA PLACE” was
selected as the facility name and redevelopment work advanced with
a view to opening in summer 2016.
In terms of the scope of consolidation, the Company had 54
consolidated subsidiaries and 2 equity-method affiliates as of
December 31, 2015.
Business Environment OverviewIn 2015, the Japanese economy was on track for a moderate recovery
in the first half, while the economy in foreign countries such as China
slowed down in the second half. Consequently, the situation for 2015
was a series of ups and downs. Consumer spending remained weak
despite some signs of improvement with the economic recovery.
More specifically, conditions in the industries in which the Sapporo
Group conducts its operations were as follows.
In the domestic alcoholic beverages and food & soft drinks indus-
tries, demand was affected by unseasonable summer weather and a
mild winter. In the real estate industry, vacancy rates in the Greater
Tokyo Area office leasing market improved, while rent levels rose
gradually. Overseas, the North American beer market remained
generally flat, while the Asian beer market continued to grow.
Consolidated Operating ResultsNet SalesNet sales increased ¥15,008 million, or 2.9%, year on year to
¥533,749 million.
By business segment, in the Japanese Alcoholic Beverages
segment, sales volumes dropped from the previous fiscal year in beer
and beer-type beverages. However, in the International segment,
beer sales volume in North America and Vietnam exceeded the
previous fiscal year, and the inclusion of Country Pure Foods, Inc. as a
consolidated subsidiary led to a sharp gain in sales value. The Food &
Soft Drinks segment saw increased sales volumes in the Japanese
food & soft drinks and overseas soft drinks businesses from the previ-
ous fiscal year. The stronger sales volumes combined with the benefit
of a weaker yen contributed to a sales increase in the International
and Food & Soft Drinks segments. The Real Estate segment saw sales
decrease, owing to the sale of the Group’s equity stake in Sapporo
Sports Plaza Co., Ltd. and several rental properties.
Cost of Sales and Selling, General and Administrative ExpensesCost of sales increased ¥16,420 million, or 4.9%, year on year to
¥352,808 million.
This mainly reflects the inclusion of Country Pure Foods, Inc. as a
consolidated subsidiary and the impact of the yen’s depreciation.
The cost of sales ratio increased 1.3 percentage points to 66.1%,
primarily due to an increase in raw material costs in the Japanese
Alcoholic Beverages segment, as well as an increase in manufactur-
ing costs in the International and Food & Soft Drinks segments.
Selling, general and administrative (SG&A) expenses decreased ¥633
million, or 0.4%, year on year to ¥166,990 million. This was chiefly due
to a decline in facility costs and so forth in the Japanese Alcoholic
Beverages segment.
35SAPPORO HOLDINGS LIMITED Annual Report 2015
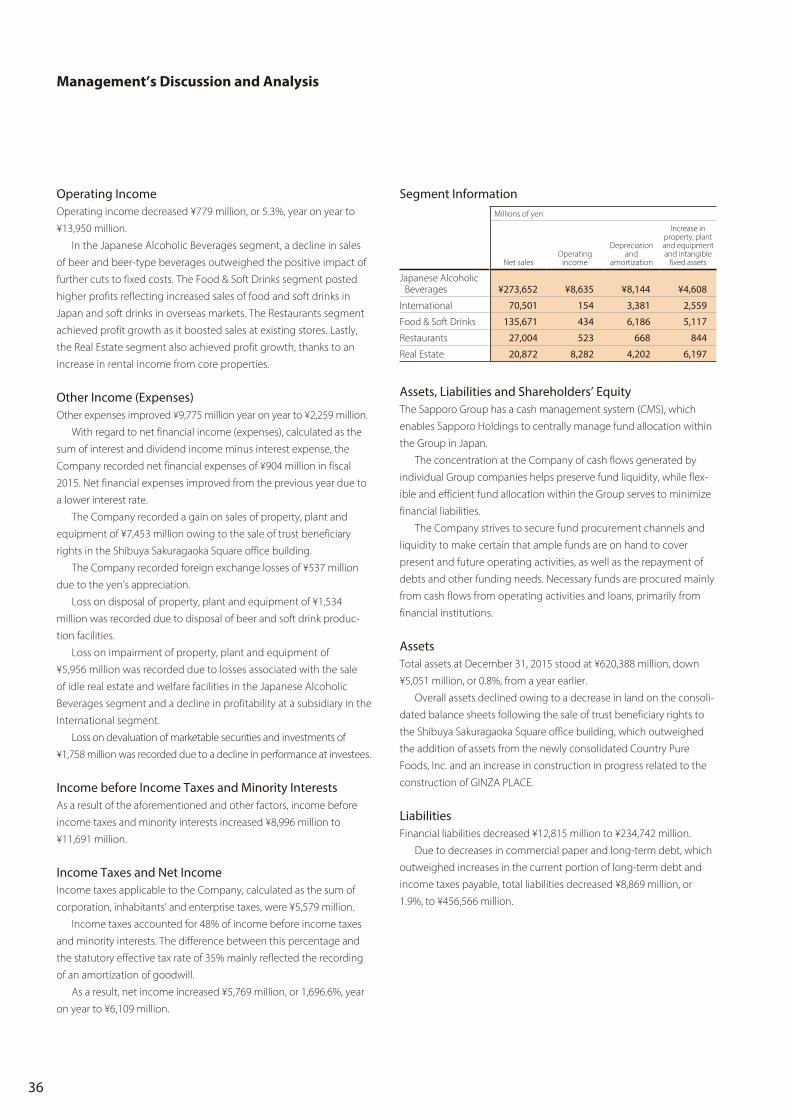
Operating IncomeOperating income decreased ¥779 million, or 5.3%, year on year to
¥13,950 million.
In the Japanese Alcoholic Beverages segment, a decline in sales
of beer and beer-type beverages outweighed the positive impact of
further cuts to fixed costs. The Food & Soft Drinks segment posted
higher profits reflecting increased sales of food and soft drinks in
Japan and soft drinks in overseas markets. The Restaurants segment
achieved profit growth as it boosted sales at existing stores. Lastly,
the Real Estate segment also achieved profit growth, thanks to an
increase in rental income from core properties.
Other Income (Expenses)Other expenses improved ¥9,775 million year on year to ¥2,259 million.
With regard to net financial income (expenses), calculated as the
sum of interest and dividend income minus interest expense, the
Company recorded net financial expenses of ¥904 million in fiscal
2015. Net financial expenses improved from the previous year due to
a lower interest rate.
The Company recorded a gain on sales of property, plant and
equipment of ¥7,453 million owing to the sale of trust beneficiary
rights in the Shibuya Sakuragaoka Square office building.
The Company recorded foreign exchange losses of ¥537 million
due to the yen’s appreciation.
Loss on disposal of property, plant and equipment of ¥1,534
million was recorded due to disposal of beer and soft drink produc-
tion facilities.
Loss on impairment of property, plant and equipment of
¥5,956 million was recorded due to losses associated with the sale
of idle real estate and welfare facilities in the Japanese Alcoholic
Beverages segment and a decline in profitability at a subsidiary in the
International segment.
Loss on devaluation of marketable securities and investments of
¥1,758 million was recorded due to a decline in performance at investees.
Income before Income Taxes and Minority InterestsAs a result of the aforementioned and other factors, income before
income taxes and minority interests increased ¥8,996 million to
¥11,691 million.
Income Taxes and Net IncomeIncome taxes applicable to the Company, calculated as the sum of
corporation, inhabitants’ and enterprise taxes, were ¥5,579 million.
Income taxes accounted for 48% of income before income taxes
and minority interests. The difference between this percentage and
the statutory effective tax rate of 35% mainly reflected the recording
of an amortization of goodwill.
As a result, net income increased ¥5,769 million, or 1,696.6%, year
on year to ¥6,109 million.
Segment InformationMillions of yen
Net salesOperating
income
Depreciation and
amortization
Increase in property, plant and equipment and intangible
fixed assets
Japanese Alcoholic Beverages ¥273,652 ¥8,635 ¥8,144 ¥4,608
International 70,501 154 3,381 2,559
Food & Soft Drinks 135,671 434 6,186 5,117
Restaurants 27,004 523 668 844
Real Estate 20,872 8,282 4,202 6,197
Assets, Liabilities and Shareholders’ EquityThe Sapporo Group has a cash management system (CMS), which
enables Sapporo Holdings to centrally manage fund allocation within
the Group in Japan.
The concentration at the Company of cash flows generated by
individual Group companies helps preserve fund liquidity, while flex-
ible and efficient fund allocation within the Group serves to minimize
financial liabilities.
The Company strives to secure fund procurement channels and
liquidity to make certain that ample funds are on hand to cover
present and future operating activities, as well as the repayment of
debts and other funding needs. Necessary funds are procured mainly
from cash flows from operating activities and loans, primarily from
financial institutions.
AssetsTotal assets at December 31, 2015 stood at ¥620,388 million, down
¥5,051 million, or 0.8%, from a year earlier.
Overall assets declined owing to a decrease in land on the consoli-
dated balance sheets following the sale of trust beneficiary rights to
the Shibuya Sakuragaoka Square office building, which outweighed
the addition of assets from the newly consolidated Country Pure
Foods, Inc. and an increase in construction in progress related to the
construction of GINZA PLACE.
LiabilitiesFinancial liabilities decreased ¥12,815 million to ¥234,742 million.
Due to decreases in commercial paper and long-term debt, which
outweighed increases in the current portion of long-term debt and
income taxes payable, total liabilities decreased ¥8,869 million, or
1.9%, to ¥456,566 million.
Management’s Discussion and Analysis
36
Net AssetsRetained earnings increased ¥276 million to ¥35,190 million.
Asset growth was supported by increases in unrealized holding
gain on securities and the posting of net income, which were partly
offset by a decline in foreign currency translation adjustments and
the payment of dividends.
As a result, net assets increased ¥3,818 million from a year earlier
to ¥163,822 million.
Cash FlowsConsolidated cash and cash equivalents as of December 31, 2015
were ¥10,399 million, an increase of ¥651 million, or 6.7%, from the
previous fiscal year-end.
Factors behind this decline were as follows.
Cash Flows from Operating ActivitiesNet cash provided by operating activities was ¥35,266 million, ¥12,981
million, or 58.3%, more than in the previous fiscal year.
Major sources of operating cash flow included ¥11,691 million
from income before income taxes and minority interests, ¥24,224
million from depreciation and amortization and ¥5,956 million from
loss on impairment of property, plant and equipment and leased
assets. These were partially offset by a ¥7,453 million gain on sales of
property, plant and equipment.
Cash Flows from Investing ActivitiesInvesting activities used net cash of ¥9,756 million, ¥7,474 million less
than the net cash used in the previous fiscal year.
Major investment outflows included purchases of property, plant
and equipment of ¥18,298 million, purchases of subsidiaries’ shares
resulting in change in scope of consolidation of ¥3,989 million and
purchases of affiliates, securities of ¥3,261 million, the sum of which
outweighed inflows from proceeds from sales of property, plant and
equipment of ¥19,564 million.
Cash Flows from Financing ActivitiesFinancing activities used net cash of ¥24,803 million, ¥17,495 million,
or 239.4%, more than the net cash used in the previous fiscal year.
Major inflows included ¥14,319 million in proceeds from long-term
debt and ¥9,960 million in proceeds from issuance of bonds. These
inflows were more than offset by outflows including a ¥13,000 million
net decrease in commercial paper, ¥16,626 million for the repayment
of long-term debt, and ¥12,000 million in redemption of bonds.
Cautionary StatementThe Company’s financial statements in English have not been
audited by independent auditors. However, the original Japanese
financial statements on which they are based have been audited by
independent auditors.
Management IndicatorsThe current ratio fell 6.9 percentage points from 73.8% to 66.9%.
The decline reflects a decline in current assets of ¥8 million and an
increase in current liabilities of ¥21,872 million due to factors such as
the drawing of short-term bank loans.
The equity ratio rose from 25.0% a year earlier to 25.5%, mainly
reflecting increases in unrealized holding gain on securities and
net income.
Return on equity (ROE) increased from 0.2% to 3.9%, due to the
year-on-year increase in net income.
The debt-to-equity (D/E) ratio, calculated as financial liabilities
divided by net assets, decreased from 1.5 to 1.4 in line with the
decrease in financial liabilities.
Outlook for 2016In 2016, the final year of Sapporo Group Management Plan 2016,
the Sapporo Group will redouble its efforts to further strengthen
the Group foundations and accelerate investment in its growth
strategies. These strategies are aimed at fully displaying the special
characteristics that position the Sapporo Group as a distinctive food
company. Standing on the strong foundation and stable earnings
provided by its Japanese Alcoholic Beverages and Real Estate seg-
ments, the Sapporo Group will continue investing in the growth of
its International and Food & Soft Drinks segments, while also plant-
ing the seeds for future growth through continued R&D investment.
Consequently, in its outlook for 2016, the Company is forecasting
consolidated net sales of ¥565,400 million (up 5.9% year on year),
operating income of ¥21,100 million (up 51.3% year on year), and net
income of ¥10,500 million (up 71.9% year on year).
Please see Key Strategies under Sapporo Group Management Plan
2016 on pages 14 to 21 for details on strategies and targets for sales and
operating income by segment.
For 2016, the Company plans to maintain an annual dividend of ¥7
per share by steadily executing the management plan, while also
making strategic investments and strengthening its financial foundation.
Furthermore, Japanese stock exchanges aim to consolidate 100
shares of common stock of listed domestic companies into single
trading units. To comply with this aim and adjust its trading unit to
an appropriate level, Sapporo Holdings has decided to change the
trading unit of its shares to 100 shares from July 1, 2016, and simulta-
neously conduct a consolidation of its common stock at a ratio of one
share for five shares. In conjunction with this, the per-share dividend is
expected to become ¥35.
37SAPPORO HOLDINGS LIMITED Annual Report 2015
Risk FactorsMajor risks that could potentially impact the operating results and
financial position of the Sapporo Group, including stock price, are
listed below.
Forward-looking statements in the following text reflect the
judgment of management as of December 31, 2015.
Economic ConditionsBecause net sales of the Sapporo Group are mainly affected by
domestic economic trends, the unit price of key products could
decline due to fluctuating shipments of key products and deflationary
trends as a result of economic deterioration caused by changing
economic conditions. Moreover, deteriorating economic conditions
could also lead to a decrease in the value of asset holdings.
In addition, Japan’s declining birthrate and aging population may
result in an overall market decline in Japan, adversely affecting the
Group’s business performance and financial position.
High Dependency on Specific Business AreasIn 2015, the Japanese Alcoholic Beverages segment, one of the
Sapporo Group’s core business segments, accounted for 52% of
consolidated net sales. The Group could thus be significantly affected
by the performance of this business.
To break away from its high dependency on the Japanese
Alcoholic Beverages segment and further increase profitability, the
Group will expand its business activities in overseas markets.
However, the dependency on the Japanese Alcoholic Beverages
segment remains high in a domestic market where demand is declin-
ing, so sales could decline due to factors including price competition
with other companies, changes in consumer preferences, increases
in product prices or a cold summer or prolonged rainy season. This
could have a negative impact on the Group’s operating results.
Overseas Business ActivitiesThe Sapporo Group is aiming to grow earnings by expanding its
business activities in overseas markets. In particular, it is expanding
the alcoholic beverages business in the U.S. and Canada.
In Asia, the Group is conducting business in the beverage and
restaurant fields, mainly in Singapore. Also, in Vietnam, it is manufac-
turing and selling locally produced beer at its Long An factory.
The overseas business activities of the Sapporo Group are subject
to a variety of factors that could adversely affect operating results.
These factors include economic trends, changes in the competitive
landscape, and exchange rate fluctuations, in addition to changes to
regulations governing investment, trade, taxation, foreign exchange
and other areas, differences in business customs and labor relations,
as well as other governmental and social factors.
Food Product SafetyThe Sapporo Group is stepping up efforts to establish quality assur-
ance systems. However, beyond quality issues originating solely at the
Group, quality problems relating to generally available products and/
or raw materials could result in product recalls or defective shipments.
In the Restaurants segment, food poisoning could result in an
order to temporarily suspend operations or may otherwise adversely
affect operating results.
OEM Products and Purchased ProductsThe Sapporo Group outsources the manufacturing of some products
to external parties. It also handles products purchased from outside
the Group.
While the Sapporo Group does its best to ensure the quality of
such products, quality problems beyond the control of the Group
could result in the suspension of sales, product recalls and other
actions that may in turn adversely affect operating results.
Raw Material and Supply PricesPrices of certain raw materials and supplies are subject to fluctuations
in market conditions. A sharp increase in these prices could push up
the cost of sales, which may in turn adversely affect operating results.
Capital Investment PlansThe Sapporo Group conducts capital investment and systems
development on an ongoing basis, but related scheduling delays,
investment budget overruns and other factors may adversely affect
operating results.
Leaks of Customer InformationIn the event of a leak of personal information and other related issues
resulting from the unforeseen intrusion of a computer virus, unauthor-
ized access to information or other incident, the Sapporo Group could
face claims for damages and suffer a decline in its credibility.
This could have a negative impact on operating results by increas-
ing costs and reducing earnings.
Credit Risk of CustomersThe collection of receivables may be hindered by such factors as an
unforeseen bankruptcy of customers or investees. This could have a
negative impact on the Group’s operating results.
Management’s Discussion and Analysis
38

Impact of Laws and RegulationsThe unanticipated application of laws and regulations to Sapporo
Group businesses in the future could restrict business operations, with
an adverse effect on operating results.
For example, should demand decline due to liquor and
consumption tax increases, or should regulations pertaining to liquor
advertising, selling hours of liquor at liquor stores, or liquor sales
locations spread, factors including expenses required for dealing with
decreased demand and responding to new regulations could have a
negative effect on business performance.
Risk of LitigationThe Sapporo Group strives to reduce violations and infringements of
laws and regulations in its business operations by instilling a strong
compliance culture through employee training and education.
However, there is a risk of litigation being brought against the
Group in respect of a problem under product liability or intellectual
property laws, irrespective of any violation of laws and regulations by
Group companies or their employees in business operations in Japan
or overseas. The instigation of a suit against the Group or its outcome
could have a negative impact on the Group’s operating results.
Risk of Natural DisastersThe Sapporo Group could sustain damage as a result of a large-scale
natural disaster or a secondary disaster. This could have a negative
impact on the Group’s operating results such as by disrupting the
supply of products.
Financial LiabilitiesThe Sapporo Group raises a significant portion of the funds it requires
for various businesses through the issuance of corporate bonds and
borrowings from financial institutions. Accordingly, the Group has a
high balance of financial liabilities relative to total assets. Moreover,
the Group’s financial liabilities may increase further as a result of large-
scale investments accompanying the execution of its growth strategy.
In the event of an increase in market interest rates, or a down-
grading of the Company’s ratings by ratings agencies, the Group’s
interest expenses could increase or its fund-raising conditions could
deteriorate. This could have a negative impact on the Group’s operat-
ing results.
Retirement Benefit ObligationsThe Sapporo Group calculates employees’ retirement benefit
expenses and obligations based on actuarial assumptions, such as
the discount rate and the expected rate of return on pension assets.
In the event of differences between actual performance and
actuarial assumptions, or a change in these assumptions, the impact
will be recorded as an actuarial difference on a cumulative basis and
amortized over the average remaining period of service of employees
at the time of accrual.
There would consequently be an impact on future retirement
benefit expenses and the amount of retirement benefit obligations
booked. Separately, the net retirement benefit obligations at
transition, which arose upon a change in accounting standards for
retirement benefits, is amortized over 15 years.
Loss on Impairment of Property, Plant and Equipment and Leased AssetsThe Sapporo Group records impairment losses on property, plant and
equipment and leased assets, and intangibles at the Company and
consolidated subsidiaries in Japan in line with impairment criteria
based on Japanese accounting standards for the impairment of
fixed assets. Overseas, consolidated subsidiaries record impairment
losses, as necessary, based on local accounting standards. However,
going forward, the Sapporo Group may need to book additional
impairment losses if assets meet impairment criteria due to changes
in market and operating conditions or other factors, or the Company
may need to book losses on sales and disposal of property, plant and
equipment, depending on the sales price. This could adversely affect
the Sapporo Group’s operating results and financial position.
Business and Capital AlliancesThe Sapporo Group is promoting business and capital alliances
with other companies worldwide as part of efforts to increase its
competitiveness with a view to achieving growth in line with the
Sapporo Group Medium-Term Management Plan. However, the
Group may not achieve results as initially anticipated, depending on
market conditions, changes in the business environment and other
factors. In certain situations, the Sapporo Group’s operating results
and financial position may be negatively affected in the event of
deterioration in the business operations, assets and other aspects of
an alliance partner or investee. In addition, the Sapporo Group may
record the amortization of large amounts of goodwill in line with
investments, or may record an impairment loss on goodwill and
other assets due to deterioration in the business results of investees.
These factors could have a negative impact on the Sapporo Group’s
operating results and financial position.
Holding Company RiskSapporo Holdings derives income from brand licensing fees and
commissions for management guidance, as well as interest and
dividends paid by Group operating companies.
Any deterioration in the financial position of Group operating
companies could result in nonpayment, which could adversely affect
Sapporo Holdings’ business performance.
39SAPPORO HOLDINGS LIMITED Annual Report 2015

Consolidated Balance Sheets(December 31, 2015 and 2014)
Millions of yenThousands of U.S. dollars (Note 1)
ASSETS 2015 2014 2015Current assets:
Cash and cash equivalents ¥ 10,399 ¥ 9,748 $ 86,274
Time deposits 31 33 258
Notes and accounts receivable—trade 92,335 89,246 766,014
Inventories (Note 5) 38,635 36,540 320,516
Allowance for doubtful receivables (64) (166) (534)
Deferred tax assets (Note 16) 4,458 5,000 36,980
Other current assets 10,570 15,972 87,693
Total current assets 156,365 156,373 1,297,201
Investments and long-term loans:
Investment securities (Notes 12 and 14) 61,848 59,969 513,092
Long-term loans receivable 9,016 9,151 74,801
Allowance for doubtful receivables (1,235) (1,305) (10,244)
Deferred tax assets (Note 16) 1,009 1,091 8,374
Other investments 15,363 13,573 127,451
86,002 82,478 713,474
Property, plant and equipment (Notes 6 and 14):
Land 105,121 115,291 872,087
Buildings and structures 383,087 387,645 3,178,091
Accumulated depreciation (213,568) (211,317) (1,771,758)
Machinery and vehicles 227,534 224,180 1,887,623
Accumulated depreciation (183,166) (180,302) (1,519,545)
Lease assets 15,498 16,826 128,572
Accumulated depreciation (7,739) (7,904) (64,204)
Construction in progress 6,638 2,618 55,067
Other 18,488 19,263 153,373
Accumulated depreciation (14,851) (15,702) (123,203)
Property, plant and equipment, net 337,042 350,597 2,796,104
Intangibles:
Goodwill 30,236 29,966 250,834
Other 10,743 6,025 89,127
40,979 35,991 339,962
Total assets ¥ 620,388 ¥ 625,439 $ 5,146,740
The accompanying Notes to Consolidated Financial Statements are an integral part of these statements.
40

Millions of yenThousands of U.S. dollars (Note 1)
LIABILITIES AND NET ASSETS 2015 2014 2015Current liabilities:
Short-term bank loans (Note 14) ¥ 19,220 ¥ 22,424 $ 159,445
Commercial paper 17,000 30,000 141,032
Current portion of bonds (Note 14) 10,000 12,000 82,960
Current portion of long-term debt (Note 14) 46,603 9,023 386,618
Current portion of lease obligations 2,933 3,068 24,330
Notes and accounts payable—trade 36,772 35,534 305,061
Liquor taxes payable 33,904 33,603 281,267
Income taxes payable (Note 16) 6,115 725 50,726
Accrued bonuses (Note 2 (k)) 2,220 2,116 18,417
Deposits received 8,824 9,651 73,204
Other current liabilities 50,054 53,629 415,250
Total current liabilities 233,644 211,772 1,938,311
Bonds (Note 14) 50,000 50,000 414,800
Long-term debt (Note 14) 91,919 124,110 762,562
Lease obligations 5,353 6,101 44,410
Dealers’ deposits for guarantees 32,833 32,337 272,384
Net defined benefit liability (Note 15) 7,636 4,511 63,350
Deferred tax liabilities (Note 16) 21,216 22,617 176,008
Other long-term liabilities 13,964 13,987 115,844
Contingent liabilities (Note 9)
Total liabilities 456,566 465,434 3,787,669
Net assets
Shareholders’ equity:
Common stock (Note 20)
Authorized — 1,000,000,000 shares
Issued — at December 31, 2015 393,971,493 shares 53,887 — 447,044
— at December 31, 2014 393,971,493 shares — 53,887 —
Capital surplus 45,914 45,913 380,901
Retained earnings (Note 7) 35,190 34,914 291,933
Treasury stock, at cost (1,596) (1,545) (13,240)
Total shareholders’ equity 133,394 133,168 1,106,638
Accumulated other comprehensive income:
Unrealized holding gain on securities 23,926 20,113 198,494
Deferred hedge gains (11) (0) (95)
Foreign currency translation adjustments (1,256) 2,583 (10,418)
Remeasurements of defined benefit plans (Note 15) 1,875 441 15,552
Total accumulated other comprehensive income 24,534 23,136 203,533
Minority interests 5,894 3,701 48,900
Total net assets 163,822 160,005 1,359,072
Total liabilities and net assets ¥620,388 ¥625,439 $5,146,740
41SAPPORO HOLDINGS LIMITED Annual Report 2015
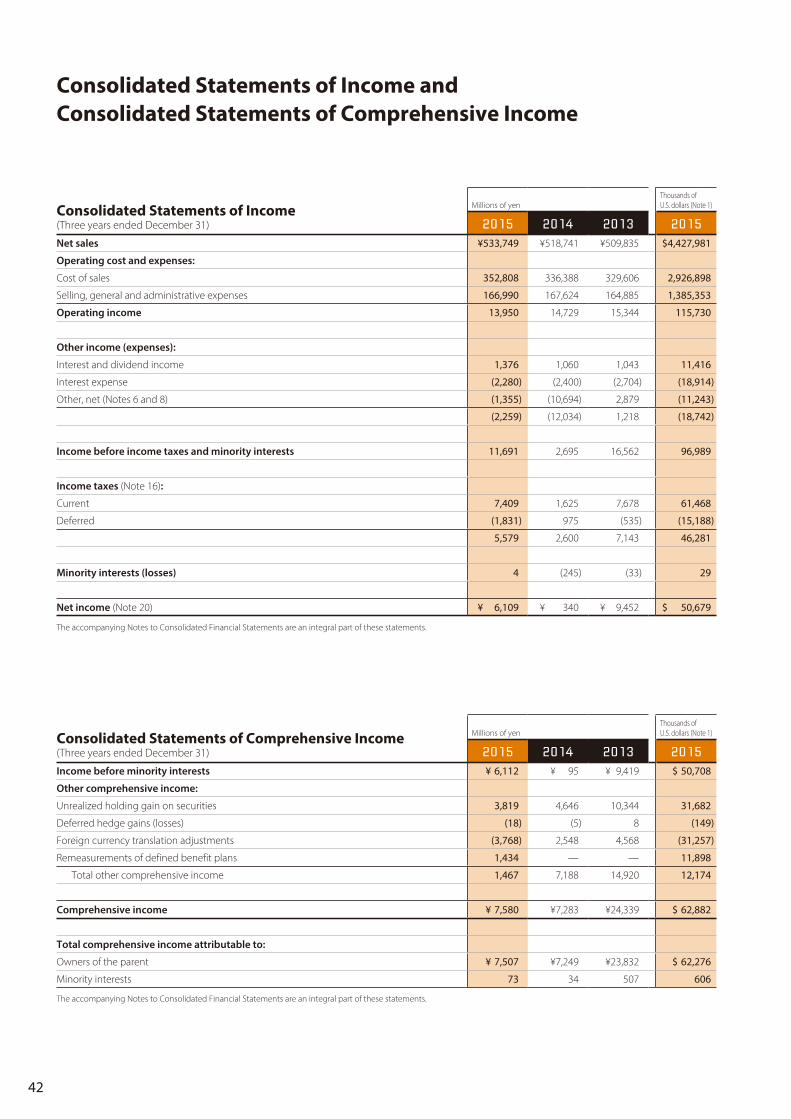
Consolidated Statements of Income and Consolidated Statements of Comprehensive Income
Consolidated Statements of Income(Three years ended December 31)
Millions of yenThousands of U.S. dollars (Note 1)
2015 2014 2013 2015Net sales ¥533,749 ¥518,741 ¥509,835 $4,427,981
Operating cost and expenses:
Cost of sales 352,808 336,388 329,606 2,926,898
Selling, general and administrative expenses 166,990 167,624 164,885 1,385,353
Operating income 13,950 14,729 15,344 115,730
Other income (expenses):
Interest and dividend income 1,376 1,060 1,043 11,416
Interest expense (2,280) (2,400) (2,704) (18,914)
Other, net (Notes 6 and 8) (1,355) (10,694) 2,879 (11,243)
(2,259) (12,034) 1,218 (18,742)
Income before income taxes and minority interests 11,691 2,695 16,562 96,989
Income taxes (Note 16):
Current 7,409 1,625 7,678 61,468
Deferred (1,831) 975 (535) (15,188)
5,579 2,600 7,143 46,281
Minority interests (losses) 4 (245) (33) 29
Net income (Note 20) ¥ 6,109 ¥ 340 ¥ 9,452 $ 50,679
The accompanying Notes to Consolidated Financial Statements are an integral part of these statements.
Consolidated Statements of Comprehensive Income(Three years ended December 31)
Millions of yenThousands of U.S. dollars (Note 1)
2015 2014 2013 2015Income before minority interests ¥ 6,112 ¥ 95 ¥ 9,419 $ 50,708
Other comprehensive income:
Unrealized holding gain on securities 3,819 4,646 10,344 31,682
Deferred hedge gains (losses) (18) (5) 8 (149)
Foreign currency translation adjustments (3,768) 2,548 4,568 (31,257)
Remeasurements of defined benefit plans 1,434 — — 11,898
Total other comprehensive income 1,467 7,188 14,920 12,174
Comprehensive income ¥ 7,580 ¥7,283 ¥24,339 $ 62,882
Total comprehensive income attributable to:
Owners of the parent ¥ 7,507 ¥7,249 ¥23,832 $ 62,276
Minority interests 73 34 507 606
The accompanying Notes to Consolidated Financial Statements are an integral part of these statements.
42
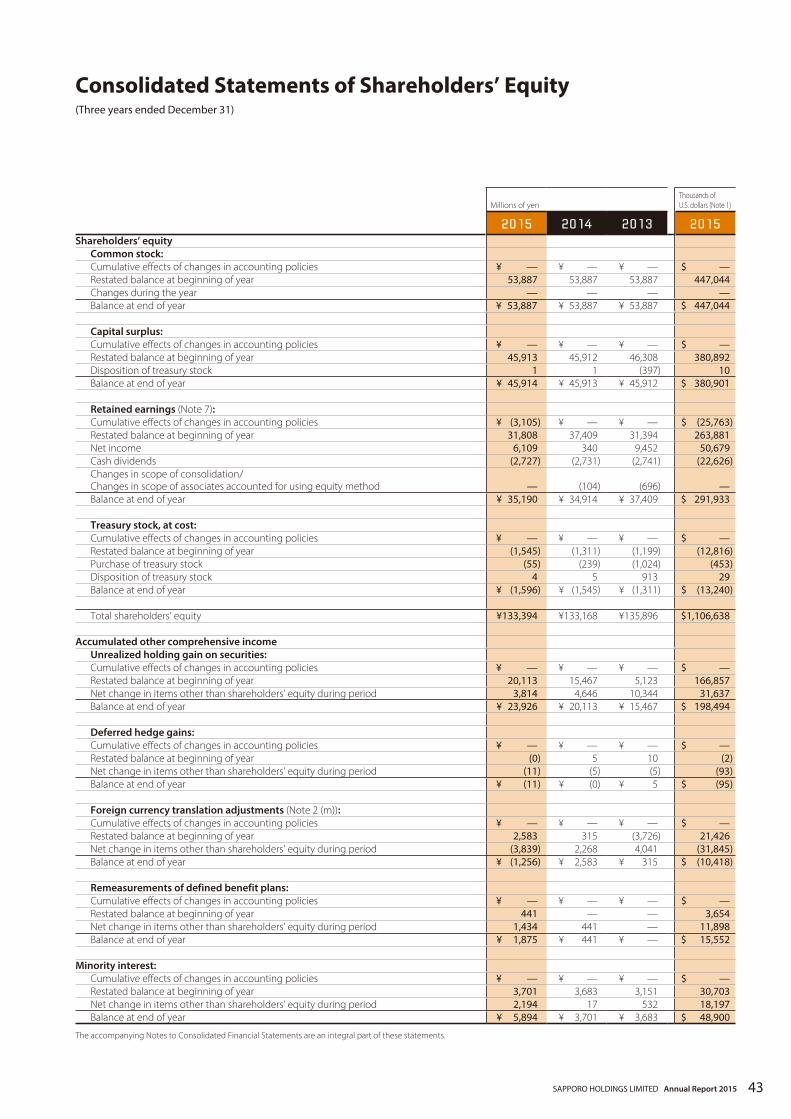
Millions of yenThousands of U.S. dollars (Note 1)
2015 2014 2013 2015Shareholders’ equity
Common stock:Cumulative effects of changes in accounting policies ¥ — ¥ — ¥ — $ —Restated balance at beginning of year 53,887 53,887 53,887 447,044Changes during the year — — — —Balance at end of year ¥ 53,887 ¥ 53,887 ¥ 53,887 $ 447,044
Capital surplus:Cumulative effects of changes in accounting policies ¥ — ¥ — ¥ — $ —Restated balance at beginning of year 45,913 45,912 46,308 380,892Disposition of treasury stock 1 1 (397) 10Balance at end of year ¥ 45,914 ¥ 45,913 ¥ 45,912 $ 380,901
Retained earnings (Note 7):Cumulative effects of changes in accounting policies ¥ (3,105) ¥ — ¥ — $ (25,763)Restated balance at beginning of year 31,808 37,409 31,394 263,881Net income 6,109 340 9,452 50,679Cash dividends (2,727) (2,731) (2,741) (22,626)Changes in scope of consolidation/ Changes in scope of associates accounted for using equity method — (104) (696) —Balance at end of year ¥ 35,190 ¥ 34,914 ¥ 37,409 $ 291,933
Treasury stock, at cost:Cumulative effects of changes in accounting policies ¥ — ¥ — ¥ — $ —Restated balance at beginning of year (1,545) (1,311) (1,199) (12,816)Purchase of treasury stock (55) (239) (1,024) (453)Disposition of treasury stock 4 5 913 29Balance at end of year ¥ (1,596) ¥ (1,545) ¥ (1,311) $ (13,240)
Total shareholders’ equity ¥133,394 ¥133,168 ¥135,896 $1,106,638
Accumulated other comprehensive incomeUnrealized holding gain on securities:Cumulative effects of changes in accounting policies ¥ — ¥ — ¥ — $ —Restated balance at beginning of year 20,113 15,467 5,123 166,857Net change in items other than shareholders’ equity during period 3,814 4,646 10,344 31,637Balance at end of year ¥ 23,926 ¥ 20,113 ¥ 15,467 $ 198,494
Deferred hedge gains:Cumulative effects of changes in accounting policies ¥ — ¥ — ¥ — $ —Restated balance at beginning of year (0) 5 10 (2)Net change in items other than shareholders’ equity during period (11) (5) (5) (93)Balance at end of year ¥ (11) ¥ (0) ¥ 5 $ (95)
Foreign currency translation adjustments (Note 2 (m)):Cumulative effects of changes in accounting policies ¥ — ¥ — ¥ — $ —Restated balance at beginning of year 2,583 315 (3,726) 21,426Net change in items other than shareholders’ equity during period (3,839) 2,268 4,041 (31,845)Balance at end of year ¥ (1,256) ¥ 2,583 ¥ 315 $ (10,418)
Remeasurements of defined benefit plans:Cumulative effects of changes in accounting policies ¥ — ¥ — ¥ — $ —Restated balance at beginning of year 441 — — 3,654Net change in items other than shareholders’ equity during period 1,434 441 — 11,898Balance at end of year ¥ 1,875 ¥ 441 ¥ — $ 15,552
Minority interest:Cumulative effects of changes in accounting policies ¥ — ¥ — ¥ — $ —Restated balance at beginning of year 3,701 3,683 3,151 30,703Net change in items other than shareholders’ equity during period 2,194 17 532 18,197Balance at end of year ¥ 5,894 ¥ 3,701 ¥ 3,683 $ 48,900
The accompanying Notes to Consolidated Financial Statements are an integral part of these statements.
Consolidated Statements of Shareholders’ Equity(Three years ended December 31)
43SAPPORO HOLDINGS LIMITED Annual Report 2015

Consolidated Statements of Cash Flows(Three years ended December 31)
Millions of yenThousands of U.S. dollars (Note 1)
2015 2014 2013 2015Cash flows from operating activities:Income before income taxes and minority interests ¥ 11,691 ¥ 2,695 ¥ 16,562 $ 96,989Depreciation and amortization 24,224 24,481 25,059 200,963Loss on impairment of property, plant and equipment and leased assets 5,956 893 426 49,415Goodwill amortization 4,153 3,764 3,985 34,456Decrease in employees’ retirement benefits — — (1,474) —Increase (decrease) in net defined benefit liability 446 (616) — 3,703Decrease in allowance for doubtful receivables (137) (87) (114) (1,138)Interest and dividend income (1,376) (1,060) (1,043) (11,416)Interest expense 2,280 2,400 2,751 18,914Gain on sales of property, plant and equipment (7,453) (3,528) (62) (61,834)Loss on sales and disposal of property, plant and equipment 1,559 2,252 1,379 12,934Gain on sales of investment securities (47) (231) (3,488) (389)Loss on devaluation of investment securities 1,758 12 59 14,587Increase in notes and accounts receivable (2,780) (1,193) (2,315) (23,063)(Increase) decrease in inventories (1,211) (1,401) 108 (10,051)Increase (decrease) in notes and accounts payable (202) (930) 2,225 (1,678)Increase (decrease) in accrued consumption taxes (3,057) 4,212 336 (25,362)Increase (decrease) in liquor taxes payable 457 (165) 194 3,795Decrease in deposits received (730) (1,163) (1,653) (6,055)Increase in other current liabilities 377 1,025 2,152 3,127Other 49 53 (2,595) 406
Subtotal 35,958 31,413 42,494 298,304Interest and dividends received 1,381 1,079 1,056 11,453Interest paid (2,385) (2,518) (2,773) (19,784)Income taxes paid (Note 4) (2,945) 7,769 (7,915) (24,431)Income taxes refundable (Note 4) 3,257 79 — 27,023Net cash provided by operating activities 35,266 22,284 32,862 292,565
Cash flows from investing activities:Purchases of investment securities (876) (1,398) (347) (7,266)Proceeds from redemption and sales of investment securities 511 392 4,436 4,241Purchases of affiliates’ securities (3,261) (91) (265) (27,053)Proceeds from sales of affiliates’ securities 1,795 — — 14,890Purchases of subsidiaries’ shares resulting in change in scope of consolidation (3,989) — — (33,093)Payments for sales of subsidiaries’ shares resulting in change in scope of consolidation — (26) — —Payments for acquisition of associates accounted for using equity method — — (286) —Collection of sales of subsidiaries’ shares for prior periods 3,198 — — 26,532Purchases of property, plant and equipment (18,298) (17,313) (12,244) (151,800)Proceeds from sales of property, plant and equipment 19,564 6,383 172 162,303Purchases of intangibles (2,042) (1,821) (1,525) (16,939)Increase in long-term loans receivable (304) (137) (232) (2,525)Collection of long-term loans receivable 417 227 440 3,463Other (6,471) (3,447) (3,417) (53,687)Net cash used in investing activities (9,756) (17,229) (13,268) (80,933)
Cash flows from financing activities:Net decrease in short-term bank loans (3,367) (3,337) (9,363) (27,931)Proceeds from long-term debt 14,319 25,630 32,250 118,793Repayment of long-term debt (16,626) (38,401) (21,964) (137,925)Proceeds from issuance of bonds 9,960 9,960 19,920 82,628Redemption of bonds (12,000) — (10,000) (99,552)Net increase (decrease) in commercial paper (13,000) 5,000 (22,000) (107,848)Cash dividends paid (2,730) (2,734) (2,738) (22,651)Cash dividends paid to minority shareholders (29) (15) (17) (240)Repayment of finance lease obligations (3,039) (3,322) (4,218) (25,212)Purchase of treasury stock (56) (95) (1,024) (468)Proceeds from sales of treasury stock 5 6 6 39Proceeds from minority shareholders 1,760 — — 14,605Net cash used in financing activities (24,803) (7,308) (19,147) (205,762)
Effect of exchange rate changes on cash and cash equivalents (56) 426 607 (467)Net increase (decrease) in cash and cash equivalents 651 (1,826) 1,053 5,403Cash and cash equivalents at beginning of year 9,748 11,519 9,725 80,871Increase in cash and cash equivalents from newly consolidated subsidiaries — 10 740 —Increase in cash and cash equivalents resulting from merger — 46 — —Cash and cash equivalents at end of year ¥ 10,399 ¥ 9,748 ¥ 11,519 $ 86,274
The accompanying Notes to Consolidated Financial Statements are an integral part of these statements.
44
Notes to Consolidated Financial Statements
1. Basis of PresentationThe Company and its domestic consolidated subsidiaries maintain their accounting records and prepare their financial statements in accordance with accounting principles generally accepted in Japan, which are different in certain respects as to the application and dis-closure requirements of International Financial Reporting Standards, and its consolidated foreign subsidiaries, in accordance with that of their country of domicile. The accompanying financial statements have been compiled from the consolidated financial statements prepared by the Company as required by the Financial Instruments and Exchange Act of Japan.The relevant notes have been prepared as additional information.In addition, certain reclassifications have been made to present the accompanying consolidated financial statements in a format which is familiar to readers outside Japan. Furthermore, certain reclassifications of previously reported amounts have been made to reconcile the consolidated financial statements for the years ended December 31, 2013 and 2014 to the 2015 presentation.
For the convenience of the reader, the accompanying consoli-dated financial statements as of and for the year ended December 31, 2015 have been translated from yen amounts into U.S. dollar amounts at the rate of ¥120.54=U.S.$1.00, the exchange rate prevailing on December 31, 2015.
2. Summary of Significant Accounting Policies(a) Principles of consolidationThe accompanying consolidated financial statements include the accounts of the Company and its significant subsidiaries. All significant intercompany balances, transactions and profits have been eliminated in consolidation.
During the year ended December 31, 2015, the Company gained 13 subsidiaries reflecting the purchase of investment securities, and lost one subsidiary that ceased to exist after a merger. Accordingly, the number of consolidated subsidiaries was 54 as of December 31, 2015.
The Company’s remaining subsidiaries, whose gross assets, net sales, net income and retained earnings were not significant in the aggregate in relation to comparable balances in the consolidated financial statements, have not been consolidated.
Regarding the fiscal years of consolidated subsidiaries, effective from the year ended December 31, 2015, consolidated subsidiary SILVER SPRINGS CITRUS, INC. changed its fiscal year-end from September 30 to December 31. In line with this change in fiscal year, the 15-month period of SILVER SPRINGS CITRUS, INC. from October 1, 2014 to December 31, 2015 has been consolidated for the year ended December 31, 2015. From October 1, 2015 to December 31, 2015, SILVER SPRINGS CITRUS, INC., the company changing its fiscal year, posted net sales of ¥2,832 million and a net loss of ¥151 million.
(b) Investments in unconsolidated subsidiaries and affiliatesDuring the year ended December 31, 2015, the Company removed one subsidiary from the sale of investment security.
As a result, the Company had made investments in two affiliates accounted by the equity method as of December 31, 2015.
Investments in unconsolidated subsidiaries and affiliates other than those accounted for by the equity method are stated at cost determined by the moving-average method as, in the aggregate, they were not material.
(c) Cash equivalentsAll highly liquid investments with a maturity of three months or less when purchased are considered cash equivalents.
(d) Marketable and investment securitiesSecurities other than those of subsidiaries and affiliates are classified into three categories: trading, held-to-maturity and other securities.
Trading securities are carried at fair value, and held-to-maturity securities are carried at amortized cost. Marketable securities classified as other securities are carried at fair value as of the end of the year, with any net unrealized gain or loss included as a separate component of shareholders’ equity, net of the related taxes.
Nonmarketable securities classified as other securities are carried at cost. Cost of securities sold is determined by the moving-average method.
(e) DerivativesDerivatives’ positions are stated at fair value.
(f) InventoriesInventories are stated at cost determined principally by the gross average method.
(g) Property, plant and equipmentProperty, plant and equipment is stated at cost. Depreciation is computed by the declining-balance method over the estimated useful lives of the manufacturing facilities for alcoholic beverages and soft drinks, and by the straight-line method for the real estate assets held and for buildings acquired in Japan subsequent to March 31, 1998. The annual provisions for depreciation have been computed over periods from two to 65 years for buildings and structures, and from two to 17 years for machinery and vehicles.
For property and equipment retired or otherwise disposed of, costs and related depreciation are charged to the respective accounts and the net difference, less any amount realized on disposal, is charged to operations.
Maintenance and repairs, including minor refurbishments and improvements, are charged to income when incurred.
(h) IntangiblesIntangibles with limited useful lives are amortized by the straight-line method over their estimated useful lives.
Software used internally is amortized by the straight-line method over its estimated useful life (5 years) within the Company.
45SAPPORO HOLDINGS LIMITED Annual Report 2015
(i) Lease assetsLease assets are amortized by the straight-line method with the lease period considered to be the useful life and the guaranteed residual value considered to be the residual value.
Finance leases other than those that transfer ownership of the leased assets to the lessees, entered into on or before December 31, 2008, are treated in the same way as ordinary operating leases for accounting purposes.
(j) Allowance for doubtful accountsThe allowance for doubtful accounts is estimated as the average percentage of actual historical bad debts, which is then applied to the balance of receivables.
In addition, an amount deemed necessary to cover uncollectible receivables is provided for specific doubtful accounts.
(k) Accrued bonusesThe accrual for employees’ bonuses is based on an estimate of the amounts to be paid subsequent to the balance sheet date.
(l) Employees’ retirement benefitsEmployees’ retirement benefits are provided principally at an amount calculated based on the retirement benefit obligation and the fair value of the pension plan assets at the balance sheet date.
(1) Method of attributing the projected amount of retirement benefit to the period
In calculating retirement benefit obligations, the Company uses the straight line method to allocate the projected retirement benefit for the period up to the end of the fiscal year under review.
(2) Method of amortizing actuarial gain and loss, past service cost, and net retirement benefit obligation at transition between accounting standards
The net retirement benefit obligation at transition is being amortized over a period of 15 years by the straight line method. Actuarial gain and loss are amortized in the year following the year in which the gain or loss is recognized primarily by the straight line method over the average remaining years of service of the eligible employees (ten years through 14 years). Past service cost is amortized by the straight line method over the average remaining years of service of the employees (ten years through 14 years).
(m) Foreign currency translationAll monetary assets and liabilities denominated in foreign currencies, whether long-term or short-term, are translated into Japanese yen at the exchange rates prevailing at the balance sheet date. The resulting exchange gain or loss is credited or charged to income.
All assets and liabilities of foreign subsidiaries are translated into Japanese yen at the exchange rates prevailing at the balance sheet date.
Revenues and expenses of foreign subsidiaries, on the other hand, are translated into Japanese yen at the average exchange rate for the fiscal year.
Any translation differences are included in foreign currency transla-tion adjustments in the net assets section of the balance sheets.
(n) Hedge accountingGain or loss on derivatives positions designated as hedging instru-ments is deferred until the gain or loss on the underlying hedged item is recognized.
In addition, if an interest-rate swap of forward foreign exchange contract meets certain conditions, the interest expense is computed at a combined rate and recognized.
(o) Amortization of goodwill and negative goodwillGoodwill is amortized in equal amounts over an appropriate period not to exceed 20 years.
3. Change in Method of Accounting
(Accounting Standards for Retirement Benefits)“Accounting Standard for Retirement Benefits” (Accounting Standards Board of Japan (ASBJ) Statement No. 26, May 17, 2012) and “Guidance on Accounting Standard for Retirement Benefits” (ASBJ Guidance No. 25, March 26, 2015) have been applied, effective from the fiscal year ended December 31, 2015, in accordance with the provisions of Article 35 of the Accounting Standard for Retirement Benefits and Article 67 of the Guidance on Accounting Standard for Retirement Benefits. As a result, the method for calculating retirement benefit obligations and service costs has been revised, and the method for attributing projected benefits to periods has been changed from the straight-line basis to the benefit formula basis. As to the discount rate, it used to be calculated based on the periods, comparable to employ-ees’ average remaining years of service. Under the new accounting standard, however, the method of determining the discount rate has now been changed to use a single weighted-average discount rate that reflects the periods until the expected payment of retirement benefits and the amount of projected benefits for every such period.
In applying these retirement benefit-related accounting standards, etc., and in accordance with the transitional treatment provided in Article 37 of the Accounting Standard for Retirement Benefits, the effect of the change in calculation method for retirement benefit obligations and service costs has been recognized by adjusting retained earnings at the beginning of the fiscal year ended December 31, 2015. Consequently, as of the beginning of the fiscal year ended December 31, 2015, net defined benefit liability increased by ¥4,800 million ($39,817 thousand), while retained earnings decreased by ¥3,105 million ($25,763 thousand). Furthermore, during the fiscal year ended December 31, 2015, operating income and income taxes before minority interests each grew by ¥168 million ($1,394 thousand), respectively.
(Accounting Standards Issued but Not Yet Adopted)• Revised Accounting Standard for Business Combinations
(ASBJ Statement No. 21, September 13, 2013)• Revised Accounting Standard for Consolidated Financial Statements
(ASBJ Statement No. 22, September 13, 2013)• Revised Accounting Standard for Business Divestitures
(ASBJ Statement No. 7, September 13, 2013)
46
Notes to Consolidated Financial Statements
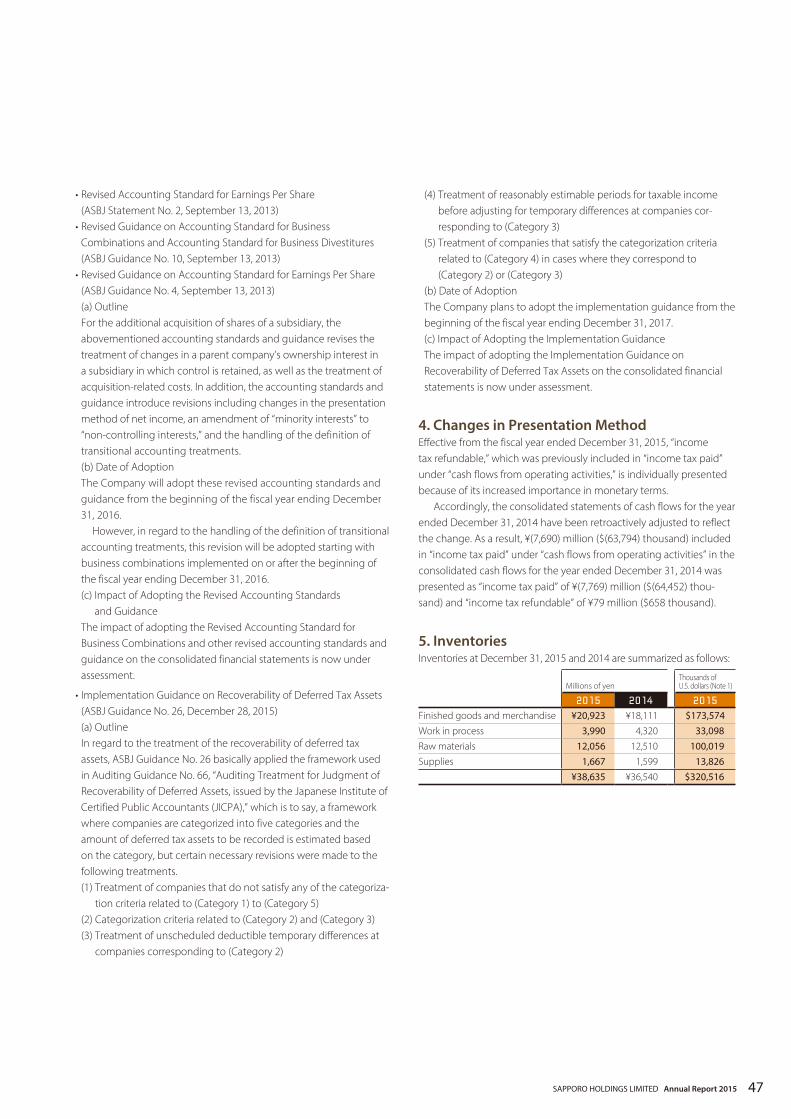
• Revised Accounting Standard for Earnings Per Share (ASBJ Statement No. 2, September 13, 2013)
• Revised Guidance on Accounting Standard for Business Combinations and Accounting Standard for Business Divestitures (ASBJ Guidance No. 10, September 13, 2013)
• Revised Guidance on Accounting Standard for Earnings Per Share (ASBJ Guidance No. 4, September 13, 2013)(a) OutlineFor the additional acquisition of shares of a subsidiary, the abovementioned accounting standards and guidance revises the treatment of changes in a parent company’s ownership interest in a subsidiary in which control is retained, as well as the treatment of acquisition-related costs. In addition, the accounting standards and guidance introduce revisions including changes in the presentation method of net income, an amendment of “minority interests” to “non-controlling interests,” and the handling of the definition of transitional accounting treatments.(b) Date of AdoptionThe Company will adopt these revised accounting standards and guidance from the beginning of the fiscal year ending December 31, 2016. However, in regard to the handling of the definition of transitional accounting treatments, this revision will be adopted starting with business combinations implemented on or after the beginning of the fiscal year ending December 31, 2016.(c) Impact of Adopting the Revised Accounting Standards
and GuidanceThe impact of adopting the Revised Accounting Standard for Business Combinations and other revised accounting standards and guidance on the consolidated financial statements is now under assessment.
• Implementation Guidance on Recoverability of Deferred Tax Assets (ASBJ Guidance No. 26, December 28, 2015)(a) OutlineIn regard to the treatment of the recoverability of deferred tax assets, ASBJ Guidance No. 26 basically applied the framework used in Auditing Guidance No. 66, “Auditing Treatment for Judgment of Recoverability of Deferred Assets, issued by the Japanese Institute of Certified Public Accountants (JICPA),” which is to say, a framework where companies are categorized into five categories and the amount of deferred tax assets to be recorded is estimated based on the category, but certain necessary revisions were made to the following treatments.(1) Treatment of companies that do not satisfy any of the categoriza-
tion criteria related to (Category 1) to (Category 5)(2) Categorization criteria related to (Category 2) and (Category 3)(3) Treatment of unscheduled deductible temporary differences at
companies corresponding to (Category 2)
(4) Treatment of reasonably estimable periods for taxable income before adjusting for temporary differences at companies cor-responding to (Category 3)
(5) Treatment of companies that satisfy the categorization criteria related to (Category 4) in cases where they correspond to (Category 2) or (Category 3)
(b) Date of AdoptionThe Company plans to adopt the implementation guidance from the beginning of the fiscal year ending December 31, 2017.(c) Impact of Adopting the Implementation GuidanceThe impact of adopting the Implementation Guidance on Recoverability of Deferred Tax Assets on the consolidated financial statements is now under assessment.
4. Changes in Presentation MethodEffective from the fiscal year ended December 31, 2015, “income tax refundable,” which was previously included in “income tax paid” under “cash flows from operating activities,” is individually presented because of its increased importance in monetary terms.
Accordingly, the consolidated statements of cash flows for the year ended December 31, 2014 have been retroactively adjusted to reflect the change. As a result, ¥(7,690) million ($(63,794) thousand) included in “income tax paid” under “cash flows from operating activities” in the consolidated cash flows for the year ended December 31, 2014 was presented as “income tax paid” of ¥(7,769) million ($(64,452) thou-sand) and “income tax refundable” of ¥79 million ($658 thousand).
5. InventoriesInventories at December 31, 2015 and 2014 are summarized as follows:
Millions of yenThousands of U.S. dollars (Note 1)
2015 2014 2015
Finished goods and merchandise ¥20,923 ¥18,111 $173,574Work in process 3,990 4,320 33,098Raw materials 12,056 12,510 100,019Supplies 1,667 1,599 13,826
¥38,635 ¥36,540 $320,516
47SAPPORO HOLDINGS LIMITED Annual Report 2015

6. Loss on Impairment of Property, Plant and EquipmentThe Company and its consolidated subsidiaries recorded impairment losses on the following asset groups for the year ended December 31, 2015:
Location Use Classification Millions of yenThousands of U.S. dollars (Note 1)
Sapporo Breweries Ltd. (Kitakanbara-gun, Niigata and other) Idle real estate/Welfare facilities Land ¥2,944 $24,423Buildings 138 1,142Other 1 12
¥3,083 $25,577
Sapporo Vietnam Ltd. (Long An Province, Vietnam) International business Goodwill ¥2,082 $17,276¥2,082 $17,276
PS Beverage Ltd (Koto-ku, Tokyo) Machinery for operations Land ¥ 130 $ 1,082Buildings 35 289Machinery 1 4Lease assets 149 1,232Other 18 151
¥ 332 $ 2,758
Sapporo Lion Ltd. (Chiyoda-ku, Tokyo and other) Restaurants for operations Buildings ¥ 157 $ 1,304Machinery 14 119Other 6 50
¥ 178 $ 1,474
POKKA SAPPORO Food & Beverage Ltd. (Toyota-shi, Aichi) Beverage manufacturing facilities Land ¥ 0 $ 1Buildings 78 650Machinery 55 456Other 4 33
¥ 137 $ 1,140
Pokka Create Co., Ltd. (Nakagyo-ku, Kyoto and other) Restaurants for operations Buildings ¥ 75 $ 619Lease assets 6 51Other 6 49
¥ 87 $ 719
Public Vending Service Co., Ltd (Koto-ku, Tokyo) Machinery for operations Lease assets ¥ 44 $ 364Other 10 82
¥ 54 $ 446
Sapporo Lion (Singapore) Pte. Ltd. (Singapore) Restaurants for operations Buildings ¥ 1 $ 11Machinery 1 8
¥ 2 $ 19
Okinawa Pokka Foods Co., Ltd. (Kunigami-gun, Okinawa) Beverage manufacturing facilities Machinery ¥ 1 $ 5¥ 1 $ 5¥5,956 $49,415
48
Notes to Consolidated Financial Statements

The Company and its consolidated subsidiaries recorded impairment losses on the following asset groups for the year ended December 31, 2014:
Location Use Classification Millions of yen
Public Vending Service Co., Ltd. (Koto-ku, Tokyo) Other Goodwill ¥209Other 142
¥350
Sapporo Lion Ltd. (Toshima-ku, Tokyo and other) Restaurants for operations Buildings ¥199Machinery 18Other 7
¥223
Okinawa Pokka Foods Co., Ltd. (Kunigami-gun, Okinawa) Beverage manufacturing facilities Buildings ¥ 62Machinery 93Other 12
¥167
Sapporo Breweries Ltd. (Kitakanbara-gun, Niigata and other) Idle real estate Land ¥ 75¥ 75
Pokka Sapporo Food & Beverage Ltd. (Isesaki-shi, Gunma) Beverage manufacturing facilities Buildings ¥ 4Machinery 32Other 0
¥ 36
Pokka Create Co., Ltd. (Tokushima-shi, Tokushima and other) Restaurants for operations Buildings ¥ 15Machinery —Other 7
¥ 22
Pokka Corporation (H.K.) Ltd. (Hong Kong, Republic of China) Restaurants for operations Buildings ¥ 19¥ 19¥893
49SAPPORO HOLDINGS LIMITED Annual Report 2015

The Company and its consolidated subsidiaries recorded impairment losses on the following asset groups for the year ended December 31, 2013:
Location Use Classification Millions of yen
SLEEMAN BREWERIES LTD. (Nova Scotia, Canada) Beer brewing facilities Machinery ¥221Buildings 5Other 3
¥228
Sapporo Lion Ltd. (Chuo-ku, Tokyo and other) Restaurants for operations Buildings ¥116Machinery 6Other 4
¥126
Pokka Create Co., Ltd. (Hamamatsu-shi, Shizuoka and other) Restaurants for operations Buildings ¥ 26Other 10
¥ 36
Sapporo Breweries Ltd. (Koshu-shi, Yamanashi) Restaurants for operations Buildings ¥ 17¥ 17
Sapporo Real Estate Co., Ltd. (Shibuya-ku, Tokyo) Offices Buildings ¥ 16¥ 16
Pokka Sapporo Food & Beverage Ltd. (Aichi-gun, Aichi and other) Idle real estate Land ¥ 2¥ 2¥426
The Company and its consolidated subsidiaries decided the asset group in consideration of the division in management accounting.Idle real estate and real estate for lease and offices are grouped with each real estate, and the restaurants are mainly grouped with each store. The asset groups for manufacturing facilities and assets for business are for each respective business.
Idle real estate and welfare facilities have been written down to the recoverable amount upon sale. An impairment loss has been booked for the amount of the write-down.
In the International segment, assets have been written down to the recoverable amount as it is expected to be difficult to recover the investment due mainly to declining profitability. An impairment loss has been booked for the amount of the write-down.
Machinery for operations has been written down to the recover-able amount as it is expected to be difficult to recover the investment due to declining profitability. An impairment loss has been booked for the amount of the write-down.
For restaurants for operations, the amount by which the carrying amount of these assets exceeds the expected present value of these assets is recognized as an impairment loss because the carrying amount of these assets may not be recoverable due to poor profitability.
Beer brewing facilities, beverages and food manufacturing facilities have been written down to the recoverable amount as it is expected to be difficult to recover the investment due mainly to the termination of roasted bean production and declining profitability. An impairment loss has been booked for the amount of the write-down.
Offices have been written down to the recoverable amount as it is expected to be difficult to recover the investment due to declining profitability as a result of office relocation. An impairment loss has been booked for the amount of the write-down.
The recoverable amount is measured by the net selling cost and the value in use, with the net selling cost determined based on an appraisal value provided by a real estate appraisal company. The value in use is calculated based on future cash flows discounted by a certain discount rate.
The discount rate was 6.6–14.7% in 2015, 7.1–7.3% in 2014, and 6.4–7.2% in 2013.
7. Shareholders’ EquityRetained earnings include a legal reserve provided in accordance with the provisions of the Commercial Code. This reserve is not available for the payment of dividends, but it may be used to reduce or elimi-nate a deficit by resolution of the shareholders or may be transferred to common stock by resolution of the Board of Directors.
50
Notes to Consolidated Financial Statements
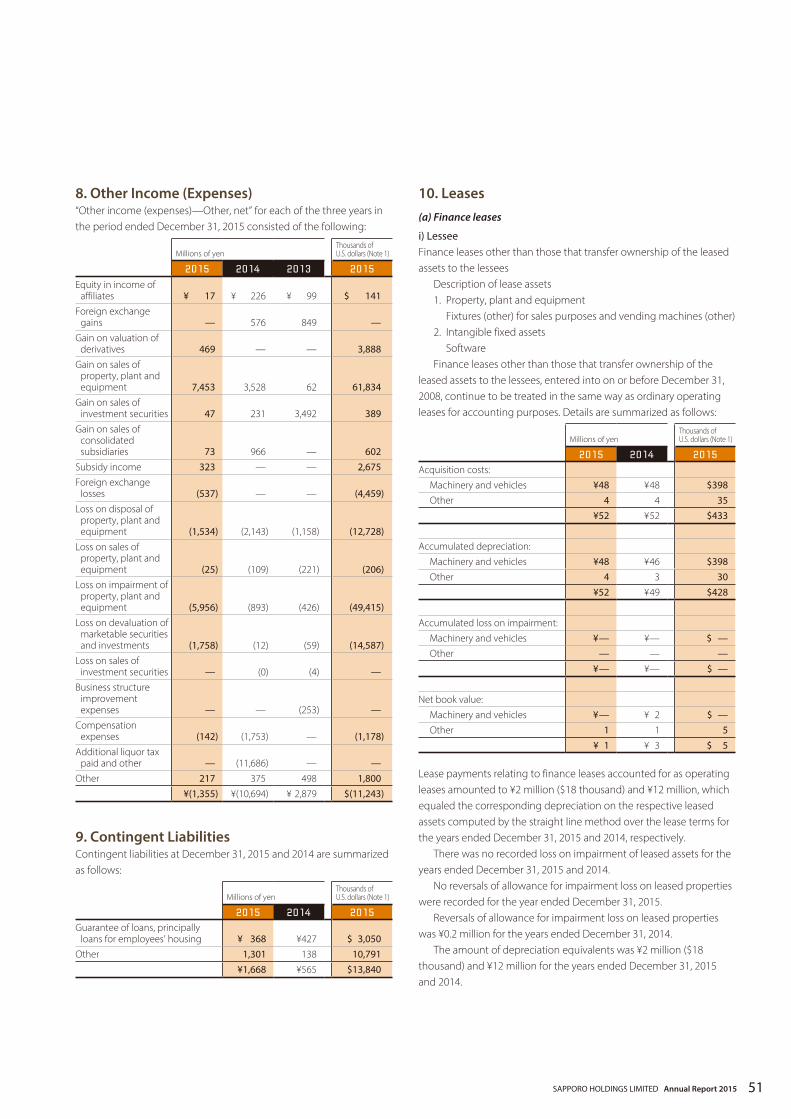
8. Other Income (Expenses)“Other income (expenses)—Other, net” for each of the three years in the period ended December 31, 2015 consisted of the following:
Millions of yenThousands of U.S. dollars (Note 1)
2015 2014 2013 2015
Equity in income of affiliates ¥ 17 ¥ 226 ¥ 99 $ 141
Foreign exchange gains — 576 849 —
Gain on valuation of derivatives 469 — — 3,888
Gain on sales of property, plant and equipment 7,453 3,528 62 61,834
Gain on sales of investment securities 47 231 3,492 389
Gain on sales of consolidated subsidiaries 73 966 — 602
Subsidy income 323 — — 2,675Foreign exchange
losses (537) — — (4,459)Loss on disposal of
property, plant and equipment (1,534) (2,143) (1,158) (12,728)
Loss on sales of property, plant and equipment (25) (109) (221) (206)
Loss on impairment of property, plant and equipment (5,956) (893) (426) (49,415)
Loss on devaluation of marketable securities and investments (1,758) (12) (59) (14,587)
Loss on sales of investment securities — (0) (4) —
Business structure improvement expenses — — (253) —
Compensation expenses (142) (1,753) — (1,178)
Additional liquor tax paid and other — (11,686) — —
Other 217 375 498 1,800¥(1,355) ¥(10,694) ¥ 2,879 $(11,243)
9. Contingent LiabilitiesContingent liabilities at December 31, 2015 and 2014 are summarized as follows:
Millions of yenThousands of U.S. dollars (Note 1)
2015 2014 2015
Guarantee of loans, principally loans for employees’ housing ¥ 368 ¥427 $ 3,050
Other 1,301 138 10,791¥1,668 ¥565 $13,840
10. Leases(a) Finance leases
i) LesseeFinance leases other than those that transfer ownership of the leased assets to the lessees
Description of lease assets1. Property, plant and equipment Fixtures (other) for sales purposes and vending machines (other)2. Intangible fixed assets SoftwareFinance leases other than those that transfer ownership of the
leased assets to the lessees, entered into on or before December 31, 2008, continue to be treated in the same way as ordinary operating leases for accounting purposes. Details are summarized as follows:
Millions of yenThousands of U.S. dollars (Note 1)
2015 2014 2015
Acquisition costs:Machinery and vehicles ¥48 ¥ 48 $398Other 4 4 35
¥52 ¥ 52 $433
Accumulated depreciation:Machinery and vehicles ¥48 ¥ 46 $398Other 4 3 30
¥52 ¥ 49 $428
Accumulated loss on impairment:Machinery and vehicles ¥ — ¥— $ —Other — — —
¥ — ¥— $ —
Net book value:Machinery and vehicles ¥ — ¥ 2 $ —Other 1 1 5
¥ 1 ¥ 3 $ 5
Lease payments relating to finance leases accounted for as operating leases amounted to ¥2 million ($18 thousand) and ¥12 million, which equaled the corresponding depreciation on the respective leased assets computed by the straight line method over the lease terms for the years ended December 31, 2015 and 2014, respectively.
There was no recorded loss on impairment of leased assets for the years ended December 31, 2015 and 2014.
No reversals of allowance for impairment loss on leased properties were recorded for the year ended December 31, 2015.
Reversals of allowance for impairment loss on leased properties was ¥0.2 million for the years ended December 31, 2014.
The amount of depreciation equivalents was ¥2 million ($18 thousand) and ¥12 million for the years ended December 31, 2015 and 2014.
51SAPPORO HOLDINGS LIMITED Annual Report 2015
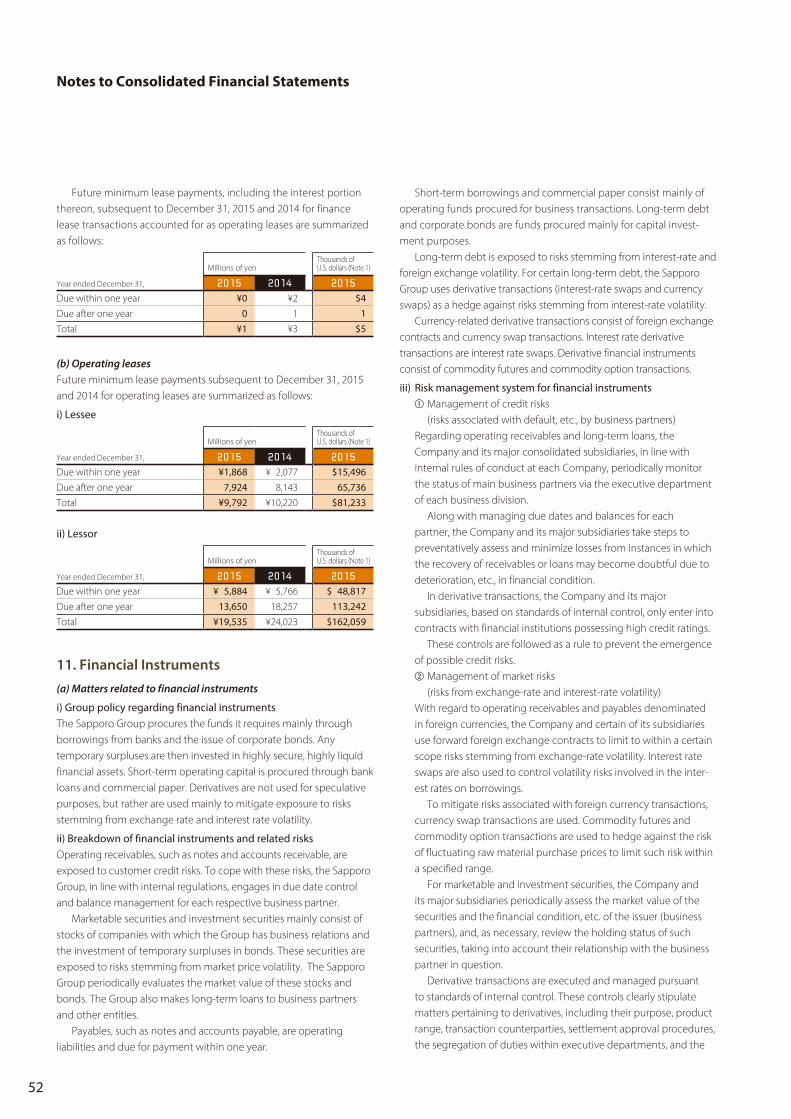
Future minimum lease payments, including the interest portion thereon, subsequent to December 31, 2015 and 2014 for finance lease transactions accounted for as operating leases are summarized as follows:
Millions of yenThousands of U.S. dollars (Note 1)
Year ended December 31, 2015 2014 2015
Due within one year ¥0 ¥2 $4Due after one year 0 1 1Total ¥1 ¥3 $5
(b) Operating leasesFuture minimum lease payments subsequent to December 31, 2015 and 2014 for operating leases are summarized as follows:
i) Lessee
Millions of yenThousands of U.S. dollars (Note 1)
Year ended December 31, 2015 2014 2015
Due within one year ¥1,868 ¥ 2,077 $15,496 Due after one year 7,924 8,143 65,736 Total ¥9,792 ¥10,220 $81,233
ii) Lessor
Millions of yenThousands of U.S. dollars (Note 1)
Year ended December 31, 2015 2014 2015
Due within one year ¥ 5,884 ¥ 5,766 $ 48,817 Due after one year 13,650 18,257 113,242 Total ¥19,535 ¥24,023 $162,059
11. Financial Instruments(a) Matters related to financial instruments
i) Group policy regarding financial instrumentsThe Sapporo Group procures the funds it requires mainly through borrowings from banks and the issue of corporate bonds. Any temporary surpluses are then invested in highly secure, highly liquid financial assets. Short-term operating capital is procured through bank loans and commercial paper. Derivatives are not used for speculative purposes, but rather are used mainly to mitigate exposure to risks stemming from exchange rate and interest rate volatility.
ii) Breakdown of financial instruments and related risksOperating receivables, such as notes and accounts receivable, are exposed to customer credit risks. To cope with these risks, the Sapporo Group, in line with internal regulations, engages in due date control and balance management for each respective business partner.
Marketable securities and investment securities mainly consist of stocks of companies with which the Group has business relations and the investment of temporary surpluses in bonds. These securities are exposed to risks stemming from market price volatility. The Sapporo Group periodically evaluates the market value of these stocks and bonds. The Group also makes long-term loans to business partners and other entities.
Payables, such as notes and accounts payable, are operating liabilities and due for payment within one year.
Short-term borrowings and commercial paper consist mainly of operating funds procured for business transactions. Long-term debt and corporate bonds are funds procured mainly for capital invest-ment purposes.
Long-term debt is exposed to risks stemming from interest-rate and foreign exchange volatility. For certain long-term debt, the Sapporo Group uses derivative transactions (interest-rate swaps and currency swaps) as a hedge against risks stemming from interest-rate volatility.
Currency-related derivative transactions consist of foreign exchange contracts and currency swap transactions. Interest rate derivative transactions are interest rate swaps. Derivative financial instruments consist of commodity futures and commodity option transactions.
iii) Risk management system for financial instruments① Management of credit risks (risks associated with default, etc., by business partners)Regarding operating receivables and long-term loans, the Company and its major consolidated subsidiaries, in line with internal rules of conduct at each Company, periodically monitor the status of main business partners via the executive department of each business division. Along with managing due dates and balances for each partner, the Company and its major subsidiaries take steps to preventatively assess and minimize losses from instances in which the recovery of receivables or loans may become doubtful due to deterioration, etc., in financial condition. In derivative transactions, the Company and its major subsidiaries, based on standards of internal control, only enter into contracts with financial institutions possessing high credit ratings. These controls are followed as a rule to prevent the emergence of possible credit risks.② Management of market risks (risks from exchange-rate and interest-rate volatility)With regard to operating receivables and payables denominated in foreign currencies, the Company and certain of its subsidiaries use forward foreign exchange contracts to limit to within a certain scope risks stemming from exchange-rate volatility. Interest rate swaps are also used to control volatility risks involved in the inter-est rates on borrowings. To mitigate risks associated with foreign currency transactions, currency swap transactions are used. Commodity futures and commodity option transactions are used to hedge against the risk of fluctuating raw material purchase prices to limit such risk within a specified range. For marketable and investment securities, the Company and its major subsidiaries periodically assess the market value of the securities and the financial condition, etc. of the issuer (business partners), and, as necessary, review the holding status of such securities, taking into account their relationship with the business partner in question. Derivative transactions are executed and managed pursuant to standards of internal control. These controls clearly stipulate matters pertaining to derivatives, including their purpose, product range, transaction counterparties, settlement approval procedures, the segregation of duties within executive departments, and the
52
Notes to Consolidated Financial Statements

system for reporting such transactions. The balance and status of income (loss) for derivative transactions is reported periodically to the Board of Directors.③ Management of liquidity risk associated with fund procurement (risk of failing to meet payment due dates)To minimize financial liabilities, the Sapporo Group has a cash management system (CMS) to centrally manage fund allocation to the Company and its major subsidiaries. Financial divisions within the Group formulate plans for fund procurement and fund management in an effort to manage liquidity risk.
iv) Supplementary explanation of matters concerning fair value, etc., of financial instruments
Market value of financial instruments contains fair values that are rationally calculated in cases for which no market price is available. Because variable factors are incorporated into the calculation of this value, the adoption of different terms and assumptions can cause fair value to vary.
Furthermore, notional amounts contracted in derivative transac-tions, as described in the notes pertaining to derivative transactions, are not a full expression of the market risk associated with derivative transactions.
(b) Matters concerning fair value, etc., of financial instrumentsAmounts, market value and their variances reported in the consolidated balance sheets for the fiscal years ended December 31, 2015 and 2014 are as follows:
Items for which the assessment of market value is not feasible were omitted.
Millions of yen Thousands of U.S. dollars (Note 1)
2015 2014 2015Carrying
valueFair
valueUnrealized gain (loss)
Carrying value
Fair value
Unrealized gain (loss)
Carrying value
Fair value
Unrealized gain (loss)
(1) Cash and cash equivalents ¥ 10,431 ¥ 10,431 ¥ — ¥ 9,781 ¥ 9,781 ¥ — $ 86,532 $ 86,532 $ —(2) Notes and accounts receivable—trade 92,335 89,246 766,014 Allowance for doubtful receivables (62) (150) (511) Sub total 92,274 92,274 — 89,096 89,096 — 765,503 765,503 —(3) Marketable securities and investment securities ① Held-to-maturity debt securities 200 202 2 — ② Other securities 54,654 54,654 — 49,849 49,849 — 453,406 453,406 —(4) Long-term loans receivable 9,367 9,653 77,706 — Allowance for doubtful receivables (6) (61) (50) Sub total 9,361 9,361 0 9,592 9,594 2 77,656 77,658 1Total assets ¥166,719 ¥166,719 ¥ 0 ¥158,519 ¥158,522 ¥ 4 $1,383,098 $1,383,099 $ 1(1) Notes and accounts payable—trade ¥ 36,772 ¥ 36,772 ¥ — ¥ 35,534 ¥ 35,534 ¥ — $ 305,061 $ 305,061 $ —(2) Short-term bank loans 19,220 19,220 — 22,424 22,424 — 159,445 159,445 —(3) Commercial paper 17,000 17,000 — 30,000 30,000 — 141,032 141,032 —(4) Liquor taxes payable 33,904 33,904 — 33,603 33,603 — 281,267 281,267 —(5) Income taxes payable 6,115 6,115 — 725 725 — 50,726 50,726 —(6) Bonds 60,000 60,431 431 62,000 62,623 623 497,760 501,336 3,576(7) Long-term bank debt 138,522 139,634 1,112 133,133 135,013 1,880 1,149,179 1,158,406 9,227Total liabilities ¥311,532 ¥313,075 ¥1,543 ¥317,418 ¥319,922 ¥2,503 $2,584,471 $2,597,273 $12,802Derivative transactions to which ① Hedge accounting is not applied ¥ 526 ¥ 526 ¥ — ¥ 3 ¥ 3 ¥ — $ 4,363 $ 4,363 $ — ② Hedge accounting is applied (12) (12) — 7 7 — (103) (103) —Total Derivative transactions ¥ 514 ¥ 514 ¥ — ¥ 10 ¥ 10 ¥ — $ 4,261 $ 42,161 $ —
i) Methods for determining market value of financial instruments and matters concerning marketable securities and derivative transactions
<Assets>(1) Cash and cash equivalents, (2) Notes and accounts receivableBook value is used since the variance between market value and book value is small due to the settlement of these accounts in the near future.(3) Marketable and investment securitiesIn determining market value, the stock market price is used for stocks.
In the absence of a market price quotation, fair value on public and corporate bonds is determined as follows. Such bonds are first sorted in sets according to maturity and credit rating. Yield on a government bond with a similar maturity or another appropriate indicator is then applied as a benchmark, and a spread taking into account credit rating and maturity of a set of bonds is added on top of the benchmark rate. This rate approximating the future cash flow of that set of bonds is then applied as the discount rate in calculating the set’s present value. For matters pertaining to respective marketable securities to be held-to-maturity, refer to “12. Marketable Securities and Investment Securities” in the Notes to Consolidated Financial Statements.
53SAPPORO HOLDINGS LIMITED Annual Report 2015

(4) Long-term loans receivableWithin the Sapporo Group, the fair value of long-term loans receiv-able is calculated as follows. Loans are first sorted in sets according to maturity and credit risk. Yield on a government bond with a similar maturity or another appropriate indicator is then applied as a benchmark, and a spread taking into account the credit risk and maturity of a set of loans is added on top of the benchmark rate. This rate approximating future cash flow of that set of loans is then applied as the discount rate in calculating the set’s present value. The fair value of potentially doubtful receivables is calculated either at present value using the same discount rate formula, or based on the projected amount of collateral or guarantees deemed recoverable.<Liabilities>(1) Accounts payable, (2) Short-term bank loans, (3) Commercial paper, (4) Liquor taxes payable, and (5) Income taxes payableBook value is used since the variance between market value and book value is small due to the short-term settlement of these accounts.(6) Corporate bondsThe market value of bonds issued by the Company is calculated based on the market price for bonds that have market prices.(7) Long-term debtFor long-term debt, the method for determining fair value is to discount the sum total of the outstanding principal and interest by the estimated interest-rate cost of refinancing it.
Long-term bank loans based on variable interest rates are subject to special procedures for interest rate swaps and allocation proce-dures for currency swaps. This is calculated by discounting the sum total amount of principal and interest, with said interest rate swaps and currency swaps treated as one, at a reasonably estimated interest rate that applies when refinancing.
ii) Financial instruments for which the assessment of market value is not feasible
Millions of yenThousands of U.S. dollars (Note 1)
2015 2014 2015Carrying
valueCarrying
valueCarrying
value
Unlisted stocks, etc. ¥ 7,195 ¥10,020 $ 59,686 Dealers’ deposits for guarantees 32,833 32,337 272,384
iii) Estimate of monetary claims and maturing marketable securities due for redemption after the consolidated account settlement
Millions of yen
2015
Inside one year
After one year
and inside five years
After five years and inside ten years
After ten years
Cash and cash equivalents ¥ 7,814 ¥ — ¥ — ¥ —
Notes and accounts receivable—trade 92,335 — — —
Long-term loans receivable 350 893 65 8,058
Total ¥100,499 ¥893 ¥65 ¥8,058
Thousands of U.S. dollars (Note 1)
2015
Inside one year
After one year
and inside five years
After five years and inside ten years
After ten years
Cash and cash equivalents $ 64,822 $ — $ — $ —
Notes and accounts receivable—trade 766,014 — — —
Long-term loans receivable 2,906 7,412 539 66,849
Total $833,742 $7,412 $539 $66,849
Millions of yen
2014
Inside one year
After one year
and inside five years
After five years and inside ten years
After ten years
Cash and cash equivalents ¥ 6,386 ¥ — ¥— ¥ —
Notes and accounts receivable—trade 89,246 — — —
Marketable securities and investment securities
Held-to-maturity debt securities 100 100 — —
Long-term loans receivable 502 1,043 — 8,108
Total ¥96,234 ¥1,143 ¥— ¥8,108
12. Marketable Securities and Investment Securities
(a) Trading securitiesNo relevant items as of December 31, 2015 and 2014.
(b) Held-to-maturity debt securitiesNo relevant items as of December 31, 2015.
The aggregate carrying value, fair value, gross unrealized gain and loss on held-to-maturity debt securities whose fair value was determinable at December 31, 2014 are summarized as follows:
Millions of yen
2014Carrying
valueFair
valueUnrealized gain (loss)
Securities whose fair value exceeds their carrying value:
Government and municipal bonds ¥ — ¥ — ¥—Corporate bonds 200 202 2Other — — —
Subtotal ¥200 ¥202 ¥ 2
54
Notes to Consolidated Financial Statements
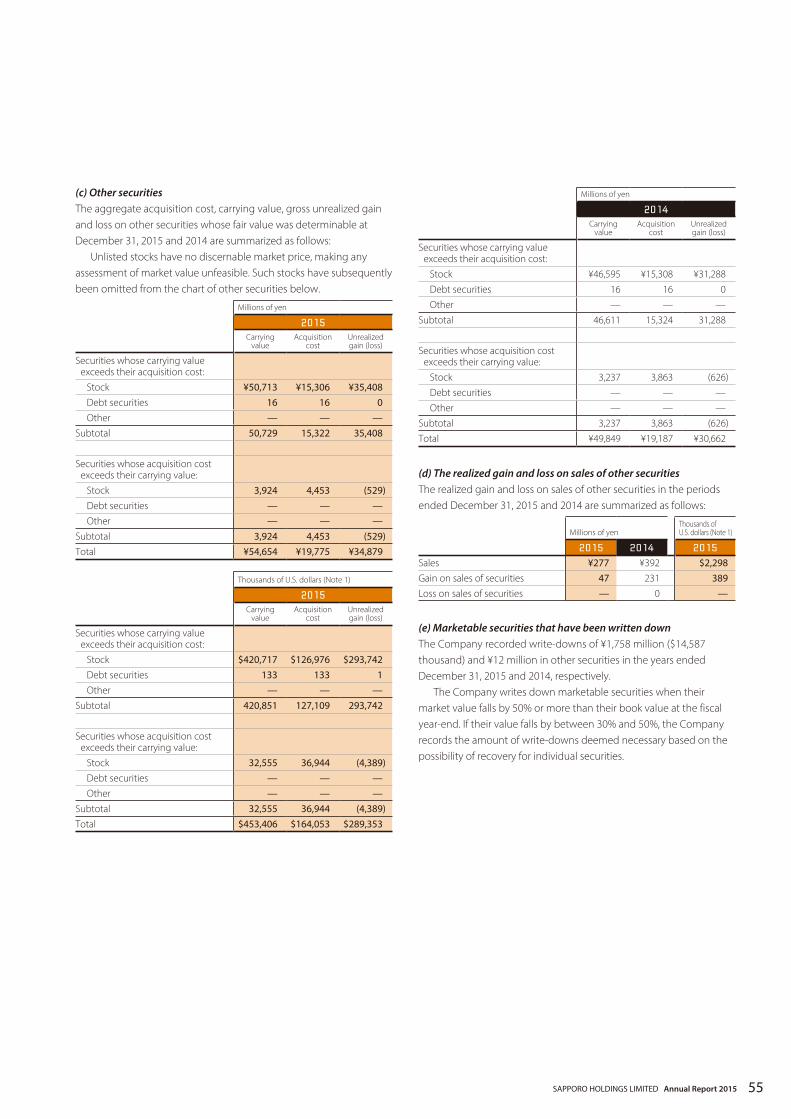
(c) Other securitiesThe aggregate acquisition cost, carrying value, gross unrealized gain and loss on other securities whose fair value was determinable at December 31, 2015 and 2014 are summarized as follows:
Unlisted stocks have no discernable market price, making any assessment of market value unfeasible. Such stocks have subsequently been omitted from the chart of other securities below.
Millions of yen
2015Carrying
valueAcquisition
costUnrealized gain (loss)
Securities whose carrying value exceeds their acquisition cost:
Stock ¥50,713 ¥15,306 ¥35,408Debt securities 16 16 0Other — — —
Subtotal 50,729 15,322 35,408
Securities whose acquisition cost exceeds their carrying value:
Stock 3,924 4,453 (529)Debt securities — — —Other — — —
Subtotal 3,924 4,453 (529)Total ¥54,654 ¥19,775 ¥34,879
Thousands of U.S. dollars (Note 1)
2015Carrying
valueAcquisition
costUnrealized gain (loss)
Securities whose carrying value exceeds their acquisition cost:
Stock $420,717 $126,976 $293,742Debt securities 133 133 1Other — — —
Subtotal 420,851 127,109 293,742
Securities whose acquisition cost exceeds their carrying value:
Stock 32,555 36,944 (4,389)Debt securities — — —Other — — —
Subtotal 32,555 36,944 (4,389)Total $453,406 $164,053 $289,353
Millions of yen
2014Carrying
valueAcquisition
costUnrealized gain (loss)
Securities whose carrying value exceeds their acquisition cost:
Stock ¥46,595 ¥15,308 ¥31,288Debt securities 16 16 0Other — — —
Subtotal 46,611 15,324 31,288
Securities whose acquisition cost exceeds their carrying value:
Stock 3,237 3,863 (626)Debt securities — — —Other — — —
Subtotal 3,237 3,863 (626)Total ¥49,849 ¥19,187 ¥30,662
(d) The realized gain and loss on sales of other securitiesThe realized gain and loss on sales of other securities in the periods ended December 31, 2015 and 2014 are summarized as follows:
Millions of yenThousands of U.S. dollars (Note 1)
2015 2014 2015
Sales ¥277 ¥392 $2,298Gain on sales of securities 47 231 389Loss on sales of securities — 0 —
(e) Marketable securities that have been written downThe Company recorded write-downs of ¥1,758 million ($14,587 thousand) and ¥12 million in other securities in the years ended December 31, 2015 and 2014, respectively.
The Company writes down marketable securities when their market value falls by 50% or more than their book value at the fiscal year-end. If their value falls by between 30% and 50%, the Company records the amount of write-downs deemed necessary based on the possibility of recovery for individual securities.
55SAPPORO HOLDINGS LIMITED Annual Report 2015

13. Derivatives(a) Derivative transactions to which hedge accounting is applied
i) Currency-related
December 31, 2015 Millions of yen Thousands of U.S. dollars (Note 1)
Hedge accounting method Hedging instrument
Main hedged item
Contract amount
Contract amount
payable after one year
Fair value
Contract amount
Contract amount
payable after one year
Fair value
Designation applied to forward exchange contracts
Forward foreign exchange contractPurchase denomination; US$ Accounts payable ¥ 131 ¥ — ¥ (2) $ 1,083 $ — $ (16)Purchase denomination; Euro Accounts payable 600 — (10) 4,979 (87)
Currency swap allocation procedures
Received in USD, paid in JPY Long-term debt11,804 11,804 * 97,928 97,928 *
Total ¥12,535 ¥11,804 ¥(12) $103,989 $97,928 $(103)
December 31, 2014 Millions of yen
Hedge accounting method Hedging instrument
Main hedged item
Contract amount
Contract amount
payable after one year
Fair value
Designation applied to forward exchange contracts
Forward foreign exchange contractPurchase denomination; Euro Accounts payable ¥ 76 ¥ — ¥ (1)Sell denomination; US$ Accounts receivable 323 — (6)
Principle method Forward foreign exchange contractSell denomination; CAN$ Accounts receivable 473 — 14
Currency swap allocation procedures
Received in USD, paid in JPY Long-term debt10,000 10,000 *
Total ¥10,872 ¥10,000 ¥ 7
Note: Because those based on currency swap allocation procedures are treated together with long-term loans, which are regarded as hedged items, their market value is shown inclusive of the market value of long-term loans.
ii) Interest rate-related
December 31, 2015 Millions of yen Thousands of U.S. dollars (Note 1)
Hedge accounting method Hedging instrument
Main hedged item
Contract amount
Contract amount
payable after one year
Fair value
Contract amount
Contract amount
payable after one year
Fair value
Special treatment for interest rate swaps
Interest rate swaps Receive variable rate, pay fixed rate Long-term debt ¥54,996 ¥49,573 * $456,244 $411,257 *
December 31, 2014 Millions of yen
Hedge accounting method Hedging instrument
Main hedged item
Contract amount
Contract amount
payable after one year
Fair value
Special treatment for interest rate swaps
Interest rate swapsReceive variable rate, pay fixed rate Long-term debt ¥43,576 ¥39,514 *
Note: Interest rate swaps backing long-term debts as hedges are subject to special treatment. Their fair value is recorded in conjunction with the long-term debts they back.
56
Notes to Consolidated Financial Statements
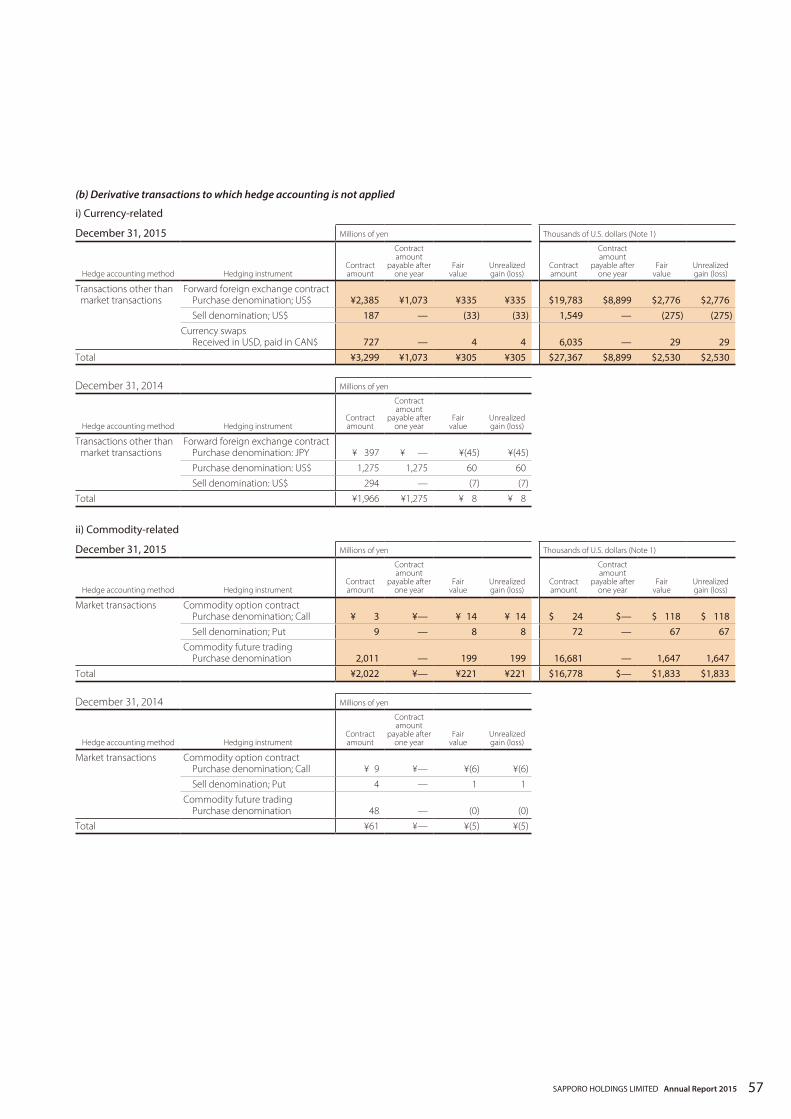
(b) Derivative transactions to which hedge accounting is not applied
i) Currency-related
December 31, 2015 Millions of yen Thousands of U.S. dollars (Note 1)
Hedge accounting method Hedging instrument Contract amount
Contract amount
payable after one year
Fair value
Unrealized gain (loss)
Contract amount
Contract amount
payable after one year
Fair value
Unrealized gain (loss)
Transactions other than market transactions
Forward foreign exchange contractPurchase denomination; US$ ¥2,385 ¥1,073 ¥335 ¥335 $19,783 $8,899 $2,776 $2,776Sell denomination; US$ 187 — (33) (33) 1,549 — (275) (275)
Currency swapsReceived in USD, paid in CAN$ 727 — 4 4 6,035 — 29 29
Total ¥3,299 ¥1,073 ¥305 ¥305 $27,367 $8,899 $2,530 $2,530
December 31, 2014 Millions of yen
Hedge accounting method Hedging instrument Contract amount
Contract amount
payable after one year
Fair value
Unrealized gain (loss)
Transactions other than market transactions
Forward foreign exchange contract Purchase denomination: JPY ¥ 397 ¥ — ¥(45) ¥(45)Purchase denomination: US$ 1,275 1,275 60 60Sell denomination: US$ 294 — (7) (7)
Total ¥1,966 ¥1,275 ¥ 8 ¥ 8
ii) Commodity-related
December 31, 2015 Millions of yen Thousands of U.S. dollars (Note 1)
Hedge accounting method Hedging instrument Contract amount
Contract amount
payable after one year
Fair value
Unrealized gain (loss)
Contract amount
Contract amount
payable after one year
Fair value
Unrealized gain (loss)
Market transactions Commodity option contractPurchase denomination; Call ¥ 3 ¥— ¥ 14 ¥ 14 $ 24 $— $ 118 $ 118Sell denomination; Put 9 — 8 8 72 — 67 67
Commodity future tradingPurchase denomination 2,011 — 199 199 16,681 — 1,647 1,647
Total ¥2,022 ¥— ¥221 ¥221 $16,778 $— $1,833 $1,833
December 31, 2014 Millions of yen
Hedge accounting method Hedging instrument Contract amount
Contract amount
payable after one year
Fair value
Unrealized gain (loss)
Market transactions Commodity option contractPurchase denomination; Call ¥ 9 ¥— ¥(6) ¥(6)Sell denomination; Put 4 — 1 1
Commodity future tradingPurchase denomination 48 — (0) (0)
Total ¥61 ¥— ¥(5) ¥(5)
57SAPPORO HOLDINGS LIMITED Annual Report 2015

14. Short-Term Bank Loans, Commercial Paper, Bonds and Long-Term Debts
Short-term bank loans represent notes or overdrafts. The annual average interest rates applicable to short-term bank loans for the years ended December 31, 2015 and 2014 were 0.79% and 0.64%, respectively.
The Company has entered into a yen domestic commercial paper program with a current maximum facility amount of ¥50,000 million ($414,800 thousand). There were outstanding balances of ¥17,000 million ($141,032 thousand), ¥30,000 million at December 31, 2015 and 2014, respectively.
Bonds at December 31, 2015 and 2014 are summarized as follows:
Millions of yenThousands of U.S. dollars (Note 1)
2015 2014 2015
0.96% bonds due 2015 ¥ — ¥12,000 $ —0.62% bonds due 2016 10,000 10,000 82,9600.64% bonds due 2017 10,000 10,000 82,9600.39% bonds due 2018 10,000 10,000 82,9600.31% bonds due 2019 10,000 10,000 82,9600.61% bonds due 2020 10,000 10,000 82,9600.33% bonds due 2020 10,000 — 82,960Total 60,000 62,000 497,760Less current portion 10,000 12,000 82,960Bonds, net of current portion ¥50,000 ¥50,000 $414,800
The aggregate annual maturities of bonds subsequent to December 31, 2015 are summarized as follows:
Millions of yenThousands of U.S. dollars (Note 1)
2016 ¥10,000 $ 82,9602017 10,000 82,9602018 10,000 82,9602019 10,000 82,9602020 20,000 165,920
¥60,000 $497,760
Long-term debt at December 31, 2015 and 2014 is summarized as follows:
Millions of yenThousands of U.S. dollars (Note 1)
2015 2014 2015
Loans from banks and insurance companies maturing from 2014 to 2024 with weighted–average annual interest rates:
2015—0.79%2014—0.69%Secured ¥ 16,470 ¥ 17,900 $ 136,635Unsecured 122,052 115,233 1,012,544
138,522 133,133 1,149,179Less current portion 46,603 9,023 386,618
¥ 91,919 ¥124,110 $ 762,562
The aggregate annual maturities of long-term debt subsequent to December 31, 2015 are summarized as follows:
Millions of yenThousands of U.S. dollars (Note 1)
2016 ¥ 46,603 $ 386,6182017 13,214 109,6272018 19,373 160,7172019 17,285 143,3962020 19,380 160,7742021 and thereafter 22,667 188,048
¥138,522 $1,149,179
The assets pledged as collateral for short-term bank loans and long-term debt at December 31, 2015 and 2014 are summarized as follows:
(a) Assets pledged as collateral
Millions of yenThousands of U.S. dollars (Note 1)
2015 2014 2015
Investment securities ¥8,886 ¥7,648 $73,717Buildings and structure 74 91 613Lands 613 613 5,083Other Investment. 25 25 207
¥9,597 ¥8,377 $79,621
(b) Debt relating to the above pledged assets
Millions of yenThousands of U.S. dollars (Note 1)
2015 2014 2015
Short-term bank loans ¥ 2,500 ¥ 3,000 $ 20,740Long-term bank debt 16,470 17,900 136,635
¥18,970 ¥20,900 $157,375
In addition, cash and cash equivalents of ¥28 million ($233 thousand) of POKKA INTERNATIONAL PTE. LTD. are pledged as collateral for a credit limit of ¥922 million ($7,647 thousand).
Short-term bank loans of ¥16 million ($133 thousand) have been borrowed against said credit limit.
15. Retirement Benefit PlansThe Company and its domestic consolidated subsidiaries have defined benefit plans, i.e., welfare pension fund plans, tax-qualified pension plans and lump-sum payment plans covering substantially all employees. Certain consolidated subsidiaries have joined the Smaller Enterprise Retirement Allowance Mutual Aid System. In addition, certain consolidated subsidiaries have set up a retirement benefits trust. Additional benefits may be granted to employees according to the conditions under which termination occurs.
Conditions for the years ended December 31, 2015 and 2014 are as follows.
58
Notes to Consolidated Financial Statements
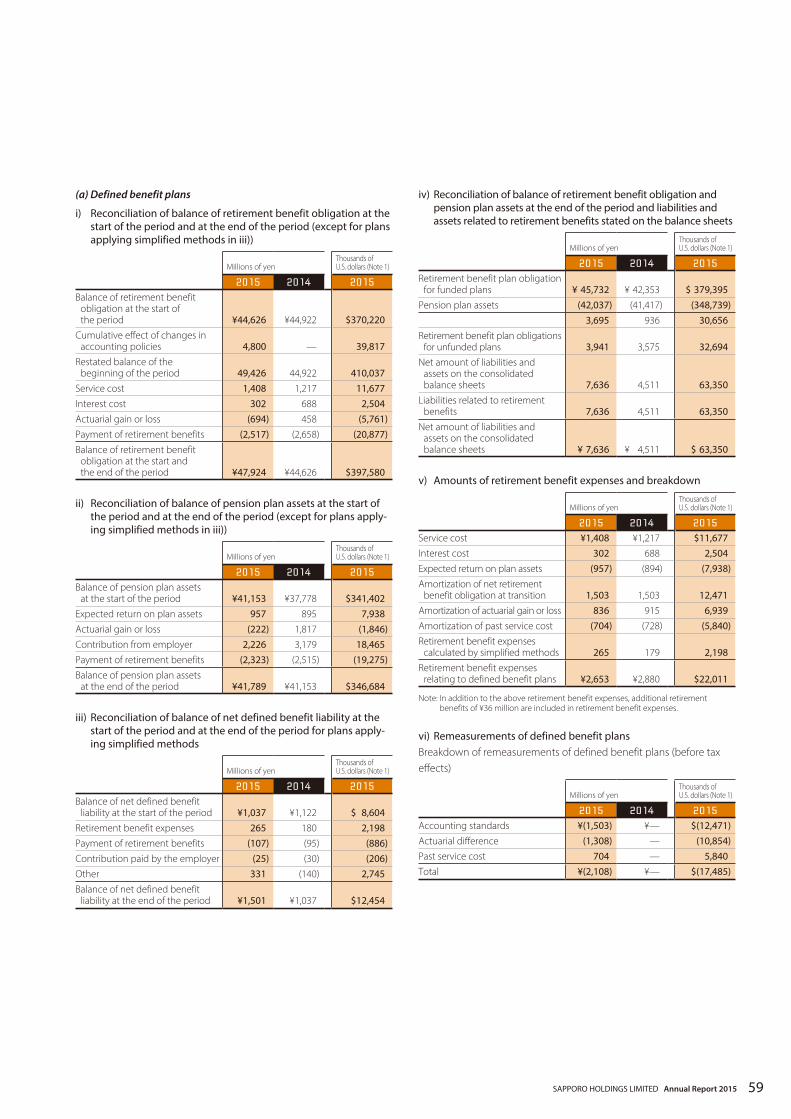
(a) Defined benefit plans
i) Reconciliation of balance of retirement benefit obligation at the start of the period and at the end of the period (except for plans applying simplified methods in iii))
Millions of yenThousands of U.S. dollars (Note 1)
2015 2014 2015
Balance of retirement benefit obligation at the start of the period ¥44,626 ¥44,922 $370,220
Cumulative effect of changes in accounting policies 4,800 — 39,817
Restated balance of the beginning of the period 49,426 44,922 410,037
Service cost 1,408 1,217 11,677Interest cost 302 688 2,504Actuarial gain or loss (694) 458 (5,761)Payment of retirement benefits (2,517) (2,658) (20,877)Balance of retirement benefit
obligation at the start and the end of the period ¥47,924 ¥44,626 $397,580
ii) Reconciliation of balance of pension plan assets at the start of the period and at the end of the period (except for plans apply-ing simplified methods in iii))
Millions of yenThousands of U.S. dollars (Note 1)
2015 2014 2015
Balance of pension plan assets at the start of the period ¥41,153 ¥37,778 $341,402
Expected return on plan assets 957 895 7,938Actuarial gain or loss (222) 1,817 (1,846)Contribution from employer 2,226 3,179 18,465Payment of retirement benefits (2,323) (2,515) (19,275)Balance of pension plan assets
at the end of the period ¥41,789 ¥41,153 $346,684
iii) Reconciliation of balance of net defined benefit liability at the start of the period and at the end of the period for plans apply-ing simplified methods
Millions of yenThousands of U.S. dollars (Note 1)
2015 2014 2015
Balance of net defined benefit liability at the start of the period ¥1,037 ¥1,122 $ 8,604
Retirement benefit expenses 265 180 2,198Payment of retirement benefits (107) (95) (886)Contribution paid by the employer (25) (30) (206)Other 331 (140) 2,745Balance of net defined benefit
liability at the end of the period ¥1,501 ¥1,037 $12,454
iv) Reconciliation of balance of retirement benefit obligation and pension plan assets at the end of the period and liabilities and assets related to retirement benefits stated on the balance sheets
Millions of yenThousands of U.S. dollars (Note 1)
2015 2014 2015
Retirement benefit plan obligation for funded plans ¥ 45,732 ¥ 42,353 $ 379,395
Pension plan assets (42,037) (41,417) (348,739)3,695 936 30,656
Retirement benefit plan obligations for unfunded plans 3,941 3,575 32,694
Net amount of liabilities and assets on the consolidated balance sheets 7,636 4,511 63,350
Liabilities related to retirement benefits 7,636 4,511 63,350
Net amount of liabilities and assets on the consolidated balance sheets ¥ 7,636 ¥ 4,511 $ 63,350
v) Amounts of retirement benefit expenses and breakdown
Millions of yenThousands of U.S. dollars (Note 1)
2015 2014 2015
Service cost ¥1,408 ¥1,217 $11,677Interest cost 302 688 2,504Expected return on plan assets (957) (894) (7,938)Amortization of net retirement
benefit obligation at transition 1,503 1,503 12,471Amortization of actuarial gain or loss 836 915 6,939Amortization of past service cost (704) (728) (5,840)Retirement benefit expenses
calculated by simplified methods 265 179 2,198Retirement benefit expenses
relating to defined benefit plans ¥2,653 ¥2,880 $22,011
Note: In addition to the above retirement benefit expenses, additional retirement benefits of ¥36 million are included in retirement benefit expenses.
vi) Remeasurements of defined benefit plansBreakdown of remeasurements of defined benefit plans (before tax effects)
Millions of yenThousands of U.S. dollars (Note 1)
2015 2014 2015
Accounting standards ¥(1,503) ¥— $(12,471)Actuarial difference (1,308) — (10,854)Past service cost 704 — 5,840Total ¥(2,108) ¥— $(17,485)
59SAPPORO HOLDINGS LIMITED Annual Report 2015

vii) Accrued adjustment for retirement benefits Breakdown of accrued adjustment for retirement benefits (before tax effects)
Millions of yenThousands of U.S. dollars (Note 1)
2015 2014 2015
Unrecognized net retirement benefit obligation at transition ¥ — ¥ 1,503 $ —
Unrecognized actuarial gain or loss 335 1,643 2,780Unrecognized past service cost (3,137) (3,841) (26,023)Total ¥(2,802) ¥ (694) $(23,243)
viii) Items related to pension plan assets(1) Main breakdown of pension plan assets
2015 2014
Bonds 44% 46%Stocks 22 22Cash and deposits 2 2Life insurance general account 23 21Other 9 9Total 100% 100%
(2) Method of determining long-term rate of returnTo determine the expected long-term rate of return on pension plan assets, the Company considers the current and expected distribution of pension plan assets, and the current and expected long-term rates of return on the various assets comprising the pension plan assets.
ix) Matters related to actuarial assumptions
2015 2014
Discount rate 0.5–0.7% 0.6–1.6%Expect rate of return 0.8–2.5 1.5–2.5Planned remuneration increase rate 0.8–5.7 0.8–5.7
(b) Defined contribution plansThe required contribution amount for the defined contribution plans of the Company and its subsidiaries at December 31, 2015 and 2014 were ¥463 million ($3,839 thousand), ¥492 million, respectively.
16. Income TaxesIncome taxes applicable to the Company and its domestic consoli-dated subsidiaries comprise corporation tax, inhabitants’ taxes and enterprise tax which, in the aggregate, resulted in a statutory tax rate of 35.6% in 2015 and 38.0% in 2014. The differences from the cor-responding effective tax rates are due primarily to (1) the accounting policy of not providing for deferred income taxes arising from timing differences between financial and tax reporting for unschedulable temporary differences, and (2) certain expenses which are not deduct-ible for income tax purposes.
The effective tax rates reflected in the consolidated statements of income for the year ended December 31, 2015 and 2014 differ from the corresponding statutory tax rates for the following reasons:
2015 2014
Statutory tax rates 35.6% 38.0%Effect of:
Disallowed expenses, including entertainment expenses 3.4 15.7
Dividends and other income deductible for income tax purposes (1.9) (14.0)
Inhabitants’ per capita taxes 2.5 10.5Changes in valuation allowance (7.6) 19.1The tax rate difference of overseas subsidiary
company 0.7 (23.0)Amortization of goodwill 11.2 45.5Loss on impairment of goodwill 6.3 —Other, net (2.6) 4.8
Effective tax rates 47.7% 96.5%
The significant components of deferred tax assets and liabilities at December 31, 2015 and 2014 were as follows:
Millions of yenThousands of U.S. dollars (Note 1)
2015 2014 2015
Deferred tax assets:Property, plant and equipment ¥ 3,359 ¥ 5,012 $ 27,866Tax loss carryforwards 2,507 3,628 20,794Net defined benefit liability 2,496 1,855 20,706Accrued expenses 2,366 2,559 19,632Investment securities 2,317 3,151 19,218Gift coupon income 1,713 2,212 14,210Accrued bonuses 588 756 4,882Asset retirement obligations 386 507 3,201Allowance for doubtful receivables 404 203 3,351Other 2,192 1,757 18,188Gross deferred tax assets 18,328 21,640 152,048Valuation allowance (6,670) (9,063) (55,337)Total deferred tax assets 11,658 12,577 96,711
Deferred tax liabilities:Unrealized holding gain on
securities 11,199 10,851 92,909Property, plant and equipment 7,949 6,245 65,947Reserve for advanced depreciation
deduction, etc. 6,633 10,545 55,025Gain on valuation of assets
received through merger 470 524 3,896Other 1,207 940 10,014Total deferred tax liabilities 27,458 29,105 227,790Net deferred tax liabilities ¥15,800 ¥16,528 $131,079
60
Notes to Consolidated Financial Statements
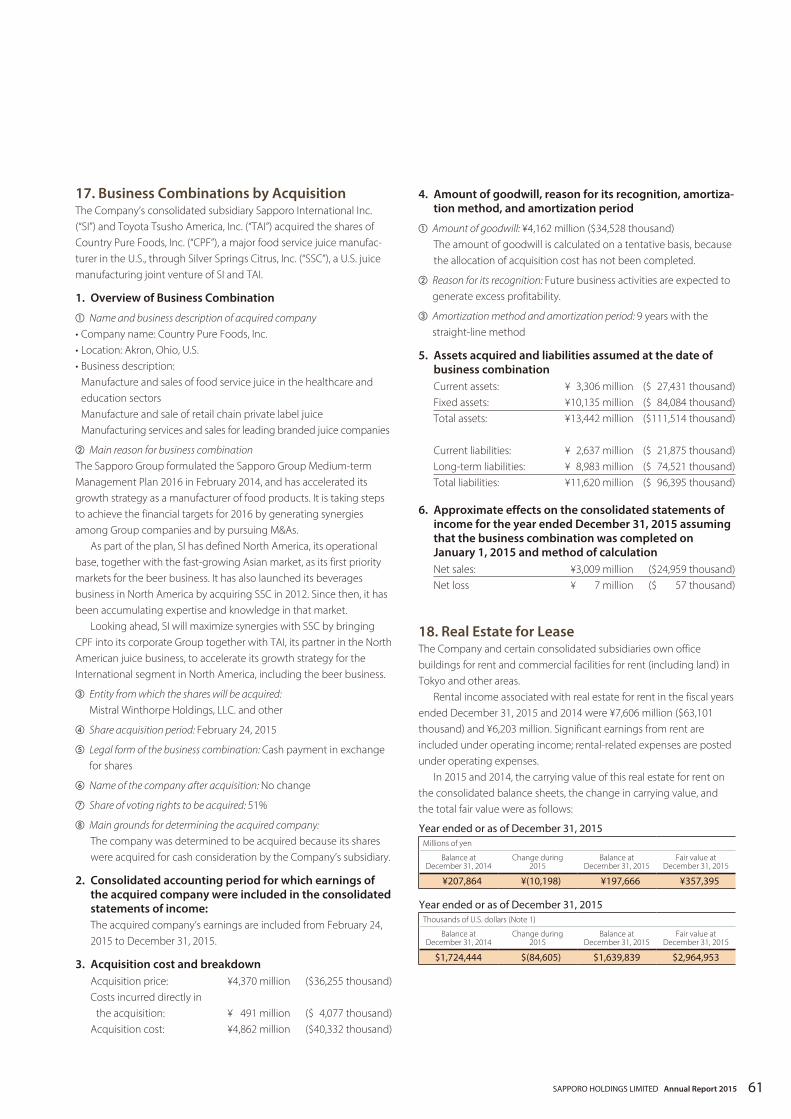
17. Business Combinations by AcquisitionThe Company’s consolidated subsidiary Sapporo International Inc. (“SI”) and Toyota Tsusho America, Inc. (“TAI”) acquired the shares of Country Pure Foods, Inc. (“CPF”), a major food service juice manufac-turer in the U.S., through Silver Springs Citrus, Inc. (“SSC”), a U.S. juice manufacturing joint venture of SI and TAI.
1. Overview of Business Combination① Name and business description of acquired company• Company name: Country Pure Foods, Inc.• Location: Akron, Ohio, U.S.• Business description: Manufacture and sales of food service juice in the healthcare and
education sectors Manufacture and sale of retail chain private label juice Manufacturing services and sales for leading branded juice companies
② Main reason for business combinationThe Sapporo Group formulated the Sapporo Group Medium-term Management Plan 2016 in February 2014, and has accelerated its growth strategy as a manufacturer of food products. It is taking steps to achieve the financial targets for 2016 by generating synergies among Group companies and by pursuing M&As.
As part of the plan, SI has defined North America, its operational base, together with the fast-growing Asian market, as its first priority markets for the beer business. It has also launched its beverages business in North America by acquiring SSC in 2012. Since then, it has been accumulating expertise and knowledge in that market.
Looking ahead, SI will maximize synergies with SSC by bringing CPF into its corporate Group together with TAI, its partner in the North American juice business, to accelerate its growth strategy for the International segment in North America, including the beer business.
③ Entity from which the shares will be acquired: Mistral Winthorpe Holdings, LLC. and other
④ Share acquisition period: February 24, 2015
⑤ Legal form of the business combination: Cash payment in exchange for shares
⑥ Name of the company after acquisition: No change
⑦ Share of voting rights to be acquired: 51%
⑧ Main grounds for determining the acquired company: The company was determined to be acquired because its shares were acquired for cash consideration by the Company’s subsidiary.
2. Consolidated accounting period for which earnings of the acquired company were included in the consolidated statements of income:The acquired company’s earnings are included from February 24, 2015 to December 31, 2015.
3. Acquisition cost and breakdownAcquisition price: ¥4,370 million ($36,255 thousand)Costs incurred directly in the acquisition: ¥ 491 million ($ 4,077 thousand)Acquisition cost: ¥4,862 million ($40,332 thousand)
4. Amount of goodwill, reason for its recognition, amortiza-tion method, and amortization period
① Amount of goodwill: ¥4,162 million ($34,528 thousand)The amount of goodwill is calculated on a tentative basis, because the allocation of acquisition cost has not been completed.
② Reason for its recognition: Future business activities are expected to generate excess profitability.
③ Amortization method and amortization period: 9 years with the straight-line method
5. Assets acquired and liabilities assumed at the date of business combinationCurrent assets: ¥ 3,306 million ($ 27,431 thousand)Fixed assets: ¥10,135 million ($ 84,084 thousand)Total assets: ¥13,442 million ($111,514 thousand)
Current liabilities: ¥ 2,637 million ($ 21,875 thousand)Long-term liabilities: ¥ 8,983 million ($ 74,521 thousand)Total liabilities: ¥11,620 million ($ 96,395 thousand)
6. Approximate effects on the consolidated statements of income for the year ended December 31, 2015 assuming that the business combination was completed on January 1, 2015 and method of calculationNet sales: ¥3,009 million ($24,959 thousand)Net loss ¥ 7 million ($ 57 thousand)
18. Real Estate for LeaseThe Company and certain consolidated subsidiaries own office buildings for rent and commercial facilities for rent (including land) in Tokyo and other areas.
Rental income associated with real estate for rent in the fiscal years ended December 31, 2015 and 2014 were ¥7,606 million ($63,101 thousand) and ¥6,203 million. Significant earnings from rent are included under operating income; rental-related expenses are posted under operating expenses.
In 2015 and 2014, the carrying value of this real estate for rent on the consolidated balance sheets, the change in carrying value, and the total fair value were as follows:
Year ended or as of December 31, 2015Millions of yen
Balance at December 31, 2014
Change during 2015
Balance at December 31, 2015
Fair value at December 31, 2015
¥207,864 ¥(10,198) ¥197,666 ¥357,395
Year ended or as of December 31, 2015Thousands of U.S. dollars (Note 1)
Balance at December 31, 2014
Change during 2015
Balance at December 31, 2015
Fair value at December 31, 2015
$1,724,444 $(84,605) $1,639,839 $2,964,953
61SAPPORO HOLDINGS LIMITED Annual Report 2015

Year ended or as of December 31, 2014Millions of yen
Balance at December 31, 2013
Change during 2014
Balance at December 31, 2014
Fair value at December 31, 2014
¥210,079 ¥(2,214) ¥207,864 ¥348,237
Notes 1. Amounts posted in the consolidated balance sheets represent the acquisition cost after the deduction of cumulative depreciation.
2. In regard to the main components of changes in the year ended December 31, 2015, the main increase was the acquisition of real estate of ¥6,596 million ($54,719 thousand), while the main decreases were depreciation and amortiza-tion of ¥3,805 million ($31,565 thousand) and sales of ¥12,535 million ($103,994 thousand) and disposal losses of ¥329 million ($2,728 thousand).
In regard to the main components of changes in the year ended December 31, 2014, the main increase was the acquisition of real estate of ¥4,572 million, while the main decreases were depreciation and amortization of ¥3,721 million and sales of ¥2,336 million and disposal losses of ¥788 million.
3. Fair value at the end of the fiscal year under review is based primarily on real estate appraisals carried out by external appraisers.
19. Segment Information(a) Segment information by geographic area
i) Net salesYear ended December 31, 2015
Millions of yen
Japan North America Asia Others Total
¥439,198 ¥67,002 ¥20,969 ¥6,580 ¥533,749
Year ended December 31, 2015
Thousands of U.S. dollars (Note 1)
Japan North America Asia Others Total
$3,643,586 $555,846 $173,961 $54,588 $4,427,981
Year ended December 31, 2014
Millions of yen
Japan North America Asia Others Total
¥441,478 ¥46,752 ¥24,904 ¥5,606 ¥518,741
Year ended December 31, 2013
Millions of yen
Japan North America Asia Others Total
¥437,607 ¥45,843 ¥21,927 ¥4,457 ¥509,835
ii) Property, plant and equipmentThe balance of property, plant and equipment located in Japan amounted to more than 90% of the total balance of property, plant and equipment. Accordingly, geographical segment information has not been disclosed in 2015 and 2014.
(b) Information by major customerNet sales
Company name
Millions of yen
Thousands of U.S. dollars (Note 1)
Segment2015 2014 2013 2015
KOKUBU & CO., LTD.
¥79,177 ¥64,789 ¥63,859 $656,856
Japanese Alcoholic Beverages, Food & Soft Drinks
(c) Segment information
i) Overview of reportable segmentsThe Company’s reportable segments are components of the Sapporo Group about which separate financial information is available.
These segments are subject to periodic examinations to enable the Company’s Board of Directors to decide how to allocate resources and assess performance.
The Sapporo Group utilizes the assets of the Group and its traditional areas of strength in the two business domains, “creation of value in food” and “creation of comfortable surroundings.” Under Sapporo Holdings, a pure holding company, each group company formulates development plans and strategies for its products, services, and sales markets and conducts business accordingly.
The Group’s businesses are therefore segmented mainly based on the products, services, and sales markets of Group companies and their affiliated companies. The Company’s five reportable segments are Japanese Alcoholic Beverages, International, Food & Soft Drinks, Restaurants, and Real Estate.
The Japanese Alcoholic Beverages segment produces and sells alcoholic beverages in Japan, while the International segment produces and sells alcoholic beverages and soft drinks overseas.
The Food & Soft Drinks segment produces and sells foods and soft drinks.
The Restaurants segment operates various types of restaurants.The Real Estate segment’s activities include leasing and develop-
ment of real estate.
ii) Calculation methods for sales, income (or loss), assets and other items by reportable segment
Accounting methods applied in reportable segments by business largely correspond to those presented under “Summary of Significant Accounting Policies” and “Change in Method of Accounting.”
Reportable segment income is based on operating income. Intersegment sales or transfers are calculated as if the transactions were with third-parties based on market prices.
iii) Changes in Reportable Segment, etc.(Changes in Reportable Segment)Following the share transfer between the consolidated subsidiaries, the segment classification of New Sanko Inc., which formerly used to be classified in the “Japanese Alcoholic Beverages” segment, has now been changed to the “Restaurants” segment, effective from the fiscal year ended December 31, 2015.
The segment information for the fiscal year ended December 31, 2014 has been retroactively adjusted to reflect these changes.
(Application of Accounting Standard for Retirement Benefits, etc.)In accordance with the revision of the method for calculating retirement benefit obligations and service costs, as per the above Changes in Accounting Policy, effective from the fiscal year ended December 31, 2015, the calculation method for retirement benefit obligations and service costs in each business segment has been revised accordingly.
62
Notes to Consolidated Financial Statements

As a result, compared to the old calculation method, segment income for “Japanese Alcoholic Beverages” grew by ¥160 million ($1,329 thousand) in the year ended December 31, 2015. The effect
of the said revision on the segment income or loss in other segments than the “Japanese Alcoholic Beverages” is immaterial.
iii) Amounts of sales, income (loss), assets, and other items by reportable segmentYear ended or as of December 31, 2015
Millions of yen
Reportable segment
Japanese Alcoholic Beverages International
Food & Soft Drinks Restaurants Real Estate Total Other Total
General corporate and intercompany eliminations Consolidated
Net sales ¥273,652 ¥70,501 ¥135,671 ¥27,004 ¥ 20,872 ¥527,700 ¥ 6,049 ¥533,749 ¥ — ¥533,749Intra-group sales and transfers 2,794 103 297 5 2,549 5,748 19,834 25,582 (25,582) —Total 276,445 70,604 135,968 27,010 23,421 533,448 25,883 559,331 (25,582) 533,749Operating income (loss) 8,635 154 434 523 8,282 18,028 1 18,030 (4,079) 13,950Identifiable assets 220,009 67,069 100,464 12,272 206,650 606,463 6,789 613,252 7,136 620,388Depreciation and amortization 8,144 3,381 6,186 668 4,202 22,581 37 22,618 1,606 24,224Increase in property,
plant and equipment and intangible fixed assets 4,608 2,559 5,117 844 6,197 19,324 2 19,327 1,257 20,583
Year ended or as of December 31, 2015
Thousands of U.S. dollars (Note 1)
Reportable segment
Japanese Alcoholic Beverages International
Food & Soft Drinks Restaurants Real Estate Total Other Total
General corporate and intercompany eliminations Consolidated
Net sales $2,270,217 $584,878 $1,125,523 $224,028 $ 173,155 $4,377,801 $ 50,179 $4,427,981 $ — $4,427,981Intra-group sales and transfers 23,175 853 2,466 44 21,148 47,685 164,546 212,231 (212,231) —Total 2,293,392 585,731 1,127,989 224,072 194,303 4,425,486 214,725 4,640,212 (212,231) 4,427,981Operating income (loss) 71,639 1,279 3,604 4,335 68,705 149,562 11 149,574 (33,843) 115,730Identifiable assets 1,825,196 556,403 833,448 101,805 1,714,366 5,031,218 56,321 5,087,539 59,201 5,146,740Depreciation and amortization 67,564 28,048 51,316 5,542 34,863 187,333 305 187,638 13,325 200,963Increase in property,
plant and equipment and intangible fixed assets 38,225 21,227 42,454 7,002 51,407 160,316 17 160,333 10,424 170,757
Year ended or as of December 31, 2014
Millions of yen
Reportable segment
Japanese Alcoholic Beverages International
Food & Soft Drinks Restaurants Real Estate Total Other Total
General corporate and intercompany eliminations Consolidated
Net sales ¥281,032 ¥49,673 ¥133,439 ¥27,143 ¥ 21,510 ¥512,797 ¥ 5,944 ¥518,741 ¥ — ¥518,741Intra-group sales and transfers 2,563 95 315 4 2,754 5,731 19,478 25,209 (25,209) —Total 283,594 49,768 133,754 27,147 24,264 518,527 25,422 543,949 (21,267) 518,741Operating income (loss) 10,193 173 121 303 7,696 18,486 184 18,670 (3,941) 14,729Identifiable assets 220,311 57,602 102,762 12,399 214,390 607,463 7,135 614,599 10,841 625,439Depreciation and amortization 8,010 2,104 6,785 672 4,231 21,803 75 21,878 2,603 24,481Increase in property,
plant and equipment and intangible fixed assets 3,702 1,949 7,401 1,282 7,189 21,523 31 21,554 1,249 22,803
63SAPPORO HOLDINGS LIMITED Annual Report 2015
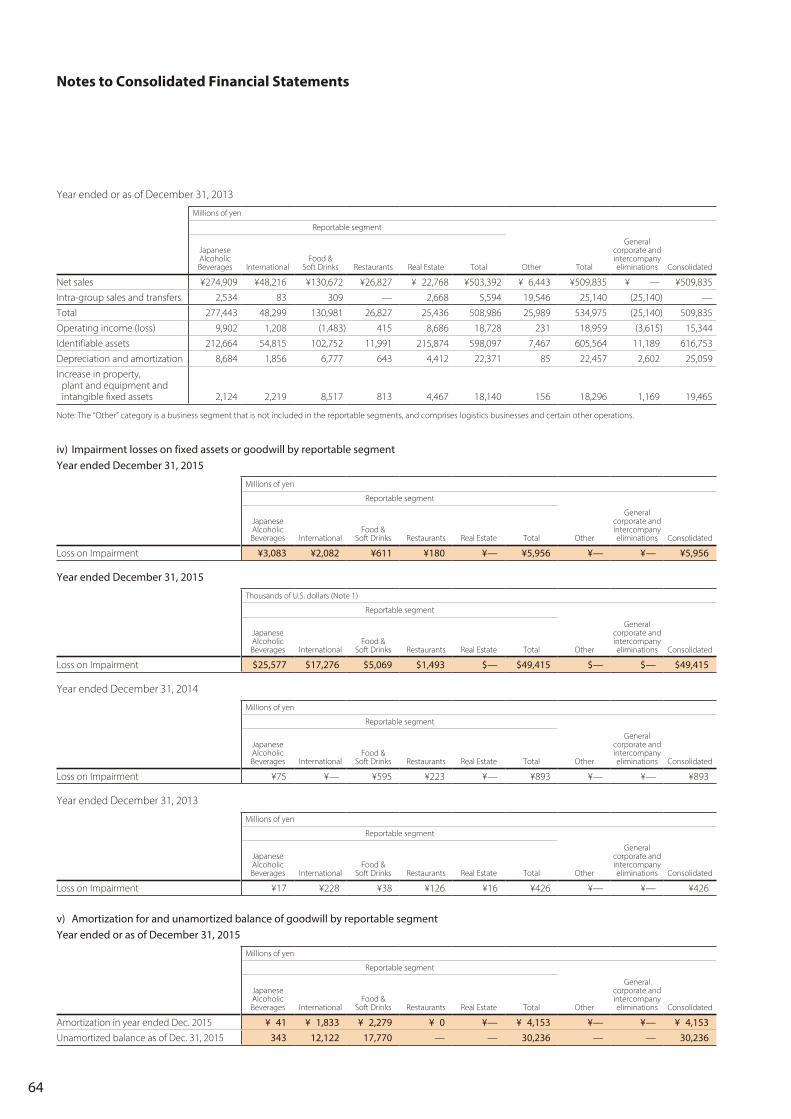
Year ended or as of December 31, 2013
Millions of yen
Reportable segment
Japanese Alcoholic Beverages International
Food & Soft Drinks Restaurants Real Estate Total Other Total
General corporate and intercompany eliminations Consolidated
Net sales ¥274,909 ¥48,216 ¥130,672 ¥26,827 ¥ 22,768 ¥503,392 ¥ 6,443 ¥509,835 ¥ — ¥509,835Intra-group sales and transfers 2,534 83 309 — 2,668 5,594 19,546 25,140 (25,140) —Total 277,443 48,299 130,981 26,827 25,436 508,986 25,989 534,975 (25,140) 509,835Operating income (loss) 9,902 1,208 (1,483) 415 8,686 18,728 231 18,959 (3,615) 15,344Identifiable assets 212,664 54,815 102,752 11,991 215,874 598,097 7,467 605,564 11,189 616,753Depreciation and amortization 8,684 1,856 6,777 643 4,412 22,371 85 22,457 2,602 25,059Increase in property,
plant and equipment and intangible fixed assets 2,124 2,219 8,517 813 4,467 18,140 156 18,296 1,169 19,465
Note: The “Other” category is a business segment that is not included in the reportable segments, and comprises logistics businesses and certain other operations.
iv) Impairment losses on fixed assets or goodwill by reportable segmentYear ended December 31, 2015
Millions of yen
Reportable segment
Japanese Alcoholic Beverages International
Food & Soft Drinks Restaurants Real Estate Total Other
General corporate and intercompany eliminations Consolidated
Loss on Impairment ¥3,083 ¥2,082 ¥611 ¥180 ¥— ¥5,956 ¥— ¥— ¥5,956
Year ended December 31, 2015
Thousands of U.S. dollars (Note 1)
Reportable segment
Japanese Alcoholic Beverages International
Food & Soft Drinks Restaurants Real Estate Total Other
General corporate and intercompany eliminations Consolidated
Loss on Impairment $25,577 $17,276 $5,069 $1,493 $— $49,415 $— $— $49,415
Year ended December 31, 2014
Millions of yen
Reportable segment
Japanese Alcoholic Beverages International
Food & Soft Drinks Restaurants Real Estate Total Other
General corporate and intercompany eliminations Consolidated
Loss on Impairment ¥75 ¥— ¥595 ¥223 ¥— ¥893 ¥— ¥— ¥893
Year ended December 31, 2013
Millions of yen
Reportable segment
Japanese Alcoholic Beverages International
Food & Soft Drinks Restaurants Real Estate Total Other
General corporate and intercompany eliminations Consolidated
Loss on Impairment ¥17 ¥228 ¥38 ¥126 ¥16 ¥426 ¥— ¥— ¥426
v) Amortization for and unamortized balance of goodwill by reportable segmentYear ended or as of December 31, 2015
Millions of yen
Reportable segment
Japanese Alcoholic Beverages International
Food & Soft Drinks Restaurants Real Estate Total Other
General corporate and intercompany eliminations Consolidated
Amortization in year ended Dec. 2015 ¥ 41 ¥ 1,833 ¥ 2,279 ¥ 0 ¥— ¥ 4,153 ¥— ¥— ¥ 4,153Unamortized balance as of Dec. 31, 2015 343 12,122 17,770 — — 30,236 — — 30,236
64
Notes to Consolidated Financial Statements

Year ended or as of December 31, 2015
Thousands of U.S. dollars (Note 1)
Reportable segment
Japanese Alcoholic Beverages International
Food & Soft Drinks Restaurants Real Estate Total Other
General corporate and intercompany eliminations Consolidated
Amortization in year ended Dec. 2015 $ 342 $ 15,209 $ 18,904 $ 1 $— $ 34,456 $— $— $ 34,456Unamortized balance as of Dec. 31, 2015 2,848 100,566 147,420 — — 250,834 — — 250,834
Year ended or as of December 31, 2014
Millions of yen
Reportable segment
Japanese Alcoholic Beverages International
Food & Soft Drinks Restaurants Real Estate Total Other
General corporate and intercompany eliminations Consolidated
Amortization in year ended Dec. 2014 ¥— ¥ 1,257 ¥ 2,507 ¥ 1 ¥— ¥ 3,764 ¥— ¥— ¥ 3,764Unamortized balance as of Dec. 31, 2014 — 10,000 19,966 — — 29,966 — — 29,966
Year ended or as of December 31, 2013
Millions of yen
Reportable segment
Japanese Alcoholic Beverages International
Food & Soft Drinks Restaurants Real Estate Total Other
General corporate and intercompany eliminations Consolidated
Amortization in year ended Dec. 2013 ¥— ¥ 1,240 ¥ 2,728 ¥— ¥17 ¥ 3,985 ¥— ¥— ¥ 3,985Unamortized balance as of Dec. 31, 2013 — 11,098 23,321 — — 34,419 — — 34,419
vi) Gain on negative goodwill by reportable segmentNot applicable in the years ended December 31, 2015, 2014 and 2013.
20. Amounts per ShareBasic net income per share has been computed based on the net income available for distribution to shareholders of common stock and the weighted average number of shares of common stock outstanding during the year, and diluted net income per share has been computed based on the net income available for distribution to shareholders and the weighted average number of shares of common stock outstanding during the year after allowing for the dilutive potential of shares of common stock to be issued upon the conversion of convertible bonds.
Information concerning diluted net income per share is omitted because there were no latent shares with a dilutive effect for the years ended December 31, 2015, 2014 and 2013.
Yen U.S. dollars (Note 1)
Year ended December 31 2015 2014 2013 2015
Net income ¥15.68 ¥0.87 ¥24.20 $0.13Diluted net income — — — —
Amounts per share of net assets have been computed based on the net assets available for distribution to shareholders and the number of shares of common stock outstanding at each balance sheet date.
Yen U.S. dollars (Note 1)
As of December 31 2015 2014 2015
Net assets ¥405.44 ¥401.17 $3.36
21. Subsequent Events
(Appropriation of Retained Earnings)On March 30, 2016, the following appropriation of retained earnings was approved at the annual general meeting of the Company’s shareholders:
Millions of yenThousands of U.S. dollars (Note 1)
Cash dividends ¥2,727 $22,620
(The Introduction of a Board Benefit Trust)The Company at its Board of Directors’ meeting held on February 10, 2016 resolved to introduce a new stock-based compensation system (Board Benefit Trust, or BBT) (hereinafter referred to as the “System”), for directors, group operating officers of the Company, and some of the directors of the Company’s subsidiaries (excluding outside directors, hereinafter referred to as the “Group Target Officers”) and resolved to submit a proposal for the System to the 92nd Ordinary General Meeting of Shareholders held on March 30, 2016 (the “General Meeting of Shareholders”). The proposal was approved by resolution of the General Meeting of Shareholders.
65SAPPORO HOLDINGS LIMITED Annual Report 2015
1. Background and Purpose of the Introduction of the SystemIn December 2015 the Company enacted its “Basic Policy on Corporate Governance” for the purpose of specifying its position and operational policy regarding its corporate governance in light of the purport and spirit of the “Corporate Governance Code” set forth in the Listing Rules of the Tokyo Stock Exchange. The Basic Policy calls for establishing a directors’ compensation system consisting of a combination of cash compensation and compensation in the form of shares of the Company.
With the goal of further clarifying the linkage between the corpo-rate performance and stock value of the Company to ensure that not only the merit of the increase in the stock prices, but also the risk of the decrease in the stock prices are shared among the Group Target Officers and the shareholders, thereby strengthening the Group Target Officers’ awareness toward their contributions to the mid- to long-term improvement in the corporate performance and value, the Company’s Board of Directors resolved to introduce the System, subject to the approval of shareholders, and will accordingly submit a proposal for the System at the General Meeting of Shareholders.
2. Summary of the System
(1) Summary of the SystemThe System is a stock-based compensation system under which, using as the funds the money the Company contributes at first, the Company’s shares are acquired by the trust (hereinafter the trust which is established based on the System is referred to as the “Trust”), and the Company’s shares and the amount of cash equivalent to the market price of the Company’s shares as of the date of their retirement (hereinafter referred to as the “Company’s shares, etc.”) are provided through the trust to the Group Target Officers in accordance with the officer stock benefit rules stipulated by the Company and the Company’s subsidiaries falling under the System. The Group Target Officers shall receive the Company’s shares, etc. upon their retirement in principle.
(2) Targets of the SystemDirectors, group operating officers of the Company, and some of the directors of the Company’s subsidiaries (excluding outside directors; Audit & Supervisory Board members are not covered by the System).
(3) Period of the TrustFrom May 31, 2016 (tentative) until the Trust is terminated (no specific date has been set for the termination of the Trust; the Trust will continue as long as the System itself continues; however, the System will terminate if the shares of the Company are delisted or the officer stock benefit rules are repealed or otherwise discontinued).
(4) The Calculation Method and the Upper Limit for the Number of the Company’s Shares to Be Provided to the Group Target Officers
For each fiscal year, the Group Target Officers shall be granted points, the amount of which is to be decided by their respective positions and achieved performance, etc. based on the officer stock benefit rules; provided, however, that in the case of the group operating officers who are non-resident of Japan for a certain period, the period on non-residence will not be covered by the System and no points will be granted in respect to such period.
The upper limit of the total points granted to the Group Target Officers for one (1) fiscal year shall be 263,900 points combined, with 92,700 points for directors of the Company, and 171,200 points for group operating officers of the Company and directors of the Company’s subsidiaries falling under the System. This has been determined, and judged appropriate by the Company, taking into consideration the current level of directors’ compensation provided, the trend of the number of the Group Target Officers and their estimate in the future, etc. in a comprehensive manner. Each point granted to the Group Target Officers shall be converted into one (1) share of the Company’s common stock at the time of the provision of the Company’s shares, etc. as explained in (7) below (provided, however, that, if, in regard to the Company’s shares, a share split, allotment of share without contribution, or consolidation of shares, etc., is carried out after the resolution for approval by shareholders at the General Meeting of Shareholders, the conversion ratio shall be adjusted in a reasonable manner in proportion to the relevant ratio, etc. for the share split, allotment of share without contribution, or consolidation of shares, etc. As a proposal for a share consolidation (the “Share Consolidation Proposal”) was approved by the shareholders as proposed, it will become effective on July 1, 2016, and at that time an appropriate adjustment of the conversion ratio will be made on the basis of the share consolidation).
The points for Group Target Officers which become the bases for the provision of the Company’s shares, etc. in (7) below shall be defined as the number aggregating the points granted to Group Target Officers by the time of their retirement (hereinafter referred to as the “Defined Number of Points.”)
(5) The Method of Acquiring the Company’s SharesThe Trust shall acquire the Company’s shares through the stock market or by underwriting the disposition of the Company’s treasury stock, using as the funds the money which is contributed at first by (6) below.
During the Initial Target Period (to be defined in (6) below), the Trust shall acquire shares within the upper limit of 791,700 shares with-out delay as the shares to be provided to the Group Target Officers, after the establishment of the Trust (May 31, 2016 (scheduled)).
(6) The Amount of the Trust and the Number of Shares to Be AcquiredSubject to approval of the introduction of the System by the General Meeting of Shareholders, the Company shall establish the Trust by contributing at first the funds necessary for the Trust to acquire in advance of a certain period the number of shares which are reason-ably expected to be required to provide the Company’s shares, etc. in accordance with (4) above and (7) below. As stipulated in (5) above, the Trust shall acquire the Company’s shares, using as the funds the money which is contributed at first by the Company.
Specifically, the Company shall establish the Trust by contributing the money with the upper limit of 446,000,000 yen as the necessary funds for three (3) fiscal years from the fiscal year ending at the end of December 2016 to the fiscal year ending at the end of December 2018 (hereinafter referred to as the “Initial Target Period”).
66
Notes to Consolidated Financial Statements
After the elapse of the Initial Target Period, the Company shall make additional contributions to the Trust, with the upper limit of 446,000,000 yen, for the following three (3) fiscal years (hereinafter referred to as the “Next Target Period”), in every three (3) fiscal years in principle until the termination of the System. Provided, however, if, at the time of such additional contributions, there remain the Company’s shares (excluding the Company’s shares corresponding to the points granted to the Group Target Officers but not yet given to the Group Target Officers) and money (hereinafter referred to as the “Remaining shares, etc.”) in the trust assets on the date immediately before the start of the Next Target Period during which the said additional contri-butions are to be made, the Remaining shares, etc. shall be allocated to the funds for the provision based on the System during the Next Target Period, and the upper limit of the monetary amount which the Company may additionally contribute during the Next Target Period shall be calculated by deducting the monetary amount of the Remaining shares, etc. (for shares, the monetary amount converted to the market value equivalent on the date immediately before the start of the Next Target Period) from 446,000,000 yen. When the Company determines additional contributions, we will make an appropriate disclosure in a timely manner.
(7) Timing for the Provision of the Company’s Shares, etc.When a Group Target Officer who has satisfied the beneficiary require-ments stipulated in the officer stock benefit rules retires, that officer may receive from the Trust the distribution of shares of the Company shares corresponding to the number of his or her Defined Number of Points awarded as per (4) above by carrying out the beneficiary certification procedures; provided, however, that, if the requirements separately stipulated in the officer stock benefit rules in addition to the requirements for the beneficiary are fulfilled, the said Group Target Officers may receive in respect of a certain percentage of the points granted to them an amount of cash equivalent to the market price of the Company’s shares as of the date of their retirement in lieu of the Company’s shares. The Trust may sell the Company’s shares in order to make the monetary provisions. Distributions of the Company Shares, etc. will not be made to the group operating officers who are not residents of Japan at the time of their retirement.
(8) Voting rights of Shares in the TrustIn accordance with the instructions from the independent trust administrator, the Trust shall not exercise the voting rights concerning the Company’s shares in the Trust’s account. It is intended that by adopting this approach neutrality can be ensured in regard to management of the Company.
(9) Treatment of DividendsThe Trust will receive the dividends from the shares of the Company held in the Trust’s account and allot them to payment of the acquisition cost of shares of the Company and to trust fees for the trustee of the Trust. In the event the Trust is terminated, dividends remaining in the Trust at that time will be distributed to the Group Target Officers in office at that time, in proportion to the number of points each holds.
(10) Treatment at the Time of Termination of the TrustThe Trust will terminate in the event of a delisting of shares of the Company or the repeal of the officer stock benefit rules and etc.
It is envisioned that all shares of the Company in the residual assets of the Trust at the time of its termination will be acquired without consideration by the Company and cancelled in accordance with a resolution of the Board of Directors. Cash in the residual assets of the Trust at the time of its termination, except for that distributed to the Group Target Officers as per (9) above, will be distributed to the Company.
[Overview of the Trust](i) Name: Board Benefit Trust (BBT)(ii) Trustor: The Company(iii) Trustee: Mizuho Trust & Banking Co., Ltd. (Re-trusted to Trust &
Custody Services Bank, Ltd.)(iv) Beneficiaries: Retiring Group Target Officers who meet the
beneficiary requirements(v) Trust administrator: Selection is planned of a third party having
no conflict of interests with the Company(vi) Type of trust: Money trust other than cash trusts (third party
benefit trust)(vii) Date of execution of the Trust Agreement:
May 31, 2016 (tentative)(viii) Date on which funds are entrusted: May 31, 2016 (tentative)(ix) Period of the Trust: From May 31, 2016 (tentative) until the Trust
is terminated (No specific date has been set for termination of the Trust; the Trust will continue as long as the System itself continues.)
(Change in the Number of Shares Constituting One Share Unit, Consolidation of Shares and Change in Total Number of Authorized Shares )At its Board of Directors’ meeting held on February 10, 2016, the Company resolved to submit a proposal for “Changes in the Number of Shares Constituting One Share Unit, Consolidation of Shares and Change in Total Number of Authorized Shares” to the 92nd Ordinary General Meeting of Shareholders held on March 30, 2016 (the “General Meeting of Shareholders”). The proposal was approved by resolution of the General Meeting of Shareholders.
1. Change in the Number of Shares Constituting One Share Unit
(1) Reason for ChangesJapanese stock exchanges have announced the Action Plan for Consolidating Trading Units, aiming to consolidate one hundred (100) shares of common stock of domestic companies listed on Japanese stock exchanges into one (1) trading unit by October 2018. As a company listed on the Tokyo Stock Exchange (“TSE”) and the Sapporo Securities Exchange (“SSE”), the Company shall respect this intention, change its number of shares constituting one share unit to one hundred (100) shares. (“Change in the Number of Shares Constituting One Share Unit.”)
67SAPPORO HOLDINGS LIMITED Annual Report 2015

(2) Details of the ChangeThe Company changes its number of shares constituting one share unit from one thousand (1,000) shares to one hundred (100) shares as of July 1, 2016.
2. Consolidation of Shares
(1) Purpose of Consolidation of SharesAs stated in “1. Change in the Number of Shares Constituting One Share Unit” above, the Company has decided to change its number of shares constituting one share unit to one hundred (100) common stock shares, and to consolidate shares with the objectives of enhancing investment opportunities for individual investors as well as adjusting the investment unit to an appropriate level taking into consideration changes in stock prices in the medium to long term, etc. (the “Consolidation of Shares”).
(2) Details of the Consolidation of Shares• Type of shares subject to the Consolidation of Shares:
Common shares• Method and ratio of the Consolidation of Shares:
Consolidation to be executed on July 1, 2016 at a ratio of 1 share for each 5 shares owned by shareholders of record in the latest shareholder register as of the close of the last day of June 2016.
• Share reduction resulting from the Consolidation of Shares Total number of outstanding shares before consolidation (as of the last day of December 2015) 393,971,493 sharesShare decrease due to consolidation 315,177,195 sharesShares outstanding after consolidation 78,794,298 shares
Note: “Share decrease due to the consolidation” and “Shares outstanding after the consolidation” are theoretical values calculated based on the shares outstanding before the consolidation, and on the Consolidation of Shares ratio.
(3) Treatment When There is Less Than One ShareIf fractional shares of less than one share arise as a result of the Consolidation of Shares, such shares shall be subject to a bulk sale in accordance with the provisions of the Companies Act, or the Company shall purchase them as treasury stock. The proceeds of the said sale, etc. shall be distributed to the target shareholders in propor-tion to their respective shareholdings.
(4) Total Number of Authorized Shares as of the Effective DateIn conjunction with the reduction of the total number of the outstanding shares of the Company as a result of the Consolidation of Shares, in order to adjust the total number of authorized shares to an appropriate level, the total number of authorized shares shall be amended from one billion (1,000,000,000) shares to two hundred million (200,000,000) shares in accordance with the Consolidation of Shares ratio (one fifth).
Number of authorized shares before change 1 billion shares Number of authorized shares after change (as of July 1, 2016) 200 million shares
3. ScheduleFebruary 10, 2016 Resolution at the Board of DirectorsMarch 30, 2016 Resolution at General Meeting of ShareholdersJuly 1, 2016 (tentative) Effective date of Change in the Number of
Shares Constituting One Share Unit, Consolidation
of Shares, and change in the total number of authorized shares
4. Impact on Per Share InformationAssuming that the Consolidation of Shares was conducted at the beginning of the year ended December 31, 2014, per share informa-tion for the years ended December 31, 2014 and 2015 is as follows.
Yen
Year ended December 31 2015 2014
(1) Net assets per share ¥2,027.21 ¥2,005.84(2) Net income per share 78.40 4.36
(Issuance for Corporate Bonds)On March 11, 2016, the Company issued domestic straight corporate bonds based on the following conditions:
31th Series of Unsecured Corporate Bonds1. Issuing company: Sapporo Holdings Ltd.2. Issuing amount: ¥10,000 million3. Issue price: ¥100 with face value of ¥1004. Interest rate: 0.25% per annum5. Payment deadline: March 22, 20166. Maturity: March 22, 20217. Use of funds: Repayment of borrowings
68
Notes to Consolidated Financial Statements
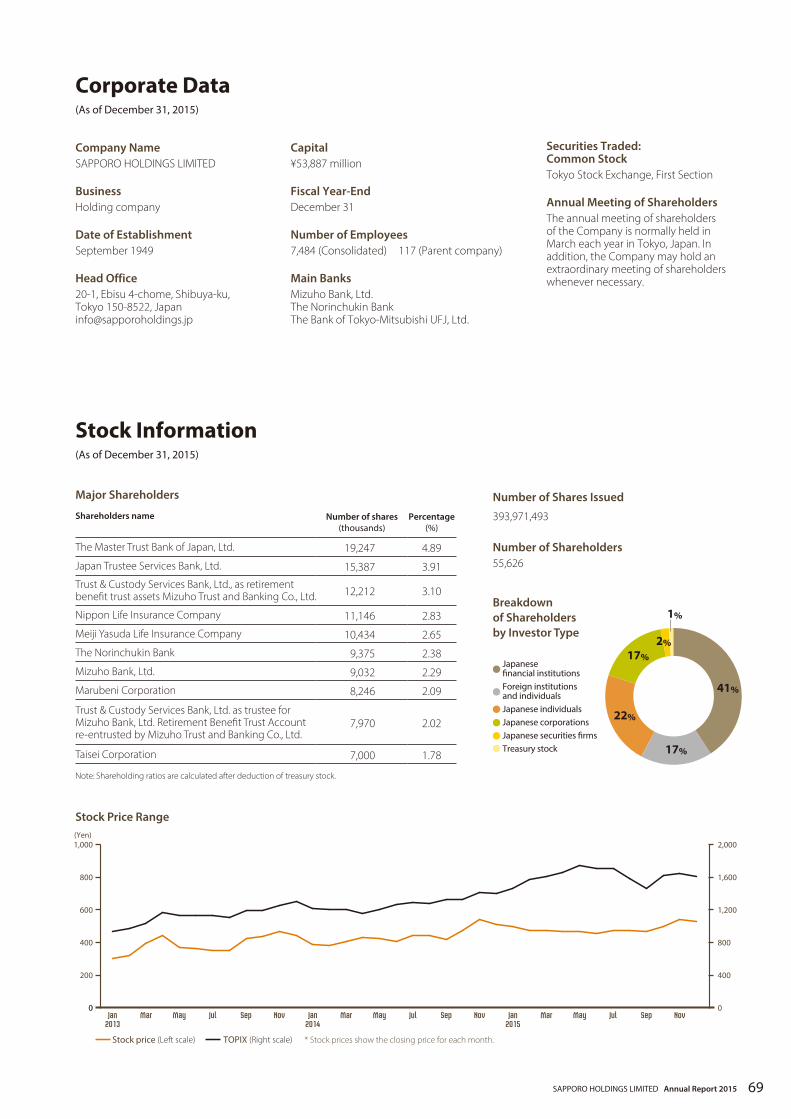
Company NameSAPPORO HOLDINGS LIMITED
BusinessHolding company
Date of EstablishmentSeptember 1949
Head Office20-1, Ebisu 4-chome, Shibuya-ku, Tokyo 150-8522, Japan [email protected]
Capital¥53,887 million
Fiscal Year-EndDecember 31
Number of Employees7,484 (Consolidated) 117 (Parent company)
Main BanksMizuho Bank, Ltd. The Norinchukin Bank The Bank of Tokyo-Mitsubishi UFJ, Ltd.
Securities Traded: Common StockTokyo Stock Exchange, First Section
Annual Meeting of ShareholdersThe annual meeting of shareholders of the Company is normally held in March each year in Tokyo, Japan. In addition, the Company may hold an extraordinary meeting of shareholders whenever necessary.
Corporate Data(As of December 31, 2015)
Stock Information(As of December 31, 2015)
Number of Shares Issued
393,971,493
Number of Shareholders55,626
Shareholders name Number of shares (thousands)
Percentage (%)
The Master Trust Bank of Japan, Ltd. 19,247 4.89
Japan Trustee Services Bank, Ltd. 15,387 3.91Trust & Custody Services Bank, Ltd., as retirement benefit trust assets Mizuho Trust and Banking Co., Ltd. 12,212 3.10
Nippon Life Insurance Company 11,146 2.83
Meiji Yasuda Life Insurance Company 10,434 2.65
The Norinchukin Bank 9,375 2.38
Mizuho Bank, Ltd. 9,032 2.29
Marubeni Corporation 8,246 2.09
Trust & Custody Services Bank, Ltd. as trustee for Mizuho Bank, Ltd. Retirement Benefit Trust Account re-entrusted by Mizuho Trust and Banking Co., Ltd.
7,970 2.02
Taisei Corporation 7,000 1.78
Note: Shareholding ratios are calculated after deduction of treasury stock.
Major Shareholders
NovSepJulMayMarJan2015
NovSepJulMayMarJan2014
NovSepJulMayMarJan2013
(Yen)
00
400
600
200
800
1,000
0
800
1,200
400
1,600
2,000
TOPIX (Right scale) * Stock prices show the closing price for each month.Stock price (Left scale)
41%
17%
17%
2%
22%
Japanese �nancial institutionsForeign institutions and individualsJapanese individualsJapanese corporationsJapanese securities �rmsTreasury stock
1%Breakdown of Shareholders by Investor Type
Stock Price Range
Printed in Japan
20-1, Ebisu 4-chome, Shibuya-ku,Tokyo 150-8522, Japan
SAPPORO HOLDINGS LIMITED
http://www.sapporoholdings.jp/english/


