26
Winning Through Innovation: Managing New Product Development for Profitable Growth Pete Bussey Solution Principal SAP America

Winning Through Innovation: Managing New Product Development for Profitable Growth
Pete BusseySolution PrincipalSAP America

©SAP AG 2005, 2
Today’s Business Imperative: Innovate or Die!

©SAP AG 2005, 3
Questions about New Product Development
NPDI…why are new products so vital?
NPDI…what is the process, how does it work?
NPDI…what is SAP’s solution?
NPDI = New Product Development and Introduction
©SAP AG 2005, 4
Why are new products so vital?
Innovation: the new business imperative
©SAP AG 2005, 5
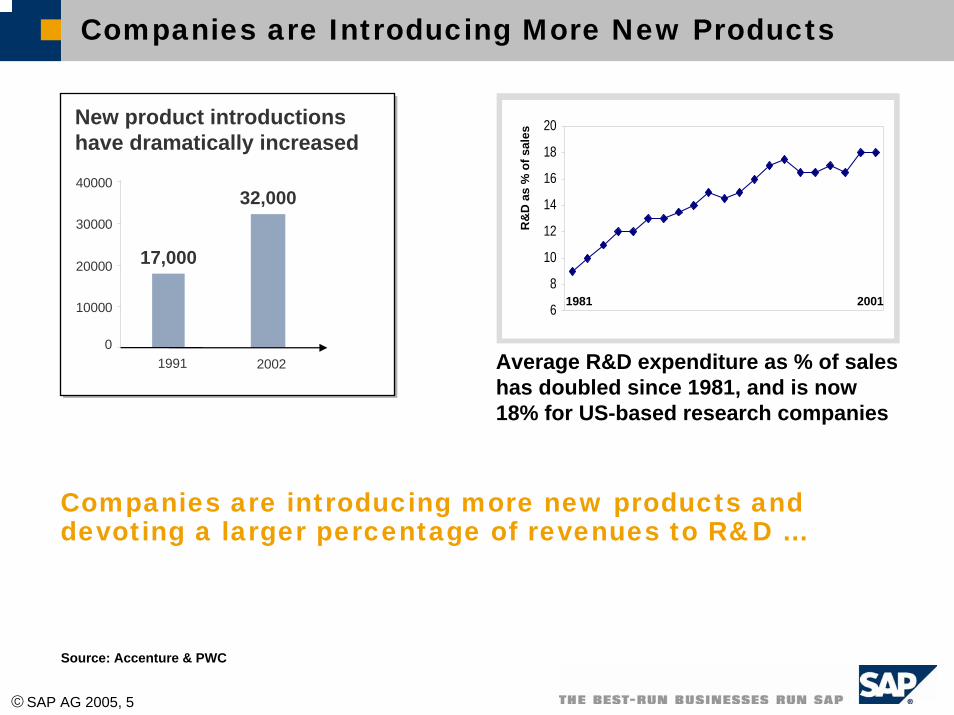
Companies are Introducing More New Products
0
10000
20000
30000
40000
1991 2002
32,000
17,000
New product introductions have dramatically increased
6
8
10
12
14
16
18
20
1981 2001
R&
D a
s %
of s
ales
Average R&D expenditure as % of sales has doubled since 1981, and is now 18% for US-based research companies
Companies are introducing more new products and devoting a larger percentage of revenues to R&D …
Source: Accenture & PWC
©SAP AG 2005, 6
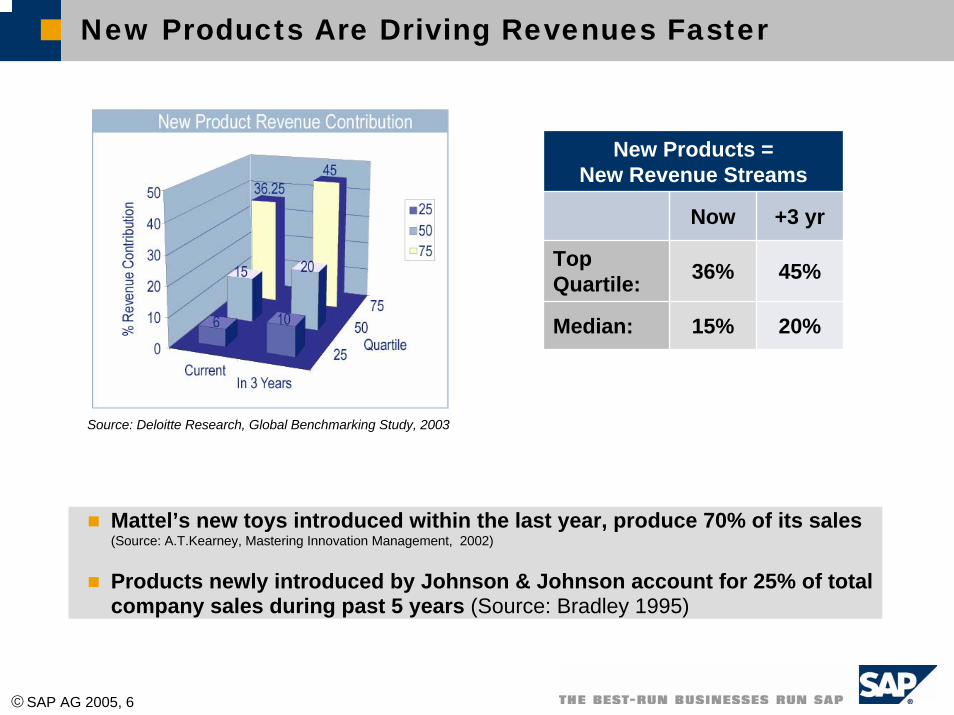
New Products Are Driving Revenues Faster
Source: Deloitte Research, Global Benchmarking Study, 2003
New Products = New Revenue Streams
Now +3 yr
36%
15%
Top Quartile: 45%
Median: 20%
Mattel’s new toys introduced within the last year, produce 70% of its sales(Source: A.T.Kearney, Mastering Innovation Management, 2002)
Products newly introduced by Johnson & Johnson account for 25% of total company sales during past 5 years (Source: Bradley 1995)

©SAP AG 2005, 7
NewProducts
New categoryNew productIncr. improvements
Growth
Value
New geographiesNew marketsNew customers
Stock priceMarket cap.
Revenues $$Margins %Market share %Competitive position #
New Products Create Growth, Value
©SAP AG 2005, 8
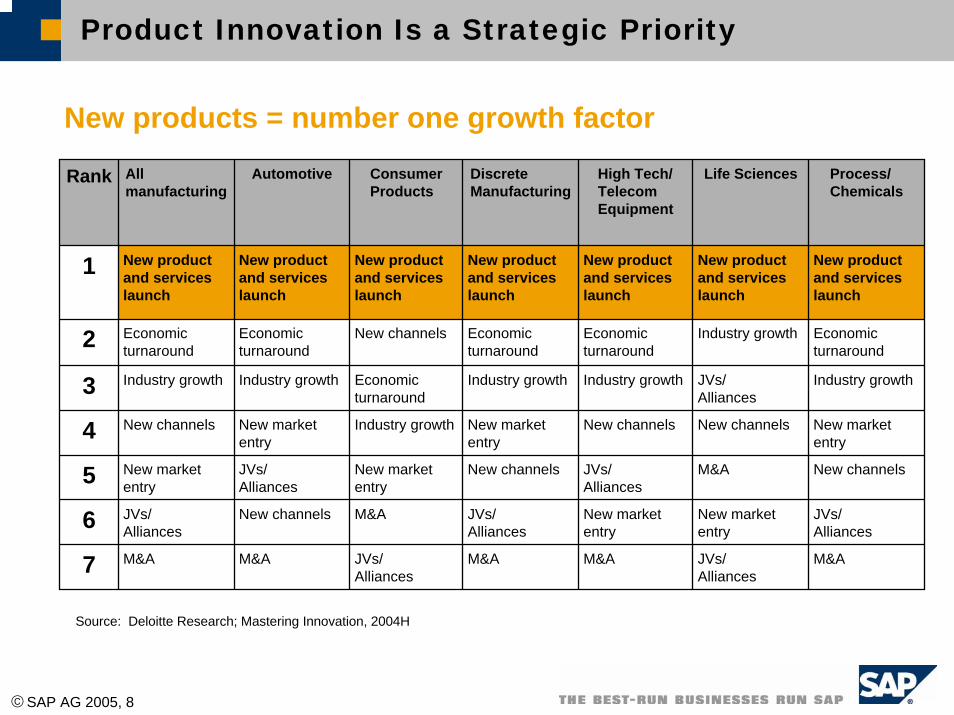
Product Innovation Is a Strategic Priority
New products = number one growth factor
Rank All manufacturing
Automotive Consumer Products
Discrete Manufacturing
High Tech/ Telecom Equipment
Life Sciences Process/Chemicals
1 New product and services launch
New product and services launch
New product and services launch
New product and services launch
New product and services launch
New product and services launch
New product and services launch
2 Economic turnaround
Economic turnaround
New channels Economic turnaround
Economic turnaround
Industry growth Economic turnaround
3 Industry growth Industry growth Economic turnaround
Industry growth Industry growth JVs/Alliances
Industry growth
4 New channels New market entry
Industry growth New market entry
New channels New channels New market entry
5 New market entry
JVs/Alliances
New market entry
New channels JVs/Alliances
M&A New channels
6 JVs/Alliances
New channels M&A JVs/Alliances
New market entry
New market entry
JVs/Alliances
7 M&A M&A JVs/Alliances
M&A M&A JVs/Alliances
M&A
Source: Deloitte Research; Mastering Innovation, 2004H
©SAP AG 2005, 9
What is NPDI, and how is it working today?
NPDI: A critical business process
©SAP AG 2005, 10
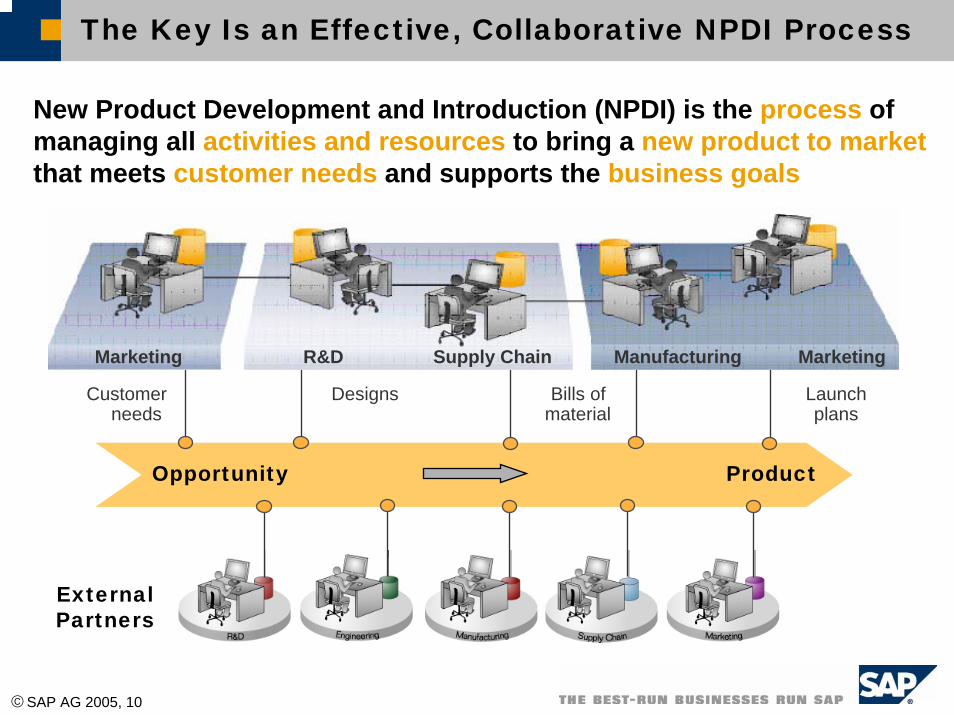
The Key Is an Effective, Collaborative NPDI Process
New Product Development and Introduction (NPDI) is the process of managing all activities and resources to bring a new product to marketthat meets customer needs and supports the business goals
Marketing R&D Supply Chain Manufacturing Marketing
Designs Bills of material
Customerneeds
Launchplans
Opportunity Product
External Partners
©SAP AG 2005, 11
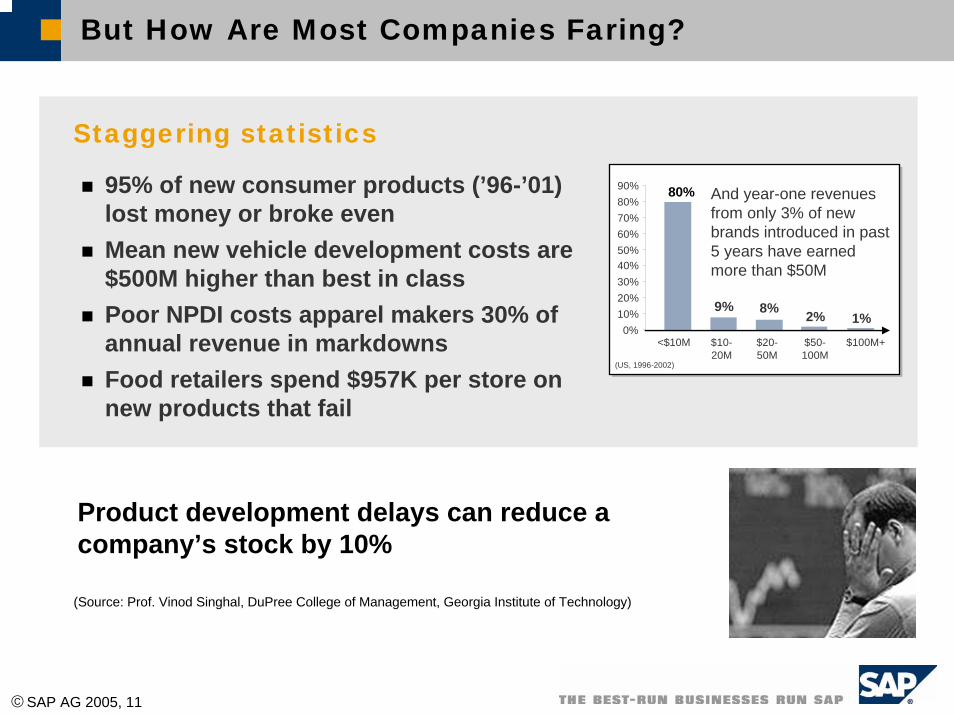
But How Are Most Companies Faring?
95% of new consumer products (’96-’01) lost money or broke evenMean new vehicle development costs are $500M higher than best in classPoor NPDI costs apparel makers 30% of annual revenue in markdownsFood retailers spend $957K per store on new products that fail
Staggering statistics
80%
9% 8% 2% 1%0%
10%20%30%40%50%60%70%80%90% And year-one revenues
from only 3% of new brands introduced in past 5 years have earned more than $50M
<$10M $10-20M
$20-50M
$50-100M
$100M+
(US, 1996-2002)
Product development delays can reduce a company’s stock by 10%
(Source: Prof. Vinod Singhal, DuPree College of Management, Georgia Institute of Technology)
©SAP AG 2005, 12
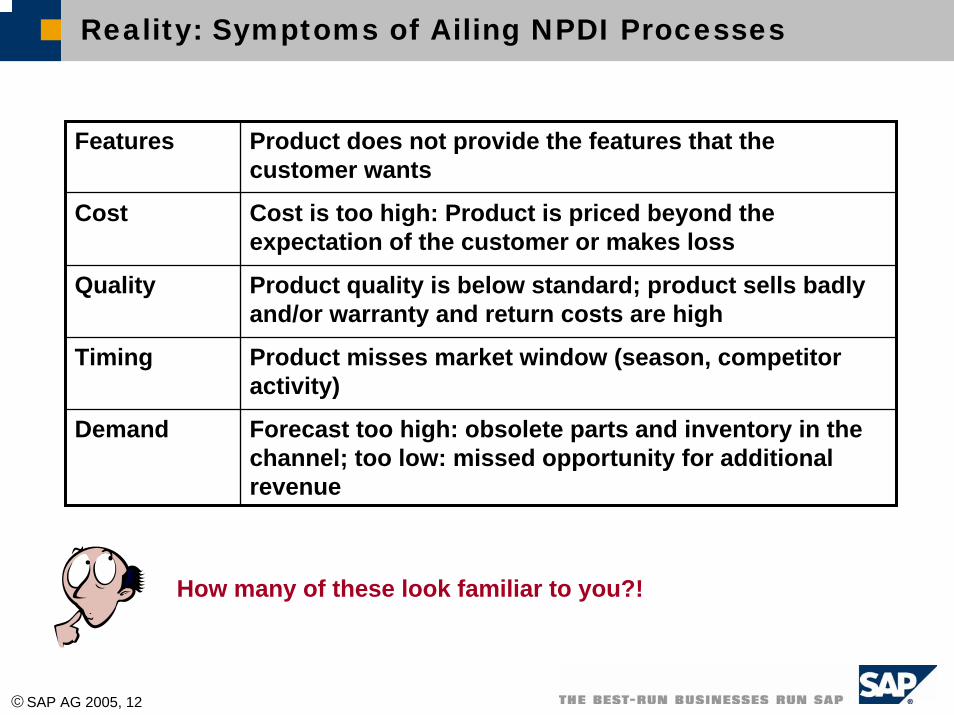
Reality: Symptoms of Ailing NPDI Processes
Product misses market window (season, competitor activity)
Timing
Product quality is below standard; product sells badly and/or warranty and return costs are high
Quality
Forecast too high: obsolete parts and inventory in the channel; too low: missed opportunity for additional revenue
Demand
Cost is too high: Product is priced beyond the expectation of the customer or makes loss
Cost
Product does not provide the features that the customer wants
Features
How many of these look familiar to you?!
©SAP AG 2005, 13
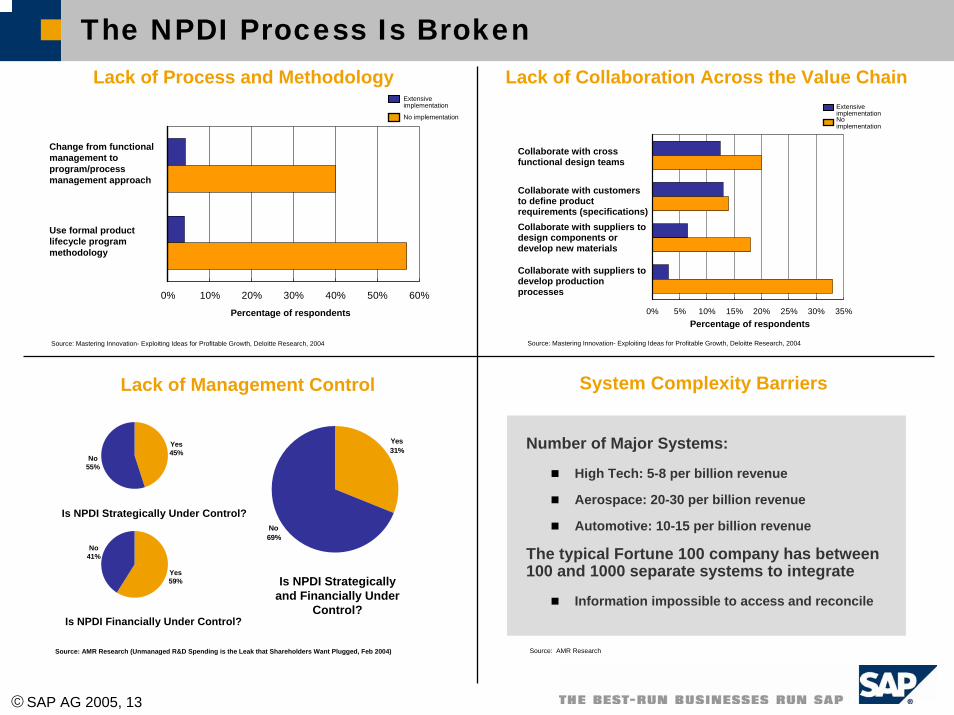
The NPDI Process Is BrokenLack of Process and Methodology
Source: Mastering Innovation- Exploiting Ideas for Profitable Growth, Deloitte Research, 2004
Change from functional management to program/process management approach
0% 10% 20% 30% 40% 50% 60%
Use formal product lifecycle program methodology
Percentage of respondents
No implementation
Extensive implementation
Lack of Collaboration Across the Value Chain
Source: Mastering Innovation- Exploiting Ideas for Profitable Growth, Deloitte Research, 2004
Collaborate with cross functional design teams
0% 5% 10% 15% 20% 25% 30% 35%
Collaborate with suppliers to design components or develop new materials
Percentage of respondents
No implementation
Extensive implementation
Collaborate with customers to define product requirements (specifications)
Collaborate with suppliers to develop production processes
No55%
Yes45%
No41%
Yes59%
Yes31%
No69%
Is NPDI Strategically Under Control?
Is NPDI Financially Under Control?
Is NPDI Strategically and Financially Under
Control?
Source: AMR Research (Unmanaged R&D Spending is the Leak that Shareholders Want Plugged, Feb 2004)
Lack of Management Control
Number of Major Systems:
High Tech: 5-8 per billion revenue
Aerospace: 20-30 per billion revenue
Automotive: 10-15 per billion revenue
The typical Fortune 100 company has between 100 and 1000 separate systems to integrate
Information impossible to access and reconcile
System Complexity Barriers
Source: AMR Research
©SAP AG 2005, 14
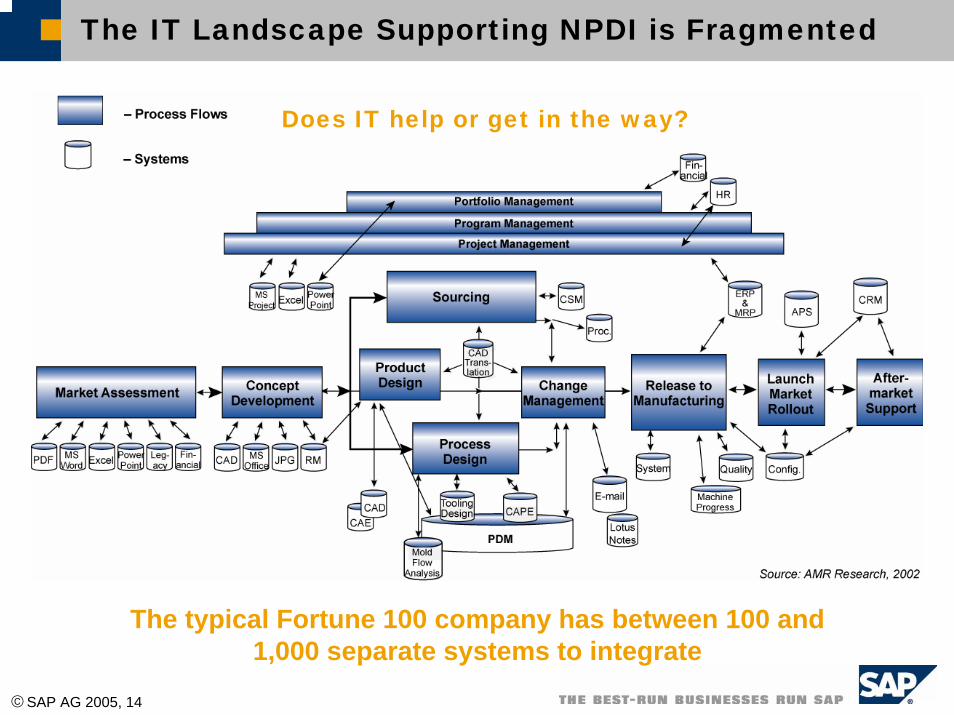
The IT Landscape Supporting NPDI is Fragmented
Does IT help or get in the way?
The typical Fortune 100 company has between 100 and 1,000 separate systems to integrate
©SAP AG 2005, 15
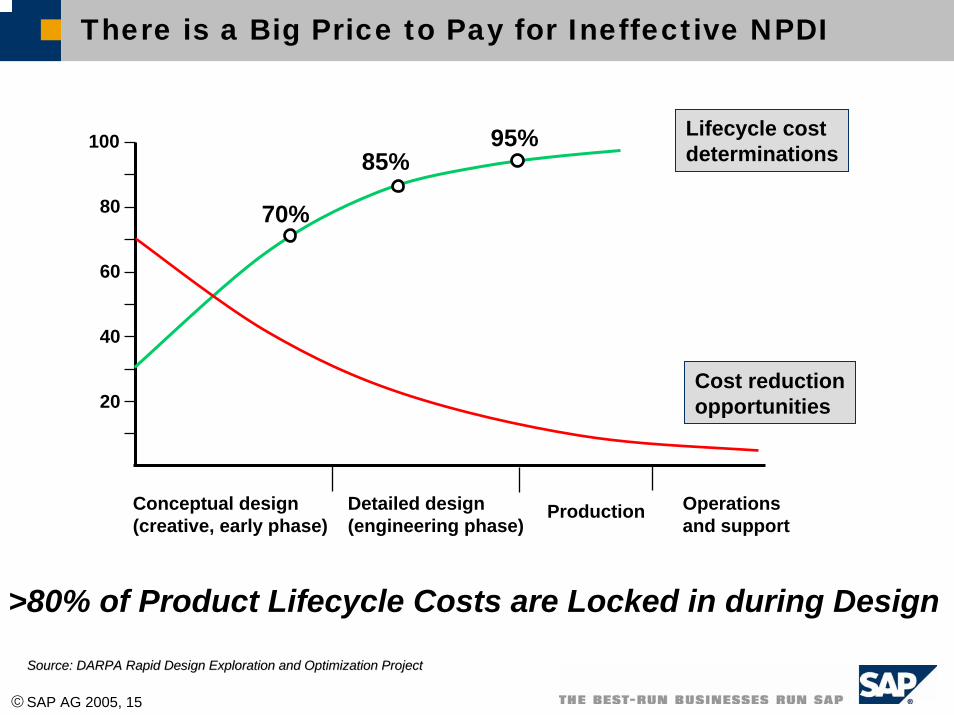
There is a Big Price to Pay for Ineffective NPDI
Conceptual design (creative, early phase)
Detailed design (engineering phase)
Operations and support
Cost reductionopportunities
Lifecycle cost determinations
70%
85%95%
20
40
60
80
100
Production
>80% of Product Lifecycle Costs are Locked in during Design
Source: DARPA Rapid Design Exploration and Optimization ProjectSource: DARPA Rapid Design Exploration and Optimization Project
©SAP AG 2005, 16
What is SAP’s solution?
NPDI: Real Solutions, Differentiated

©SAP AG 2005, 17
Critical NPDI Capabilities
Product innovation management
Idea,portfolio
management
Projectmanagement
Project, resource, andcost management
Functionalexecution
Productdevelop-
ment
MarketlaunchSupply
chainplanning
Production ramp-up
Strategicsourcing
Proto-typing
©SAP AG 2005, 18
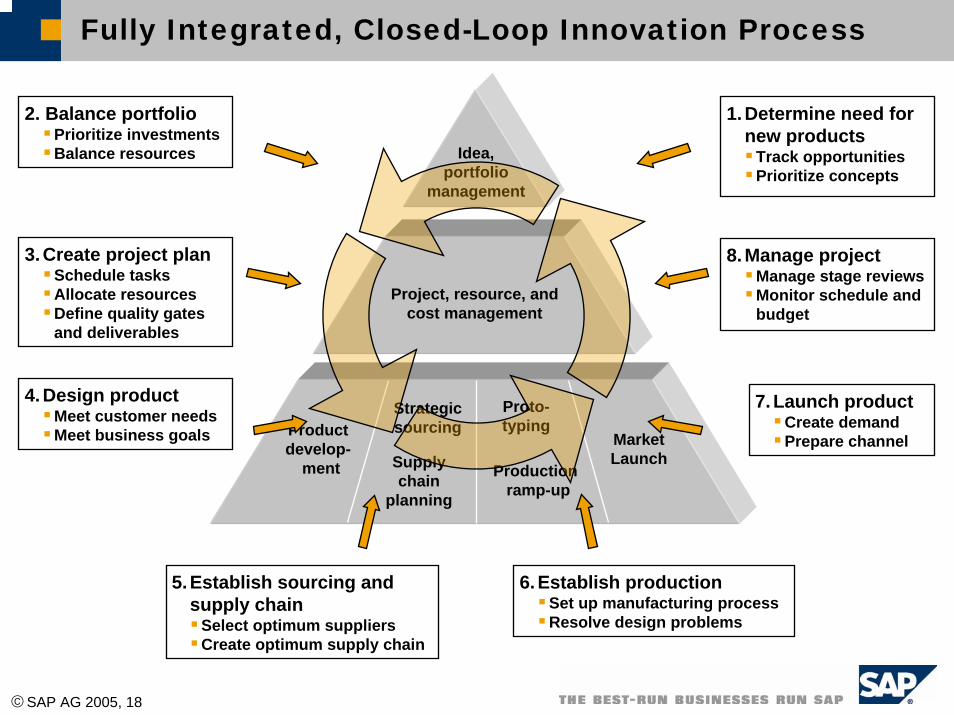
Fully Integrated, Closed-Loop Innovation Process
Productdevelop-
ment
MarketLaunchSupply
chainplanning
Production ramp-up
Strategicsourcing
Proto-typing
Project, resource, andcost management
Idea,portfolio
management
2. Balance portfolioPrioritize investmentsBalance resources
3.Create project planSchedule tasksAllocate resourcesDefine quality gates and deliverables
4.Design productMeet customer needsMeet business goals
1.Determine need for new products
Track opportunitiesPrioritize concepts
8.Manage projectManage stage reviewsMonitor schedule and budget
7.Launch productCreate demandPrepare channel
5.Establish sourcing and supply chain
Select optimum suppliersCreate optimum supply chain
6.Establish productionSet up manufacturing processResolve design problems
©SAP AG 2005, 19
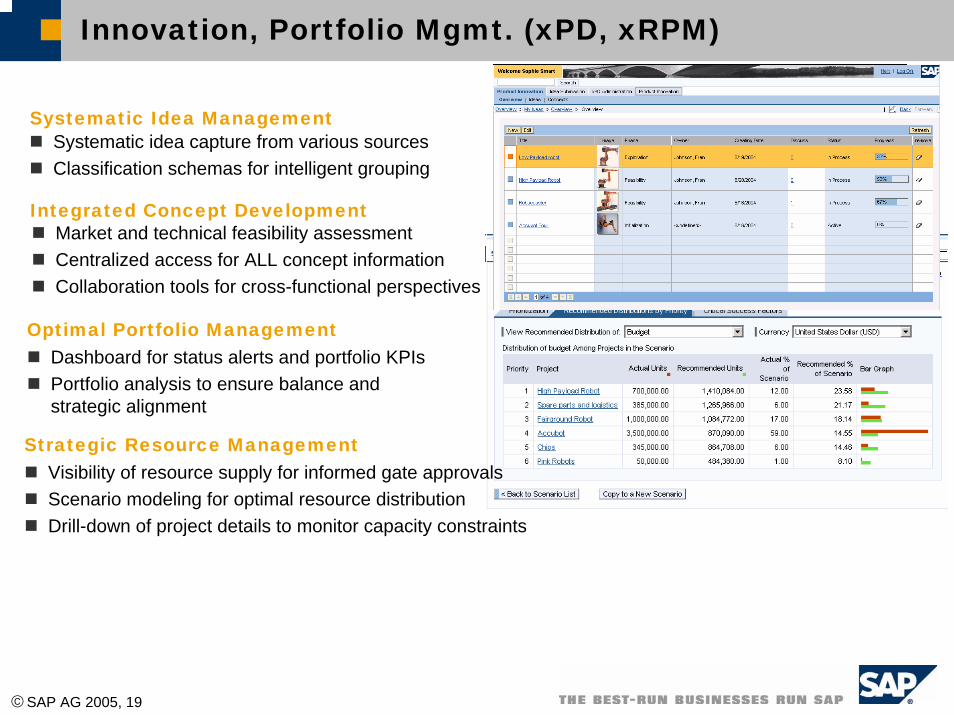
Innovation, Portfolio Mgmt. (xPD, xRPM)
Systematic idea capture from various sourcesClassification schemas for intelligent grouping
Systematic Idea Management
Market and technical feasibility assessmentCentralized access for ALL concept informationCollaboration tools for cross-functional perspectives
Integrated Concept Development
Strategic Resource ManagementVisibility of resource supply for informed gate approvalsScenario modeling for optimal resource distributionDrill-down of project details to monitor capacity constraints
Optimal Portfolio ManagementDashboard for status alerts and portfolio KPIsPortfolio analysis to ensure balance and strategic alignment
©SAP AG 2005, 20
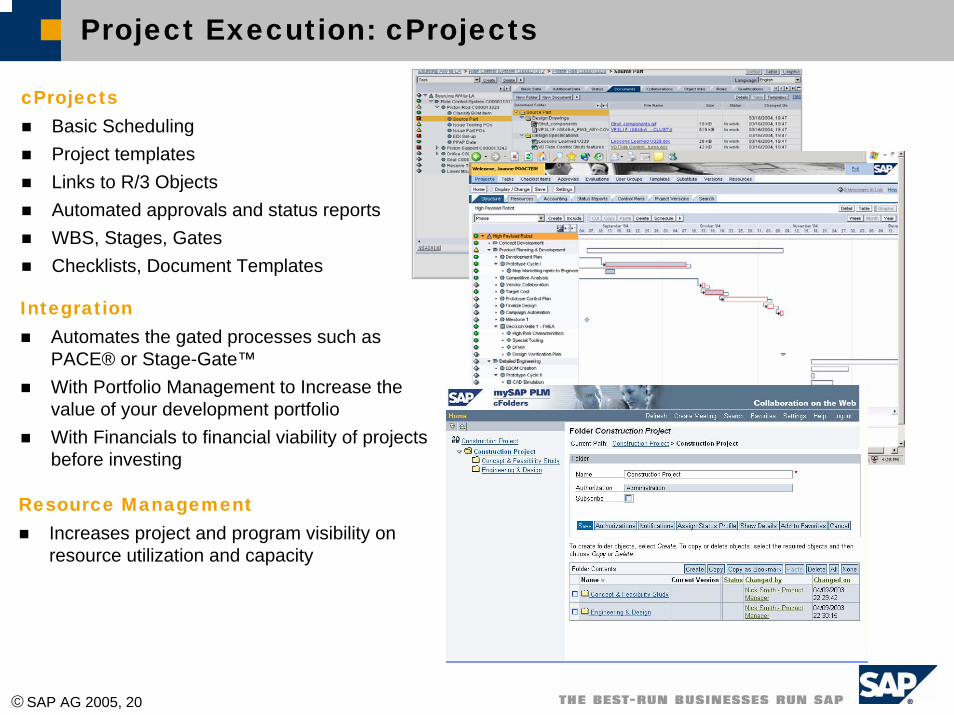
Project Execution: cProjects
Resource ManagementIncreases project and program visibility on resource utilization and capacity
Integration Automates the gated processes such as PACE® or Stage-Gate™With Portfolio Management to Increase the value of your development portfolioWith Financials to financial viability of projects before investing
cProjectsBasic Scheduling Project templatesLinks to R/3 ObjectsAutomated approvals and status reportsWBS, Stages, GatesChecklists, Document Templates
©SAP AG 2005, 21
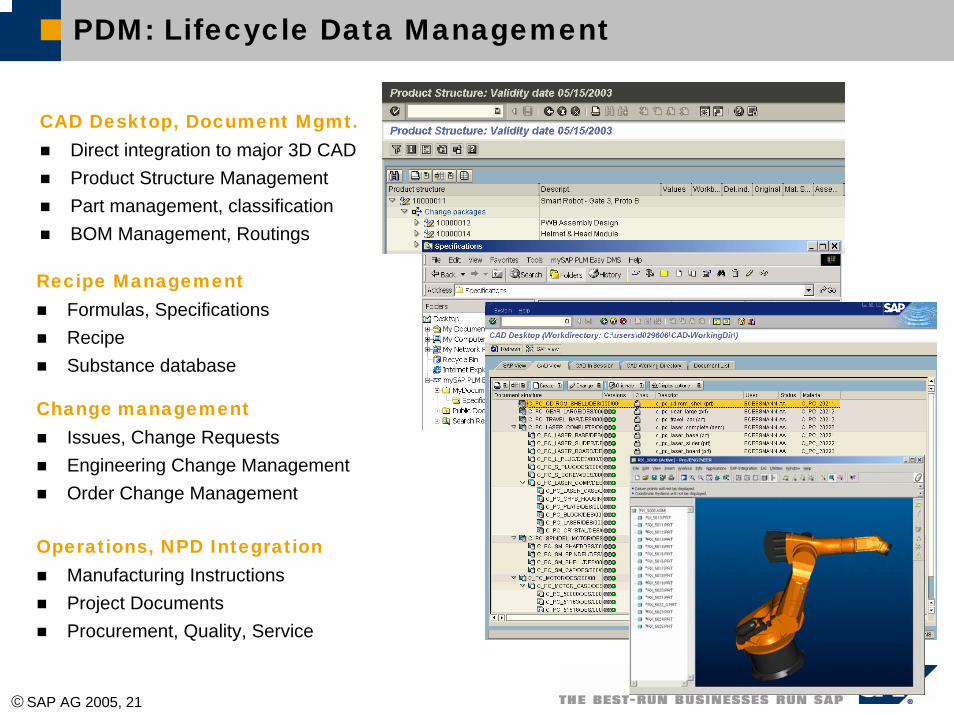
PDM: Lifecycle Data Management
CAD Desktop, Document Mgmt.Direct integration to major 3D CADProduct Structure ManagementPart management, classificationBOM Management, Routings
Change managementIssues, Change RequestsEngineering Change ManagementOrder Change Management
Recipe ManagementFormulas, SpecificationsRecipeSubstance database
Operations, NPD IntegrationManufacturing InstructionsProject DocumentsProcurement, Quality, Service

©SAP AG 2005, 22
SAP has the Inside Track for NPDI
As companies move toward Demand-Driven Supply Networks (DDSNs) they face their trickiest technology strategy decisions in the vital, but complex New Product Development and Introduction (NPDI) process. NPDI calls on a lot of different tools and data. Does this make it the natural domain of Enterprise Resource Planning (ERP) vendors? The larger the business, the more likely the answer is yes.
The Bottom Line: Larger companies are giving ERP vendors the pole position in owning the NPDI business process.
AMR, “ERP Vendors are Set to Win the Battle for NPDI”, Dec. 2004
©SAP AG 2005, 23
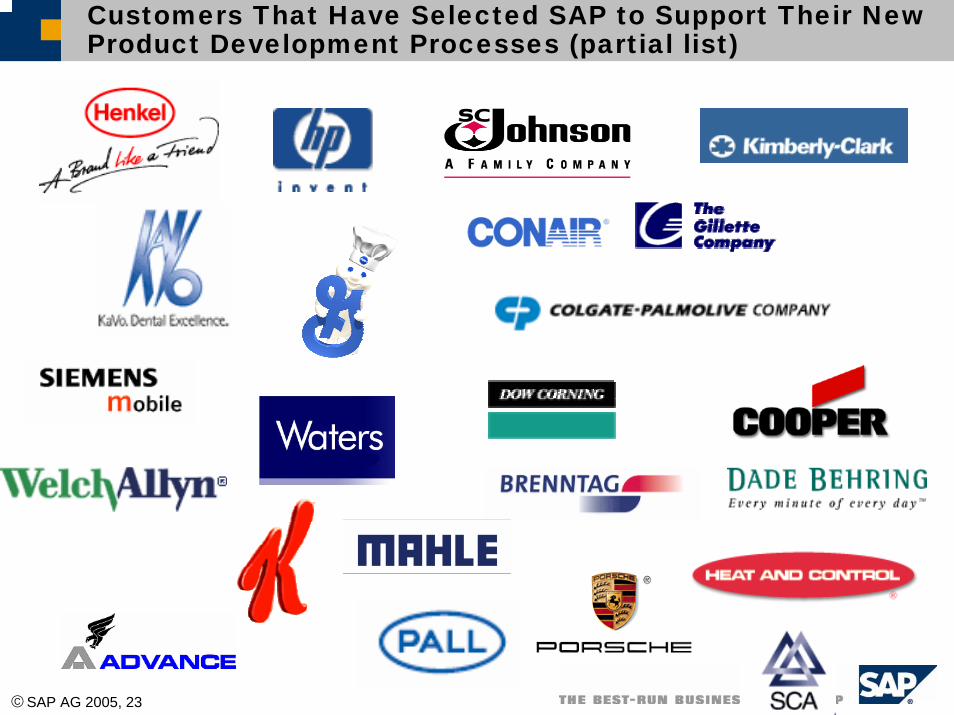
Customers That Have Selected SAP to Support Their New Product Development Processes (partial list)

©SAP AG 2005, 24
Why do Companies Choose the SAP NPDI Solution?
Reduced time to market for new productsIncreased revenue, better marginsImproved NPDI productivity
Tangible Business Benefits
Integration and Speed to Value
Risk Mitigation
Broad functional capabilitiesFully integrated > lowest Total Cost of Ownership (TCO) Powered by NetWeaver
SAP viabilityLarge manufacturing installed baseR&D commitment and investment

©SAP AG 2005, 25
NPDI - Growth Through Innovation
Manufacturers recognize the critical importance of innovation to their future successThere is enormous scope to improve the way in which NPDI is managedYou can get started today using solutions already available from SAP
“The companies that know how to develop things are ultimately going to create the most shareholder value. It’s as simple as that.”
Jeffrey ImmeltChairman and CEO
General ElectricMIT Technology Review, October 2003
“You only get a position in the future by investing, creating something new, and staying ahead of the competition. So it’s simple: invest or die”
Craig BarrettCEOIntel
Business 2.0, January/February 2004
©SAP AG 2005, 26
Copyright 2005 SAP AG. All Rights Reserved
No part of this publication may be reproduced or transmitted in any form or for any purpose without the express permission of SAP AG. The information contained herein may be changed without prior notice.
Some software products marketed by SAP AG and its distributors contain proprietary software components of other software vendors.
Microsoft®, WINDOWS®, NT®, EXCEL®, Word®, PowerPoint® and SQL Server® are registered trademarks of Microsoft Corporation.
IBM®, DB2®, DB2 Universal Database, OS/2®, Parallel Sysplex®, MVS/ESA, AIX®, S/390®, AS/400®, OS/390®, OS/400®, iSeries, pSeries, xSeries, zSeries, z/OS, AFP, Intelligent Miner, WebSphere®, Netfinity®, Tivoli®, Informix and Informix® Dynamic ServerTM are trademarks of IBM Corporation in USA and/or other countries.
ORACLE® is a registered trademark of ORACLE Corporation.
UNIX®, X/Open®, OSF/1®, and Motif® are registered trademarks of the Open Group.
Citrix®, the Citrix logo, ICA®, Program Neighborhood®, MetaFrame®, WinFrame®, VideoFrame®, MultiWin® and other Citrix product names referenced herein are trademarks of Citrix Systems, Inc.
HTML, DHTML, XML, XHTML are trademarks or registered trademarks of W3C®, World Wide Web Consortium, Massachusetts Institute of Technology.
JAVA® is a registered trademark of Sun Microsystems, Inc.
JAVASCRIPT® is a registered trademark of Sun Microsystems, Inc., used under license for technology invented and implemented by Netscape.
MarketSet and Enterprise Buyer are jointly owned trademarks of SAP AG and Commerce One.
SAP, R/3, mySAP, mySAP.com, xApps, xApp, SAP NetWeaver and other SAP products and services mentioned herein as well as their respective logos are trademarks or registered trademarks of SAP AG in Germany and in several other countries all over the world. All other product and service names mentioned are the trademarks of their respective companies.


