SAR FOR AGRICULTURE- Research and Development at AAFC Heather McNairn*, Jarrett Powers, Jiali Shang, Amine Merzouki, Anna Pacheco, Thierry Fisette, Grant Wiseman, Saeid Homayouni and Mehdi Hosseini *Science and Technology Branch, Agriculture and Agri-Food Canada [email protected]
Transcript
SAR FOR AGRICULTURE- Research
and Development at AAFC
Heather McNairn*, Jarrett Powers, Jiali Shang, Amine Merzouki, Anna Pacheco,
Thierry Fisette, Grant Wiseman, Saeid Homayouni and Mehdi Hosseini
*Science and Technology Branch, Agriculture and Agri-Food Canada [email protected]
SAR Applications at Agriculture and Agri-Food Canada
• SAR is playing an increasing role in agriculture monitoring
• Decades of research using airborne systems and ground based scatterometers are now paying dividends, coupled with unprecedented engineering advancements in space-borne SAR
• Annual Crop Inventory
Status: operational
• Crop Condition Assessment and Phenology Determination
Status: research
• Soil Moisture Monitoring
Status: pilot
CCRS Scatterometer Canadian CV-580 SAR
RADARSAT-2
Crop Inventory
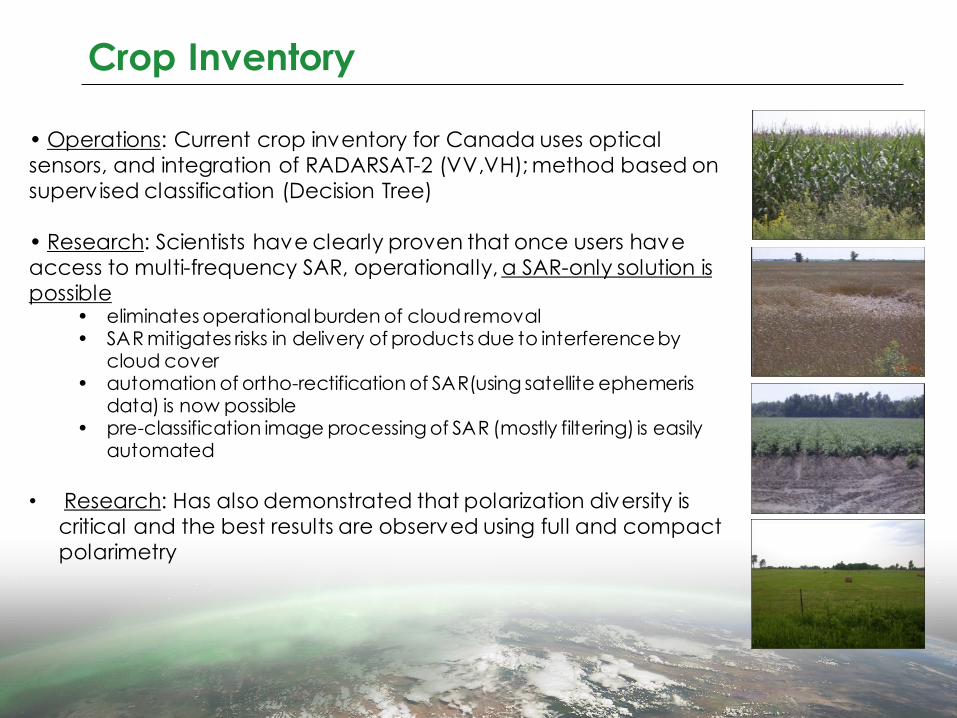
• Operations: Current crop inventory for Canada uses optical
sensors, and integration of RADARSAT-2 (VV,VH); method based on
supervised classification (Decision Tree)
• Research: Scientists have clearly proven that once users have
access to multi-frequency SAR, operationally, a SAR-only solution is
possible • eliminates operational burden of cloud removal • SAR mitigates risks in delivery of products due to interference by
cloud cover • automation of ortho-rectification of SAR(using satellite ephemeris
data) is now possible • pre-classification image processing of SAR (mostly filtering) is easily
automated
• Research: Has also demonstrated that polarization diversity is
critical and the best results are observed using full and compact
polarimetry
2013 National Crop Inventory - Completed by Earth Observation Unit
RADARSAT-2 usage
2010
– A
B a
nd S
K
2011
20
13
2012
Fiset te T, Rollin P, Aly Z, Campbell L, Daneshfar B, Filyer P, Smit h A, Davidson A, Shang J , Jarvis I (2013) AAFC annual crop invent ory: Status and challenges. The Second International Conference on Agro -
Geoinformatics 2013, Fairfax, Virginia, 12 - 16 August 2013
Several years of research (2004-2006) (by AAFC Research Branch) on 5 sites across Canada ensured that method was robust and repeatable over different cropping systems.
• temporal tracking of changes in crop condition • quantitative estimation of production indicators such as Leaf Area Index and biomass • identification of crop phenology and risk factors for crop disease
CV-580 June 28, 2000 (SK)
Impact of saturated soils on wheat and barley development
(causes oxygen deficiency in soil and loss of
N due to denitrification and leaching)
McNairn, H., Hochheim, K., and Rabe, N. 2004.
Applying Polar imetric Radar Imagery for Mapping
t he Productivity of Wheat Crops, Canadian Journal of Remote Sensing, 30 (3): 517-524.
CV-580 June 30, 1999 (ON)
Agreement between wheat yield monitor data and SAR response
Temporal Crop Condition Monitoring
• Most nations monitor crop condition using temporal
sequences of optical indices, usually NDVI
• Cloud cover necessitates temporal compositing to
remove clouds with the result being weekly or 10-day
NDVI products
• Research using RADARSAT-2 is demonstrating that
some radar parameters (HV intensity and
decomposition parameters) track crop growth in a
similar pattern as that observed from optical indices
such as the Soil Adjusted Vegetation Index (SAVI)
• SAR could augment or eventually replace optical
approaches
Typical MODIS-derived weekly NDVI product
from AAFC EO Unit
Temporal tracking of crop development using RADARSAT-2
(alpha angle)
Homayouni, H., McNairn, H., Wiseman, G., Shang, J ., and Powers, J . Time
Ser ies Analysis of Synt hetic Aperture Radar Polarimetric Dat a for Agricultural Crop Monit oring, in review.
Estimating Dry Biomass
• Above ground dry biomass is a strong indicator of
crop production
• Some radar parameters (HV intensity and
decomposition parameters) are strongly correlated
with biomass
• In addition, there are indications SAR responds to
crop conditions indicative of yield potential and disease risk
• canola flowering and pod development
• height of corn
• density of soybeans
• progression of wheat to milking and
dough stages
Wiseman, G., McNairn, H., Homayouni, H., and Shang, J . RADARSAT-2 Polar imetric SAR Response to Crop Biomass for Agricultural Production
Monit oring, IEEE Journal Of Selected Topics In Applied Earth Observations And Remot e Sensing, in press.
Correlations between RADARSAT-2 and crop dry biomass
SAR Parameter Canola
(n=64)
Corn
(n=107)
Soybean
(n=210)
HV 0.645 0.824 0.785
VOL 0.575 0.768 0.807
ENT 0.806 0.838 0.665
APH 0.803 0.833 0.662
RADARSAT-2 response to canola pod
development (top) and flowering (bottom)
Crop Condition: Leaf Area Index
0.01 0.015 0.02 0.025 0.03 0.035
1
2
3
4
5
6
Backscatter coefficient (power)
LA
I (m
2/m
2)
Soybean LAI vs backscatter coefficient of HV at FQ6
observed LAI>3
observed LAI 0-3
linear fit y=77*x-0.1
R2=0.82,RMSE=0.31
0.005 0.01 0.015 0.02 0.025 0.03 0.0350
0.5
1
1.5
2
2.5
3
3.5
4
Backscatter coefficient (power)
LA
I (m
2/m
2)
Corn LAI vs linear backscatter coefficient of HV at FQ6
observed LAI >3
observed LAI 0-3
linear fit y=137*x-0.5
R2=0.93,RMSE=0.28
• LAI is a strong indicator of crop productiv ity and is
linked through crop process models to yield and
biomass
• LAI from optical data have been assimilated into
yield models and have improved model estimates
• Gaps in access to optical data, especially early in
the season when growth accelerates, is
problematic
• SAR parameters sensitive to volume scattering (HV
intensity, entropy and F-D volume component)
have all proven to be highly correlated with LAI
• Track LAI until reproductive phase begins, then use
SAR to determine phenology changes
• HV is very sensitive to LAI , but are advantages in
using FP or CP configurations
Liu, C., Shang, J ., Vachon, P., and McNairn, H. 2013. Mult i-year crop monitoring using polar imetric RADARSAT-2 in IEEE Transact ions on Geoscience and Remot e
Sensing, 51(4): 2227-2240.
J iao, X., McNairn, H., Shang, J ., Pattey, E., Liu, J ., and Champagne, C. 2011. The
Sensit ivity of RADARSAT-2 Polar imetric SAR Dat a to Corn and Soybean Leaf Area Index in Canadian Journal of Remote Sensing, 37:69-81.
RADARSAT-2 response to LAI of corn and
soybeans over growing season
Correlation between RADARSAT-2 backscatter
and LAI of corn and soybeans
Estimating Leaf Area Index from RADARSAT-2
SAR modelling with Water Cloud Model Total backscattered by the whole canopy (σo ) at incidence angle (θ)
Vegetation component Soil component
t2 is the two-way attenuation through the canopy layer
L is the LAI, expressed in (m2m-2) A,B,C,D and E are model coefficients defined by experimental data (A,B, E
depend on canopy type)
• the parameterization of C and D, as determined by Jiao et al. (2011), was used (only one soil moisture station).
• remaining parameters (A, B, and E) simultaneously determined using a nonlinear least squares method in the
Matlab Curve Fitting Toolbox
)cos/2exp())cos/2exp(1(cos 00 BLBLAL soi
E
)1(cos 20 t E
veg AL
)cos/2exp(2 t BL
ssoil DMC 0
Inversion of WCM using RADARSAT-2 entropy
and ancillary soil moisture
Coupling WCM with soil moisture models
sclerotinia stem rot effects at harvest
(photos from canolawatch.org and canolacouncil.org)
10% bloom 50% bloom
Deriving Indicators of Crop Disease Risk
• Canola is susceptible to a host of diseases and infestations
• Sclerotinia stem rot affects canola when the crop is in bloom,
reducing yields up to 50%
• Canola is also susceptible to insect infestations at the pod stage
• Identifying fields at risk requires knowledge of meteorological and
soil moisture conditions, and information on crop phenology
0
1
2
3
4
5
6
7
VV
/HV
(po
wer
)
0
5
10
15
20
25
30
35
volu
me/
surf
ace
rati
o
RADARSAT-2
0
2
4
6
8
10
VV
/VH
(po
wer
)
0
10
20
30
40
50
Alp
ha
An
gle
(deg
rees
)
TerraSAR-X
McNairn, H., Wiseman, G., Powers, J ., Merzouki,
A., and Shang, J . 2014. Assessment of Disease
Risk in Canola using Mult i-Frequency SAR: Preliminary Results. Proceedings of EUSAR 2014 –
10t h European Conference on Synt hetic Apert ure Radar, 3-5 June 2014, Berlin, Germany.
2001-02 drought: cost the Canadian economy $5.8 billion 2010 excessive moisture in Canadian Prairies: reduced productive capacity of over 15 million acres, affecting 30,000 producers, resulting in production losses of more than $2.4 billion 2014: Close to 100 communities in Manitoba and Saskatchewan flooded; 400,000 hectares of farmland left unseeded (estimated). Manitoba declares state of emergency.
Response
Fed-Prov Programs for Agricultural Production Losses 2011-12: > $420M* spent by Agri-Recovery on climate related disasters mostly related to excess moisture. In addition, $895M spent on Crop Insurance programs. 2010-11: > $400M spent by Agri-Recovery on climate related disasters. In addition, $767M spent on Crop Insurance programs.
Soil Moisture
Soil Moisture Estimation with SAR
• AAFC Research focused on pre-
planting and post-harvest (without
significant vegetation)
• Current method has been tested
over multiple years and is now being
piloted in Manitoba
• What about moisture under
vegetation?
• Longer wavelengths offer best option
• De-coupling of surface from volume scattering
• “Simpler” scattering models like WCM
• More complex forward scattering models with crop specific LUTs (NASA, CONAE)
Merzouki, A., McNairn, H., and Pacheco, A. 2011. Mapping Soil Moisture Using RADARSAT-2 Dat a and Local Aut ocorrelation Statistics, Journal of Selected Topics in Earth
Observations and Remote Sensing, 4(1): 1-10.
Merzouki, A., McNairn, H., and Pacheco, A. 2010. Evaluat ion of Radar Backscatter Models over Agr icultural Fields: Validation using Polar imetric C-band RADARSAT-2 SAR Image Dat a, Canadian Journal of Remote Sensing, 36 (Suppl.2): S274-S286
Soil Moisture Calibration/Validation Real-time In-Situ Soil Monitoring for Agriculture
- RISMA -
Traditionally validation involves sending teams of 2 to measure soil moisture 2 hours of acquisition. To cover enough fields, crews of 8-20+ are needed. Temporal discontinuity if acquisitions are at dawn/dusk
Soil moisture research and
operations has migrated to
use of in situ networks to
assist in calibration and
validation.
Includes cal/val for both
SAR soil moisture products
and passive microwave
operational products (SMOS
and SMAP)
RISMA will be one of NASA’s
core cal/val networks for
SMAP active-passive
• Soil moisture measured in triplicate at: 0-5, 5, 20, 50, 100 cm
• Meteorological measurements: soil temperature, precipitation, air temperature, relative humidity, wind speed, wind direction
• Stations are at edge of field, but probes cabled 10-30m into field
• Site is hand-seeded as per crop planted in field
• Regular maintenance/spraying
• Hand harvested coincident with field harvest
RISMA • RISMA consists of 3 networks: two in western
Canada and one east of Ottawa
From: Patrick Rollin, AAFC
Data are recorded every 15 minutes, quality checked and calibrated, then distributed every hour Will be accessed by NASA for cal/val of SMAP active and passive microwave operational products
Data Access
Validation Using In situ Soil Moisture Networks
Station 1 - Real Dielectric Constant - 5cm (FQ5)
0
5
10
15
20
25
30
35
40
45
50
4/9/
2011
4/16
/2011
4/23
/2011
4/30
/2011
5/7/
2011
5/14
/2011
5/21
/2011
5/28
/2011
6/4/
2011
6/11
/2011
6/18
/2011
Die
lec
tric
Co
ns
tan
t
1-1 V51-2 H51-3 H52-5 V5FQ5A Dielec_MEAN
April 17
June 4
Time series of soil moisture from an eastern
Canada in situ station and estimated soil
moisture by RADARSAT-2 (red dots)
Validation of IEM Soil Moisture Estimates Using RISMA
RMSE (%) MAE (%) R
4.82 3.45 0.85
Errors Statistics – Hybrid Model
2011-2012
McNairn, H., Merzouki, A., Pacheco, A., and Fit zmaurice, J ., 2012. Monitoring Soil Moisture to Support
Risk Reduct ion for t he Agriculture Sector Using RADARSAT-2 in IEEE Journal of Selected Topics in Applied Eart h Observations and Remote Sensing, vol 5(3): 824-834.
20
Soil Moisture Retrieval Processing Chain
Research: AAFC, Science and Technology Branch (Ottawa and Winnipeg) 10+ years of research
Funding: Canadian Space Agency and AAFC
From Research to Implementation
- The Soil Moisture Toolkit
Industry Support (software engineering): Array Systems Computing Inc.
RADARSAT Tool Box
Soil Moisture Toolkit
Forward Modeling for Soil Moisture Retrieval
• FARO scanner re-creates crop 3-D
• Allows detailed crop geometry measurements
• Needed for forward modeling of scattering models to retrieve soil moisture (NASA’s approach for SMAP)
• AAFC has moved some applications towards operations (crop inventory) with others soon to follow (soil moisture)
• Research is reporting sensitivity of SAR to crop condition (via temporal monitoring or estimating crop production indicators such as LAI and biomass); methods to invert SAR response to estimate LAI and biomass under investigation
• Note: AAFC has been requested by the NASA SMAP cal/val team to lead a second field experiment post launch (SMAPVEX16)
Where do we go from here 1. Action to get the “easy” wins out the door while the science continues on more
complicated requirements, and on improving existing methods.
• What could be an “easy” win? – Integration of C-Band and optical (perhaps Sentinel-1(VV+VH) and Sentinel-2) using same/similar
approach as AAFC for large crop area mapping
– Method is robust and can use data from new sensors (RCM) once available
– Integration of multi-frequency (RADARSAT-2/Sentinel-1 and/or ALOS-2 and/or TerraSAR-X/Cosmo-
skymed) for regions where smaller SAR swaths do not limit mapping
• Soil moisture could be next, but still need to gain more confidence in results
(Canada, Argentina, U.S….others); however we are very close to being able to
implement. As long as errors are well understood. Methods can be highly
automated.
2. Capacity building and mentoring – Jumping from optical to SAR is not easy and should not be underestimated; a lot can go wrong if data
planning and processing are not done properly
– We need to transfer our knowledge and methods and this will take a committed and concerted effort
– Equally important, we need to understand the requirements of user community