SAR of 9-Amino-1,2,3,4-tetrahydroacridine-Based AcetylcholinesteraseInhibitors: Synthesis, Enzyme Inhibitory Activity, QSAR, and Structure-BasedCoMFA of Tacrine Analogues
Department of Pharmaceutical Sciences, University of Bologna, Via Belmeloro 6, I-40126 Bologna, Italy
Received December 22, 1999
In this study, we attempted to derive a comprehensive SAR picture for the class ofacetylcholinesterase (AChE) inhibitors related to tacrine, a drug currently in use for thetreatment of the Alzheimer’s disease. To this aim, we synthesized and tested a series of 9-amino-1,2,3,4-tetrahydroacridine derivatives substituted in the positions 6 and 7 of the acridine nucleusand bearing selected groups on the 9-amino function. By means of the Hansch approach, QSARequations were obtained, quantitatively accounting for both the detrimental steric effect ofsubstituents in position 7 and the favorable electron-attracting effect exerted by substituentsin positions 6 and 7 of the 9-amino-1,2,3,4-tetrahydroacridine derivatives. The three-dimensional(3D) properties of the inhibitors were taken into consideration by performing a CoMFA analysison the series of AChE inhibitors made by 12 9-amino-1,2,3,4-tetrahydroacridines and 13 11H-indeno[1,2-b]quinolin-10-ylamines previously developed in our laboratory. The alignment ofthe molecules to be submitted to the CoMFA procedure was carried out by taking advantageof docking models calculated for the interactions of both the unsubstituted 9-amino-1,2,3,4-tetrahydroacridine and 11H-indeno[1,2-b]quinolin-10-ylamine with the target enzyme. A highlysignificant CoMFA model was obtained using the steric field alone, and the features of such a3D QSAR model were compared with the classical QSAR equations previously calculated. Thetwo models appeared consistent, the main aspects they had in common being (a) theindividuation of the strongly negative contribution of the substituents in position 7 of tacrineand (b) a tentative assignment of the hydrophobic character to the favorable effect exerted bythe substituents in position 6. Finally, a new previously unreported tacrine derivative designedon the basis of both the classical and the 3D QSAR equations was synthesized and kineticallyevaluated, to test the predictive ability of the QSAR models. The 6-bromo-9-amino-1,2,3,4-tetrahydroacridine was predicted to have a pIC50 value of 7.31 by the classical QSAR modeland 7.40 by the CoMFA model, while its experimental IC50 value was equal to 0.066 ((0.009)µM, corresponding to a pIC50 of 7.18, showing a reasonable agreement between predicted andobserved AChE inhibition data.
Introduction
Tacrine (9-amino-1,2,3,4-tetrahydroacridine) is a re-versible inhibitor of acetylcholinesterase (AChE) thatwas launched in 1993 as the first drug for the symp-tomatic treatment of Alzheimer’s disease (AD).1 Therationale for its use was related to the elevation of theacetylcholine (ACh) levels that can compensate for thecholinergic deficit associated to the brain lesions presentin AD. Further outcomes of the so-called “cholinergichypothesis” are donepezil and rivastigmine, which havebeen marketed more recently for the treatment of thecognitive symptoms of AD2 (Chart 1).
Although a number of therapeutic possibilities areemerging aimed at an early intervention on the se-quence of neuropathological events leading to the ADdementia,3 no actual cure is presently available for thedisease. On the other hand, recent evaluations of theclinical effects of tacrine have shown efficacy in delayingthe deterioration of the symptoms of AD, while confirm-
ing the adverse events consisting mainly in the elevatedliver transaminase levels and in dose-related peripheralcholinergic effects.4
The study of tacrine analogues is still of interest tomedicinal chemists involved in AD research. In fact,quite recently, the possibility to design potent andselective bis-tetrahydroaminoacridine inhibitors of AChEwas demonstrated,5 and furthermore, McKenna et al.6modified tacrine in such a way as to obtain AChE
* To whom correspondence should be addressed. Tel: +39 0512099700. Fax: +39 051 2099734. E-mail: [email protected].
Chart 1. Drugs Presently Marketed for the Treatmentof AD
inhibitors able to inhibit 5-HT uptake as well. Despitethese achievements, few reports exist in the literaturedealing with systematic modification of the tetrahy-droaminoacridine nucleus in view of an assessment ofthe structure-activity relationships (SAR) of this classof compounds.7-13
In a recent paper,14 we performed a comparativeQSAR analysis of the main classes of AChE inhibitorsunder consideration for the use in the treatment of AD:physostigmine derivatives, tetrahydroaminoacridines,and benzylamines. The aim of the work was to individu-ate the physicochemical properties governing the inhibi-tory activity of such compounds and to build simpleregression models correlating inhibitory potency andproperties, to be subsequently used for the design of newinhibitors. As regards the tacrine analogues, we couldonly determine a dependence of the AChE inhibitoryactivity on the length of the 9-amino substituent, whilealmost no indications could be obtained about nuclearsubstitutions: the reason for this is that very fewtetrahydroaminoacridine analogues carrying ring sub-stituents have been synthesized and tested as AChEinhibitors.
To fill the gap in the SAR of tacrine analogues, wedecided to carry on our work on 9-amino-1,2,3,4-tet-rahydroacridine-based AChE inhibitors12,15 by synthe-sizing and testing a series of tacrine derivatives sub-stituted in positions 6 and 7 of the acridine nucleus andbearing selected groups on the 9-amino function (Chart2, general structure I). The biological data (IC50 valuesfor the inhibition of isolated human AChE) were thenstudied by means of the QSAR approach, in search forcorrelation equations describing the dependence of theAChE inhibitory activity on the physicochemical char-acteristics of the substituents. Moreover, we attemptedto obtain a three-dimensional (3D) quantitative descrip-tion of the SAR of tetrahydroaminoacridine derivativesusing the CoMFA method and including in the seriessome 11H-indeno[1,2-b]quinolin-10-ylamine derivatives(Chart 2, general structure II) recently developed in ourlaboratory.15 The outcome of the present work is acomprehensive qualitative and quantitative descriptionof the interaction of 9-amino-1,2,3,4-tetrahydroacridine-based AChE inhibitors with the enzyme, which com-pletes the picture of the SAR of this class of compounds.The AChE inhibitory activity of a new analogue syn-thesized for the purpose of testing the QSAR modelsconfirms the theoretical results.
Chemistry
Substituent Selection. The selection of the substit-uents to be introduced in positions 6 and 7 of theacridine nucleus and on the 9-amino function wasdictated by criteria of minimum effort and maximuminformative content. Following this line, we chose the
smallest number of easily synthetically accessible com-pounds which could give the maximum spread andorthogonality of the main physicochemical properties,i.e., the hydrophobic, steric, and electronic ones. Thislead us to synthesize 11 mono- and disubstituted tacrinederivatives (Table 1), some of which were already knownas AChE inhibitors. Notwithstanding this, compounds1-11 plus tacrine provided a set of 12 consistentlytested 9-amino-1,2,3,4-tetrahydroacridine derivativesbearing in positions 6 and 7 substituents that displayuncorrelated hydrophobic, electronic, and steric proper-ties, as shown by the squared correlation matrix of thedescriptors reported in Table 2.
Some of the above derivatives were further modifiedby inserting a substituent on the 9-NH2 group (com-pounds 12-22, Table 1). Such a modification wasintroduced in the 6- or 7-substituted analogues showingthe best anticholinesterase activity within the set. Asthe R groups, the benzyl and n-heptyl ones wereselected, which had already been tested as substituentsin the corresponding position of tacrine analogues byus15 and also by others.7,8,11
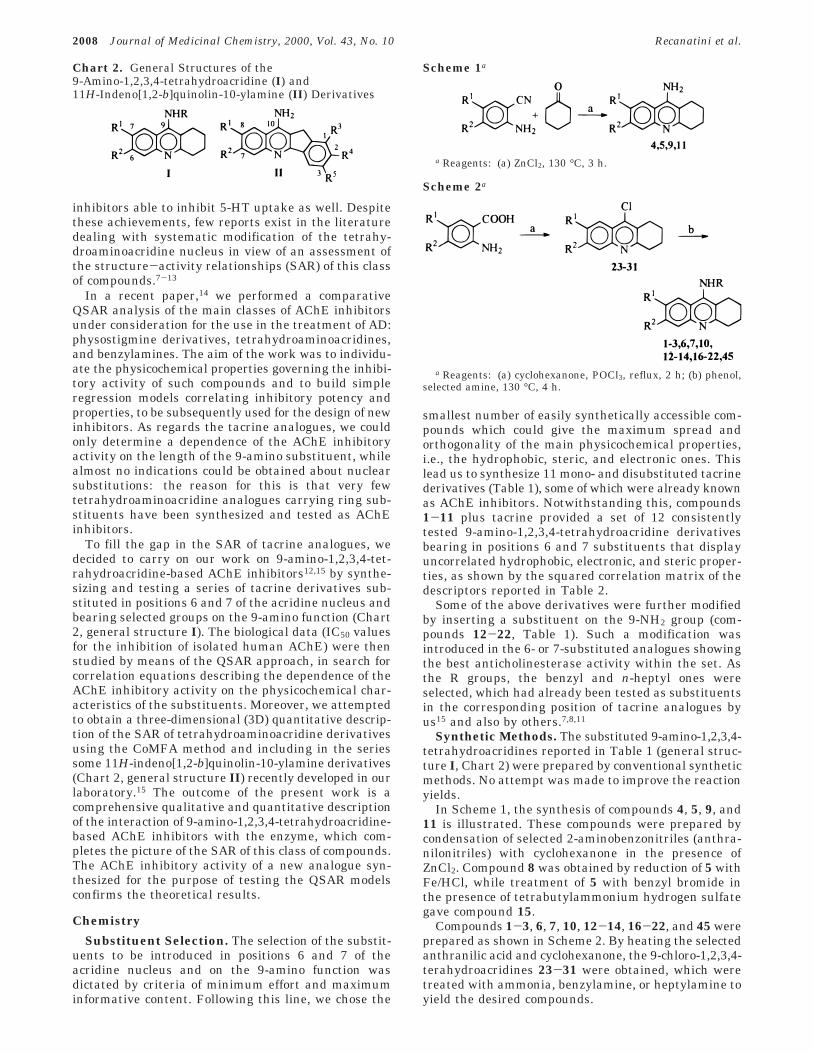
Synthetic Methods. The substituted 9-amino-1,2,3,4-tetrahydroacridines reported in Table 1 (general struc-ture I, Chart 2) were prepared by conventional syntheticmethods. No attempt was made to improve the reactionyields.
In Scheme 1, the synthesis of compounds 4, 5, 9, and11 is illustrated. These compounds were prepared bycondensation of selected 2-aminobenzonitriles (anthra-nilonitriles) with cyclohexanone in the presence ofZnCl2. Compound 8 was obtained by reduction of 5 withFe/HCl, while treatment of 5 with benzyl bromide inthe presence of tetrabutylammonium hydrogen sulfategave compound 15.
Compounds 1-3, 6, 7, 10, 12-14, 16-22, and 45 wereprepared as shown in Scheme 2. By heating the selectedanthranilic acid and cyclohexanone, the 9-chloro-1,2,3,4-terahydroacridines 23-31 were obtained, which weretreated with ammonia, benzylamine, or heptylamine toyield the desired compounds.
Chart 2. General Structures of the9-Amino-1,2,3,4-tetrahydroacridine (I) and11H-Indeno[1,2-b]quinolin-10-ylamine (II) Derivatives
Scheme 1a
a Reagents: (a) ZnCl2, 130 °C, 3 h.
Scheme 2a
a Reagents: (a) cyclohexanone, POCl3, reflux, 2 h; (b) phenol,selected amine, 130 °C, 4 h.
2008 Journal of Medicinal Chemistry, 2000, Vol. 43, No. 10 Recanatini et al.
The synthesis of the 11H-indeno[1,2-b]quinolin-10-ylamine derivatives of Table 4 (general structure II,Chart 2) is reported in ref 15. Not commercially avail-able substituted anthranilonitriles and anthranilic acidswere prepared from the corresponding anilines by theisatin route.
Results
The inhibitory activity against human erythrocyteAChE of 6-, 7-, and N9-substituted derivatives of the9-amino-1,2,3,4-tetrahydroacridine and of the referencecompound tacrine is reported in Table 1, expressed asIC50 values. For all the compounds studied, the inhibi-tion of AChE activity was very fast, not time-dependent(the 50% enzyme inactivation produced by the IC50concentrations following a 1-min incubation was notsignificantly (P > 0.01) different from the inhibitionobserved up to a 40-min incubation) and reversible.
SAR. It is evident that both the nature and theposition on the ring of the 6- and 7-substituents are ableto vary the biological activity of the unsubstitutedparent compound (tacrine). For example, it was alreadyknown9 that the chlorine atom in the 6-position stronglyincreases the inhibitory potency of tacrine, while the7-chloro analogue does not (compounds 4 and 3, respec-tively). We found a similar effect for both the CH3(compounds 2 and 1) and the NO2 groups (compounds6 and 5). Other substituents modify only slightly theinhibitory activity of tacrine, like 6-OCH3 (compound7), or decrease it, like 7-NH2 (compound 8), or increaseit, like 6-F (compound 9). As regards the double sub-stitution, in the case of the 6,7-dichloro derivative, itappears that the favorable effect of Cl in position 6 iscanceled by the presence of the second chlorine atom(compound 10). The same seems to hold for themonomethoxy (compound 7) and dimethoxy (compounds11) derivatives, as already reported by Del Giudice etal.11
The introduction of substituents on the 9-NH2 func-tion of the tetrahydroacridine nucleus was limited to
the benzyl and n-heptyl groups, as they can provide asubstantial increase of lipophilicity while showing dif-ferent steric characteristics. Moreover, we alreadystudied the effects of these substituents in a relatedseries of 11H-indeno[1,2-b]quinolin-10-ylamines.15 Inthe present work, we partially confirmed those results,as we found that the benzyl group decreases the AChEinhibitory effect for the 6-substituted tetrahydroacridineanalogues (compounds 13, 14, 16) and for the 7-CH3analogue (compound 12), while it causes a slight in-crease for the 7-NO2-substituted derivative (compound15). As regards the n-heptyl group, it strongly increasesthe activity of the 7-methyl analogue (compound 17) andleaves almost unchanged the inhibitory potency of theremaining 6-substituted compounds (compounds 18-22).
The qualitative SAR picture that emerges from theabove results can be summarized in a few points: (a)substituents in position 6 of the 9-amino-1,2,3,4-tet-rahydroacridine nucleus exert more favorable effects onthe AChE inhibitory activity than substituents in posi-tion 7; (b) the 6,7-disubstitution cancels the favorableeffect of the 6-substituent; (c) a benzyl group on the9-amino function generally leads to a lower inhibitorypotency, while a n-heptyl one does not have a substan-tial effect. Of course, the above points are tentativegeneralizations that can be contradicted by some singlecase (e.g., compound 17).
QSAR. With the aim to rationalize in terms ofphysicochemical properties the SAR of tacrine deriva-tives, we applied to the series of compounds under studythe classical Hansch analysis, looking for correlationsbetween the variation of inhibitory activity and thevariation of parameters describing the hydrophobic,electronic, and steric properties of the molecules.18 Asstated in the Introduction, the substituents in positions6 and 7 were selected in such a way as to provide anacceptable compromise between the maximum spreadof each property and the orthogonality of the variables(see Table 2). The parameters used in this study and
Table 1. Structural Data and AChE Inhibitory Activity (IC50) of the 9-Amino-1,2,3,4-tetrahydroacridine Derivatives
no. R R1 R2 formula yield, % mp, °C IC50 ( SE, µM
1a H CH3 H C14H16N2 20 223-225 8.1 ( 0.62 H H CH3 C14H16N2 30 220-222 0.10 ( 0.013 H Cl H C13H13ClN2 50 254-256b 0.55 ( 0.024 H H Cl C13H13ClN2 50 296-298c 0.0099 ( 0.00035 H NO2 H C13H13N3O2 50 264-266d 3.0 ( 0.26 H H NO2 C13H13N3O2 20 260-262 0.028 ( 0.0017 H H OCH3 C14H16N2O 50 181-183e 0.35 ( 0.018f H NH2 H C13H15N3 60 118-120 3.8 ( 0.29f H H F C13H13FN2 30 210-212 0.087 ( 0.00110 H Cl Cl C13H12Cl2N2 20 265-267 0.47 ( 0.0211 H OCH3 OCH3 C15H18N2O2 30 275-277g 5.2 ( 0.112 CH2C6H5 CH3 H C21H22N2 60 120-122 3.7 ( 0.213 CH2C6H5 H CH3 C21H22N2 50 245-247 0.75 ( 0.0314 CH2C6H5 H Cl C20H19ClN2 20 >300 dec 0.17 ( 0.0115 CH2C6H5 NO2 H C20H19N3O2 50 184-186 1.6 ( 0.116 CH2C6H5 H NO2 C20H19N3O2 30 166-168 4.8 ( 0.417 C7H15 CH3 H C21H30N2 30 48-50 0.39 ( 0.0318 C7H15 H CH3 C21H30N2 50 49-51 0.13 ( 0.0119 C7H15 H Cl C20H27ClN2 40 80-82 0.013 ( 0.00420 C7H15 H NO2 C20H23N3O2 20 66-68 0.29 ( 0.0221 C7H15 H OCH3 C21H30N2O 40 84-86h 0.46 ( 0.0122 C7H15 H F C20H27FN2 40 219-221 0.045 ( 0.002tacrine H H H 0.25 ( 0.01
a Ref 16. b Lit.9 mp > 230 °C dec. c Lit.9 mp 262-264 °C dec. d Lit.10 mp 197-198 °C. e Lit.11 mp 213-214 °C. f Ref 17. g Lit.11 mp 237-239 °C. h Lit.11 mp 92-94 °C.
from which the squared correlation matrix of Table 2was calculated are the substituent constants π, MR, F,and R, describing the hydrophobic, steric, and electronic(field and resonance) characteristics of the substituents,respectively. The π and MR values were assigned tosubstituents in each of the 6- and 7-positions, while todescribe the electronic effects also in the case of disub-stituted derivatives, the sum of the F and R values forthe two positions was used for all the compounds. Dueto the limited variation of the substituents on the 9-NH2function, we introduced two indicator variables, I-B andI-H, to take into account the presence of the benzyl orn-heptyl group, respectively. The complete list of theparameters used to derive the correlation equations isshown in Table 3, together with the activity datatransformed into pIC50 values.
As the first step in the derivation of a meaningfulQSAR model for tacrine analogues, we tried to calculatea correlation equation based on all the compounds ofthe series, and obtained eq 3 as the best significantcorrelation for the 23 compounds. The stepwise develop-ment of eq 3 is the following:
In the above equations and in all the other ones in thispaper, n is the number of data points from which theequation was calculated, r2 is the correlation coefficient,and s is the standard deviation of the regression; F(total)and F(partial) are the values of the Fisher’s test for theoverall significance of the equation and for the introduc-tion of the last variable, respectively.
Equation 3, which is the best one obtainable from thedata at hand, is actually a poor correlation equationexplaining only about the 67% of the variance of theAChE inhibition data. Moreover, the introduction of thelast variable, I-B, the indicator variable for the presenceof the benzyl group on the N9 atom, is significant onlyat the R > 0.05 level, as it is the introduction of theπ(R2) term in eq 2. These statistics point out some
weakness of the model, which, on the other hand, israther stable throughout the stepwise derivation, withregard to the regression coefficients associated to theMR(R1) and π(R2) variables.
From eq 3, one can obtain a first indication that thevariation of the pIC50 data is affected at least partly bythe steric properties (unfavorable) of the substituentsin position 7 and by the hydrophobic characteristics(favorable) of the substituents in position 6; the benzylgroup in position N9 contributes negatively to theactivity by decreasing the pIC50 values of about 0.7 logunit. Finally, eq 3 cannot be used for predictive pur-poses.
In an attempt to pursue a more precise descriptionof the effects of substituents in the critical 6- and7-positions of the tetrahydroacridine nucleus, we de-cided to study only the N9-unsubstituted compounds1-11 (plus tacrine). This was done considering that theconformational flexibility of both the benzyl and n-heptyl groups could make it questionable the choice ofproper physicochemical parameters for the 9-substitu-ents. The most significant equation obtained from the12 data points is eq 5, which contains the electronic termF(R1,R2) together with the MR(R1) term present also ineq 3:
Equation 5, although showing a rather high standarddeviation, can be considered as a statistically acceptableQSAR model; the introduction of the electronic param-eter F(R1,R2) can be regarded as significant at an R >0.01 level, the critical F1,9 value being equal to 10.56.For eq 5, we calculated also the cross-validated regres-sion coefficient by using the leave-one-out technique(q2
loo); considering its good value, one can be ratherconfident in the predictive power of the QSAR.
In eq 5, the most important term is again the MR(R1)parameter that confirms the detrimental effect of 7-sub-stituents on the AChE inhibitory activity. However,when the N9-substituted derivatives are excluded, theinductive (field) electronic effect of the 6- and 7-substit-uents comes into light: it seems that the formersubstituents increase the inhibitory activity of thecompounds by exerting an electron-attracting action(positive coefficient) on the tetrahydroacridine nucleus.There is no hydrophobic term in eq 3, which might meanthat the property is not important or, otherwise, thatthe series is not wide and/or varied enough to allow thateffect to be detected.
The picture emerging from eq 5 regards only theeffects of the substituents in positions 6 and 7 and itshows a negative steric influence on the AChE inhibi-tory activity carried out by groups in position 7 and afavorable electron-attracting effect exerted by the sub-stituents on the ring.
Table 2. Squared Correlation Matrix of the Parameters Usedin the QSAR Analysis
n ) 23 r2 ) 0.668 s ) 0.519 F3,19(total) ) 12.73F1,19(partial) ) 6.45
pIC50 ) -2.63((1.31)MR(R1) + 7.35((0.60) (4)
n ) 12 r2 ) 0.668 s ) 0.560 F1,10(total) ) 20.09
pIC50 ) -3.09((1.03)MR(R1) +
1.43((0.99)F(R1,R2) + 7.00((0.50) (5)
n ) 12 r2 ) 0.847 s ) 0.400 F2,9(total) ) 24.88
F1,9(partial) ) 10.52 q2loo ) 0.769
2010 Journal of Medicinal Chemistry, 2000, Vol. 43, No. 10 Recanatini et al.
3D QSAR. A further step toward both the definitionand the illustration of the SAR of tacrine analogues wasthe consideration of the 3D properties of the compounds.This was initially accomplished by using the compara-tive molecular field analysis (CoMFA)19 method thatallowed us to derive a 3D QSAR model for AChEinhibitors based on the 9-amino-1,2,3,4-tetrahydroacri-dine nucleus.
To carry out the analysis, we again decided to studyonly the 6- and 7-substituted compounds and to excludethe N9-substituted derivatives for the reason outlinedabove; that is because the conformational flexibility ofboth the benzyl and n-heptyl groups could render itdifficult and perhaps meaningless the individuation ofone putative active conformation. However, to extendthe database on which to perform the 3D analysis, weadded to the tetrahydroacridine set a series of 11H-indeno[1,2-b]quinolin-10-ylamine derivatives that wasrecently developed and published by us15 (Chart 2,general structure II; Table 4). These compounds can beconsidered as tacrine derivatives bearing substituentsin positions corresponding to the tacrine’s 6 and 7 andexpanding the polycyclic nucleus through the replace-ment of the tetrahydrophenyl moiety with an indenylone. By means of kinetic experiments, we have been ableto show that the indenoquinoline derivatives not sub-
stituted on the 10-amino function display the samemode of AChE inhibition as tacrine, i.e., a mixed typeinhibition.
The mutual alignment of the molecules to be submit-ted to the CoMFA procedure, which is the critical stepof the analysis,20 was carried out by taking advantageof docking models developed for the interaction oftacrine and of the parent unsubstituted 11H-indeno[1,2-b]quinolin-10-ylamine 32. Based on the X-ray coordi-nates of the tacrine-AChE complex21 and suitablymodifying the structure of the ligand, a starting modelof the indenoquinoline-AChE complex was built. Afterthe appropriate minimization and molecular dynamicssimulation steps, we could obtain a docking modelshowing the interactions between 32 and some criticalresidues of the AChE active site gorge.15 The samecomputational protocol was applied to the tacrine-AChE complex for consistency, and after superimposi-tion of the AChE backbone atoms of the two models,the ligands tacrine and 32 were extracted, each main-taining the orientation it assumes in the enzyme activesite. In Figure 1, the mutual orientation of the two par-ent molecules is shown as it resulted from the dockingexperiments. The alignment of the molecules for theCoMFA analysis was then obtained by superimposingeach analogue on the respective template, i.e., com-pounds 1-11 on tacrine and compounds 33-44 on 32.
To obtain the 3D QSAR equations, PLS analyses wereperformed using each of the steric and electrostaticCoMFA fields alone and also, as usual, in combination.The results of the analyses are shown in Table 5, fromwhich it is possible to see that the use of the steric fieldonly gave the best statistical result. Model 1 was thuschosen as the working CoMFA model, whose descrip-tivity and predictivity are assessed by the r2 value of0.817 and q2 value of 0.669, respectively. As in theQSAR model (eq 5), the standard deviation is ratherhigh, in both the cross-validated (scross) and non-cross-validated (s) cases.
The results of the comparative molecular field analy-sis can be illustrated by plotting the isocontour mapscalculated from the QSAR equation expressing the non-
Table 3. Activity Data and Parameters Used for Derivation of the QSAR Eqs 1-5
Table 4. Structure of the 11H-Indeno[1,2-b]quinolin-10-ylamine Derivativesa Used in the CoMFA Analysis
no. R1 R2 R3 R4 R5
32 H H H H H33 NH2 H H H H34 H NO2 H H H35 H NH2 H H H36 H Cl H H H37 H F H H H38 H H OCH3 H H39 H H H OCH3 H40 H H H H OCH341 H H CH3 H H42 H H H H CH343 H H H F H44 H H H Cl Ha Ref 15.
cross-validated model. The isocontours generated byinterpolating the STDEV*COEFF terms of the conven-tional CoMFA equation for the steric contribution areshown in Figure 2. CoMFA contour plots are shownsurrounding regions in the space around the templatestacrine (magenta) and 32 (orange), where the stericproperties of the molecules influence the AChE inhibi-
tory activity. The steric contours are colored greenwhere addition of steric bulk increases the activity andyellow where an increase of the inhibitor’s volumecauses a decrease of activity.
Considering the position of the isocontours in thespace around the reference molecules, it can be observedthat part of the steric effects significative for thevariation of the anticholinesterase activity of the seriesarise from the variation of the substituents located onthe quinolinic benzene of the molecules. In particular,a green favorable contour (Figure 2, left) is located in aposition corresponding mostly to the 6-substituents oftacrine and partly to the 8-substituents of 32. Theyellow unfavorable steric contours are mainly locatedover the 7-position of tacrine (Figure 2, top left) coveringan area that comprises also the NH2 function of theindenoquinoline analogues and partly corresponding tothe 7-position of 32 (Figure 2, bottom). Another relevantfavorable green volume surrounds the 2-, 3-, and 4-posi-tions of the tacrine derivatives (Figure 2, right) indicat-ing the higher activity of that subset of analogues.
The picture shown in Figure 2, if considered in all itscomponents (reference molecules and contours), sum-marizes on a statistical basis the 3D SAR for the twoseries of tacrine analogues. In fact, it shows how theprototype molecules are mutually oriented in order tobind to the same enzyme active site, and it also showswhich zones of the space around the overlapped mol-ecules are available or forbidden for a (steric) modifica-tion. The most interesting feature of the CoMFA modelis the individuation of the narrow sterically favorable“window” embedded between two sterically unfavorablezones and corresponding to the position occupied by the6-substituents of tacrine.
To get an objective validation of the two quantitativemodels developed to describe the SAR of tetrahydroacri-dine-based AChE inhibitors, we synthesized a newtacrine analogue whose experimentally determinedactivity was compared with that predicted by bothmodels. The previously unreported 6-bromo-9-amino-1,2,3,4-tetrahydroacridine (45) was predicted to have apIC50 value of 7.31 by the QSAR model (eq 5) and 7.40by the CoMFA model (steric field only). The experimen-tal IC50 value was 0.066 ((0.009) µM, corresponding toa pIC50 of 7.18. It may be concluded that the activityvalues calculated by the QSAR and 3D QSAR modelsare in reasonable agreement with the observed value,despite the fact that the QSAR equation uses a stericand an electronic parameter, while the CoMFA equationuses only the steric field. Interestingly, the QSAR modelapproaches the real value slightly more closely.
DiscussionSince the paper of Steinberg et al. on noncovalent
AChE inhibitors related to 9-amino-1,2,3,4-tetrahy-droacridine,7 only few articles have been publisheddealing with structural modifications of tacrine8-13,15 orwith bis-tetrahydroacridine derivatives.5 In our com-parative QSAR paper published in 1997,14 we pointed
Figure 1. Superimposition of the unsubstituted 9-amino-1,2,3,4-tetrahydroacridine (gray) and 11H-indeno[1,2-b]quino-lin-10-ylamine (white) resulting from the fitting of the en-zymes’ backbone atoms of the AChE-tacrine and AChE-32complexes, respectively.
Table 5. Summary of the CoMFA Results and Statistics
Figure 2. View of the steric CoMFA STDEV*COEFF contourmaps (model 1, Table 5). The region where increasing thevolume increases activity is green (0.020 level), and the regionwhere increasing the volume decreases activity is yellow(-0.040 level). The parent compounds 9-amino-1,2,3,4-tet-rahydroacridine (magenta) and 11H-indeno[1,2-b]quinolin-10-ylamine (orange) are shown for reference.
2012 Journal of Medicinal Chemistry, 2000, Vol. 43, No. 10 Recanatini et al.
out the lack of comprehensive SAR work on the tacrine-related class of inhibitors of AChE and indicated theneed to synthesize and test a set of carefully designedanalogues able to provide a sound basis for a QSARstudy. In this paper, we present such a group ofcompounds and derive a SAR picture by taking advan-tage of a number of computational techniques. Actually,it seemed to us that the QSAR approach could be moresuitable than a traditional SAR study for both rational-izing and summarizing the effects of structural varia-tions of the molecules on the anticholinesterase activity.Consequently, here we will discuss essentially the QSARand 3D QSAR results regarding the nuclear modifica-tions brought on the 9-amino-1,2,3,4-tetrahydroacridineparent structure.
As regards the QSAR analysis, the model to be takeninto consideration is that expressed by eq 5, and it wouldnot be the case to discuss eq 3, unless one noticed thatit contains the indicator variable I-B (accounting for thepresence of the benzyl group on the 9-amino group) witha negative coefficient. It might be observed that theappearance of this slightly negative effect exerted bythe 9-N-benzyl substituent is in agreement with thefindings of Steinberg et al.7 and Shutske et al.,8 whostudied the effects of amino substituents on 9-aminotet-rahydroacridine and 9-aminotetrahydroacridin-1-ol de-rivatives, respectively.
The common motif throughout eqs 1-5 is the presenceof the term MR(R1) bearing a negative coefficient. Thisindicates a negative steric effect carried out by anysubstituent in position 7 of tacrine, also reported byother authors.8,9,11 Interestingly, in the most statisticallysignificant eq 5, the presence of an electronic term(F(R1,R2), positive coefficient) indicates favorable electron-attracting effects caused by both the 6- and 7-substit-uents. The role of electron-attracting electronic effectson the interaction of 6-chlorotacrine with AChE waspointed out by Wlodek et al.,22 who, on the basis oftheoretical calculations, gave a tentative explanation ofsuch effects, suggesting that the reduced electron den-sity on the tacrine aromatic rings could favor π-electroninteractions with nearby residues, like Phe330 andTrp84.
A number of CoMFA models have already beenpublished on AChE inhibitors,23-26 but none dealsexclusively with 9-amino-1,2,3,4-tetrahydroacridine-related compounds. In three cases,24-26 the authorsperformed a structure-based alignment of the moleculesto be analyzed, which was allowed by the availabilityof the crystal structures of AChE-inhibitor complexes.We followed the procedure indicated by Cho et al.,24
fitting the coordinates of the crystallographically re-solved AChE-tacrine complex and those of the modeledAChE-11H-indeno[1,2-b]quinolin-10-ylamine complex.The resulting superimposition of the two prototypeinhibitors shown in Figure 1 was used as the templatefor the alignment of the respective derivatives. It isworth noting that a CoMFA analysis performed on thesame series of molecules aligned by superimposing theatoms of the aminoquinoline moieties common to thetwo subsets gave an unacceptably low q2 value (datanot shown). Notably, this was a case where a structure-based alignment lead to better results than a simple
“objective” atom-by-atom superimposition of the com-mon structural features of the molecules.
The reported CoMFA model is highly significant froma statistical point of view (Table 5), even if one calcu-lated pIC50 value deviates from the correspondingexperimental one by about twice the standard deviation(Table 6, compound 43, deviation CoMFA ) 0.82). Theanticholinesterase activity of 43 is strongly underpre-dicted, as are, even if at a lesser extent, the activityvalues of 32 (deviation CoMFA ) 0.64) and 37 (deviationCoMFA ) 0.62). These sensible differences between thecalculated and observed pIC50 values and, in general,the rather high standard deviation of the CoMFAequation might be a consequence of the alignmentstrategy, which is structure-based for the two prototypesbut atom-by-atom for their substituted analogues. Thismight lead to neglecting some subtle aspect of theenzyme-inhibitor docking, and it is likely to increasethe uncertainty in the estimate of the activity. Actually,Bernard et al.,26 studying a set of AChE inhibitors,found better CoMFA results when each of the trainingset molecules was individually docked into the enzymeactive site. However, the deviations of the F-substitutedcompounds 37 and 43 might also be due to the fact thatonly the steric field was used in the derivation of themodel. It is reasonable to hypothesize that the stericcharacteristics of the fluorine atom are not relevantenough to account for the observed variations of pIC50.
Another feature of the CoMFA model deserving acomment is the need of the steric field only to obtain astatistically satisfactory model. It appears from thestatistics reported in Table 5 that the electrostatic fielddid not contribute to the explanation of the variance ofthe activity data, such that it was not included in thederivation of the PLS model. In the previously publishedCoMFA analyses concerning AChE inhibitors, the re-sults regarding the relative field contributions are
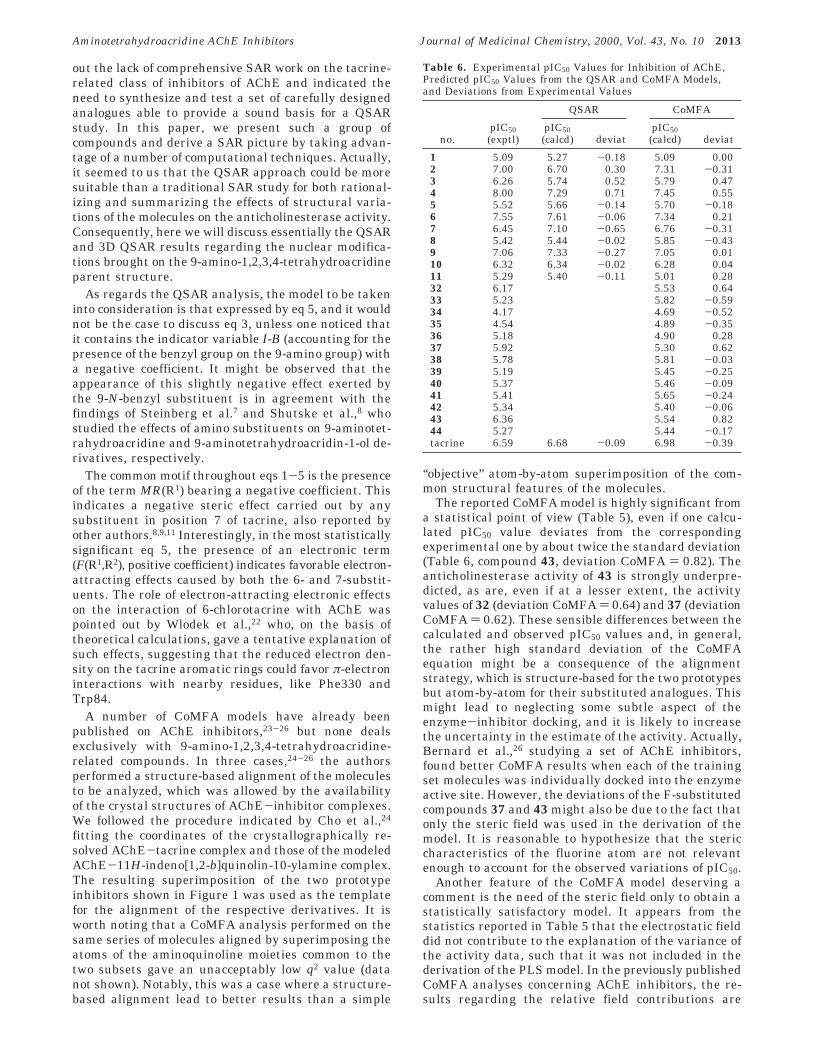
Table 6. Experimental pIC50 Values for Inhibition of AChE,Predicted pIC50 Values from the QSAR and CoMFA Models,and Deviations from Experimental Values
different, as it is reasonably expected considering thestructural differences of the training sets. In the modelof Bernard et al.,26 there is a prevalence of the electro-static field contribution (66.8% electrostatic, 33.2%steric), while in the model developed by Cho et al.,24 thesteric field contributes more, in both the conventionaland q2-GRS analyses. However, it is interesting to notethat Tong et al.,23 who studied the molecules (benzylpi-peridine derivatives) in both the neutral and protonatedstates, found a definitely greater steric field contribution(73.5% steric, 26.5% electrostatic) when the moleculeswere considered in the protonated form. We modeledthe molecules in the protonated state, as it is supposedthat 4-aminoquinoline-related derivatives are ionized onthe ring nitrogen atom at the pH of the biologicalexperiment.7 As may be inferred by the finding of Tonget al.,23 it is possible that the formal positive chargecarried by the molecules obscures the electronic effectsexerted by the substituents and levels off the electro-static field values that, accordingly, are not variedenough to provide a significant contribute in the PLSanalysis.
The QSAR and 3D QSAR models can be compared,to assess their consistency in describing the SAR of theAChE inhibitors studied in the present paper. Asoutlined above, the most reliable QSAR model is rep-resented by eq 5, which deals with 12 tacrine analogues(Table 1, compounds 1-11 plus tacrine); the featuresof the CoMFA model obtained from the 25 compoundsof Table 6 (tetrahydroacridines and indenoquinolines)are shown in Figure 2. The most relevant aspect thetwo models have in common is the individuation of the
strongly negative steric contribution of the substituentsin position 7 of the tacrine nucleus. The yellow area topleft of Figure 2 is perfectly consistent with the negativeMR(R1) term of eq 5. Of course, there is no possibilityto interpret the electronic term F(R1,R2) of the QSARequation with reference to the CoMFA model, whereasthe hydrophobic π(R2) term present in eqs 2 and 3 couldtentatively be viewed as a possible explanation of thesterically favorable green zone left in Figure 2. Theextreme caution required in considering the poorlysignificant eqs 2 and 3 needs however to be stressed.
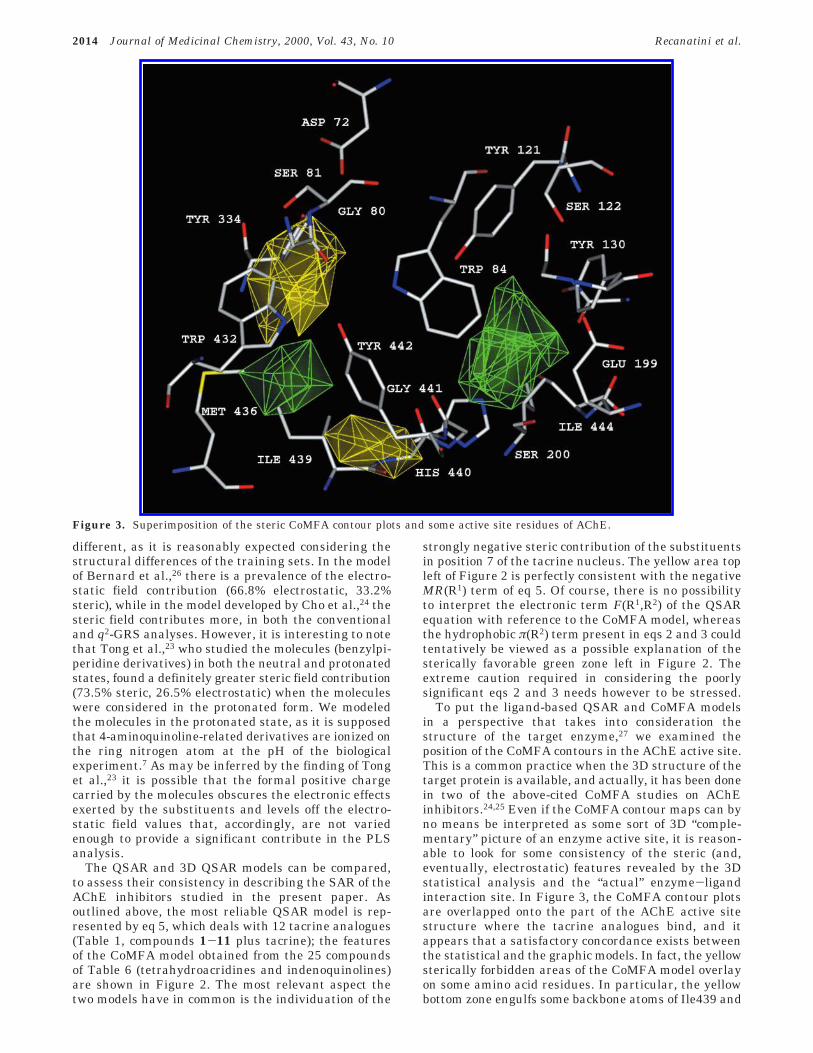
To put the ligand-based QSAR and CoMFA modelsin a perspective that takes into consideration thestructure of the target enzyme,27 we examined theposition of the CoMFA contours in the AChE active site.This is a common practice when the 3D structure of thetarget protein is available, and actually, it has been donein two of the above-cited CoMFA studies on AChEinhibitors.24,25 Even if the CoMFA contour maps can byno means be interpreted as some sort of 3D “comple-mentary” picture of an enzyme active site, it is reason-able to look for some consistency of the steric (and,eventually, electrostatic) features revealed by the 3Dstatistical analysis and the “actual” enzyme-ligandinteraction site. In Figure 3, the CoMFA contour plotsare overlapped onto the part of the AChE active sitestructure where the tacrine analogues bind, and itappears that a satisfactory concordance exists betweenthe statistical and the graphic models. In fact, the yellowsterically forbidden areas of the CoMFA model overlayon some amino acid residues. In particular, the yellowbottom zone engulfs some backbone atoms of Ile439 and
Figure 3. Superimposition of the steric CoMFA contour plots and some active site residues of AChE.
2014 Journal of Medicinal Chemistry, 2000, Vol. 43, No. 10 Recanatini et al.
His440, and the other yellow area occupies the spacearound some backbone atoms of Ser81 and the sidechains of Tyr334 and Trp432. On the contrary, the greensterically favorable volume on the right of the picturefills an empty volume of the enzyme active site. Re-markably, the left green zone occupies an area wherethe side chains of Met436 and Ile439 fall, and thisobservation is intriguing, because it again leads to thehypothesis that the positive steric interaction in thiszone can be interpreted as the possibility of a favorablehydrophobic contact between the substituents in posi-tion 6 of the tetrahydroacridine-derived inhibitors andthe mentioned residues. At the light of this hypothesis,the presence of the π(R2) term in eqs 2 and 3 might notbe exclusively seen as a mere statistical artifact.
Conclusions
In this study, we attempted to derive a comprehensiveSAR picture able to summarize the effects of theintroduction of substituents in some position of tacrine,the lead compound of a class of noncovalent AChEinhibitors. To achieve the goal, we synthesized andtested a number of substituted analogues that constitutea set of structurally varied compounds to be analyzedby means of the QSAR approach. Moreover, with theaim to obtain a 3D description of the QSAR of the class,we extended the training set of AChE inhibitors byadding to the tetrahydroacridines a set of recentlydeveloped indenoquinoline derivatives. The QSAR andCoMFA analyses provided two separate models thatshow a satisfactory consistency, pointing out two mainSAR aspects of the tetrahydroacridine-based AChEinhibitors: (a) the negative steric effect of substituentsin position 7 and (b) the relative steric freedom ofposition 6. The comparison of the two quantitativemodels with a 3D picture of the AChE active site derivedfrom the X-ray resolved structure supported thoseconclusions and allowed to hypothesize the possibilityof a hydrophobic interaction between some enzymeresidues and substituents in position 6 of tacrine. Thekinetic evaluation of the AChE inhibitory activity of anew tacrine derivative designed on the basis of both theclassical and 3D QSAR equations and purposely syn-thesized allowed us to assess the good predictivity ofthe models and to confirm the reliability of the SARconclusions.
It can be concluded that, for an important class ofAChE inhibitors, the proper selection of a small set ofcompounds and the application of QSAR techniques inconjunction with a 3D model of the target protein leadto a formulation of the SAR suitable for both descriptiveand predictive purposes.
Experimental SectionChemistry. General Methods. All melting points were
determined in open glass capillaries using a Buchi apparatusand are uncorrected. 1H NMR spectra were recorded in CDCl3
solution on a Varian Gemini 300 spectrometer with Me4Si asthe internal standard. Wherever analyses are only indicatedwith elements symbols, analytical results obtained for thoseelements are within 0.4% of the theoretical values.
Preparation of Compounds 4, 5, 9, and 11. A mixtureof selected anthranilonitrile (0.01 mol), cyclohexanone (0.01mol) and dry ZnCl2 (3 g) was heated at 120-130 °C for 3 h.After cooling, the reaction mixture was treated with water andthe separated solid, collected by filtration, was crystallized
from suitable solvent or purified by flash chromatography(silica gel 60, Merck, Darmstadt, Germany; ethyl acetate/methanol 9/1).
7,9-Diamino-1,2,3,4-tetrahydroacridine (8). A solutionof 5 (1.2 g, 5 mmol) in ethanol (50 mL) and HCl (1.5 mL) wasrefluxed and Fe (1.8 g) was added portionwise in 2 h. Thereaction mixture was refluxed 2 h and hot filtered. The solventwas evaporated at reduced pressure and the residue was takenup in water, treated with solid NaHCO3 and extracted withCH2Cl2. The solution was dried and evaporated to dryness toyield a solid which was crystallized from ethanol to give 0.63g (60%) of 8: mp 181-183 °C; 1H NMR δ 1.74-1.87 (m, 4H),2.43-2.56 (m, 2H), 2.78-2.84 (m, 2H), 5.32 (br, 2H, NH2), 6.89(br, 2H, NH2), 7.09-7.53 (m, 3H, Ar); MS m/z (relativeabundance) 213 (M+, 100), 197 (11.9), 185 (9.9). Anal. (C13H15N3)C, H, N.
7-Nitro-9-benzylamino-1,2,3,4-tetrahydroacridine (15).A solution of 5 (1.2 g, 5 mmol) in CH2Cl2 (100 mL) was treatedwith 50% NaOH solution, tetrabutylammonium hydrogensulfate (1.7 g, 5 mol) and benzyl bromide (0.86 g, 5 mmol) andthe reaction mixture was stirred at room temperature for 4 h.The organic layer was separated, washed with water, driedand evaporated to dryness. The residue, purified by flashchromatography (toluene-ethyl acetate 4/1), yielded 0.83 g(50%) of 15: mp 184-186 °C (toluene); 1H NMR δ 1.87-1.98(m, 4H), 2.58-2.62 (m, 2H), 3.05-3.11 (m, 2H), 4.62 (br, 1H,NH), 4.84 (s, 2H), 7.32-9.09 (m, 8H, Ar); MS m/z (relativeabundance) 333 (M+, 70.8), 242 (10.0), 91 (100). Anal.(C20H19N3O2) C, H, N.
General Method for the Preparation of Substituted9-Chloro-1,2,3,4-tetrahydroacridines 23-31. A mixture ofselected anthranilic acid (0.01 mol), cyclohexanone (0.01 mol)in POCl3 (10 mL) was refluxed for 2 h. The reaction mixturewas evaporated and treated with ice and NaHCO3 solid. Theseparated solid was taken up in ether. The solution waswashed with water, dried and evaporated. The residue waspurified by crystallization from petroleum ether or by flashchromatography to give the desired compounds.
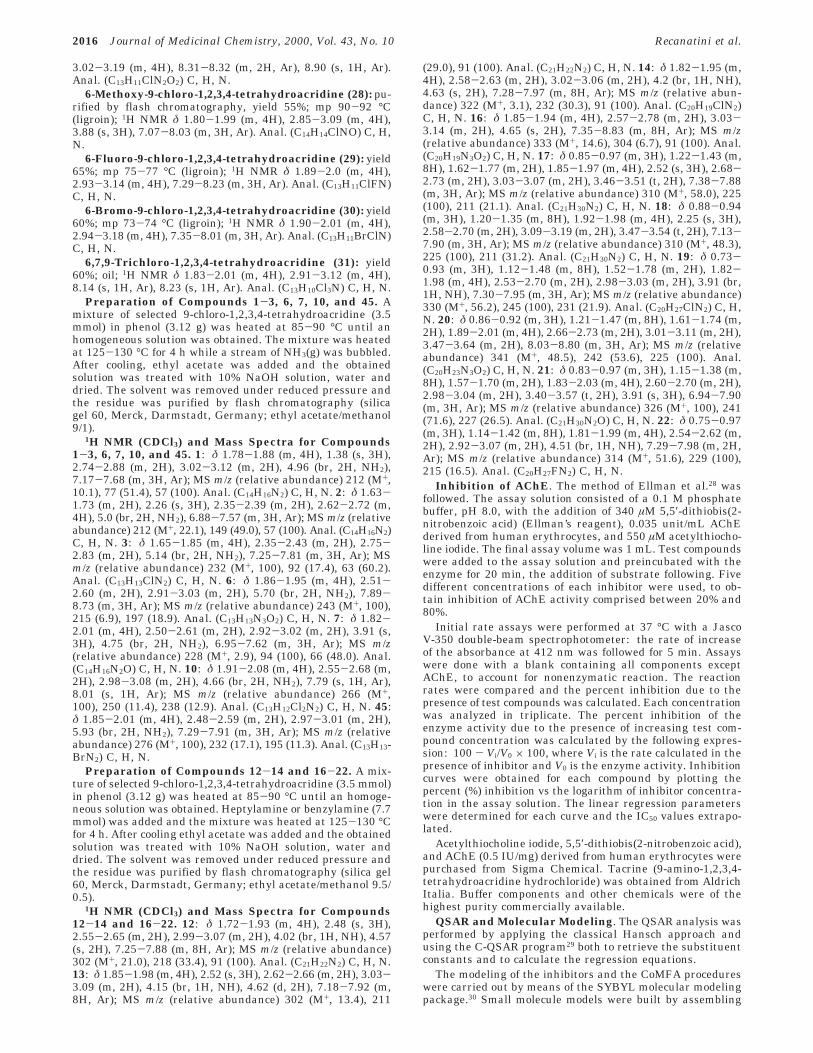
Preparation of Compounds 1-3, 6, 7, 10, and 45. Amixture of selected 9-chloro-1,2,3,4-tetrahydroacridine (3.5mmol) in phenol (3.12 g) was heated at 85-90 °C until anhomogeneous solution was obtained. The mixture was heatedat 125-130 °C for 4 h while a stream of NH3(g) was bubbled.After cooling, ethyl acetate was added and the obtainedsolution was treated with 10% NaOH solution, water anddried. The solvent was removed under reduced pressure andthe residue was purified by flash chromatography (silicagel 60, Merck, Darmstadt, Germany; ethyl acetate/methanol9/1).
Preparation of Compounds 12-14 and 16-22. A mix-ture of selected 9-chloro-1,2,3,4-tetrahydroacridine (3.5 mmol)in phenol (3.12 g) was heated at 85-90 °C until an homoge-neous solution was obtained. Heptylamine or benzylamine (7.7mmol) was added and the mixture was heated at 125-130 °Cfor 4 h. After cooling ethyl acetate was added and the obtainedsolution was treated with 10% NaOH solution, water anddried. The solvent was removed under reduced pressure andthe residue was purified by flash chromatography (silica gel60, Merck, Darmstadt, Germany; ethyl acetate/methanol 9.5/0.5).
Inhibition of AChE. The method of Ellman et al.28 wasfollowed. The assay solution consisted of a 0.1 M phosphatebuffer, pH 8.0, with the addition of 340 µM 5,5′-dithiobis(2-nitrobenzoic acid) (Ellman’s reagent), 0.035 unit/mL AChEderived from human erythrocytes, and 550 µM acetylthiocho-line iodide. The final assay volume was 1 mL. Test compoundswere added to the assay solution and preincubated with theenzyme for 20 min, the addition of substrate following. Fivedifferent concentrations of each inhibitor were used, to ob-tain inhibition of AChE activity comprised between 20% and80%.
Initial rate assays were performed at 37 °C with a JascoV-350 double-beam spectrophotometer: the rate of increaseof the absorbance at 412 nm was followed for 5 min. Assayswere done with a blank containing all components exceptAChE, to account for nonenzymatic reaction. The reactionrates were compared and the percent inhibition due to thepresence of test compounds was calculated. Each concentrationwas analyzed in triplicate. The percent inhibition of theenzyme activity due to the presence of increasing test com-pound concentration was calculated by the following expres-sion: 100 - Vi/V0 × 100, where Vi is the rate calculated in thepresence of inhibitor and V0 is the enzyme activity. Inhibitioncurves were obtained for each compound by plotting thepercent (%) inhibition vs the logarithm of inhibitor concentra-tion in the assay solution. The linear regression parameterswere determined for each curve and the IC50 values extrapo-lated.
Acetylthiocholine iodide, 5,5′-dithiobis(2-nitrobenzoic acid),and AChE (0.5 IU/mg) derived from human erythrocytes werepurchased from Sigma Chemical. Tacrine (9-amino-1,2,3,4-tetrahydroacridine hydrochloride) was obtained from AldrichItalia. Buffer components and other chemicals were of thehighest purity commercially available.
QSAR and Molecular Modeling. The QSAR analysis wasperformed by applying the classical Hansch approach andusing the C-QSAR program29 both to retrieve the substituentconstants and to calculate the regression equations.
The modeling of the inhibitors and the CoMFA procedureswere carried out by means of the SYBYL molecular modelingpackage.30 Small molecule models were built by assembling
2016 Journal of Medicinal Chemistry, 2000, Vol. 43, No. 10 Recanatini et al.
fragments from the program standard library and energy-optimized by means of the MOPAC AM1 method;31 partialatomic charges for all the compounds were also calculatedusing AM1.
The structure-based alignment of the parent compoundstacrine and 32 was obtained by fitting the backbones of theAChE-tacrine and AChE-32 complexes and then extractingthe two inhibitors from the enzyme active sites. The modelingprocedure of the AChE-32 complex, performed using theunited-atom AMBER* force field implemented in the Macro-Model Ver. 5.5 program,32 is reported in detail elsewhere15,33
and only summarized here. Briefly, the coordinates of theAChE-tacrine complex obtained from the X-ray structuredetermined using AChE from T. californica were retrievedfrom the Brookhaven Protein Data Bank (entry 1acj), and theresidue Phe330 was replaced by Tyr, to reproduce the humanAChE active site sequence. The inhibitor 32 was built byproperly modifying the structure of tacrine and docked intothe enzyme active site in the N10-protonated form. All theionizable residues of the enzyme were kept in the ionized state,and the water molecules present in the PDB file were alsomaintained in their original positions. The AChE-inhibitorcomplex was submitted to a molecular modeling protocol aimedat refining the position of 32 in the active site pocket.Minimizations and molecular dynamics (MD) simulations werecarried out on a core of unconstrained atoms around the activesite (8 Å) and on a shell of constrained atoms (energy penaltyforce constant of 100 kJ/Å2 mol-1) surrounding the core (6 Å).An initial minimization (2000 steps, steepest descent) and asubsequent temperature constant MD simulation (140 ps, 298K, 1.0-fs time step) were carried out. An equilibration time of60 ps was allowed before starting the data collection. The MDaverage structure of the last 80 ps was energy-minimized firstby steepest descent (3000 steps) and then by conjugategradient with a derivative convergence criterion of 0.05 kJ/Å2
mol-1. The same MD protocol was applied to the AChE-tacrine complex, to ensure the consistency of the dockingmodels.
The CoMFA fields were generated using an sp3 C atom witha +1 charge as the probe, the region was created automati-cally, and the default grid spacing was used (2 Å). Thestatistical analysis was performed by applying the PLSprocedure to the appropriate columns of the CoMFA tableand using the standard scaling method (COMFA_STD). Also,to reduce the actual number of column considered, energycutoff values of 30 kcal/mol were selected for both electro-static and steric fields and the minimum σ value was set to2.0. Cross-validated PLS runs were carried out for establishingthe optimum number of components to be used in the finalfitting models. The number of cross-validation groups wasalways equal to the number of compounds (leave-one-outtechnique), and the optimum number of components waschosen by considering the lowest standard error of prediction(scross).
Acknowledgment. This investigation was sup-ported by the University of Bologna (funds for selectedresearch topics) and by MURST.
References(1) Davis, K. L.; Powchik, P. Tacrine. Lancet 1995, 345, 625-630.(2) (a) Bartus, R. T.; Dean, L. D. III; Beer, B.; Lippa, A. S. The
Cholinergic Hypothesis of Geriatric Memory Dysfunction. Sci-ence 1982, 217, 408-417. (b) Siddiqui, M. F.; Levey, A.-I.Cholinergic Therapies in Alzheimer’s Disease. Drugs Future1999, 24, 417-424.
(3) Selkoe, D. J. Translating Cell Biology into Therapeutic Advancesin Alzheimer’s Disease. Nature 1999, 399, A23-A31.
(4) Gracon, S. I.; Berghoff, W. G. Cholinesterase Inhibition in theTreatment of Alzheimer’s Disease: Further Evaluation of theClinical Effects of Tacrine. In Pharmacological Treatment ofAlzheimer’s Disease. Molecular and Neurobiological Founda-tions; Brioni, J. D., Decker, M. W, Eds.; Wiley-Liss, Inc.: NewYork, 1997; pp 389-408.
(5) (a) Pang, Y.-P.; Quiram, P.; Jelacic, T.; Hong, F.; Brimijoin, S.Highly Potent, Selective, and Low Cost Bis-tetrahydroamina-crine Inhibitors of Acetylcholinesterase. J. Biol. Chem. 1996, 271,23646-23649. (b) Carlier, P. R.; Han, Y. F.; Chow, E. S.-H.; Li,C. P.-L.; Wang, H.; Lieu, T. X.; Wong, H. S.; Pang, Y.-P.Evaluation of Short-tether Bis-THA AChE Inhibitors. A Fur-ther Test of the Dual Binding Site Hypothesis. Bioorg. Med.Chem. 1999, 7, 351-357. (c) Carlier, P. R.; Chow, E. S.-H.; Han,Y. F.; Liu, J.; El Yazal, J.; Pang, Y.-P. Heterodimeric Tacrine-Based Acetylcholinesterase Inhibitors: Investigating Ligand-Peripheral Site Interactions. J. Med. Chem. 1999, 42, 4225-4231.
(6) McKenna, M.; Proctor, G. R.; Young, L. C.; Harvey, A. L. NovelTacrine Analogues for Potential Use against Alzheimer’s Dis-ease: Potent and Selective Acetylcholinesterase Inhibitors and5-HT Uptake Inhibitors. J. Med. Chem. 1997, 40, 3516-3523.
(7) Steinberg, G. M.; Mednick, M. L.; Maddox, J.; Rice, R. AHydrophobic Binding Site in Acetylcholinesterase. J. Med. Chem.1975, 18, 1056-1061.
(8) Shutske, G. M.; Pierrat, F. A.; Kapples, K. J.; Cornfeldt, M. L.;Szewczac, M. R.; Huger, F. P.; Bores, G. M.; Haroutunian, V.;Davis, K. L. 9-Amino-1,2,3,4-tetrahydroacridin-1-ols: Synthesisand Evaluation as Potential Alzheimer’s Disease Therapeutics.J. Med. Chem. 1989, 32, 1805-1813.
(9) Gregor, V. E.; Emmerling, M. R.; Lee, C.; Moore, C. J. TheSynthesis and In Vitro Acetylcholinesterase and Butyrylcho-linesterase Inhibitory Activity of Tacrine (Cognex) Derivatives.Bioorg. Med. Chem. Lett. 1992, 2, 861-864.
(10) Pirrung, M. C.; Chau, J. H.-L.; Chen, J. Discovery of a NovelTetrahydroacridine Acetylcholinesterase Inhibitor through anIndexed Combinatorial Library. Chem. Biol. 1995, 2, 621-626.
(11) Del Giudice, M. R.; Borioni, A.; Mustazza, C.; Gatta, F.; Meneguz,A.; Volpe, M. T. Synthesis and Cholinesterase Inhibitory Activityof 6-, 7-Methoxy- (and Hydroxy-) Tacrine Derivatives. Farmaco1996, 51, 693-698.
(13) Camps, P.; El Achab, R.; Gorbig, D. M.; Morral, J.; Munoz-Torrero, D.; Badia, A.; Banos, J. E.; Vivas, N. M.; Barril, X.;Orozco, M.; Luque, F. J. Synthesis, In Vitro Pharmacology, andMolecular Modeling of Very Potent Tacrine-Huperzine A Hybridsas Acetylcholinesterase Inhibitors of Potential Interest for theTreatment of Alzheimer’s Disease. J. Med. Chem. 1999, 42,3227-3242.
(14) Recanatini, M.; Cavalli, A.; Hansch, C. A Comparative QSARAnalysis of Acetylcholinesterase Inhibitors Currently Studiedfor the Treatment of Alzheimer’s Disease. Chem.-Biol. Interact.1997, 105, 199-228.
(15) Rampa, A.; Bisi, A.; Belluti, F.; Gobbi, S.; Valenti, P.; Andrisano,V.; Cavrini, V.; Cavalli, A.; Recanatini, M. AcetylcholinesteraseInhibitors for Potential Use in Alzheimer’s Disease: MolecularModeling, Synthesis and Kinetic Evaluation of 11H-Indeno-[1,2-b]-quinolin-10-ylamine Derivatives. Bioorg. Med. Chem. 2000,8, 497-506.
(16) Bielavsky, J. Single step preparation of 9-amino-1,2,3,4-tetrahy-droacridines. Czech. Patent 181,474, 1980; Chem. Abstr. 93,204471j.
(17) Kawakami, H.; Ohuchi, R.; Kitano, M.; Ono, K. Quinolinederivatives. Eur. Patent 268871, 1988; Chem. Abstr. 109,110275v.
(18) Hansch, C.; Leo, A. Exploring QSAR. Fundamentals and Ap-plications in Chemistry and Biology; ACS Professional ReferenceBooks; American Chemical Society: Washington, 1995.
(19) Cramer, R. D. III; Patterson, D. E.; Bunce, J. D. ComparativeMolecular Field Analysis (CoMFA). 1. Effect of Shape on Bindingof Steroids to Carrier Proteins. J. Am. Chem. Soc. 1988, 110,5959-5967.
(20) Cramer, R. D. III; DePriest, S. A.; Patterson, D. E.; Hecht, P.The Developing Practice of Comparative Molecular Field Analy-sis. In 3D QSAR in Drug Design. Theory, Method and Applica-tions; Kubinyi, H., Ed.; ESCOM: Leiden, 1993; pp 443-485.
(21) Sussman, J. L.; Harel, M.; Silman, I. Three-Dimensional Struc-ture of Acetylcholinesterase and of its Complexes with Anticho-linesterase Drugs. Chem.-Biol. Interact. 1993, 87, 187-197.
(22) Wlodek, S. T.; Antosiewicz, J.; McCammon, J. A.; Straatsma, T.P.; Gilson, M. K.; Briggs, J. M.; Humblet, C.; Sussman, J. L.Binding of Tacrine and 6-Chlorotacrine by Acetylcholinesterase.Biopolymers 1996, 38, 109-117.
(23) Tong, W.; Collantes, E. R.; Chen, Y.; Welsh, W. J. A Compara-tive Molecular Field Analysis Study of N-Benzylpiperidines asAcetylcholinesterase Inhibitors. J. Med. Chem. 1996, 39, 380-387.
(24) Cho, S. J.; Serrano Garsia, M. L.; Bier, J.; Tropsha, A. Structure-Based Alignment and Comparative Molecular Field Analysis ofAcetylcholinesterase Inhibitors. J. Med. Chem. 1996, 39, 5064-5071.
(25) Hasegawa, K.; Kimura, T.; Funatsu, K. GA Strategy for VariableSelection in QSAR Studies: Application of GA-Based RegionSelection to a 3D-QSAR Study of Acetylcholinesterase Inhibitors.J. Chem. Inf. Comput. Sci. 1999, 39, 112-120.
(26) Bernard, P.; Kireev, D. B.; Chretien, J. R.; Fortier, P.-L.; Coppet,L. Automated Docking of 82 N-Benzylpiperidine Derivatives toMouse Acetylcholinesterase and Comparative Molecular FieldAnalysis with “Natural” Alignment. J. Comput.-Aided Mol. Des.1999, 13, 355-371.
(27) Kim, K. H. Building a Bridge Between G-Protein-CoupledReceptor Modelling, Protein Crystallography and 3D QSARStudies for Ligand Design. In 3D QSAR in Drug Design: RecentAdvances; Kubinyi, H., Folkers, G., Martin, Y. C., Eds.; KLU-VER/ESCOM: London, 1998; pp 233-255.
(28) Ellman, G. L.; Courtney, K. D.; Andres, V.; Featherstone, R. M.A New and Rapid Colorimetric Determination of Acetylcho-linesterase Activity. Biochem. Pharmacol. 1961, 7, 88-95.
(29) C-QSAR, ver. 1.87; BioByte: Claremont, CA, 1994.
(30) SYBYL, ver. 6.5; Tripos Associates: St. Louis, MO, 1998.(31) Dewar, M. J.; Zoebisch, E. G.; Healy, E. F.; Stewart, J. J. P.
AM1: a New General Purpose Quantum Mechanical MolecularModel. J. Am. Chem. Soc. 1985, 107, 3902-3909.
(32) Mohamadi, F.; Richards, N. G. J.; Guida, W. C.; Liskamp, R. M.J.; Lipton, M. A.; Caulfield, C. E.; Chang, G.; Hendrickson, T.F.; Still, W. C. MacroModel - an Integrated Software Systemfor Modeling Organic and Bioorganic Molecules Using MolecularMechanics. J. Comput. Chem. 1990, 11, 440-467.
(33) Rampa, A.; Bisi, A.; Valenti, P.; Recanatini, M.; Cavalli, A.;Andrisano, V.; Cavrini, V.; Fin, L.; Buriani, A.; Giusti, P.Acetylcholinesterase Inhibitors: Synthesis and Structure-Activ-ity Relationships of ω-[N-Methyl-N-(3-alkylcarbamoyloxyphen-yl)methyl]aminoalkoxyheteroaryl Derivatives. J. Med. Chem.1998, 41, 3976-3986.
JM990971T
2018 Journal of Medicinal Chemistry, 2000, Vol. 43, No. 10 Recanatini et al.