22
Rising health spending but who benefits Presented by Sarina Fisher Centre for International Economics www.TheCIE.com.au 28 July 2015
| Date post: | 12-Aug-2015 |
| Category: |
Business |
| Upload: | informa-australia |
| View: | 98 times |
| Download: | 0 times |

Rising health spending but who benefits
Presented by Sarina Fisher
Centre for International Economics
www.TheCIE.com.au
28 July 2015
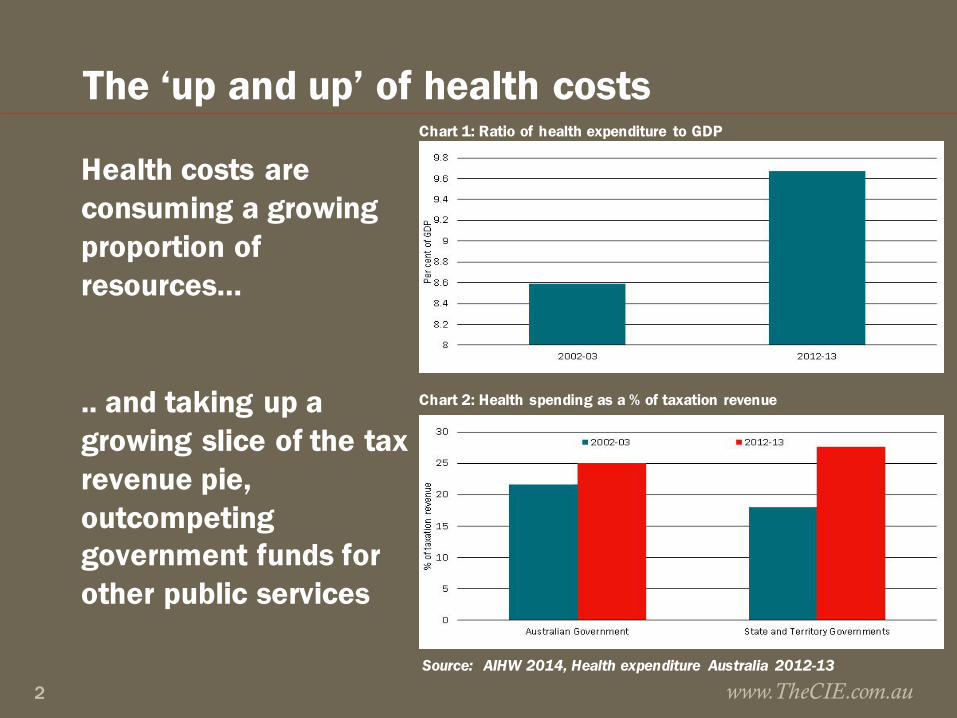
The ‘up and up’ of health costs
Health costs are consuming a growing proportion of resources…
.. and taking up a growing slice of the tax revenue pie, outcompeting government funds for other public services
www.TheCIE.com.au2
Chart 1: Ratio of health expenditure to GDP
Chart 2: Health spending as a % of taxation revenue
Source: AIHW 2014, Health expenditure Australia 2012-13

Dollar spend is rising and source of funds is changing, but little shift in spending profile
www.TheCIE.com.au3
0
20
40
60
80
100
120
140
160
2002-03
2003-04
2004-05
2005-06
2006-07
2007-08
2008-09
2009-10
2010-11
2011-12
2012-13
$ billion
Capital expenditure Other recurrent Primary care Hospitals
5.3%
5.3%
20.3%
20.3%
36.3%
38.1%
35.9%
38.0%
Very little change in the distribution of total spending by area of expenditure
5.3%
5.3%
20.3%
20.3%
36.3%
38.1%
35.9%
38.0%
Very little change in the distribution of total spending by area of expenditure
$147.4bn in 2012-13
Health spending continued to rise, up
64%over the past decade
Source: AIHW health expenditure database
Chart 3: Total expenditure on health, constant prices

Chart 4: Health spending by source
www.TheCIE.com.au4
0
10
20
30
40
50
60
70
2002-03
2003-04
2004-05
2005-06
2006-07
2007-08
2008-09
2009-10
2010-11
2011-12
2012-13
$ billion
Australian Government health expenditureState and Territory Government health expenditureNon-Government health expenditure
Average annual growth in spending per person2002-03 − 2007-08
Average annual growth in spending per person2008-09 − 2012-13
3.3 3.9 3.3 4.24.02.3
Consistent increase in non-Govt spending with growth in 2012-13 at a decade high
Source: AIHW health expenditure database
Everyone is spending more on hospitals■ Hospital spending accounts for 38% of health spending, but
takes the lions share of state and territory health budgets (70%), and is increasing as a share of non-government health spending (27%)
■ PHI’s hospital spending budget is increasingly making room for public hospital spending
■ Policy is driving up individual spending on hospitals. Following the 2008 increase in the MLS income threshold, growth in individual spending on hospitals has averaged 25%, compared to 6% for PHI and 4% for government
■ Individual spending on private hospitals has been strongest, averaging 31% p.a. over past 5 years, possibly reflecting the drift to exclusionary and excess/ co-payment products
www.TheCIE.com.au5

Chart 5: Spending on hospitals as a % of total funding by source
www.TheCIE.com.au6
Source: AIHW health expenditure database
37.0%
64.1%
25.2%
32.8%
69.5%
27.4%
AustralianGovernment
State andTerritoryGovernment
Non-Government
Outer rim = 2012-13 Inner rim = 2002-03
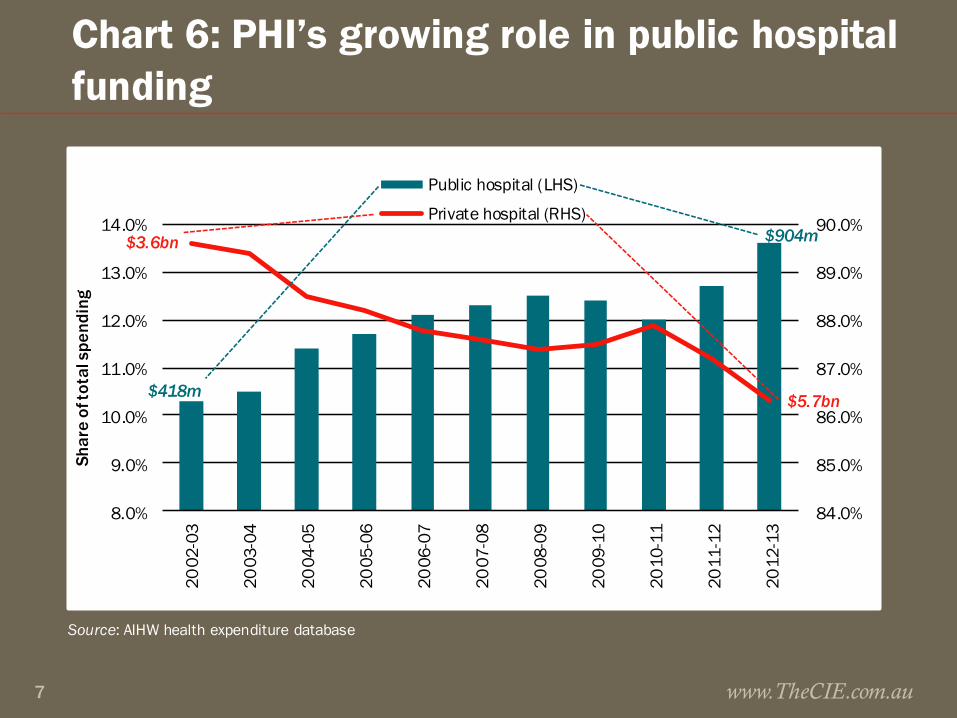
Chart 6: PHI’s growing role in public hospital funding
www.TheCIE.com.au7
Source: AIHW health expenditure database
84.0%
85.0%
86.0%
87.0%
88.0%
89.0%
90.0%
8.0%
9.0%
10.0%
11.0%
12.0%
13.0%
14.0%
2002
-03
2003
-04
2004
-05
2005
-06
2006
-07
2007
-08
2008
-09
2009
-10
2010
-11
2011
-12
2012
-13
Shar
e of
tota
l spe
ndin
g
Public hospital (LHS)
Private hospital (RHS)
$3.6bn
$5.7bn$418m
$904m

Key policy drivers impacting on individual health spend■ Medicare pays 75% of scheduled fee for private patients in
public/private hospital, and 85% of scheduled fee for a specialist, patients pay gap plus any above-schedule fee
■ 2010-11 Medicare levy introduced (1.5%). 1 July 2012 new income thresholds introduced with higher rates of the surcharge for high income earners
■ 1 July 2015, general patients pay $5 for each PBS prescription and $145.30 more to reach the safety net for concessional rate (lesser rises for concession card holders)
■ 1 July 2015, patients may pay (optional) $5 towards bulk billed standard GP consults and out-of-hospital pathology and imaging services. States and Territories allowed to introduce contributions for GP equivalent visits to EDwww.TheCIE.com.au8

Chart 7: Growth in private hospital funding, constant prices
www.TheCIE.com.au9
Source: AIHW health expenditure database
0
5
10
15
20
25
30
35
2002-03 –2007-08 2007-08 –2012-13
Ave
rage
ann
ual g
row
th in
hea
lth
spen
ding
per
per
son
(%)
Individuals PHI
$202m
$3.6bn$5.7bn
$1.5bn
ACTUALSPEND

PHI premium increases consistently above CPI because of benefits expenditure growth
www.TheCIE.com.au10
Source: Department of Health and ABS
0
1
2
3
4
5
6
7
8
2010 2011 2012 2013 2014 2015*
Annual % change
year to March 2015
Weighted average industry premium increase MBF Bupa CPI
Premium growth well above CPI
Source: Department of Health and ABS
Chart 9: Premium increases across the industry and for the largest PHIs

But as you would expect given growth in benefits expenditure
www.TheCIE.com.au11
Source: PHIAC
6 000
8 000
10 000
12 000
14 000
16 000
18 000
2009 2010 2011 2012 2013 2014
$
Chart 8: Hospital and General Treatment Benefits

Future cost of health care: … up some more
■ Currently >25% of Aust. Government spending is for health, age–related pensions and aged care
■ In GDP terms, Australian Government spending on health is forecast to rise the most in % of GDP terms, widening the spending gap between health and all other areas of Australian Government funding
www.TheCIE.com.au12

Health spending projections foretell ongoing pressure to share the funding burden
www.TheCIE.com.au13
Source: Commonwealth Treasury projections, Intergenerational Report 2015
0
1
2
3
4
5
6
2014-15 2024-25 2034-35 2044-45 2054-55
% of GDP
Health Aged careAge and service persions Other income supportEducation NDISPublic sector superannuation Defence
Health dominates spending growth
Chart 10: Projected Australian Government spending by category

Forecast spending confirms Govt emphasis on primary care, leaving increases in other spending to be met by non-Govt
■ No planned increase in real per person expenditure on the PHI rebate, which will be flat for next 15 years ($280 in 2014-15 to $283 in 2027-28
■ Medicare will growth the most from $855 to $1071 per person
■ Pharma spending to rise from $420 to $474 per person
■ Public hospital spending to rise from $647 to $680 per person
www.TheCIE.com.au14

Commonwealth prioritises primary care for growth spending
www.TheCIE.com.au15
Source: Treasury projections, International Report 2015.
0
200
400
600
800
1 000
1 200
Medicare services Pharmaceuticalspending
Funding for publichospitals
PHI rebate
2014-15 2027-28Strongest growth in
primary care and non-hospital interventions
Low and flat
Chart 11: Projected health spending per person, real terms
This signals wider purposeful shift away from hospital care to early intervention
■ Hospital and PHI funding increase only in line with population and CPI growth (CPI assumed to be < than premium ↑)
■ Medicare and pharmaceutical benefits increase in line with both CPI/population growth and non-demographic factors (in line with age based historical use patterns)
www.TheCIE.com.au16

Why are health costs rising like they are? .. mostly because of the things we do
■ Much talked about population ageing will fuel growth ■ Real health spending on 65+ to rise seven fold
■ Real health spending on 85+ to rise twelve fold
www.TheCIE.com.au17
■ But it is increasing demand for health services that really takes off
Chart 12: Australian Government spending on health: 2009-10 dollars
Source: Treasury projections, Intergenerational Report 2010

Most recent Treasury projections point to non-demographic factors driving health costs
■ Out to 2027-28 Treasury forecasts non-demographic factors will be the largest contributor (80%) to growth in real per person health spending
■ Ageing contributes just 10%■ Projected pharmaceutical benefits spending is four times
higher for 85+ years than the average person across all years
■ Projected public hospital spending is four times higher for 85+ years than the average person across all years
Source: Treasury projections from the 2015 Intergenerational Report www.TheCIE.com.au18
It is our needs, wants and options that are changing
■ Higher incomes bring increased preferences to consume more and/or better health services
■ Technology change increases demand and price (eg. Keyhole surgery is a better/more expensive way of treating same condition
■ Changes in disease rates (esp. chronic disease) increases demand for treatments
■ Wages growth >CPI leads to price growth in labour intensive industries, including hospitals and medical services
www.TheCIE.com.au19
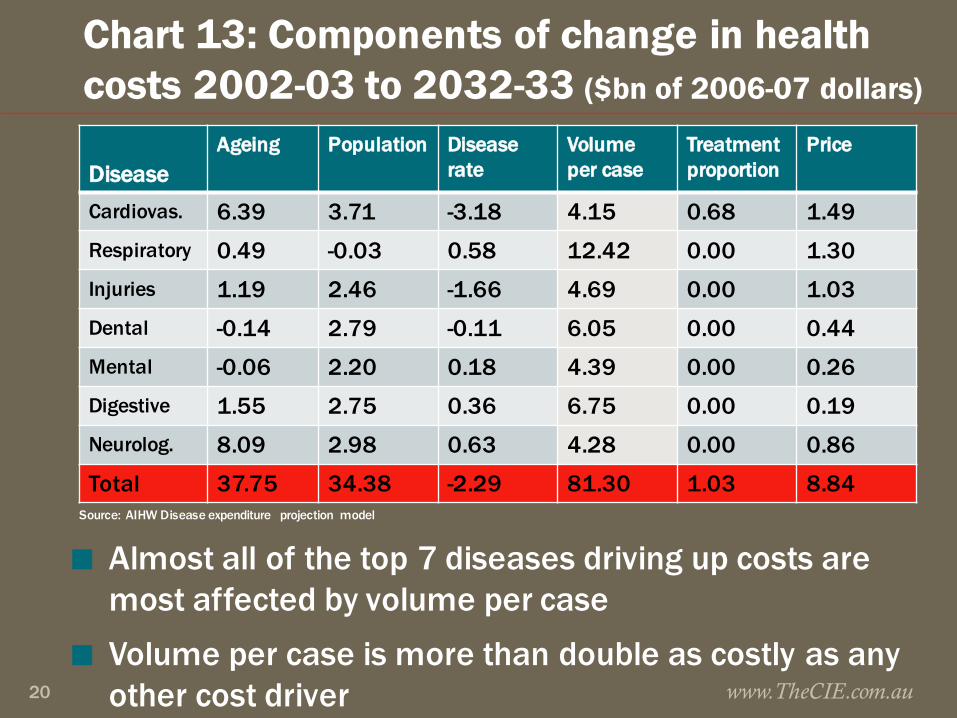
Chart 13: Components of change in health costs 2002-03 to 2032-33 ($bn of 2006-07 dollars)
DiseaseAgeing Population Disease
rateVolume per case
Treatment proportion
Price
Cardiovas. 6.39 3.71 -3.18 4.15 0.68 1.49Respiratory 0.49 -0.03 0.58 12.42 0.00 1.30Injuries 1.19 2.46 -1.66 4.69 0.00 1.03Dental -0.14 2.79 -0.11 6.05 0.00 0.44Mental -0.06 2.20 0.18 4.39 0.00 0.26Digestive 1.55 2.75 0.36 6.75 0.00 0.19Neurolog. 8.09 2.98 0.63 4.28 0.00 0.86
Total 37.75 34.38 -2.29 81.30 1.03 8.84
www.TheCIE.com.au20
■ Almost all of the top 7 diseases driving up costs are most affected by volume per case
■ Volume per case is more than double as costly as any other cost driver
Source: AIHW Disease expenditure projection model

Concluding thoughts..
■ Health spending pressure will make cost sharing inevitable, and price signals will increasingly be used to ration health services: look out for some rebalancing of the access vs quality compromise
■ Arguably unlikely to get additional Government sponsorship of PHI, policy momentum from sector likely to be to preserve the status quo
■ Can more be done to get more market signals into healthcare? Arguably yes, healthcare is very regulated but arguably mature enough to get equitable outcomes from greater market freedoms
www.TheCIE.com.au21


