SARS-CoV-2 detection status associateswith bacterial community composition inpatients and the hospital environmentClarisse Marotz1,2†, Pedro Belda-Ferre1,3†, Farhana Ali1, Promi Das1,2, Shi Huang1,3, Kalen Cantrell3,4, Lingjing Jiang3,5,Cameron Martino1,3,6, Rachel E. Diner1,2, Gibraan Rahman1,6, Daniel McDonald1, George Armstrong1,3,6,Sho Kodera1,2, Sonya Donato7, Gertrude Ecklu-Mensah1,2, Neil Gottel1,2, Mariana C. Salas Garcia1,2, Leslie Y. Chiang1,Rodolfo A. Salido8, Justin P. Shaffer1, Mac Kenzie Bryant1, Karenina Sanders1, Greg Humphrey1, Gail Ackermann1,Niina Haiminen9, Kristen L. Beck10, Ho-Cheol Kim10, Anna Paola Carrieri11, Laxmi Parida9, Yoshiki Vázquez-Baeza3,Francesca J. Torriani8, Rob Knight1,3,4,12, Jack Gilbert1,2,3, Daniel A. Sweeney13* and Sarah M. Allard1,2*
Abstract
Background: SARS-CoV-2 is an RNA virus responsible for the coronavirus disease 2019 (COVID-19) pandemic.Viruses exist in complex microbial environments, and recent studies have revealed both synergistic and antagonisticeffects of specific bacterial taxa on viral prevalence and infectivity. We set out to test whether specific bacterialcommunities predict SARS-CoV-2 occurrence in a hospital setting.
Methods: We collected 972 samples from hospitalized patients with COVID-19, their health care providers, andhospital surfaces before, during, and after admission. We screened for SARS-CoV-2 using RT-qPCR, characterizedmicrobial communities using 16S rRNA gene amplicon sequencing, and used these bacterial profiles to classifySARS-CoV-2 RNA detection with a random forest model.
Results: Sixteen percent of surfaces from COVID-19 patient rooms had detectable SARS-CoV-2 RNA, althoughinfectivity was not assessed. The highest prevalence was in floor samples next to patient beds (39%) and directlyoutside their rooms (29%). Although bed rail samples more closely resembled the patient microbiome compared tofloor samples, SARS-CoV-2 RNA was detected less often in bed rail samples (11%). SARS-CoV-2 positive samples hadhigher bacterial phylogenetic diversity in both human and surface samples and higher biomass in floor samples.16S microbial community profiles enabled high classifier accuracy for SARS-CoV-2 status in not only nares, but alsoforehead, stool, and floor samples. Across these distinct microbial profiles, a single amplicon sequence variant fromthe genus Rothia strongly predicted SARS-CoV-2 presence across sample types, with greater prevalence in positivesurface and human samples, even when compared to samples from patients in other intensive care units prior tothe COVID-19 pandemic.
* Correspondence: [email protected]; [email protected]†Clarisse Marotz and Pedro Belda-Ferre are joint first authors.13Division of Pulmonary, Critical Care and Sleep Medicine, Department ofInternal Medicine, University of California San Diego, La Jolla, CA, USA1Department of Pediatrics, School of Medicine, University of California SanDiego, La Jolla, CA, USAFull list of author information is available at the end of the article
Marotz et al. Microbiome (2021) 9:132 https://doi.org/10.1186/s40168-021-01083-0
Conclusions: These results contextualize the vast diversity of microbial niches where SARS-CoV-2 RNA is detectedand identify specific bacterial taxa that associate with the viral RNA prevalence both in the host and hospitalenvironment.
Keywords: Built environment, SARS-CoV-2, 16S rRNA, Microbiome, COVID-19
BackgroundSevere acute respiratory syndrome coronavirus 2 (SARS-CoV-2) is the causative agent of a novel infectious dis-ease, COVID-19, that has reached pandemic propor-tions. This pandemic has been characterized bysustained human to human transmission and has causedmore than 91 million cases and nearly 2 million deathsworldwide (as of 15 January 2020, WHO report).Viruses exist in complex microbial environments, and
specific virus-bacterium interactions have been increas-ingly documented in host-associated contexts. In theanimal microbiome, the gastrointestinal tract containsthe greatest number and density of bacteria, and manyvirus-bacterium interaction studies have therefore fo-cused on enteric viruses. Gut bacteria have been shownto directly modulate enteric virus infectivity via improv-ing thermostability [1], increasing environmental stabil-ity [2], and encouraging viral genetic diversity andfitness [3]. Virus-bacterium interactions have also beenobserved in upper-respiratory tract infections includinginfluenza A [4, 5] and oral human papillomavirus infec-tion [6]. Most recently, prevalent bacteria in the humanmicrobiome have been demonstrated to alter the humanglycocalyx, thereby modulating the ability of SARS-CoV-2 to bind host cells [7].In addition to observed virus-bacterium interactions in
the host, existing evidence suggests that bacteria in in-door spaces (the “built environment”) may also influenceviral stability or virulence. The risk of contracting SARS-CoV-2 is higher indoors than outdoors, particularly inpoorly ventilated areas [8], and the built environmenthas a distinct microbiome [9]. The built environmentmicrobiome is usually dominated by human-associatedmicrobes [10]. It is estimated that humans shed approxi-mately 37 million bacterial genomes per hour into theirbuilt environments [11]. In a study following the build-ing of a new hospital, it was discovered that indoorspaces were seeded with microbes from patients andhealth care workers [12]. Bacterial load was found topositively correlate with viral load across a variety of sur-face types and humidity conditions in the built environ-ment [13]. Given the nature of known virus-bacteriuminteractions, we hypothesized that associations betweenspecific bacteria and SARS-CoV-2 may also be detect-able in the built environment.Despite evidence that SARS-CoV-2 can persist on sur-
faces under controlled conditions for days [14], more
recent studies have demonstrated that fomite transmis-sion is relatively low-risk in real world conditions [15–17]. Nevertheless, SARS-CoV-2 RNA detection has beenwidely reported across hospital surfaces [18–20]. To testwhether specific bacterial taxa in the host or built envir-onment co-associate with SARS-CoV-2, we collectedsamples from hospital surfaces, patients, and health careworkers in the intensive care unit (ICU) and medical-surgical floor during the onset of the COVID-19 out-break, screened for viral RNA presence, and sequencedthe bacterial community.
ResultsSARS-CoV-2 RNA detection across surfaces and patientsamplesSample collection for SARS-CoV-2 RNA screening istypically performed using viral transport media contain-ing fetal bovine serum and a cocktail of antibiotics,which could negatively influence studies of bacteria andother microbes [21, 22]. For this study, swab sampleswere stored in 95% EtOH in order to inactivate the virusfor safe transportation [23] while stabilizing the micro-bial community [24]. A total of 972 samples were col-lected longitudinally from 16 patients with clinicallaboratory confirmed SARS-CoV-2 infection (118 sam-ples), 10 health care workers assigned to these patients(113 samples), and 734 hospital surfaces either inside orimmediately outside of the patients’ rooms over the spanof two months (Fig. 1A). The 16 patients (5 females and11 males) enrolled in this study ranged from age 20 to84, with a median age of 49.5 years (Fig S1). Approxi-mately 50% of patients were Hispanic/Latino, 31% werenon-Hispanic/Latino White, 13% were Black, and 6%were Pacific Islander. Of the patients for whom anti-biotic treatment information was collected, the majorityhad received at least one antibiotic. The number of daysspent in the hospital ranged from 1 to 25, with a medianstay of 9 days.Each sample was screened for the presence of SARS-
CoV-2 RNA using three distinct primer/probe sets: theU.S. Center for Disease Control N1 and N2 targets andthe World Health Organization E-gene target (seemethods). The US Food and Drug Administration has is-sued Emergency Authorization for more than 150 RT-qPCR assays for the detection of SARS-CoV-2, the ma-jority of which define a positive result as amplification ina single target [25]. Accordingly, we designated samples
Marotz et al. Microbiome (2021) 9:132 Page 2 of 15
as positive if at least one out of three targets amplifiedwith a Ct value below 40.Of the surfaces sampled, 13.1% contained detectable
SARS-CoV-2 RNA, including those touched primarily by
health care workers (keyboard, ventilator buttons, doorhandles inside, and outside the rooms) and those directlyin contact with the patient (toilet seats and bed rails). Asmall number of other surface samples were collected
Fig. 1 Summary of SARS-CoV-2 RNA detection in the dataset. A Schematic diagram of the experimental design highlighting the time frame forsample collection across sample types. B Percent and number of SARS-CoV-2 positives for each sample type collected from rooms occupied ornot occupied by patients with COVID-19. Not occupied includes both post-cleaning rooms and rooms currently occupied by a patient negativefor COVID-19. C Number of samples and SARS-CoV-2 screening results for 3 gene targets (N1, N2, and E-gene). D Boxplot of time-incorporatedprincipal scores on viral copies per swab for different sample types. Each dot represents the functional principal component score for each viralload trajectory over time, which was estimated from sparse functional principal components analysis on viral load over time; *p < 0.05, **p <0.01, ***p < 0.001, ****p < 0.0001, Wilcoxon signed-rank test. E Viral copies per swab relative to date of symptom onset across COVID-19 patientsample types, where only sample types with both n positive> 10 and % positive> 10% are included. F Viral copies per swab relative to date ofroom admission across hospital surface sample types, where samples from rooms occupied by a COVID-19 patient at the time of sampling areincluded. Again, sample types with both n > 10 and % positive> 10% are included
Marotz et al. Microbiome (2021) 9:132 Page 3 of 15
(room air intake filter, n = 13; tap water, n = 4; healthcare worker shoes, n = 2; ultrasound buttons, n = 2; in-side of veil box, n = 1), for which no SARS-CoV-2 RNAwas detected (Fig. 1B). Of the patients enrolled in thestudy, we collected at least one positive sample from 15/16 patients (nares, forehead, or stool) and from 14/15 as-sociated hospital rooms. In rooms where patient sampleswere not available, surfaces screened positive at leastonce for 6/6 COVID-19 patient rooms and 4/5 non-COVID-19 patient rooms. Floor samples had the highestpositivity rates (36% of samples collected from the floornear the patients’ bed, i.e., “Inside Floor”, and 26% ofsamples collected from the floor immediately outside ofthe patient room, i.e., “Outside Floor”) (Fig. 1B, Fig. S2).In some cases, SARS-CoV-2 RNA was detected on thefloors of rooms with non-COVID-19 patients and inrooms that had been cleaned following COVID-19 pa-tient occupancy (Fig. 1B, Fig. S3C).For the purposes of this study, viral load was defined
as viral copies per swab extrapolated from Ct values ofserially diluted viral RNA amplicons included on eachplate (see methods). The surface area swabbed for builtenvironment samples was consistent within sampletypes, and only three healthcare providers collected sam-ples to reduce variation in swabbing technique. Most ofthe positive surface samples amplified only one or twoout of the three SARS-CoV-2 targets (Fig. 1C) and hadsignificantly lower viral load over time compared to pa-tient nares and stool samples (p < 0.003, non-parametrictest from sparse functional principal components ana-lysis) [26], but similar viral load to patient forehead sam-ples (Fig. 1D). SARS-CoV-2 viral load tended todecrease slightly in patients over time (Fig. 1E) but wasdetectable in patient’s nares up to 27 days after symptomonset. For a COVID-19-positive patient’s stay, viral loadalso tended to decrease slightly on associated hospitalsurfaces including bed rails and floor samples butremained detectable up to 16 days after patient admis-sion (Fig. 1F). Due to high patient volume necessitatingimmediate room turnover, rooms were not left un-occupied long enough to collect repeated samplesafter patient discharge and room cleaning. The overallhigh Ct values on hospital surfaces suggest that thedetected SARS-CoV-2 viral RNA was likely not insufficient quantities to be infectious, consistent withprevious findings of hospital surfaces [18, 19]. Of 113health care worker samples, only one stool sampleamplified for one of the three viral targets. No othersamples collected from this health care worker, andno samples from any other health care worker treat-ing patients with COVID-19 had any viral target amp-lification. Moreover, no health care workers in thisstudy had detectable serum antibodies against SARS-CoV-2 during routine employee screening.
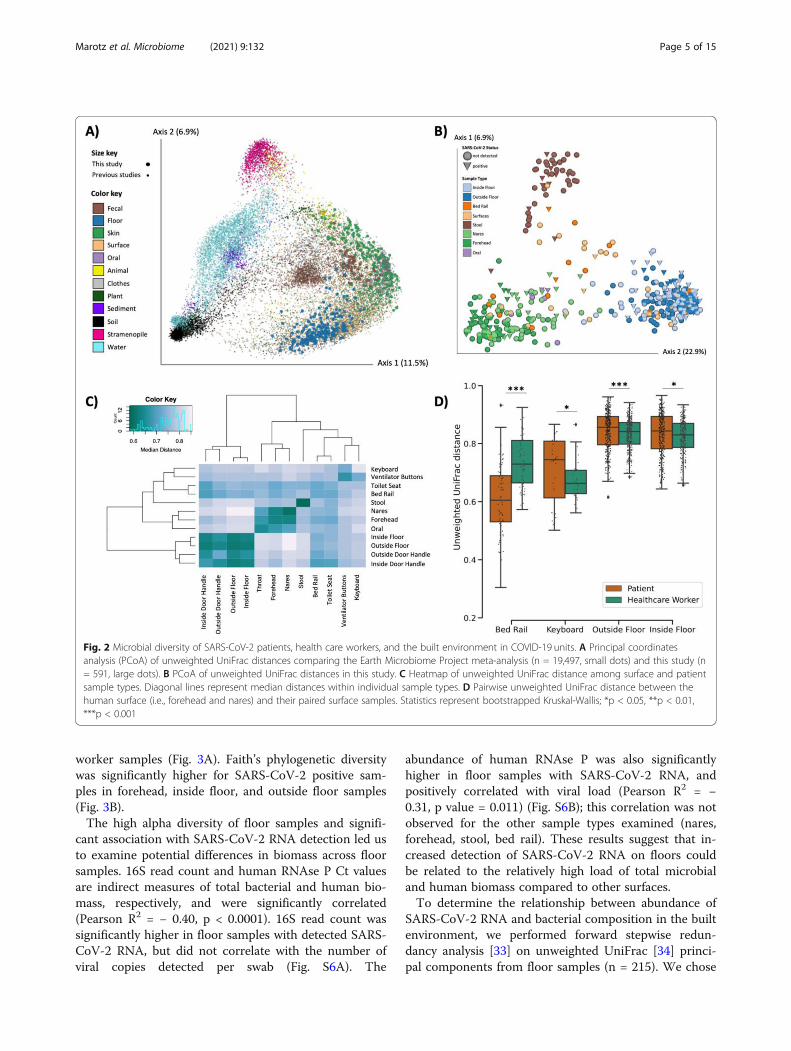
Microbial context of SARS-CoV-2 RNA detectionTo compare the built environment microbial communi-ties in this study to that in prior studies, we performed16S V4 rRNA gene amplicon (16S) sequencing on allsamples including both positive and negative controls toexclude failed samples according to the KatharoSeqprotocol (see methods) [27]. A total of 589 out of the972 samples passed quality filtering. Most of the sampledropouts were low biomass samples from surfaces in thebuilt environment (49% of hospital surface samples com-pared to 9% of human samples). Fewer samples thatfailed 16S sequencing were SARS-CoV-2 positive (6.7%)compared to samples that sequenced successfully(23.9%). A meta-analysis with samples from the EarthMicrobiome Project [28], an intensive care unit micro-biome project [29], and a hospital surface microbiomestudy performed at another hospital [12] (a total of 19,947 samples collected and processed using comparableand standardized Earth Microbiome Project methods[28, 30]) contextualized the microbial composition ofsamples from this hospital study and the microbial di-versity covered in this dataset (Fig. 2A). Using source-tracking [31] on the meta-analysis dataset, we found thatfloor samples, which clustered separately from the restof our dataset (Fig. 2C), were similar to built environ-ment samples from previous studies (Fig. S4).Beta diversity estimated using unweighted UniFrac dis-
tances [32] in this study showed that floor samples, stoolsamples, and nares/forehead samples formed three dis-tinct clusters with other surfaces falling between the hu-man skin and floor samples (Fig. 2B-C). SARS-CoV-2viral load was weakly correlated with unweighted Uni-Frac beta diversity (PERMANOVA R2 < 0.01, p value =0.043, Fig. S5).We compared beta diversity between human samples
and paired built environment samples from the patients’respective hospital rooms. As expected, microbial com-position of high-touch surfaces routinely used by health-care workers, such as keyboards and floor samples, weresignificantly more similar to health care worker samples,whereas samples from bed rails that are frequentlytouched by patients were significantly more similar tothe patient samples (Fig. 2D), reflecting likely inputs ofmicrobes to these communities. Notably, the percent ofSARS-CoV-2 positive bed rail samples was lower thanfloor (11% vs. 39%) despite the high similarity of bed railmicrobiomes to the corresponding patient microbiomes.
Microbial diversity and biomass positively associated withSARS-CoV-2Next, we tested whether bacterial alpha diversity is asso-ciated with SARS-CoV-2 RNA detection. Overall, Faith’sphylogenetic alpha diversity was significantly higheramong surface samples than patient or health care
Marotz et al. Microbiome (2021) 9:132 Page 4 of 15
worker samples (Fig. 3A). Faith’s phylogenetic diversitywas significantly higher for SARS-CoV-2 positive sam-ples in forehead, inside floor, and outside floor samples(Fig. 3B).The high alpha diversity of floor samples and signifi-
cant association with SARS-CoV-2 RNA detection led usto examine potential differences in biomass across floorsamples. 16S read count and human RNAse P Ct valuesare indirect measures of total bacterial and human bio-mass, respectively, and were significantly correlated(Pearson R2 = − 0.40, p < 0.0001). 16S read count wassignificantly higher in floor samples with detected SARS-CoV-2 RNA, but did not correlate with the number ofviral copies detected per swab (Fig. S6A). The
abundance of human RNAse P was also significantlyhigher in floor samples with SARS-CoV-2 RNA, andpositively correlated with viral load (Pearson R2 = −0.31, p value = 0.011) (Fig. S6B); this correlation was notobserved for the other sample types examined (nares,forehead, stool, bed rail). These results suggest that in-creased detection of SARS-CoV-2 RNA on floors couldbe related to the relatively high load of total microbialand human biomass compared to other surfaces.To determine the relationship between abundance of
SARS-CoV-2 RNA and bacterial composition in the builtenvironment, we performed forward stepwise redun-dancy analysis [33] on unweighted UniFrac [34] princi-pal components from floor samples (n = 215). We chose
Fig. 2 Microbial diversity of SARS-CoV-2 patients, health care workers, and the built environment in COVID-19 units. A Principal coordinatesanalysis (PCoA) of unweighted UniFrac distances comparing the Earth Microbiome Project meta-analysis (n = 19,497, small dots) and this study (n= 591, large dots). B PCoA of unweighted UniFrac distances in this study. C Heatmap of unweighted UniFrac distance among surface and patientsample types. Diagonal lines represent median distances within individual sample types. D Pairwise unweighted UniFrac distance between thehuman surface (i.e., forehead and nares) and their paired surface samples. Statistics represent bootstrapped Kruskal-Wallis; *p < 0.05, **p < 0.01,***p < 0.001
Marotz et al. Microbiome (2021) 9:132 Page 5 of 15
floor samples for this analysis since floor samples hadthe largest number and highest biomass of all surfacessampled (Fig. S7). Three non-redundant variables had asignificant effect size, explaining a total of 21.7% vari-ation in the data (Fig. S6C). The variable with the stron-gest effect size was patient identity (17.5%, p value =0.0002), which aligns with previous work demonstratingthat the built environment microbiome is contributedfrom the humans inhabiting that space [12]. Whetherthe sample was an inside floor sample (next to patientbed) or outside floor sample (hallway directly in front ofpatient room) also had a small, yet significant effect size(0.8%, p value = 0.04). Importantly, SARS-CoV-2 detec-tion status also significantly contributed to microbialvariation (3.4%, p value = 0.0004).
Unique microbial signatures predict SARS-CoV-2 acrosspatient sample typesTo identify microbial features associated with SARS-CoV-2 positive samples, we independently trained ran-dom forest (RF) classifiers on nares (N = 76), stool (N =44), and forehead samples (n = 79) from patients withCOVID-19 and health care workers. Based on 16S rRNAgene amplicon sequencing microbial profiles, the RFmodels predicted SARS-CoV-2 status (positive vs. notdetected) with 0.89 area under the receiver operatingcharacteristic curve (AUROC) in unseen nares samples(Fig. 4A). Strikingly, skin (AUROC = 0.79) and stool(AUROC = 0.82) also showed high classifier accuracy.As the SARS-CoV-2-negative samples were
overrepresented in the data, we also employed the areaunder the precision recall curves (AUPRC) to evaluatethe prediction performance of each classifier, which were0.76, 0.72, and 0.7 for nares, stool, and forehead, respect-ively (Fig. 4B). A RF model built from bacterial profileson the inside floor also showed a moderate predictionaccuracy for discriminating SARS-CoV-2 status(AUROC = 0.71; AUPRC = 0.6, Fig. 4A and B). RF clas-sifiers trained on outside floor and bed rail samples didnot perform well, especially in the precision-recall curves(Fig. S8).The phylogenetic relationship of the top 100 ranked
amplicon sequence variants (ASV) from the RF modelswere visualized with EMPress [35] (Fig. 4C). Stool andinside floor samples each had distinct sets of taxa drivingthe RF model compared to nares and forehead samples,which were more similar to one another. Many of thehighly ranked ASVs in the stool samples are from theclass Clostridiales, a polyphyletic group of obligate an-aerobes that were also identified as predictive of SARS-CoV-2 status in a wastewater study [36].ASVs from the genera Actinomyces, Anaerococcus,
Dialister, Gemella, and Schaalia were in the top 40ranked predictive features of both forehead and naressamples (Table S2); these taxa are normally found in an-terior nares samples [37–39], but are not commonly de-scribed in forehead microbiome samples. Interestingly,from Fig. 2C, we observed that the unweighted UniFracdistance between samples from the same individual’snares and forehead were more similar in rooms with
Fig. 3 Alpha diversity is higher in SARS-CoV-2 positive samples of each type. A Faith’s phylogenetic diversity (rarefied to 4000 reads per sample) ofhuman and surface samples over time, fitted with locally estimated scatterplot smoothing (LOESS) curves. B Faith’s phylogenetic diversity of humansand their surface samples grouped by SARS-CoV-2 screening results. Statistics resulted from Wilcoxon signed rank tests; *p < 0.05, **p < 0.01
Marotz et al. Microbiome (2021) 9:132 Page 6 of 15
SARS-CoV-2 positive surfaces, suggesting that patients whoshed virus into their environment could be cross-contaminating bacteria between nares and forehead (Fig. S9).One ASV with an exact match to Rothia dentocariosa
(GenBank ID CP054018.1) was highly ranked as predict-ive across all four disparate sample types: nares, fore-head, stool, and inside floor (Fig. 4C). There were a totalof 36 ASVs aligning to the genus Rothia, of which only 7ASVs were present in > 2% of samples. Of these, theonly ASV found to associate with viral presence was theRothia ASV presented here. Further investigation showsthis ASV is more prevalent in SARS-CoV-2 positivesamples across all sample types examined. To exclude
the possibility that this Rothia ASV was associated withsick patients generally, we examined the prevalence ofthis ASV in an intensive care unit microbiome study thatwas performed in 2016 [29] and found that high preva-lence of this Rothia ASV is specific to SARS-CoV-2 posi-tive patient samples (Fig. 4D). We also found thatpatients with cardiovascular disease comorbiditiestended to have higher prevalence of the Rothia ASV as-sociated with SARS-CoV-2, compared to patients with-out pre-existing cardiovascular disease (45% versus 26%,respectively). Rothia dentocariosa can cause endocarditis,particularly in patients with a history of cardiovasculardisease [40, 41]. Using data from the American Gut
Fig. 4 Bacterial composition is predictive of SARS-CoV-2 status in nares, forehead, stool, and inside floor samples. The prediction performance ofrandom forest classifiers on SARS-CoV-2 status for each sample type was assessed using AUROC (A) and AUPRC (B) for nares (n = 76), forehead (n= 79), stool (n = 44), and inside floor (n = 107), in a 100-fold cross-validation approach (see methods). C EMPress plot of the 100 features mostpredictive of SARS-CoV-2 status in nares, forehead, stool, and inside floor samples, where a single ASV with 100% alignment to Rothiadentocariosa was identified across all sample types. D Proportion of samples containing the highly predictive Rothia dentocariosa ASV in SARS-CoV-2 positive and negative samples from the current study and from [29] (ICU 2016 pre-COVID19)
Marotz et al. Microbiome (2021) 9:132 Page 7 of 15
Project [42], we tested for the presence of this RothiaASV in samples from those self-reporting a medicaldiagnosis of a cardiovascular disease and those self-reporting not having a cardiovascular disease. We ob-served a significantly higher prevalence of the RothiaASV in samples with a reporting of cardiovascular dis-ease (Fisher’s exact test, p = 0.041) than those without,suggesting that the Rothia ASV could be associated withcardiovascular disease outside of the context of SARS-CoV-2.
DiscussionThe COVID-19 pandemic continues unabated as out-breaks ebb and flow around the globe. Because evidencefor the synergistic effects of host-associated bacteria onmultiple viral pathogens continues to emerge, we set outto identify possible correlations between host- orsurface-associated bacteria and SARS-CoV-2 RNA pres-ence and abundance in the hospital built environment.At the onset of sampling, no hospital rooms or healthcare workers enrolled in the study had known exposureto SARS-CoV-2. Although both patient samples and sur-face samples from patient rooms tested positivethroughout the study, all samples collected from healthcare workers providing direct patient care to patientswith COVID-19 were negative by both clinical RT-qPCRand antibody tests (data not shown). This includes the 3health care workers who collected samples for the study.Aside from one stool sample where one of three viraltargets amplified in our screening, all health care workersamples in this study (n = 113) were negative for SARS-CoV-2, similar to findings from previous studies of ex-posed health care workers using airborne, contact, anddroplet protective PPE [43–45]. This contrasts with earlyreports of high SARS-CoV-2 transmission levels amonghealth care workers before the implementation of gen-eral hospital-wide masking of healthcare workers andpatients and of eye protection when interacting withunmasked patients [46, 47]. Our findings are thus con-sistent with other work directly testing the importanceof providing healthcare workers with appropriate PPEand rigorous training in donning and doffing proceduresto minimize self-contamination.The demographics of participants in this study
reflected global trends demonstrating that race and eth-nicity, as well as sex, influence susceptibility to SARS-CoV-2 as well as clinical outcomes. The majority of sub-jects enrolled were men, who are generally more at riskfor worse outcomes when infected by COVID-19 [48].Compared with the demographics of San Diego, the dis-tribution of patient ethnicities is in line with the CDCreporting that Black and Hispanic people are more likelyto be hospitalized with COVID-19 compared to non-Hispanic White people [49]. Due to sample size
constraints, analyses of the influence of these demo-graphics on SARS-CoV-2 prevalence and microbial asso-ciations with SARS-CoV-2 were not possible.In this study, approximately 16% (83/529) of surface
samples from hospital rooms occupied by patients withCOVID-19 and 6% (13/205) of surface samples fromhospital rooms not currently occupied by patients withCOVID-19 had detectable levels of SARS-CoV-2 RNA.Of the various surfaces sampled in this study, floor sam-ples had the highest prevalence of SARS-CoV-2 RNAdetection. The intense and frequent oropharyngeal, re-spiratory, skin, and bowel care provided to these critic-ally ill patients is expected to produce shedding andcontamination of the environment in close proximity tothe patient, including the floors. Our findings replicateprevious studies where floors had the highest prevalenceof SARS-CoV-2 RNA of all hospital room surfaces tested[20, 50]. Previous studies of environmental contamin-ation reported higher surface prevalence of SARS-CoV-2in hospital settings, ranging from 25% to over 50% [18,50–52]. The lower SARS-CoV-2 prevalence rates in thisstudy could be due to differences in sampling strategy(e.g., area sampled, storage and extraction methods),more careful environmental cleaning of high touch areasaround the patient, or due to physiological differencessince different surface types differentially influence viralRNA persistence [53]. Furthermore, contamination ofhospital room surfaces with SARS-CoV-2 tends to behighest during the first 5 days after symptom onset [50].All patients enrolled in our study had symptoms for atleast 6 days before admission to the hospital and enroll-ment in this study.While SARS-CoV-2 RNA was identified via RT-qPCR
for both patient and hospital room samples, it is import-ant to note that this study did not determine whetherthe detected viral RNA was viable or infectious. Twostudies assaying infectivity of surface and air samplesusing RT-qPCR in parallel showed that samples with Ctvalues over 30 were not infectious [18, 19]. In our study,only 2 out of 79 positive surface samples amplified atleast one SARS-CoV-2 target under 30 cycles. Both ofthese samples were from the floor directly next to thepatient bed in rooms that hosted patients who weremechanically ventilated during their stay.It should be acknowledged that transportation of sam-
ples in ethanol (to ensure the safety of those handlingsamples, as well as to enable microbiome analysis) in-stead of using viral transport media may have resulted inoverall lower viral RNA yield. Despite these potentialsources of variation, we found that the microbiomesfound on bed rails and corresponding patient micro-biomes were highly similar to one another before clean-ing, but this similarity disappeared after environmentalcleaning was performed. Microbial community
Marotz et al. Microbiome (2021) 9:132 Page 8 of 15
composition was also more similar between humans andthe surfaces they touched (including between health careworkers and keyboards, as well as patients and bed rails),supporting the robustness of our microbial sample col-lection and processing protocols.It is both a strength and a limitation of this study that
standard of care environmental cleaning was performedand was not influenced or altered by the study team.The daily cleaning regimen can vary depending on staffand other factors (hospital room surface types and disin-fection protocols are summarized in Table S1) which isrepresentative of hospital environmental practices world-wide. To limit additional burden on hospital staff, spe-cific cleaning events were not tracked, except forcleaning after patient discharge. SARS-CoV-2 RNA wasamplified from floor samples, albeit at a relatively lowabundance based on Ct values, even in rooms with non-COVID-19 patients and after patient discharge cleaning.Although transmission risk from the floor is likely negli-gible as discussed above, resuspension of particles fromthe floor in highly transited areas cannot be ruled out.In this study, the relatively high positivity rate for floorsamples allowed us to use them as a proxy to study howmicrobial communities are interrelated with shed virus.In the built environment, microbial load, human bio-
mass, and alpha diversity were higher in floor samplespositive for SARS-CoV-2. More controlled samplingprocedures are required to determine if the increasedalpha diversity associated with SARS-CoV-2 positivesamples is due to increased biomass or if it is more spe-cifically correlated with SARS-CoV-2 RNA presence.Floor samples had the highest biomass of all the surfacesamples tested, including high-touch surfaces (e.g., bedrail, keyboard, door handles). This may help explain thehigher prevalence of positive floor samples in COVID-19patient rooms (39%) versus bed rail samples (11%), des-pite their distance from the patient. This is in agreementwith previous research showing that bacterial and viralload are positively correlated in built environment sam-ples [13]. The relatively low prevalence of SARS-CoV-2contamination on bed rail samples may also be becausemany of the patients were deeply sedated and were notactively moving in bed, including touching the bed rails,or because high touch areas in close proximity to the pa-tient are cleaned by nurses at each shift, and/or due todifferences in material (vinyl versus plastic).Using random forest models to classify microbes asso-
ciated with SARS-CoV-2 RNA detection, we found 16Smicrobial profiles had high predictive accuracy of SARS-CoV-2 RNA presence in nares, stool, forehead, and in-side floor samples. Despite these sample types havingdistinct microbiomes covering a broad range of micro-bial diversity (Fig. 2), we identified a single Rothia ASVthat was highly ranked in the random forest classifier
across all four sample types. This ASV was also moreprevalent in SARS-CoV-2 positive samples across all hu-man sample types and floor and bed rail samples in ourdataset. By comparing the prevalence of this ASV acrossour dataset and a 2016 study from an intensive care unit[29], we found that this signal is specific to SARS-CoV-2positive samples, and not other factors associated withan ICU admission such as antibiotic use. This findingsupports previous work reporting Rothia to be enrichedin SARS-CoV-2 positive stool [54] and bronchoalveolarlavage fluid [55] and further suggests a role in nares,forehead, and surfaces. These results further suggest thatthere may be species- or strain-level specificity to thesedynamics.While the mechanism remains unclear, the consistent
Rothia ASV prevalence trend across both patient andsurface sample types suggests an association of this bac-teria with SARS-CoV-2. Although this study was carriedout at a single hospital, and built environment micro-biomes tend to vary based on location and occupancy[56], previous research into the clinical relevance ofRothia species indicates that this association warrantsfurther investigation. Species from the genus Rothia arecommon to the human oral microbiome [57], but havealso been identified as opportunistic pathogens [40].Oral microbes have been found to colonize the gastro-intestinal tract, especially in disease states [58]. This,along with our finding of the predictive nature of theRothia ASV in stool, may suggest a possible increasedoral-fecal transmission triggered under viral infectionthat manifests as a hallmark of COVID-19. Furthermore,the specific Rothia ASV identified in this study appearsto associate with cardiovascular disease even in peoplewithout SARS-CoV-2 infection, indicating that Rothiamay be a marker for individuals at increased risk fromCOVID-19. Cardiovascular disease can predispose indi-viduals to worse outcomes with COVID-19, and SARS-CoV-2 infection has been associated with cardiovascularcomplications [59]. Further studies are required to deter-mine the mechanism underlying the association betweenRothia and SARS-CoV-2, the role of co-morbidities, andhow this knowledge may be translated into effectivemethods for reducing SARS-CoV-2 virulence.To better understand how virus-bacteria interactions
influence pathogen infection, transmission, and healthoutcomes, studies using animal models could be usefuland ultimately lead to the development of effective clin-ical interventions. In built environments, the findingsfrom our study highlight the need to better understandviral distribution patterns and how bacterial distributionand abundance influence the persistence and viability ofviruses, especially in the context of human health. Hos-pitals are promising study sites for these investigations,as they contain patients harboring known diseases,
Marotz et al. Microbiome (2021) 9:132 Page 9 of 15
environmental factors are kept fairly consistent andregularly monitored, and standard of care consistencyacross facilities may allow for some extrapolation beyondeach specific building investigated. These future studiescould illuminate the development of viral pathogen miti-gation strategies in both patients and the builtenvironment.
ConclusionsThis large-scale study is the first to examine the micro-bial context of SARS-CoV-2 in a hospital setting. We de-tected SARS-CoV-2 RNA contamination across a varietyof surfaces in the ICU and the general medical-surgicalunit, including rooms that were not currently used totreat patients with COVID-19 infection. RT-qPCR re-sults are not indicative of infectious virus; nevertheless,we were able to identify bacterial signatures predictive ofSARS-CoV-2 RNA detection using a random forestmodel. Across a remarkable diversity of microbiomes(floor, nares, stool, skin), we identified a single bacterialASV, Rothia dentocariosa, that was highly predictive ofand co-identified with SARS-CoV-2 RNA. Our discoveryof bacterial associations with SARS-CoV-2 both inhumans and the built environment suggests thatbacteria-virus synergy likely plays a role in the COVID-19 pandemic.
Materials and methodsStudy designPatients admitted to the UCSD Medical Center - Hill-crest who were either confirmed patients with COVID-19 or Persons Under Investigation (PUI: have symptomsand undergoing testing) were approached for informedconsent upon admission. Patients whose clinical test wasnegative were included in the study as controls for sur-face sampling. Health care workers providing direct carefor PUIs and patients with COVID-19 were included inthe study. Following hospital policy, all underwent dailysymptomatic screening and wore the following PPE dur-ing treatment of PUI and patients with COVID-19: gog-gles or face-shield, N95 mask, gown, gloves; hair andshoe coverings were not part of the required PPE butwere available and inconsistently used. All participantswere consented under UCSD Human Research Protec-tions Program protocol 200613.We followed the excretion pattern of the virus from
the skin, respiratory tract, and gastrointestinal tract.From patients and health care workers, specimen sam-ples were obtained from the forehead, nares, and stool.Additional throat swabs and/or tracheal aspirate sampleswere collected for a subset of patients and health careworkers: “oral” samples. Patient samples were collectedby gloved health care workers via dual-tipped syntheticswabs (BD BBL CultureSwabs #220145) which were
immediately transferred to tubes containing 95% etha-nol. Stool was collected from patient bed pans or fromcollection bags that were connected to a rectal tube.Health care workers self-collected swabs over a timeseries of 4 days. A chronological series was alsoemployed for patient samples, with the target samplingschemes as follows: samples collected within the first 12h of hospital admission with sequential samples obtainedonce daily for the first 4 days of hospitalization and asubset of samples collected regularly until the patient va-cated the room (Fig. 1A). Actual sample collection tim-ing varied by patient availability and duration in thehospital (Fig. S3).Dual-tipped synthetic swabs (BD BBL CultureSwabs
#220145) were pre-moistened by dipping for 5 secondsinto 95% spectrophotometric-grade ethanol solution(Sigma-Aldrich #493511), and then used to vigorouslyswab surfaces that are frequently in contact with healthcare workers or patients. Surfaces were swabbed for 10–15 s with moderate pressure on a defined surface area,and swabs were returned to the collection container.Outside of patient rooms, prior to entering the room,the floor (1 square foot outside the entrance) and out-side door handle were swabbed. Inside patient rooms,the inside door handle, floor (1 square foot near the pa-tient’s bed on side closest to door), bedrail (side closestto door), and keyboard were swabbed. Depending on thepatient room, if an air filter was present, the intake wasswabbed. For a subset of samples, patient care equip-ment such as portable ultrasound and ventilator screenwere also swabbed, as well as the toilet seat. After sam-ple collection, dual-tipped swabs were returned to theswab container. Surface samples were collected at thesame time as patient sample collection, as well as priorto patient admission and following patient discharge androom cleaning, when possible.
Nucleic acid extractionSample plating and extractions of all clinical and envir-onmental specimens were carried out in a biosafety cabi-net Class II in a BSL2+ facility. Sample swabs wereplated into a bead plate from the 96 MagMAX™ Micro-biome Ultra Nucleic Acid Isolation Kit (A42357 ThermoFisher Scientific, USA). Following the KatharoSeq lowbiomass protocol [27], each sample processing plate in-cluded eight positive controls consisting of 10-fold serialdilutions of the ZymoBIOMICS™ Microbial CommunityStandard (D6300 Zymo, USA) ranging from 5 to 50 mil-lion cells per extraction. Each plate also contained aminimum of 8 negative controls (sample-free lysis buf-fer). Nucleic acids purification was performed on theKingFisher FlexTM robots (Thermo Fisher Scientific,USA) using the MagMAXTM Microbiome Ultra NucleicAcid Isolation Kit (Applied BiosystemsTM), as instructed
Marotz et al. Microbiome (2021) 9:132 Page 10 of 15
by the manufacturer. Briefly, 800 μL of lysis buffer wasadded to each well on the sample processing plate andbriefly centrifuged to bring all beads to the bottom ofthe plate. Sample swab heads were added to the lysisbuffer and firmly sealed first with MicroAmp™ clear ad-hesive film (Thermo Fisher Scientific, UK) using a sealroller, and the sealing process repeated twice using foilseals. The plate was beaten in a TissueLyser II (Qiagen,Germany) at 30 Hz for 2 min and subsequently centri-fuged at 3700×g for 5 min. Lysates (450 μL/well) weretransferred into a Deep Well Plate (96 well, ThermoFisher Scientific, USA) containing 520 μL of MagMaxTM
binding bead solution and transferred to the KingFisherFlexTM for nucleic acid purification using the Mag-MaxTM protocol. Nucleic acids were eluted in 100 μLnuclease free water and used for downstream SARS-CoV-2 real time RT-qPCR.
SARS-CoV-2 RT-qPCR and viral load quantificationThe Center for Disease Control (CDC) 2019-Novel Cor-onavirus Real-Time RT-PCR Diagnostic Panel [60] andthe E-gene primer/probe from the World HealthOrganization [61] were used to assess SARS-CoV-2 sta-tus via reverse transcription, quantitative polymerasechain reaction (RT-qPCR). Accordingly, each plate of ex-tracted nucleic acid (96-well plate) was aliquoted into a384-well plate with four separate reactions per sample;two reactions targeted the SARS-CoV-2 nucleocapsidgene (CDC N1 and N2), one reaction targeted theSARS-CoV-2 virporin forming E-gene (WHO E-gene),and one reaction targeted the human RNAse P gene as apositive control for sample collection and nucleic acidextraction (CDC RP).Each reaction contained 3 μL of TaqPathTM 1-Step
RT-qPCR Master Mix (Thermo Fisher Scientific, USA),400 nm forward and reverse primers and 200 nm FAM-probes (IDT, USA—table with sequences below), 4 μLRNA template, and H2O to a final volume of 10 μL.Master mix and sample plating were performed using anEpMotion automated liquid handler (Eppendorf,Germany). Each plate contained both positive and nega-tive controls. The positive control was vRNA and eightserial dilutions of viral amplicons for viral load quantifi-cation (details below). Six extraction blanks and one RT-qPCR blank (nuclease-free H2O) were included per plateas negative controls. RT-qPCR was performed on theCFX384 Real-Time System (BIO-RAD). Cycling condi-tions were reverse transcription at 50 °C for 15 min, en-zyme activation at 95 °C for 2 min, followed by 45 cyclesof PCR amplification (denaturing at 95 °C for 10 s; an-nealing/extending at 55 °C for 30 s). Cycle threshold (Ct)values were generated using the CFX384 Real-Time Sys-tem (BIO-RAD) software.
Viral load quantification was performed using a standardladder comprising serially diluted target amplicons whichwas included in the RT-qPCR of each extraction plate, inplace of the KatharoSeq control samples. SARS-CoV-2 viralRNA was reverse transcribed into cDNA using the Super-script IV enzyme (Thermo Fisher, USA) and PCR amplifiedwith KAPA SYBR® FAST qPCR Master Mix (KAPA Biosys-tems, USA) using the N1, N2, and E gene primers in dupli-cate 20 μL reactions with cycling parameters as detailedabove. Each amplicon reaction was run across a 1.5% agar-ose gel and the resulting bands were excised and purifiedinto 100 μL nuclease-free water with the MinElute Gel Ex-traction Kit (Qiagen, Germany). Amplicons were quantifiedwith in duplicate with the Qubit™ dsDNA HS Assay Kit(Thermo Fisher, USA) and copies per μL were calculatedbased on predicted amplicon length (N1 72 bp, N2 67 bp,and E gene 113 bp). Eight, 10-fold serial dilutions wereadded to the RT-qPCR for final estimated copy input perreaction ranging from 10 million to one. The limit of detec-tion was between 10 and 100 vRNA copies per reaction,and the Ct values were highly consistent across extractionplates. Viral load per swab head was calculated by firstusing the slope and intercept from the N1 amplicon ladderlinear regression per plate to determine the number of viralcopies per reaction, and then multiplying this number by25 since 4 μL out of a total 100 μL extracted nucleic acidwas used as input to the RT-qPCR.
16S rRNA gene amplicon sequencing16S rRNA gene amplification was performed accordingto the Earth Microbiome Project protocol [28]. Briefly,
Marotz et al. Microbiome (2021) 9:132 Page 11 of 15
Illumina primers with unique reverse primer barcodes[62] were used to amplify the V4 region of the 16SrRNA gene (515f-806rB, [63]). Amplification wasperformed in a miniaturized volume [64], with singlereactions per sample [65]. Equal volumes of eachamplicon were pooled, and the library was sequenced onthe Illumina MiSeq sequencing platform with a MiSeqReagent Kit v2 and paired-end 150 bp cycles.
Statistical analysisData pre-processingRaw 16S rRNA gene amplicon sequencing data wasdemultiplexed, quality filtered, and denoised with deblur[66] through Qiita [67] under study ID 13092.Downstream data processing was performed usingQiime2 [68]. Eight negative controls (blanks) and eightpositive controls (serially diluted mock communities)were included in each 96-well extraction plate (see the“Nucleic acid extraction” section). The serially dilutedmock communities included in each extraction platewere used to identify the read count threshold at which80% of sequencing reads aligned to the positive controlaccording to the KatharoSeq protocol [27] (code avail-able at https://github.com/lisa55asil/KatharoSeq_ipynb),and all samples falling below the threshold set for eachindependent sequencing run were removed from down-stream analysis. The KatharoSeq-filtered feature tableswere merged, and features present in less than threesamples were removed from downstream analysis, withthe final feature table containing 589 samples and 9461features.
Beta diversity analysesTo verify that study samples of particular typesclustered with similar types from other microbialstudies, we estimated the UniFrac phylogeneticdistance between samples and visualized the distanceof variation of our current project in reference tosamples from the Earth Microbiome Project. Forsignificance testing based on distances fromsequencing data, a permutation test was used. Thiswas chosen since univariate statistical tests oftenassume that observations are independently andidentically distributed, which is not the case withdistance calculations. Similar to PERMANOVA, thegroup labels were shuffled, and a Kruskal-Wallis testwas applied. P values were calculated by (#(K > Kp)+ 1)/(number of permutations + 1) where K is theKruskal-Wallis statistic on the original statistic andKp is the Kruskal-Wallis statistic computed from thepermuted grouping. One thousand permutations wereused for the permutation test.
Longitudinal data analysisWe used Bayesian Sparse Functional PrincipalComponents Analysis (SFPCA) [69] methodology tomodel temporal variations and sample type differencesin viral load. To quantify the contribution of potentialsource environments (i.e., patient microbiome) to thehospital surface microbiome (as a sink), SourceTracker2[31] was used.
Random forest analysisWe performed machine learning analysis of bacterialprofiles derived from 16S rRNA gene ampliconsequencing from multiple sample types (nares, skin,stool, inside floor, outside floor, and bed rail) to predictthe samples’ SARS-CoV-2 status according to RT-qPCRresults (i.e., “positive” or ”not detected”). For each sam-ple type, a random forest sample classifier was trainedbased on the ASV-level bacterial profiles with tunedhyperparameters as 20-time repeated, stratified 5-foldcross-validation using the R caret package [70]. Thedataset of each sample type was repeatedly split into fivegroups with similar class distributions, and we trainedthe classifier on 80% of the data and made predictionson the remaining 20% of the data in each fold iteration.We evaluated each classifier using both area under thereceiver operating characteristic curve (AUROC) andarea under the precision-recall curve (AUPRC) based onthe samples’ predictions in the holdout test set using theR PRROC package [71]. For all six sample types, ourdata had an imbalanced representation of SARS-CoV-2status, and “not detected” was consistently the majorityclass (nares: 45 not detected vs. 31 positives; foreheadskin: 63 not detected vs. 16 positives; stool: 33 not de-tected vs. 11 positives; inside floor: 67 not detected vs.40 positive; outside floor: 81 not detected vs. 27 posi-tives; bed rail: 38 not detected vs. 8 positives). To assesshow well a classifier can predict the SARS-CoV-2 posi-tive samples (the minority class) using microbiome data,the AUPRC was calculated by assigning “positive” as thepositive class. Next, the importance of each ASV for theprediction performance of the four classifiers withAUROC ≥ 0.7 and AUPRC ≥ 0.6 (for nares, foreheadskin, stool, and inside floor) was estimated by the built-in random forest scores in the 100-fold cross-validation.For each body site or environmental site, we finallyranked all ASVs by their average ranking of importancescores in the 100 classification models. The code forgenerating the multi-dataset machine learning analysis isavailable at https://github.com/shihuang047/crossRangerand is based on random forest implementation from Rranger package [72].To identify the ASVs consistently important to the
prediction of SARS-CoV-2 across the four well-performing classifiers of four different sample types, we
Marotz et al. Microbiome (2021) 9:132 Page 12 of 15
visualized the top 100 ranked important ASV’s and theirphylogenetic relationship for each sample type usingEMPress [35].
Redundancy analysisTo quantify the effect size of different metadata variableson our 16S rRNA gene amplicon sequencing dataset, weapplied redundancy analysis on the robust Aitchisonprincipal coordinates analysis biplot [73] as describedpreviously [33]. Briefly, RDA employs the varpartfunction in R which uses linear constrained ordinationto estimate the independent and shared contributions ofmultiple covariates on microbiome compositionvariation.
Supplementary InformationThe online version contains supplementary material available at https://doi.org/10.1186/s40168-021-01083-0.
Additional file 2: Figure S2. Ili’ spatial mapping of standard hospital(non-ICU) room and intensive care unit (ICU) room. Heatmap depicts thepercent of samples collected at each site that were positive for SARS-CoV-2.
Additional file 3: Figure S3. Snapshot of variability in longitudinalsample collection and SARS-CoV-2 viral RNA load per swab between pa-tients and their hospital rooms, starting at patient admission time. Forsamples where SARS-CoV-2 was detected (+), a darker color indicates ahigher viral load. White boxes represent samples with no detectable virus(-). Patient A was admitted 12 days after symptom onset and was movedto a general surgery unit room after 6 days in the ICU. Patient B was ad-mitted 8 days after symptom onset and moved from general surgery tothe ICU, where they were intubated. Patient C was admitted to the ICU 9days after symptom onset, and despite having symptoms consistent withCOVID-19 repeatedly tested negative by clinical nasopharyngeal swab;their only clinical positive came from a tracheal aspirate sample mid-waythrough their stay in the ICU.
Additional file 4: Figure S4. Source tracker on meta-analysis data. Floorsamples formed a distinct cluster in this dataset; source tracking [31] withfloor samples (n = 215) as the sink and meta-analysis samples (n = 1,990)as the source reveals that these floor samples match other built environ-ment samples. The other built environment samples included in thismeta-analysis were mostly floor (27.7%), faucet handles (19.6%), andgloves (15%).
Additional file 5: Figure S5. Beta diversity has a statistically significantbut weak correlation with viral load. PCoA of unweighted UniFracdistances between samples, with SARS-CoV-2 positive samples colored byviral load across the whole dataset (A) and subset by each patient with atleast one surface positive (B). Statistical analysis performed with Adonis(PERMANOVA) found a small (R2 < 0.01) but significant (p-value = 0.043)association between beta diversity and viral load across all samples.
Additional file 6: Figure S6. Floor sample SARS-CoV-2 status is associ-ated with higher biomass and with significantly different bacterial com-munity composition. Two independent metrics were used to assessbiomass; 16S rRNA gene amplicon sequencing read count, which be-cause of our equal volume sequencing library pooling approach corre-lates with total bacterial load [27, 74], and the Ct value from the CDC’shuman RNAse P RT-qPCR target, which correlates with human biomass.(A) Abundance of 16S rRNA gene amplicon sequencing read count inSARS-CoV-2 positive floor samples showing no correlation with SARS-CoV-2 viral load. (B) Ct value of human RNAse P in SARS-CoV-2 positivefloor samples showing significant correlation with SARS-CoV-2 viral load.Statistical analysis of scatter plots represents Pearson correlation, and box
plots represents independent t-tests; *p < 0.05, **p < 0.01, ***p < 0.001.The legend in panel B applies to panel A as well. (C) Effect size of signifi-cant, non-redundant variables identified from Redundancy Analysis onunweighted UniFrac PCoA of floor samples.
Additional file 7: Figure S7. Bacterial (16S rRNA gene ampliconsequencing read count) and human biomass (RNAse P Ct) is higher infloor samples than other surface sample types.
Additional file 8: Figure S8. Random Forest classifier performance with100-fold cross validation in the outside floor (n = 108; 81 not detected vs.27 positives) and bed rail samples (n = 46; 38 not detected vs. 8positives).
Additional file 9: Figure S9. Unweighted UniFrac distance betweenforehead and nares samples from the same host. ‘Shedder’ (n = 12) is apatient who had detectable virus on the surface in their room and ‘non-shedder’ (n = 4) did not. Bootstrapped Kruskal-Wallis p-value is 0.003.
Additional file 10: Table S1. Hospital surface materials and cleaningpractices.
Additional file 11: Table S2. Top 100 random forest importance ranksand GreenGenes taxonomy from nares, forehead, stool, and inside floorsamples.
AcknowledgementsThis work would not have been possible without the support of Louis-FelixNothias, Chris Callewaert, and Alison Vrbanac, who transported samples fromthe hospital to the lab, Franck Lejzerowicz, Dom Nguyen, Emily Kunselman,Kanwal Aziz, and Megan Preovolos, who assisted with kit preparation, MeganThoemmes who was instrumental in initial study design conversations, andKarsten Zengler who provided access to lab space.
Authors’ contributionsSMA, FA, JAG, RK, and DAS conceived of the study. CM, PB-F, SMA, DAS, andFA developed the sample collection and processing methodology, and FA,LC, and DAS collected samples and metadata. YV-B, SMA, and GA curatedmetadata. CM, PB-F, SK, SD, GE-M, NG, MCSG, MB, KS, and GH processed sam-ples. CM, PB-F, PD, SH, KC, LJ, CM, RED, GR, DM, GA, RS, JPS, and SMA con-ducted formal analysis and visualization. NH, KLB, H-CK, APC, LP, and YV-Bsupervised and provided feedback on formal analysis and visualization. FJTand DAS provided a clinical perspective to interpretation of results. CM, PB-F,and SMA wrote the original manuscript, and all authors edited and approvedthe final manuscript.
FundingThis work was partially supported by IBM Research AI through the AIHorizons Network and the UC San Diego Center for Microbiome Innovation(to SH, KC, YVB, and RK). RED is supported by NIH/NIGMS IRACDA K12(GM068524) and the National Science Foundation PRFB (P2011025). RK issupported by NIH Pioneer (1DP1AT010885) and NIH/NIDDK (1P30DK120515).
Availability of data and materialsThe dataset supporting the conclusions of this article is available in theEuropean Bioinformatics Institute repository [ERP124721, https://www.ebi.ac.uk/ena/browser/view/PRJEB41002]. Additionally, sequencing data andprocessed tables and taxonomy assignments are available through QIITA [67]under study ID 13092.
Declarations
Ethics approval and consent to participateAll participants were consented under UCSD Human Research ProtectionsProgram protocol 200613.
Consent for publicationNot applicable.
Competing interestsThe authors declare that they have no competing interests to declare.
Marotz et al. Microbiome (2021) 9:132 Page 13 of 15
Author details1Department of Pediatrics, School of Medicine, University of California SanDiego, La Jolla, CA, USA. 2Scripps Institution of Oceanography, University ofCalifornia San Diego, La Jolla, CA, USA. 3Center for Microbiome Innovation,Jacobs School of Engineering, University of California San Diego, La Jolla, CA,USA. 4Department of Computer Science and Engineering, Jacobs School ofEngineering, University of California San Diego, La Jolla, CA, USA. 5Division ofBiostatistics, University of California, San Diego, La Jolla, CA, USA.6Bioinformatics and Systems Biology Program, Jacobs School of Engineering,University of California San Diego, La Jolla, CA, USA. 7Microbiome Core,School of Medicine, University of California San Diego, La Jolla, CA, USA.8Infection Prevention and Clinical Epidemiology Unit at UC San DiegoHealth, Division of Infectious Diseases and Global Public Health, Departmentof Medicine, UC San Diego, San Diego, CA, USA. 9IBM, T.J Watson ResearchCenter, Yorktown Heights, New York, USA. 10AI and Cognitive Software, IBMResearch-Almaden, San Jose, CA, USA. 11IBM Research UK, The HartreeCentre, Warrington, UK. 12Department of Bioengineering, University ofCalifornia San Diego, La Jolla, CA, USA. 13Division of Pulmonary, Critical Careand Sleep Medicine, Department of Internal Medicine, University of CaliforniaSan Diego, La Jolla, CA, USA.
Received: 3 February 2021 Accepted: 21 April 2021
References1. Berger AK, Yi H, Kearns DB, Mainou BA. Bacteria and bacterial envelope
2. Robinson CM, Jesudhasan PR, Pfeiffer JK. Bacterial lipopolysaccharidebinding enhances virion stability and promotes environmental fitness of anenteric virus. Cell Host Microbe. 2014;15(1):36–46. https://doi.org/10.1016/j.chom.2013.12.004.
3. Erickson AK, Jesudhasan PR, Mayer MJ, Narbad A, Winter SE, Pfeiffer JK.Bacteria facilitate enteric virus co-infection of mammalian cells and promotegenetic recombination. Cell Host Microbe. 2018;23:77–88.e5.
4. Rowe HM, Meliopoulos VA, Iverson A, Bomme P, Schultz-Cherry S, Rosch JW.Direct interactions with influenza promote bacterial adherence duringrespiratory infections. Nat Microbiol. 2019;4(8):1328–36. https://doi.org/10.1038/s41564-019-0447-0.
5. Tashiro M, Ciborowski P, Klenk H-D, Pulverer G, Rott R. Role ofStaphylococcus protease in the development of influenza pneumonia.Nature. 1987;325(6104):536–7. https://doi.org/10.1038/325536a0.
6. Pavlova SI, Wilkening RV, Federle MJ, Lu Y, Schwartz J, Tao L. Streptococcusendopeptidases promote HPV infection in vitro. MicrobiologyOpen. 2019;8.https://doi.org/10.1002/mbo3.628.
7. Martino C, Kellman BP, Sandoval DR, Clausen TM, Marotz CA, Song SJ, et al.Bacterial modification of the host glycosaminoglycan heparan sulfatemodulates SARS-CoV-2 infectivity. bioRxiv. 2020. https://doi.org/10.1101/2020.08.17.238444.
8. Qian H, Miao T, Liu L, Zheng X, Luo D, Li Y. Indoor transmission of SARS-CoV-2. Indoor Air. 2020;31(3):639–45. https://doi.org/10.1111/ina.12766.
9. Kembel SW, Jones E, Kline J, Northcutt D, Stenson J, Womack AM, et al.Architectural design influences the diversity and structure of the builtenvironment microbiome. ISME J. 2012;6(8):1469–79. https://doi.org/10.1038/ismej.2011.211.
10. Gilbert JA, Stephens B. Microbiology of the built environment. Nat RevMicrobiol. 2018;16(11):661–70. https://doi.org/10.1038/s41579-018-0065-5.
11. Qian J, Hospodsky D, Yamamoto N, Nazaroff WW, Peccia J. Size-resolvedemission rates of airborne bacteria and fungi in an occupied classroom.Indoor Air. 2012;22(4):339–51. https://doi.org/10.1111/j.1600-0668.2012.00769.x.
12. Lax S, Sangwan N, Smith D, Larsen P, Handley KM, Richardson M, et al.Bacterial colonization and succession in a newly opened hospital. Sci TranslMed. 2017;9:eaah6500.
13. Lax S, Cardona C, Zhao D, Winton VJ, Goodney G, Gao P, et al. Microbialand metabolic succession on common building materials under highhumidity conditions. Nat Commun. 2019;10(1):1767. https://doi.org/10.1038/s41467-019-09764-z.
14. van Doremalen N, Bushmaker T, Morris DH, Holbrook MG, Gamble A,Williamson BN, et al. Aerosol and surface stability of SARS-CoV-2 as
compared with SARS-CoV-1. N Engl J Med. 2020;382(16):1564–7. https://doi.org/10.1056/NEJMc2004973.
15. Sia SF, Yan L-M, Chin AWH, Fung K, Choy K-T, Wong AYL, et al.Pathogenesis and transmission of SARS-CoV-2 in golden hamsters. Nature.2020;583(7818):834–8. https://doi.org/10.1038/s41586-020-2342-5.
16. Goldman E. Exaggerated risk of transmission of COVID-19 by fomites. LancetInfect Dis. 2020;20(8):892–3. https://doi.org/10.1016/S1473-3099(20)30561-2.
17. Mondelli MU, Colaneri M, Seminari EM, Baldanti F, Bruno R. Low risk ofSARS-CoV-2 transmission by fomites in real-life conditions. Lancet Infect Dis.2020. https://doi.org/10.1016/S1473-3099(20)30678-2.
18. Zhou J, Otter JA, Price JR, Cimpeanu C, Garcia DM, Kinross J, et al.Investigating SARS-CoV-2 surface and air contamination in an acutehealthcare setting during the peak of the COVID-19 pandemic in London.Clin Infect Dis. 2020. https://doi.org/10.1093/cid/ciaa905.
19. Ben-Shmuel A, Brosh-Nissimov T, Glinert I, Bar-David E, Sittner A, Poni R,et al. Detection and infectivity potential of severe acute respiratorysyndrome coronavirus 2 (SARS-CoV-2) environmental contamination inisolation units and quarantine facilities. Clin Microbiol Infect. 2020;26(12):1658–62. https://doi.org/10.1016/j.cmi.2020.09.004.
20. Santarpia JL, Rivera DN, Herrera VL, Morwitzer MJ, Creager HM, SantarpiaGW, et al. Aerosol and surface contamination of SARS-CoV-2 observed inquarantine and isolation care. Sci Rep. 2020;10(1):12732. https://doi.org/10.1038/s41598-020-69286-3.
21. Bergner LM, Orton RJ, da Silva Filipe A, Shaw AE, Becker DJ, Tello C, et al.Using noninvasive metagenomics to characterize viral communities fromwildlife. Mol Ecol Resour. 2019;19(1):128–43. https://doi.org/10.1111/1755-0998.12946.
22. Minich JJ, Ali F, Marotz C, Belda-Ferre P, Chiang L, Shaffer JP, et al. Feasibilityof using alternative swabs and storage solutions for paired SARS-CoV-2detection and microbiome analysis in the hospital environment.Microbiome. 2021;9(1):25. https://doi.org/10.1186/s40168-020-00960-4.
23. Kratzel A, Todt D, V’kovski P, Steiner S, Gultom M, Thao TTN, et al.Inactivation of severe acute respiratory syndrome coronavirus 2 by WHO-recommended hand rub formulations and alcohols. Emerg Infect Dis J.2020;26(7). https://doi.org/10.3201/eid2607.200915.
24. Song SJ, Amir A, Metcalf JL, Amato KR, Xu ZZ, Humphrey G, et al.Preservation methods differ in fecal microbiome stability, affecting suitabilityfor field studies. mSystems. 2016;1. https://doi.org/10.1128/mSystems.00021-16.
25. MacKay MJ, Hooker AC, Afshinnekoo E, Salit M, Kelly J, Feldstein JV, et al.The COVID-19 XPRIZE and the need for scalable, fast, and widespreadtesting. Nat Biotechnol. 2020;38(9):1021–4. https://doi.org/10.1038/s41587-020-0655-4.
26. Jiang L, Zhong Y, Elrod C, Natarajan L, Knight R, Thompson WK, BayesTime:Bayesian functional principal components for sparse longitudinal data,ArXiv201200579 Stat (2020) (available at http://arxiv.org/abs/2012.00579).Accessed 1 Dec 2020.
27. Minich JJ, Zhu Q, Janssen S, Hendrickson R, Amir A, Vetter R, et al. KatharoSeqenables high-throughput microbiome analysis from low-biomass samples.mSystems. 2018;3. https://doi.org/10.1128/mSystems.00218-17.
28. Thompson LR, Sanders JG, McDonald D, Amir A, Ladau J, Locey KJ, et al. Acommunal catalogue reveals Earth’s multiscale microbial diversity. Nature.2017;551:457–63.
29. McDonald D, Ackermann G, Khailova L, Baird C, Heyland D, Kozar R, et al.Extreme dysbiosis of the microbiome in critical illness. mSphere. 2016;1.https://doi.org/10.1128/mSphere.00199-16.
30. Shaffer JP, Marotz C, Belda-Ferre P, Martino C, Wandro S, Estaki M, et al. Acomparison of DNA/RNA extraction protocols for high-throughputsequencing of microbial communities. BioTechniques. 2021;70(3):149–59.https://doi.org/10.2144/btn-2020-0153.
32. McDonald D, Vázquez-Baeza Y, Koslicki D, McClelland J, Reeve N, Xu Z, et al.Striped UniFrac: enabling microbiome analysis at unprecedented scale. NatMethods. 2018;15(11):847–8. https://doi.org/10.1038/s41592-018-0187-8.
33. Falony G, Joossens M, Vieira-Silva S, Wang J, Darzi Y, Faust K, et al.Population-level analysis of gut microbiome variation. Science. 2016;352(6285):560–4. https://doi.org/10.1126/science.aad3503.
34. Hamady M, Lozupone C, Knight R. Fast UniFrac: facilitating high-throughputphylogenetic analyses of microbial communities including analysis of
Marotz et al. Microbiome (2021) 9:132 Page 14 of 15
pyrosequencing and PhyloChip data. ISME J. 2010;4(1):17–27. https://doi.org/10.1038/ismej.2009.97.
35. Cantrell K, Fedarko MW, Rahman G, McDonald D, Yang Y, Zaw T, et al. EMPressenables tree-guided, interactive, and exploratory analyses of multi-omic datasets. mSystems. 2021;6. https://doi.org/10.1128/mSystems.01216-20.
36. Gallardo-Escárate C, Valenzuela-Muñoz V, Núñez-Acuña G, Valenzuela-Miranda D, Benaventel BP, Sáez-Vera C, et al. The wastewater microbiome: anovel insight for COVID-19 surveillance. Sci Total Environ. 2021;764:142867.https://doi.org/10.1016/j.scitotenv.2020.142867.
37. Kumpitsch C, Koskinen K, Schöpf V, Moissl-Eichinger C. The microbiome ofthe upper respiratory tract in health and disease. BMC Biol. 2019;17. https://doi.org/10.1186/s12915-019-0703-z.
38. Nouioui I, Carro L, García-López M, Meier-Kolthoff JP, Woyke T, Kyrpides NC,et al. Genome-based taxonomic classification of the phylum Actinobacteria.Front Microbiol. 2018;9. https://doi.org/10.3389/fmicb.2018.02007.
39. Wos-Oxley ML, Plumeier I, von Eiff C, Taudien S, Platzer M, Vilchez-Vargas R,et al. A poke into the diversity and associations within human anterior naremicrobial communities. ISME J. 2010;4(7):839–51. https://doi.org/10.1038/ismej.2010.15.
40. Boudewijns M, Magerman K, Verhaegen J, Debrock G, Peetermans WE,Donkersloot P, et al. Rothia dentocariosa, endocarditis and mycoticaneurysms: case report and review of the literature. Clin Microbiol Infect.2003;9(3):222–9. https://doi.org/10.1046/j.1469-0691.2003.00503.x.
41. Yang C-Y, Hsueh P-R, Lu C-Y, Tsai H-Y, Lee P-I, Shao P-L, et al. Rothiadentocariosa bacteremia in children: report of two cases and review of theliterature. J Formos Med Assoc. 2007;106(3):S33–8. https://doi.org/10.1016/S0929-6646(09)60364-8.
42. Donald DM, Hyde E, Debelius JW, Morton JT, Gonzalez A, Ackermann G,et al. American gut: an open platform for citizen science microbiomeresearch. mSystems. 2018;3. https://doi.org/10.1128/mSystems.00031-18.
43. Cheng VCC, Wong S-C, Chen JHK, Yip CCY, Chuang VWM, Tsang OTY, et al.Escalating infection control response to the rapidly evolving epidemiologyof the coronavirus disease 2019 (COVID-19) due to SARS-CoV-2 in HongKong. Infect Control Hosp Epidemiol. 2020;5:493-8.
44. Durante-Mangoni E, Andini R, Bertolino L, Mele F, Bernardo M, Grimaldi M,et al. Low rate of severe acute respiratory syndrome coronavirus 2 spreadamong health-care personnel using ordinary personal protectionequipment in a medium-incidence setting. Clin Microbiol Infect. 2020;26(9):1269–70. https://doi.org/10.1016/j.cmi.2020.04.042.
45. Demmer RT, Ulrich AK, Wiggen TD, Strickland A, Naumchik BM, KulasingamS, et al. SARS-CoV-2 screening among symptom-free healthcare workers.Infect Control Hosp Epidemiol. 2021:1-4. https://doi.org/10.1017/ice.2021.81.https://www.cambridge.org/core/journals/infection-control-and-hospital-epidemiology/article/severe-acute-respiratory-coronavirus-virus-2-sarscov2-screening-among-symptomfree-healthcare-workers/F6D370C8FB71F604796B2AA9BCAA8D33.
46. Suárez-García I, Martínez de Aramayona Lopez MJ, Sáez Vicente A, LoboAbascal P. SARS-CoV-2 infection among healthcare workers in a hospital inMadrid, Spain. J Hosp Infect. 2020;106:357–63.
47. Wang X, Ferro E, Hashimoto D, Bhatt D. Association between universalmasking in a health care system and SARS-CoV-2 positivity among healthcare workers - PubMed. JAMA. 2020;324(7):703–4. https://doi.org/10.1001/jama.2020.12897.
48. Jin J-M, Bai P, He W, Wu F, Liu X-F, Han D-M, et al. Gender differences inpatients with COVID-19: focus on severity and mortality. Front Public Health.2020;8. https://doi.org/10.3389/fpubh.2020.00152.
49. CDC. Cases, Data, and Surveillance. Cent Dis Control Prev. 2020. https://www.cdc.gov/coronavirus/2019-ncov/covid-data/investigations-discovery/hospitalization-death-by-race-ethnicity.html. Accessed 1 Feb 2021.
50. Chia PY, Coleman KK, Tan YK, Ong SWX, Gum M, Lau SK, et al. Detection of airand surface contamination by SARS-CoV-2 in hospital rooms of infected patients.Nat Commun. 2020;11(1):2800. https://doi.org/10.1038/s41467-020-16670-2.
51. Wu S, Wang Y, Jin X, Tian J, Liu J, Mao Y. Environmental contamination bySARS-CoV-2 in a designated hospital for coronavirus disease 2019. Am JInfect Control. 2020;48(8):910–4. https://doi.org/10.1016/j.ajic.2020.05.003.
52. Ye G, Lin H, Chen S, Wang S, Zeng Z, Wang W, et al. Environmentalcontamination of SARS-CoV-2 in healthcare premises. J Inf Secur. 2020;81(2):e1–5. https://doi.org/10.1016/j.jinf.2020.04.034.
53. Ren S-Y, Wang W-B, Hao Y-G, Zhang H-R, Wang Z-C, Chen Y-L, et al. Stabilityand infectivity of coronaviruses in inanimate environments. World J ClinCases. 2020;8(8):1391–9. https://doi.org/10.12998/wjcc.v8.i8.1391.
54. Gu S, Chen Y, Wu Z, Chen Y, Gao H, Lv L, et al. Alterations of the gutmicrobiota in patients with coronavirus disease 2019 or H1N1 influenza. ClinInfect Dis. 2020;71(10):2669–78. https://doi.org/10.1093/cid/ciaa709.
55. Han Y, Jia Z, Shi J, Wang W, He K. The active lung microbiota landscape ofCOVID-19 patients. medRxiv. 2020. https://doi.org/10.1101/2020.08.20.20144014.
56. Chase J, Fouquier J, Zare M, Sonderegger DL, Knight R, Kelley ST, et al.Geography and location are the primary drivers of office microbiomecomposition. mSystems. 2016;1. https://doi.org/10.1128/mSystems.00022-16.
57. Zaura E, Keijser BJ, Huse SM, Crielaard W. Defining the healthy “coremicrobiome” of oral microbial communities. BMC Microbiol. 2009;9(1):259.https://doi.org/10.1186/1471-2180-9-259.
58. Schmidt TS, Hayward MR, Coelho LP, Li SS, Costea PI, Voigt AY, et al.,editors. Extensive transmission of microbes along the gastrointestinal tract.eLife. 2019;8:e42693.
59. Nishiga M, Wang DW, Han Y, Lewis DB, Wu JC. COVID-19 and cardiovasculardisease: from basic mechanisms to clinical perspectives. Nat Rev Cardiol.2020;17(9):543–58. https://doi.org/10.1038/s41569-020-0413-9.
60. CDC 2019-Novel Coronavirus (2019-nCoV) Real-Time RT-PCR DiagnosticPanel (2020) (available at https://www.fda.gov/media/134922/download).Accessed 13 July 2020.
61. Corman VM, Landt O, Kaiser M, Molenkamp R, Meijer A, Chu DK, et al.Detection of 2019 novel coronavirus (2019-nCoV) by real-time RT-PCR.Eurosurveillance. 2020;25. https://doi.org/10.2807/1560-7917.ES.2020.25.3.2000045.
62. Caporaso JG, Lauber CL, Walters WA, Berg-Lyons D, Huntley J, Fierer N, et al.Ultra-high-throughput microbial community analysis on the Illumina HiSeq andMiSeq platforms. ISME J. 2012;6(8):1621–4. https://doi.org/10.1038/ismej.2012.8.
63. Walters W, Hyde ER, Berg-Lyons D, Ackermann G, Humphrey G, Parada A,et al. Improved bacterial 16S rRNA gene (V4 and V4-5) and fungal internaltranscribed spacer marker gene primers for microbial community surveys.mSystems. 2016;1. https://doi.org/10.1128/mSystems.00009-15.
64. Minich JJ, Humphrey G, Benitez RAS, Sanders J, Swafford A, Allen EE, et al.High-throughput miniaturized 16S rRNA amplicon library preparationreduces costs while preserving microbiome integrity. mSystems. 2018;3.https://doi.org/10.1128/mSystems.00166-18.
65. Marotz C, Sharma A, Humphrey G, Gottel N, Daum C, Gilbert JA, et al.Triplicate PCR reactions for 16S rRNA gene amplicon sequencing areunnecessary. BioTechniques. 2019;67(1):29–32. https://doi.org/10.2144/btn-2018-0192.
66. Amir A, McDonald D, Navas-Molina JA, Kopylova E, Morton JT, Xu ZZ, et al.Deblur rapidly resolves single-nucleotide community sequence patterns.mSystems. 2017;2. https://doi.org/10.1128/mSystems.00191-16.
68. Bolyen E, Rideout JR, Dillon MR, Bokulich NA, Abnet CC, Al-Ghalith GA, et al.Reproducible, interactive, scalable and extensible microbiome data scienceusing QIIME 2. Nat Biotechnol. 2019;37:852–7.
69. Jiang L, Elrod C, Kim JJ, Swafford AD, Knight R, Thompson WK. Multi-blocksparse functional principal components analysis for longitudinalmicrobiome multi-omics data, ArXiv210200067 Stat. 2021. Available athttp://arxiv.org/abs/2102.00067. Accessed 5 Feb 2021.
70. Kuhn M. Building predictive models in R using the caret package. J StatSoftw. 2008;28:1–26.
71. Keilwagen J, Grosse I, Grau J. Area under precision-recall curves forweighted and unweighted data. Plos One. 2014;9(3):e92209. https://doi.org/10.1371/journal.pone.0092209.
72. Wright MN, Ziegler A. ranger: a fast implementation of random forests forhigh dimensional data in C++ and R. J Stat Softw. 2017;77:1–17.
73. Martino C, Morton JT, Marotz CA, Thompson LR, Tripathi A, Knight R, et al. Anovel sparse compositional technique reveals microbial perturbations.mSystems. 2019;4. https://doi.org/10.1128/mSystems.00016-19.
74. Cruz GNF, Christoff AP, de Oliveira LFV. Equivolumetric protocolgenerates library sizes proportional to total microbial load in 16Samplicon sequencing. Front Microbiol. 2021;12. https://doi.org/10.3389/fmicb.2021.638231.
Publisher’s NoteSpringer Nature remains neutral with regard to jurisdictional claims inpublished maps and institutional affiliations.
Marotz et al. Microbiome (2021) 9:132 Page 15 of 15