37
SAS® Maps as Tools to Display and Clarify Healthcare Outcomes Barbara B. Okerson, HMC, Richmond, VA
| Date post: | 26-Dec-2015 |
| Category: |
Documents |
| Upload: | archibald-jessie-allison |
| View: | 218 times |
| Download: | 1 times |

SAS® Maps as Tools to Display and Clarify Healthcare Outcomes
Barbara B. Okerson, HMC, Richmond, VA

Abstract
Changes in healthcare and other industries often have a spatial component. Maps can be used to convey this type of information more quickly than tabular reports and other non-graphical formats. SAS®, SAS/GRAPH and ODS graphics provide SAS programmers with the tools to display spatial data in a meaningful manner that aids in understanding of changes that have transpired.
This presentation illustrates the creation of a number of different maps for displaying change over time with examples from the healthcare arena. Examples include choropleth, bubble, and distance maps and introduce the new GEOCODE procedures.
Purpose
Identify population/demographic differences Identify providers/provider areas in need of
improvement Identify regional differences in healthcare delivery Identify population differences
Identify changes in outcomes by demographics

Maps as images
When generating a map as an image, the user has extensive control over the map's appearance. These maps allow users to do the following within the procedure: For block maps, specify:
Block width, outline colors for blocks and map areas, the angle of view;
For choropleth maps, specify: colors and patterns that fill the map areas, and ranges for the response variable.
For prism maps, specify: ranges for the response values, and specify the angle of view.
Hide the legend, or change its features; Add titles and footnotes to the map; Use annotations to enhance the map; and Create non-spatial maps.

Types of maps
Choropleth
Block
Prism

Types of maps (cont.)
Area
Other

ACTIVE-X and JAVA
Both ActiveX and Java allow: A pop-up box that displays data values as mouse moves over
area; Panning, rotating, or zooming the map; Changing the use of color in map areas, legend or background; Hiding the legend, or changing its features; and Displaying or hiding a background image (when used).
Additionally, Java allows: Changing the map type so that values for the response data are
represented as: blocks that are set on the map areas, patterns or colors in the map areas, or raised polygons in the map areas.

Pop-ups and flyovers
Java- popupActive-X - flyover

Included maps
Purpose – understand health care outcomes Choropleth with graphic markers Choropleth color patterns
Population distribution Fetal mortality rates Medical costs
Geocoding – non-geographic example Bubble map – bubbles for linked labels National county map


GMAP SAS code
proc gmap map=maps.us data=maprank;
id state ;
choro raterank / levels=5 coutline=black legend=legend1 annotate=labels;
run;
quit;

Annotate SAS code
data labels;
length function color $ 8 text $ 25;
retain function 'label' xsys ysys '2' hsys '3' when 'a';
set office2;
text=put(pass,passfmt.); position='5'; color='red'; size=7;
style='Marker'; output;
run;


Annotate SAS code
data labels; length function color $ 8 text $ 1 style $ 15; retain function 'label' xsys ysys '2' hsys '3' when 'a'; set office2; if pass=1 then do; text=put(pass,passfmt.); position='B'; color='blue'; size=4; style='"Webdings"'; output; end; if pass=2 then do; text=put(pass,passfmt.); position='B'; color='red';
size=5.5; style='"Webdings"'; output; end; run;


Annotate SAS Code
data labels; length function $ 8 style $ 15; retain xsys ysys '2' hsys '3' when 'a'; set office2;function='move'; output;function='image'; style='fit'; imgpath='r:\bokerson\sas global forum\sgf 2010\
office.bmp';x=x+0.05; y=y+0.05;output; run;

Map color patterns
SAS provides many options Default list Specify color list (color name, RGB value,
HLS Value and Hex Value) Specify pattern list (color name, RGB value,
HLS Value and Hex Value) %colorscale, a SAS-supplied macro:
HTTP://FTP.SAS.COM/TECHSUP/DOWNLOAD/SAMPLE/GRAPH/OTHER-COLOR.HTML
Safe for black/white: colors=(white bwh vpab vlipb lib) or colors=(bwh vpab vlipb lib virp)
Color references
SAS TS-688 http://support.sas.com/techsup/technote/ts688/ts688.html
http://www.colourlovers.com/
http://www.hitmill.com/html/pastels.html
http://www.w3schools.com/html/html_colors.asp
http://www.netstrider.com/tutorials/HTML/colors/
http://www.visibone.com/vaccc/

Choropleth map – population change

Color patterns - greens
pattern1 value=msolid color=cxFFFF66;
pattern2 value=msolid color=cxCCFF00;
pattern3 value=msolid color=cx66FF00;
pattern4 value=msolid color=cx009900;
pattern5 value=msolid color=cx666600;

Choropleth map – intervention impact

Color patterns - oranges
goptions colors=(white cxFFDAB9 cxFFA07A cxF2691E cxB85800)
Note: pattern statements take precedence over goptions – if using goptions do not use pattern.

Choropleth – change in cost

Color patterns - mixed
pattern1 v = msolid c =LemonChiffon;
pattern2 v = msolid c = cxffcc00;
pattern3 v = msolid c = orange;
pattern4 v = msolid c = cxd9892b;
pattern5 v = msolid c = vpag;
pattern6 v = msolid c = YellowGreen ;
pattern7 v = msolid c = MediumSeaGreen ;
pattern8 v = msolid c = brown;
pattern9 v = msolid c = CX800000 ;
pattern10 v = msolid c = CX33070F ;
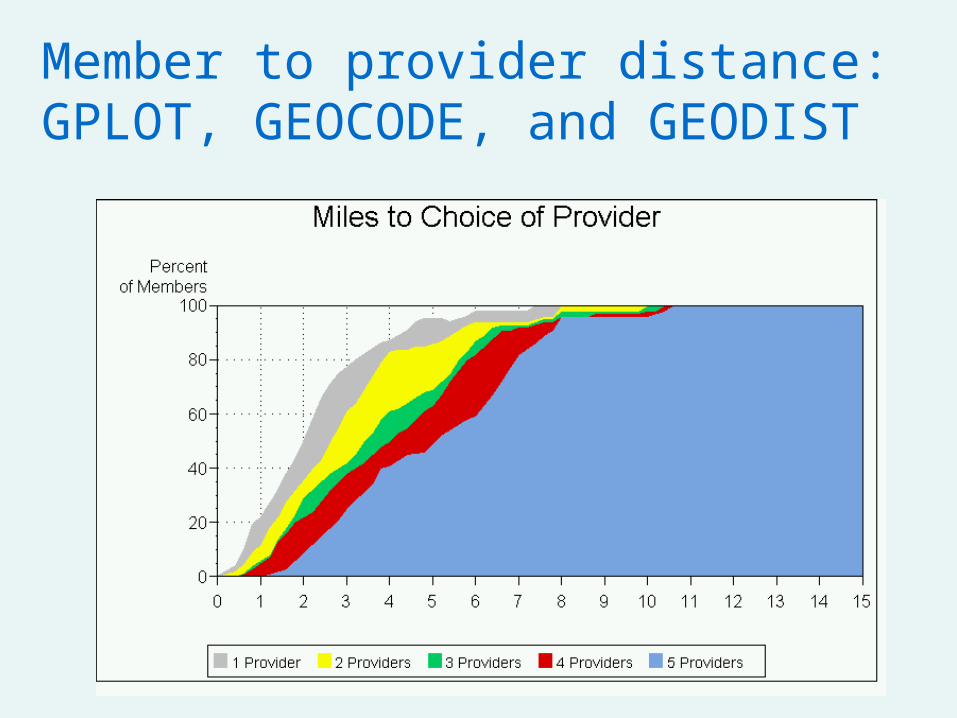
Member to provider distance: GPLOT, GEOCODE, and GEODIST

GEOCODE SAS code
proc geocode
plus4
lookup=lookup.zip4
data=work.members out=work.geo_members;
run;
quit;
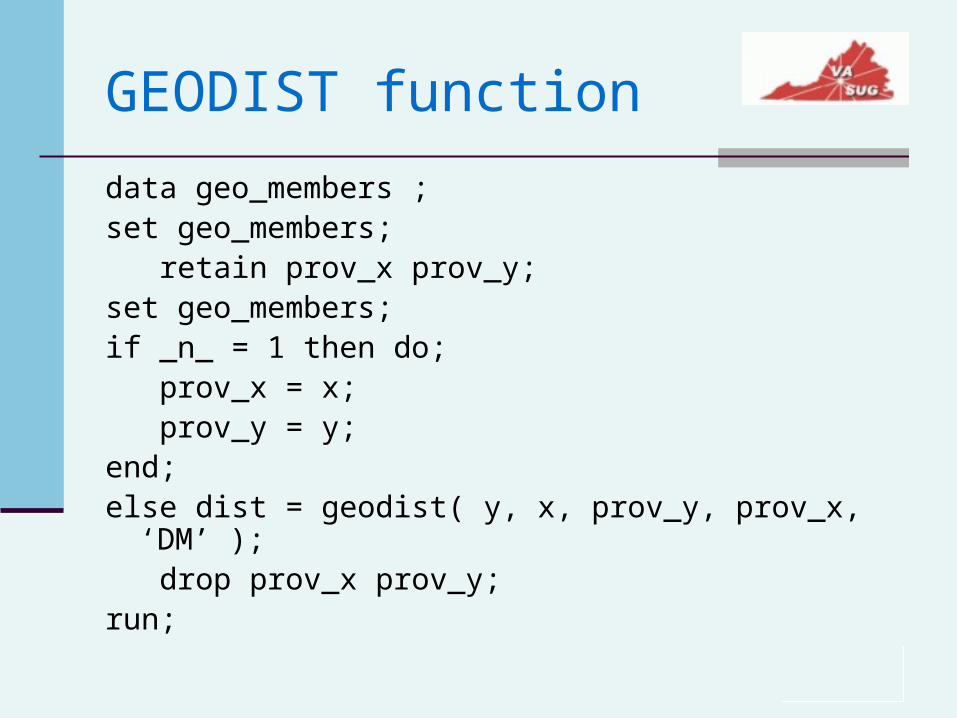
GEODIST function
data geo_members ;set geo_members; retain prov_x prov_y;set geo_members;if _n_ = 1 then do; prov_x = x; prov_y = y;end;else dist = geodist( y, x, prov_y, prov_x, ‘DM’ ); drop prov_x prov_y;run;

GPLOT SAS Codegoptions reset=all gunit=pct border ftext='Arial' ftitle='Arial'
htext=4 htitle=7 ctext=black colors=(cx7BA7E1 cxD80000 cx00CC66 cxFFFF00 ltgray) ;
symbol1 interpol=join; title 'Miles to Choice of Provider'; axis1 order=(0 to 15 by 1) offset=(0,0) minor=none label=none; axis2 order=(0 to 100 by 20) offset=(0,0) major =(height=1) label=( j=r 'Percent' j=r 'of Members'); proc gplot data=provider2; plot p5*interval p4*interval p3*interval p2*interval p1*interval /overlay
haxis=axis1 autovref autohref cvref=black chref=black lautovref=34 lautohref=34
vaxis=axis2 vminor=3 caxis=black areas=5; run; quit;
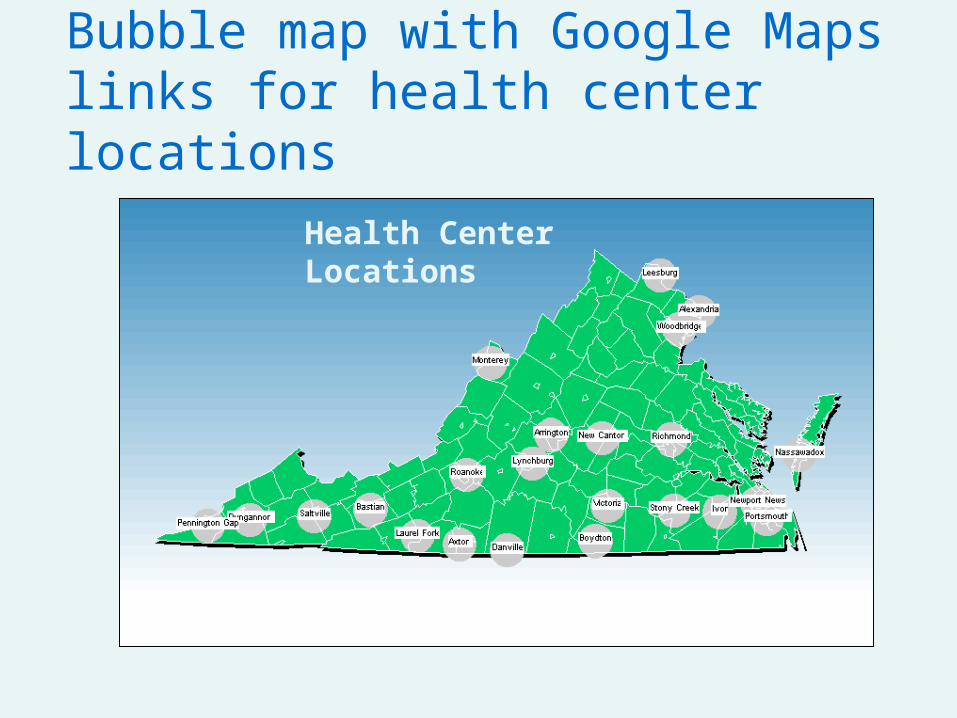
Health Center Locations
Bubble map with Google Maps links for health center locations

Health center location SAS codeproc sql; create table circle_anno as select loc_ccnv.zip, zipcode.city, -1*zipcode.x as longitude, zipcode.y as latitude
from loc_ccnv left join sashelp.zipcode
on loc_ccnv.zip=zipcode.zip; quit; run; /* Convert degrees to radians, */ data circle_anno; set circle_anno; length city $ 30; city=scan(zipcity(zip),1,','); x=atan(1)/45 * longitude; y=atan(1)/45 * latitude; run;

Google Maps link

Google Maps link SAS codedata circle_anno; length function style color $ 8 position $ 1 text $ 20 html $1024; retain xsys ysys '2' hsys '3' when 'a';set circle_anno;html='title='||quote( trim(left(propcase(city)))||' ('||trim(left(zip))||')' ) ||' '||'href='||quote('http://maps.google.com/maps?t=k&hl=en&q='||
trim(left(put(zip,z5.))));function='pie'; color='graycc'; style='psolid'; position='5';
rotate=360; size=3; anno_flag=1;output;function='label'; position='B'; style='"Arial"'; text=trim(left(city)); color='black'; cbox='white'; size=2; anno_flag=3;output;run;
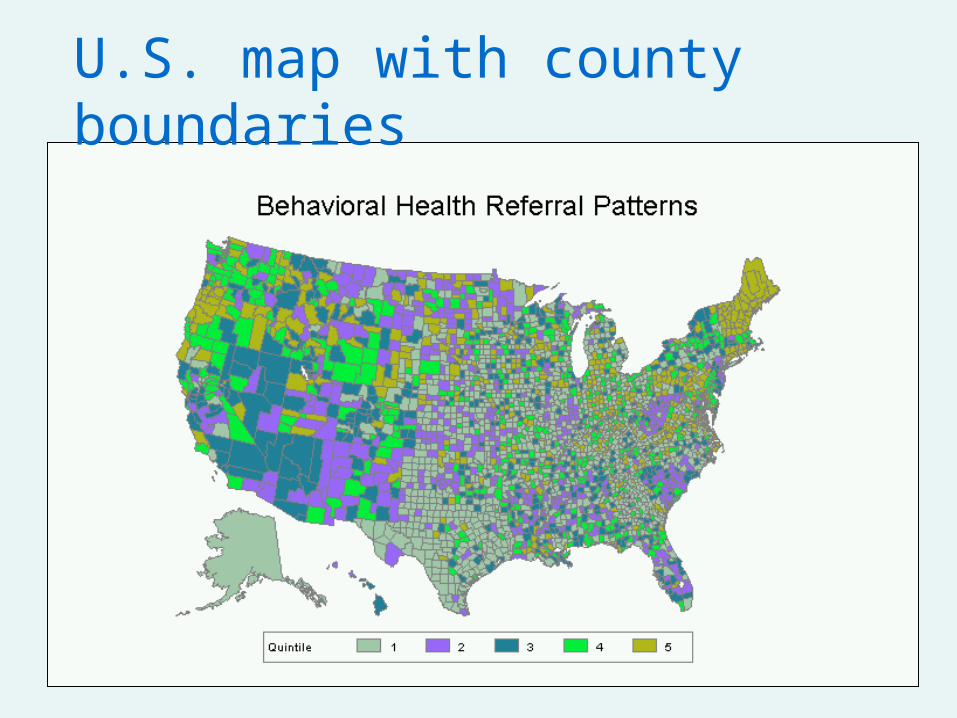
U.S. map with county boundaries

Proc RANK SAS code
proc rank data=mapbh out=mapbhrank group=5; var pctbh; ranks pctbhgrp;run;data mapbhrank(rename=(stfips=state
cntyfips=county)); set mapbhrank; pctbhgrp=pctbhgrp+1; run;proc sql; create table bhdatamap as select * from maps.uscounty m left join mapbhrank r on m.state=r.state and m.county=r.county; run; quit;

References
Ingenix Geo Networks. http://www.ingenix.com/content/attachments/GeoNetworks_brochure.pdf. Accessed February 2010.
Massengill D, Odom E. “PROC GEOCODE: Creating Map Locations from Your Data.” SAS Global Forum 2009.
Osborne, Anastasiya. “Let Me Look At It! Graphic Presentation of Any Numeric Variable.” SAS Global Forum 2009.
SAS Institute, Inc. 2009. http://support.sas.com/rnd/datavisualization. Accessed October 2009.
SAS Institute Inc. 2008. SAS OnlineDoc® 9.1.3. Cary, NC: SAS Institute Inc.

Contact info
Barbara B. Okerson, Ph.D., CPHQ, FAHMSenior Health Information Consultant National Accounts OutcomesHealth Management Corporation (HMC)8831 Park Central Drive, Suite 100Richmond, VA 23227Office: 804-662-5287Fax: 804-662-5364Email: [email protected]

Questions?


