Satellite mapping of rain-induced nitric oxide emissions from soils L. Jaegle ´, 1 R. V. Martin, 2,3 K. Chance, 4 L. Steinberger, 1 T. P. Kurosu, 4 D. J. Jacob, 5 A. I. Modi, 6 V. Yoboue ´, 7 L. Sigha-Nkamdjou, 8 and C. Galy-Lacaux 9 Received 18 March 2004; revised 16 July 2004; accepted 5 August 2004; published 12 November 2004. [1] We use space-based observations of NO 2 columns from the Global Ozone Monitoring Experiment (GOME) to map the spatial and seasonal variations of NO x emissions over Africa during 2000. The GOME observations show not only enhanced tropospheric NO 2 columns from biomass burning during the dry season but also comparable enhancements from soil emissions during the rainy season over the Sahel. These soil emissions occur in strong pulses lasting 1–3 weeks following the onset of rain, and affect 3 million km 2 of semiarid sub-Saharan savanna. Surface observations of NO 2 from the International Global Atmospheric Chemistry (IGAC)/Deposition of Biochemically Important Trace Species (DEBITS)/Africa (IDAF) network over West Africa provide further evidence for a strong role for microbial soil sources. By combining inverse modeling of GOME NO 2 columns with space-based observations of fires, we estimate that soils contribute 3.3 ± 1.8 TgN/year, similar to the biomass burning source (3.8 ± 2.1 TgN/year), and thus account for 40% of surface NO x emissions over Africa. Extrapolating to all the tropics, we estimate a 7.3 TgN/year biogenic soil source, which is a factor of 2 larger compared to model-based inventories but agrees with observation- based inventories. These large soil NO x emissions are likely to significantly contribute to the ozone enhancement originating from tropical Africa. INDEX TERMS: 0315 Atmospheric Composition and Structure: Biosphere/atmosphere interactions; 0322 Atmospheric Composition and Structure: Constituent sources and sinks; 0365 Atmospheric Composition and Structure: Troposphere— composition and chemistry; 1640 Global Change: Remote sensing; 3354 Meteorology and Atmospheric Dynamics: Precipitation (1854); KEYWORDS: soil, NO x , satellite Citation: Jaegle ´, L., R. V. Martin, K. Chance, L. Steinberger, T. P. Kurosu, D. J. Jacob, A. I. Modi, V. Yoboue ´, L. Sigha-Nkamdjou, and C. Galy-Lacaux (2004), Satellite mapping of rain-induced nitric oxide emissions from soils, J. Geophys. Res., 109, D21310, doi:10.1029/2004JD004787. 1. Introduction [2] Emissions of atmospheric nitrogen oxides (NO x , the sum of nitric oxide and nitrogen dioxide, NO + NO 2 ) lead to hemispheric-scale enhancements in tropospheric ozone, rain acidification, and increased oxidizing capacity of the troposphere. In addition, through their influence on aerosol composition and on the burdens of many greenhouse gases (ozone, methane, and hydrofluorocarbons), NO x emissions indirectly affect the Earth’s radiative balance [Prather and Ehhalt, 2001]. Human-initiated fires are the main anthro- pogenic source of NO x in tropical regions, while fossil fuel combustion dominates anthropogenic sources in Northern Hemisphere midlatitudes [Logan, 1983; Penner et al., 1991; Holland and Lamarque, 1997]. Natural sources include microbial processes in soils, lightning and transport from the stratosphere. [3] Tropical soils have been identified as significant NO x sources, accounting for nearly 70% of global soil emissions [Yienger and Levy , 1995]. Many field and laboratory experi- ments have reported large pulses of biogenic NO emissions following rain on dry soils of savannas and seasonally dry forests [Johansson and Sanhueza, 1988; Davidson, 1992; Harris et al., 1996; Levine et al., 1996; Scholes et al., 1997]. Long dry periods in these tropical ecosystems allow soils to accumulate inorganic nitrogen. The first rains of the wet season activate water-stressed nitrifying bacteria, lead- ing to the consumption of accumulated nitrogen and as a by- product, to the release of large pulses of NO [Davidson, 1992, and references therein]. After the excess nitrogen is JOURNAL OF GEOPHYSICAL RESEARCH, VOL. 109, D21310, doi:10.1029/2004JD004787, 2004 1 Department of Atmospheric Sciences, University of Washington, Seattle, Washington, USA. 2 Department of Physics and Atmospheric Science, Dalhousie Uni- versity, Halifax, Nova Scotia, Canada. 3 Also at Harvard-Smithsonian Center for Astrophysics, Cambridge, Massachusetts, USA. 4 Harvard-Smithsonian Center for Astrophysics, Cambridge, Massachu- setts, USA. 5 Division of Engineering and Applied Sciences and Department of Earth and Planetary Sciences, Harvard University, Cambridge, Massachusetts, USA. 6 De ´partement de Physique, Ecole Normale Supe ´rieure, University Abdou Moumouny of Niamey, Niamey, Niger. 7 Laboratoire de Physique de l’Atmosphe `re, Universite ´ de Cocody, Abidjan, Ivory Coast, Africa. 8 Centre de Recherches Hydrologiques, Yaounde ´, Cameroon. 9 Observatoire Midi-Pyre ´ne ´es, Laboratoire d’Ae ´rologie, Toulouse, France. Copyright 2004 by the American Geophysical Union. 0148-0227/04/2004JD004787$09.00 D21310 1 of 10
Transcript
Satellite mapping of rain-induced nitric oxide emissions from soils
L. Jaegle,1 R. V. Martin,2,3 K. Chance,4 L. Steinberger,1 T. P. Kurosu,4 D. J. Jacob,5
A. I. Modi,6 V. Yoboue,7 L. Sigha-Nkamdjou,8 and C. Galy-Lacaux9
Received 18 March 2004; revised 16 July 2004; accepted 5 August 2004; published 12 November 2004.
[1] We use space-based observations of NO2 columns from the Global Ozone MonitoringExperiment (GOME) to map the spatial and seasonal variations of NOx emissions overAfrica during 2000. The GOME observations show not only enhanced troposphericNO2 columns from biomass burning during the dry season but also comparableenhancements from soil emissions during the rainy season over the Sahel. These soilemissions occur in strong pulses lasting 1–3 weeks following the onset of rain, and affect3 million km2 of semiarid sub-Saharan savanna. Surface observations of NO2 from theInternational Global Atmospheric Chemistry (IGAC)/Deposition of BiochemicallyImportant Trace Species (DEBITS)/Africa (IDAF) network over West Africa providefurther evidence for a strong role for microbial soil sources. By combining inversemodeling of GOME NO2 columns with space-based observations of fires, we estimatethat soils contribute 3.3 ± 1.8 TgN/year, similar to the biomass burning source(3.8 ± 2.1 TgN/year), and thus account for 40% of surface NOx emissions over Africa.Extrapolating to all the tropics, we estimate a 7.3 TgN/year biogenic soil source, which isa factor of 2 larger compared to model-based inventories but agrees with observation-based inventories. These large soil NOx emissions are likely to significantly contribute tothe ozone enhancement originating from tropical Africa. INDEX TERMS: 0315 Atmospheric
Composition and Structure: Biosphere/atmosphere interactions; 0322 Atmospheric Composition and
Structure: Constituent sources and sinks; 0365 Atmospheric Composition and Structure: Troposphere—
composition and chemistry; 1640 Global Change: Remote sensing; 3354 Meteorology and Atmospheric
Citation: Jaegle, L., R. V. Martin, K. Chance, L. Steinberger, T. P. Kurosu, D. J. Jacob, A. I. Modi, V. Yoboue, L. Sigha-Nkamdjou,
and C. Galy-Lacaux (2004), Satellite mapping of rain-induced nitric oxide emissions from soils, J. Geophys. Res., 109, D21310,
doi:10.1029/2004JD004787.
1. Introduction
[2] Emissions of atmospheric nitrogen oxides (NOx, thesum of nitric oxide and nitrogen dioxide, NO + NO2) leadto hemispheric-scale enhancements in tropospheric ozone,rain acidification, and increased oxidizing capacity of the
troposphere. In addition, through their influence on aerosolcomposition and on the burdens of many greenhouse gases(ozone, methane, and hydrofluorocarbons), NOx emissionsindirectly affect the Earth’s radiative balance [Prather andEhhalt, 2001]. Human-initiated fires are the main anthro-pogenic source of NOx in tropical regions, while fossil fuelcombustion dominates anthropogenic sources in NorthernHemisphere midlatitudes [Logan, 1983; Penner et al., 1991;Holland and Lamarque, 1997]. Natural sources includemicrobial processes in soils, lightning and transport fromthe stratosphere.[3] Tropical soils have been identified as significant NOx
sources, accounting for nearly 70% of global soil emissions[Yienger and Levy, 1995]. Many field and laboratory experi-ments have reported large pulses of biogenic NO emissionsfollowing rain on dry soils of savannas and seasonally dryforests [Johansson and Sanhueza, 1988; Davidson, 1992;Harris et al., 1996; Levine et al., 1996; Scholes et al.,1997]. Long dry periods in these tropical ecosystems allowsoils to accumulate inorganic nitrogen. The first rains of thewet season activate water-stressed nitrifying bacteria, lead-ing to the consumption of accumulated nitrogen and as a by-product, to the release of large pulses of NO [Davidson,1992, and references therein]. After the excess nitrogen is
JOURNAL OF GEOPHYSICAL RESEARCH, VOL. 109, D21310, doi:10.1029/2004JD004787, 2004
1Department of Atmospheric Sciences, University of Washington,Seattle, Washington, USA.
2Department of Physics and Atmospheric Science, Dalhousie Uni-versity, Halifax, Nova Scotia, Canada.
3Also at Harvard-Smithsonian Center for Astrophysics, Cambridge,Massachusetts, USA.
4Harvard-Smithsonian Center for Astrophysics, Cambridge, Massachu-setts, USA.
5Division of Engineering and Applied Sciences and Department of Earthand Planetary Sciences, Harvard University, Cambridge, Massachusetts,USA.
6Departement de Physique, Ecole Normale Superieure, UniversityAbdou Moumouny of Niamey, Niamey, Niger.
7Laboratoire de Physique de l’Atmosphere, Universite de Cocody,Abidjan, Ivory Coast, Africa.
8Centre de Recherches Hydrologiques, Yaounde, Cameroon.9Observatoire Midi-Pyrenees, Laboratoire d’Aerologie, Toulouse,
France.
Copyright 2004 by the American Geophysical Union.0148-0227/04/2004JD004787$09.00
D21310 1 of 10
consumed, wet season NO emissions decrease but remain atrelatively high levels compared to the dry season [Serca etal., 1998].[4] The inherent large spatial and temporal inhomogene-
ity in soil-atmospheric NOx exchange has lead to poorlyconstrained estimates of its contribution to the globalNOx budget: 5–21 TgN/year (1 Tg = 1012g) [Logan,1983; Davidson, 1991; Muller, 1992; Yienger andLevy, 1995; Potter et al., 1996; Davidson and Kingerlee,1997]. The upper end of these estimates is comparableto global NOx emissions from fossil fuel combustion (20–24 TgN/year). The most commonly used methods todetermine these emissions are ‘‘bottom-up’’ approaches,which include global extrapolations of surface fluxmeasurements [Davidson, 1991; Davidson and Kingerlee,1997], semiempirical models [Muller, 1992; Yienger andLevy, 1995], and more complex process-based models ofland-vegetation biogeochemistry [Potter et al., 1996; Partonet al., 2001]. Uncertainties in each of these inventories aredifficult to estimate and are potentially very large (±5–10 TgN/year) [Davidson and Kingerlee, 1997], in partbecause of the role of plant canopy in recapturing soil NOx
[Jacob and Bakwin, 1991; Ganzeveld et al., 2002].[5] Space-based observations of NO2 columns from the
Global Ozone Monitoring Experiment (GOME) on boardthe European Remote Sensing (ERS-2) satellite [Bednarz,1995] directly track surface NOx emissions because of theshort lifetime of NOx (<1 day) and the high NO2/NOx ratio(>0.8) in the boundary layer. These observations can thusprovide an independent ‘‘top-down’’ constraint to improveNOx emission inventories, as recently demonstrated by Leueet al. [2001] and Martin et al. [2003].[6] In this study, we focus on Africa during 2000 and
show that remotely sensed GOME tropospheric NO2 col-umns can map the elusive first-rains pulse. We partitionNOx sources between biomass burning, soils, fossil fuelcombustion and domestic biomass fuel (biofuel) combus-tion by exploiting the spatiotemporal distribution of firesobserved on the Tropical Rainfall Measuring Mission(TRMM) satellite. This allows us to quantify soil NOx
emissions and contrast them to biomass burning emissions.In addition, we use surface NO2 observations from theInternational Global Atmospheric Chemistry (IGAC)/Deposition of Biochemically Important Trace Species(DEBITS)/Africa (IDAF) network of passive samplers inWest Africa to support our findings.
2. Observations and Methods
2.1. Satellite Observations
[7] The GOME instrument, in a Sun-synchronous orbitaboard the ERS-2 satellite, is a nadir-viewing spectrometerwith a ground footprint of 320 km (across-track) by 40 km(along-track) that achieves global coverage in 3 days.GOME measures sunlight reflected by the Earth at ultravi-olet, visible and near-infrared wavelengths, thus detectingabsorption of atmospheric NO2. Slant columns of NO2 forthe year 2000 are obtained by nonlinear least squares fittingof backscattered radiance spectra over the 423–451 nmspectral region [Chance et al., 2000; Martin et al., 2003].[8] Stratospheric NO2 column and instrument biases are
removed followingMartin et al. [2002a]. The air mass factor
(AMF) calculation, used to convert the tropospheric slantcolumns to vertical columns, accounts for scattering by thesurface, clouds, aerosols and gases in the atmosphere [Martinet al., 2002a, 2003]. Local cloud information is obtainedfrom the GOME Cloud Retrieval Algorithm (GOMECAT)[Kurosu et al., 1999]. The GEOS-CHEM global model oftropospheric chemistry and the GOCART global model oftropospheric aerosols (section 2.3) are used to specify thevertical shape factor of NO2 and aerosol profiles. Of partic-ular interest to our study is the application of the aerosolcorrection to the AMF calculation, as developed byMartin etal. [2003]. High levels of absorbing aerosols over biomassburning regions lead to a reduction of the AMF by up to 40%over the African biomass burning regions.[9] To minimize uncertainties, all reported GOME col-
umns are for scenes where less than 50% of backscatteredradiation comes from clouds, corresponding to cloud cover<40% (unless otherwise noted). Uncertainties for eachGOME scene include a 1015 molecules cm�2 absolute errorfrom spectral fitting and removal of the stratosphere, and a42% relative error from the AMF calculation (includingerrors from surface reflectivity, NO2 profile, aerosols, cloudcover and radiative transfer). These errors result in a monthlymean tropospheric column relative uncertainty of �30%and a 5 � 1014 molecules cm�2 absolute uncertainty foreach 2� latitude by 2.5� longitude grid box, assuming randomerrors in spectral fitting, surface reflectivity and clouds.[10] Infrared emission from fires is detected by the Visible
and Infrared Scanner (VIRS) on board TRMM. We use herethe monthly gridded product (0.5� � 0.5�) [Giglio et al.,2003]. In addition, we use the monthly and daily TRMMprecipitation products (3B43 and 3B42), which combineTRMM observations together with observations from geo-synchronous infrared satellite data and rain gauge informa-tion [Adler et al., 2000]. These precipitation products havebeen validated against a high-density rain gauge data setover West Africa and show no bias [Nicholson et al., 2003].Finally, we use lightning detected by the Lightning ImagingSensor (LIS) on board TRMM [Christian et al., 1999]. Wegridded the lightning flashes on a 1� � 1� degree grid toobtain monthly and daily maps.
2.2. IDAF Surface NO2 Observations
[11] Monthly surface measurements of NO2 from theIDAF network in Africa (http://medias.obs-mip.fr/idaf) areobtained with passive samplers [Galy-Lacaux et al., 2001].Ambient air diffuses to a filter impregnated in an iodine saltsolution, resulting in the conversion of NO2 to NO2
�:2 NO2(g) + 3I� ! 2 NO2
� + I3�. The filters are exposed for
onemonth and then are analyzed by ion chromatography. Thedetection limit is 0.3 ppbv and the reproducibility is 3.7%.[12] This technique has been tested in urban, rural and
remote stations [Ferm and Rodhe, 1997; Ferm and Svanberg,1998]. The passive samplers have also been tested andvalidated for the IDAF network since the beginning of1998 [Al Ourabi and Lacaux, 1999]. The three IDAF sitesdiscussed here, Banizoumbou in Niger (13.3�N, 2.4�E),Lamto in Ivory Coast (6.1�N, 5.0�W) and Zoetele inCameroon (3.1�N, 11.6�E), are located along a transectrepresentative of the semiarid savanna, humid savannaand forested equatorial ecosystems [Galy-Lacaux and Modi,1998; Sigha-Nkamdjou et al., 2003]. These sites are remote
D21310 JAEGLE ET AL.: SATELLITE MAPPING OF SOIL NOX
2 of 10
D21310
from urban and industrial influence. We use monthlyobservations for 2000 as well as mean monthly observationsfor the 1998–2001 time period.
2.3. Global Models
[13] The GEOS-CHEM global three-dimensional modelof tropospheric chemistry [Bey et al., 2001] is driven byassimilated meteorological fields for 2000 from the God-dard Earth Observing System (GEOS) Global Modeling andAssimilation Office with a horizontal resolution of 2�latitude by 2.5� longitude and 30 vertical levels. Modelversion 5.05 (http://www-as.harvard.edu/trop/chemistry/geos) is used in our analysis.[14] The model NOx inventory includes emissions from
fossil fuel, biofuel, biomass burning, soil, aircraft, strato-sphere and lightning, as described by Bey et al. [2001] andMartin et al. [2002b]. More specifically, soil emissions arebased on the Yienger and Levy [1995] algorithm, with animproved formulation of the canopy reduction factor [Wanget al., 1998]. Our global above-canopy emission of NOx
from soils (6.3 TgN/year) is 15% higher compared to that ofYienger and Levy [1995]. Anthropogenic emissions are fromthe Global Emission Inventory Activity (GEIA) [Benkovitzet al., 1996], scaled to 1998 levels. Biofuel emissions arefrom Yevich and Logan [2003]. We use interannuallyvarying biomass burning emissions determined by satelliteobservations of fire counts and aerosols [Duncan et al.,2003], with vegetation-specific emissions factors describedin the work of Staudt et al. [2003]. Over Africa (southof 18�N), the GEOS-CHEM surface NOx emissions are5.2 TgN/year: 2.6 TgN/year from biomass burning,1.8 TgN/year from soils, 0.49 TgN/year from fossil fuel,and 0.37 TgN/year from biofuel.[15] The GOCART model of tropospheric aerosols [Chin
et al., 2002] is driven by the same meteorological fields asGEOS-CHEM (year 2000) and simulates the transport of5 classes of aerosols: sulfate, dust, organic carbon, blackcarbon and sea-salt aerosols. GOCART also uses the inter-annually varying biomass burning inventory developedby Duncan et al. [2003]. These monthly mean aerosolfields are used both in the GEOS-CHEM simulation toaccount for the photochemical effects of aerosols, as well asin the AMF calculation to account for aerosol extinction(see section 2.1).
3. Seasonal Variations of NO2 Over Africa
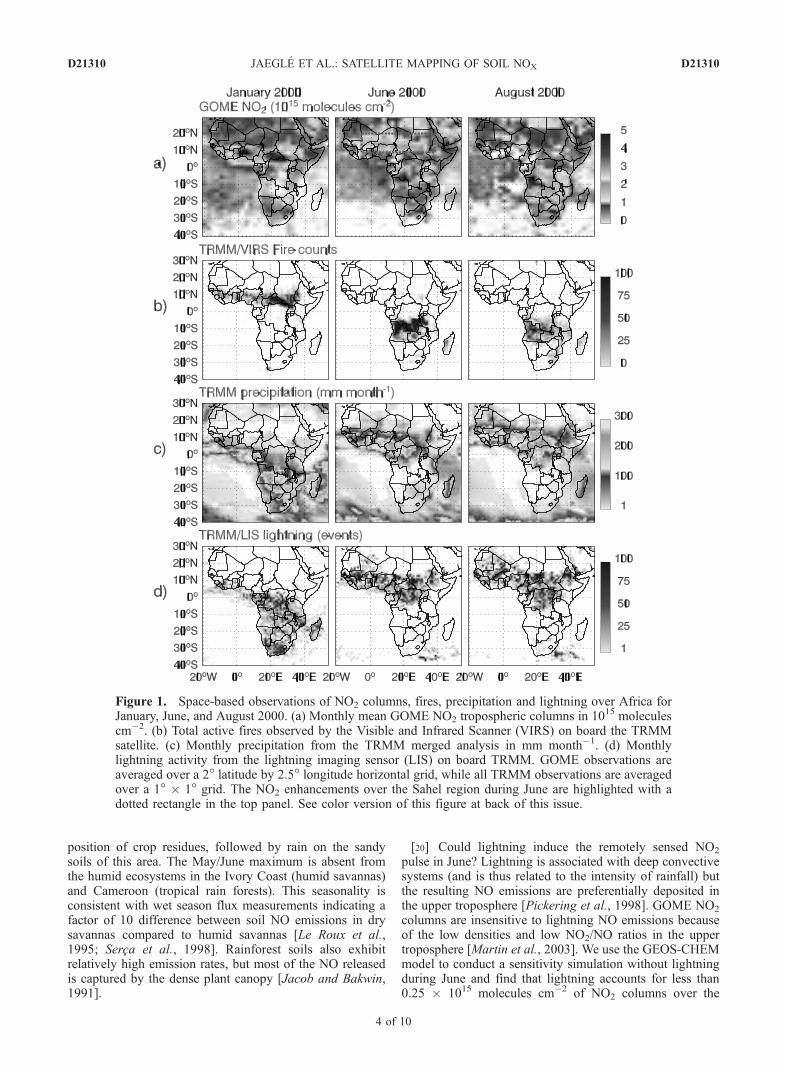
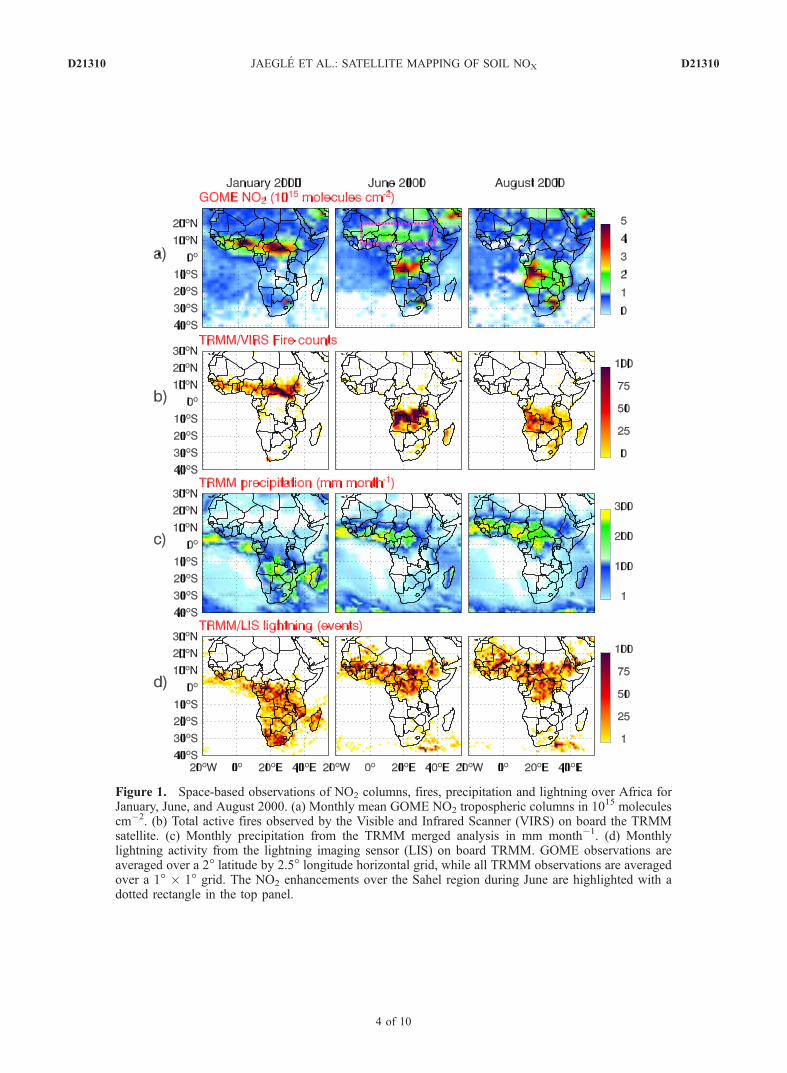
[16] GOME observations of tropospheric NO2 columnsover Africa are shown in Figure 1 (top) for January, Juneand August 2000. Also shown are observations of activefires, precipitation and lightning from the TRMM satellite.African fires are predominantly human-initiated throughdeforestation, shifting cultivation, gaming, and clearanceof agricultural residue [Crutzen and Andreae, 1990]. Thesefires have a well-known seasonality [Hao and Liu, 1994],which corresponds to the dry (winter) seasons in eachhemisphere: a northern fire belt in November–February,and a southern fire belt in June–October. Enhanced NO2
columns (>3 � 1015 molecules cm�2) clearly map ontothese areas of intense biomass burning (Figure 1). Highlevels of NO2 over the industrial Highveld region ofSouth Africa and oil-producing Saudi Arabia and Egypt
are also detected by GOME. In addition, unexpectedly largeNO2 columns (>1–2 � 1015 molecules cm�2) are observedover 3 million km2 of semiarid savannas in the so-calledSahel region during June, when no fires occur and noindustrial emissions are expected. We will argue that thisrepresents the first satellite evidence of microbial NOx pulsesfollowing the onset of rainfall over vast areas of dry soils. Asthe heavy rainfall migrates northward in August, followingthe movement of the Intertropical Convergence Zone(ITCZ), these NO2 enhancements over the Sahel regiondisappear.[17] To further document these enhancements over the
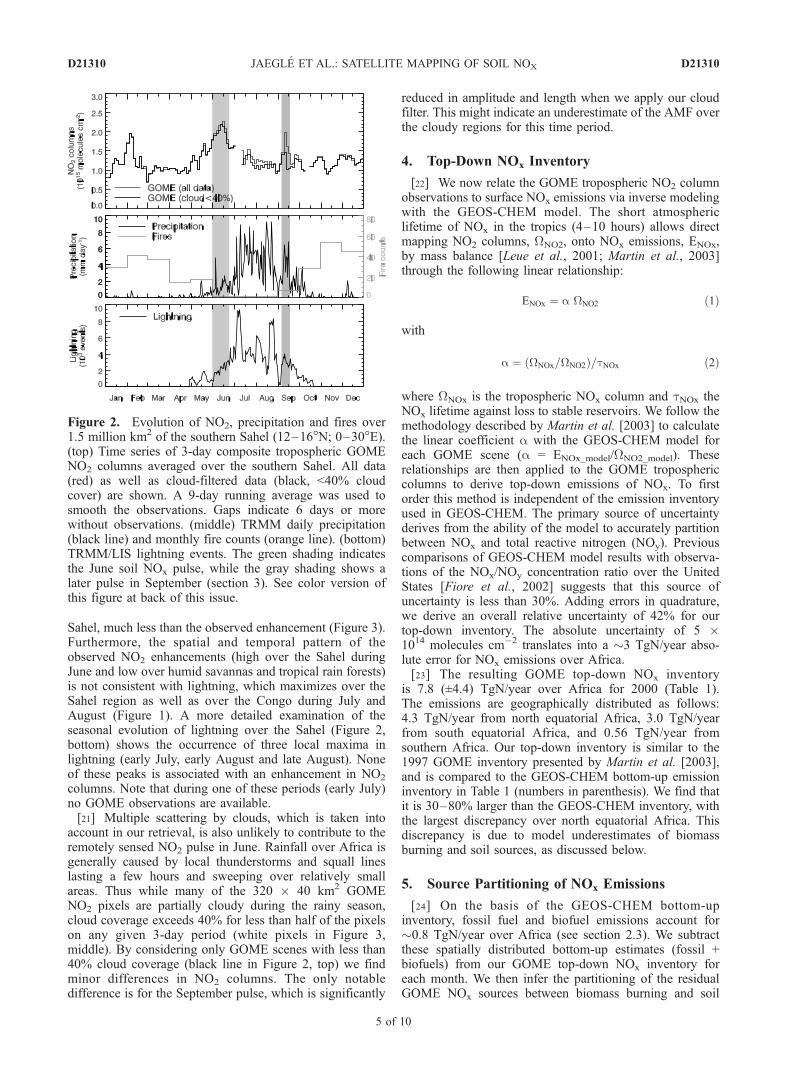
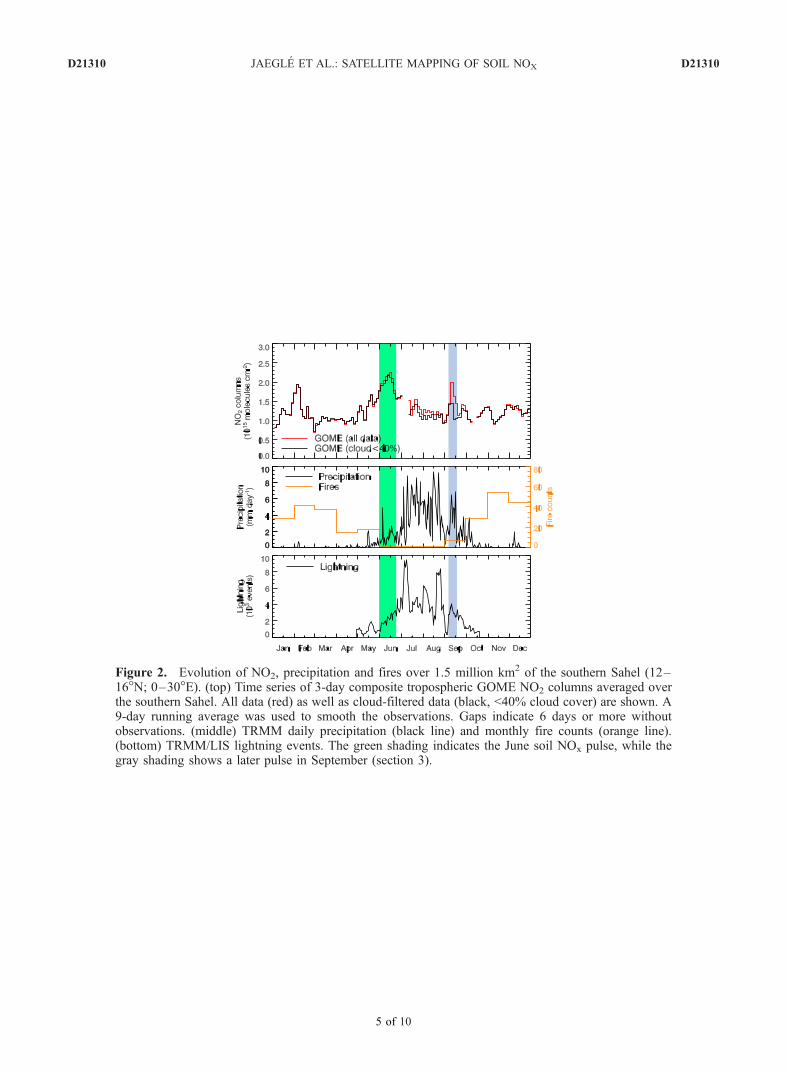
Sahel, we examine the temporal variations of NO2, fires,rainfall and lightning over an area spanning from Mali toSudan (12–16�N; 0–30�E). The high tropospheric NO2
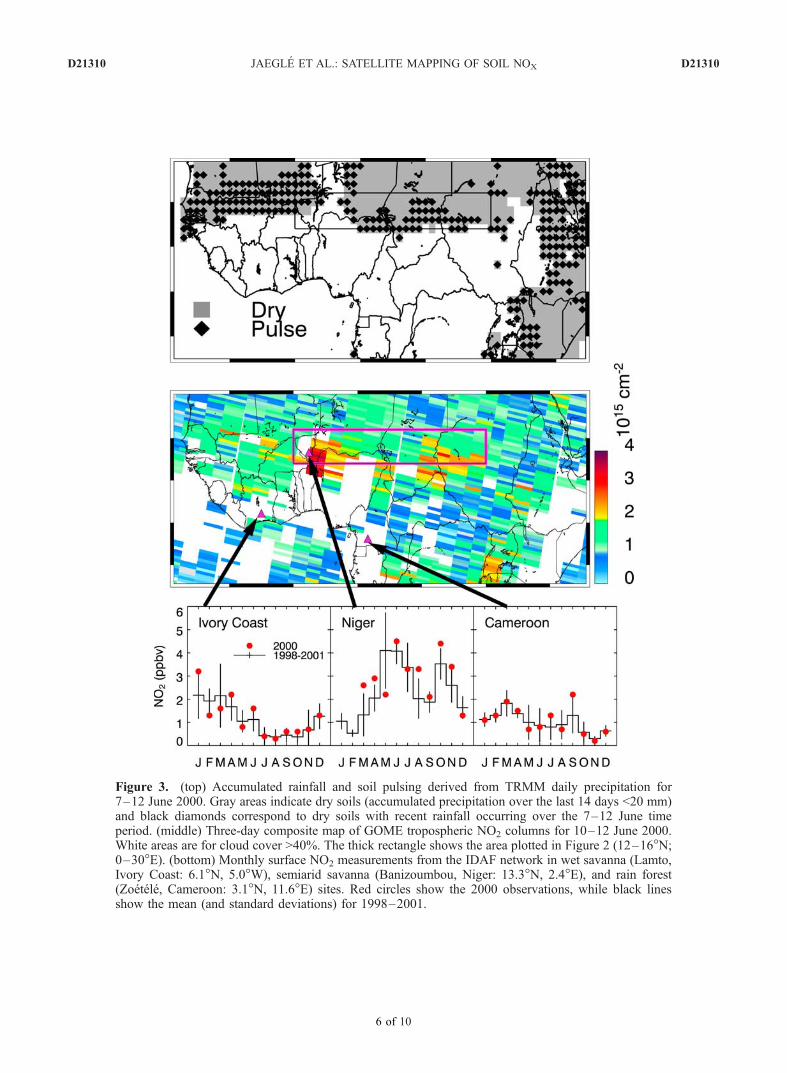
columns in January and February, corresponding to the fireseason, are followed by lower columns in March and April(Figure 2). Mid-May marks the onset of rainfall over thesouthern Sahel after a 6-month dry season, and NO2 columnsbegin to increase. By mid-June these first rains have wettedprogressively larger areas and the NO2 pulse reaches itsmaximum at 2.2 � 1015 molecules cm�2 (Figure 2, greenshading). Assuming a NOx atmospheric lifetime of 7 hoursagainst oxidation, this corresponds to an average emissionflux of 20 ng Nm�2s�1, which is within the range of reportedfield measurement values (6–60 ng N m�2s�1) [Johanssonand Sanhueza, 1988; Davidson, 1992; Levine et al., 1996;Scholes et al., 1997; Serca et al., 1998]. A later pulse occursin September (Figure 2, gray shading). This pulse appears tobe triggered by the return of rain after a 2-week dry period,but it could also be related to the beginning of the burningseason.[18] Figure 3 (middle) shows a three-day composite map
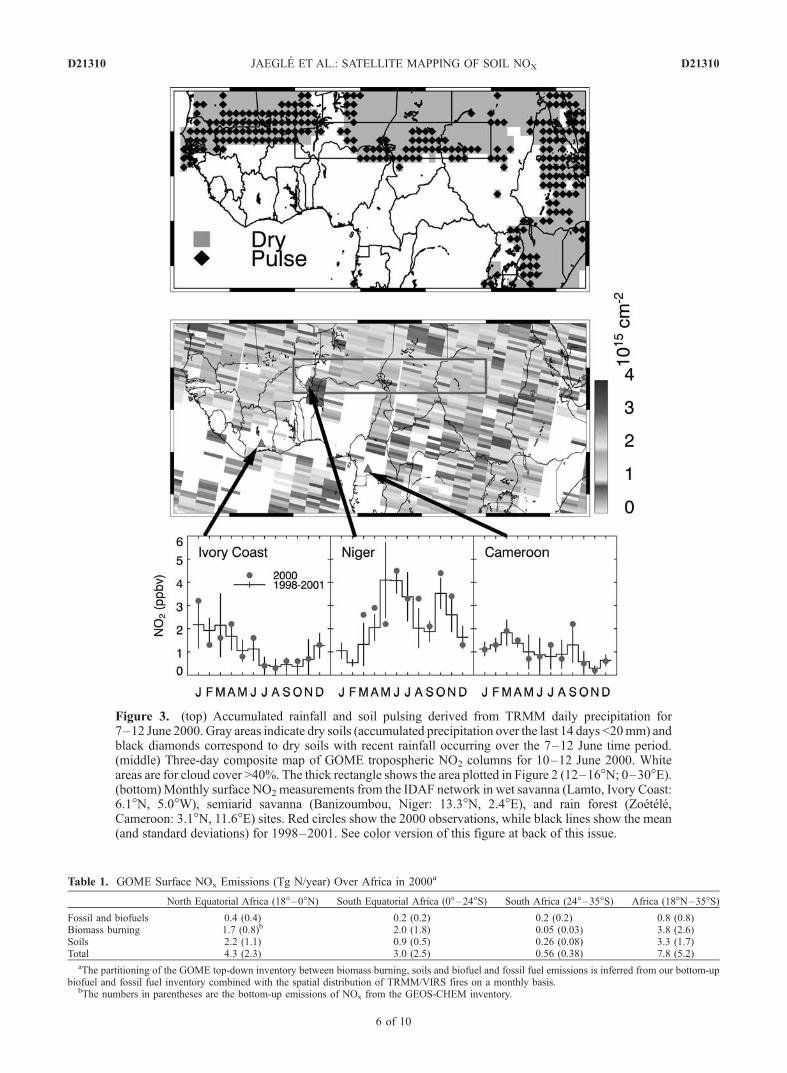
of GOME NO2 columns for 10–12 June. During that timeperiod, the pulse covers a strikingly large area of semiaridsavannas, with the largest columns (>3.5 � 1015 moleculescm�2) observed at the borders of Benin, Niger and Nigeria.The top panel of Figure 3 indicates dry soils (cumulativeprecipitation over last 14 days <20 mm, gray) and regions ofpulsing (dry soils with rain occurring over the 7–12 Junetime period, diamonds). This analysis represents a first-order estimate of soil moisture, which affect soil NOx
emissions, but it is only an approximation, as it does nottake into account soil properties. Pulsing regions are gen-erally colocated with the NO2 enhancements, with theexception of the Benin/Niger/Nigeria borders. Local differ-ences in soil type and porosity might be causing thisdiscrepancy, but other explanations such as local retrievalerrors associated with clouds and/or aerosols are alsopossible.[19] Surface observations of NO2 from the IDAF network
over West Africa provide further evidence for a large rolefor microbial soil emissions of NOx (Figure 3, bottom).Both monthly observations for 2000 as well as averageconcentrations for the 1998–2001 time period are shown.The site in the semiarid savannas of Niger shows amaximum at the onset of the rainy season in May/June,with a secondary maximum associated with biomass burn-ing in October/November. The first maximum is consistentwith the emission of inorganic nitrogen that accumulatedin soils during the dry season from traditional agriculturalpractices such as grazing, manure application and decom-
D21310 JAEGLE ET AL.: SATELLITE MAPPING OF SOIL NOX
3 of 10
D21310
position of crop residues, followed by rain on the sandysoils of this area. The May/June maximum is absent fromthe humid ecosystems in the Ivory Coast (humid savannas)and Cameroon (tropical rain forests). This seasonality isconsistent with wet season flux measurements indicating afactor of 10 difference between soil NO emissions in drysavannas compared to humid savannas [Le Roux et al.,1995; Serca et al., 1998]. Rainforest soils also exhibitrelatively high emission rates, but most of the NO releasedis captured by the dense plant canopy [Jacob and Bakwin,1991].
[20] Could lightning induce the remotely sensed NO2
pulse in June? Lightning is associated with deep convectivesystems (and is thus related to the intensity of rainfall) butthe resulting NO emissions are preferentially deposited inthe upper troposphere [Pickering et al., 1998]. GOME NO2
columns are insensitive to lightning NO emissions becauseof the low densities and low NO2/NO ratios in the uppertroposphere [Martin et al., 2003]. We use the GEOS-CHEMmodel to conduct a sensitivity simulation without lightningduring June and find that lightning accounts for less than0.25 � 1015 molecules cm�2 of NO2 columns over the
Figure 1. Space-based observations of NO2 columns, fires, precipitation and lightning over Africa forJanuary, June, and August 2000. (a) Monthly mean GOME NO2 tropospheric columns in 1015 moleculescm�2. (b) Total active fires observed by the Visible and Infrared Scanner (VIRS) on board the TRMMsatellite. (c) Monthly precipitation from the TRMM merged analysis in mm month�1. (d) Monthlylightning activity from the lightning imaging sensor (LIS) on board TRMM. GOME observations areaveraged over a 2� latitude by 2.5� longitude horizontal grid, while all TRMM observations are averagedover a 1� � 1� grid. The NO2 enhancements over the Sahel region during June are highlighted with adotted rectangle in the top panel. See color version of this figure at back of this issue.
D21310 JAEGLE ET AL.: SATELLITE MAPPING OF SOIL NOX
4 of 10
D21310
Sahel, much less than the observed enhancement (Figure 3).Furthermore, the spatial and temporal pattern of theobserved NO2 enhancements (high over the Sahel duringJune and low over humid savannas and tropical rain forests)is not consistent with lightning, which maximizes over theSahel region as well as over the Congo during July andAugust (Figure 1). A more detailed examination of theseasonal evolution of lightning over the Sahel (Figure 2,bottom) shows the occurrence of three local maxima inlightning (early July, early August and late August). Noneof these peaks is associated with an enhancement in NO2
columns. Note that during one of these periods (early July)no GOME observations are available.[21] Multiple scattering by clouds, which is taken into
account in our retrieval, is also unlikely to contribute to theremotely sensed NO2 pulse in June. Rainfall over Africa isgenerally caused by local thunderstorms and squall lineslasting a few hours and sweeping over relatively smallareas. Thus while many of the 320 � 40 km2 GOMENO2 pixels are partially cloudy during the rainy season,cloud coverage exceeds 40% for less than half of the pixelson any given 3-day period (white pixels in Figure 3,middle). By considering only GOME scenes with less than40% cloud coverage (black line in Figure 2, top) we findminor differences in NO2 columns. The only notabledifference is for the September pulse, which is significantly
reduced in amplitude and length when we apply our cloudfilter. This might indicate an underestimate of the AMF overthe cloudy regions for this time period.
4. Top-Down NOx Inventory
[22] We now relate the GOME tropospheric NO2 columnobservations to surface NOx emissions via inverse modelingwith the GEOS-CHEM model. The short atmosphericlifetime of NOx in the tropics (4–10 hours) allows directmapping NO2 columns, WNO2, onto NOx emissions, ENOx,by mass balance [Leue et al., 2001; Martin et al., 2003]through the following linear relationship:
ENOx ¼ a WNO2 ð1Þ
with
a ¼ WNOx=WNO2ð Þ=tNOx ð2Þ
where WNOx is the tropospheric NOx column and tNOx theNOx lifetime against loss to stable reservoirs. We follow themethodology described by Martin et al. [2003] to calculatethe linear coefficient a with the GEOS-CHEM model foreach GOME scene (a = ENOx_model/WNO2_model). Theserelationships are then applied to the GOME troposphericcolumns to derive top-down emissions of NOx. To firstorder this method is independent of the emission inventoryused in GEOS-CHEM. The primary source of uncertaintyderives from the ability of the model to accurately partitionbetween NOx and total reactive nitrogen (NOy). Previouscomparisons of GEOS-CHEM model results with observa-tions of the NOx/NOy concentration ratio over the UnitedStates [Fiore et al., 2002] suggests that this source ofuncertainty is less than 30%. Adding errors in quadrature,we derive an overall relative uncertainty of 42% for ourtop-down inventory. The absolute uncertainty of 5 �1014 molecules cm�2 translates into a �3 TgN/year abso-lute error for NOx emissions over Africa.[23] The resulting GOME top-down NOx inventory
is 7.8 (±4.4) TgN/year over Africa for 2000 (Table 1).The emissions are geographically distributed as follows:4.3 TgN/year from north equatorial Africa, 3.0 TgN/yearfrom south equatorial Africa, and 0.56 TgN/year fromsouthern Africa. Our top-down inventory is similar to the1997 GOME inventory presented by Martin et al. [2003],and is compared to the GEOS-CHEM bottom-up emissioninventory in Table 1 (numbers in parenthesis). We find thatit is 30–80% larger than the GEOS-CHEM inventory, withthe largest discrepancy over north equatorial Africa. Thisdiscrepancy is due to model underestimates of biomassburning and soil sources, as discussed below.
5. Source Partitioning of NOx Emissions
[24] On the basis of the GEOS-CHEM bottom-upinventory, fossil fuel and biofuel emissions account for�0.8 TgN/year over Africa (see section 2.3). We subtractthese spatially distributed bottom-up estimates (fossil +biofuels) from our GOME top-down NOx inventory foreach month. We then infer the partitioning of the residualGOME NOx sources between biomass burning and soil
Figure 2. Evolution of NO2, precipitation and fires over1.5 million km2 of the southern Sahel (12–16�N; 0–30�E).(top) Time series of 3-day composite tropospheric GOMENO2 columns averaged over the southern Sahel. All data(red) as well as cloud-filtered data (black, <40% cloudcover) are shown. A 9-day running average was used tosmooth the observations. Gaps indicate 6 days or morewithout observations. (middle) TRMM daily precipitation(black line) and monthly fire counts (orange line). (bottom)TRMM/LIS lightning events. The green shading indicatesthe June soil NOx pulse, while the gray shading shows alater pulse in September (section 3). See color version ofthis figure at back of this issue.
D21310 JAEGLE ET AL.: SATELLITE MAPPING OF SOIL NOX
5 of 10
D21310
Figure 3. (top) Accumulated rainfall and soil pulsing derived from TRMM daily precipitation for7–12 June 2000. Gray areas indicate dry soils (accumulated precipitation over the last 14 days <20mm) andblack diamonds correspond to dry soils with recent rainfall occurring over the 7–12 June time period.(middle) Three-day composite map of GOME tropospheric NO2 columns for 10–12 June 2000. Whiteareas are for cloud cover >40%. The thick rectangle shows the area plotted in Figure 2 (12–16�N; 0–30�E).(bottom)Monthly surface NO2measurements from the IDAF network in wet savanna (Lamto, Ivory Coast:6.1�N, 5.0�W), semiarid savanna (Banizoumbou, Niger: 13.3�N, 2.4�E), and rain forest (Zoetele,Cameroon: 3.1�N, 11.6�E) sites. Red circles show the 2000 observations, while black lines show the mean(and standard deviations) for 1998–2001. See color version of this figure at back of this issue.
Table 1. GOME Surface NOx Emissions (Tg N/year) Over Africa in 2000a
North Equatorial Africa (18�–0�N) South Equatorial Africa (0�–24�S) South Africa (24�–35�S) Africa (18�N–35�S)
aThe partitioning of the GOME top-down inventory between biomass burning, soils and biofuel and fossil fuel emissions is inferred from our bottom-upbiofuel and fossil fuel inventory combined with the spatial distribution of TRMM/VIRS fires on a monthly basis.
bThe numbers in parentheses are the bottom-up emissions of NOx from the GEOS-CHEM inventory.
D21310 JAEGLE ET AL.: SATELLITE MAPPING OF SOIL NOX
6 of 10
D21310
sources from the spatial location of fires. For each monthand each 2� � 2.5� grid box where at least 20 fire counts aredetected we assume that all NOx emissions are associatedwith biomass burning. This method is likely to lead to anupper estimate of biomass burning emissions as some non-burning sources are expected to be present even when thereare fires. The use of other remotely sensed fire data sets(Along Track Scanning Radiometer (ATSR) sensor onboard the ERS-2 satellite, and Global Burned Area productfrom the SPOT-VEGETATION instrument) does not affectour partitioning by more than 10% as we are only using thespatial distribution of fires, not their intensity.[25] The biomass burning component of the GOME
NOx emissions is 40% for north equatorial Africa, 60%for south equatorial Africa, and 10% for southern Africa(Table 1). The total contribution from biomass burningover Africa is 3.8 (±2.1) TgN/year, within the rangeof previous estimates (2.8–5 TgN/year) [Scholes andAndreae, 2000; Hoelzemann et al., 2004]. Our top-downGOME inventory agrees with the GEOS-CHEM inventoryover south equatorial Africa, but is a factor of two higherover north equatorial Africa. As noted by Martin et al.[2003], this is likely a result of an underestimate of theNO emission factor (EF) used in our inventory for northAfrican savannas (EF = 1.1 gNO/kg dry matter) [Staudt etal., 2003]. This emission factor was based on fieldsmeasurements obtained in the wet savannas of the Ivorycoast [Lacaux et al., 1996], which might not be represen-tative of dry savanna burning. Increasing the emissionfactor closer to values observed in South African savannas(3.9 g/kg) [Andreae and Merlet, 2001] would bring the
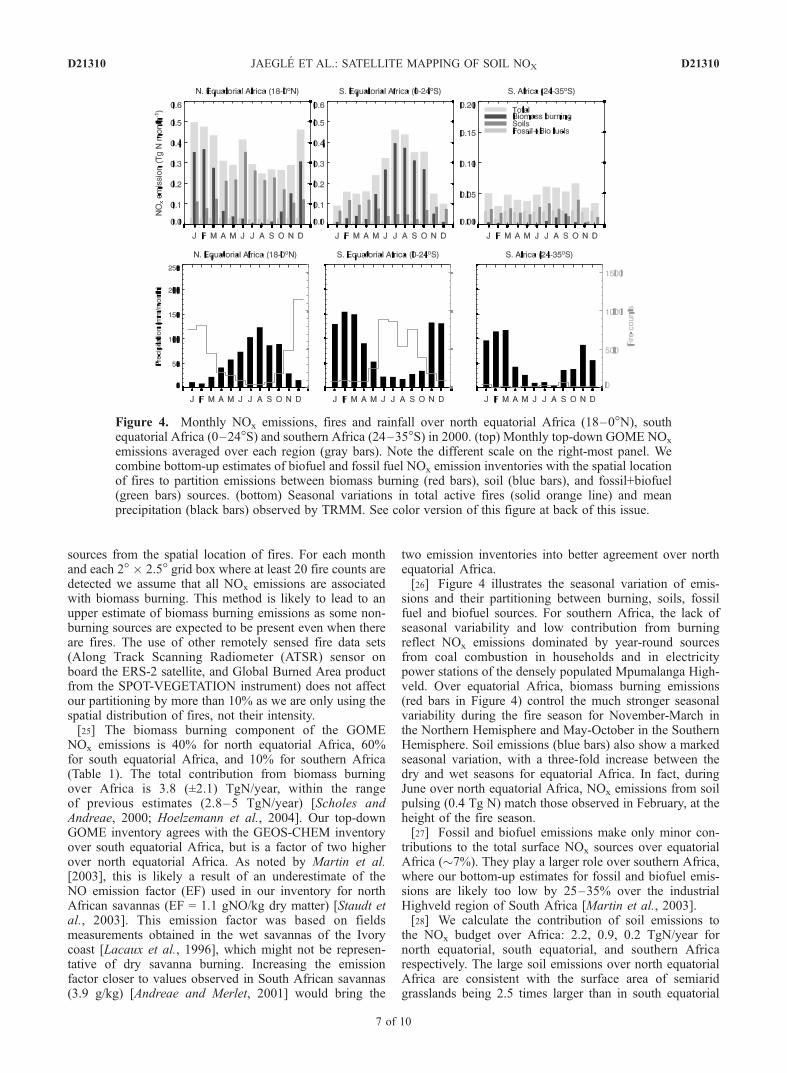
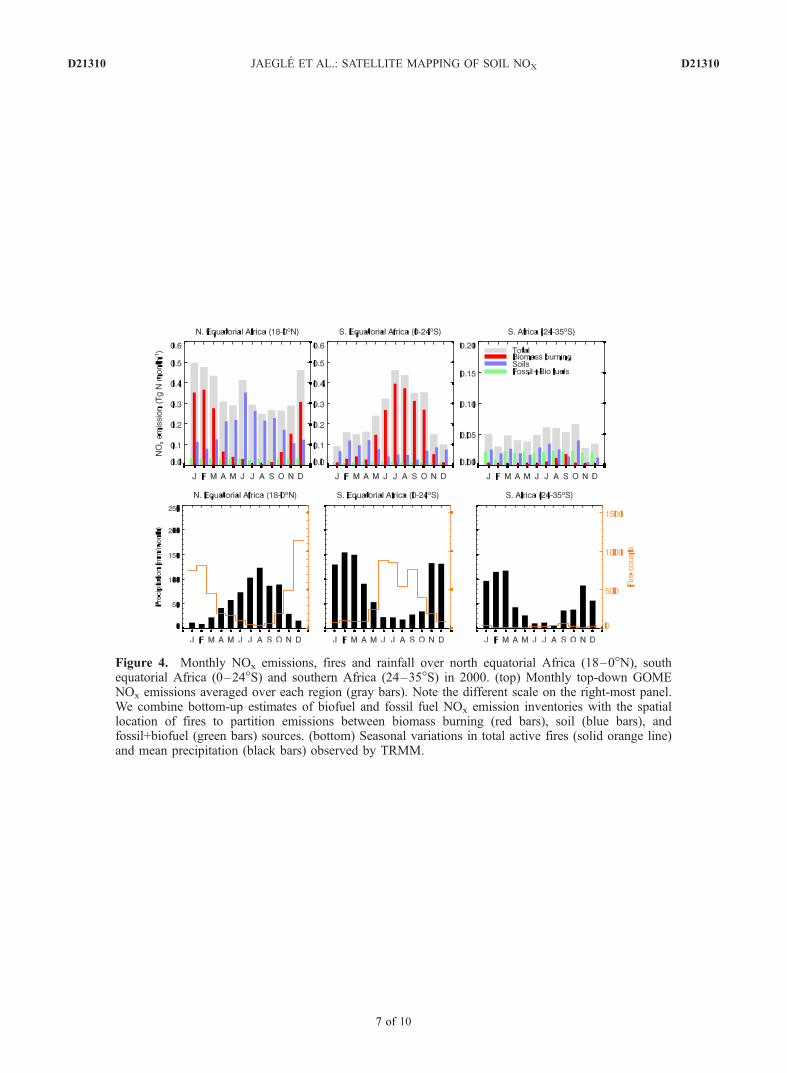
two emission inventories into better agreement over northequatorial Africa.[26] Figure 4 illustrates the seasonal variation of emis-
sions and their partitioning between burning, soils, fossilfuel and biofuel sources. For southern Africa, the lack ofseasonal variability and low contribution from burningreflect NOx emissions dominated by year-round sourcesfrom coal combustion in households and in electricitypower stations of the densely populated Mpumalanga High-veld. Over equatorial Africa, biomass burning emissions(red bars in Figure 4) control the much stronger seasonalvariability during the fire season for November-March inthe Northern Hemisphere and May-October in the SouthernHemisphere. Soil emissions (blue bars) also show a markedseasonal variation, with a three-fold increase between thedry and wet seasons for equatorial Africa. In fact, duringJune over north equatorial Africa, NOx emissions from soilpulsing (0.4 Tg N) match those observed in February, at theheight of the fire season.[27] Fossil and biofuel emissions make only minor con-
tributions to the total surface NOx sources over equatorialAfrica (�7%). They play a larger role over southern Africa,where our bottom-up estimates for fossil and biofuel emis-sions are likely too low by 25–35% over the industrialHighveld region of South Africa [Martin et al., 2003].[28] We calculate the contribution of soil emissions to
the NOx budget over Africa: 2.2, 0.9, 0.2 TgN/year fornorth equatorial, south equatorial, and southern Africarespectively. The large soil emissions over north equatorialAfrica are consistent with the surface area of semiaridgrasslands being 2.5 times larger than in south equatorial
Figure 4. Monthly NOx emissions, fires and rainfall over north equatorial Africa (18–0�N), southequatorial Africa (0–24�S) and southern Africa (24–35�S) in 2000. (top) Monthly top-down GOME NOx
emissions averaged over each region (gray bars). Note the different scale on the right-most panel. Wecombine bottom-up estimates of biofuel and fossil fuel NOx emission inventories with the spatial locationof fires to partition emissions between biomass burning (red bars), soil (blue bars), and fossil+biofuel(green bars) sources. (bottom) Seasonal variations in total active fires (solid orange line) and meanprecipitation (black bars) observed by TRMM. See color version of this figure at back of this issue.
D21310 JAEGLE ET AL.: SATELLITE MAPPING OF SOIL NOX
7 of 10
D21310
Africa. Our top-down soil emissions over southern Africaare likely to be too high because of the underestimate offossil and biofuel emissions noted above. Overall, soilemissions (3.3 ± 1.8 TgN/year) account for 40% of surfaceNOx emissions over Africa.[29] Extrapolating to all the tropics (Africa represents
�40% of tropical soils), we estimate a 7.3 TgN/yearbiogenic soil source that is consistent with the experimen-tally based inventory of Davidson and Kingerlee [1997](7.9 TgN/year), but is a factor of two larger than thesemiempirical model of Yienger and Levy [1995](3.65 TgN/year) and process-based model of Potter et al.[1996] (3.45 TgN/year). These numbers include the Yiengerand Levy canopy reduction and were obtained by adding thetropical grassland, tropical woodland, dry forest, rain forestand tropical agriculture categories listed by these authors.[30] The two-fold difference between model-based and
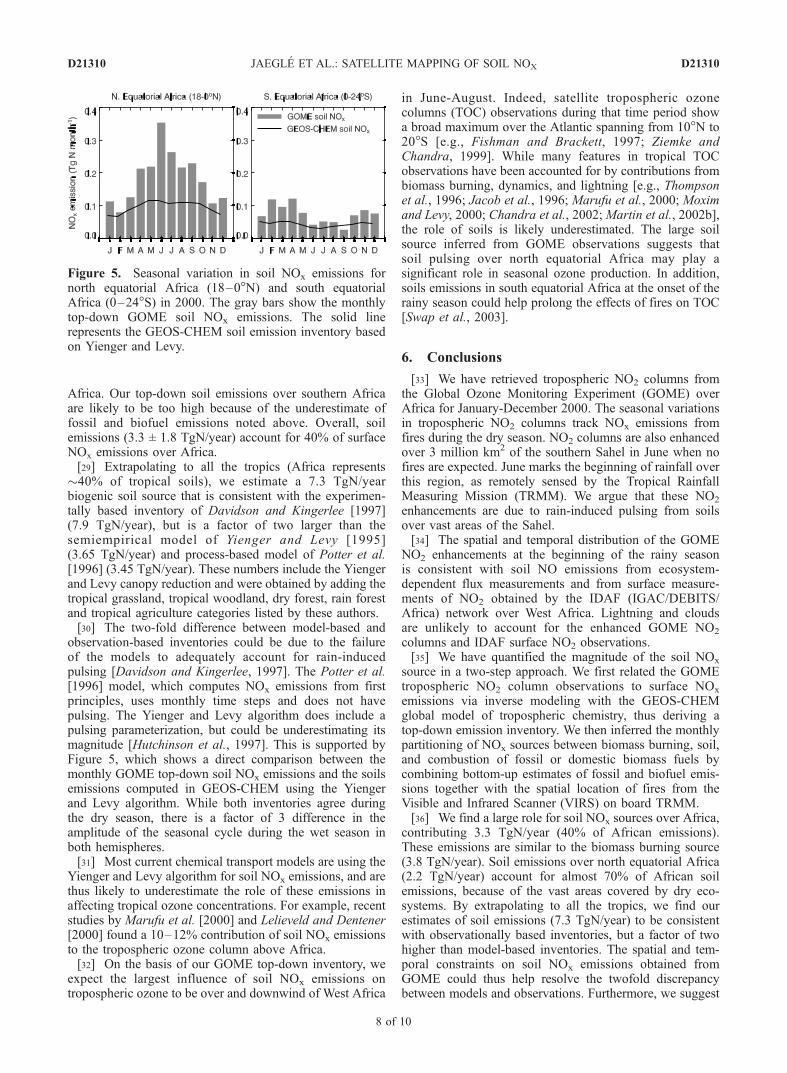
observation-based inventories could be due to the failureof the models to adequately account for rain-inducedpulsing [Davidson and Kingerlee, 1997]. The Potter et al.[1996] model, which computes NOx emissions from firstprinciples, uses monthly time steps and does not havepulsing. The Yienger and Levy algorithm does include apulsing parameterization, but could be underestimating itsmagnitude [Hutchinson et al., 1997]. This is supported byFigure 5, which shows a direct comparison between themonthly GOME top-down soil NOx emissions and the soilsemissions computed in GEOS-CHEM using the Yiengerand Levy algorithm. While both inventories agree duringthe dry season, there is a factor of 3 difference in theamplitude of the seasonal cycle during the wet season inboth hemispheres.[31] Most current chemical transport models are using the
Yienger and Levy algorithm for soil NOx emissions, and arethus likely to underestimate the role of these emissions inaffecting tropical ozone concentrations. For example, recentstudies by Marufu et al. [2000] and Lelieveld and Dentener[2000] found a 10–12% contribution of soil NOx emissionsto the tropospheric ozone column above Africa.[32] On the basis of our GOME top-down inventory, we
expect the largest influence of soil NOx emissions ontropospheric ozone to be over and downwind of West Africa
in June-August. Indeed, satellite tropospheric ozonecolumns (TOC) observations during that time period showa broad maximum over the Atlantic spanning from 10�N to20�S [e.g., Fishman and Brackett, 1997; Ziemke andChandra, 1999]. While many features in tropical TOCobservations have been accounted for by contributions frombiomass burning, dynamics, and lightning [e.g., Thompsonet al., 1996; Jacob et al., 1996; Marufu et al., 2000; Moximand Levy, 2000; Chandra et al., 2002; Martin et al., 2002b],the role of soils is likely underestimated. The large soilsource inferred from GOME observations suggests thatsoil pulsing over north equatorial Africa may play asignificant role in seasonal ozone production. In addition,soils emissions in south equatorial Africa at the onset of therainy season could help prolong the effects of fires on TOC[Swap et al., 2003].
6. Conclusions
[33] We have retrieved tropospheric NO2 columns fromthe Global Ozone Monitoring Experiment (GOME) overAfrica for January-December 2000. The seasonal variationsin tropospheric NO2 columns track NOx emissions fromfires during the dry season. NO2 columns are also enhancedover 3 million km2 of the southern Sahel in June when nofires are expected. June marks the beginning of rainfall overthis region, as remotely sensed by the Tropical RainfallMeasuring Mission (TRMM). We argue that these NO2
enhancements are due to rain-induced pulsing from soilsover vast areas of the Sahel.[34] The spatial and temporal distribution of the GOME
NO2 enhancements at the beginning of the rainy seasonis consistent with soil NO emissions from ecosystem-dependent flux measurements and from surface measure-ments of NO2 obtained by the IDAF (IGAC/DEBITS/Africa) network over West Africa. Lightning and cloudsare unlikely to account for the enhanced GOME NO2
columns and IDAF surface NO2 observations.[35] We have quantified the magnitude of the soil NOx
source in a two-step approach. We first related the GOMEtropospheric NO2 column observations to surface NOx
emissions via inverse modeling with the GEOS-CHEMglobal model of tropospheric chemistry, thus deriving atop-down emission inventory. We then inferred the monthlypartitioning of NOx sources between biomass burning, soil,and combustion of fossil or domestic biomass fuels bycombining bottom-up estimates of fossil and biofuel emis-sions together with the spatial location of fires from theVisible and Infrared Scanner (VIRS) on board TRMM.[36] We find a large role for soil NOx sources over Africa,
contributing 3.3 TgN/year (40% of African emissions).These emissions are similar to the biomass burning source(3.8 TgN/year). Soil emissions over north equatorial Africa(2.2 TgN/year) account for almost 70% of African soilemissions, because of the vast areas covered by dry eco-systems. By extrapolating to all the tropics, we find ourestimates of soil emissions (7.3 TgN/year) to be consistentwith observationally based inventories, but a factor of twohigher than model-based inventories. The spatial and tem-poral constraints on soil NOx emissions obtained fromGOME could thus help resolve the twofold discrepancybetween models and observations. Furthermore, we suggest
Figure 5. Seasonal variation in soil NOx emissions fornorth equatorial Africa (18–0�N) and south equatorialAfrica (0–24�S) in 2000. The gray bars show the monthlytop-down GOME soil NOx emissions. The solid linerepresents the GEOS-CHEM soil emission inventory basedon Yienger and Levy.
D21310 JAEGLE ET AL.: SATELLITE MAPPING OF SOIL NOX
8 of 10
D21310
that rain-induced microbial pulsing over north equatorialAfrica likely contributes to seasonal ozone production overand downwind of West Africa.[37] A significant fraction of soil NOx emissions may be
driven by human perturbations such as fertilizer use, burningof vegetation and deforestation [Keller et al., 1993; Levine etal., 1996; Sanhueza, 1997]. These land use practices arelikely to increase in the future, and thus continued monitoringof tropical NO2 by satellite might help to quantify humaninfluence on microbial soil emissions.
[38] Acknowledgments. We thank Mian Chin for providing theGOCART model results for 2000. This work was supported by fundingfrom the NASA New Investigator Program in Earth Science to L.J. and byfunding from NASA’s Radiation Science Program to R.M. The GEOS-CHEM model is managed by the Atmospheric Chemistry Modeling groupat Harvard University with support from the NASA Atmospheric ChemistryModeling and Analysis Program.
ReferencesAdler, R. F., G. J. Huffman, D. T. Bolvin, S. Curtis, and E. J. Nelkin (2000),Tropical rainfall distributions determined using TRMM combined withother satellite and rain gauge information, J. Appl. Meteorol., 39, 2007–2023.
Al Ourabi, H., and J. P. Lacaux (1999), Measurements of NH3, NO2 andHNO3 in tropical Africa by use of diffusion samplers, paper presentedat International Global Atmospheric Chemistry (IGAC) Symposium,Bologna, Italy, Sept.
Andreae, M. O., and P. Merlet (2001), Emission of trace gases and aerosolsfrom biomass burning, Global Biogeochem. Cycles, 15, 955–966.
Bednarz, F. (Ed.) (1995), ESA, in The GOME Users Manual, Eur. SpaceAg. Publ. SP-1182, ESA Publ., Noordwijk.
Benkovitz, C. M., M. T. Scholtz, J. Pacyna, L. Tarrason, J. Dignon, E. C.Voldner, P. A. Spiro, J. A. Logan, and T. E. Graedel (1996), Globalgridded inventories of anthropogenic emissions of sulfur and nitrogen,J. Geophys. Res., 101, 29,239–29,253.
Bey, I., D. J. Jacob, R. M. Yantosca, J. A. Logan, B. D. Field, A. M. Fiore,Q. Li, H. Y. Liu, L. J. Mickley, and M. G. Schultz (2001), Globalmodeling of tropospheric chemistry with assimilated meteorology: Modeldescription and evaluation, J. Geophys. Res., 106, 23,073–23,095.
Chance, K., P. I. Palmer, R. J. D. Spurr, R. V. Martin, T. Kurosu, and D. J.Jacob (2000), Satellite observations of formaldehyde over North Americafrom GOME, Geophys. Res. Lett., 27, 3461–3464.
Chandra, S., J. R. Ziemke, P. K. Bhartia, and R. V. Martin (2002), Tropicaltropospheric ozone: Implications for dynamics and biomass burning,J. Geophys. Res., 107(D14), 4188, doi:10.1029/2001JD000447.
Chin, M., P. Ginoux, S. Kinne, O. Torres, B. N. Holben, B. N. Duncan,R. V. Martin, J. A. Logan, A. Higurashi, and T. Nakajima (2002), Tropo-spheric aerosol optical thickness from the GOCART model and compar-isons with satellite and Sun photometer measurements, J. Atmos. Sci., 59,461–483.
Christian, H. J., et al. (1999), The lightning imaging sensor, in Proceedingsof the 11th International Conference on Atmospheric Electricity, Gunters-ville, Alabama, June 7–11, edited by H. J. Christian, pp. 746–749,NASA, Greenbelt, Md.
Crutzen, P. J., and M. O. Andreae (1990), Biomass burning in the tropics:Impact on atmospheric chemistry and biogeochemical cycles, Science,250, 1669–1678.
Davidson, E. A. (1991), Fluxes of nitrous oxide and nitric oxide fromterrestrial ecosystems, in Microbial Production and Consumptionof Greenhouse Gases: Methane, Nitrogen oxides, and Halomethanes,edited by J. E. Rogers and W. B. Whitman, pp. 219–235, Am. Soc.for Microbiol., Washington, D. C.
Davidson, E. A. (1992), Pulses of nitric oxide and nitrous oxide fluxfollowing wetting of dry soil: An assessment of probable sources andimportance relative to annual fluxes, Ecol. Bull., 42, 149–155.
Davidson, E. A., and W. Kingerlee (1997), A global inventory of nitricoxide emissions from soils, Nut. Cycl. Agroecosys., 48, 37–50.
Duncan, B. N., R. V. Martin, A. C. Staudt, R. Yevich, and J. A. Logan(2003), Interannual and seasonal variability of biomass burning emissionsconstrained by satellite observations, J. Geophys. Res., 108(D2), 4100,doi:10.1029/2002JD002378.
Ferm, M., and H. Rodhe (1997), Measurements of air concentrations ofSO2, NO2 and NH3 at rural and remote sites in Asia, J. Atmos. Chem., 27,17–29.
Ferm, M., and P. A. Svanberg (1998), Cost efficient techniques for urbanand background measurements of SO2 and NO2, Atmos. Environ., 32,1377–1381.
Fiore, A. M., D. J. Jacob, I. Bey, R. M. Yantosca, B. D. Field, A. C. Fusco,and J. G. Wilkinson (2002), Background ozone over the United Statesin summer: Origin, trend, and contribution to pollution episodes, J. Geo-phys. Res., 107(D15), 4275, doi:10.1029/2001JD000982.
Fishman, J., and V. G. Brackett (1997), The climatological distributionof tropospheric ozone derived from satellite measurements usingVersion 7 TOMS and SAGE data sets, J. Geophys. Res., 102, 19,275–19,278.
Galy-Lacaux, C., and A. I. Modi (1998), Precipitation chemistry in theSahelian savanna of Niger, Africa, J. Atmos. Chem., 30, 319–343.
Galy-Lacaux, C., G. R. Carmichael, C. H. Song, J. P. Lacaux, H. Al Ourabi,and A. I. Modi (2001), Heterogeneous processes involving nitrogenouscompounds and Saharan dust inferred from measurements and modelcalculations, J. Geophys. Res., 106, 12,559–12,578.
Ganzeveld, L. N., J. Lelieveld, F. J. Dentener, M. C. Krol, A. J. Bouwman,and G.-J. Roelofs (2002), Global soil-biogenic NOx emissions and therole of canopy processes, J. Geophys. Res., 107(D16), 4298, doi:10.1029/2001JD001289.
Giglio, L., J. D. Kendall, and R. Mack (2003), A multi-year active firedataset for the tropics derived from the TRMM VIRS, Int. J. RemoteSensing., 24, 4505–4525.
Hao, W. M., and M.-H. Liu (1994), Spatial and temporal distribution oftropical biomass burning, Global Biogeochem. Cycles, 8, 495–503.
Harris, G. W., F. G. Wienhold, and T. Zenker (1996), Airborne observationsof strong biogenic NOx emissions from the Namibian savanna at the endof the dry season, J. Geophys. Res., 101, 23,707–23,711.
Hoelzemann, J. J., M. G. Schultz, G. P. Brasseur, C. Granier, and M. Simon(2004), Global Wildland Fire Emission Model (GWEM): Evaluating theuse of global area burnt satellite data, J. Geophys. Res., 109, D14S04,doi:10.1029/2003JD003666.
Holland, E. A., and J.-F. Lamarque (1997), Modeling of bio-atmosphericcoupling of the nitrogen cycle through NOx emissions and NOy deposi-tion, Nut. Cycl. Agroecosys., 48, 7–24.
Hutchinson, G. L., M. F. Vigil, J. W. Doran, and A. Kessavalou (1997),Coarse-scale soil-atmosphere NOx exchange modeling: Status and limita-tions, Nut. Cycl. Agroecosys., 48, 25–35.
Jacob, D. J., and P. S. Bakwin (1991), Cycling of NOx in tropical forestcanopies, in Microbial Production and Consumption of GreenhouseGases: Methane, Nitrogen Oxides, and Halomethanes, edited by J. E.Rogers and W. B. Whitman, chap. 13, pp. 237–253, Am. Soc. forMicrobiol., Washington, D. C.
Jacob, D. J., et al. (1996), Origin of ozone and NOx in the tropical tropo-sphere: A photochemical analysis of aircraft observations over the SouthAtlantic basin, J. Geophys. Res., 101, 24,235–24,250.
Johansson, C., and E. Sanhueza (1988), Emissions of NO from savannasoils during the rainy season, J. Geophys. Res., 93, 14,193–14,198.
Keller, M., E. Veldkamp, A. M. Weitz, and W. A. Reiners (1993), Effect ofpasture age on soil trace-gas emissions from a deforested area of CostaRica, Nature, 365, 244–246.
Kurosu, T. P., K. Chance, and R. J. D. Spurr (1999), CRAG-cloud retrievalalgorithm for ESA’s global ozone monitoring experiment, Rep. ESAWPP-161, pp. 513–521, Eur. Space Res. and Tech Cent., Noordwijk.
Lacaux, J. P., R. Delmas, C. Jambert, and T. A. J. Kuhlbusch (1996), NOx
emissions from African savanna fires, J. Geophys. Res., 101, 23,585–23,595.
Lelieveld, J., and F. J. Dentener (2000), What controls tropospheric ozone?,J. Geophys. Res., 105, 3531–3551.
Le Roux, X., L. Abbadie, R. Lensi, and D. Serca (1995), Emissionof nitrogen monoxide from African tropical ecosystems: Control ofemissions by soil characteristics in humid and dry savannas of WestAfrica, J. Geophys. Res., 100, 23,133–23,142.
Leue, C., M. Wenig, T. Wagner, O. Klimm, U. Platt, and B. Jahne (2001),Quantitative analysis of NOx emissions from GOME satellite imagesequences, J. Geophys. Res., 106, 5493–5505.
Levine, J. S., E. L. Winstead, D. A. B. Parsons, M. C. Scholes, R. J.Scholes, W. R. Cofer, D. R. Cahoon, and D. I. Sebacher (1996), Biogenicsoil emissions of nitric oxide (NO) and nitrous oxide (N2O) from savan-nas in South Africa: The impact of wetting and burning, J. Geophys. Res.,101, 23,689–23,697.
Logan, J. A. (1983), Nitrogen oxides in the troposphere: Global andregional budgets, J. Geophys. Res., 88, 785–807.
Martin, R. V., et al. (2002a), An improved retrieval of tropospheric nitrogendioxide from GOME, J. Geophys. Res., 107(D20), 4437, doi:10.1029/2001JD001027.
Martin, R. V., et al. (2002b), Interpretation of TOMS observations oftropical tropospheric ozone with a global model and in situ observations,J. Geophys. Res., 107(D18), 4351, doi:10.1029/2001JD001480.
D21310 JAEGLE ET AL.: SATELLITE MAPPING OF SOIL NOX
9 of 10
D21310
Martin, R. V., D. J. Jacob, K. Chance, T. P. Kurosu, P. I. Palmer, and M. J.Evans (2003), Global inventory of nitrogen oxide emissions constrainedby space-based observations of NO2 columns, J. Geophys. Res.,108(D17), 4537, doi:10.1029/2003JD003453.
Marufu, L., F. Dentener, J. Lelieveld, M. O. Andreae, and G. Helas (2000),Photochemistry of the African troposphere: Influence of biomass burningemissions, J. Geophys. Res., 105, 14,513–14,530.
Moxim, W. J., and H. Levy II (2000), A model analysis of tropicalSouth Atlantic Ocean tropospheric ozone maximum: The interaction oftransport and chemistry, J. Geophys. Res., 105, 17,393–17,415.
Muller, J.-F. (1992), Geographical distribution and seasonal variation ofsurface emissions and deposition velocities of atmospheric trace gases,J. Geophys. Res., 97, 3787–3804.
Nicholson, S. E., et al. (2003), Validation of TRMM and other rainfallestimates with a high-density gauge dataset for West Africa. Part II:Validation of TRMM rainfall products, J. Appl. Meteorol., 42, 1355–1368.
Parton, W. J., E. Holland, S. Del Grosso, M. D. Hartman, R. E. Martin,A. R. Mosier, D. S. Ojima, and D. S. Schimel (2001), Generalized modelfor NOx and N2O emissions from soils, J. Geophys. Res., 106, 17,403–17,419.
Penner, J. E., C. S. Atherton, J. Dignon, S. J. Ghan, J. J. Walton, andS. Hameed (1991), Tropospheric nitrogen: A three-dimensional studyof sources, distributions, and deposition, J. Geophys. Res., 96, 959–990.
Pickering, K. E., Y. S. Wang, W. K. Tao, C. Price, and J. F. Muller (1998),Vertical distributions of lightning NOx for use in regional and globalchemical transport models, J. Geophys. Res., 103, 31,203–31,216.
Potter, C. S., P. A. Matson, P. M. Vitousek, and E. A. Davidson (1996),Process modeling of controls on nitrogen tracer gas emissions from soilsworldwide, J. Geophys. Res., 101, 1361–1377.
Prather, M. J., and D. Ehhalt (2001), Atmospheric chemistry and green-house gases, in Climate Change 2001: The Science of Climate Change,chap. 4, pp. 239–287, Cambridge Univ. Press, New York.
Sanhueza, E. (1997), Impact of human activity on NO soil fluxes, Nutr.Cycl. Agroecosys., 48, 61–68.
Scholes, M., and M. O. Andreae (2000), Biogenic and pyrogenic emissionsfrom Africa and their impact on the global atmosphere, Ambio, 29, 23–29.
Scholes, M., R. Martin, R. J. Scholes, D. Parsons, and E. Winstead (1997),NO and N2O emissions from savanna soils following the first simulatedrains of the season, Nutr. Cycl. Agroecosys., 48, 115–122.
Serca, D., R. Delmas, X. Le Roux, D. A. B. Parsons, M. C. Scholes,L. Abbadie, R. Lensi, O. Ronce, and L. Labroue (1998), Comparisonof nitrogen monoxide emissions from several African tropical ecosystemsand influence of season and fire, Global Biogeochem. Cycles, 12, 637–651.
Sigha-Nkamdjou, L., C. Galy-Lacaux, V. Pont, S. Richard, D. Sighomnou,and J. P. Lacaux (2003), Rainwater chemistry and wet deposition over theequatorial forested ecosystem of Zoetele (Cameroon), J. Atmos. Chem.,46, 173–198.
Staudt, A. C., D. J. Jacob, F. Ravetta, J. A. Logan, D. Bachiochi, T. N.Krishnamurti, S. Sandholm, B. Ridley, H. B. Singh, and B. Talbot (2003),Sources and chemistry of nitrogen oxides over the tropical Pacific,J. Geophys. Res., 108(D2), 8239, doi:10.1029/2002JD002139.
Swap, R. J., T. A. Szuba, M. Garstang, H. J. Annegarn, L. Marufu, and S. J.Piketh (2003), Spatial and temporal assessment of sources contributingto the annual austral spring mid-tropospheric ozone maxima over thetropical South Atlantic, Glob. Change Biol., 9, 336–345.
Thompson, A. M., K. E. Pickering, D. P. McNamara, M. R. Schoeberl,R. D. Hudson, J. H. Jim, E. V. Browell, V. W. J. H. Kirchhoff, andD. Nganga (1996), Where did tropospheric ozone over southern Africaand the tropical Atlantic come from in October 1992?: Insights fromTOMS, GTE TRACE A, and SAFARI 1992, J. Geophys. Res., 101,24,251–24,278.
Wang, Y., D. J. Jacob, and J. A. Logan (1998), Global simulation of tropo-spheric O3-NOx-hydrocarbon chemistry: 1. Model formulation, J. Geo-phys. Res., 103, 10,713–10,725.
Yevich, R., and J. A. Logan (2003), An assessment of biofuel useand burning of agricultural waste in the developing world, GlobalBiogeochem. Cycles, 17(4), 1095, doi:10.1029/2002GB001952.
Yienger, J. J., and H. Levy II (1995), Empirical model of global soil-biogenic NOx emissions, J. Geophys. Res., 100, 1447–1464.
Ziemke, J. R., and S. Chandra (1999), Seasonal and interannual variabilitiesin tropical tropospheric ozone, J. Geophys. Res., 104, 21,425–21,442.
�����������������������K. Chance and T. P. Kurosu, Harvard-Smithsonian Center for
UMR CNRS/Universite Paul Sabatier 5560, 14 Avenue Edouard Belin,F-31400 Toulouse, France. ([email protected])D. J. Jacob, Division of Engineering and Applied Sciences and
Department of Earth and Planetary Sciences, Harvard University, PierceHall, 29 Oxford Street, Cambridge, MA 02138, USA. ([email protected])L. Jaegle and L. Steinberger, Department of Atmospheric Sciences,
University of Washington, Box 351640, Seattle, WA 98195-1640, USA.([email protected]; [email protected])R. V. Martin, Department of Physics and Atmospheric Science,
Dalhousie University, Halifax, Nova Scotia B3H 3J5, Canada. ([email protected])A. I. Modi, Departement de Physique, Ecole Normale Superieure,
Universite Abdou Moumouny de Niamey, BP 10963 Niger, Africa.([email protected])L. Sigha-Nkamdjou, Centre de Recherches Hydrologiques, BP 4110
Yaounde, Cameroun. ([email protected])V. Yoboue, Laboratoire de Physique de l’Atmosphere, Universite de
D21310 JAEGLE ET AL.: SATELLITE MAPPING OF SOIL NOX
10 of 10
D21310
Figure 1. Space-based observations of NO2 columns, fires, precipitation and lightning over Africa forJanuary, June, and August 2000. (a) Monthly mean GOME NO2 tropospheric columns in 1015 moleculescm�2. (b) Total active fires observed by the Visible and Infrared Scanner (VIRS) on board the TRMMsatellite. (c) Monthly precipitation from the TRMM merged analysis in mm month�1. (d) Monthlylightning activity from the lightning imaging sensor (LIS) on board TRMM. GOME observations areaveraged over a 2� latitude by 2.5� longitude horizontal grid, while all TRMM observations are averagedover a 1� � 1� grid. The NO2 enhancements over the Sahel region during June are highlighted with adotted rectangle in the top panel.
D21310 JAEGLE ET AL.: SATELLITE MAPPING OF SOIL NOX D21310
4 of 10
Figure 2. Evolution of NO2, precipitation and fires over 1.5 million km2 of the southern Sahel (12–16�N; 0–30�E). (top) Time series of 3-day composite tropospheric GOME NO2 columns averaged overthe southern Sahel. All data (red) as well as cloud-filtered data (black, <40% cloud cover) are shown. A9-day running average was used to smooth the observations. Gaps indicate 6 days or more withoutobservations. (middle) TRMM daily precipitation (black line) and monthly fire counts (orange line).(bottom) TRMM/LIS lightning events. The green shading indicates the June soil NOx pulse, while thegray shading shows a later pulse in September (section 3).
D21310 JAEGLE ET AL.: SATELLITE MAPPING OF SOIL NOX D21310
5 of 10
Figure 3. (top) Accumulated rainfall and soil pulsing derived from TRMM daily precipitation for7–12 June 2000. Gray areas indicate dry soils (accumulated precipitation over the last 14 days <20 mm)and black diamonds correspond to dry soils with recent rainfall occurring over the 7–12 June timeperiod. (middle) Three-day composite map of GOME tropospheric NO2 columns for 10–12 June 2000.White areas are for cloud cover >40%. The thick rectangle shows the area plotted in Figure 2 (12–16�N;0–30�E). (bottom) Monthly surface NO2 measurements from the IDAF network in wet savanna (Lamto,Ivory Coast: 6.1�N, 5.0�W), semiarid savanna (Banizoumbou, Niger: 13.3�N, 2.4�E), and rain forest(Zoetele, Cameroon: 3.1�N, 11.6�E) sites. Red circles show the 2000 observations, while black linesshow the mean (and standard deviations) for 1998–2001.
D21310 JAEGLE ET AL.: SATELLITE MAPPING OF SOIL NOX D21310
6 of 10
Figure 4. Monthly NOx emissions, fires and rainfall over north equatorial Africa (18–0�N), southequatorial Africa (0–24�S) and southern Africa (24–35�S) in 2000. (top) Monthly top-down GOMENOx emissions averaged over each region (gray bars). Note the different scale on the right-most panel.We combine bottom-up estimates of biofuel and fossil fuel NOx emission inventories with the spatiallocation of fires to partition emissions between biomass burning (red bars), soil (blue bars), andfossil+biofuel (green bars) sources. (bottom) Seasonal variations in total active fires (solid orange line)and mean precipitation (black bars) observed by TRMM.
D21310 JAEGLE ET AL.: SATELLITE MAPPING OF SOIL NOX D21310