Extreme Precipitation Estimation Using Satellite-Based PERSIANN-CCS Algorithm Kuo-Lin Hsu, Ali Behrangi, Bisher Imam, and Soroosh Sorooshian Abstract The need for frequent observations of precipitation is critical to many hydrological applications. The recently developed high resolution satellite-based precipitation algorithms that generate precipitation estimates at sub-daily scale pro- vide a great potential for such purpose. This chapter describes the concept of devel- oping high resolution Precipitation Estimation from Remotely Sensed Information using Artificial Neural Networks-Cloud Classification System (PERSIANN-CCS). Evaluation of PERSIANN-CCS precipitation is demonstrated through the extreme precipitation events from two hurricanes: Ernesto in 2006 and Katrina in 2005. Finally, the global near real-time precipitation data service through the UNESCO G-WADI data server is introduced. The query functions for viewing and accessing the data are included in the chapter. Keywords Extreme precipitation · Image segmentation · Hurricane Katrina · Probability matching method · Self-organizing feature map 1 Introduction Flood events caused by extreme precipitation are considered as the most frequent and widespread natural disaster in human history. It is estimated hundred millions of people are affected by flood events each year. Hurricane Katrina, for example, impaired the South Eastern US States, including Mississippi, Louisiana, Alabama, and Florida. The total damage is estimated at more than $80 billion and it is con- firmed there were more than 1300 deaths (NWS NOAA, 2006). While accurate precipitation monitoring is a key element for improving flood-forecasting, precip- itation observations from traditional means (e.g. rain gauges) are limited to point K-L. Hsu (B ) Civil and Environmental Engineering, The Henry Samueli School of Engineering, Center for Hydrometeorology and Remote Sensing, UC Irvine, CA 92697-2175, USA e-mail: [email protected]49 M. Gebremichael, F. Hossain (eds.), Satellite Rainfall Applications for Surface Hydrology, DOI 10.1007/978-90-481-2915-7_4, C Springer Science+Business Media B.V. 2010
Kuo-Lin Hsu, Ali Behrangi, Bisher Imam, and Soroosh Sorooshian
Abstract The need for frequent observations of precipitation is critical to manyhydrological applications. The recently developed high resolution satellite-basedprecipitation algorithms that generate precipitation estimates at sub-daily scale pro-vide a great potential for such purpose. This chapter describes the concept of devel-oping high resolution Precipitation Estimation from Remotely Sensed Informationusing Artificial Neural Networks-Cloud Classification System (PERSIANN-CCS).Evaluation of PERSIANN-CCS precipitation is demonstrated through the extremeprecipitation events from two hurricanes: Ernesto in 2006 and Katrina in 2005.Finally, the global near real-time precipitation data service through the UNESCOG-WADI data server is introduced. The query functions for viewing and accessingthe data are included in the chapter.
Flood events caused by extreme precipitation are considered as the most frequentand widespread natural disaster in human history. It is estimated hundred millionsof people are affected by flood events each year. Hurricane Katrina, for example,impaired the South Eastern US States, including Mississippi, Louisiana, Alabama,and Florida. The total damage is estimated at more than $80 billion and it is con-firmed there were more than 1300 deaths (NWS NOAA, 2006). While accurateprecipitation monitoring is a key element for improving flood-forecasting, precip-itation observations from traditional means (e.g. rain gauges) are limited to point
K-L. Hsu (B)Civil and Environmental Engineering, The Henry Samueli School of Engineering,Center for Hydrometeorology and Remote Sensing, UC Irvine, CA 92697-2175, USAe-mail: [email protected]
measurements. Recent improvements in the ability of satellite remote sensing tech-niques provide a unique opportunity for precipitation observation for hydrologicapplications of remote ungauged basins.
Satellite-based precipitation retrieval algorithms use information ranging fromvisible (VIS) to infrared (IR) spectral bands of Geostationary Earth Orbiting (GEO)satellites and microwave (MW) spectral bands from Low Earth Orbiting (LEO)satellites. GEO satellites give frequent observations every 15–30 min, but theinformation provided is indirect to the surface rainfall. Some improvements werereported using cloud classification approaches using texture measures and cloud-patch identification as well as combining information from multi-spectral imagery(Ba and Gruber, 2001; Behrangi et al. 2009a, b; Bellerby et al., 2000; Bellerby,2004; Capacci and Conway, 2005; Hong et al., 2004; Turk and Miller, 2005). Onthe other hand, MW sensors on LEO satellites provide more direct sensing of rainclouds. Its low sampling frequency, however, limits the effectiveness of the rain-fall retrievals. Integration of multiple LEO satellite information is considered to beeffective in improving rainfall retrieval at short-time scales. Improvements in pre-cipitation retrieval were also reported by locally adjusting GEO-IR retrievals usingnear-real-time LEO MW-based rainfall estimation (Bellerby et al., 2000; Bellerby,2004; Hsu et al., 1997; Huffman et al., 2007; Kidd et al., 2003; Marzano et al.,2004; Nicholson et al., 2003a, b; Sorooshian et al., 2000; Todd et al., 2001; Turkand Miller, 2005; Xu et al., 1999). More recent developments include morphing ofMW rainfall according to cloud advection from GEO-IR imagery and were found tobe effective in improving rainfall retrievals (Bellerby et al., 2009; Hsu et al., 2009;Joyce et al., 2004; Ushio et al., 2009).
In this chapter, the Precipitation Estimation from Remotely Sensed Informationusing Artificial Neural Networks – Cloud Classification System (PERSIANN –CCS) is presented (Hong et al., 2004; Hsu et al., 2007). Instead of extracting localtexture information in PERSIANN (Hsu et al., 1997, 1999; Sorooshian et al., 2000),PERSIANN-CCS extracts information from the whole cloud patch and providesmultiple infrared brightness temperature versus rainfall rate (Tb–R) relationshipsfor different cloud classification types. The chapter will be described as follows:In Section 2, the development of PERSIANN-CCS and its application to the rain-fall retrieval using geostationary satellite IR imagery is introduced. In Section 3and 4, evaluation of PERSIANN-CCS rainfall retrieval on extreme events and nearreal-time visualization of global precipitation estimation through the UNESCOG-WADI (Water And Development Information for Arid Lands-A global Network)map server are discussed. Finally, conclusions and future directions are discussed inSection 5.
2 Methodology
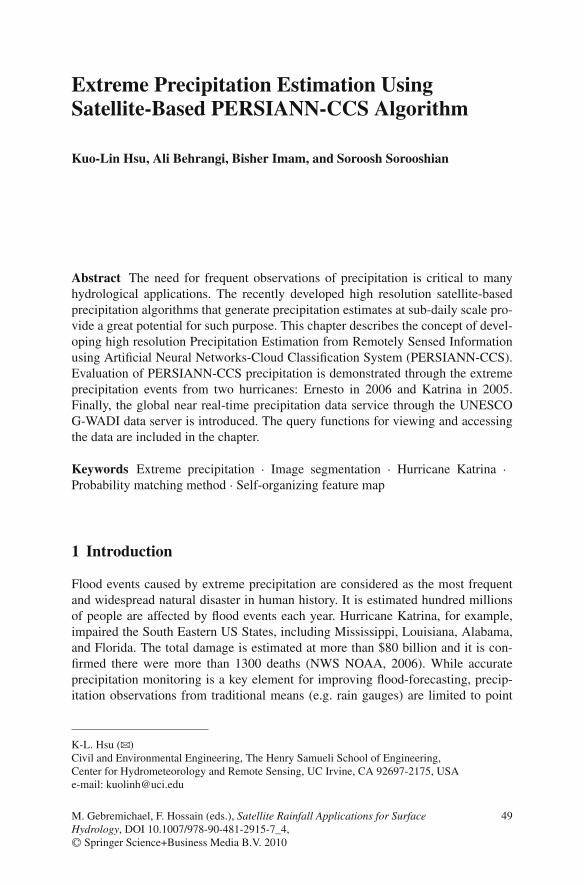
Rainfall estimation from the PERSIANN-CCS consists of four major steps: (1) IRcloud image segmentation, (2) feature extraction from IR cloud patches, (3) patchfeature classification, and (4) rainfall estimation. The classification and rainfall
PERSIANN Satellite Product 51
Fig. 1 The cloud image segmentation, feature extraction, classification, and rainfall estimation ofPERSIANN-CCS algorithm
estimation using PERSIANN-CSS is demonstrated in Fig. 1. The description of theCCS system components is outlined below:
2.1 Cloud Image Segmentation
Studies show that different cloud systems consist of distinct thermal features anddistributions of cloud precipitable water. In a satellite-based cloud image, a numberof cloud systems may co-exist and be inter-connected in space and time. Althoughcloud systems may be distinguished from our visual observation, it is useful todevelop an automatic method for classifying clouds. This is facilitated due to thegrowing computational capability of modern computers. Overall, an effective imagesegmentation procedure is one key step towards a better cloud image classification.
In this study a watershed-based (WA) segmentation approach (Vincent andSoille, 1991; Dobrin et al., 1994) is used for cloud patch segmentation. This algo-rithm starts with locating the local brightness temperature minimums in the IR cloudimage. Each local minimum is considered as a seed point to form a cloud system(see “+” marker in Fig. 2a). Next, a threshold temperature is assigned and continuedto increase; image pixels under the threshold connecting to those local minimum
52 K-L. Hsu et al.
Fig. 2 Cloud segmentation using a watershed-based algorithm: (a) the GOES IR imagery below253 K and local temperature minimum points; (b)–(e) pixels are merged to several cloud patchgroups slowly by increasing IR temperature thresholds from 210 to 253 K
seeds are merged to the same patch group. As temperature continues to rise (seeFig. 2b–c), image basins with pixels surrounding the local minimums are formed.When two basins are connected to each other, a border is formed to separate them(see Fig. 2d–e). The process stops when the assumed no-rain (or clear sky) thresh-old of IR temperature is reached. In our case, the no-rain IR threshold temperatureis assigned as 253 K.
2.2 Input Feature Extraction
After the image segmentation, the cloud image is separated into a number of dis-tinct patches, having various sizes and shapes. Transformation of the image underthe cloud patch coverage to fewer features can be useful to reduce the redundantinformation in the patches, which as a result, may give rise to a more effectiveclassification of cloud images. This transformation is called feature extraction. Inour case, from the appearance of cloud systems, convective clouds are those puffyclouds with sharp temperature gradient near the coldest cloud top, while stratiformclouds are layer clouds with mild temperature gradients. Warm and cold clouds arealso separable based on their cloud top temperature features. Features are selectedfrom cloud patches with characteristics of (1) coldness, (2) geometry, and (3) tex-ture (see Table 1). The features, except for Tbmin and TOPG, are extracted at threetemperature thresholds (220, 235, and 253 K).
PERSIANN Satellite Product 53
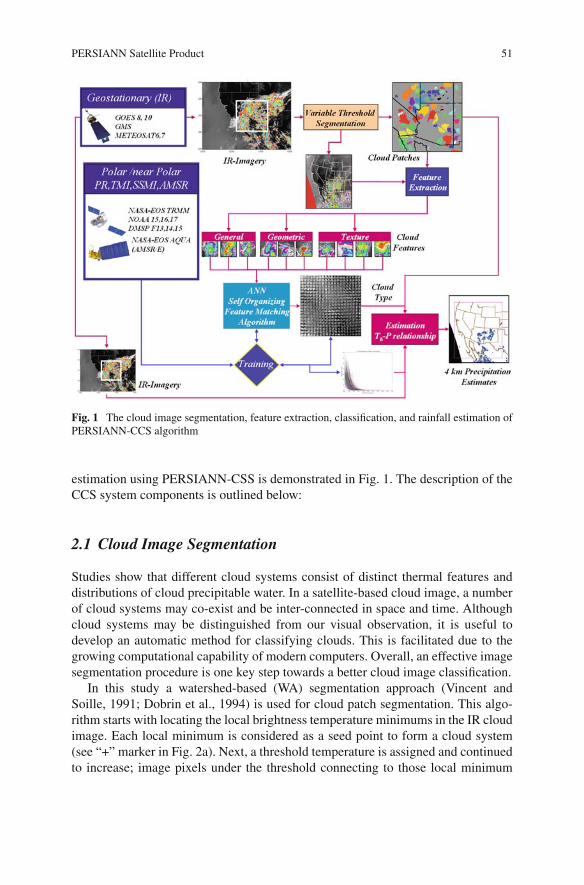
Table 1 The input features extracted from cloud patches
Category Features
Coldness Minimum temperature of a cloud patch: TbminFeatures
Mean temperature of a cloud Patch: Tbmean
Geometric Cloud patch area: AREAFeatures
Cloud patch shape index: SI
Texture Standard deviation of cloud patch: STDFeatures
Mean value of local standard deviation of cloud patch: MSTD(5x5)Standard deviation of local standard deviation: STDstd(5x5)Temperature gradient near Tbmin: TOPG
2.3 Image Classification
After the representative features are extracted from the cloud patches, the next stageis to the classify cloud patch features into a number of categories arranged in a twodimensional classification map according to the similarity between cloud patch fea-tures. This is accomplished by implementing an unsupervised clustering algorithmnamed Self-Organizing Feature Map (SOFM).
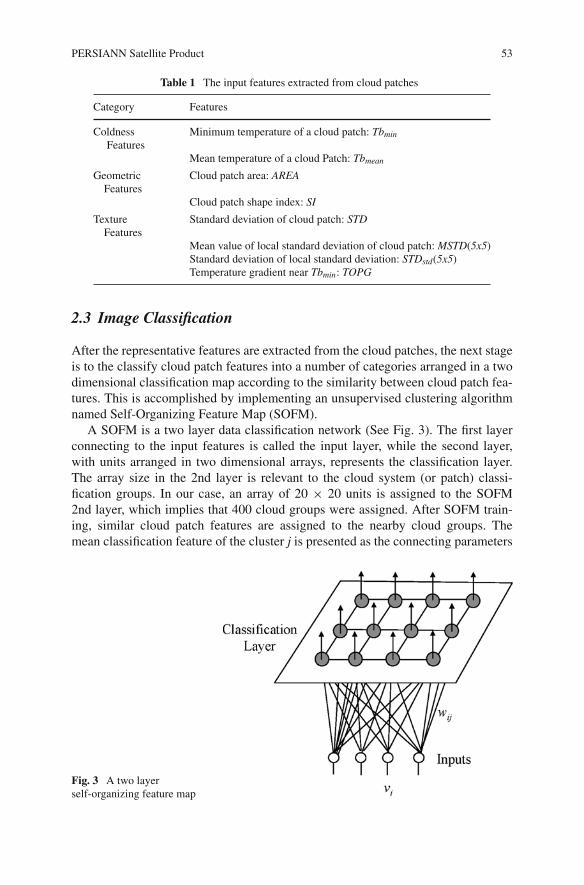
A SOFM is a two layer data classification network (See Fig. 3). The first layerconnecting to the input features is called the input layer, while the second layer,with units arranged in two dimensional arrays, represents the classification layer.The array size in the 2nd layer is relevant to the cloud system (or patch) classi-fication groups. In our case, an array of 20 × 20 units is assigned to the SOFM2nd layer, which implies that 400 cloud groups were assigned. After SOFM train-ing, similar cloud patch features are assigned to the nearby cloud groups. Themean classification feature of the cluster j is presented as the connecting parameters
Fig. 3 A two layerself-organizing feature map
54 K-L. Hsu et al.
between the input features and the output unit j of the 2nd layer. The cloud patcheswith input features close to the parameters of unit j are assigned to the cluster j.Description of SOFM can be found from Kohonen (1995) and Hsu et al. (1999). Abrief discussion of training SOFM is listed below:
Step 1: Initialize the weights (or parameters) wij as uniform random numberin [0 1].
Step 2: Collect a set of cloud patches and extract their features. These fea-tures are normalized and are presented as: �V(p) = [�V220(p), �V235(p), �V253(p)],p=1..N, where N is the number of cloud patch samples used in the train-ing; �V220(p), �V235(p), �V253(p) are features of patch p extracted from thetemperature threshold of 220, 235, and 253 K, respectively.
Step 3: Select a cloud patch sample m having normalized features as �V(m),m∈[1,N]. Find the best unit in the 2nd layer that has minimum distancebetween normalized input features and connect parameters (�wj):
j∗ = argj
min∥∥�wj − �V(m)
∥∥ (1)
Step 4: Update the connection parameters for the neighborhood (radius r)units of j∗ with learning rate α :
�wj = �wj + α(�V(m) − �wj
)
(2)
Step 5: Terminate if the �wj is converged, or reduce r and α and go to step 3.
2.4 Mapping Patch to Pixel Rainfall
After the IR cloud image is processed through the patch segmentation and classi-fication, the following stage is to assign rainfall rates to the pixels under the patchcoverage. This requires a set of training data including GEO-IR image and rainfallmeasurement from radar or LEO-MW sensors. Over the continental United States(CONUS), ground-based radar rainfall can be used for this purpose. The processincludes assigning IR cloud patches to the SOFM 2nd classification units and assign-ing surface rainfall rates, observed from radar or LEO-MW sensors, to the classifiedSOFM output units.
Taking rainfall estimation of the j-th SOFM output unit for example, a largenumber of cloud patches were assigned to this unit. The corresponding IR bright-ness temperature (Tb) and rainfall rate (R) in the cloud patch at pixel level arepresented as:
�Xj(k) = [Tbj(k), Rj(k)],k = 1..n1. (3)
Where n1 is the total number of pixels assigned to the SOFM output unit j; R j(k)is the rainfall rate assigned to the SOFM output unit j.
PERSIANN Satellite Product 55
The probability matching method (PMM; Atlas et al, 1990; Vincent et al., 1998)is then used to define the relationship of Tb and R at pixel scale, with the assump-tion that the lower the Tb the higher the rainfall rate. The cumulative distributionfunctions of the data pairs of Tb-R of the j-th SOFM classification unit can bepresented as:
R∗∫
0
P(R)dR =Tbmax∫
Tbmin
P(Tb)dTb −T∗
b∫
Tbmin
P(Tb)dTb = 1 −T∗
b∫
Tbmin
P(Tb)dTb (4)
Where the P(.) is the probability distribution function and the estimated valueof Tb and R is in the range [0 Rmax] and [Tbmin Tbmax], respectively. To generalizethe Tb and R relationship for future events, a power-law function of Tb and R issuggested (Vicente et al., 1998):
Rj(k) = f (�θ j,Tbj(k)) = θj0 + θ
j1 · exp [θ j
2 (Tbj(k) + θj3)θ
j4 ] (5)
Where θjk, k = 0,1, . . ., 4 are parameters and j is the j-th SOFM output unit. In our
case, 400 (i.e. 20 × 20) cloud patch groups were assigned and each group consistsof a power law function of 5 parameters. Parameters for each cloud patch group aredefined calibration data.
Figure 4(a) shows the 400 cloud patch groups, while each group is assigned aunique Tb-R function; for those groups being close to each other, the Tb-R curvesare similar. Here we have selected a few cloud groups and their Tb-R functions, asthey are marked as G0~G6 in Fig. 4a, b. For the group in region G0, the cloud Tb ishigh (clear weather pattern) and has no-rain associated with it. The slopes of Tb-Rcurves are higher for G2, G4, and G6 regions, which imply that those cloud groupsare relevant to the convective clouds of low, medium, and high altitudes. For the
Fig. 4 (a) The Tb-R relationship of 20×20 SOFM cloud patch groups and (b) the Tb-R curves withrespect to the SOFM groups G0~G6
56 K-L. Hsu et al.
regions covered by G1, G3, and G5, however, the slopes of Tb-R are less steep andthey are associated with light or no-rain clouds at low, medium, and high altitudes,respectively.
3 Application Examples
As described in Section 2, PERSIANN-CCS extracts cloud information using three-temperature thresholds (220, 235, and 253 K), which enables it to obtain rainfallrate from different cloud systems. Our experiments show that PERSIANN-CCS canbe effective at detecting cirrus clouds and helps to distinguish between differentconvective rain systems at various heights. A strong convective system is expectedto reach the very high troposphere level or enter into the lower stratosphere, while asmall local convective may stay in the lower troposphere.
Extreme rainfall events, particularly those associated with strong convective sys-tems, pose a serious flooding threat to many populated areas worldwide. Betterrepresentation of the intensity and distribution of these events is extremely importantto save human life and property. In the following section, performance of the highresolution PERSIANN-CCS product is evaluated under two extreme precipitationevents which resulted in serious damage and fatality.
3.1 Hurricane Ernesto
Formed on August 24 in the eastern Caribbean Sea, Hurricane Ernesto was thecostliest tropical cyclone of the 2006 Atlantic hurricane season. Early in the morn-ing of August 30, Ernesto made landfall on the Florida mainland in southwesternMiami-Dade County. It moved across eastern Florida and hit North Carolina coaston August 31, just below hurricane strength.
Compared to ground radar, PERSIANN-CCS is found to be capable of estimat-ing rain rates under regions of cold clouds, but fails to detect rainfall under relativelywarm clouds areas, resulting in underestimation of both areal extent and volume ofthe rainfall (see Fig. 5 for example). Although some discrepancies are observedin hourly 0.04◦ PERSIANN-CCS rain estimates, overall evaluations have beenencouraging. Such a rain estimate with high spatial resolution is a unique featureof PERSIANN-CCS and is beneficial for many applications including hydrologicalmodeling. At coarser time and space resolution PERSIANN-CCS provides fairlyreasonable estimation (see Fig. 6a–d). Daily accumulation of 0.04◦ rain estimateresults in capturing rain details fairly well (Figs. 6a, b).
For further statistical assessment of such an extreme rain event, scatter plots ofPERSIANN-CCS versus radar rain intensity estimate, accompanied by evaluationstatistics, are presented in Fig. 7. In addition, Table 2 demonstrates the evalua-tion statistics for top 25 and 50 percentile rain rates to assess the capability ofPERSIANN-CCS to capture heavy rainfall.
PERSIANN Satellite Product 57
Fig. 5 Demonstration of IR (10.8 μm) image (Left panel) captured at 15:15 UTC on August 30over Florida and corresponding hourly 0.04o rain rate obtained from ground radar (middle panel)and PERSIANN-CCS (Right panel). The event is captured from the hurricane Ernesto, passingover the region
Fig. 6 Analyzing the performance of daily 0.04◦ and 0.25◦ PERSIANN-CCS rain rate estimate ascompared to ground radar for hurricane Ernesto passing over Florida on August 30, 2006. Whitegrid boxes represent the areas, either not covered by radar or have missing data in all or at leastone of the hourly rain rate maps during the period of study
58 K-L. Hsu et al.
Fig. 7 Scatter plots and evaluation statistics for different combination scenarios of time andspace resolution to analyze the performance of PERSIANN-CCS rain rate estimate as comparedto ground radar for Hurricane Ernesto on August 30, 2006. Perfect BIASvolume and BIAS areashould be 1
Table 2 Evaluation statistics for PERSIANN-CCS top 50 and 25 percentile rain rates forHurricane Ernesto on August 30, 2006. The ground radar rain estimate is used as reference
Hurricane Katrina is well known as one of the most destructive and deadliest hur-ricanes in the history of the United States. It formed over the Bahamas on August
PERSIANN Satellite Product 59
23, 2005 and rapidly strengthened in the Gulf of Mexico and caused severe destruc-tion, mainly due to the storm surge, along the Gulf coast. The greatest fatalities anddestruction occurred in New Orleans, Louisiana where, Katrina made its secondlandfall as a Category 3 hurricane, in the morning of August 29, 2005 after the firstlandfall in Florida on August 24.
Similar to the previous case study, evaluation statistics of different combinationscenarios of time and space resolutions are presented in Figs. 8 and 9 and Table 3for Hurricane Katrina on August 29, 2005. Figure 8 displays daily 0.04◦ and 0.25◦rain rate maps obtained from ground radar and PERSIANN-CCS estimates. Detailedstatistics and scatter plots are shown in Fig. 9 and finally, the skill of PERSIANN-CCS to capture higher rain intensities is presented in Table 3.
The statistics demonstrate that both 0.04◦ and 0.25◦ PERSIANN-CCS estimatesshow reasonable results, particularly at coarser time resolution. From Table 3 andcompared to the pervious example, it is inferred that PERSIANN-CCS is less skil-ful in capturing intense rainfall at finer time resolutions. However, at coarser timeresolution, while with high spatial resolution, it is found to be relatively reliable inestimating intense rainfall.
Fig. 8 Analyzing the performance of daily 0.04◦ and 0.25◦ PERSIANN-CCS rain rate estimate ascompared to ground radar for hurricane Katrina, made its landfall on August 29, 2005. White gridboxes represent no data at all or at least within one of the hourly rain rate maps during the periodof study
60 K-L. Hsu et al.
Fig. 9 Scatter plots and evaluation statistics for different combination scenarios of time and spaceresolution to analyze the performance of the PERSIANN-CCS rain rate estimate compared toground radar for Hurricane Katrina on August 29, 2005. Note that, at the best condition, bothBIASvolume and BIAS area should be 1
Table 3 Evaluation statistics for PERSIANN-CCS top 50 and 25 percentile rain rates: the groundradar rain estimate is used as reference for Hurricane Katrina on August 29, 2005
4 Real-Time High Resolution Global Precipitation Server
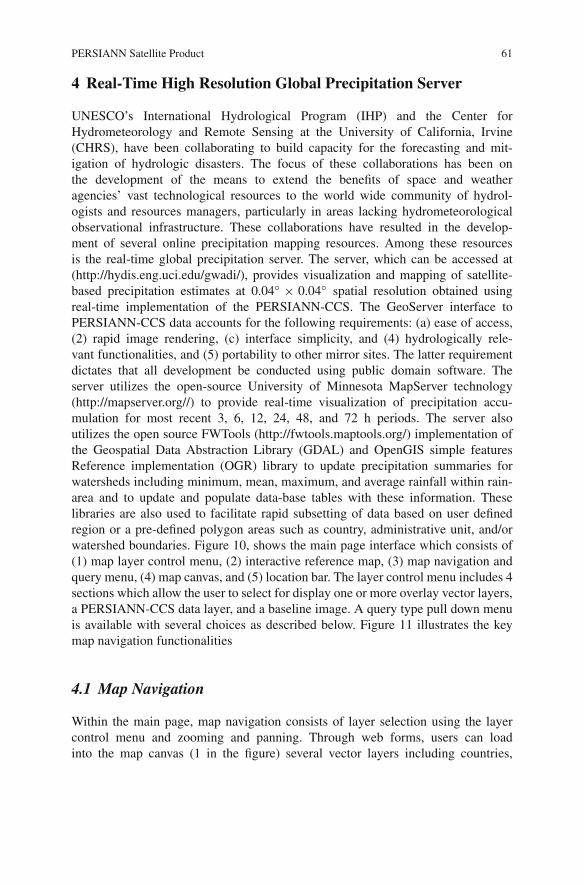
UNESCO’s International Hydrological Program (IHP) and the Center forHydrometeorology and Remote Sensing at the University of California, Irvine(CHRS), have been collaborating to build capacity for the forecasting and mit-igation of hydrologic disasters. The focus of these collaborations has been onthe development of the means to extend the benefits of space and weatheragencies’ vast technological resources to the world wide community of hydrol-ogists and resources managers, particularly in areas lacking hydrometeorologicalobservational infrastructure. These collaborations have resulted in the develop-ment of several online precipitation mapping resources. Among these resourcesis the real-time global precipitation server. The server, which can be accessed at(http://hydis.eng.uci.edu/gwadi/), provides visualization and mapping of satellite-based precipitation estimates at 0.04◦ × 0.04◦ spatial resolution obtained usingreal-time implementation of the PERSIANN-CCS. The GeoServer interface toPERSIANN-CCS data accounts for the following requirements: (a) ease of access,(2) rapid image rendering, (c) interface simplicity, and (4) hydrologically rele-vant functionalities, and (5) portability to other mirror sites. The latter requirementdictates that all development be conducted using public domain software. Theserver utilizes the open-source University of Minnesota MapServer technology(http://mapserver.org//) to provide real-time visualization of precipitation accu-mulation for most recent 3, 6, 12, 24, 48, and 72 h periods. The server alsoutilizes the open source FWTools (http://fwtools.maptools.org/) implementation ofthe Geospatial Data Abstraction Library (GDAL) and OpenGIS simple featuresReference implementation (OGR) library to update precipitation summaries forwatersheds including minimum, mean, maximum, and average rainfall within rain-area and to update and populate data-base tables with these information. Theselibraries are also used to facilitate rapid subsetting of data based on user definedregion or a pre-defined polygon areas such as country, administrative unit, and/orwatershed boundaries. Figure 10, shows the main page interface which consists of(1) map layer control menu, (2) interactive reference map, (3) map navigation andquery menu, (4) map canvas, and (5) location bar. The layer control menu includes 4sections which allow the user to select for display one or more overlay vector layers,a PERSIANN-CCS data layer, and a baseline image. A query type pull down menuis available with several choices as described below. Figure 11 illustrates the keymap navigation functionalities
4.1 Map Navigation
Within the main page, map navigation consists of layer selection using the layercontrol menu and zooming and panning. Through web forms, users can loadinto the map canvas (1 in the figure) several vector layers including countries,
62 K-L. Hsu et al.
Fig. 10 Components of the G-WADI GeoServer web-interface including: (1) map layer controlmenu, (2) interactive reference map, (3) map navigation and query menu, (4) map canvas, and (5)location bar
administrative units, and watershed boundaries at different scales (continental-smallwatershed), streams, and water bodies. The user can also load either precipita-tion totals for the most recent 3-to-72 h as described above, or maps of extremerainfall as foreground (2 in the figure). The canvas background layers includesatellite image background (from NASA-MODIS), aridity, International Geoshpere-Biosphere Programme (IGBP) land use, and/or elevation maps. The user can zoomin to explore details of precipitation accumulation and view the spatial patterns ofrainfall. The speed of image generation is enhanced by using image-tiling tech-niques to allow for rapid generation of area-views at multiple scales. Panning allowsthe user to retain the current zoom level while freely moving the area of inter-est either by sliding the map or by selecting a new map center. In addition, userscan jump from one area into another on the globe, while maintaining the currentzoom level by clicking the new area on the reference map available in the layercontrol menu.
PERSIANN Satellite Product 63
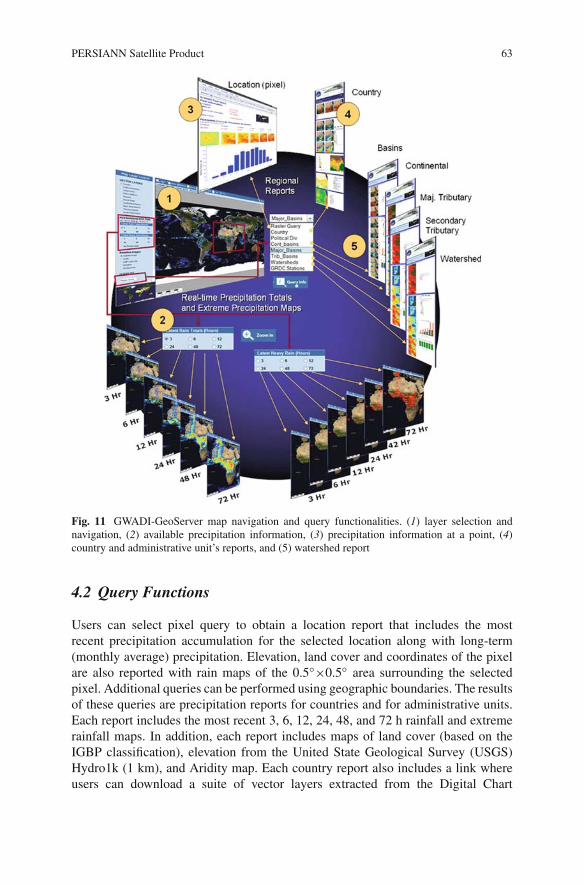
Fig. 11 GWADI-GeoServer map navigation and query functionalities. (1) layer selection andnavigation, (2) available precipitation information, (3) precipitation information at a point, (4)country and administrative unit’s reports, and (5) watershed report
4.2 Query Functions
Users can select pixel query to obtain a location report that includes the mostrecent precipitation accumulation for the selected location along with long-term(monthly average) precipitation. Elevation, land cover and coordinates of the pixelare also reported with rain maps of the 0.5◦×0.5◦ area surrounding the selectedpixel. Additional queries can be performed using geographic boundaries. The resultsof these queries are precipitation reports for countries and for administrative units.Each report includes the most recent 3, 6, 12, 24, 48, and 72 h rainfall and extremerainfall maps. In addition, each report includes maps of land cover (based on theIGBP classification), elevation from the United State Geological Survey (USGS)Hydro1k (1 km), and Aridity map. Each country report also includes a link whereusers can download a suite of vector layers extracted from the Digital Chart
64 K-L. Hsu et al.
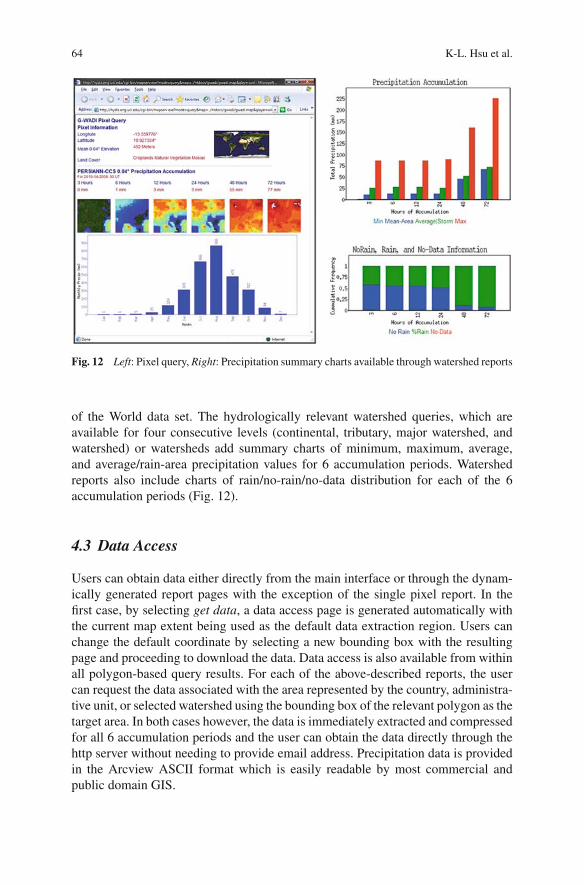
Fig. 12 Left: Pixel query, Right: Precipitation summary charts available through watershed reports
of the World data set. The hydrologically relevant watershed queries, which areavailable for four consecutive levels (continental, tributary, major watershed, andwatershed) or watersheds add summary charts of minimum, maximum, average,and average/rain-area precipitation values for 6 accumulation periods. Watershedreports also include charts of rain/no-rain/no-data distribution for each of the 6accumulation periods (Fig. 12).
4.3 Data Access
Users can obtain data either directly from the main interface or through the dynam-ically generated report pages with the exception of the single pixel report. In thefirst case, by selecting get data, a data access page is generated automatically withthe current map extent being used as the default data extraction region. Users canchange the default coordinate by selecting a new bounding box with the resultingpage and proceeding to download the data. Data access is also available from withinall polygon-based query results. For each of the above-described reports, the usercan request the data associated with the area represented by the country, administra-tive unit, or selected watershed using the bounding box of the relevant polygon as thetarget area. In both cases however, the data is immediately extracted and compressedfor all 6 accumulation periods and the user can obtain the data directly through thehttp server without needing to provide email address. Precipitation data is providedin the Arcview ASCII format which is easily readable by most commercial andpublic domain GIS.
PERSIANN Satellite Product 65
5 Conclusions and Future Directions
This chapter describes the development of PERSIANN-CCS for rainfall estima-tion and the data visualization and service through the G-WADI Geo-Server. Twocase studies were provided to demonstrate the capability of PERSIANN-CCS in themeasurement of precipitation from two hurricane events. The results were evalu-ated using ground-based radar measurements at various spatial (0.04◦ and 0.25◦)and temporal (hourly to daily) scales over the Southeastern United States. Casestudies show that, at 0.04◦ resolution, accumulation of PERSIANN-CCS estimationfrom 3-h to daily scale has improved correlation coefficients from 0.52 to 0.73 forHurricane Ernesto and from 0.40 to 0.87 for Hurricane Katrina. Likewise, at 0.25◦resolution, correlation coefficients are improved from 0.63 to 0.82 for HurricaneErnesto and from 0.44 to 0.91 for Hurricane Katrina (see Figs. 7 and 9). The resultsdemonstrated great potential of using PERSIANN-CCS estimates for hydrologicapplications.
Although PERSAINN-CCS performs fairly well under cold clouds (Tb < 253 K),extending the algorithm’s capability to capture warmer rainfall requires more inves-tigation. Employing multi-spectral images can be an alternative for this purpose.During daytime a visible channel provides added information relevant to cloudthickness, which is beneficial for rain detection and estimation (Behrangi et al.,2009a, b; Cheng et al., 1993; Griffith et al., 1978; Osullivan et al., 1990). A watervapor channel was also found useful for rain retrieval purposes (Ba and Gruber,2001; Behrangi et al., 2009a; Desbois et al., 1982; Kurino, 1997). These twochannels are currently available globally from a constellation of geosynchronoussatellites hence, have potential to be implemented in operational rain estimationalgorithms. With the advent of modern imagers on the recent and future geosta-tionary satellites, in particular the Spinning Enhanced Visible and InfraRed Imager(SEVERI) on Meteosat Second Generation (MSG) and the Advanced BaselineImager (ABI) on GOES-R, more spectral channels with higher temporal and spatialresolution are becoming available.
Recent developments using GEO cloud motion vectors to propagate andsmooth MW rainfall estimates have also demonstrated excellent skills in rainretrieval. The Climate Prediction Center Morphing (CMORPH) algorithm, forexample, applied the difference between average cloud advection and the motionof surface rainfall and then linearly interpolated MW rainfall estimates alongadvection streamlines (Joyce et al., 2004). A new multi-platform multi-sensorsatellite rainfall algorithm, named Lagrangian Model (LMODEL), has been devel-oped to evaluate the effectiveness of the cloud development modeling/modelupdating approach (Bellerby et al., 2009; Hsu et al., 2009). The LMODELsynergizes recent developments in cloud development modeling, satellite cloud-feature extraction, cloud image tracking, geostatistics and sequential filteringtheory to develop microwave and IR combination algorithm for rainfall retrieval.Investigation of extreme rainfall estimation using multi-spectral imagery andLMODEL cloud tracking approaches are ongoing and will be reported in the nearfuture.
66 K-L. Hsu et al.
Acknowledgement Partial support for this research is from NASA-EOS (Grant NA56GPO185),NASA-PMM (Grant NNG04GC74G), NASA NEWS (Grant NNX06AF93G) and NSF STC for“Sustainability of Semi-Arid Hydrology and Riparian Areas” (SAHRA) (Grant EAR-9876800).Authors appreciate the satellite data processing from Dan Braithwaite and manuscript editing fromDiane Hohnbaum.
References
Atlas, D., D. Rosenfeld, and D. B. Wolff, 1990: Climatologically turned reflectivity-rainraterelationship and links to area-time integrals. Journal of Applied Meteorology, 29, 1120–1135.
Ba, M. B. and A. Gruber, 2001: GOES multispectral rainfall algorithm (GMSRA). Journal ofApplied Meteorology, 40, 1500–1514.
Behrangi, A., K. Hsu, B. Imam, S. Sorooshian, and R. J. Kuligowski, 2009a: Evaluating the util-ity of multi-spectral information in delineating the areal extent of precipitation. Journal ofHydrometeorology, In 10, 684–700.
Behrangi, A., K. L. Hsu, B. Imam, S. Sorooshian, G. J. Huffman, and R. J. Kuligowski, 2009b:PERSIANN-MSA: A precipitation estimation method from satellite-based multi-spectralanalysis. Journal of Hydrometeorology, In press.
Bellerby, T., M. Todd, D. Kniveton, and C. Kidd, 2000: Rainfall estimation from a combination ofTRMM Precipitation Radar and GOES multi-spectral satellite imagery through the use of anartificial neural network. Journal of Applied Meteorology, 39, 2115–2128.
Bellerby, T., 2004: A feature-based approach to satellite precipitation monitoring using geostation-ary IR imagery. Journal of Hydrometeorology, 5, 910–921.
Bellerby, T., K. Hsu, and S. Sorooshian, 2009: LMODEL: A satellite precipitation algorithm usingcloud development modeling and model updating. Part 1: Model development and calibration.Journal of Hydrometeorology, In press.
Capacci, D. and B. J. Conway, 2005: Delineation of precipitation areas from MODIS visi-ble and infrared imagery with artificial neural networks. Meteorological Applications, 12,291–305.
Cheng, M., R. Brown, and C. G. Collier, 1993: Delineation of precipitation areas using Meteosatinfrared and visible data in the region of the United Kingdom. Journal of Applied Meteorology,32, 884–898.
Desbois, M., G. Seze, and G. Szejwach, 1982: Automatic Classification of Clouds on METEOSATimagery: Application to high-level clouds. Journal of Applied Meteorology, 21, 401–412.
Dobrin, B. P., T. Viero, and M. Gabbouj, 1994: Fast watershed algorithms: analysis and extensions.Nonlinear Image Processing V, 2180, 209–220, SPIE.
Griffith, C. G., W. L. Woodley, P. G. Grube, D. W. Martin, J. Stout, and D. N. Sikdar, 1978:Rain estimation from geosynchronous satellite imagery – visible and infrared studies. MonthlyWeather Review, 106, 1153–1171.
Hsu, K., X. Gao, S. Sorooshian, and H. V. Gupta, 1997: Precipitation estimation from remotelysensed information using artificial neural networks. Journal of Applied Meteorology, 36, (9),1176–1190.
Hsu, K., H. Gupta, X. Gao, and S. Sorooshian, 1999: Estimation of physical variables from mul-tichannel remotely sensed imagery using a neural network: Application to rainfall estimation.Water Resources Research, 35, 1605–1618.
Hsu, K., Y. Hong, and S. Sorooshian, 2007: Rainfall estimation using a cloud patch classifi-cation map. Measurement of Precipitation from Space: EURAINSAT and Future. Edited byV. Levizzani, P. Bauer, and F. J. Turk, Springer Publishing Company, 745 pages, Hardcover,ISBN#978–1-4240–5834-9, pp. 329–343.
Hsu, K., T. Bellerby, and S. : Sorooshian, 2009. LMODEL: A Satellite Precipitation AlgorithmUsing Cloud Development Modeling and Model Updating. Part 2: Model Updating. In press.
PERSIANN Satellite Product 67
Huffman, G. J., R. F. Adler, D. T. Bolvin, G. Gu, E. J. Nelkin, K. P. Bowman, Y. Hong,E. F. Stocker, and D. B. Wolff, 2007: The TRMM Multisatellite Precipitation Analysis(TMPA): Quasi-Global, Multiyear, Combined-Sensor Precipitation Estimates at Fine Scales.Journal of Hydrometeorology, 8, 38–55.
Hong, Y., K. Hsu, S. Sorooshian, and X. Gao, 2004: Precipitation estimation from remotely sensedimagery using an artificial neural network cloud classification system. Journal of AppliedMeteorology, 43, 1834–1852.
Joyce, R. J., J. E. Janowiak, P. A. Arkin, and P. Xie, 2004: CMORPH: A method that producesglobal precipitation estimates from passive microwave and infrared data at high spatial andtemporal resolution. Journal of Hydrometeorology, 5, 487–503.
Kidd, C., D. R. Kniveton, M. C. Todd, and T. J. Bellerby, 2003: Satellite rainfall estimationusing combined passive microwave and infrared algorithms. Journal of Hydrometeorology, 4,1088–1104.
Kohonen, T., 1995: Self-Organizing Map. Springer-Verlag, New YorkKurino, T., 1997: A satellite infrared technique for estimating “deep/shallow” precipitation.
Satellite Data Applications: Weather and Climate, 19, 511–514.Marzano, F. S., M. Palmacci, D. Cimini, G. Giuliani, and F. J. Turk, 2004: Multivariate statis-
tical integration of Satellite infrared and microwave radiometric measurements for rainfallretrieval at the geostationary scale. IEEE Transactions on Geoscience and Remote Sensing, 42,1018–1032.
National Weather Service, NOAA, 2006: Service Assessment: Hurricane Katrina, August 23–31,2005.
Nicholson, S. E., B. Some, J. McCollum, E. Nelkin, D. Klotter, Y. Berte, B. M. Diallo, I. Gaye,G. Kpabeba, O. Ndiaye, J. N. Noukpozounkou, M. M. Tanu, A. Thiam, A. A. Toure, andA. K. Traore, 2003a: Validation of TRMM and other rainfall estimates with a high-densitygauge dataset for West Africa. Journal of Applied Meteorology, 42, Part I, 1337–1354.
Nicholson, S. E., B. Some, J. McCollum, E. Nelkin, D. Klotter, Y. Berte, B. M. Diallo, I. Gaye,G. Kpabeba, O. Ndiaye, J. N. Noukpozounkou, M. M. Tanu, A. Thiam, A. A. Toure, andA. K. Traore, 2003b: Validation of TRMM and other rainfall estimates with a high-densitygauge dataset for West Africa. Journal of Applied Meteorology, 42, Part II, 1355–1368.
Osullivan, F., C. H. Wash, M. Stewart, and C. E. Motell, 1990: Rain estimation from infrared andvisible GOES satellite data. Journal of Applied Meteorology, 29, 209–223.
Sorooshian, S., K. Hsu, X. Gao, H. V. Gupta, B. Imam, and D. Braithwaite, 2000: Evaluationof PERSIANN system satellite-based estimates of tropical rainfall. Bulletin of the AmericanMeteorological Society, 81, 2035–2046.
Todd, M., C. Kidd, D. R. Kniveton, and T. J. Bellerby, 2001: A combined satellite infrared andpassive microwave technique for the estimation of small scale rainfall. Journal of Atmosphericand Oceanic Technology, 18, 742–755.
Turk, F. J. and S. D. Miller, 2005: Toward improving estimates of remotely-sensed precipitationwith MODIS/AMSR-E blended data techniques. IEEE Transactions on Geoscience and RemoteSensing, 43, 1059–1069.
Ushio, T., T. Kubota, S. Shige, K. Okamoto, K. Aonashi, T. Inoue, N. Takahashi, T. Iguchi,M. Kachi, R. Oki, T. Morimoto, and Z. Kawasaki, 2008: A Kalman filter approach to theGlobal Satellite Mapping of Precipitation (GSMaP) from combined passive microwave andinfrared radiometric data. Journal of Meteorology Society Japan, 87A, 137–151.
Vincent, L. and P. Soille, 1991: Watersheds in digital spaces: an efficient algorithm based on immer-sion simulations. IEEE Transactions on Pattern Analysis and Machine Intelligence, 13, (6),583–598.
Vincent, G., R. A. Scofield, and W. P. Mensel, 1998: The operational GOES infrared rainfallestimation technique. Bulletin of the American Meteorological Society, 79, 1883–1898.
Xu, L., X. Gao, S. Sorooshian, and P. A. Arkin, 1999: A microwave infrared threshold techniqueto improve the GOES precipitation index. Journal of Applied Meteorology, 38, 569–579.