34
Earnings Call Presentation Q1, 2017 1 Saudi Arabian Mining Company (Ma’aden) Earnings Conference Call Q1 2017 May 7, 2017

Earnings Call Presentation Q1, 2017 1
Saudi Arabian Mining Company (Ma’aden) Earnings Conference Call Q1 2017
May 7, 2017

Earnings Call Presentation Q1, 2017 2
Walid Al-Hakim
Head Investor Relations

Earnings Call Presentation Q1, 2017 3
This presentation contains statements that are, or may be deemed to be, forward looking statements, including statements about the beliefs and expectations of Saudi Arabian Mining Company (the "Company"). These statements are based on the Company's current plans, estimates and projections, as well as its expectations of external conditions and events. Forward-looking statements involve inherent risks and uncertainties and speak only as of the date they are made. As a result of these risks, uncertainties and assumptions, a prospective investor should not place undue reliance on these forward-looking statements. A number of important factors could cause actual results or outcomes to differ materially from those expressed in any forward-looking statements. The Company is not obliged to, and does not intend to, update or revise any forward- looking statements made in this presentation whether as a result of new information, future events or otherwise. This communication has been prepared by and is the sole responsibility of the Company. It has not been reviewed, approved or endorsed by any financial advisor, lead manager, selling agent, receiving bank or underwriter retained by the Company. This communication is provided for information purposes only. In addition, because this communication is a summary only, it may not contain all material terms and this communication in and of itself should not form the basis for any investment decision. The information and opinions herein is believed to be reliable and has been obtained from sources believed to be reliable, but no representation or warranty, express or implied, is made with respect to the fairness, correctness, accuracy reasonableness or completeness of the information and opinions. There is no obligation to update, modify or amend this communication or to otherwise notify you if information, opinion, projection, forecast or estimate set forth herein, changes or subsequently becomes inaccurate. You are strongly advised to seek your own independent advice in relation to any investment, financial, legal, tax, accounting or regulatory issues discussed herein. Analyses and opinions contained herein may be based on assumptions that if altered can change the analyses or opinions expressed. Nothing contained herein shall constitute any representation or warranty as to future performance of any financial instrument, credit, currency, rate or other market or economic measure. Furthermore, past performance is not necessarily indicative of future results. The Company disclaims liability for any loss arising out of or in connection with your use of, or reliance on, this communication. These materials may not be published, distributed or transmitted and may not be reproduced in any manner whatsoever without the explicit consent of Ma’aden’s management. These materials do not constitute an offer to sell or the solicitation of an offer to buy the securities in any jurisdiction.
Forward looking statement

Earnings Call Presentation Q1, 2017 4
Khalid Al-Mudaifer
President & Chief Executive Officer

Earnings Call Presentation Q1, 2017 5
Solid performance in first quarter of 2017
Record
production
■ 71 K ounces of gold, up 61% vs Q1 2016
■ 369 K tonnes of alumina, up 5% vs Q1 2016
■ 228 K tonnes of primary aluminium, up 5% vs Q1 2016
■ 599 K tonnes of ammonia, up 97% vs Q1 2016
■ 721 K tonnes of ammonium phosphate fertilizer, up 9% vs Q1 2016
Outstanding cost
performance
Strong financial
performance
■ Sales SAR 2,717 mn, up 20% vs Q1 2016
■ EBITDA SAR 1,437 mn, up 52% vs Q1 2016
■ Net income SAR 341 mn, up 70%
■ Net cash from operation SAR 857 mn, up 137%
Growth projects
underway
■ Continued focus on efficiency, productivity and throughput
■ Reduced cash cost in all our products
■ Margins continue to increase with EBITDA margins higher
by ~17 basis points
■ Ammonia plant for Ma’aden Wa’ad Al Shamal (MWAS) entered commercial
operation on January 1, 2017
■ Remaining plants of MWAS project are on track for first production in Q2 2017
■ Feasibility of our new Mansourah / Massarah mines is being finalised
■ Feasibility study for the third phosphate project is progressing well
Strong operating performance, supportive market conditions, benefits of low cost operations
reflecting in healthier results

Earnings Call Presentation Q1, 2017 6
Margin improvement with price and volume increase
947 952 886
1,437
37% 41%
37%
53%
20%
25%
30%
35%
40%
45%
50%
55%
60%
0
200
400
600
800
1000
1200
1400
1600
Q2 2016 Q3 2016 Q4 2016 Q1 2017
EBITDA
EBITDA Margins
SA
R m
illio
n
Rebase t
o 1
00 a
s o
n 1
Mar
2016
Source: Bloomberg
Commodity price movement
EBITDA and margins
40.00
60.00
80.00
100.00
120.00
140.00
160.00
1-Mar-16 1-May-16 1-Jul-16 1-Sep-16 1-Nov-16 1-Jan-17 1-Mar-17
Aluminium Copper Gold DAP Ammonia Ma'aden share price

Earnings Call Presentation Q1, 2017 7
0
100
200
300
400
500
600
Jan-15 Apr-15 Jul-15 Oct-15 Jan-16 Apr-16 Jul-16 Oct-16 Jan-17
Avg. FOB, KSA DAP
Avg. FOB, ME Ammonia
Source: Ma’aden SBU analysis, CRU , FMB and FERTECON
■ In Q1 2017 DAP prices averaged ~US$355/tonne1 and ammonia price averaged ~US$ 285 / tonne2
■ Phosphate and ammonia prices recovered from lows of 2016, due to low exports from China & US, high demand in China,
Latin America, etc.
■ DAP demand from India is picking up but there are increasing exports from China on the back of firmer prices in Q1
■ Additional supplies expected in H1 2017 from MWAS and Morocco which may exert pressure on prices
■ Ammonia prices bounced back after a very weak Q4, on reduced supply from the Black Sea.
Firm phosphate market in Q1, but now showing signs of
weakness
DAP and Ammonia price movement (US$/t)
1 Tampa FOB Index, 2 Middle East FOB Index
Earnings Call Presentation Q1, 2017 8
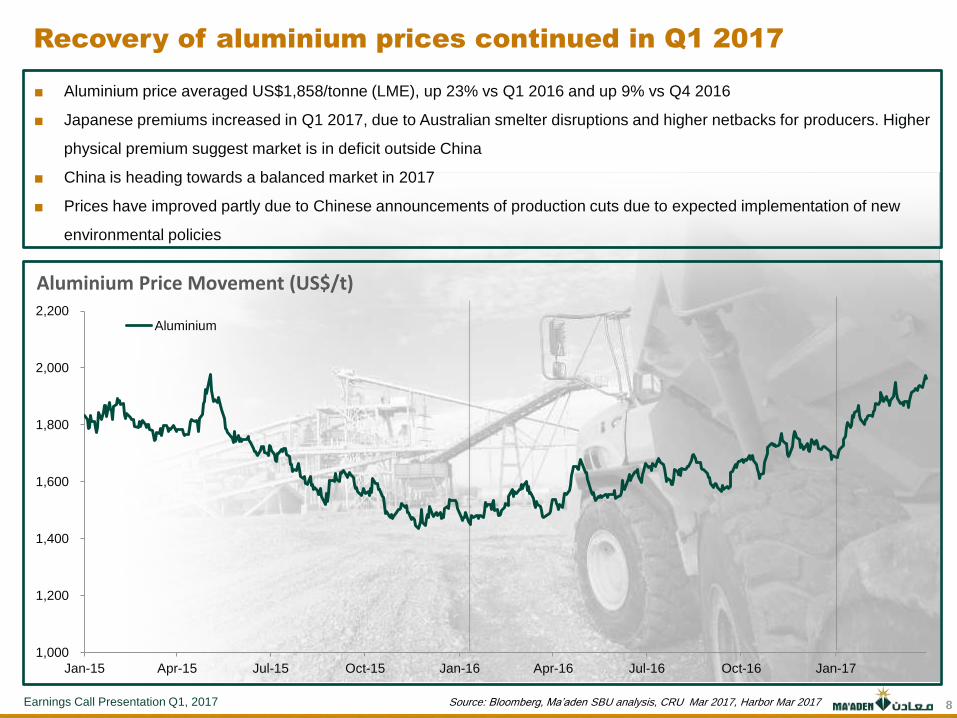
Recovery of aluminium prices continued in Q1 2017
■ Aluminium price averaged US$1,858/tonne (LME), up 23% vs Q1 2016 and up 9% vs Q4 2016
■ Japanese premiums increased in Q1 2017, due to Australian smelter disruptions and higher netbacks for producers. Higher
physical premium suggest market is in deficit outside China
■ China is heading towards a balanced market in 2017
■ Prices have improved partly due to Chinese announcements of production cuts due to expected implementation of new
environmental policies
Aluminium Price Movement (US$/t)
Source: Bloomberg, Ma’aden SBU analysis, CRU Mar 2017, Harbor Mar 2017
1,000
1,200
1,400
1,600
1,800
2,000
2,200
Jan-15 Apr-15 Jul-15 Oct-15 Jan-16 Apr-16 Jul-16 Oct-16 Jan-17
Aluminium

Earnings Call Presentation Q1, 2017 9
0.40
0.50
0.60
0.70
0.80
0.90
1.00
1.10
1.20
Jan-15 Apr-15 Jul-15 Oct-15 Jan-16 Apr-16 Jul-16 Oct-16 Jan-17
Copper
Gold
Gold firm and copper is sustaining its recovery
Gold and copper price movement
Rebase t
o 1
as a
t 1 J
an 2
015
■ Gold and copper prices averaged US$1,221/ounce and US$ 5,855/tonne, up 3% and 25% respectively vs Q1 2016
■ World economic growth forecast, particularly Chinese structural reforms remain on track supporting the prices outlook
■ Production disruption at world’s three largest copper mines helped to support copper prices, despite financial market
weakness and industrial metals sell-off
■ Copper prices are expected to be driven by sustainability of Chinese demand into the second half of 2017 and US
infrastructure spending announcement
Source: Bloomberg, CRU Mar 2017, SBU secondary analysis

Earnings Call Presentation Q1, 2017
Additional reserves and resources added in phosphate and
copper business
0 500
KM
gold mine
copper mine
metallurgical bauxite mine
phosphate mine
low grade bauxite mine
Arabian
Shield
Ma’aden’s Total
Resources & Reserves1
461 Mt
288 Mt
210 Mt
16.5 Moz
4.3 Moz
P2O
5
Bau
xit
e
Go
ld
569 kt Co
pp
er
Minerals with potential for further
growth through exploration
HIGH
MEDIUM
bauxite, phosphate, gold,
copper, zinc
potash
1. Resources and reserves at December 2016
2. Resources for gold, phosphate and bauxite are stated inclusive of reserves
10
232 Mt
199 kt
Growth in Resources &
Reserves in 2016
Earnings Call Presentation Q1, 2017 11
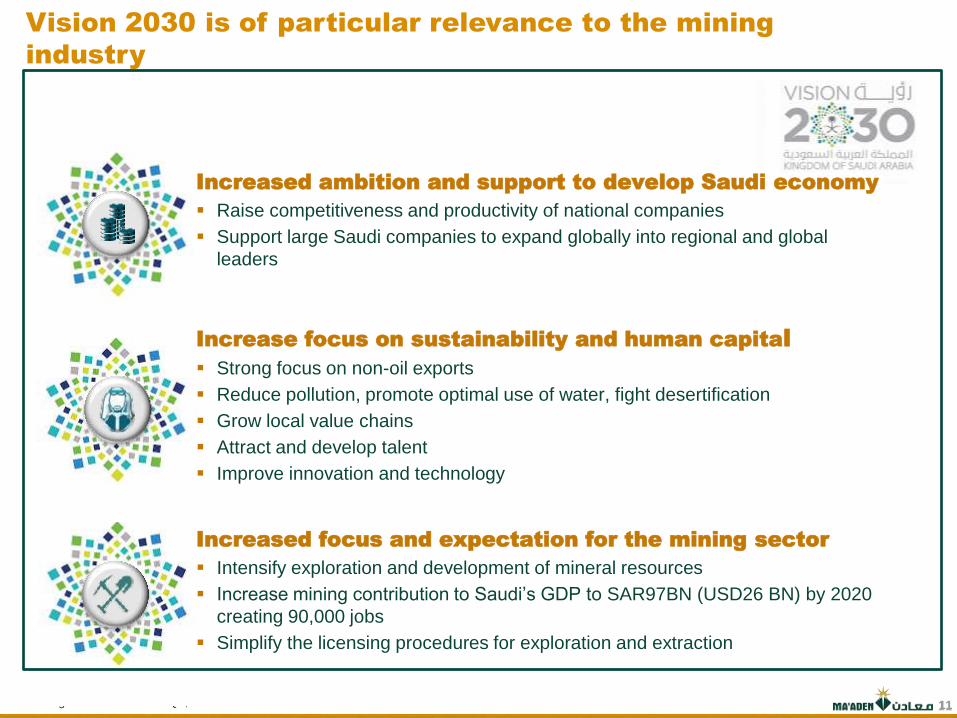
Vision 2030 is of particular relevance to the mining
industry
Increased focus and expectation for the mining sector
Intensify exploration and development of mineral resources
Increase mining contribution to Saudi’s GDP to SAR97BN (USD26 BN) by 2020
creating 90,000 jobs
Simplify the licensing procedures for exploration and extraction
Increased ambition and support to develop Saudi economy
Raise competitiveness and productivity of national companies
Support large Saudi companies to expand globally into regional and global
leaders
Increase focus on sustainability and human capital
Strong focus on non-oil exports
Reduce pollution, promote optimal use of water, fight desertification
Grow local value chains
Attract and develop talent
Improve innovation and technology
11
Earnings Call Presentation Q1, 2017 12
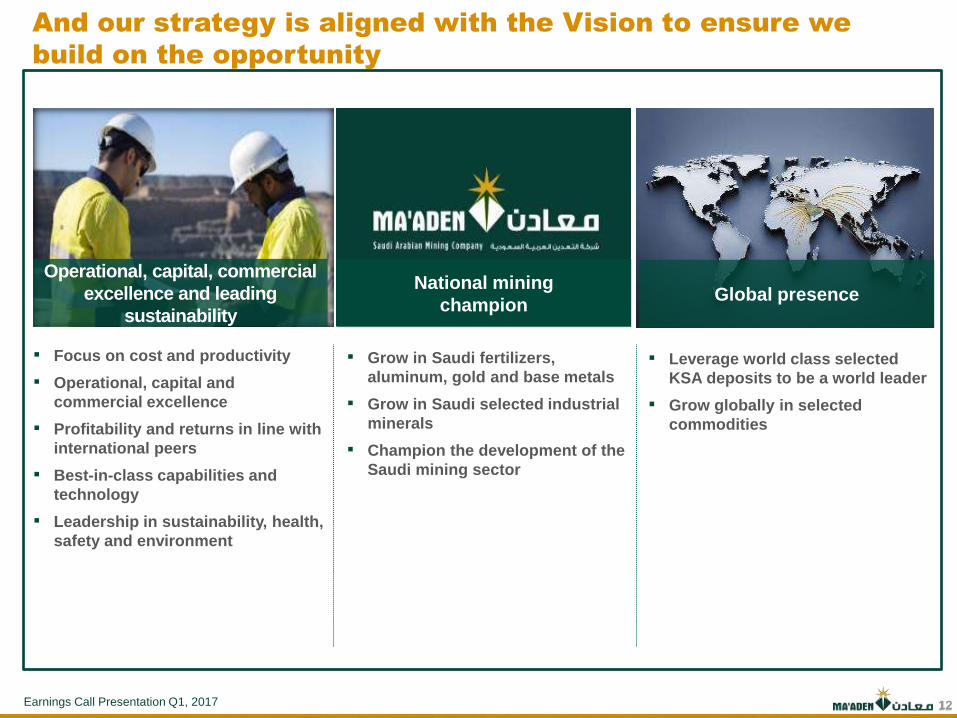
And our strategy is aligned with the Vision to ensure we
build on the opportunity
▪ Focus on cost and productivity
▪ Operational, capital and
commercial excellence
▪ Profitability and returns in line with
international peers
▪ Best-in-class capabilities and
technology
▪ Leadership in sustainability, health,
safety and environment
▪ Grow in Saudi fertilizers,
aluminum, gold and base metals
▪ Grow in Saudi selected industrial
minerals
▪ Champion the development of the
Saudi mining sector
▪ Leverage world class selected
KSA deposits to be a world leader
▪ Grow globally in selected
commodities
Operational, capital, commercial
excellence and leading
sustainability
National mining
champion Global presence
12

Earnings Call Presentation Q1, 2017 13
Darren C. Davis
Chief Financial Officer
Earnings Call Presentation Q1, 2017 14
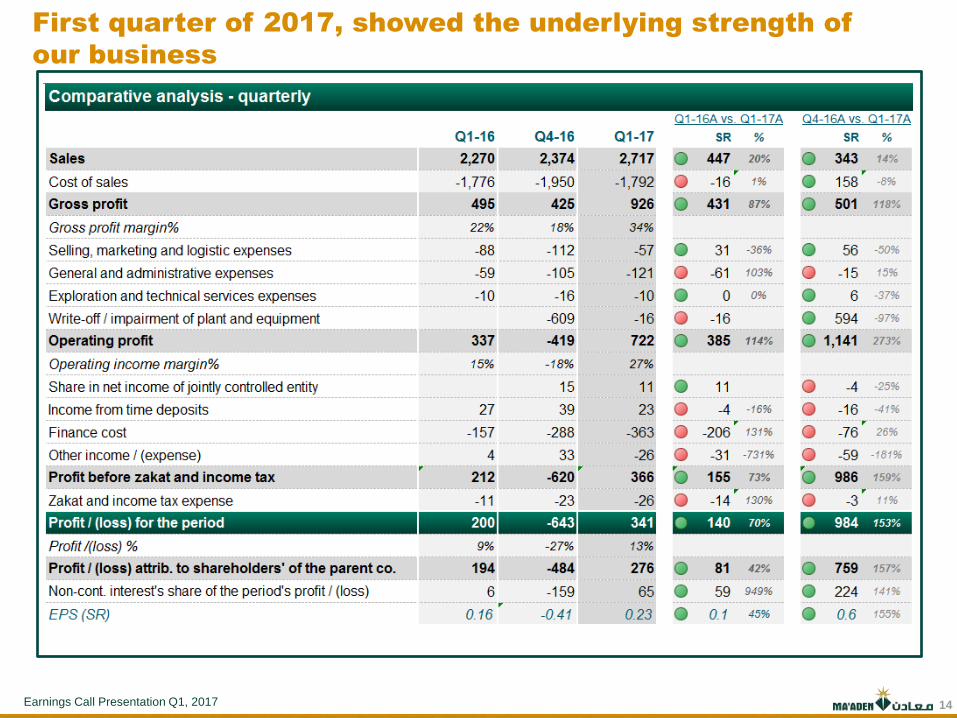
First quarter of 2017, showed the underlying strength of
our business
Earnings Call Presentation Q1, 2017
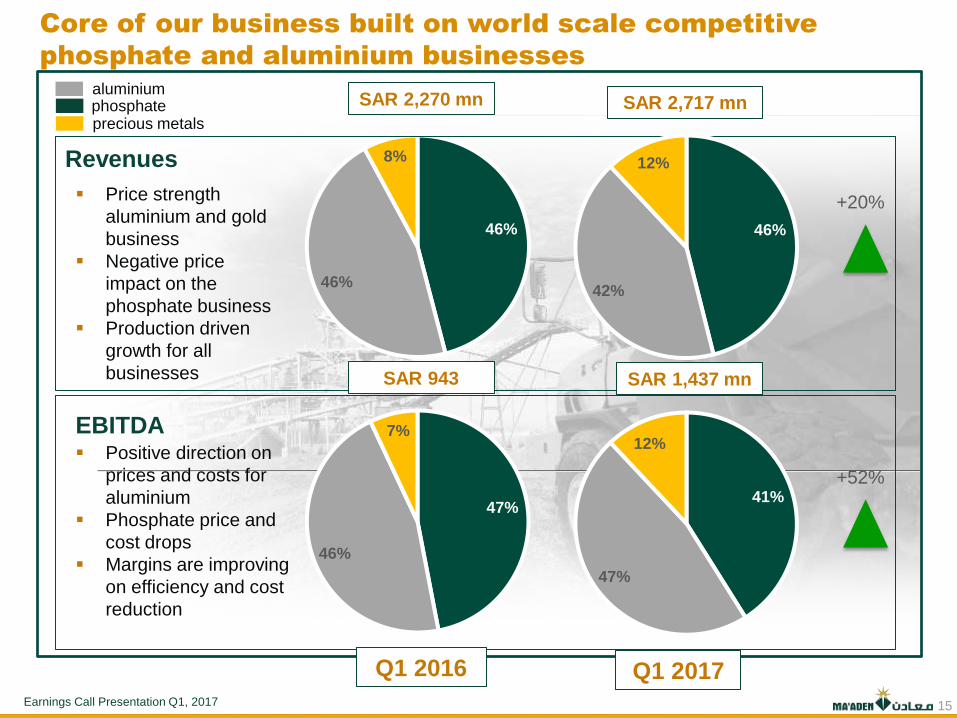
Core of our business built on world scale competitive
phosphate and aluminium businesses
46%
46%
8%
47%
46%
7%
Revenues
EBITDA
Price strength
aluminium and gold
business
Negative price
impact on the
phosphate business
Production driven
growth for all
businesses
Positive direction on
prices and costs for
aluminium
Phosphate price and
cost drops
Margins are improving
on efficiency and cost
reduction
aluminium phosphate precious metals
SAR 943
15
SAR 2,270 mn
Q1 2016
+20%
+52%
46%
42%
12%
SAR 1,437 mn
SAR 2,717 mn
Q1 2017
41%
47%
12%
Earnings Call Presentation Q1, 2017 16
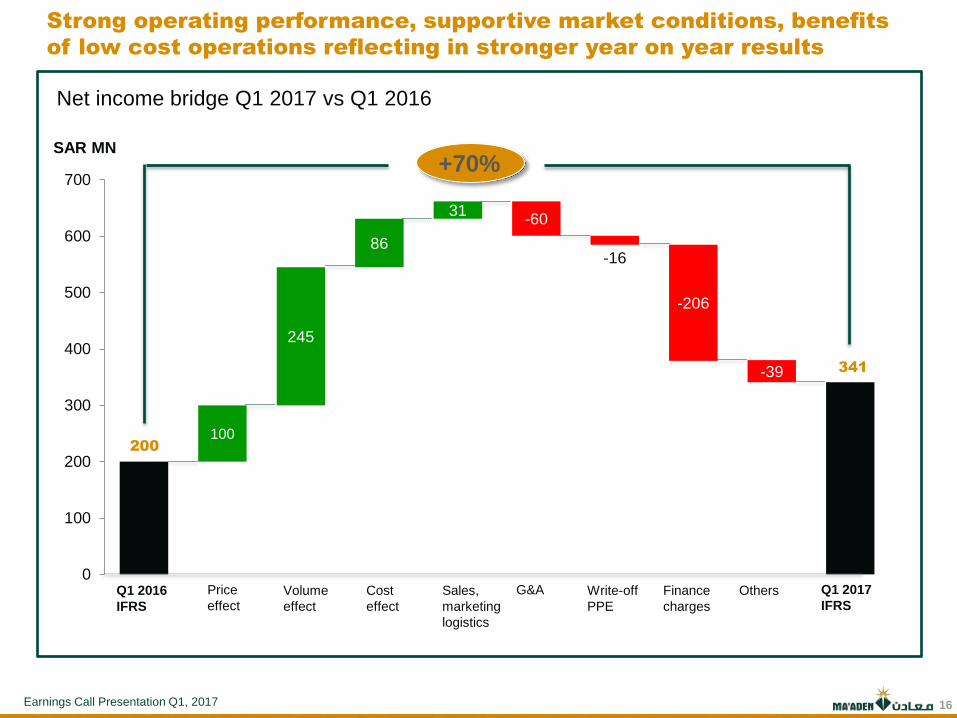
Strong operating performance, supportive market conditions, benefits
of low cost operations reflecting in stronger year on year results
Net income bridge Q1 2017 vs Q1 2016
100
245
86
31 -60
-16
-206
-39
0
100
200
300
400
500
600
700
200
341
Q1 2016
IFRS
Price
effect Volume
effect
Cost
effect
Sales,
marketing
logistics
G&A Write-off
PPE
Finance
charges
Others Q1 2017
IFRS
SAR MN +70%
Earnings Call Presentation Q1, 2017 17
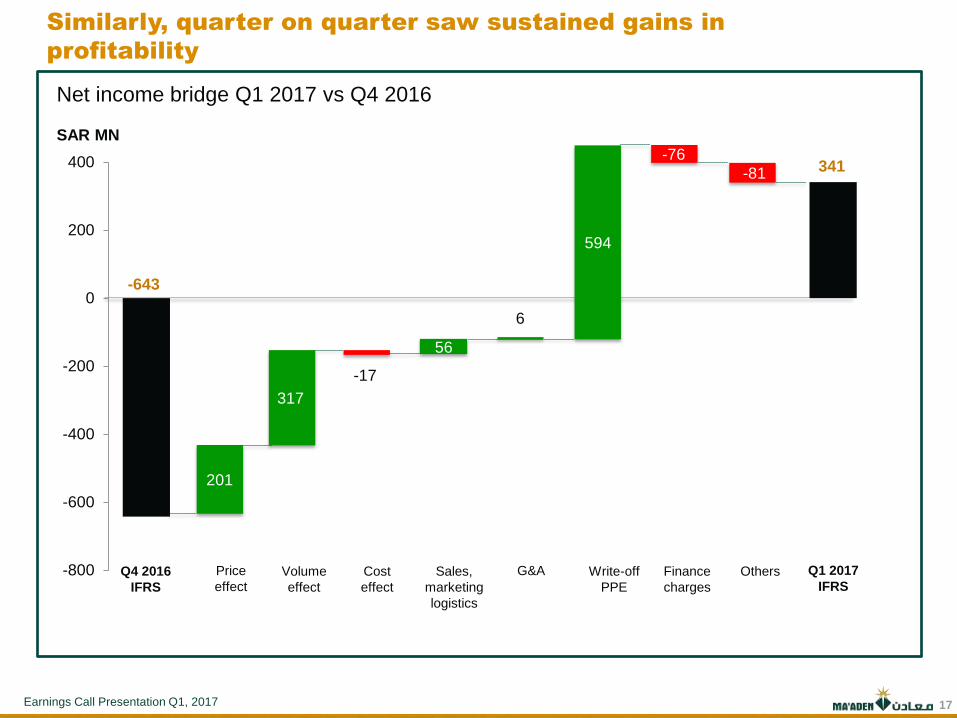
Similarly, quarter on quarter saw sustained gains in
profitability
Net income bridge Q1 2017 vs Q4 2016
Q4 2016
IFRS
Price
effect Volume
effect
Cost
effect
Sales,
marketing
logistics
G&A Write-off
PPE
Finance
charges
Others Q1 2017
IFRS
SAR MN
-17
56
6 594
-76
-81
594
201
317
-643
341
-800
-600
-400
-200
0
200
400
Earnings Call Presentation Q1, 2017 18
Operational performance
Earnings Call Presentation Q1, 2017 19
Phosphate performance
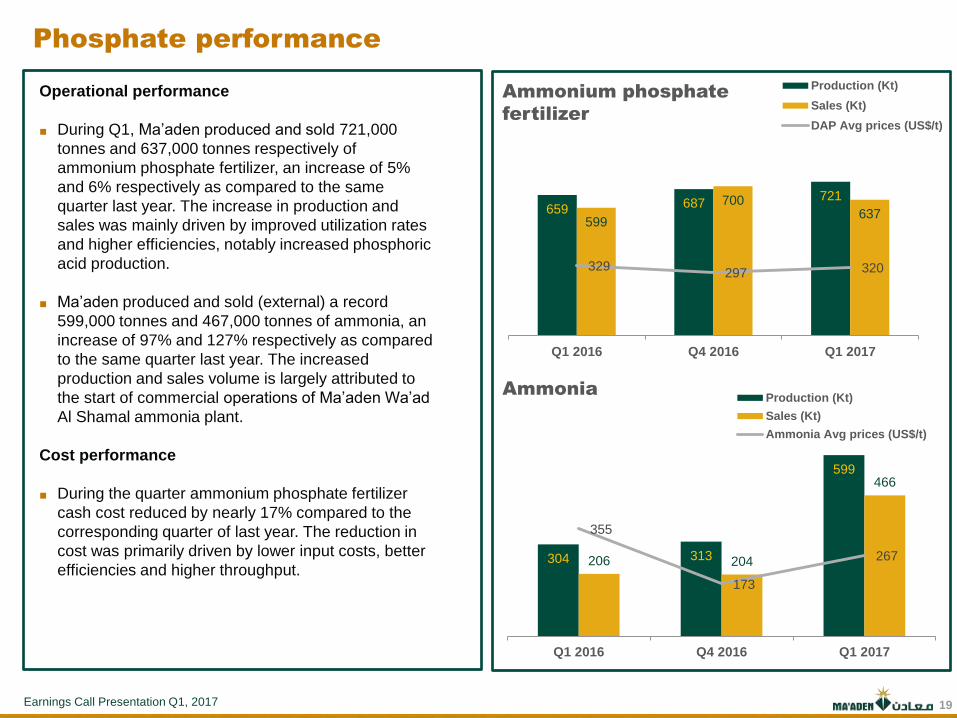
Operational performance
■ During Q1, Ma’aden produced and sold 721,000
tonnes and 637,000 tonnes respectively of
ammonium phosphate fertilizer, an increase of 5%
and 6% respectively as compared to the same
quarter last year. The increase in production and
sales was mainly driven by improved utilization rates
and higher efficiencies, notably increased phosphoric
acid production.
■ Ma’aden produced and sold (external) a record
599,000 tonnes and 467,000 tonnes of ammonia, an
increase of 97% and 127% respectively as compared
to the same quarter last year. The increased
production and sales volume is largely attributed to
the start of commercial operations of Ma’aden Wa’ad
Al Shamal ammonia plant.
Cost performance
■ During the quarter ammonium phosphate fertilizer
cash cost reduced by nearly 17% compared to the
corresponding quarter of last year. The reduction in
cost was primarily driven by lower input costs, better
efficiencies and higher throughput.
Ammonium phosphate
fertilizer
Ammonia
659 687 721
599
700 637
329 297 320
Q1 2016 Q4 2016 Q1 2017
Production (Kt)
Sales (Kt)
DAP Avg prices (US$/t)
304 313
599
206 204
466
355
173
267
Q1 2016 Q4 2016 Q1 2017
Production (Kt)
Sales (Kt)
Ammonia Avg prices (US$/t)

Earnings Call Presentation Q1, 2017 20
Aluminium performance
Operational performance
■ During the first quarter of 2017, Ma’aden produced
228,000 tonnes of primary aluminium, an increase of 5%,
compared to the same period of last year. The increase
was mainly due to increased production efficiency and
increased production from the recycling unit.
■ Ma’aden’s bauxite mine and alumina refinery operated
well. During Q1, Ma’aden produced 369,000 tonnes of
alumina, an increase of 5% compared to Q1 2016.
Ma’aden made its first external sales of 30,000 tonnes of
alumina in the last quarter.
Cost performance
■ During the quarter, our aluminium cash cost reduced
significantly, due to increased volumes, decreased fixed
costs through strong cost control measures, reduction in
some of the raw material consumptions, and lower input
costs, notably the lower price of alumina.
■ However, we see some headwinds with the prices of key
inputs such as caustic soda and coke prices increasing
Projects
■ The rolling mill operation continues to ramp up production
and is making gradual progress in penetrating the market
for can sheets in the Middle East region and beyond.
Primary aluminium
Corporate aluminium sales (Kt)
217 219
228
215 216
228
1,503 1,663
1,858
-
200
400
600
800
1,000
1,200
1,400
1,600
1,800
2,000
205
210
215
220
225
230
Q1 2016 Q4 2016 Q1 2017
Production (Kt)
Sales (Kt)
Avg LME prices (US$/t)
128
135
113
100
105
110
115
120
125
130
135
140
Q1 2016 Q4 2016 Q1 2017

Earnings Call Presentation Q1, 2017 21
44
64 71
40
64 70
1,192 1,182
1,200
800
850
900
950
1000
1050
1100
1150
1200
1250
0
10
20
30
40
50
60
70
80
Q1 2016 Q4 2016 Q1 2017
Production (Koz)
Sales (Koz)
Gold Avg prices (US$/oz)
Gold and Copper performance
Gold volumes
Copper volumes (Kt)
Operational performance
■ During the quarter, Ma’aden production of gold
increased by 61% to 71,000 ounces compared to the
same quarter last year. This was mainly due to
increased volumes from Ad Duwayhi mine, Ma’aden’s
largest gold mine, which was commercialized on April
1, 2016.
■ During the quarter, we produced 7,000 tonnes and sold
7,500 tonnes of copper concentrate. The Jabal Sayid
mine is progressing well in terms of reaching its full
production capability
Cost performance
■ Continued focus on cost has helped Ma’aden to
reduce its gold cash cost by 22% compared to the
same quarter last year. This is mainly attributed to
increased volumes and better efficiencies.
■ Jabal Sayid C1 cash cost performance continued to
improve through efficiency and higher throughput.
1 Ma’aden attributable production & sales @ 50%
4
8
7
5 5
7.5
0
1
2
3
4
5
6
7
8
9
Q1 2016 Q4 2016 Q1 2017
Production
Sales
Earnings Call Presentation Q1, 2017 22
Financial position
Earnings Call Presentation Q1, 2017 23
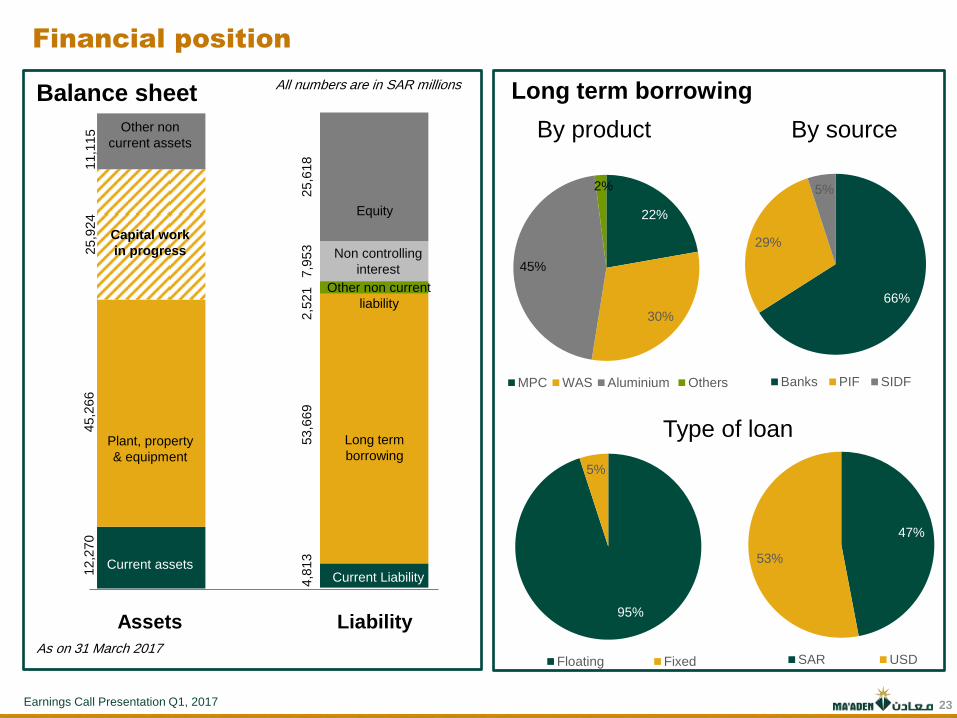
All numbers are in SAR millions
4,8
13
53,6
69
2,5
21
7,9
53
25,6
18
Current Liability
22%
30%
45%
2%
MPC WAS Aluminium Others
66%
29%
5%
Banks PIF SIDF
Long term borrowing
By product By source
12,2
70
45,2
66
25,9
24
11,1
15
Capital work
in progress
Plant, property
& equipment
Current assets
Other non
current assets
Equity
Long term
borrowing
Other non current
liability
Assets Liability
As on 31 March 2017
Balance sheet
95%
5%
Floating Fixed
47%
53%
SAR USD
Type of loan
Financial position
Non controlling
interest
Earnings Call Presentation Q1, 2017 24
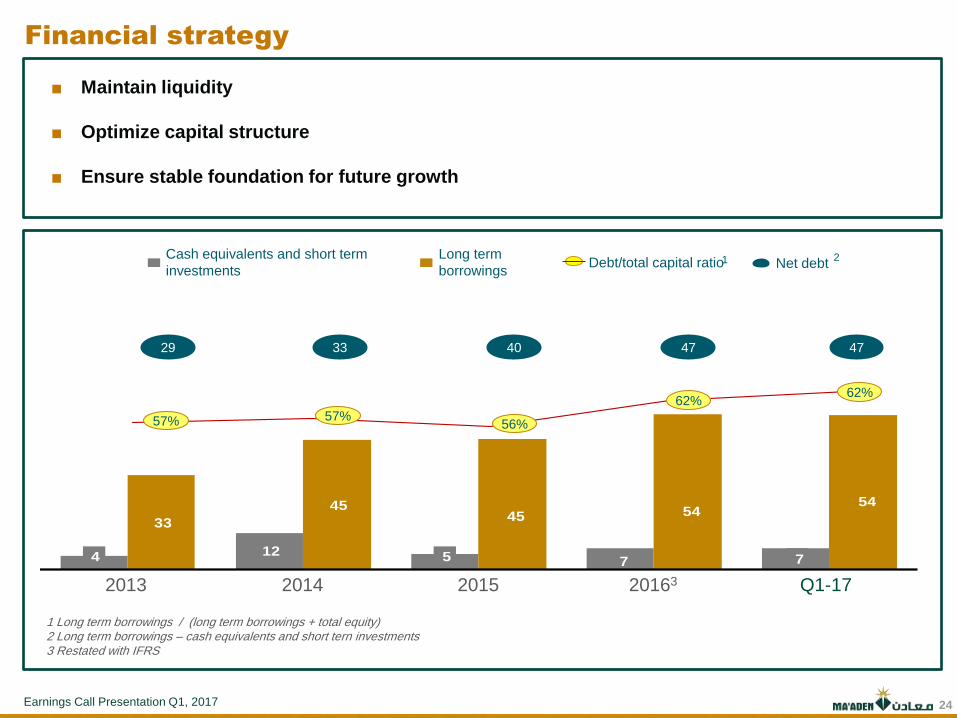
1 Long term borrowings / (long term borrowings + total equity) 2 Long term borrowings – cash equivalents and short tern investments 3 Restated with IFRS
Financial strategy
■ Maintain liquidity
■ Optimize capital structure
■ Ensure stable foundation for future growth
4 12 5 7 7
33
45 45 54
54
Cash equivalents and short term
investments
Long term
borrowings Debt/total capital ratio Net debt 1 2
57% 57% 56%
62% 62%
2013 2014 2015
29 33 40 47 47
Q1-17 20163

Earnings Call Presentation Q1, 2017 25
Summary
Leading position in fundamentally attractive commodities
Better overall price environment in Q1 2017 but some concerns for the balance of the
year, particularly in DAP
Underpinned outstanding cost performance
Strong cost performance allows us to see the full benefits of improved commodity prices
Record production in all our business first quarter 2017
Continued focus on volumes: ramping up new capacities and increasing throughput at existing
operations
Growth projects underway
Wa’ad Al Shamal on track and we have a good pipeline of new projects
Aligned to Vision 2030
Our strategy is set to contribute to, and benefit from, the Vision 2030 initiatives
Earnings Call Presentation Q1, 2017 26
Appendix
Earnings Call Presentation Q1, 2017 27
0
500
1000
1500
2000
2500
2017 2018 2019 2020 2021 2022 2023 2024 2025 2026 2027 2028 2029 2030
MIC
MGBM
WAS
MBAC
MRC
MAC
MPC
633
873
998
1,132
1,269
1,712
2,067
1,198
1,321
1,631
806
575 575
288
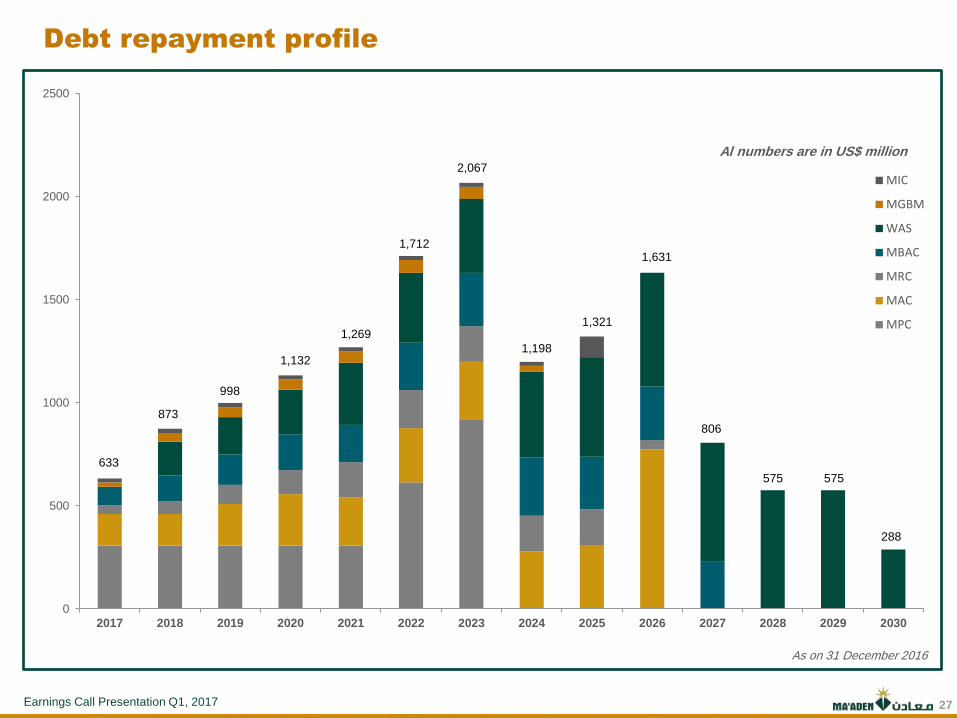
Debt repayment profile
Al numbers are in US$ million
As on 31 December 2016
Earnings Call Presentation Q1, 2017 28
Particulars Q1
2017
Q1
2016
%
change
y-o-y
Q4
2016
%
change
q-o-q
2016 2015
%
change
y-o-y
Phosphate business
Ammonium phosphate
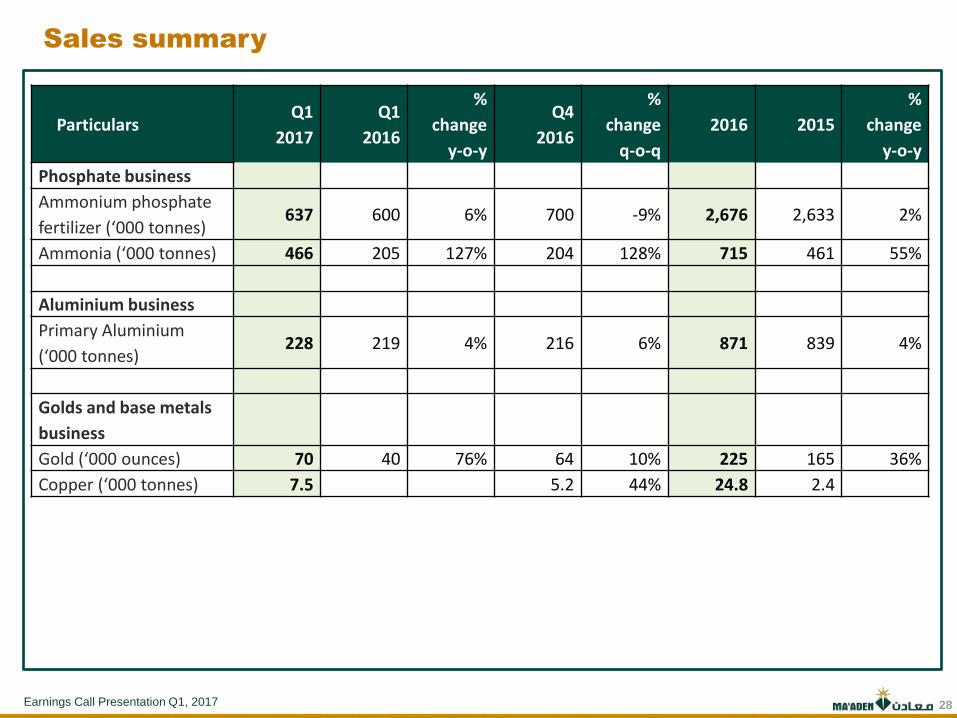
fertilizer (‘000 tonnes) 637 600 6% 700 -9% 2,676 2,633 2%
Ammonia (‘000 tonnes) 466 205 127% 204 128% 715 461 55%
Aluminium business
Primary Aluminium
(‘000 tonnes) 228 219 4% 216 6% 871 839 4%
Golds and base metals
business
Gold (‘000 ounces) 70 40 76% 64 10% 225 165 36%
Copper (‘000 tonnes) 7.5 5.2 44% 24.8 2.4
Sales summary

Earnings Call Presentation Q1, 2017 29
Saudi Arabian Mining Company (Ma’aden) IFRS Transition Impact on the Consolidated Financial Statements
May 7, 2017
Earnings Call Presentation Q1, 2017 30
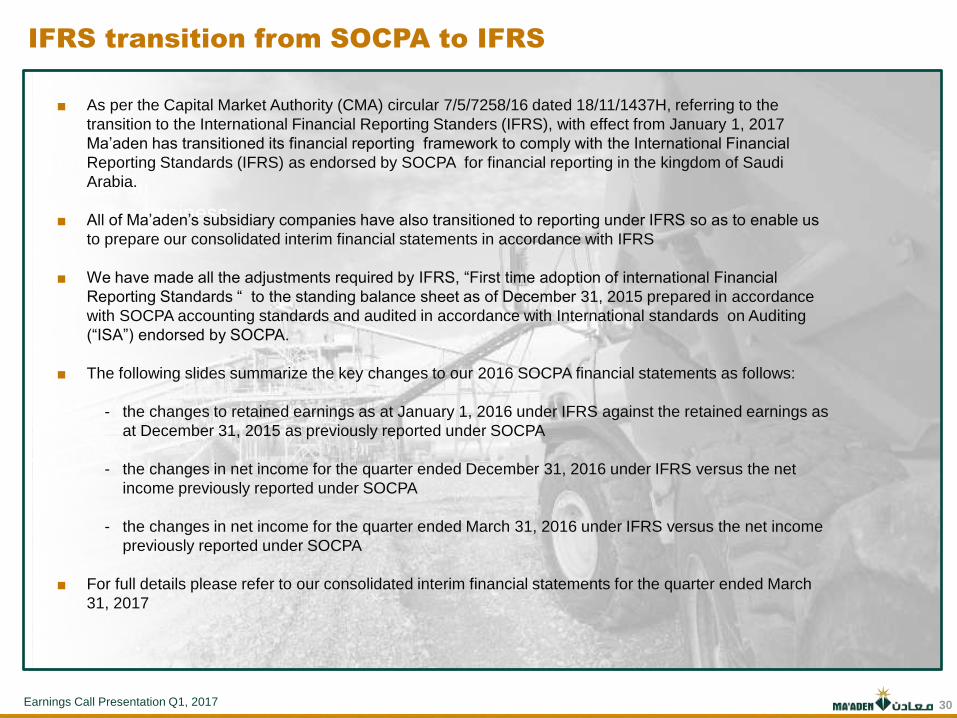
IFRS transition from SOCPA to IFRS
IFRS transition
impact on
Ma’aden business
■ As per the Capital Market Authority (CMA) circular 7/5/7258/16 dated 18/11/1437H, referring to the
transition to the International Financial Reporting Standers (IFRS), with effect from January 1, 2017
Ma’aden has transitioned its financial reporting framework to comply with the International Financial
Reporting Standards (IFRS) as endorsed by SOCPA for financial reporting in the kingdom of Saudi
Arabia.
■ All of Ma’aden’s subsidiary companies have also transitioned to reporting under IFRS so as to enable us
to prepare our consolidated interim financial statements in accordance with IFRS
■ We have made all the adjustments required by IFRS, “First time adoption of international Financial
Reporting Standards “ to the standing balance sheet as of December 31, 2015 prepared in accordance
with SOCPA accounting standards and audited in accordance with International standards on Auditing
(“ISA”) endorsed by SOCPA.
■ The following slides summarize the key changes to our 2016 SOCPA financial statements as follows:
- the changes to retained earnings as at January 1, 2016 under IFRS against the retained earnings as
at December 31, 2015 as previously reported under SOCPA
- the changes in net income for the quarter ended December 31, 2016 under IFRS versus the net
income previously reported under SOCPA
- the changes in net income for the quarter ended March 31, 2016 under IFRS versus the net income
previously reported under SOCPA
■ For full details please refer to our consolidated interim financial statements for the quarter ended March
31, 2017
Earnings Call Presentation Q1, 2017 31
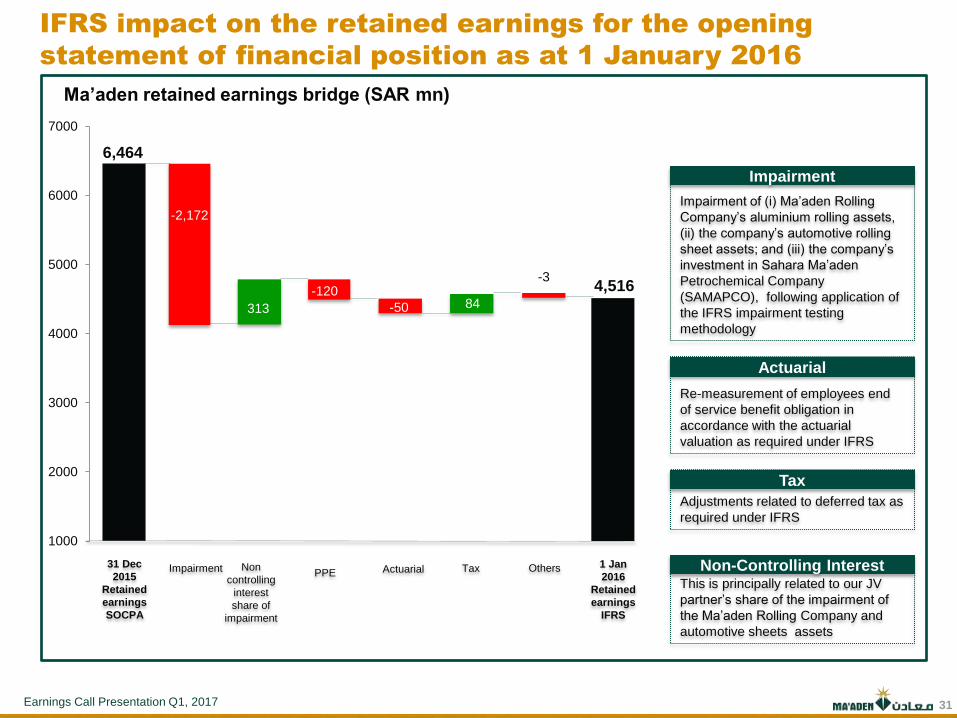
Ma’aden retained earnings bridge (SAR mn)
IFRS impact on the retained earnings for the opening
statement of financial position as at 1 January 2016
6,464
4,516
1000
2000
3000
4000
5000
6000
7000
-2,172
84
313
-3
31 Dec
2015
Retained
earnings
SOCPA
Impairment PPE Actuarial Tax Non
controlling
interest
share of
impairment
Others 1 Jan
2016
Retained
earnings
IFRS
Impairment of (i) Ma’aden Rolling
Company’s aluminium rolling assets,
(ii) the company’s automotive rolling
sheet assets; and (iii) the company’s
investment in Sahara Ma’aden
Petrochemical Company
(SAMAPCO), following application of
the IFRS impairment testing
methodology
Impairment
Re-measurement of employees end
of service benefit obligation in
accordance with the actuarial
valuation as required under IFRS
Actuarial
Adjustments related to deferred tax as
required under IFRS
Tax
This is principally related to our JV
partner’s share of the impairment of
the Ma’aden Rolling Company and
automotive sheets assets
Non-Controlling Interest
-120
-50 84

Earnings Call Presentation Q1, 2017 32
Re-measurements due to conversion to IFRS reporting
standard resulted to an increase in net loss by SR 620 mn
Net income/loss bridge of Q4 2016 SOCPA vs Q4 2016 IFRS
Due to the introduction of
componentization of
plant, property and
equipment, increased
the depreciation charge
Cost of sales
Re-measurement of
employees end of
service termination
benefit obligation in
accordance with the
actuarial valuation as
required under IFRS
Actuarial
Adjustments arising from
provisional pricing in gold
and aluminium business
Sales
Investment in SAMAPCO
was impaired on the date
of transition to IFRS,
which resulted in the
reversal of reported
equity share of loss for
Q4 2016 under IFRS
Share in net loss of JV
Adjustments related to
the deferred tax as
required under IFRS
applicable to non-
controlling interest
Others
Impairment of Ma’aden
Rolling Company’s
assets, following
adoption of IFRS
impairment methodology
Impairment
-23 -643
-700
-600
-500
-400
-300
-200
-100
0
Q4
2016
SOCPA
Net
loss
Sales Cost
of
sales
Actuarial Finance
cost Others Q4 2016
IFRS Net
loss
SAR MN
Impairment Share
in net
loss of
JV
-76
-5 -566
-23 17 29
3
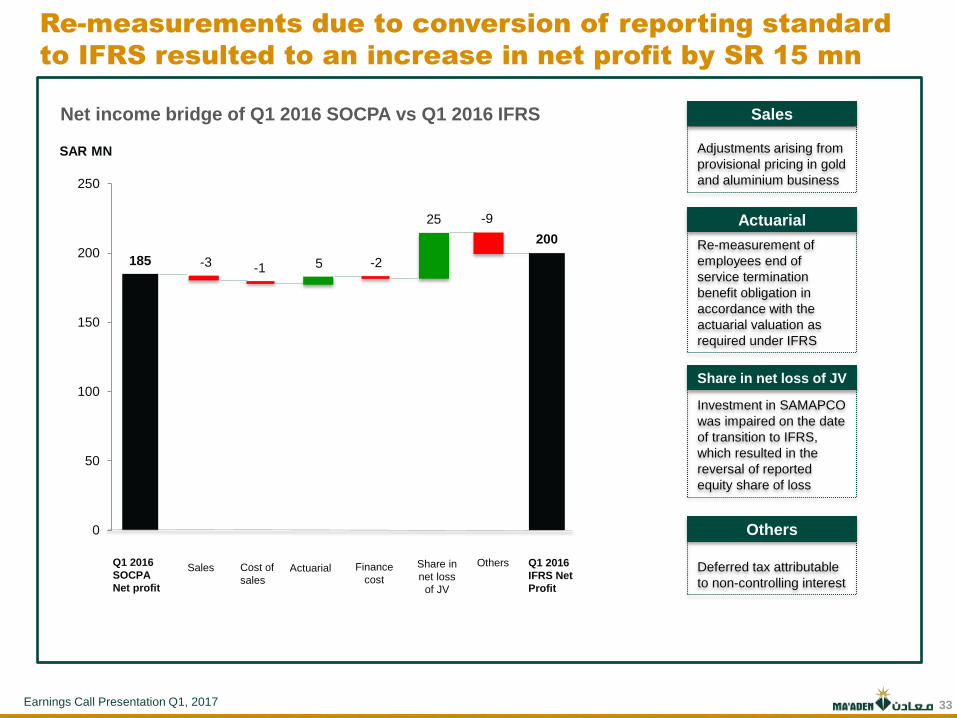
Earnings Call Presentation Q1, 2017 33
Adjustments arising from
provisional pricing in gold
and aluminium business
Sales
Investment in SAMAPCO
was impaired on the date
of transition to IFRS,
which resulted in the
reversal of reported
equity share of loss
Share in net loss of JV
Re-measurements due to conversion of reporting standard
to IFRS resulted to an increase in net profit by SR 15 mn
185
200
0
50
100
150
200
250
Q1 2016
SOCPA
Net profit
Sales Cost of
sales Actuarial
Finance
cost
Q1 2016
IFRS Net
Profit
SAR MN
Share in
net loss
of JV
Others
Net income bridge of Q1 2016 SOCPA vs Q1 2016 IFRS
Re-measurement of
employees end of
service termination
benefit obligation in
accordance with the
actuarial valuation as
required under IFRS
Actuarial
Deferred tax attributable
to non-controlling interest
Others
-3 -1 5 -2
25 -9

Earnings Call Presentation Q1, 2017 34
Thank You!
Copyright © 2016. Ma’aden . All rights reserved.


