Page 1
Company Name: Dr. Reddy's Laboratories
Head Office: Hyderabad, Telangana,India
Industry Type: Pharmaceuticals, Drugs & Healthcare
Founded: 1984
Founder: Anji Reddy
Key people: G. V. Prasad (CEO) Kallam Satish Reddy(Chairman)
Products: Omez, Nise, Stamlo, Stamlo, Beta, Enam, Atocor
Page 2
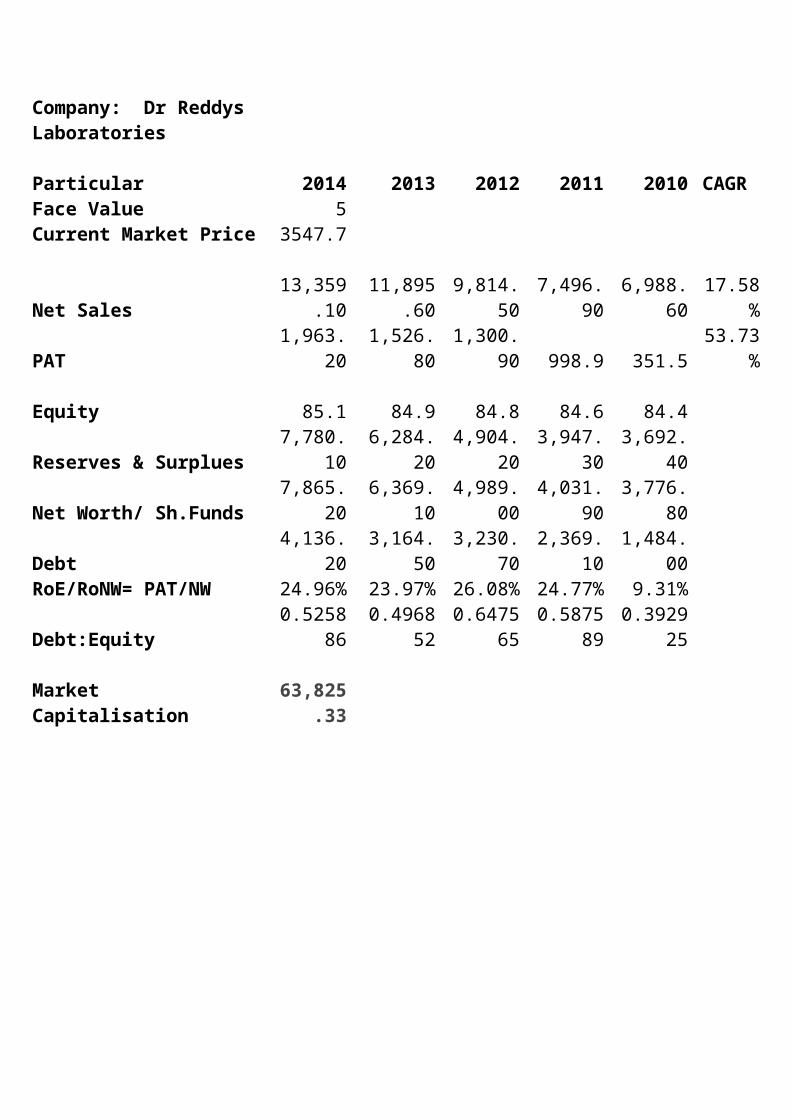
Company: Dr Reddys Laboratories Particular 2014 2013 2012 2011 2010 CAGRFace Value 5 Current Market Price 3547.7
Net Sales 13,359.1011,895.6
0 9,814.50 7,496.90 6,988.60 17.58%PAT 1,963.20 1,526.80 1,300.90 998.9 351.5 53.73% Equity 85.1 84.9 84.8 84.6 84.4 Reserves & Surplues 7,780.10 6,284.20 4,904.20 3,947.30 3,692.40 Net Worth/ Sh.Funds 7,865.20 6,369.10 4,989.00 4,031.90 3,776.80 Debt 4,136.20 3,164.50 3,230.70 2,369.10 1,484.00 RoE/RoNW= PAT/NW 24.96% 23.97% 26.08% 24.77% 9.31%
Debt:Equity 0.525886 0.496852 0.647565 0.5875890.39292
5 Market Capitalisation 63,825.33
Page 3
Fundamental Analysis
Page 4
Company Name: Aurobindo Pharma
Head Office: Hyderabad, Telangana,India
Industry Type: Pharmaceuticals, Drugs & Healthcare
Founded: 1986
Founder: Mr. P. V. Ramaprasad Reddy and Mr.K. Nityananda Reddy
Key people: Dr. M. Sivakumaran, Mr. Madanmohan Reddy, Mr. Govind, Mr. Arvind Vasudeva,
Products: Formulation, Active Pharmaceutical Ingredient, Organic Intermediates
Page 5
Fundamental AnalysisCompany:Aurobindo Pharma
Particular 2014 2013 2012 2011 2010 CAGR
Face Value 1
Current Market Price 1415.35
Net Sales 8,099.79 5,855.32 4,627.40 4,384.80 3,604.27 22.44%
PAT 1,169.07 291.4 -124.14 563.06 563.08 20.04%
Equity 29.15 29.12 29.11 29.11 27.86
Reserves & Surplues 3,721.00 2,576.64 2,310.54 2,415.72 1,801.22
Net Worth/ Sh.Funds 3,750.15 2,605.76 2,339.65 2,444.83 1,829.08
Debt 3,633.92 3,384.38 2,572.84 2,414.35 2,154.56
RoE/RoNW= PAT/NW 31.17% 11.18% -5.31% 23.03% 30.78%
Debt:Equity 0.969007 1.298807 1.099669 0.987533 1.177947
Market Capitalisation 42,413.35
About the Company
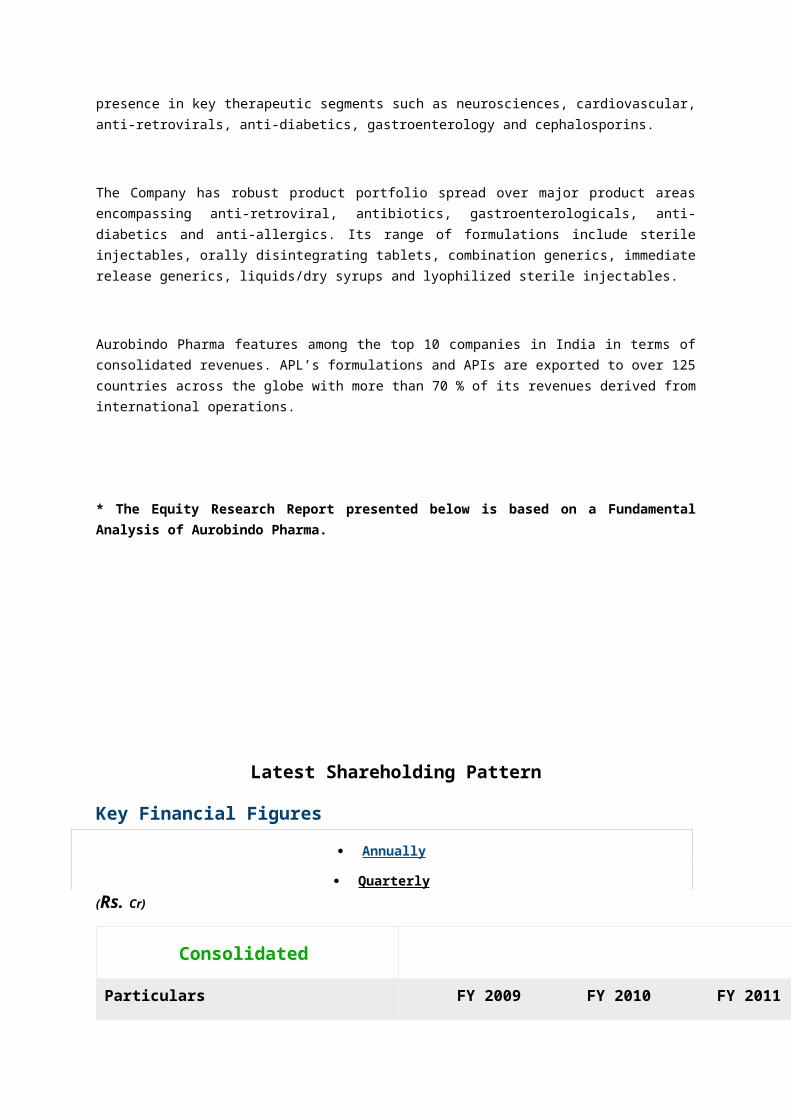
Aurobindo Pharma Limited (“Aurobindo Pharma” or the “Company”) was set up in the year 1986 and is a leading manufacturer of Active Pharmaceutical Ingredients (APIs) and finished dosage formulations. The Company has presence in key therapeutic segments such as neurosciences, cardiovascular, anti-retrovirals, anti-diabetics, gastroenterology and cephalosporins.
The Company has robust product portfolio spread over major product areas encompassing anti-retroviral, antibiotics, gastroenterologicals, anti-diabetics and anti-allergics. Its range of formulations include sterile injectables, orally disintegrating tablets, combination generics, immediate release generics, liquids/dry syrups and lyophilized sterile injectables.
Aurobindo Pharma features among the top 10 companies in India in terms of consolidated revenues. APL’s formulations and APIs are exported to over 125 countries across the globe with more than 70 % of its revenues derived from international operations.
Page 6
* The Equity Research Report presented below is based on a Fundamental Analysis of Aurobindo Pharma.
Latest Shareholding Pattern
Key Financial Figures
Annually
Quarterly
(Rs. Cr)
Consolidated
Particulars FY 2009 FY 2010 FY 2011
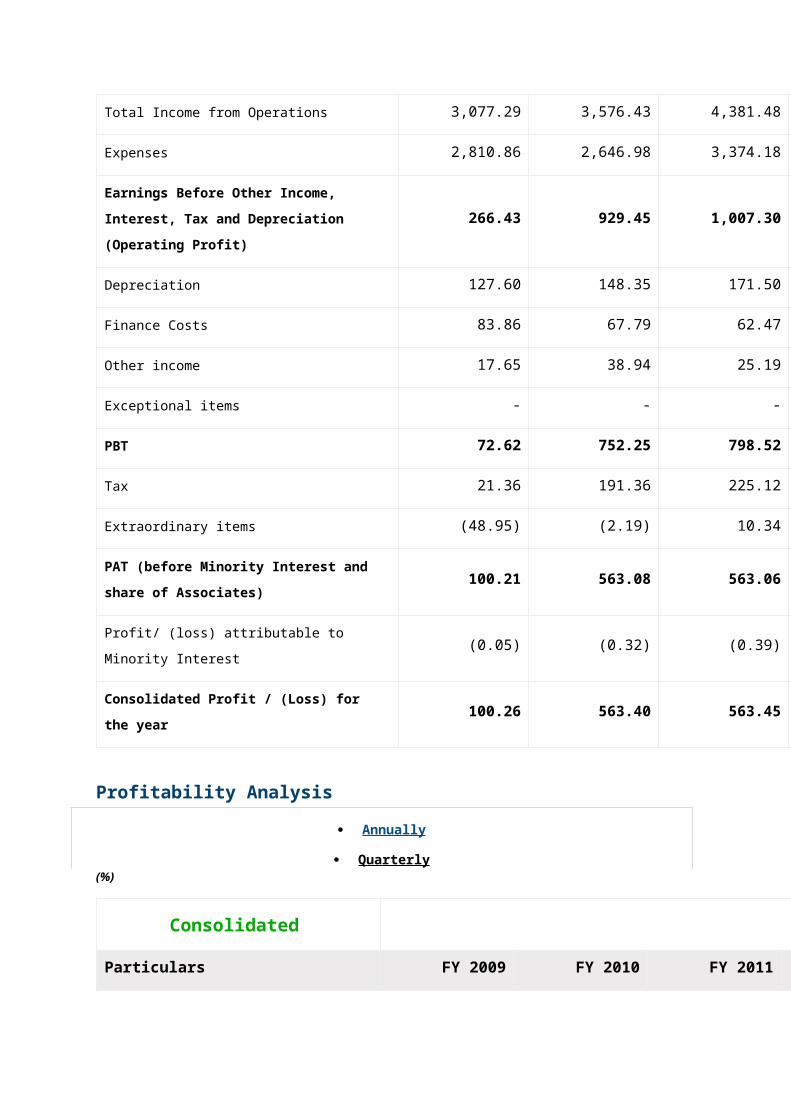
Total Income from Operations 3,077.29 3,576.43 4,381.48
Expenses 2,810.86 2,646.98 3,374.18
Earnings Before Other Income, Interest, Tax and
Depreciation (Operating Profit)266.43 929.45 1,007.30
Depreciation 127.60 148.35 171.50
Finance Costs 83.86 67.79 62.47
Other income 17.65 38.94 25.19
Exceptional items - - -
PBT 72.62 752.25 798.52
Tax 21.36 191.36 225.12
Page 7
Extraordinary items (48.95) (2.19) 10.34
PAT (before Minority Interest and share of
Associates)100.21 563.08 563.06
Profit/ (loss) attributable to Minority Interest (0.05) (0.32) (0.39)
Consolidated Profit / (Loss) for the year 100.26 563.40 563.45
Profitability Analysis
Annually
Quarterly (%)
Consolidated
Particulars FY 2009 FY 2010 FY 2011
Operating Profit Margin Ratio 8.66 25.99 22.99
Net Profit Margin Ratio 3.26 15.75 12.86
Operating profit margin is a measurement of the proportion of a company’s revenue that is left over
after paying for production costs such as raw materials, salaries and administrative costs. Net profit
margin is arrived at by deducting non operating expenses such as depreciation, finance costs and
taxes out of operating profit and shows what is left for the shareholders as a percentage of net sales.
Together these ratios help in understanding the cost and profit structure of the firm and analysing
business inefficiencies. Profitability Ratios
Key Balance Sheet Figures(Rs. Cr)
Sources of Funds / Liabilities
Particulars FY 2009 FY 2010 FY 2011
Page 8
Share Capital 26.88 27.86 29.11
Reserves & Surplus 1,214.38 1,801.22 2,415.72
Net worth (shareholders funds) 1,241.26 1,829.08 2,444.83
Minority Interest 3.15 4.33 9.12
Long term borrowings 2,332.97 2,154.56 523.35
Current liabilities 570.05 707.99 2,768.49
Other long term liabilities and provisions - - 3.09
Deferred Tax Liabilities 79.04 95.35 123.40
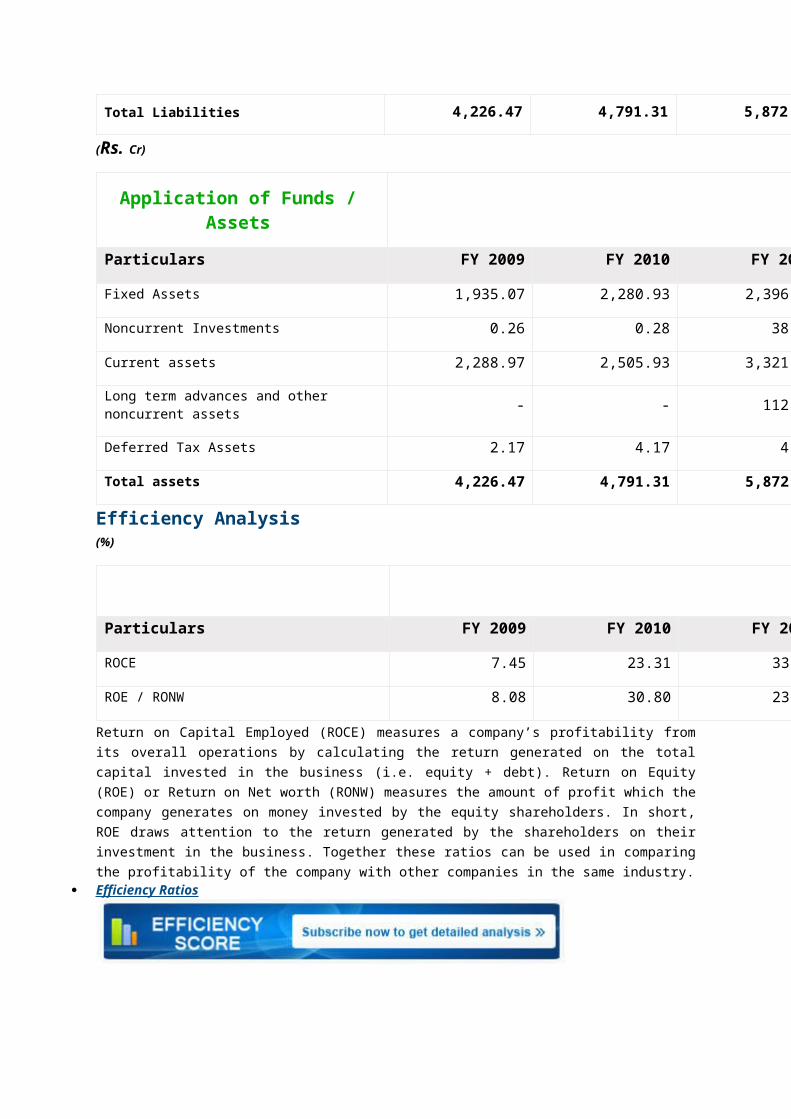
Total Liabilities 4,226.47 4,791.31 5,872.28
(Rs. Cr)
Application of Funds / Assets
Particulars FY 2009 FY 2010 FY 2011
Fixed Assets 1,935.07 2,280.93 2,396.02
Noncurrent Investments 0.26 0.28 38.49
Current assets 2,288.97 2,505.93 3,321.18
Long term advances and other noncurrent assets - - 112.24
Deferred Tax Assets 2.17 4.17 4.35
Total assets 4,226.47 4,791.31 5,872.28
Efficiency Analysis(%)
Particulars FY 2009 FY 2010 FY 2011
ROCE 7.45 23.31 33.94
ROE / RONW 8.08 30.80 23.05
Return on Capital Employed (ROCE) measures a company’s profitability from its overall operations by
calculating the return generated on the total capital invested in the business (i.e. equity + debt).
Page 9
Return on Equity (ROE) or Return on Net worth (RONW) measures the amount of profit which the
company generates on money invested by the equity shareholders. In short, ROE draws attention to
the return generated by the shareholders on their investment in the business. Together these ratios
can be used in comparing the profitability of the company with other companies in the same industry. Efficiency Ratios
Valuation Analysis
Annually
Quarterly
Consolidated
Particulars FY 2009 FY 2010 FY 2011
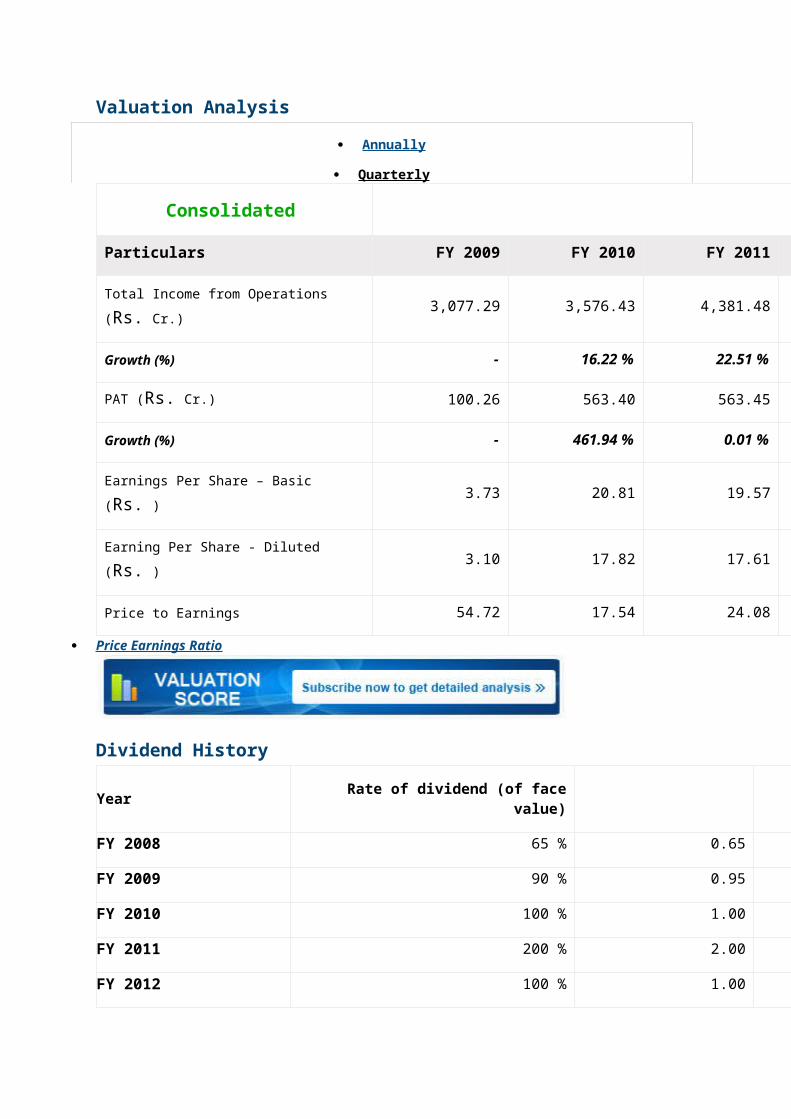
Total Income from Operations (Rs. Cr.) 3,077.29 3,576.43 4,381.48
Growth (%) - 16.22 % 22.51 %
PAT (Rs. Cr.) 100.26 563.40 563.45
Growth (%) - 461.94 % 0.01 %
Earnings Per Share – Basic (Rs. ) 3.73 20.81 19.57
Earning Per Share - Diluted (Rs. ) 3.10 17.82 17.61
Price to Earnings 54.72 17.54 24.08
Price Earnings Ratio
Dividend History
Year Rate of dividend (of face value) Rs.
FY 2008 65 % 0.65
FY 2009 90 % 0.95
FY 2010 100 % 1.00
FY 2011 200 % 2.00
Page 10
FY 2012 100 % 1.00
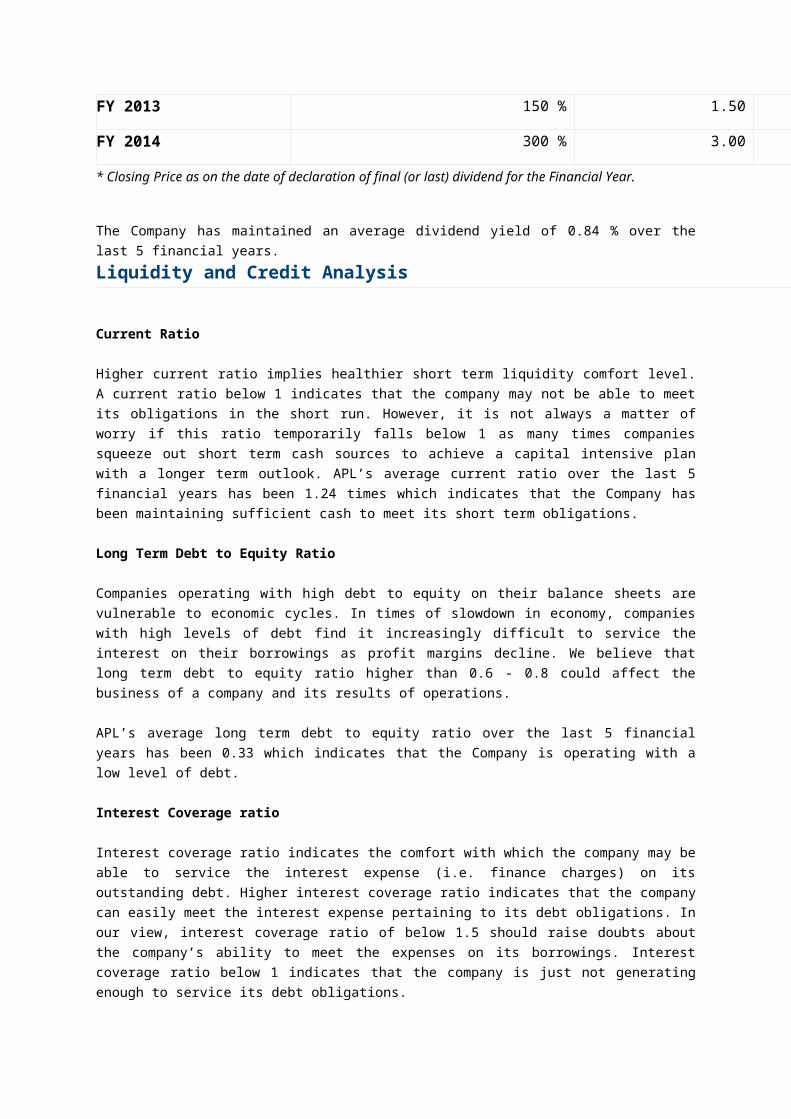
FY 2013 150 % 1.50
FY 2014 300 % 3.00
* Closing Price as on the date of declaration of final (or last) dividend for the Financial Year.
The Company has maintained an average dividend yield of 0.84 % over the last 5 financial years.
Liquidity and Credit Analysis
Current Ratio
Higher current ratio implies healthier short term liquidity comfort level. A current ratio below 1
indicates that the company may not be able to meet its obligations in the short run. However, it is not
always a matter of worry if this ratio temporarily falls below 1 as many times companies squeeze out
short term cash sources to achieve a capital intensive plan with a longer term outlook. APL’s average
current ratio over the last 5 financial years has been 1.24 times which indicates that the Company has
been maintaining sufficient cash to meet its short term obligations.
Long Term Debt to Equity Ratio
Companies operating with high debt to equity on their balance sheets are vulnerable to economic
cycles. In times of slowdown in economy, companies with high levels of debt find it increasingly
difficult to service the interest on their borrowings as profit margins decline. We believe that long term
debt to equity ratio higher than 0.6 - 0.8 could affect the business of a company and its results of
operations.
APL’s average long term debt to equity ratio over the last 5 financial years has been 0.33 which
indicates that the Company is operating with a low level of debt.
Interest Coverage ratio
Interest coverage ratio indicates the comfort with which the company may be able to service the
interest expense (i.e. finance charges) on its outstanding debt. Higher interest coverage ratio
indicates that the company can easily meet the interest expense pertaining to its debt obligations. In
our view, interest coverage ratio of below 1.5 should raise doubts about the company’s ability to meet
the expenses on its borrowings. Interest coverage ratio below 1 indicates that the company is just not
generating enough to service its debt obligations.
APL’s average interest coverage ratio over the last 5 financial years has been 10.27 times which
indicates that the Company has been generating enough for the shareholders after servicing its debt
obligations. Liquidity & Credit Ratios
Page 11
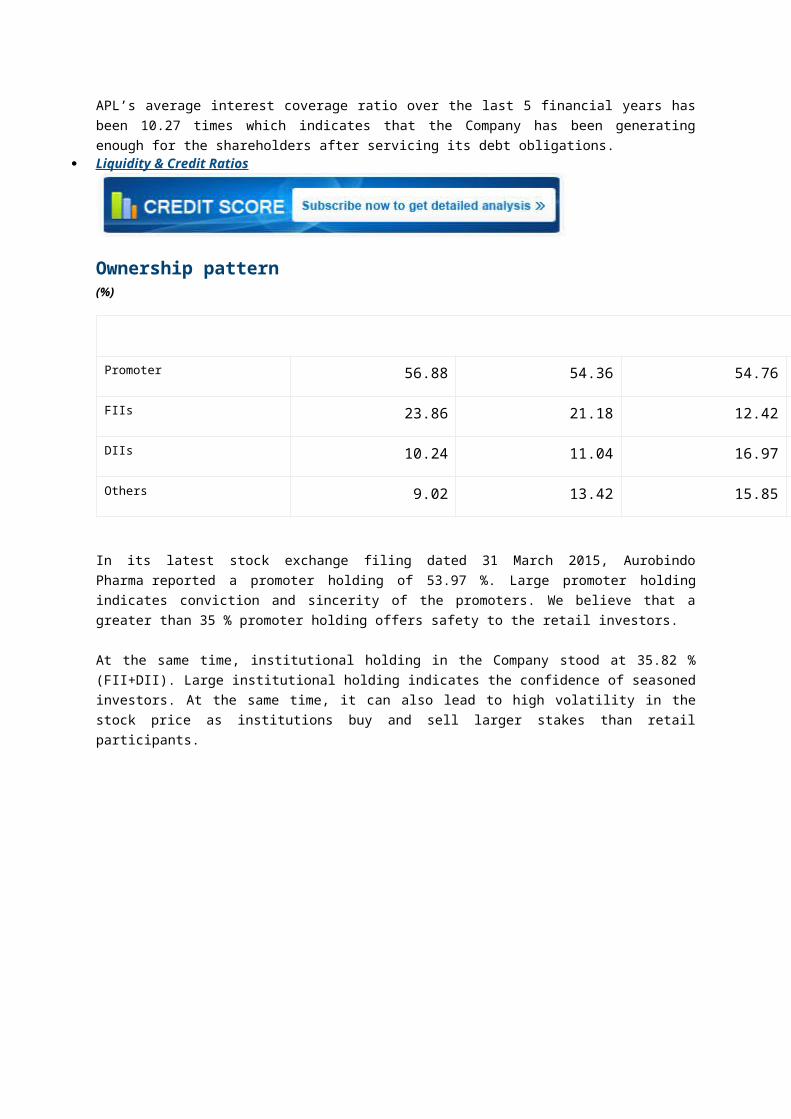
Ownership pattern(%)
Shareholding March 2010 March 2011 March 2012
Promoter 56.88 54.36 54.76
FIIs 23.86 21.18 12.42
DIIs 10.24 11.04 16.97
Others 9.02 13.42 15.85
In its latest stock exchange filing dated 31 March 2015, Aurobindo Pharma reported a promoter
holding of 53.97 %. Large promoter holding indicates conviction and sincerity of the promoters. We
believe that a greater than 35 % promoter holding offers safety to the retail investors.
At the same time, institutional holding in the Company stood at 35.82 % (FII+DII). Large institutional
holding indicates the confidence of seasoned investors. At the same time, it can also lead to high
volatility in the stock price as institutions buy and sell larger stakes than retail participants.
Page 12
Company Name: Ipca Laboratories
Head Office: Mumbai, India
Industry Type: Pharmaceuticals
Founded: 19 October 1949
Founder: K.B. MehlaDr. N.S. Tibrawala
Key people: Prem Chand Godha, MD, Mr. AK Jain, JMD
Products:Pharmaceuticals, drugs, Atenolol(antihypertensive) Chloroquine Phosphate (anti-malarial), Furosemide (diuretic), Hydroxychloroquine Sulphate (NSAID)
Page 13
Fundamental AnalysisCompany: Ipca Laboratories Particular 2014 2013 2012 2011 2010 CAGRFace Value 2 Current Market Price 698.65
Net Sales 3,281.77 2,813.12 2,370.09 1,975.341,621.9
319.27
PAT 478.2 324.6 276.2 262.31 203.5423.81
Equity 25.24 25.24 25.23 25.14 25.04 Reserves & Surplues 1,934.42 1,528.54 1,228.78 1,026.45 839.84 Net Worth/ Sh.Funds 1,959.66 1,553.78 1,254.01 1,051.59 864.88 Debt 437.94 523.35 531.54 530.32 454.01 RoE/RoNW= PAT/NW 24.40% 20.89% 22.03% 24.94% 23.53%
Debt:Equity0.22347
80.33682
40.42387
20.50430
3 0.52494 Market Capitalisation 8,664.20
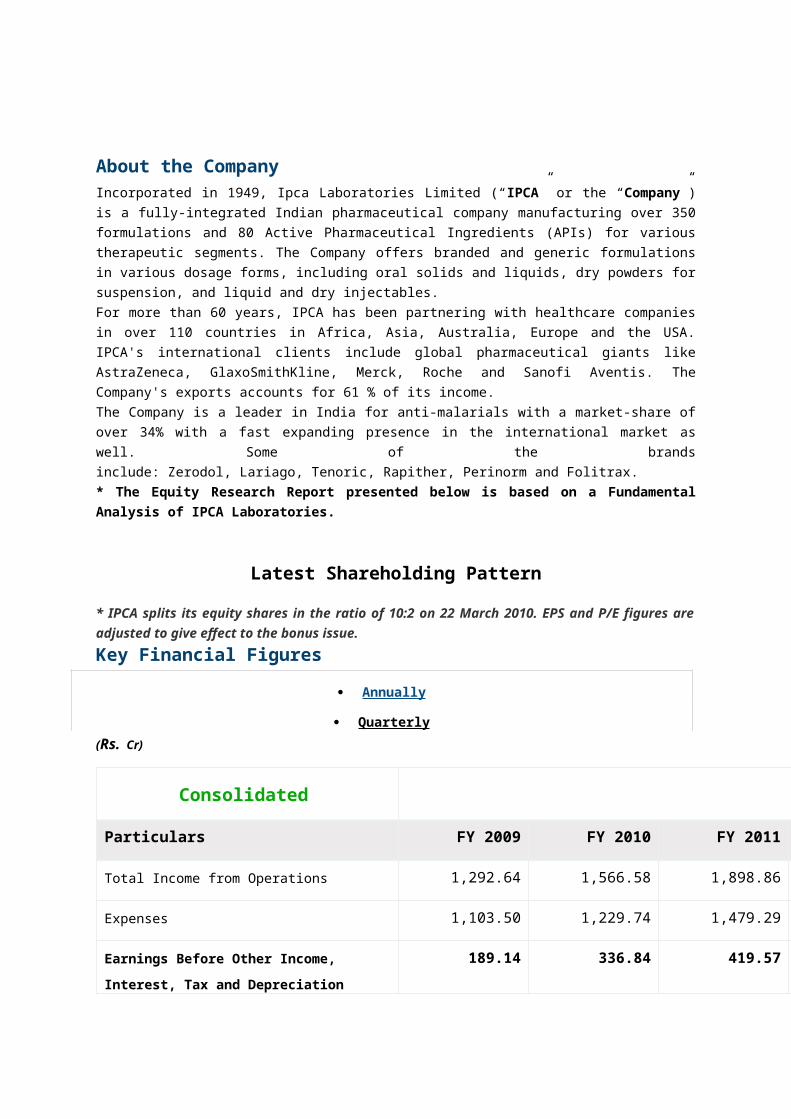
About the CompanyIncorporated in 1949, Ipca Laboratories Limited (“IPCA” or the “Company”) is a fully-integrated Indian
pharmaceutical company manufacturing over 350 formulations and 80 Active Pharmaceutical
Ingredients (APIs) for various therapeutic segments. The Company offers branded and generic
formulations in various dosage forms, including oral solids and liquids, dry powders for suspension,
and liquid and dry injectables.
Page 14
For more than 60 years, IPCA has been partnering with healthcare companies in over 110 countries
in Africa, Asia, Australia, Europe and the USA. IPCA's international clients include global
pharmaceutical giants like AstraZeneca, GlaxoSmithKline, Merck, Roche and Sanofi Aventis. The
Company's exports accounts for 61 % of its income.
The Company is a leader in India for anti-malarials with a market-share of over 34% with a fast
expanding presence in the international market as well. Some of the brands
include: Zerodol, Lariago, Tenoric, Rapither, Perinorm and Folitrax.
* The Equity Research Report presented below is based on a Fundamental Analysis of IPCA
Laboratories.
Latest Shareholding Pattern
* IPCA splits its equity shares in the ratio of 10:2 on 22 March 2010. EPS and P/E figures are
adjusted to give effect to the bonus issue.
Key Financial Figures
Annually
Quarterly
(Rs. Cr)
Consolidated
Particulars FY 2009 FY 2010 FY 2011
Total Income from Operations 1,292.64 1,566.58 1,898.86
Expenses 1,103.50 1,229.74 1,479.29
Earnings Before Other Income, Interest, Tax and
Depreciation (Operating Profit)189.14 336.84 419.57
Depreciation 39.66 46.74 55.79
Finance Costs 31.80 26.38 31.40
Other income 0.64 2.54 8.31
Exceptional items - - -
PBT 118.32 266.26 340.69
Tax 23.25 62.72 78.38
Page 15
Extraordinary items - - -
PAT (before Minority Interest and share of
Associates)95.07 203.54 262.31
Profit/ (loss) attributable to Minority Interest (0.38) (0.20) (0.08)
Share of profit / (loss) of Associates (5.35) (1.62) (0.43)
Consolidated Profit / (Loss) for the year 100.80 205.36 262.82
Profitability Analysis
Annually
Quarterly (%)
Consolidated
Particulars FY 2009 FY 2010 FY 2011
Operating Profit Margin Ratio 14.63 21.50 22.10
Net Profit Margin Ratio 7.80 13.11 13.84
Operating profit margin is a measurement of the proportion of a company’s revenue that is left over
after paying for production costs such as raw materials, salaries and administrative costs. Net profit
margin is arrived at by deducting non operating expenses such as depreciation, finance costs and
taxes out of operating profit and shows what is left for the shareholders as a percentage of net sales.
Together these ratios help in understanding the cost and profit structure of the firm and analysing
business inefficiencies. Profitability Ratios
Key Balance Sheet Figures(Rs. Cr)
Sources of Funds / Liabilities
Page 16
Particulars FY 2009 FY 2010 FY 2011
Share Capital 24.99 25.04 25.14
Share application money pending allotment 0.03 0.01
Reserves & Surplus 606.30 839.84 1,026.45
Net worth (shareholders funds) 631.32 864.89 1,051.59
Minority Interest (0.38) (0.58) (0.66)
Long term borrowings 459.36 454.52 194.62
Current liabilities 216.18 209.70 578.53
Other long term liabilities and provisions - - 7.00
Deferred Tax Liabilities 65.11 79.30 80.73
Total Liabilities 1,371.59 1,607.83 1,911.81
(Rs. Cr)
Application of Funds / Assets
Particulars FY 2009 FY 2010 FY 2011
Fixed Assets 591.20 676.13 793.97
Noncurrent Investments 41.17 32.54 40.68
Current assets 739.22 899.16 1,036.80
Long term advances and other noncurrent assets - - 40.36
Goodwill on consolidation (net) - -
Total assets 1,371.59 1,607.83 1,911.81
Efficiency Analysis(%)
Particulars FY 2009 FY 2010 FY 2011
ROCE 17.35 25.54 33.67
Page 17
ROE / RONW 15.97 23.74 24.99
Return on Capital Employed (ROCE) measures a company’s profitability from its overall operations by
calculating the return generated on the total capital invested in the business (i.e. equity + debt).
Return on Equity (ROE) or Return on Net Worth (RONW) measures the amount of profit which the
company generates on money invested by the equity shareholders. In short, ROE draws attention to
the return generated by the shareholders on their investment in the business. Together these ratios
can be used in comparing the profitability of the company with other companies in the same industry. Efficiency Ratios
Valuation Analysis
Annually
Quarterly
Consolidated
Particulars FY 2009 FY 2010 FY 2011
Total Income from Operations (Rs. Cr.) 1,292.64 1,566.58 1,898.86
Growth (%) - 21.19 % 21.21 %
PAT (Rs. Cr.) 100.80 205.36 262.82
Growth (%) - 103.73 % 27.98 %
Earnings Per Share – Basic (Rs. ) 7.89 16.44 20.96
Earning Per Share - Diluted (Rs. ) 7.8 16.41 20.95
Price to Earnings 8.33 16.41 14.39
Price Earnings Ratio
Dividend History
Year Rate of dividend (of face value) Rs.
FY 2008 80 % 1.60
Page 18
FY 2009 110 % 2.20
FY 2010 150 % 3.00
FY 2011 160 % 3.20
FY 2012 160 % 3.20
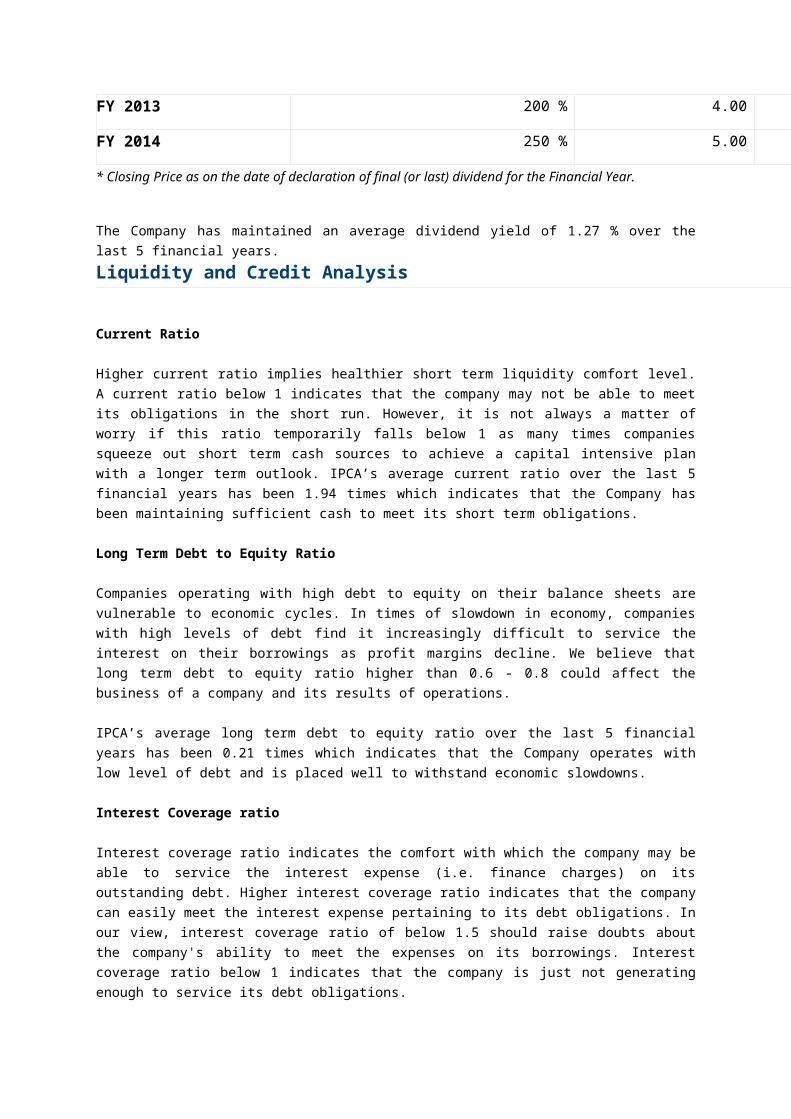
FY 2013 200 % 4.00
FY 2014 250 % 5.00
* Closing Price as on the date of declaration of final (or last) dividend for the Financial Year.
The Company has maintained an average dividend yield of 1.27 % over the last 5 financial years.
Liquidity and Credit Analysis
Current Ratio
Higher current ratio implies healthier short term liquidity comfort level. A current ratio below 1
indicates that the company may not be able to meet its obligations in the short run. However, it is not
always a matter of worry if this ratio temporarily falls below 1 as many times companies squeeze out
short term cash sources to achieve a capital intensive plan with a longer term outlook. IPCA’s average
current ratio over the last 5 financial years has been 1.94 times which indicates that the Company has
been maintaining sufficient cash to meet its short term obligations.
Long Term Debt to Equity Ratio
Companies operating with high debt to equity on their balance sheets are vulnerable to economic
cycles. In times of slowdown in economy, companies with high levels of debt find it increasingly
difficult to service the interest on their borrowings as profit margins decline. We believe that long term
debt to equity ratio higher than 0.6 - 0.8 could affect the business of a company and its results of
operations.
IPCA’s average long term debt to equity ratio over the last 5 financial years has been 0.21 times
which indicates that the Company operates with low level of debt and is placed well to withstand
economic slowdowns.
Interest Coverage ratio
Interest coverage ratio indicates the comfort with which the company may be able to service the
interest expense (i.e. finance charges) on its outstanding debt. Higher interest coverage ratio
indicates that the company can easily meet the interest expense pertaining to its debt obligations. In
our view, interest coverage ratio of below 1.5 should raise doubts about the company's ability to meet
the expenses on its borrowings. Interest coverage ratio below 1 indicates that the company is just not
generating enough to service its debt obligations.
Page 19
IPCA’s average interest coverage ratio over the last 5 financial years has been 17.26 times which
indicates that the Company has been generating enough for the shareholders after servicing its debt
obligations.
Company Name: Divis Laboratories
Head Office: Hyderabad
Industry Type: Pharmaceuticals
Founded: 1990
Founder: Dr. Murali K Divi
Key people: Mr N. V. Ramana, Executive Director, Mr Madhusudana Rao Divi, Director, Mr. Kiran S Divi, Director (Business Development)
Products: Active Pharmaceutical Ingredients (APIs) & Intermediates for Generics
Page 20
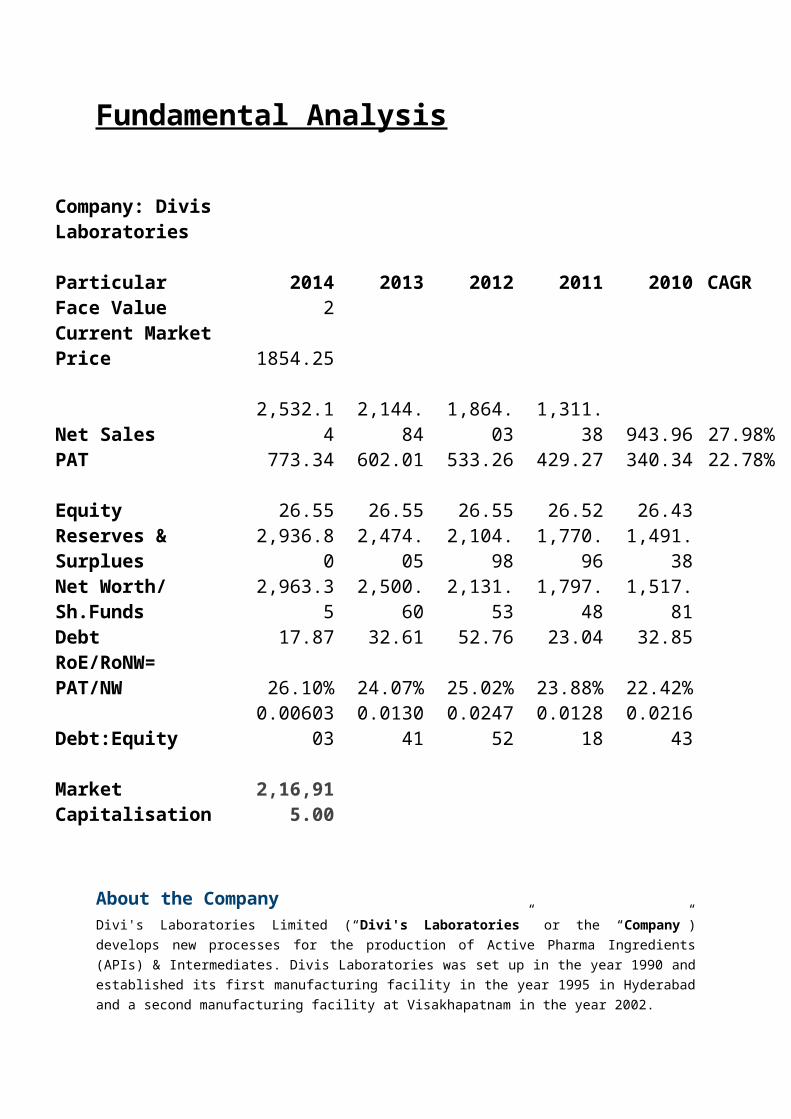
Fundamental Analysis
Company: Divis Laboratories Particular 2014 2013 2012 2011 2010 CAGRFace Value 2 Current Market Price 1854.25 Net Sales 2,532.14 2,144.84 1,864.03 1,311.38 943.96 27.98%PAT 773.34 602.01 533.26 429.27 340.34 22.78% Equity 26.55 26.55 26.55 26.52 26.43 Reserves & Surplues 2,936.80 2,474.05 2,104.98 1,770.96 1,491.38 Net Worth/ Sh.Funds 2,963.35 2,500.60 2,131.53 1,797.48 1,517.81 Debt 17.87 32.61 52.76 23.04 32.85 RoE/RoNW= PAT/NW 26.10% 24.07% 25.02% 23.88% 22.42% Debt:Equity 0.0060303 0.013041 0.024752 0.012818 0.021643
Market Capitalisation 2,16,915.0
0
About the CompanyDivi's Laboratories Limited (“Divi's Laboratories” or the “Company”) develops new processes for the
production of Active Pharma Ingredients (APIs) & Intermediates. Divis Laboratories was set up in the
year 1990 and established its first manufacturing facility in the year 1995 in Hyderabad and a second
manufacturing facility at Visakhapatnam in the year 2002.
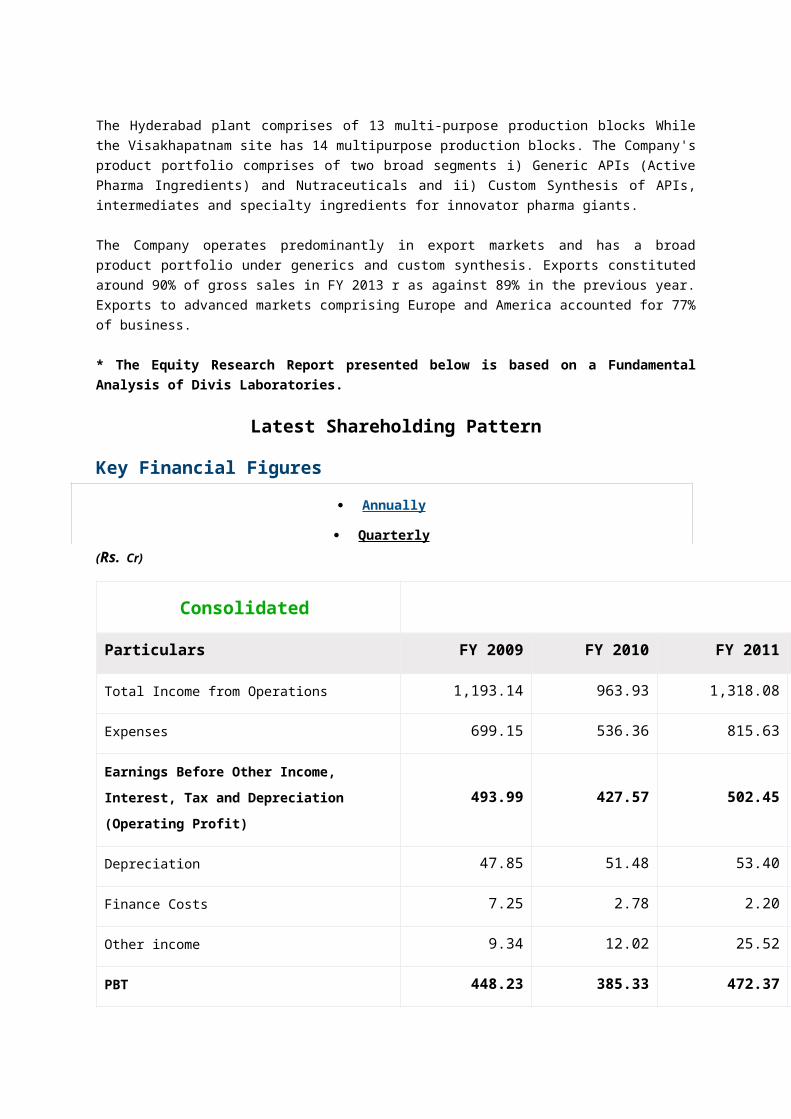
The Hyderabad plant comprises of 13 multi-purpose production blocks While the Visakhapatnam site
has 14 multipurpose production blocks. The Company's product portfolio comprises of two broad
segments i) Generic APIs (Active Pharma Ingredients) and Nutraceuticals and ii) Custom Synthesis of
APIs, intermediates and specialty ingredients for innovator pharma giants.
The Company operates predominantly in export markets and has a broad product portfolio under
generics and custom synthesis. Exports constituted around 90% of gross sales in FY 2013 r as
against 89% in the previous year. Exports to advanced markets comprising Europe and America
accounted for 77% of business.
Page 21
* The Equity Research Report presented below is based on a Fundamental Analysis of Divis
Laboratories.
Latest Shareholding Pattern
Key Financial Figures
Annually
Quarterly
(Rs. Cr)
Consolidated
Particulars FY 2009 FY 2010 FY 2011
Total Income from Operations 1,193.14 963.93 1,318.08
Expenses 699.15 536.36 815.63
Earnings Before Other Income, Interest, Tax and
Depreciation (Operating Profit)493.99 427.57 502.45
Depreciation 47.85 51.48 53.40
Finance Costs 7.25 2.78 2.20
Other income 9.34 12.02 25.52
PBT 448.23 385.33 472.37
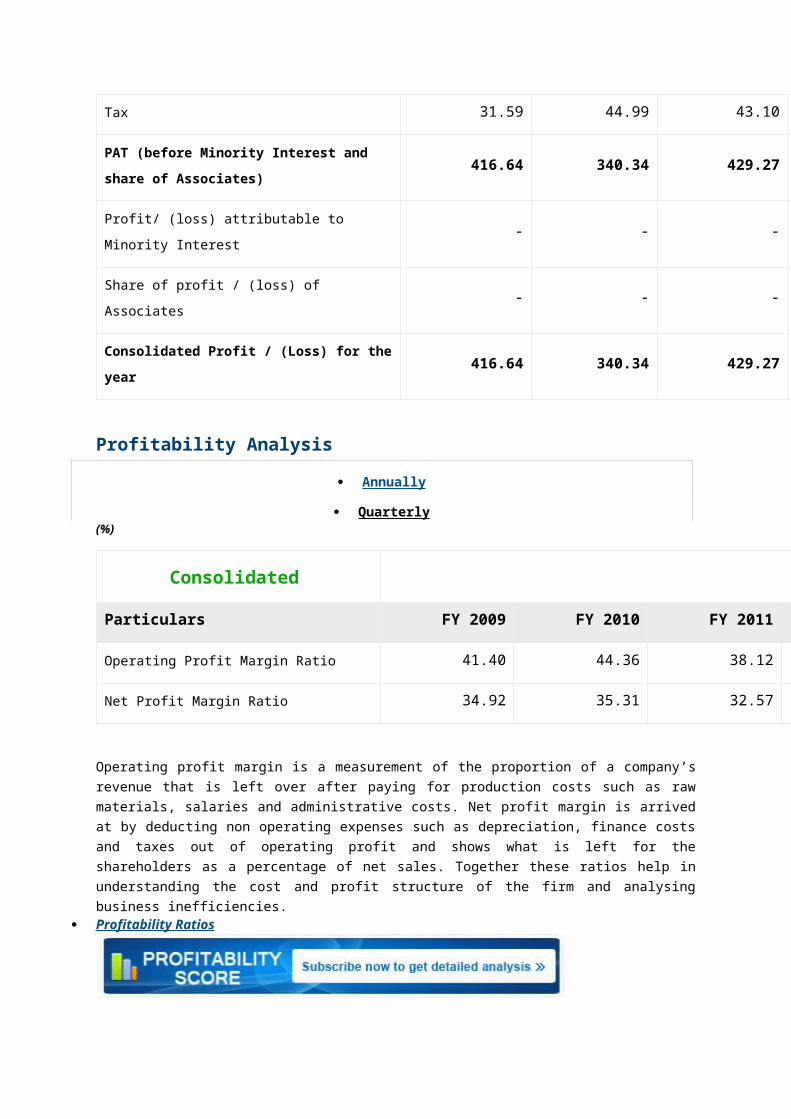
Tax 31.59 44.99 43.10
PAT (before Minority Interest and share of
Associates)416.64 340.34 429.27
Profit/ (loss) attributable to Minority Interest - - -
Share of profit / (loss) of Associates - - -
Consolidated Profit / (Loss) for the year 416.64 340.34 429.27
Profitability Analysis
Annually
Page 22
Quarterly (%)
Consolidated
Particulars FY 2009 FY 2010 FY 2011
Operating Profit Margin Ratio 41.40 44.36 38.12
Net Profit Margin Ratio 34.92 35.31 32.57
Operating profit margin is a measurement of the proportion of a company’s revenue that is left over
after paying for production costs such as raw materials, salaries and administrative costs. Net profit
margin is arrived at by deducting non operating expenses such as depreciation, finance costs and
taxes out of operating profit and shows what is left for the shareholders as a percentage of net sales.
Together these ratios help in understanding the cost and profit structure of the firm and analysing
business inefficiencies. Profitability Ratios
Key Balance Sheet Figures(Rs. Cr)
Sources of Funds / Liabilities
Particulars FY 2009 FY 2010 FY 2011
Share Capital 12.95 26.43 26.52
Reserves & Surplus 1,228.43 1,491.38 1,770.96
Net worth (shareholders funds) 1,241.38 1,517.80 1,797.48
Long term borrowings 52.64 32.85 4.92
Current liabilities 211.01 260.79 409.90
Other long term liabilities and provisions - - 12.43
Deferred Tax Liabilities 43.22 47.41 50.04
Page 23
Total Liabilities 1,548.25 1,858.85 2,274.78
(Rs. Cr)
Application of Funds / Assets
Particulars FY 2009 FY 2010 FY 2011
Fixed Assets 609.37 613.59 694.27
Noncurrent Investments 171.80 441.28
Current assets 767.08 803.99 1,540.71
Long term advances and other noncurrent assets - - 39.80
Total assets 1,548.25 1,858.85 2,274.78
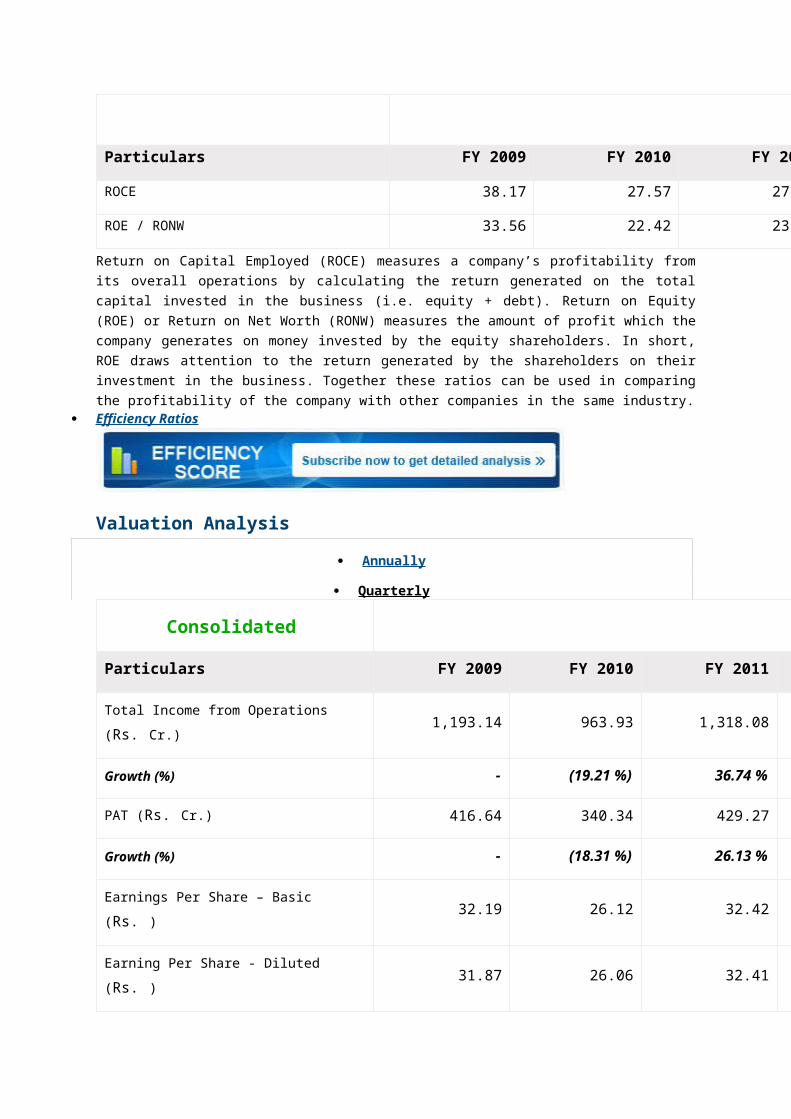
Efficiency Analysis(%)
Particulars FY 2009 FY 2010 FY 2011
ROCE 38.17 27.57 27.88
ROE / RONW 33.56 22.42 23.88
Return on Capital Employed (ROCE) measures a company’s profitability from its overall operations by
calculating the return generated on the total capital invested in the business (i.e. equity + debt).
Return on Equity (ROE) or Return on Net Worth (RONW) measures the amount of profit which the
company generates on money invested by the equity shareholders. In short, ROE draws attention to
the return generated by the shareholders on their investment in the business. Together these ratios
can be used in comparing the profitability of the company with other companies in the same industry. Efficiency Ratios
Valuation Analysis
Annually
Quarterly
Consolidated
Particulars FY 2009 FY 2010 FY 2011
Page 24
Total Income from Operations (Rs. Cr.) 1,193.14 963.93 1,318.08
Growth (%) - (19.21 %) 36.74 %
PAT (Rs. Cr.) 416.64 340.34 429.27
Growth (%) - (18.31 %) 26.13 %
Earnings Per Share – Basic (Rs. ) 32.19 26.12 32.42
Earning Per Share - Diluted (Rs. ) 31.87 26.06 32.41
Price to Earnings 14.96 26.06 20.85
Price Earnings Ratio
Dividend History
Year Rate of dividend (of face value) Rs.
FY 2008 200 % 4.00
FY 2009 300 % 6.00
FY 2010 300 % 6.00
FY 2011 500 % 10.00
FY 2012 650 % 13.00
FY 2013 750 % 15.00
FY 2014 1,000 % 20.00
* Closing Price as on the date of declaration of final (or last) dividend for the Financial Year.
The Company has maintained an average dividend yield of 0.98 % over the last 5 financial years.
Liquidity and Credit Analysis
Current Ratio
Higher current ratio implies healthier short term liquidity comfort level. A current ratio below 1
indicates that the company may not be able to meet its obligations in the short run. However, it is not
always a matter of worry if this ratio temporarily falls below 1 as many times companies squeeze out
Page 25
short term cash sources to achieve a capital intensive plan with a longer term outlook. DIVISLAB’s
average current ratio over the last 5 financial years has been 3.50 times which indicates that the
Company is comfortably placed to pay for its short term obligations.
Long Term Debt to Equity Ratio
Companies operating with high debt to equity on their balance sheets are vulnerable to economic
cycles. In times of slowdown in economy, companies with high levels of debt find it increasingly
difficult to service the interest on their borrowings as profit margins decline. We believe that long term
debt to equity ratio higher than 0.6 - 0.8 could affect the business of a company and its results of
operations.
DIVISLAB’s average long term debt to equity ratio over the last 5 financial years has been 0.001 times
which indicates that the Company operates with negligible level of debt and is placed well to withstand
economic slowdowns.
Interest Coverage ratio
Interest coverage ratio indicates the comfort with which the company may be able to service the
interest expense (i.e. finance charges) on its outstanding debt. Higher interest coverage ratio
indicates that the company can easily meet the interest expense pertaining to its debt obligations. In
our view, interest coverage ratio of below 1.5 should raise doubts about the company's ability to meet
the expenses on its borrowings. Interest coverage ratio below 1 indicates that the company is just not
generating enough to service its debt obligations.
DIVISLAB’s average interest coverage ratio over the last 5 financial years has been 397.98 times
which indicates that the Company can meet its debt obligations without any difficulty.
Page 26
Company Name: Alembic Pharmaceuticals
Head Office: Vadodara , Gujarat ,INDIA
Industry Type: Pharmaceuticals
Founded: 1907
Founder: Mr.Chirayu R. Amin
Key people: Pranav Amin, shaunak amin
Products: Pharmaceutical substances and Intermediates
Page 27
Fundamental Analysis
Company:Alembic Pharmaceuticals Particular 2014 2013 2012 2011 2010 CAGRFace Value 2 Current Market Price 679 Net Sales 2,056.12 1,863.22 1,520.35 1,466.39 1,192.35 14.59%PAT 282.72 235.51 165.25 130.13 85.39 34.89% Equity 37.7 37.7 37.7 37.7 37.7 Reserves & Surplues 846.94 637.87 465.24 357.3 259.03 Net Worth/ Sh.Funds 884.64 675.57 502.94 395 296.73 Debt 238.5 77.65 140.64 234.32 327.9 RoE/RoNW= PAT/NW 31.96% 34.86% 32.86% 32.94% 28.78% Debt:Equity 0.269601 0.11494 0.279636 0.593215 1.105045 Market Capitalisation 14,347.95
About the CompanyEstablished in 1907, Alembic Pharmaceuticals Limited ("Alembic" or the "Company") is one of the
leading pharmaceutical company in India. The Company develops, manufactures and markets
pharmaceutical products, pharmaceutical substances and Intermediates. Alembic is the market leader
in the segment of anti-infective drugs in India.
The Company's manufacturing facilities are located in Vadodara and Baddi in Himachal Pradesh. The
plant at Vadodara has the largest fermentation capacity in India. The Panelav facility houses the API
and formulation manufacturing (both US FDA approved) plants. The plant at Baddi, Himachal Pradesh
manufactures formulations for the domestic and non-regulated export market.
* The Equity Research Report presented below is based on a Fundamental Analysis of Alembic
Pharmaceuticals Limited.
Latest Shareholding Pattern
Key Financial Figures
Annually
Quarterly
(Rs. Cr)
Page 28
Consolidated
Particulars FY 2011 FY 2012 FY 2013
Total Income from Operations 1,202.04 1,466.39 1,519.34
Expenses 1,041.79 1,245.98 1,267.38
Earnings Before Other Income, Interest, Tax and
Depreciation (Operating Profit)160.25 220.41 251.96
Depreciation 29.59 33.65 34.97
Finance Costs 23.89 26.21 14.57
Other income 0.08 0.44 3.93
PBT 106.85 160.99 206.35
Tax 21.46 30.85 41.10
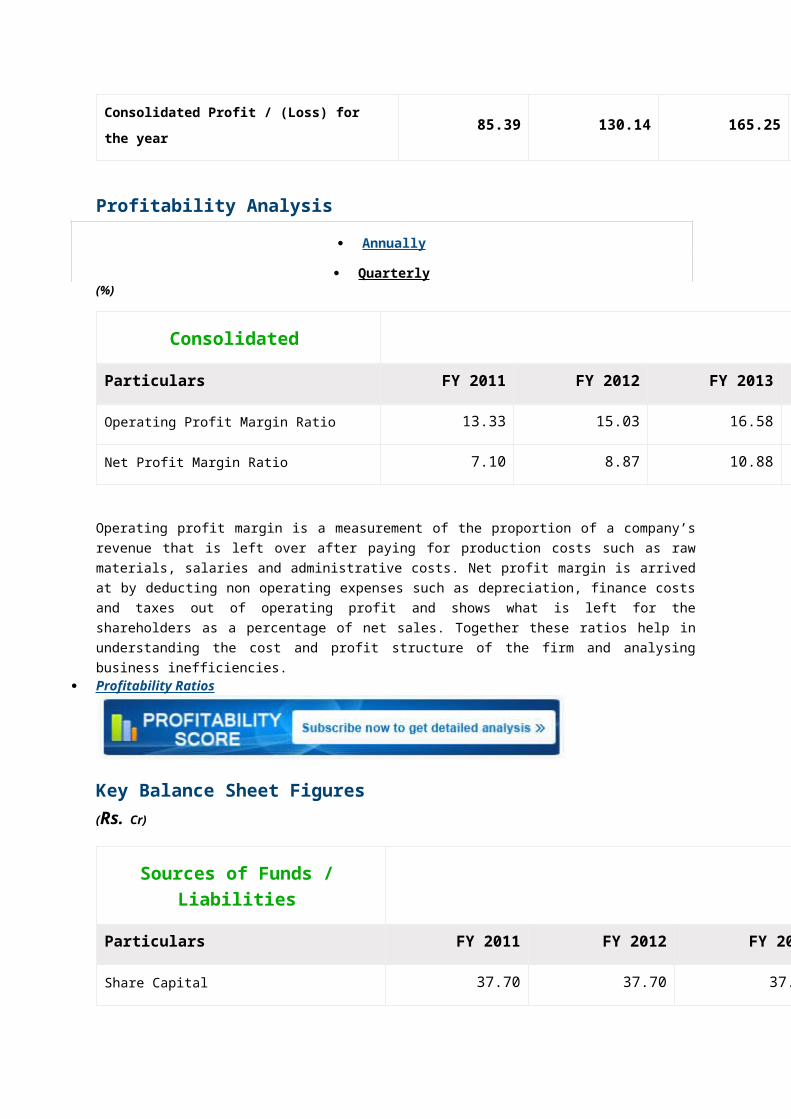
PAT (before Minority Interest and share of
Associates)85.39 130.14 165.25
Share of profit / (loss) of Associates - - -
Consolidated Profit / (Loss) for the year 85.39 130.14 165.25
Profitability Analysis
Annually
Quarterly (%)
Consolidated
Particulars FY 2011 FY 2012 FY 2013
Operating Profit Margin Ratio 13.33 15.03 16.58
Net Profit Margin Ratio 7.10 8.87 10.88
Page 29
Operating profit margin is a measurement of the proportion of a company’s revenue that is left over
after paying for production costs such as raw materials, salaries and administrative costs. Net profit
margin is arrived at by deducting non operating expenses such as depreciation, finance costs and
taxes out of operating profit and shows what is left for the shareholders as a percentage of net sales.
Together these ratios help in understanding the cost and profit structure of the firm and analysing
business inefficiencies. Profitability Ratios
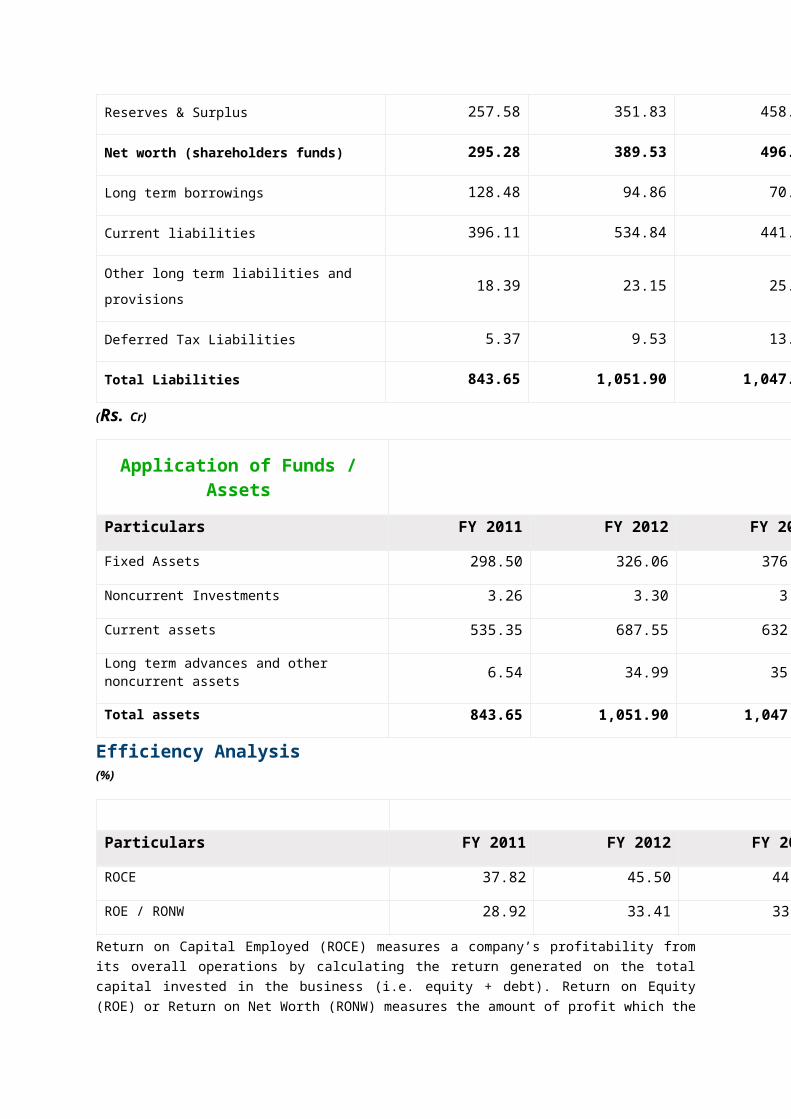
Key Balance Sheet Figures(Rs. Cr)
Sources of Funds / Liabilities
Particulars FY 2011 FY 2012 FY 2013
Share Capital 37.70 37.70 37.70
Reserves & Surplus 257.58 351.83 458.54
Net worth (shareholders funds) 295.28 389.53 496.25
Long term borrowings 128.48 94.86 70.53
Current liabilities 396.11 534.84 441.63
Other long term liabilities and provisions 18.39 23.15 25.52
Deferred Tax Liabilities 5.37 9.53 13.90
Total Liabilities 843.65 1,051.90 1,047.82
(Rs. Cr)
Application of Funds / Assets
Particulars FY 2011 FY 2012 FY 2013
Fixed Assets 298.50 326.06 376.48
Noncurrent Investments 3.26 3.30 3.30
Current assets 535.35 687.55 632.16
Page 30
Long term advances and other noncurrent assets 6.54 34.99 35.88
Total assets 843.65 1,051.90 1,047.82
Efficiency Analysis(%)
Particulars FY 2011 FY 2012 FY 2013
ROCE 37.82 45.50 44.45
ROE / RONW 28.92 33.41 33.30
Return on Capital Employed (ROCE) measures a company’s profitability from its overall operations by
calculating the return generated on the total capital invested in the business (i.e. equity + debt).
Return on Equity (ROE) or Return on Net Worth (RONW) measures the amount of profit which the
company generates on money invested by the equity shareholders. In short, ROE draws attention to
the return generated by the shareholders on their investment in the business. Together these ratios
can be used in comparing the profitability of the company with other companies in the same industry. Efficiency Ratios
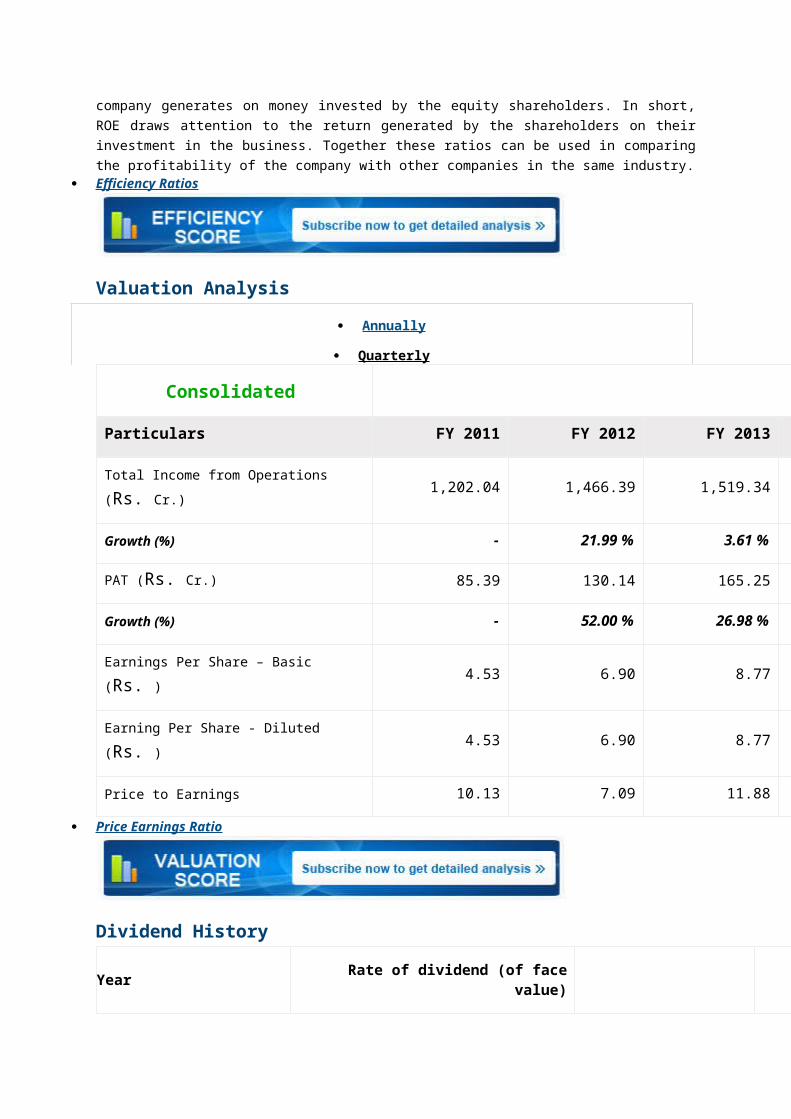
Valuation Analysis
Annually
Quarterly
Consolidated
Particulars FY 2011 FY 2012 FY 2013
Total Income from Operations (Rs. Cr.) 1,202.04 1,466.39 1,519.34
Growth (%) - 21.99 % 3.61 %
PAT (Rs. Cr.) 85.39 130.14 165.25
Growth (%) - 52.00 % 26.98 %
Earnings Per Share – Basic (Rs. ) 4.53 6.90 8.77
Earning Per Share - Diluted (Rs. ) 4.53 6.90 8.77
Price to Earnings 10.13 7.09 11.88
Page 31
Price Earnings Ratio
Dividend History
Year Rate of dividend (of face value) Rs.
FY 2012 70 % 2.00
FY 2013 125 % 2.00
FY 2014 150 % 2.00
* Closing Price as on the date of declaration of final (or last) dividend for the Financial Year.
The Company has maintained an average dividend yield of 2.00 % over the last 3 financial years.
Liquidity and Credit Analysis
Current Ratio
Higher current ratio implies healthier short term liquidity comfort level. A current ratio below 1
indicates that the company may not be able to meet its obligations in the short run. However, it is not
always a matter of worry if this ratio temporarily falls below 1 as many times companies squeeze out
short term cash sources to achieve a capital intensive plan with a longer term outlook.
Alembic's average current ratio over the last 5 financial years has been 1.41 times which indicates
that the Company is comfortably placed to pay for its short term obligations.
Long term Debt to Equity Ratio
Companies operating with high long term debt to equity on their balance sheets are vulnerable to
economic cycles. In times of slowdown in economy, companies with high levels of debt find it
increasingly difficult to service the interest on their borrowings as profit margins decline. We believe
that long term debt to equity ratio higher than 0.6 - 0.8 could affect the business of a company and its
results of operations.
Alembic's average long term debt to equity ratio over the last 5 financial years has been 0.18 times
which indicates that the Company operates with close to zero debt and is placed well to withstand
economic slowdowns.
Interest Coverage Ratio
Interest coverage ratio indicates the comfort with which the company may be able to service the
interest expense (i.e. finance charges) on its outstanding debt. Higher interest coverage ratio
Page 32
indicates that the company can easily meet the interest expense pertaining to its debt obligations. In
our view, interest coverage ratio of below 1.5 should raise doubts about the company’s ability to meet
the expenses on its borrowings. Interest coverage ratio below 1 indicates that the company is just not
generating enough to service its debt obligations.
Alembic's average interest coverage ratio over the last 5 financial years has been 59.05 times which
indicates that the Company can meet its debt obligations without any difficulty.