42
Kansas State University 1 NRES Capstone Course Saving Energy by Behavioral Changes By Colton Kester, William James, Steven Gerber

Kansas State University
1 NRES Capstone Course
Saving Energy by Behavioral Changes
By Colton Kester, William James, Steven Gerber

Kansas State University
2 NRES Capstone Course
Introduction
We all know saving money is good. But what about saving energy when it comes to college
campuses? How do you go about making changes to bring about a good amount of savings? You can
always make changes to the infrastructure and the pieces of equipment that become outdated as years go
on. Those things end up costing a lot of money to start and then years later you run into the same
problems updating out of date equipment. So why not make a change in an individual person’s behavior,
a change that helps promote energy savings. Now, if we can get a mass involvement in this type of
change on college campuses it will not only help save energy now, but also promote behavior change to
last.
So how do we go about making these types of changes? First, we want to see how much energy
savings are possible through some behavioral changes. We can do this by looking at experimental
practices other colleges have tried, see what their programs have saved and estimate what a behavior
program will save here at K-State. The next step is to look at what the best practices are in order to start
programs that will create behavior changes and save energy on a campus setting. Finally, we want to look
into ways to put a tangible measurement on the potential savings from the desired behavior changes. We
can look at how other campuses behavioral energy savings programs actually got this measurement and
their results. Reviewing successful changes that have been made at other universities would be a good
place to begin. Another option would be to conduct our own experiment here on campus and observe
those results. This is definitely a different approach to saving energy on a campus setting and there are
some obstacles to overcome, but in the end I think we as a collective can make a difference and save
energy.

Kansas State University
3 NRES Capstone Course
Research Review
Question 1: How much energy can we save from behavioral efforts on
campus?
The goal of question one is to find what the potential energy savings are through the creation of
behavioral changes on a campus setting. In order to do that we researched how much energy is being
used by certain appliances that are found in different campus buildings. This chart from Tulane
University (“Energy Star Chart” 2013) does a great job of breaking down the appliances that are in some
dorm rooms. There are two categories of appliances, Energy Star appliances and non-energy star
appliances. They showed the number of hours ran, how much energy is consumed by each appliance in
kilowatts and then found the cost of using those appliances in dollars per kilowatt-hour. They also
showed what it would cost in a year, which was based on 9-month average and 3600 students. As you
can see, by using energy star appliances it only cost about 70,000 dollars vs. 131,000 dollars for the non-
energy appliances
The results show that nearly fifty percent savings are possible by simply being consumer

Kansas State University
4 NRES Capstone Course
conscious. If we can get students to either limit their usage of these appliances or switch to energy star
appliances, it would help the university save money. The fact that these kinds of savings are possible by
switching appliances puts emphasis on creating individual awareness.
So what things can be done to help us save money? There was another article (‘Energy
conservation initiative draft report’2008) from the St Mary’s college of Maryland. They looked at a
couple of behavioral ideas that are based off simple training programs. One path they chose was looking
into bad behaviors we do like not turning off lights, taking too long of showers, turning off our power
bars and habits of that nature. They discuss putting in an incentivized training program that would be in
collaboration with the psychology department. They estimated the operational costs to be about 400
dollars a year. The authors hypothesized that if they could get at least 10 percent of students to take
shorter showers potential savings could be $6,600 a year. Changing the electricity-based energy wasting
behaviors, like turning off lights and power bars, could save at least 2400 KWh which turns into only
saving $264 a year, also at 10% participation. As you can see, that is only 10% of students. If we could
make these types of training programs mandatory, or simply include them into freshman orientation,
participation rates would be directly affected. After practicing this for a number of years in succession the
savings would only increase.
Another area they looked into was changing student’s washing machine habits. They estimated it would cost $2000 dollars to set up a program and they would end up saving $11485 dollars a year, so after a couple years we would be seeing savings. They put the dryers into consideration as well. If they could get students to use clotheslines instead of dryers it would cost about $1000 dollars to initiate and it would actually end up saving about $4,400 dollars a year. This is how they got the estimate
Cost:
10 clothesline at $100 each = $1,000
Annual Resource Saving
: 15% x 48 electric dryers (3,400 W) used 6 hours a day x 270 days = 39,658 KWh
Annual cost saving

Kansas State University
5 NRES Capstone Course
: 39,658 KWh x $0.11/KWh = $4,362 (“Energy conservation initiative draft report”,p33)
We can see that there is some research into the best ways to save energy by trying behavioral
changes instead of infrastructure changes that can be costly.
Another approach to savings was real time visual feedback with an incentive reward system. One
study, Dormitory residents reduce electricity consumption when exposed to real-time visual feedback and
incentives, found that they were able to save about 69,000 kWh, which came out to be about $5,200
dollars in saving.

Kansas State University
6 NRES Capstone Course
Question 2: What are some good practices to encourage behavior
changes for energy savings in a campus setting?
The majority of research done in the past on the subject of changing social behaviors to be more
environmentally sustainable has shown that education, availability of environmentally friendly options,
perceived effectiveness of those options, and motivational incentives are key drivers in leading to a
desirable behavior change. Economic incentives and reassurance that one’s actions are making an impact
are two important motivational factors. One of the studies we reviewed, Environmental knowledge and
other variables affecting pro-environmental [behavior]: comparison of university students from emerging
and advanced countries (Vicente-Molina et al., 2013) surveyed university students from one school in
four countries. Two developed countries and two developing countries were selected (USA, Mexico,
Spain, Brazil). It found that most of the independent variables stated later were significant to at least one
of the countries. They were significant in that they had a positive effect on pro-environmental behavior.
The indicators of pro-environmental behavior were recycling, public transit use, and green purchasing.
”Spanish students stand out for their recycling behavior, Mexican and Spanish students show a greater
tendency to use public transport and USA students show far higher buying behavior than any of the others
but are the least likely to use public transport. These patterns are probably due to the different cultural
habits and structures that exist in each country.”(Vicent-Molina at al., 2013)The independent variables
listed in this study were; attitudes, motivations, gender, academic discipline and number of environment-
related subjects studied, informal education, and country-specific factors such as access to environmental
structures and cultural differences. Also, pre and post survey environmental knowledge was measured and
collected. The variables that were found to be significant were; pre-survey knowledge and post-survey
knowledge, formal education, motivation, PCE, and gender. The most significant variables to all countries
were pre- and post-survey environmental knowledge, motivation, and Perceived Consumer Effectiveness.

Kansas State University
7 NRES Capstone Course
Since education is an apparent key variable in boosting ecological behavior, decisions need to be
made on when people should be taught environmentally positive behavior. One study we reviewed
showed that teaching young kids about human interactions with the environment and conserving its
natural systems is very important to ensuring that the youth hold to their ecological values into the future
(Spearman & Eckhoff 2012).
Another study shows that geographical location and size also play a roll. Town populations of
50,000 – 100,000 had higher environmental attitudes (Torgler & Garcia-Valinas 2006). Town sizes both
larger and smaller had lower environmental attitudes. The authors hypothesized that smaller communities
may not have enough funding or organizational power to start initiatives and the larger cities may be hard
to motivate as a whole due to a more diverse population with different values. This study also noted that
regional social and cultural differences play into effect, therefor, the authors supposed decentralization of
policies would be more sufficient. Different regions require different needs, especially in a country the
size of the United States. With the many different climates, terrains, and political attitudes of the U.S.
decentralization of environmental policies is needed to have success. One model we found, The Corporate
Sustainability Model, developed by Marc J. Epstein breaks down how different inputs into various
aspects of a corporate system, with leadership being a central element, will create desired outputs. It
should be noted that the authors put heavy emphasis on the leadership factor and how much it plays into
causing an outcome (Epstein & Buhovac 2010).
BJ Fogg’s Behavior Model (Fogg, B.J.) clearly demonstrates the importance of applicable
motivators and triggers when trying to create a desired behavior change and how these variables function
together. Motivation is one of the axes of Fogg’s model. Some people will have personal motivators and
goals in place to assist in accomplishing a certain task. Others will need incentive-based motivators.
Reward based system are usually effective, but when trying to change environmental behaviors, the
positive environmental impacts obtained from the behavior change should be tied into the incentive so the
individual doesn’t get reliant on be handed a reward. Fogg states that the motivation variable can be

Kansas State University
8 NRES Capstone Course
broken down into three different types; Pleasure/Pain, Hope/Fear, and Social Acceptance/Rejection. The
other axis on the model is ability. If someone doesn’t have the tools at hand to fix a problem then we
cannot expect anything to become better. So if we want to create a particular behavior change we have to
be sure that most people can participate by considering all limitations (physical, time, money, social
deviance, non-routine, brain cycles) that may prevent someone from participating in an activity and
creating easy access to alternatives. The most important variable of the model is the trigger. Without a
trigger no action will happen and no change will be made. Fogg also breaks this variable down into three
other components or possibilities; facilitator, signal, and spark. The trigger can be anything thing from a
sudden realization of what needs to be done, or it could be the construction of an alternative, less
impacting way of doing things.
Question 2: How would we develop a highly effective campus-wide
behavioral energy initiative?
The second part of our research question is, how do we get the behavior changes needed in order
to increase sustainability at KSU? First Kansas State must define sustainability. Sustainability can be
described in three ways, practiced in three areas; environmental, social, and economic. Some people like
to separate the three into a Venn diagram insisting that each system can operate on its own, but we know
that to be false. The economy cannot exist without society just like society cannot exist without a
providing environment. Therefore, when thinking about sustainability and designing a master plan, all
three realms must be considered in order to be effective. Moganadas et al. compiled definitions on
campus sustainability from various sources to build his own comprehensive definition of systemic
campus sustainability:
“The capacity of an academic institution to explicitly recognize the responsibilities, advocate
participation and integrate the functions of all its human resources, students, activities, processes

Kansas State University
9 NRES Capstone Course
and stakeholders toward conserving and regenerating natural, human, social, manufactured and
financial capitals for a continuous future.” (Moganadas et al.)
After a specific idea of what sustainability means to K-State is created, we can then figure out
how we want to get the student body and faculty to participate. Administration needs to know what
aspects of K-State life and what behaviors need/can be changed in order to increase sustainability. For
that, University leaders need to find out where the largest energy sinks are and what costs will it take to
reduce or eliminate the waste. These areas of losses will vary from campus to campus. The issues can be
related to infrastructure efficiency or lifestyle and educational accommodations. Our area of focus was
mostly on personal energy consumption reduction and what variables may limit someone from reducing
his or her impact.
Human behavior has long been a topic of great interest to social researchers. Behavior change has
become an area of greater interest in recent decades. Recently, the Fogg Behavioral Model has been
receiving much attention for its accurate breakdown of what correlating factors cause behavior change. It
was developed by B.J. Fogg of Stanford University. Fogg’s Behavior Model (FBM) has three components
that must exist when behavior change is a goal; motivation, ability, and trigger. (Fogg, B.J.)
Below is figure (1) representing Fogg’s Behavior Model (Fogg, B.J.) and the key elements of
each axis:

Kansas State University
10 NRES Capstone Course
Motivation and ability are the two axes of the model. In Figure (1), motivation is the vertical axis.
Fogg describes the motivation axis as having three type of elements that can create a higher values;
pleasure/pain, hope/fear, and social acceptance/rejection.
An example of a pleasure/pain response would be people who enjoy the outdoors and have a
natural obligation of preserving and restoring its beauty, for them the work is enjoyable. Some people are
concerned with future generations of the planet, their well-being, and the disheartening statistics that lead
to cynical, doomsday perspectives. This dark perspective would be a pain response. Some communities
have programs and initiatives to promote sustainable behavior. Just a few types of incentives include
reduced costs on alternative energy sources, providing alternative fuel stations, free recycling, and public
transit options. But on the other end of the spectrum, some communities put additional costs and fees on
installing solar panels on homes, which repels green consumers and more business in this sector. Political
and cultural atmospheres of a particular place can push someone away from sustainability for fear of
social rejection. These communal differences are the types of social acceptance and rejection elements

Kansas State University
11 NRES Capstone Course
that Fogg describes. These examples also show how regional differences can play into effect (Torgler &
Garcia-Volinas, 2006). The social acceptance and rejection elements of the motivation axis are somewhat
interchangeable with the social deviance element of simplicity discussed later.
The horizontal axis represents ability and how capable a person is at performing a target behavior.
The conceptual scale of this axis works in the same manner as the motivation axis. In figure 1, ability
increases to the right and decreases towards the left. Suppose a target behavior is to get all professors to
turn off their lights every time they leave their room. Every teacher has the ability to flip a switch, so
ability is very high. But if a target behavior were as challenging as getting students and faculty to ride a
bike to campus every day, then ability would rank low. Some people may not have, or be able to afford, a
bicycle. Others may have physical limitations keeping them from participating.
According to Moganadas et al.’s definition of systemic campus sustainability, it is the institutions
responsibilities to recognize the issues, advocate participation, and use its resources in a proper manner.
Therefore, if systemic sustainability is a goal for KSU, then leading by example is the best path to take. In
the Corporate Sustainability Model developed by Epstein and Buhovoc, leadership is the driving force
behind all success. “At the core of the model is the leadership function. The role of committed leadership
can never be overstated. Management commitment to sustainability as a core value, and management
recognition that sustainability can create financial value for the organization through enhanced revenues
and/or lower costs are critically important.” (Epstein & Buhovoc. 2010. pg 4 ) Below is Epstein’s
Corporate Sustainability Model

Kansas State University
12 NRES Capstone Course
In their description of the model, they state that financial revenues and lowered costs are the
motivation for sustainability in the Corporate Model. Social and environmental welfare are not considered
to be as important in this model, but that is to little surprise.
The third, and required, factor in creating a desired behavior change is the trigger. When KSU
leads the way increasing social awareness of sustainability issues, they are acting as the facilitator and
creating the spark required. Even if the only innovation made at K-State is an energy saving initiative,
then they would be providing a signal that will hopefully motivate others to change their behaviors. A key
factor in increasing motivation is relating the subject material to the observer. There are triggers that exist
that cannot be facilitated by just administration. Pro-environmental behavior should be encouraged
through social acceptance, as well as negative environmental behavior being rejected and reversed. Those
who deviate from positive environmental behavior should not be out-casted and given up on, the FBM is
effective on different time scales. The triggers of other significant variables, like Perceived Consumer
Effectiveness, can be dependent upon the manufacturers that sell the product. But also, increased

Kansas State University
13 NRES Capstone Course
education can give a person the proper knowledge to know which products are better for the environment
and why.
If students and faculty do not have access to alternative means of consumption and production
then ability ranks very low. “In general, persuasive design succeeds faster when we focus on making the
behavior simpler instead of trying to pile motivation.” (Fogg, B.J. pg. 6) In the description of the ability
axis of his model, Fogg lists six ‘elements of simplicity’; Time, Money, Physical Ability, Brain Cycles,
Social Deviance, and Non-Routine.
Most of the elements are easy to understand. Brain cycles, social deviance and non-routine,
however, may need some more description. When Fogg mentions brain cycles, he’s referring to the
simplicity of concentrating on the task at hand. People tend to think in different patterns. If a task requires
new or deep thought it becomes hard to accomplish. This decrease in simplicity leads to losses in
participation. In the study by Vicente-Molina at al., gender was found to be a significant social deterrent
from sustainable behavior. (Vicente-Molina et al. 2013) This phenomenon can fall under either the social
deviance element of simplicity, or the rejection/acceptance variable of motivation in Fogg’s Model.
(Fogg, B.J.) Ecological behavior is usually perceived as positive but in recent years it has irrationally
been feminized. One possible result from this is males begin to commit environmental degradation to
show their masculinity.
Further research will be needed to find the root of the feminizing action against ecology, but
feminization is not the only variation of segregation that occurs. The back-to-the-land movements and
commune living of the sixty’s hippy culture created a negative stigmatism against sustainable/simple
living. In a Midwestern state conservative, right-wing ideologies are more popular. The political
atmosphere in the United States creates lots of animosity and a division between the parties. This leads to
conservative right-wings being led away from the conservative practices of the leftists for fear of being
socially rejected from their political affiliation. Fogg’s Behavior Model states social acceptance and

Kansas State University
14 NRES Capstone Course
rejection as key motivators for creating behavior change. (Fogg, B.J.) Changing the language of
sustainable behavior is one possible method of mitigating this development.
Changing language is an issue that has grown with the popularity of this science. Many people
perceive sustainable development as an oxymoron. How can something be sustained and developed at the
same time? The concept of sustainable development can be better understood through expanding
education. But for some people ignorance and stubbornness is what is holding them back from making the
transition to sustainable behavior. Improved communication can fall under the social elements of
motivation and ability elements of Fogg’s Model. Making strides in changing the language will make us
more capable of relating the relevant information between different demographics. This will lead to more
group inclusion, participation, and eventually to core altruistic values.
An example of a non-routine element would be implementing break rooms on each floor of a
building, or a couple wings per floor, as well as restricting personal electric appliances. This would cause
some disorientation and civil unrest for a little while, but eventually people would get acclimated. People
do not like being told what to do, in any circumstance. So introducing different lifestyle changes in
increments cannot be stressed enough. Adaptability is a key element of survival for any species. If we are
unable to adapt to small lifestyle changes like walking down the hall to get coffee instead of on your own
desk, then our future is bleak in terms of sustainability and therefor, our existence.
A factor that would limit ability for the hypothetical scenario of 50% bike traffic described
previously would be the restrictive infrastructure. K-State’s campus currently could not support that much
bicycle traffic. It has been observed in society time and again that the construction of freeways and more
roads on the grounds of reducing traffic congestion in fact induces more traffic. (Litman, T. 2014.) We
believe that this would work in other areas of consumption as well. Putting caps on the amount of road
construction could work similarly in office or dorm settings. Putting caps on the amount of electronic
devices aloud in a room. We understand that this may be an unattractive option to some. Generally,
Kansas State University
15 NRES Capstone Course
people don’t like having reduced choices. Brain cycles and non-routine elements of simplicity under
Fogg’s Behavior Model explain how this concept translates. But bad habits are broken best by creating
new ones. Transitioning to alternative lifestyles, or behaviors, is easier the more available they are.
Perceived Consumer Effectiveness (PCE) was a variable used to measure how effective a person
feels with their daily purchasing decision in a multi-dimensional survey. (Vicente-Molina et al. 2013) If a
consumer senses that their purchasing impacts are minimal then they will choose cheaper, more
convenient options, but at what long term price? PCE is an interesting and important variable in this
research. One reason for its importance is because enhanced education could drastically improve PCE.
The correlation between the two is very strong. Purchasing power is said to be one of the greatest
strengths an individual can possess in influencing market trends. Combining PCE with increased
awareness of environmental issues, especially with a mentality of, ‘What can I do to help?’ will be a
direct feedback to their personal perception of their decisions.
Direct feedback is becoming a popular trend in boosting ecological behavior. Carbon Footprint
Calculators have been a tool of growing popularity in recent years, especially in the digital age. These
calculators give us a generalized, or detailed, feedback of our consumption. It is to be interpreted as; ‘If
everyone on Earth lived as I do, how many earths would it take to keep our survival going?’ This kind of
information system is motivational in that it encourages a hope/fear response. Again, more information
(education) is received and ability increases as well.
Providing feedback on the results of our decisions is being seen as an effective method of
changing behaviors. Direct feedback systems have been put into practice in some places in order to
measure a building, a room, or an individual’s effectiveness in reducing energy consumption. The
feedback systems are usually screens mounted onto a wall that display trends in consumption over a given
period of time. Some systems give a real-time feedback, others are over longer intervals. In the Oberlin
College of Ohio study they saw a direct reduction in energy consumed after installing the feedback
Kansas State University
16 NRES Capstone Course
systems. (Emeakaroha et al. 2007) The direct feedback systems can also be correlated with improving
Perceived Consume Effectiveness. Again, K-State would be the facilitator trigger, but by providing a
signal/spark trigger to each building, or individual. The smart sensor and monitor system would be
expensive to implement, especially if it was done quickly and on a large scale, but it would improve
almost every other element of simplicity. If competitions were held and incentives were produced after
the installation people would become interested in reduction and it could become routine to conserve.
Part of our research method was conducting a survey of a campus building. When surveyed
Throckmorton Hall we found that over 30% of the offices had their own coffee machines, and over 15%
have their own mini-fridges. There is at least one break area on each floor already and some of these areas
contain a microwave and/or a coffee machine. By making the break areas more appealing through
comfort, simplicity, and through ease of access it would reduce the number of appliances used in personal
office spaces. This practice would work the same for office appliances, such as printers, copiers, and
phones.
We were able to talk to a few of the occupants of the office spaces. There were a few reoccurring
comments. Office phones were said to be used very rarely. Most people said they used e-mail or their cell
phones. Though office phones require little amounts of energy to operate, they are being used less and
less. Since the office phone is becoming obsolete, removing them could be a consideration. Another issue
was inconsistent heating during the winter that leads people to bring his or her own space heaters to work.
Some people said repairs were made and they no longer used the space heater. Space heaters are very
inefficient at performing their job, so any way of reducing the number of them on campus is encouraged.
Inefficiencies in infrastructure are expensive to update and repair, this is well understood. But the long
terms savings and impact reductions help pay off the installments and make us feel better about ourselves.
We must remember, short-term economic gains are not the most important result we want from
sustainability. Value cannot be placed solely on how much money is being saved, but the fact that
something is being saved should motivate us. In Moganadas et al.’s definition of systemic campus

Kansas State University
17 NRES Capstone Course
sustainability, and through the rest of his article, he stresses the responsibilities that the educational
institution carries. Institutions and corporations are the power players in today’s society and if effective
leadership positions are assumed, they should come from these sectors. A university is obligated to its
student body to effectively prepare them for their futures. This is done by integrating all resources to
creating, conserving, and regenerating social, financial, and environmental capital. A goal of any
University is to increase enrollment and appeal. If K-State steps its leadership up to become an innovator
in the area of sustainability, it can be hypothesized that the student body, the fan base, and the region
would follow in example. Educational institutions house the brightest minds and ideas of the future and it
is their responsibility to advocate the participation all of this potential in order to conserve our future.
Just like any other issue of social equity and human behavior, focusing education towards
making the right decisions is a strong variable. The K-State 8 Curriculum is already a progressive
approach to ensuring a well-rounded education. Social and natural sciences are already included in the
curriculum, but with the results of our research we feel that implementing sustainability science and
practice directly into all eight of the curricula, it would only benefit the student’s knowledge base. After
all, “it should be kept in mind that university students are the consumers, researchers and entrepreneurs of
the future, and if future talent is able to make decisions that are beneficial to the environment, society is
more likely to make progress along the path towards sustainability. In this sense, the level of
environmental knowledge and the role of environmental education in changing and addressing lifestyles
and attitudes could be crucial in altering individuals' behavior and in turning society towards
sustainability.” (Vicente-Molina et al. 2013. last paragraph) By educating people in the classroom about
the right decisions, it is making their ability much higher by reducing brain cycles. If the knowledge is on
the front of their mind an individual will not have to think as hard about what is right. This reduction in
complex thought also saves time. By creating more environmental classes and increasing participation
from each student, it pushes sustainability into the realm of a social norm. Imagine the improvement that
could be made if everyone made his or her decisions based around sustainability.
Kansas State University
18 NRES Capstone Course
Without a doubt changing Kansas State University’s curriculum would be one of the biggest and
more challenging alterations to increase pro-environmental behavior. Thus, other forms of educating the
campus population must exist.
Recently a promotional event called Recycle mania took place on campus. At the end of the
eighth week KSU was in 138th place out of 256 other campuses. (ksu.edu 2014) This is in the lower 50%!
This shows that we have a lot of room for improvement. There are other incentive-based promotional
methods that can be tried. For instance, we mentioned how competitions could be held with the monitor
feedback systems. Promotional events for zero-emission transportation for a week, or for voluntary
simple living practices could boost awareness of the environmental issues. Also, these types of
promotional events can help people adjust to different lifestyles and change their daily routines,
improving a person’s ability.
There are smaller initiatives that can be started across campus to make incremental steps towards
sustainability. For instance, since infrastructural modifications are expensive, setting a standard of
replacing all electrical appliances with Energy Star or LEED certified products. Agreements could be
made to ensure that campus buildings and affiliated stores sell and consume a certain percentage of
recycled/reusable products and encourage purchasing energy star appliances. Encouraging e-mail and
KSOL use by students and faculty in order to reduce paper consumption would be relatively easy.
Starting initiatives for greener behavior should be a little easier in Manhattan due to our population size.
A study we found stated that city population sizes between 50,000 and 100,000 were in the optimum
range for attaining community involvement. (Torgler & Garcia-Valinas. 2006) Cities larger than 100,000
people typically have more cultural diversity. This makes it harder to centralize ideas and policy and get
them into practice. Town sizes smaller than 50,000 have greater community involvement, but struggle to
get funding to make the changes they need in their community.

Kansas State University
19 NRES Capstone Course
Sustainable development doesn’t come without its problems. Complacency occurs when
sustainable development occurs, the public takes notice, but then feel the responsibility was taken from
them and put somewhere else. Some people interpret the improvements as their job of being a steward is
now complete and they can unwind their behaviors and regress some. This is a bad habit to get into. A
comparative study of multiple Spanish communities showed that there was a reduction in eco-friendly
behavior. “Furthermore, we find big differences between the first half (strong increase of the
environmental attitudes) and the second half of the 90s (strong decrease). A possible reason for regional
differences and the development over time is a higher satisfaction with the environmental policy.”
(Torgler and Garcia-Valinas. 2006)
As Kansas State University pushes to become more sustainable, because it has to happen, there
will be pushbacks. Society must be resilient and adaptive while focusing on the task at hand, education.
Higher education will always be a goal for any university, but by realizing our current societal path and
the vagueness of predicting the future on it, the more tailoring our education to meet these demands is
seen as essential. There is one thing that we can be certain of from our research, improvements can be
made and potentials untapped.
Kansas State University
20 NRES Capstone Course
Question 3: How can/would we measure behavioral energy savings and
be confident that we know how much we saved?
The next step in trying to input an energy saving program campus wide is trying
to figure out how to measure the savings. There are different methods that have been circulating
to help illustrate the savings. Setting up display monitors in key locations of a building so the
students, faculty, or the public can see how their consumption trends would be beneficial in
several ways. One benefit would be that the monitors provide instant, or near-instant, feedback.
Some people may find that the building they are in is using less energy than what they were
expecting. The monitor method might be expensive to install due to the model types that are
available on the market, as well as installation fees. The most expensive models show a more
data and provide instant feedback. Also, we could set up a website that would allow the staff,
students, or even the public to access the online program remotely, even when they are on breaks
or out of country on trips.
The first experiment that we looked into comes from Oberlin College and their
innovative Lewis Center for Environmental Studies, located in Oberlin, Ohio. The purpose of
their study was to look into how different types of feedback could help the students living in the
dorms conserve energy and water resources. They conducted this research through a dormitory
competition and observed what dorms saved the most energy and water sources. To do this study
the researchers looked through three different levels of depth while compiling the data. They
showed the results to the occupants of the dorms according to the three levels of depth. The first

Kansas State University
21 NRES Capstone Course
issue they came across was how to measure water and electricity consumption in each dorm.
“Researchers involved in this study developed a prototype system for metering, processing, and
displaying data on resource use in dormitories.” (Petersen & Shunturov & Janda & Platt &
Weinberger, p20) One main reason for using this prototype is that during the time the study was
being conducted and the data being gathered there was no item that was sold in stores that could
help monitor and display real time feedback on these resources. “With funds obtained through a
People, Prosperity and the Planet (“P3”) grant from the US Environmental Protection Agency, a
prototype wireless data monitoring and display system was developed that enabled easy
observation and interpretation of real-time resources use in two dormitories on the Oberlin
College campus.” (Petersen&Shunturov&Janda&Platt&Weinberger,p21).
The items listed below are what the researchers used to make the sensing and monitoring
prototype that they needed in order to complete the study.
“Off- the-shelf” water and electricity flow sensors;
Newly available and relatively inexpensive wireless data logging and networking
hardware (www.xbow.com); and
Networking, database management and display software custom developed by the
research team” (Petersen&Shunturov&Janda&Platt&Weinbergerp21).
To use this new prototype to the full extent of its abilities they linked the sensors up with
the machine rooms of the two dorms they were monitoring. From there, meter readings were sent
to the researcher’s base station where the data points were plugged into their designed software.
The software then converts the data into a readable and applicable format that the researchers can

Kansas State University
22 NRES Capstone Course
post to the website for private and public use. They can see the variables being played as times-
series graphs. The graphs show the average kilowatts used during a particular time interval.
Someone visiting the building can see how much energy was consumed during the time they
were there. The web site also refreshes the data every 20 seconds and its accessible in three
different ways:
Access to a web site to the students that lived in the dorms
Two temporary kiosks were set up the dorms with real time data on their
electricity use. Also a kiosk in the colleges science center (so they could
run presentations on this studies)
Lastly they made the website publically available on March 10, 2005.
Before they could calculate the savings from each building they had to come up with a
way to calculate each of the buildings unique attributes. “Dormitories were assessed by
comparing percent changes in resources use rather than by comparing absolute or per capita.
Using percent change allowed us to compare changes across building of different vintages,
different construction types, different solar exposure, and with different installed appliances (e.g.
incandescent vs. fluorescents desk lighting” (Petersen & Shunturov & Janda & Platt &
Weinberger, p25)
The changes in the percentages of each building were calculated by the following equation.
Percent reduction = 100 X [(average baseline period rate) – (average competition period rate)]/
(average baseline period rate).

Kansas State University
23 NRES Capstone Course
The savings for each dorm was calculated by taking the difference in average
consumption rates between the two periods by the elapsed time. Here is another example formula
that was given to help us understand how this was done.
KWh= (baseline kW - feedback kW) X (24h X 7 days/week X 2 weeks).
(Petersen&Shunturov&Janda&Platt&Weinberger p 25)
Researchers looked at results after the calculations were completed to see what potential
savings existed. During the calculation process they looked at the weather data from a regional
airport. They figured daylights savings time into the calculations as well. They found out that the
temperature during the baseline readings and after the completion of the experiment only
changed an average of 2 degrees Fahrenheit. Light sensitivity during these longer days was also
considered to see if it affected the outcomes. They found that there was not a major change in
light sensitivity. They concluded that most of the change came from the students that lived in the
dorms. After the competition and the final readings were done they found that the weather and
lights changed greatly. The group decided that the due to the change of the unknowable
condition (weather and light sensors), they decided to focus on the energy changes of the
students. They concluded that most of the change came from the students that lived in the dorms.
The results of the competition of all 18 dorms saw a reduction of the watts during the
competition. During the baseline readings they saw average watts of 367 and during the two-
week competition they saw a reduction of 120 watts form the base line showing a 32 percent

Kansas State University
24 NRES Capstone Course
reduction of grid. They were able to save around 68, 300 kWh by all 18 dorms; most of the watts
that were saved came from the high-resolution dorms that saved up to 55% compared to the other
dorms. They got those findings based on the measurement system they used. In the end the
college was able to calculate the savings to be around $5,368 dollars on the electricity and water
reduction in the dorms.
(Petersen&Shunturov&Janda&Platt&Weinberger,p 26)
If the college was to expand this type of experiment they would have to spend a total of
$250,000 dollars to set up all 25 of their dorms with this technology to show the real time
information on the website. If they were to do this the technology would be paying for the
installation and they would make a profit only after two years. And get the measurement
feedbacks they need
Another study looked at using smart sensors in the U.K. Their proposed system would
work almost like the system above as far as the calculations. The difference though is that they
would have an energy delegate located in each of the dorms they were testing and they would

Kansas State University
25 NRES Capstone Course
promote the behavior change. Below is a figure that shows how the technological factor worked
as well as the behavior factor of this experiment.
(Emeakaroha&Ang&Yan, p 302)
This next figure shows all the major appliances and how much energy they used in a year.

Kansas State University
26 NRES Capstone Course
This table shows the calculation of all the major appliances and how much energy was used during the studies first
year on the campus. (Emeakaroha&Ang&Yan, p 310-311)
At the end of experiment they were able to identify the wasted energy on the campus they
selected. They were able to help set up their plans and experiments on a small scale before
moving on to their full scale.
The next study that we looked at dealt with energy conservation in work and teaching
space at mid-size private college located in the southern United States. They wanted to test out
two different types of feedback systems to see if they were affective on saving energy. The ideas
were to provide feedback and a peer system to see if it would change any people in the study
groups. They started off four months before the intervention and got a baseline reading in a
similar way that the other two experiments did. They also included the past two years of energy

Kansas State University
27 NRES Capstone Course
bills that also took place during the same time period. The participants were also allowed to take
a survey. The surveys were done during the baseline testing and during the final intervention.
These surveys looked at the different ideas of the people taking the survey. They asked people if
they themselves have changed their behaviors to save energy and what they thought of the
program’s goals and the attractiveness of the program.
Their sample size of the buildings included twenty-four buildings on the campus. The
buildings that were selected only had office spaces and no energy-intensive laboratory
environments. They were also not located on the list to get renovated during the time of this
study. Employee numbers were located around an average of 88 people working each of the
building. Each building had a range of 11,571 to 180,258 square feet. The online survey they
would allow people to take part in was sent to around 2056 employees’ emails that were
available through each individual departments mail server.
The results of the program didn’t meet the standards the researchers were hoping for. As
they collected the results they noticed that the average kWh was still a little too high and the
conservation behavior was not really being effective. They went through and looked at the
different variables to see why the experiment failed. They noticed that reading the meters at the
end of the month and not having enough observations really hurt them in the long run. They
stated “Future research should consider collecting more frequent observations, particularly using self-
report data, as well as examining the long-term effects of interventions on energy use behavior in general.
This will allow for a more precise measurement of behavior and may expose more behavioral variance
over time.” (Carrico& Riemer. pg, 11).They also came to the conclusion that the common areas
where they had appliances that everyone could use were not being turned off. So in the end their
Kansas State University
28 NRES Capstone Course
experiment sounded plausible and would work great if it had a few changes like in the
observations and the frequency they read meters.
This next study shows how the researcher is looking at how different size and occupant levels
affect the amount energy used on the campus of Smith College. The administration is looking at how to
cut the footage of the campus and cut the energy bill they are accumulating through building usage. They
were able to figure the number of (kWh) per-hours and (kWh) per week. “For most appliances, we
multiplied the number of appliances owned by the students’ times the number of hours reported by the
students, and then multiplied this number by the number of watts the appliances use and by 7 to get the
weekly watt-hours. We then divided this number by 1000 to calculate kWh per week.” (Steingard, pg.,
5).
**Values reported: 1 lamp with a 60-watt bulb that is on 5 hours per day
(1 lamp)*(5 hrs/day)*(60 W/lamp)*(7 days/week)/(1000 W/kW) = 2.1 kWh/week
After the data was converted to the desired variable they were able to start focusing on the weekly
consumption of each of the participants, total sample weekly consumption, total appliances weekly
consumption, average the appliance weekly consumption, and figure percentage of total weekly
consumption used by each appliance. After all these calculations they started their data analysis of the
occupant levels and per capita energy consumption. They started with a significance level of 0.05, with
these analyses they started to generate linear, quadratic and cubic regressions as well as F-scores and p-
values.
The results showed that the size of the building and the occupant levels are strongly related by the
energy consumption. They also discovered through their multiple analyses that the building location on
the campus might have an effect on the energy consumption. “On average students living in Upper and
Lower Elm will use more energy than their classmates in the Center Campus, Green Street and the Quad.”
(Steingard. pg., 13). During this experiment they decided that this theory might need to be tested on the
fact that they were not able to have control over the locations of these buildings. They were able to come

Kansas State University
29 NRES Capstone Course
to this conclusion through a different study that was previously done. So they challenged the next group
of students to test the theory that location will play a part in how much energy is consumed on campus.
There was also a pattern that formed while they did their studies, the class of students might also have an
effect of the energy consumption.
These studies can show us what we can possibly do on our campus. The first step is
trying to figure out how we will approach the idea of getting the program off the ground and
coming up with good solid measurements. Each of studies used smart sensors that showed real
time data via their web sites that they setup. For us to use the smart sensors we would need to
approach the university for money or try and apply for grants that could help cover some of the
upfront cost of setting the program up.
Pros of these experiments are that they can give us some sort of starting structure for
setting up our own program. The experiments can also be useful by us looking at the studies they
went through and used to start their own study. By doing this we can put together parts of the
experiments they would best fit our campus. They both can also give us ideas on what to look for
while we are hooking up the smart sensors to the meters in the buildings. It might be a better idea
to run a pilot test on a very small part of our campus to see if it will even be effective before
trying a full-scale campus operation. They could also show us blue prints of how they set up
measuring systems. It could also prove the point that if we were to set up the sensors and
implement the behavioral changes we could show some of the same savings that these people
got. And also allow us to get a timeline of when will the program start putting money back in the
universities pocket.
Each program had faults in the experiment designs with their instruments and their ideas
of motivation of students. The first study had problems with their sensors cutting out on them or

Kansas State University
30 NRES Capstone Course
people reading the senor and meters wrong. The way to fix this problem would to be having
secondary sensors on location with the primary incase of failure and also have trained faculty
that can read the meters instead of having a person that is not trained.
The second study had problems motivating their students during their first years of their
studies to even give good data to get measurements. They could have set up a program to get the
student interested in saving the resources in their living spaces. A big con is there is still not a lot
of data out there that can really tell us what measurement system will work the best. This idea of
behavioral change is a hard thing to do on a campus setting where you have so many students
who don’t pay the bill. So it leaves us to take parts from these experiments and see what type of
measurement system will work best for our campus setting. Its still a theory in the works so
anything we do will help the future of implementing behavior change measurement systems in
the future.

Kansas State University
31 NRES Capstone Course
Data method:
So what we wanted to do was look more at question 1 on our experiment. In terms of how much is
possible to save at Kansas State. Why do we want to look at this well its simple we want to come up with
an estimate that shows savings. If we can show that we use a lot of energy and how much it actually cost
us. Then show that just by changing a few choices we could possibly save money. So we did a very
general overview of one of our buildings on campus. So for our own data collection on campus we are
using the Throckmortan Plant and Science Building. Our first step is to do a survey of appliances we
thought would be in offices and classrooms of this building. We just went through as many offices as we
could and got a checklist. This checklist is based off of about 55 offices and classrooms.
Electronic Device Checklist
Building Information: Throckmortan Plant and Science Building
Appliances
Numer of
Appliances
Desktop
Computer 50
Laptop
Computer 30
Projector 16
Central Printer 4
Individual
Printer 1
Central Fax 4

Kansas State University
32 NRES Capstone Course
Individual Fax 0
Mini Fridge 11
Main Fridge 5
Floor Lamp 0
Desk Lamp 3
Floor Fan 2
Desk Fan 1
Space Heater 9
Television 18
Power Strip 35
Toaster 2
Microwave 14
Office Phones 24
Shredders 4
Phone Chargers 4

Kansas State University
33 NRES Capstone Course
Next we looked at how many Watts the top 10 appliances had. Here is a simple graph showing how many
watts each appliance consumes.
Watts
Desktop Computer
Laptop Computer
Individual Printer
Mini Fridge
Main Fridge 20 cu ft
Space Heater
Televison
Coffee Machines
Office Phones
Projectors

Kansas State University
34 NRES Capstone Course
This next chart shows the top 10 appliances in the survey we did. But the only difference is we
added in the kWh. To get those kWh we used this equation and an example of how we convert it. I did an
assumption based on how long we thought each item was on per day. I did find out from the Office of
Sustainability at Kansas State that the blended cost per kWh is .077. We gathered data from multiple
sources to average out the watts for each appliance.
Equation: (Watts) x (Assumed Hours) / 1000 = kWh
Appliances Assumed Hours Watts kWh
Desktop Computer 8 Hrs 150 1.2
Laptop Computer 8 Hrs 50 .4
Individual Printer 5 Hrs 35 0.175
Mini Fridge
Plugged in 24/7
but cycles about
6 Hrs 120 .72
Main Fridge 20 cu feet
Plugged in 24/7
but cycles about
6 Hrs 800 4.8
Space Heater 4 Hrs 1500 6
Television 7 Hrs 300 2.1
Coffee Machines 7 Hrs 1200 8.4
Office Phones 24 Hrs 17 .408
Projectors 8 Hrs 250 2
Kansas State University
35 NRES Capstone Course
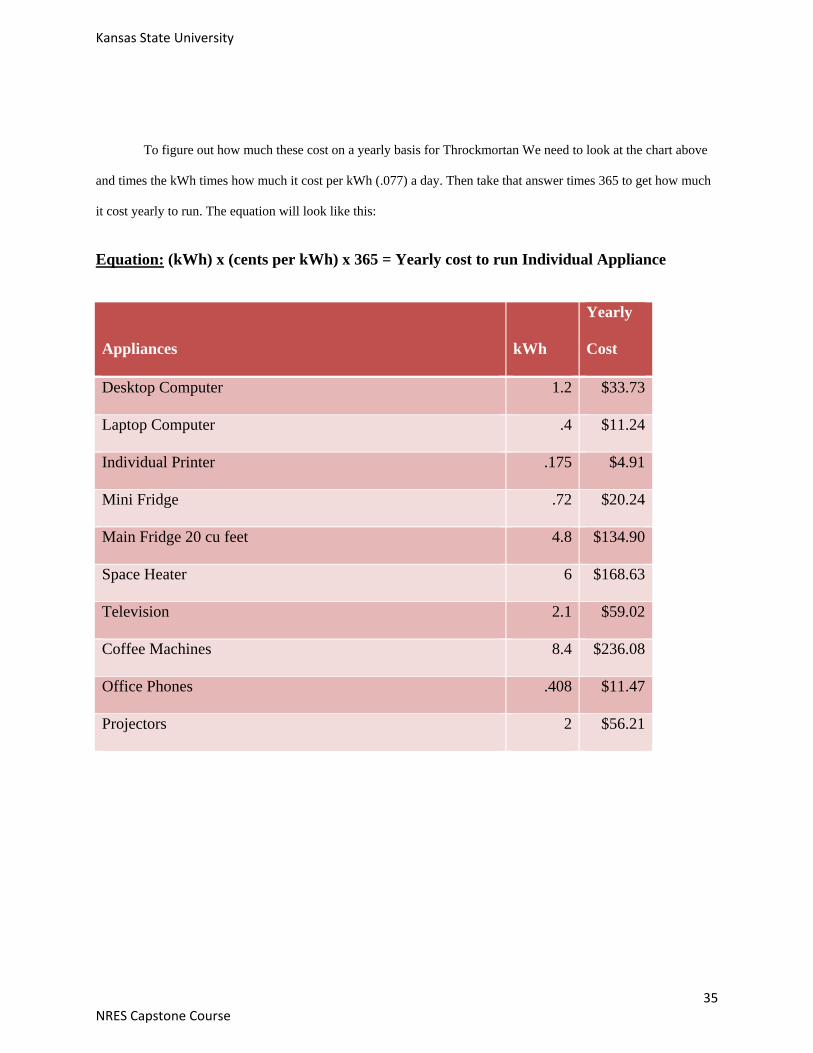
To figure out how much these cost on a yearly basis for Throckmortan We need to look at the chart above
and times the kWh times how much it cost per kWh (.077) a day. Then take that answer times 365 to get how much
it cost yearly to run. The equation will look like this:
Equation: (kWh) x (cents per kWh) x 365 = Yearly cost to run Individual Appliance
Appliances kWh
Yearly
Cost
Desktop Computer 1.2 $33.73
Laptop Computer .4 $11.24
Individual Printer .175 $4.91
Mini Fridge .72 $20.24
Main Fridge 20 cu feet 4.8 $134.90
Space Heater 6 $168.63
Television 2.1 $59.02
Coffee Machines 8.4 $236.08
Office Phones .408 $11.47
Projectors 2 $56.21
Kansas State University
36 NRES Capstone Course
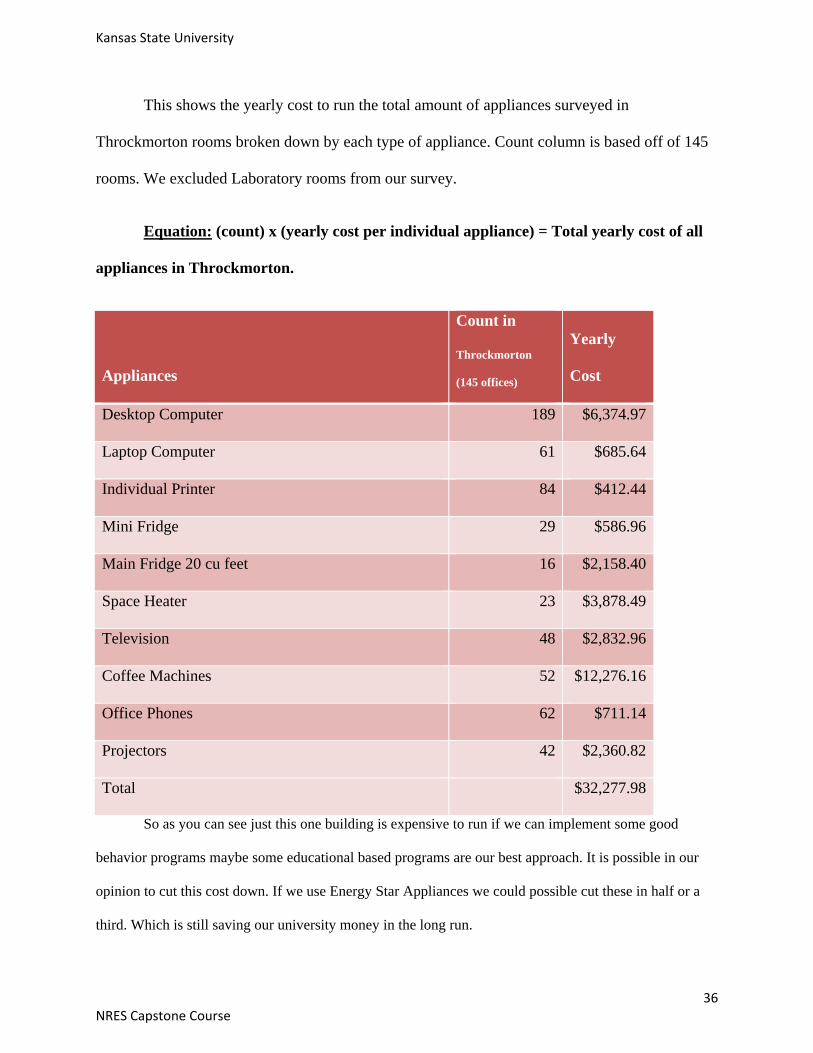
This shows the yearly cost to run the total amount of appliances surveyed in
Throckmorton rooms broken down by each type of appliance. Count column is based off of 145
rooms. We excluded Laboratory rooms from our survey.
Equation: (count) x (yearly cost per individual appliance) = Total yearly cost of all
appliances in Throckmorton.
Appliances
Count in
Throckmorton
(145 offices)
Yearly
Cost
Desktop Computer 189 $6,374.97
Laptop Computer 61 $685.64
Individual Printer 84 $412.44
Mini Fridge 29 $586.96
Main Fridge 20 cu feet 16 $2,158.40
Space Heater 23 $3,878.49
Television 48 $2,832.96
Coffee Machines 52 $12,276.16
Office Phones 62 $711.14
Projectors 42 $2,360.82
Total $32,277.98
So as you can see just this one building is expensive to run if we can implement some good
behavior programs maybe some educational based programs are our best approach. It is possible in our
opinion to cut this cost down. If we use Energy Star Appliances we could possible cut these in half or a
third. Which is still saving our university money in the long run.

Kansas State University
37 NRES Capstone Course
Conclusion:
A constants debate exists in attempts to decide whether it is an individual responsibility, or the
responsibility of the leaders of society. There was a recent article that recently came out from the
collaboration of Princeton Professor Martin Gilens and Northwestern Professor Benjamin I. Page. Their
research on over a thousand public policy actions found that corporations and business had a majority of
the influence in the outcome of decisions. The results also found that the individual person has a “near-
zero statistically significant effect” on public policy. Since the results of this study show that the most
affluent in society hold the greatest power to create change, most would recognize that this is where the
responsibility lies as well. So one approach is to get these people to help get these policy changes to
happen so that the individual can have an effect on saving energy in this country. That is an approach we
could further look into is putting in policies to help with these behavioral programs.
Kansas State University is located in a small, tight-knit, agriculture community in the Midwest.
The conditions here are optimal for creating a sustainable community. The only missing element(s) is the
correct amount and implementation of motivators and triggers. Like stated earlier in the Fogg Theory. We
came up with estimates on how much we believe we could save. And finally we looked at how do we
measure that, is it by real time monitors or by other means not yet discovered. Our research shows that
there are numerous areas of student, faculty, and operational life that can be improved on to reduce our
impact. The observational study we conducted on campus showed that savings in the thousands of dollars
are possible through a few simple behavior changes, in just one campus building. Reducing and/or
eliminating human impact is gaining popularity as a lifestyle change and as a business practice across the
world. In every one of these initiatives there is something that can be taken in, learned, and applied to our
community.
During our researching and surveying process we decided to omit laboratory equipment. This
specialized equipment would require in-depth research, as well as more time, to calculate their total

Kansas State University
38 NRES Capstone Course
impact. In order to fit our study into our time limit we ultimately decided to survey classroom and office
space appliances only. For future research, we would suggest taking more time to survey an entire
building, if not an entire campus, to calculate the total impact and cost of our plug-in devices. Future
studies could also include the use of new technology similar to the instant feedback systems we reviewed
in our research. Another thing we hoped we could have had time for was to put in a behavioral system
ourselves in Throckmortan and to set up a way we can measure how much could have been saved. It
would have helped shown how much could be saved in Throckmortan, which is only one building of
many on campus.
Energy is expensive and costly to more than just a pocketbook. Institutions around the world are
taking steps in improving campus life and the environment around them, simultaneously. K-State’s
Sustainability Plan needs to be at the top of the list of priorities for the 2025 plan. If we are proactive
about sustainable development now it will cost us less in the future, whether it’s the economy, society, or
the environment. It starts to help promote energy saving friendly behavior. So just think if we can get this
trend going here at Kansas State then maybe others will follow and help cut back on energy consumptions
on universities around the United States.

Kansas State University
39 NRES Capstone Course
Sources Cited:
1. "Energy-Star Chart.”. N.p., n.d. Web. 6 May 2014. http://green.tulane.edu/energysmart/images-
EnergySmart/ApplianceChart.pdf.
2. "How much energy do appliances use?." . N.p., n.d. Web. 6 May 2014.
<https://www.nvenergy.com/brochures_arch/conservation/spp_np_aplince_use_gide.pdf>.
3. "A Sto chastic Mo del for Energy Consumption Entailed by Mobile Device Proliferation." . N.p.,
n.d. Web. 23 Apr. 2014. <http://people.duke.edu/~mat39/MCMPaper.pdf>.
Petersen, John. "Dormitory Residents Reduce Electricity Consumption When Exposed to Real
Time Visual Feedback and Incentives." N.p., n.d. Web. <www.emeraldinsight.com/1467-
6370.htm>.
4. "Energy Conservation Initiative." St. Mary's College Of Maryland, n.d. Web.
<https://www.smcm.edu/sustainability/_assets/pdf/energyconservationinitiative.pdf>.
5. "Frequently Asked Questions." City of Glendale, CA :. N.p., n.d. Web. 17 Apr.
2014.<http://www.glendalewaterandpower.com/rates/appliance_operating_costs.aspx>
6. "Estimating Appliance and Home Electronic Energy Use." Energy.gov. N.p., n.d. Web. 17 Apr.
2014<http://energy.gov/energysaver/articles/estimating-appliance-and-home-electronic-energy-
use>
7. "Bartholomew County REMC." Bartholomew County REMC. N.p., n.d. Web. 17 Apr.
2014.<http://www.bcremc.com/appliance.html>
8. "Tech Tools: TechLAB Shootout: 5 Classroom Projectors." 'Tech Tools' N.p., n.d. Web. 17 Apr.
2014.http://blogs.scholastic.com/techtools/2012/06/classroom-projectors-techlab-shootout-5-
classroom-projectors-the-center-of-every-childs-education-is-rightly.html#.U0HR1ce0bC8
9. Carrico, Amanda R., and Maneul Riemer. “Motivating Energy Conservation in the Workplace an
Evaluation of the Use of Group-level Feedback and Peer Education.” Journal of Environmental

Kansas State University
40 NRES Capstone Course
Psychology 31.1 (2011): 1-13. Web. 8 Apr. 2014.
<http://www.sciencedirect.com/science/article/pii/S0272494410001015>.
10. Emeakaroha, Anthony, Chee S. Ang, and Youn Yan. “Challenges in Improving Efficiency in a
University Campus Through the Application of Persuasive Technology and Smart Sensors.”
(2007): 290-318. Web. 8 Apr. 2014. <www.mdpi.com/journal/challenges>.
11. Petersen, John E., Vladislav Shunturov, Kathryn Jada, Gavin Platt, and Kate Weinberger.
“Dormitory Residents Reduce Energy Consumption When Exposed to Real-time Visual
Feedback and Incentives. “International Journal of Sustainability in Higher Education 8.1 (2007):
6-33 Web. 8 Apr. 2014. <https://my.vanderbilt.edu/cs265/files/2012/11/Lucid-
IJSHE_DormEnergyFeedback.Pdf>.
12. Steingrad, Britni. “Astudy of in-Dorm Student Energy Use at Smith College.” Smith College.
Smith College, 5 May 2009. Web. 14 Apr.
2014.<http://www.smith.edu/env/pdf%20files/2009/Steingrand EnergyUse 09.pdf>.
13. Vicente-Molina, M. A., Fernandez-Sainz, A., & Izagirre-Olaizola, J. (2013). Environmental
knowledge and other variables affecting pro-environmental behavior: Comparison of university
students from emerging and advanced countries. Journal of Cleaner Production, 61, 130-138.
<http://www.sciencedirect.com.er.lib.k-state.edu/science/article/pii/S0959652613003247>.
14. O'Brien, K. (2012). Global environmental change ii: From adaptation to deliberate
transformation. Progress in Human Geography, 667-676. <http://web.b.ebscohost.com.er.lib.k-
state.edu/ehost/pdfviewer/pdfviewer?sid=6ad4b2ff-c42f-464e-971d-
f7caf985b44e@sessionmgr110&vid=2&hid=12>.
15. Spearman, M., & Eckhoff, A. (2012). Teaching young learners about sustainability. Childhood
Education,88.6(Nov.-Dec.), 354. <http://go.galegroup.com.er.lib.k-
state.edu/ps/i.do?action=interpret&id=GALE|A312290673&v=2.1&u=ksu&it=r&p=AONE&sw=
w&authCount=1>.
Kansas State University
41 NRES Capstone Course
16. Givens, J.E. & Jorgenson, A.K. (2012) Individual environmental concern in the world polity: A
multilevel analysis. Social Science Research (42),(6),418-431<
http://www.sciencedirect.com.er.lib.k-state.edu/science/article/pii/S0049089X12002220>.
17. Torgler, B., & Garcia-Valinas, M. A. (2006). The determinants of individuals' attitudes towards
preventing environmental damage. Ecological Economics, 63, 536-552.
<http://ac.els-cdn.com.er.lib.k-state.edu/S0921800906006021/1-s2.0-S0921800906006021-
main.pdf?_tid=e51cfc50-9473-11e3-b20f
00000aacb35e&acdnat=1392271303_9b486ade3baf63c95fac5d2b7e1b3838>.
18. Epstein, M. J., & Buhovac, A. R. (2010). Solving the sustainability implementation challenge.
Organizational Dynamics, 39(4), 306-315. <http://www.sciencedirect.com.er.lib.k-
state.edu/science/article/pii/S0090261610000574>.
19. Barber, J. (2006). Mapping the movement to achieve sustainable production and consumption in
north america. Journal of Cleaner Production, 15(6), 499-512.
<http://www.sciencedirect.com.er.lib.k-state.edu/science/article/pii/S0959652606001740>.
20. Moganadas, S. R., Corral-Verdugo, V., & Ramanathan, S. (2013). Toward systemic campus
sustainability: gauging dimensions of sustainable development via a motivational and perception-
based approach. Environmental Development Sustainability, 15, 1443-1464.
<http://download.springer.com.er.lib.k-state.edu/static/pdf/124/art%3A10.1007%2Fs10668-013-
9451-3.pdf?auth66=1392473389_32779300d1a3ff6abbd59ef844e9cacc&ext=.pdf>.
21. Fogg, B. (n.d.). A behavior model for persuasive design. Unpublished raw data, Persuasive
Technology Lab, Stanford University, Stanford, CA.
<http://bjfogg.com/fbm_files/page4_1.pdf>.
22. Litman, T. (). Generated Traffic and Induced Travel. Institute of Transportation Engineers
Journal, 71, pp. 38-47.< http://www.vtpi.org/gentraf.pdf>.
23. Gilens, M., & Page, B. I. (April 2014) Testing Theories of American Politics: Elites, Interest
Groups, and Average Citizens . Forthcoming Fall 2014 In: Perspectives on Politics.

Kansas State University
42 NRES Capstone Course
<http://www.princeton.edu/~mgilens/Gilens%20homepage%20materials/Gilens%20and%20Page
/Gilens%20and%20Page%202014-Testing%20Theories%203-7-14.pdf>.


![Articles...ing the pipeline now will produce tangible benefits well into the future. “There are a lot of possibilities out there for [students], Ontiveros said. “Science, technology,](https://static.documents.pub/doc/80x56/6010256d788d3072f235ce28/articles-ing-the-pipeline-now-will-produce-tangible-benefits-well-into-the-future.jpg)


