In 1872, the world’s first national park was born. The land that would become Yellowstone National Park had captured the attention of explorers and artists, and Congress decided to keep the area free from private development. The purpose of the National Park system was to protect these natural resources for future generations and allow their unique ecosystems to stay wild forever.
Now, with our increasing exploitation of the ocean through fisheries, aquaculture, and oil extraction, human impact on the ocean is growing. One strategy to manage these impacts is to conserve ocean habitats in the way that National Parks protect terrestrial habitats. Marine Protected Areas (MPAs) are areas of the ocean where some or all human activities are restricted so that these ecosystems can exist undisturbed by humans.
• Visit the MPA section of the Ocean Tracks Library: http://oceantracks.org/library/conservation/marine-protected-areas/
• Click on and read through all the links related to Marine Protected Areas.
Sara Maxwell is a marine biologist who uses satellite technology to track marine animals and learn how they interact with the ocean environment. She uses this information to determine how these animals, human activities, and ocean resources can best be managed.
• Watch a video of Sara Maxwell talking about her research and how animal tracking data can help us better protect marine wildlife: http://oceantracks.org/library/scientist-video-sara-maxwell-%E2%80%93-conservation.
Pre-Lab AssignmentPRE-LAB QUESTIONSUse what you learned from the readings in the Ocean Tracks Library and from watching the video to answer the following questions.
1. What are the three main purposes of marine protected areas?
2. What are some of the different levels of protection?
3. What are some important characteristics to consider when choosing a site for an MPA?
4. Why is it important to consider social dimensions when planning an MPA?
5. How is satellite tracking data used when designing an MPA?
Every year, it is estimated that 100 million sharks are killed by human activities. This equates to approximately 11,000 sharks per hour. Sharks are being harvested for food and cosmetic products through various methods, including shark finning, which involves the removal of the sharks fins so that they can be used for shark fin soup. Sharks are also at risk for other reasons such as bycatch during fishing activities, habitat degradation through pollution, and removal of prey species as a result of overfishing. Sharks are particularly susceptible to these types of human impacts due to their biology. They are slow growing, are late to reproduce, and give birth only to a few young, meaning that they are slow to recover from population declines. Currently, one-third of all shark species are at risk of extinction.
One of our Ocean Tracks species, the white shark, has been adversely affected by human activities and is currently listed as “vulnerable” on the IUCN (International Union for the Conservation of Nature) Red List of Threatened Species (http://www.iucnredlist.org/details/3855/0), meaning that the white shark is likely to become endangered unless steps are taken to improve the conditions necessary for their survival.
As you learned in your Pre-Lab Assignment, MPAs can be used to protect ocean species, like sharks, from human activities. In this module, you will learn how MPAs can help counteract human impacts to improve the health of the ocean—and specifically to help white sharks—as you answer the research question: What would be the ideal characteristics of a marine protected area designed to conserve white sharks in the Pacific Ocean?
EngageStart by looking at existing MPAs in the Pacific Ocean to see where they are located and what characteristics they have. Using the Ocean Tracks interface, you can explore the location, size, and level of protection of MPAs in the Pacific Ocean.
• Go to http://oceantracks.org/map.
• Open the Data & Tools tab. Click the + to expand Overlays. Check the box for Show Marine Protected Areas.
• Zoom in and out on Hawaii and the West Coast of North America. Notice the legend on the bottom right that describes the level of protection for MPAs.
• NOTE: It may be difficult to distinguish between the MPAs and the underlying Bathymetry layer, so it is important to really zoom in when disseminating the boundaries of these MPAs.
• Look for patterns in the size, location, and level of protection of the MPAs.
CLASS DISCUSSION
As a class, discuss the following questions:
1. What patterns do you notice between the size of an MPA and the level of restriction in the MPA? Why might this be the case?
2. Where are most of the MPAs located? Why do you think this might be?
3. What might be the purpose of a very large MPA? What about a very small MPA? What would the purpose of an MPA close to shore be vs. one farther from shore?
4. Why would it be not be practical to protect the whole ocean?
One of the unique features of the Ocean Tracks interface is the inclusion of data related to the impact humans are having on Earth’s oceans. These data are visualized as a map that shows the intensity of human impacts in the ocean. The colors on this map reflect the values of a human impacts “index” in each area of the ocean.
To create the human impact maps, scientists compiled global data and maps for issues such as fishing, climate change, and pollution. These data were gathered from pre-existing records, research studies, fish catch records, global climate data, etc. Scientists also looked at the vulnerability of certain ecosystems and how particular ecosystems might be impacted by human activities. To create this visualization, scientists overlaid the maps representing the various threats onto a map of ecosystem types to create a vulnerability score, which is represented by the ecological impact index. It is important to note that this research is from 2008 and the data have changed since then.
To learn more about these data, read the Science article “A Global Map of Human Impact on Marine Ecosystems” by Halpern et al. (2008): http://msp.naturalcapitalproject.org/msp_concierge_master/docs/Halpern_etal_2008_Science.pdf
A follow-up comparative article was published in 2015 by the Halpern et. al group in Nature, “Spatial and Temporal Changes in Cumulative Human Impacts on the World’s Ocean”:http://www.nature.com/ncomms/2015/150714/ncomms8615/full/ncomms8615.html
Marine resource managers can use this map to determine where effort needs to be focused in the ocean to minimize the negative effects of humans on the marine environment. In this section, you’ll learn more about some of the ways that humans are affecting the oceans by using the Human Impact overlay available in the Ocean Tracks interface. You will then use this information to help make decisions about the characteristics of your MPA to protect white sharks.
• Go to #4: Explore Human Impacts and select Cumulative Human Impactfrom the dropdown menu. (NOTE: Cumulative Human Impact is a sum of all of the individual types of human impacts in the list combined).
Figure 1. Screenshots showing Cumulative Human Impact overlay
1. With the Cumulative Human Impact layer turned on, zoom in and out, and explore the various regions of Earth’s oceans. Record three specific areas and the corresponding impact values for each of the following conditions:
• Regions of Earth’s oceans experiencing the highest levels of human impact
• Regions of the North Pacific basin experiencing the highest levels of human impact
• Regions of Earth’s oceans experiencing very little human impact
2. Now, toggle between the individual impacts in the Explore Human Impacts layer, and again explore various regions of Earth’s oceans:
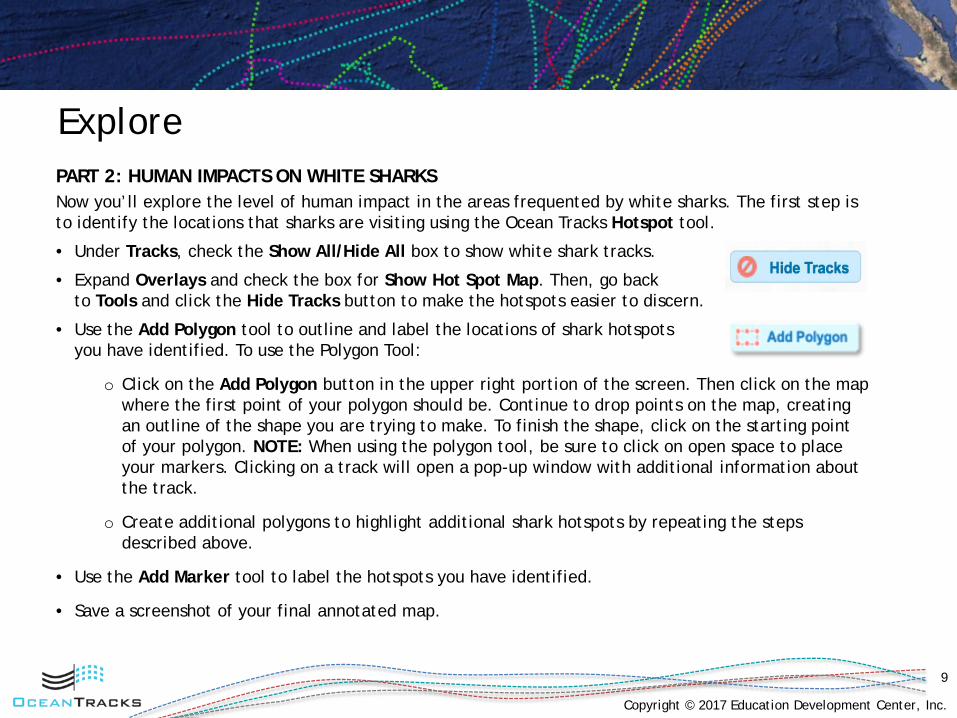
ExplorePART 2: HUMAN IMPACTS ON WHITE SHARKSNow you’ll explore the level of human impact in the areas frequented by white sharks. The first step is to identify the locations that sharks are visiting using the Ocean Tracks Hotspot tool.
• Under Tracks, check the Show All/Hide All box to show white shark tracks.
• Expand Overlays and check the box for Show Hot Spot Map. Then, go backto Tools and click the Hide Tracks button to make the hotspots easier to discern.
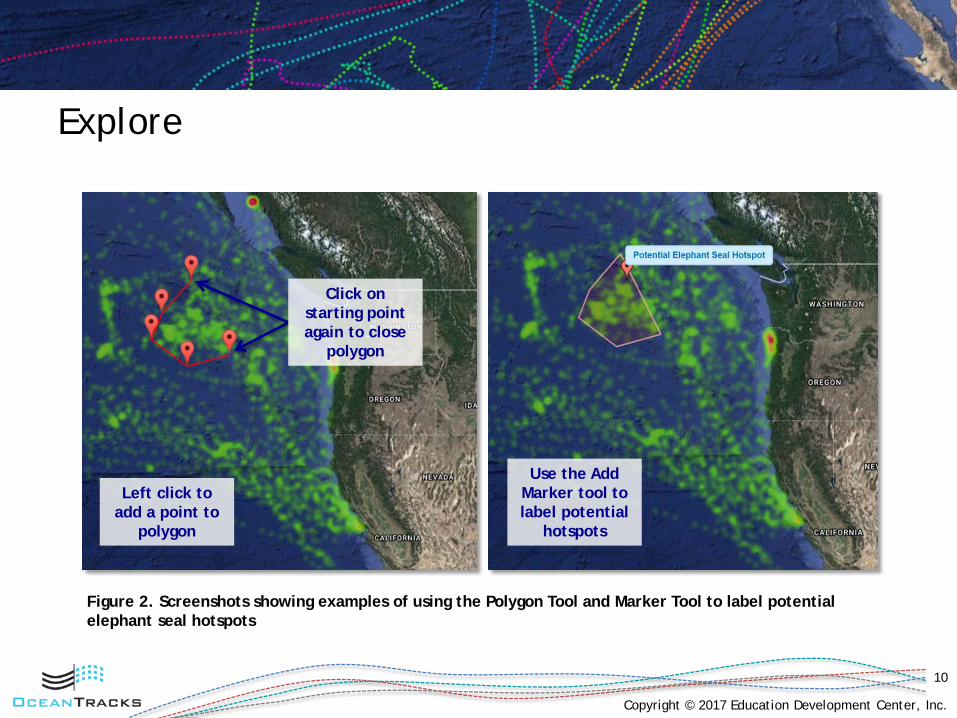
• Use the Add Polygon tool to outline and label the locations of shark hotspotsyou have identified. To use the Polygon Tool:
o Click on the Add Polygon button in the upper right portion of the screen. Then click on the map where the first point of your polygon should be. Continue to drop points on the map, creating an outline of the shape you are trying to make. To finish the shape, click on the starting point of your polygon. NOTE: When using the polygon tool, be sure to click on open space to place your markers. Clicking on a track will open a pop-up window with additional information about the track.
o Create additional polygons to highlight additional shark hotspots by repeating the steps described above.
• Use the Add Marker tool to label the hotspots you have identified.
ExploreMake and complete a table like Table 1 on Slide 12. Use the Human Impacts Map overlay to find out how sharks are being affected by human activities in their hotspots.
Investigate human impacts on the North Pacific even further by looking at individual sources of human impact. The Ocean Tracks Library contains additional information on these individual sources of human impact, as well as specific threats for each species.
• Select different impacts from the Impact Type dropdown menu under Explore Human Impacts under Overlays. Suggestion: Save screenshots of the visuals you create throughout your exploration to refer back to when you are designing your shark MPA.
• To learn more about these human impacts, go to the Ocean Tracks Library (http://oceantracks.org/library) and select Human Impacts from the Categories list on the right.
• The conservation subsection for the white shark in the Ocean Tracks Library contains information on the specific threats and conservation efforts for the white shark: http://oceantracks.org/library/species/white-shark/#conservation
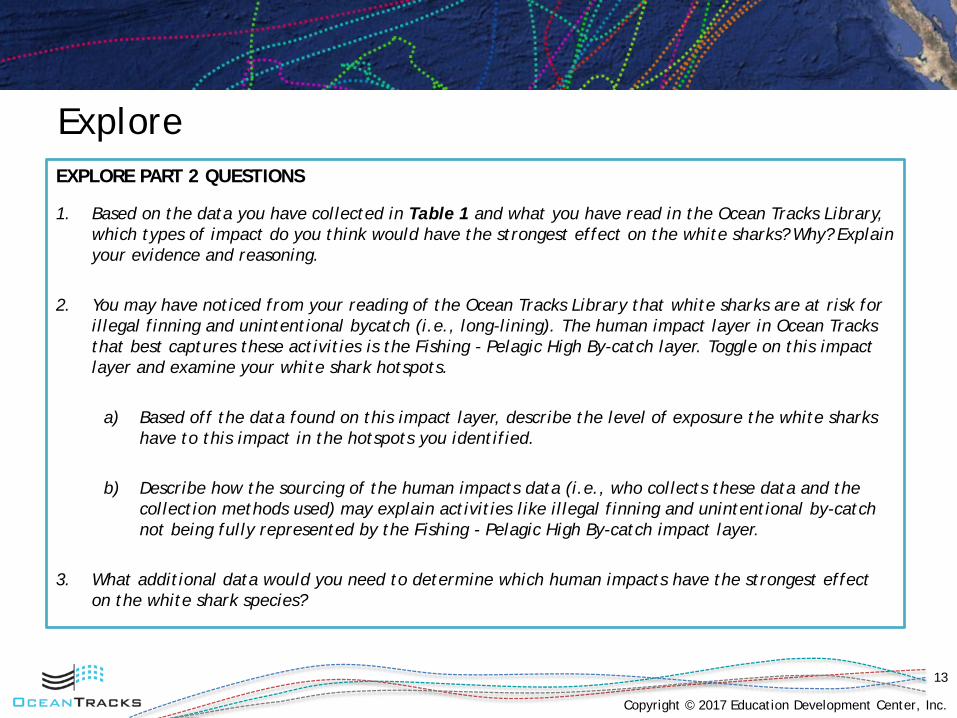
1. Based on the data you have collected in Table 1 and what you have read in the Ocean Tracks Library, which types of impact do you think would have the strongest effect on the white sharks? Why? Explain your evidence and reasoning.
2. You may have noticed from your reading of the Ocean Tracks Library that white sharks are at risk for illegal finning and unintentional bycatch (i.e., long-lining). The human impact layer in Ocean Tracks that best captures these activities is the Fishing - Pelagic High By-catch layer. Toggle on this impact layer and examine your white shark hotspots.
a) Based off the data found on this impact layer, describe the level of exposure the white sharks have to this impact in the hotspots you identified.
b) Describe how the sourcing of the human impacts data (i.e., who collects these data and the collection methods used) may explain activities like illegal finning and unintentional by-catch not being fully represented by the Fishing - Pelagic High By-catch impact layer.
3. What additional data would you need to determine which human impacts have the strongest effect on the white shark species?
ExplorePART 3: EXISTING MPAs FOR SHARK CONSERVATION
The data and information you collected in the previous exercise will be useful in designing your own MPA to help protect white sharks. Before you begin designing your own MPA, however, first look at a couple of examples of existing MPAs that are part of a conservation strategy to help sharks. These will serve as a model for your own MPA design.
The Farallon Islands, located in the Gulf of the Farallones off the coast of San Francisco, are closed to the public but are a safe haven for many different marine species, including white sharks. Explore:
• Find the North and Southeast Farallon Islands State Marine Reserves:
o Under Overlays, check the box labeled Show Marine Protected Areas.
o Zoom in on the coast of California, near San Francisco. The Farallon Islands are approximately 50 km off shore.
o Notice how many other MPAs are also in this location.
• Right click the area of the map that contains the North Farallon Islands State Marine Reserve.
• Click More About These MPAs to open the Protected Seas website. Then click on North Farallon Islands State Marine Reserve in the list of Marine Restricted Areas.
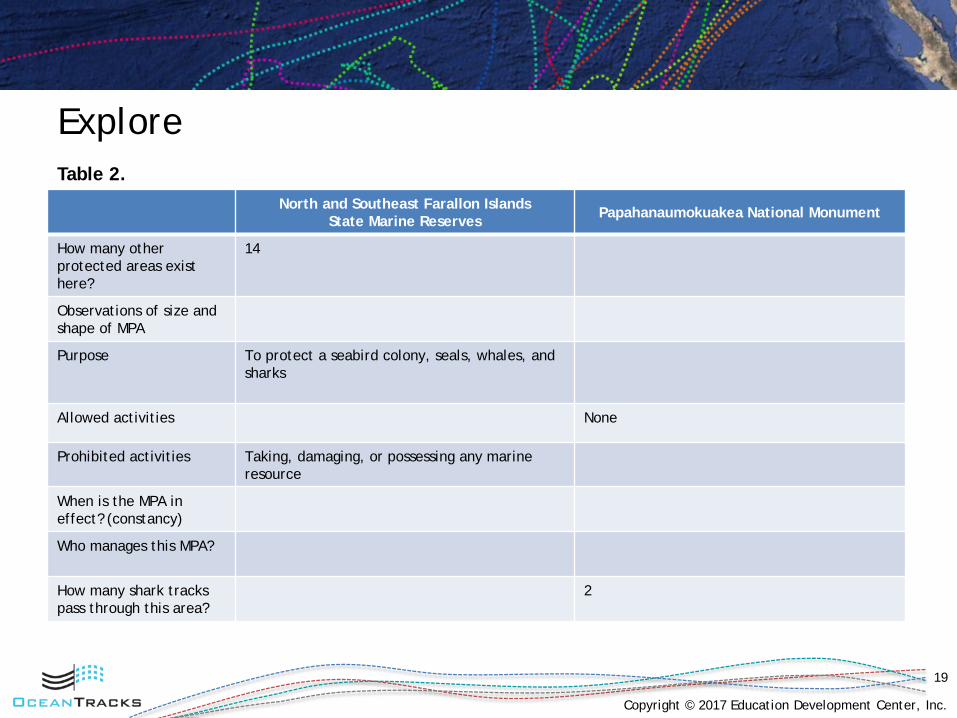
• Identify the purpose, allowed activities, and prohibited activities within the MPA. Record this information in a table like Table 2 on Slide 21.
Explore• Using the ruler tool, try to estimate the approximate area of the MPA (the greatest width x the greatest
height in km2) and record it in your data table. To use the ruler tool:
o Click Show Ruler to activate the ruler tool.
o Click on the map to place a 0 km marker.
o Click and drag the marker to extend the ruler—a second marker shows distance between start and end markers.
o Click and drag either marker to change the start/end positions of the ruler.
o Click Hide Ruler to remove the ruler from map.
• Click Show All white shark tracks and check the box labeled Use Unique Colors to see how many shark tracks cross through this MPA. Record this value in your table.
• Follow the same steps as above for the Southeast Farallon Islands State Marine Reserve.
• Next, find the Papahanaumokuakea National Marine Monument.
o Zoom out from the coast of California and pan southwest to locate the Hawaiian Islands.
o Look for the red restricted area around the northern islands.
• Right click on the MPA and click More About These MPAs to go to the Protected Seas website to read about this MPA and record the information in the table on the following page as you did for the FarallonIslands MPAs.
1. Using the information you collected in Table 2, compare the potential for these MPAs to help the white shark population. Describe how the preservation strategies used in each MPA have the potential to aid in preserving the white shark population.
2. Describe the level of human impact in these habitats. Explain how the MPAs may help to address those issues?
3. How do the dimensions and size of these MPAs compare? Describe how each of their different sizes can be effective in preserving the white shark species?
4. Compare the size of these MPAs with the white shark hotspots you identified in the previous exercise. In instances where these MPAs are noticeably smaller than your hotspots, describe how these MPAs may still be effective in preserving a highly migratory species like the white shark?
5. What might be some of the costs associated with maintaining these MPAs? How would increasing or decreasing the size of the MPA effect these costs?
6. What other restricted areas did you notice in the same regions as these MPAs? How do these work together in an MPA network? How is this beneficial to species?
7. In what ways do you think the restrictions in these MPAs have affected people? What might be some of the social and economic consequences of having an MPA in these locations?
SynthesizeDESIGN AND PROPOSE AN MPA FOR SHARK CONSERVATION
The creation of an MPA is a collaboration between scientists, government officials (at the local, state, or federal level), and a variety of stakeholder groups such as fishermen, divers, representatives from the energy and tourism industries, and environmentalists. For this Synthesize assignment, you will represent a science advisor proposing to a diverse panel of stakeholders a new MPA designed specifically for white shark conservation in the North Pacific.
Your Synthesize assignment for this module will consist of three major components:
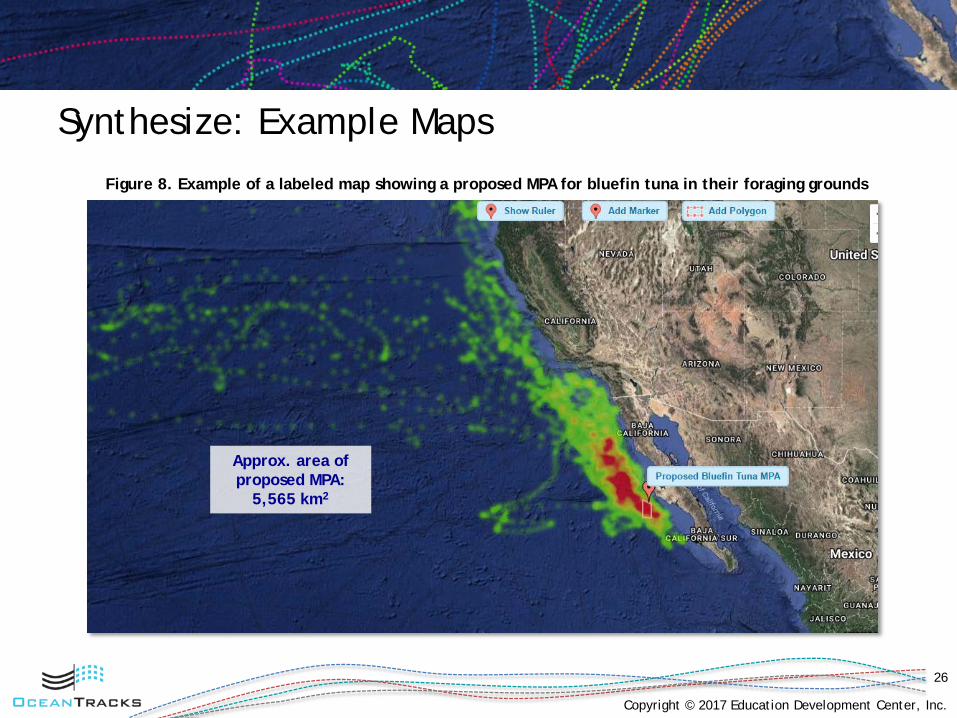
1. A map of your MPA, showing the area of the North Pacific you think will make the most effective MPA for protecting white sharks. (See instructions on Slide 25 and examples on Slides 26 and 27.)
2. A completed table of key characteristics of your MPA. (See sample table on Slide 28.)
3. A short proposal to be shared with scientists, government officials, and other stakeholders explaining your rationale for your design choices. (See instructions on Slide 29.)
GETTING STARTEDConsider the prompts on the following three slides as you begin to make decisions about the design of your MPA. You don’t have to formally answer these questions. Instead, use them to help guide your thinking. You are also encouraged to do some additional research as you think about various aspects of your MPA design. For example, it might be helpful to learn more about the biggest conservation threats facing sharks or how MPAs are monitored.
• Look at the shark hotspots that you identified in the Explore section. Which geographic area is the most heavily used by white sharks? What might the sharks be doing in these areas? What ecological function might this location serve for these sharks? Which habitat locations are most important to the life history of the white shark?
• As you consider location, also think about the management of your proposed MPA. Will the location be close to shore or far from shore? Is it in U.S. waters or international waters? How will that affect the management of the MPA?
Human Impacts:
• Refer back to the data you collected in Table 1 on the three shark hotspots you discovered. Which shark habitat areas are the most impacted by human activity? Which types of human impact were sharks most exposed to? Which types of human impact pose a specific threat to the white sharks? How could the creation of your MPA address these impacts to protect sharks?
• Consider the human side of the human impact data. In what ways are shark habitats being used by people? Are these locations important for recreation, jobs, or food? How would having a restricted area here impact people? Remember that you will be reporting to fishermen, commercial shipping companies, tourism groups, etc. How can you best satisfy everyone’s needs while still offering adequate protection for the sharks?
• As you begin to zero in on a particular white shark hotspot that may serve as your MPA region, consider how large this shark hotspot is compared with the average size of other MPAs that you have been investigating. It might not be feasible to protect the entire hotspot, but can you pinpoint a specific area in your hotspot that you think might be more valuable to protect? How will you determine the shape of your MPA? Use the following questions to help you make your MPA more specific based on the data that is available to you:
o Place a polygon around the entire hotspot and turn on the tracks. How many tracks go through the hotspot? Zoom in on the area as much as you can to see detail in the tracks. Is there a region of the hotspot where there is a greater number of different white shark tracks than other regions within the hotspot?
o When you have zoomed in, what was interesting (if anything) about the bathymetry within the boundaries of the hotspot?
o Turn on the Cumulative Human Impact layer. Is one region of your hotspot affected more or less by humans? Toggle between all of the various individual human impact layers. Is one region affected more or less by one particular type of impact?
o Turn on/off various environmental layers, like SST and CHL. Are there any differences in SST or CHL within the hotspot that could make a region of the hotspot more or less desirable to protect?
After using the prompts on the previous two slides to zero in on a specific location for your MPA, consider the following prompts as you begin to draft your MPA proposal to local policymakers and stakeholders:
Management:
• When are sharks in the area of your proposed MPA? Does the MPA need to be in effect year-round or are the sharks only in the area at certain times of the year?
• What are some strategies that could be used to monitor your MPA? Using other MPAs as examples, consider who might manage your MPA.
Existing Protection:
• What levels of protection already exist in this area? The MPA overlay in Ocean Tracks shows that many locations in the ocean are protected by more than one MPA, offering different levels of protection. If you discover that your proposed MPA overlaps with a pre-existing MPA, how would you expand the size of the MPA or otherwise revise the regulations to further protect the sharks? How might your MPA function as part of a network of MPAs that aid in shark conservation?
Restrictions:
• Which activities will be important to restrict in this area? Again, use your research on other MPAs to see examples of restricted activities and think about what will be necessary to help the sharks. Are there some human activities that don’t have much of an impact on sharks that could still be permitted in the area? Again, consider your audience of diverse stakeholders. How can you appease group members by allowing certain activities while still offering protection for the sharks?
SynthesizeUse the guidelines below to build the components of your Synthesize assignment:
1. Create your map (and other data visualizations to support your MPA)
• Using the Ocean Tracks interface and the Add Polygon tool, create an outline of your MPA. Use the Add Marker tool to add a label to the map with the name of your proposed MPA. Take a screenshot of this map.
• Using the ruler tool, determine the approximate dimensions of your proposed MPA and calculate the area (in km2) of the MPA. Annotate your map to include this information.
• To help support your rationale for an MPA in this location, generate, save, and annotate other visualizations to show the shark tracks moving through your MPA, the levels of human impact (both cumulative and specific impacts) in your MPA, nearby existing MPAs, etc. Consider what visual supports will best help policymakers understand the purposes of your MPA. Create and annotate these maps so viewers can better understand your rationale for an MPA in this location.
• Example maps are provided on Slides 26 and 27 solely to show the level of detail you should provide in your own map(s) and not as a template to follow. Be creative in providing visuals that best support your rationale for your chosen MPA location.
Figure 9.All of these bluefin tuna tracks are available in the Ocean Tracks interface in relation to the proposed MPA. At least seven tuna move through this area.
Figure 10. The proposed bluefin tuna MPA contains a seamount. Marine species, like tuna, use seamounts as important foraging grounds.
Figure 11. Pelagic high by-catch fishing practices pose a specific threat to the bluefin tuna.
The images below are examples of additional visualizations that could be used to support the proposed bluefin tuna MPA shown on Slide 26.
3. Write your proposal and describe your rationale (300–500 words)
Now that you have designed what you think is the ideal MPA for conserving white sharks, write a short proposal to scientists, local policymakers, and other interested groups (e.g., fisherman and representatives from energy, tourism, and shipping industries) that explains the choices you made in designing your MPA. Explain why the location you chose is the most important area of the North Pacific for protecting sharks and why money should be spent to protect this particular region instead of other locations. Your response should be grounded in the evidence you collected throughout the module. Whenever possible, include actual data points, quantitative values (e.g., statistics from track points, human impact values, and information cited from background research). Be sure to consider your audience of diverse stakeholders, and be creative in developing a compelling narrative for why local policymakers should support and fund the creation of your MPA. Make sure to do the following in your proposal:
• Reflect back on the decisions you made as you planned your MPA. Justify the choices you made about its location, size, and shape.
• Discuss the importance of this habitat to white sharks. Why did you pick this site over other possible locations? Why will this conservation strategy be important in the recovery of white shark populations? How did the human impact data influence your decisions?
• Describe how you were able to balance the conservation needs of the sharks with economic and other needs of people affected by the installment of your MPA. How did these considerations affect the design of your MPA?
• If you discovered that your proposed MPA overlaps with a pre-existing MPA, how you would expand the size of the MPA or revise the regulations to further protect the species/environment there? How could these MPAs work together as a network?
• What are some monitoring and enforcement strategies you would employ in your MPA? How will you make sure that your proposed restrictions will be followed?
• How will you assess the efficacy of your MPA? What additional data would you use to see if your MPA is effective in preserving the white shark species?