Saving the Euro: Mitigating Financial or Trade Spillovers? Stijn Claessens (IMF) Hui Tong (IMF) Igor Zuccardi (University of Maryland) 1 September 25, 2012 Abstract This paper analyzes through what channels the euro crisis has affected firm valuations and what the efficacy of various policy interventions to mitigate the crisis has been. It examines stock price responses for 3045 non-financial firms in 16 countries to policy measures announced at four key events from 2010 to 2011. Using pre-crisis benchmarks, it separates effects arising from changes in financing conditions from those in trade and examines if bank or trade linkages propagated shocks across borders. It finds that measures impacted financially-constrained firms more, particularly in creditor countries with greater bank exposure to peripheral euro countries. The results carry through when we use bank exposure to the public sectors of peripheral euro countries. Trade linkages with peripheral countries played a minor role, although euro exchange rate movements led to some differential effects. It concludes that interventions were mostly geared towards preserving creditor banks’ ability to finance local firms. JEL Classification Numbers: F3 Keywords: Euro crisis; debtor countries; financial channels; trade channels 1 Stijn Claessens, Research Department, International Monetary Fund, University of Amsterdam and CEPR, email: [email protected]; Hui Tong, Research Department, International Monetary Fund, e-mail: [email protected]; Igor Zuccardi, Economics Department, University of Maryland, e-mail: [email protected]. We would like to thank George Akerlof, Olivier Blanchard, Heiko Hesse, Ashoka Mody, Nada Oulidi, Thierry Tressel, Jerome Vacher and Nico Valckx for useful comments and Mohsan Bilal for excellent research assistance. Igor Zuccardi was a summer intern at the IMF Research Department when this paper was written. The views expressed here are those of the authors and do not necessarily represent those of the IMF.
Transcript
Saving the Euro: Mitigating Financial or Trade Spillovers?
Stijn Claessens (IMF)
Hui Tong (IMF)
Igor Zuccardi (University of Maryland)1
September 25, 2012
Abstract
This paper analyzes through what channels the euro crisis has affected firm valuations and what the efficacy of various policy interventions to mitigate the crisis has been. It examines stock price responses for 3045 non-financial firms in 16 countries to policy measures announced at four key events from 2010 to 2011. Using pre-crisis benchmarks, it separates effects arising from changes in financing conditions from those in trade and examines if bank or trade linkages propagated shocks across borders. It finds that measures impacted financially-constrained firms more, particularly in creditor countries with greater bank exposure to peripheral euro countries.The results carry through when we use bank exposure to the public sectors of peripheral euro countries. Trade linkages with peripheral countries played a minor role, although euro exchange rate movements led to some differential effects. It concludes that interventions were mostlygeared towards preserving creditor banks’ ability to finance local firms.
JEL Classification Numbers: F3
Keywords: Euro crisis; debtor countries; financial channels; trade channels
1Stijn Claessens, Research Department, International Monetary Fund, University of Amsterdam and CEPR, email: [email protected]; Hui Tong, Research Department, International Monetary Fund, e-mail: [email protected]; Igor Zuccardi, Economics Department, University of Maryland, e-mail: [email protected] . We would like to thank George Akerlof, Olivier Blanchard, Heiko Hesse, Ashoka Mody, Nada Oulidi, Thierry Tressel, Jerome Vacher and Nico Valckx for useful comments and Mohsan Bilal for excellent research assistance. Igor Zuccardi was a summer intern at the IMF Research Department when this paper was written. The views expressed here are those of the authors and do not necessarily represent those of the IMF.
2
1. INTRODUCTION
Since late 2009, financial markets have been occupied with developments concerning the
sovereign debt of peripheral euro countries (Greece, Ireland, Italy, Portugal, and Spain, or PEC).2
Events have led to a significant widening of bond yield spreads and higher risk premium on
credit default swaps of PEC. And policy makers and financial markets have been concerned
about the spillovers to other euro-zone countries through various channels that are affecting the
viability of the euro more generally.
European countries and international organizations have since early 2010 responded with
a number of coordinated measures. Important region-wide steps were taken on May 10, 2010,
when Europe's Finance Ministers approved a comprehensive rescue package worth €750 billion
aimed at ensuring financial stability across Europe, including by creating the European Financial
Stability Facility (EFSF). This boosted stock market indexes for periphery and core euro-zone
countries by 10% and 8% respectively.
Differences among policy makers from various EU-countries as regards objectives and
approaches have arisen, however, making markets question at times the overall strategy. In June
2011, the crisis became even more intense with many concerns regarding the refinancing of
Greek sovereign debt. As political disagreements surfaced, market concerns peaked again.
Coordinated steps aimed to resolve the crisis were subsequently taken by the euro-zone
countries. An important date was July 21, 2011, when the euro area governments agreed on the
terms for the second bail-out loan to Greece. Moreover, on October 27, 2011, the EU forged
agreement with private banks on Greece debt reduction, which positively impacted markets.
2 One can date the start of the euro crisis as October 16, 2009, when incoming Greek Prime Minister George Papandreou told parliament “We have large hidden debts and spending,” with the previous government's deficit of 6% GDP for 2009 revealed to have been massively underestimated.
3
The varying reactions of financial markets to these events and policy measures
announced at them have made clear that there remain many questions on the best way to
intervene in what has been a unique financial and sovereign crisis. This paper aims to shed light
on the best policy mix by analyzing through what channels the euro crisis spilled over to the real
sectors of various countries and how effective policies announced were in mitigating (or not)
spillovers. In theory, crises may spillover to firms through at least two channels: a financial
channel and a trade channel. The financial channel arises as banks in creditor countries exposed
to sovereign risk, directly and indirectly, see their balance sheets impaired and have to cut back
on lending (“deleverage”) or, more generally, become reluctant to lend to (local) firms in the
face of uncertainty. This in turn will hurt the performance of firms, especially those dependent
on (bank) financing. The trade channel arises as affected countries reduce imports, which in turn
implies lower firm sales and profitability in exporting countries.
Policy measures can mitigate these channels, but are likely to vary in their effectiveness.
Public financial support for affected countries can help creditor banks as their asset values are
enhanced, and thereby help banks to maintain financing to domestic firms. Support can also
serve to support financial conditions and boost demand in affected countries, thus help to
maintain their imports, and thereby the exports of firms. Our objective is to investigate through
which of these two channels and to what degree the various policy measures have affected firms.
This will allow for an assessment as to the efficacy of specific support measures. We also study
two groups of firms: firms from around the world, and EU firms. Studying the first group
informs us about the general channels of cross-border contagion. Studying the second group
provides, beside a robustness test, insight on whether the measures helped to stabilize economic
and financial conditions within the EU and the Eurozone.
4
Empirical work on the real impacts of the euro crisis has been limited to date, in large
part as the crisis is still evolving. There is, however, a literature that studies the global
transmission of the (earlier) U.S. subprime crisis, which, although the evidence from studies is
mixed, offers some lessons and methodological guidance. Some studies find that pre-crisis
financial integration affected how the crisis impacted individual countries (e.g., Claessens et al.
(2010), Milesi-Ferretti and Tille (2011), Cetorelli and Goldberg (2011), and Forbes (2012)). In
contrast, Rose and Spiegel (2010a, b) fail to find roles for country factors, including trade and
financial linkages, in how countries were affected. A common feature of these studies, however,
is the reliance on aggregate data. The mixed evidence on the role of country factors and
individual contagion channels is thus perhaps no surprise since the macro data reflect the
aggregation of multiple underlying factors.
To separate the various channels, one could go to firm-level, micro data and use actual
financial statements (see Forbes (2004), and Claessens, Tong, and Wei (2012)).3 For the current
euro crisis, however, firm-level evidence is limited, mainly because firm-level performance data
on indicators such as profitability are released at low frequency with a long lag. Moreover,
individual bank-level data on indicators such as exposure to affected countries are often missing,
making analysis of specific channels difficult. And details on how policy measures are
implemented are often lacking. The lack of suitable data in turn prevents the examination of
actual responses of firms to the crisis and specific policy measures.
3 Forbes (2004) studies how the 1997-98 Asian and Russian crises spread to other markets and Forbes (2012) analyze how the current euro crisis spread. Claessens, Tong, and Wei (2011) examine how the 2007-2009 crisis affected firm performance and how various linkages propagated shocks across borders, by using accounting data for 7722 non-financial firms in 42 countries. There has been more analysis of the drivers of the recent trade retrenchment in 2008-2009, also using firm or sector level data (e.g., Alessandria et al (2010), Behrens et al (2010), Bems et al (2010), Levchenko et al (2010)). And Duchin, Ozbas and Sensoy (2010) examine quarterly US investment from Q3, 2007 to Q3, 2008.
5
We overcome the lack of actual firm and bank data and policy measures by using firm-
level stock price data and key event dates at which policy changes were announced, as well as
benchmark characteristics of firms. Since stock prices are forward-looking, they can be expected
to reflect the markets’ reactions as to how firms may be affected by policies announced. And the
benchmark characteristics allow one to trace the channels through which firms are affected. This
approach has been used to investigate in similar way to address these types of questions, as in
Tong and Wei (2011), which examined the cross-country impact of the US subprime crisis.4
We focus our analysis on four key events during the euro crisis and the related financial
market responses. One is May 10, 2010, when the European Financial Stability Facility was
established. This event was widely regarded as positive, with general, albeit not uniform
increases in stock prices and an appreciation of the euro.5 The second period is from June 8 to 10,
2011, when there appeared to be public disagreements among core euro-zone countries on the
private sector participation in the resolution for Greek crisis, which created large turbulence in
global financial markets.6 The third event is July 19-21, 2011, when leaders of the euro zone
announced the terms of the second bail-out loan to Greece of €109 billion and the voluntary
participation of private creditors. This agreement was welcomed by markets, in part because it
eliminated some of the uncertainty generated by the contrasting public positions of the German
4 They show evidence of liquidity crunches across emerging market economies by reporting that stock prices declined more for firms intrinsically more dependent on external finance for working capital. 5 Stock market indexes for periphery and core euro-zone countries increased by 10% and 8% respectively, while the euro appreciated on May 10, 2010 by 2% against the dollar. 6 On June 8, 2011, German Finance Minister Schäuble called for a Greek debt rollover into 7-year maturities. But on June 10, ECB President Trichet ruled out ECB participation in any debt rollover constituting default. Analysts noted the entrenched stand-off, and were unsure about the Greece crisis resolution. From June 7 to 10, the stock market indexes for periphery and core euro-zone countries decreased by 2.3% and 1.3% respectively, while the euro depreciated by 2.2%.
6
government and the ECB about private participation in the program.7 The fourth event is Oct 25-
27, 2011 when the EU forged the Greek bond deal of a fifty percent haircut on Greek bonds, also
boosting financial markets.
We examine whether and how the policy measures (or reversal thereof) at these key event
dates affected firm-level stock returns in the euro-zone and other countries. We do this for 3045
firms in 16 countries. For the May 10, 2010 event, we find that stock prices particularly
increased for more financially–constrained firms and in countries where banks had large pre-
crisis claims on peripheral euro-zone countries. Stock prices also increased significantly for pairs
of sectors and countries with heavy pre-crisis trade exposure to peripheral euro-zone countries,
particularly so for non-euro-zone countries, possibly as they benefited from the concurrent euro
appreciation. For the June 8-10, 2011 event, we find effects like those of May 10, 2010, but with
opposite signs: financially-constrained firms in countries with more exposed banks suffered
more as did firms in sectors that exported more to the peripheral countries. And for the July 19-
21, 2011 event, we find, like for the May 2010 event, that stock prices increased more for non-
financial firms with high external financial dependence and from countries with larger banking
exposure to peripheral euro countries. Finally, for the Oct 25-27 event, we find significant results
for financial channels similar to the July 19-21 event.
The main results are very robust. They carry through when we perform weighted
regressions to control for differences in sample size across countries and when we analyze
abnormal stock returns. The financial channel becomes even stronger when we focus on firms 7 We use as the event window July 19 to 21, 2011, as the agreement became partially known before the announcement in the evening of July 21 (e.g., at about 2pm on July 21, the draft agreement was already published by the Telegraph). Capital markets partially anticipated the agreement starting July 19 due to two pieces of news: i) a comment of Mr. Ewald Nowotny, governor of the Austria’s Central Bank, that a short-term selective default situation would not have major negative consequences, appearing to signal a softening of the ECB position about default scenario; and ii) reports on July 20 that euro-zone policymakers requested a delay of the euro-zone Summit in order to agree on private participation in the bail-out package.
7
from the EU only, suggesting that EU policy makers were very focused on assisting their firms.
And the results carry through when we include various control variables, such as proxies for
demand channels and movements in countries’ sovereign CDS spreads. Moreover, results are
preserved when we use bank exposure to public sectors in Greece, Iceland and Portugal only
(rather than exposures to all sectors), suggesting that sovereign risks importantly drove financial
spillovers and policy responses.
Collectively, our findings confirm that the European sovereign debt crisis spilled over to
the real economy in other countries mostly through financial channels and only somewhat
through trade channels, and more so for EU firms. And they show that policy measures at
various dates mainly helped (or failed) to support creditor banks and mitigate the adverse effects
on domestic financing conditions in core countries. These results show that policy makers
considered reducing cross-border financial spillovers among closely-integrated countries the
most important to preserve the benefits from integrated financial markets and a single currency.
Our paper relates to studies on pre-crisis euro-zone integration since it highlights the
possible costs of and risks in a unified currency zone during periods of financial stress. Some of
these studies focus on how a common currency influences financial integration (e.g., Frankel and
Rose (2002), Codogno et al (2003), Manganelli and Wolswijk (2004), and Sgherri and Zoli
(2009)). These papers document how sovereign bond spreads converged among euro countries
between 1999 and 2008, with the decline in spreads associated with increased international
market liquidity and risk diversification, but little with country-specific factors, such as public
debt. On the channels of integration, Kalemli-Ozcan et al. (2010) find that the euro’s impact on
financial integration is mainly through the elimination of currency risk, but not through trade.
8
Bris, Koskinen and Nilsson (2009) find that the euro increased corporate valuation more for
firms from euro countries with less credibility in their previous exchange rate policy.8
Our paper also relates to the literature on links between sovereign and private
borrowings. Earlier studies documented negative “spillover” effects of sovereign credit risk on
firms’ access to international capital markets, mainly for emerging markets (e.g., Ferri et al
(2001), Borensztein et al (2007), and Arteta and Hale (2008)).9 So far, this literature has focused
largely on the effects of government’s actions on corporations in their own country. Our paper
shows that sovereign crises can also affect foreign firms with financial and trade linkages with
the countries in crises, and shows the specific role of a currency union.
Earlier studies of the euro crisis have focused on the evolution of risk in the banking
sector and its spillovers onto sovereign sectors (Eichengreen et al (2009) and Mody (2009)). In
this paper, we focus instead on the channels through which sovereign risk is transferred to the
non-financial sector, studying how creditor banks can work as amplification channels.10 Our
paper also relates to the recent literature on crisis contagion through equity markets. For instance,
Bekaert et al (2011) analyze the transmission of the 2007-2009 financial crisis by examining
country-industry equity portfolios in 55 countries.11 They did not study the Euro crisis, however,
which started only in 2010. We also explore higher-frequency (daily) movements at the firm
level, which allows us to more directly identify the effects of policy announcements. Finally, our
paper relates to Horvath and Huizinga (2011), who perform an event study of the May 2011
8 Mainly countries that devalued during the Exchange Rate Mechanism crisis of 1992/93: Finland, Italy, Ireland, Portugal, and Spain. 9In this literature, the main channels through which governments may transmit credit risks to the private sector are: reduced public spending, increases in taxes, and capital controls. These government actions can affect firms’ expected returns, reduce their collateral value, and increase firm-level borrowing costs. 10 Related work on cross-border banking spillovers but using aggregate data, is Kaminsky and Reinhart (2003), who studied how a common lender propagated problems across multiple countries during the East Asian crisis. 11 Hau and Lai (2011) also examine the role played by equity funds in the propagation of the 2007-2009 crisis.
9
ESFS announcement. Their focus, however, is on the effects on banks’ share prices, bank CDS
spreads and sovereign CDS spreads, and whether the EFSF benefitted banks or PEC-sovereigns.
The rest of the paper is structured as follows. We describe our data and methodology in
Section 2. Section 3 presents results for the four key events during the euro crisis. Section 4
reports results for robustness check of our main results. Section 5 then concludes.
2. THE FRAMEWORK AND DATA
Building on the existing literature, we aim to distinguish, by using firm-level stock price
data, the transmission channels through which the crisis in peripheral euro countries spilled over
to the rest of the world. We examine two channels through which the crisis may have spilled
over: a financial channel and a trade channel. We employ a consistent framework to distinguish
the impacts of these two channels. To isolate transmission through the finance channel, we make
use of the following idea: if the availability of credit plays an important role for firm
performance, a shock to the supply of external financing should be reflected in the performance
of those firms that rely more on external finance (for investment) relative to those firms that rely
less on external financing. Similarly, if trade were to be an important factor, a shock to demand
leading to a change in imports should be reflected in the performance of those firms that rely
more heavily on exports to peripheral euro countries relative to those firms that rely less on such
exports. And markets should reflect performance differences in firms’ stock prices whenever
there is news (positive or negative) about the supply of external financing or trade prospects.
10
2.1 Basic Specification
The basic empirical strategy is to check whether ex ante classifications of firms in terms
of their intrinsic characteristics – degree of financial dependence and exposure to trade - help to
explain changes in their stock price performance following key events in the European sovereign
debt crisis. To proxy the intrinsic financial dependence, we use the approach of relying on the
sector characteristics of U.S. firms, which are arguably exogenous to our sample of firms (see
Rajan and Zingales, 1998; note that we do not include U.S. firms in our regressions). And for
trade linkage, we use pre-crisis actual trade exposures at the country-sector level. Specifically,
our empirical model is given by the following equation:
(1) i, j,k j j,k i,k, j i,k, jStockReturn = * FinancialDependence + *TradeLinkage +Control + e
where i stands for company, j for sector, and k for country. Note that this is a pure cross-sectional
regression for each key event in the European sovereign crisis and that the key regressors are
pre-determined (in 2006). We add firm size (log assets in US dollar) as our base control variable.
We start by assuming the same β and λ for all countries in order to estimate average
effects, but next allow for variations across countries. To study how the pattern of pre-crisis
financial exposure to peripheral euro countries affects the extent of a liquidity crunch, we
consider the interaction between a country’s financial exposure and its firms’ dependence on
external finance. In other words,
(2) k 1 2 * kFinancial Exposure
where Financial Exposurek is country k’s banking sector exposure to peripheral euro
countries. The slope coefficient, β2, then captures the extent to which financial exposure affects
the severity of the external-financing supply shock.
11
Related to the trade channel, we include an interaction term of trade linkage with the
Euro dummy. That is,
(3) 1 2 *k kEurozone
The slope coefficient, λ2, then captures the extent to which the severity of the trade shock
depends on euro-zone membership.
2.2 Events Selection
There certainly have been many events related to European sovereign crisis between
October 2009 (the start of the Euro crisis) and December 2011. Of these, we choose in the
following way four key events to examine the spillover channels. We started with examining the
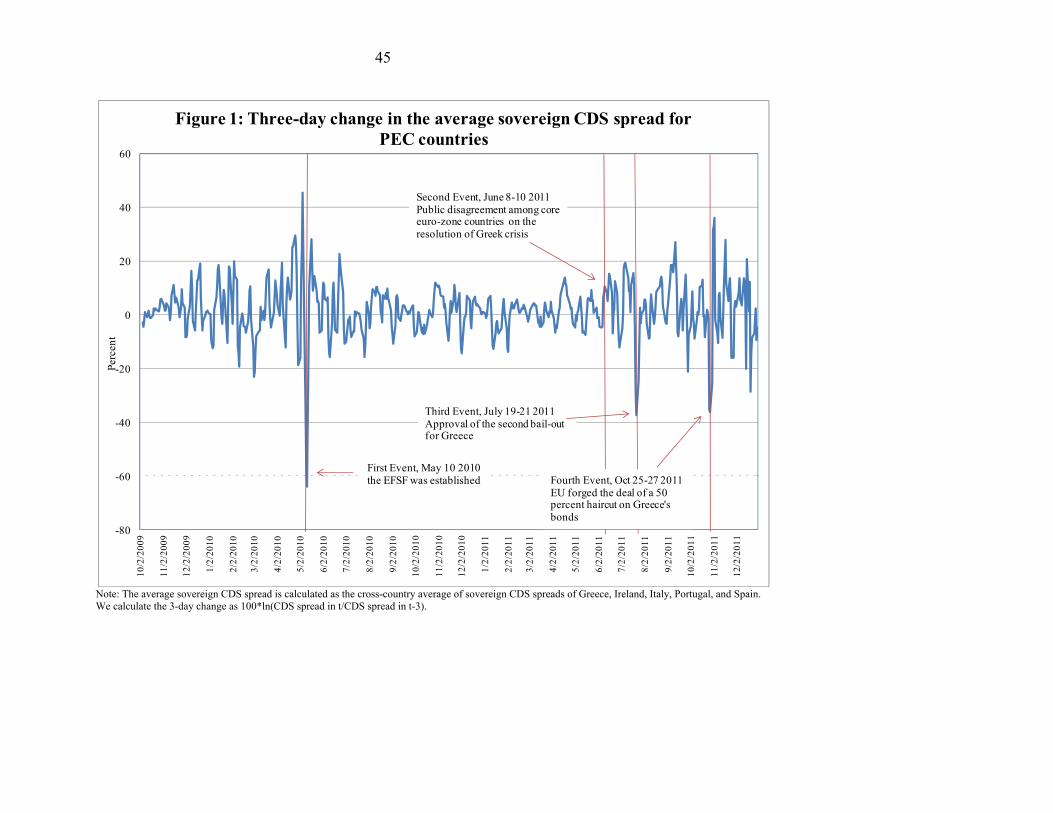
three-day change in the average sovereign CDS spreads for the PEC countries. (Note that we are
not testing whether events related to European sovereign crisis affect the sovereign CDS spread
of PEC countries; rather we examine how these events affected firms in other countries. As such,
there is no obvious selection bias in using this spread to select events.) As seen in Figure 1, over
the period from October 2009 to December 2011, the three largest drops in the spread occurred
on May 10, 2010, July 21, 2011, and October 27, 2011. Hence we selected these three events. As
for the second event (June 8-10, 2011), the average sovereign CDS spread increased by 10
percent during a 3-day window, a large increase after a relatively low volatility period from July
2010 to May 2011.12 The second event can thus been seen as a major negative event.
For these four events, we further confirm that they satisfy the following criteria: i) news
of the event was on the front page of the Financial Times and the Wall Street Journal; ii) the
12 Similar results are found if a one-day or a two-day change in the average sovereign CDS spread is calculated.
12
event was the major news during the time-window (i.e., no other major news from world markets
occurred during or just before that period); and iii) the event was not highly anticipated (for
instance, there was no major leakage of the news in the media related to the event’s timing or
magnitude). Also, since there was little prior change in the average sovereign CDS spread of
PEC, we are confident that these four events were not fully anticipated by the market.
2.3 Key Data
We describe here the definitions of our dependent variable, the change in stock price, and
the two sectoral benchmark indicators for external financing and trade sensitivity. We also
discuss data used to measure the linkages of countries with peripheral euro countries.
Percentage change in stock price. The stock price index is from Datastream and is the total rate
of return index, i.e., adjusted for dividends, and action such as stock splits and reverse splits.
Financial dependence index. We construct a sector-level proxy of a firm’s intrinsic dependence
on external finance for investment following a methodology of Rajan and Zingales (1998):
(4) ,capital expenditures - cash flow
Dependence on external finance for investment = capital expenditures
where Cash flow = cash flow from operations + decreases in inventories + decreases in
receivables + increases in payables. All the numbers are based on U.S. firms, which are judged to
be least likely to suffer from financing constraints (during normal times) relative to firms in other
countries. While the original Rajan and Zingales (1998) paper covers only 40 (mainly 2-digit
SIC) sectors, we expand the coverage to around 110 3-digit SIC sectors.
13
To calculate this benchmark, we take the following steps. First, every firm in the
COMPUSTAT USA is sorted into one of the 3-digit SIC sectors. Second, we calculate the ratio
of actual dependence on external finance for each firm from 1990-2006. Third, we calculate the
sector-level median from firm ratios for each 3-digit SIC sector that contains at least 5 firms. The
median value is then chosen to be the index of demand for external financing in that sector.
Conceptually, the Rajan-Zingales index aims to identify sector-level features, i.e., which sectors
are naturally more dependent on external financing for their business operation. The index could
be seen as a “technical feature” of a sector, almost like a part of the production function. It does
not consider which firms are more or less liquidity constrained within a sector.
Trade Exposure. Trade exposure captures a country’s exports to peripheral euro countries
(Greece, Ireland, Portugal, Italy and Spain). To construct this variable, we use data on bilateral
exports at the 4-digit SIC sector-level for year 2006. Then trade exposure is defined as:
, ,(5) j k cg
Sector j's total exports from country k to country cgTradeExposure =
(Sector j s total exports from countr' y k)
for exports of sector j in country k to country group cg (peripheral euro countries). Data for 2006
are retrieved from the United Nations Commodity Trade Statistics Database (UN Comtrade).
Bank Lending Exposure. Banking lending exposure captures the pre-crisis linkage of country k
with peripheral euro countries through credit exposure. To construct this variable, we use
information on the “consolidated foreign claims by nationality of reporting banks, immediate
borrower basis”, as published by the Bank of International Settlements (BIS), for the fourth
quarter of 2006. We then calculate a creditor country’s relative banking system exposure as:
(6) k,cg
Total foreign claims of country k on country cg
Total foreign claims Bank E
of coxp
unosure =
try k
14
where k is a creditor country and cg is the debtor country group of interest, such as peripheral
euro countries. We use a relative measure to account for the fact that some countries are more
active in international lending. Our sample includes a total of 16 reporting countries.
Control Variables. As noted, we include variables to control for basic firm characteristics. One is
firm size, measured by the log of book assets in US dollars. Note that size may also proxy for the
degree to which the firm is active internationally through trade and FDI in periphery countries.13
2.4 Key Hypotheses
With this framework and data, we aim to test the following three hypotheses:
H1: News about the Euro crisis will change the stock returns of financially-dependent
firms more. That is, β >0 when there is positive, and β <0 when there is negative news.
H2: News about the Euro crisis will change the stock returns of financially-dependent
firms more in countries with larger bank exposure to peripheral euro countries. That is, β2>0
when there is positive, and β2<0 when there is negative news.
H3: News about the Euro crisis will affect the stock returns more of firms with more
trade exposure to peripheral euro countries. That is, 1 >0 when there is positive, and 1 <0 when
there is negative news.
H4: News about the Euro crisis will affect the stock returns of firms from euro-zone
countries with trade exposure to peripheral euro countries differently of firms from non-euro
zone countries. Specifically, if the bailout helps stabilize the crisis, it may cause the euro to
13 We also included a proxy for demand sensitivity as an additional control variable to capture a firm’s relative sensitivity to a contraction in aggregate consumer demand. However, this variable is always insignificant and therefore did not include it in the reported estimations.
15
appreciate and consequently reduce the competitiveness of euro-area exporting firms. This would
mean that 2 <0 when there is positive news and 2 >0 when there is negative news.
2.5 Basic Statistics
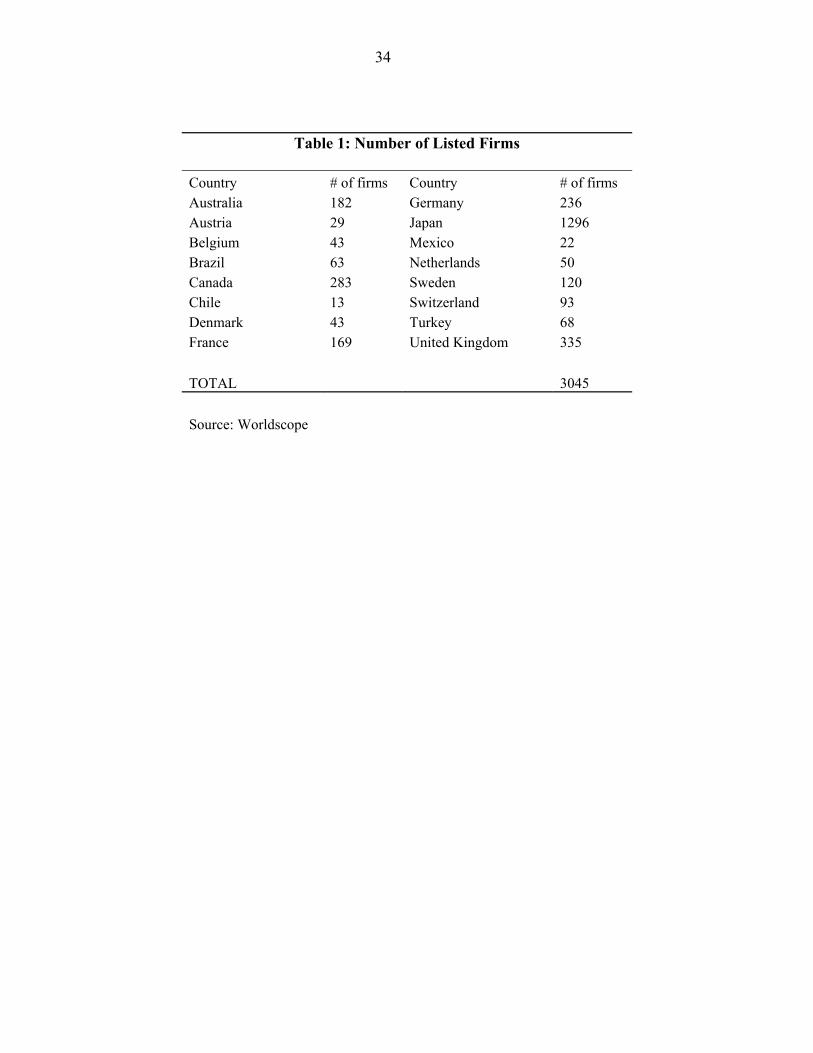
Table 1 shows the number of non-financial firms included in the sample, classified by
country of origin. Our sample includes 3045 firms from 16 advanced and emerging economies.
We select these countries as they have BIS data on cross-border bank claims.14
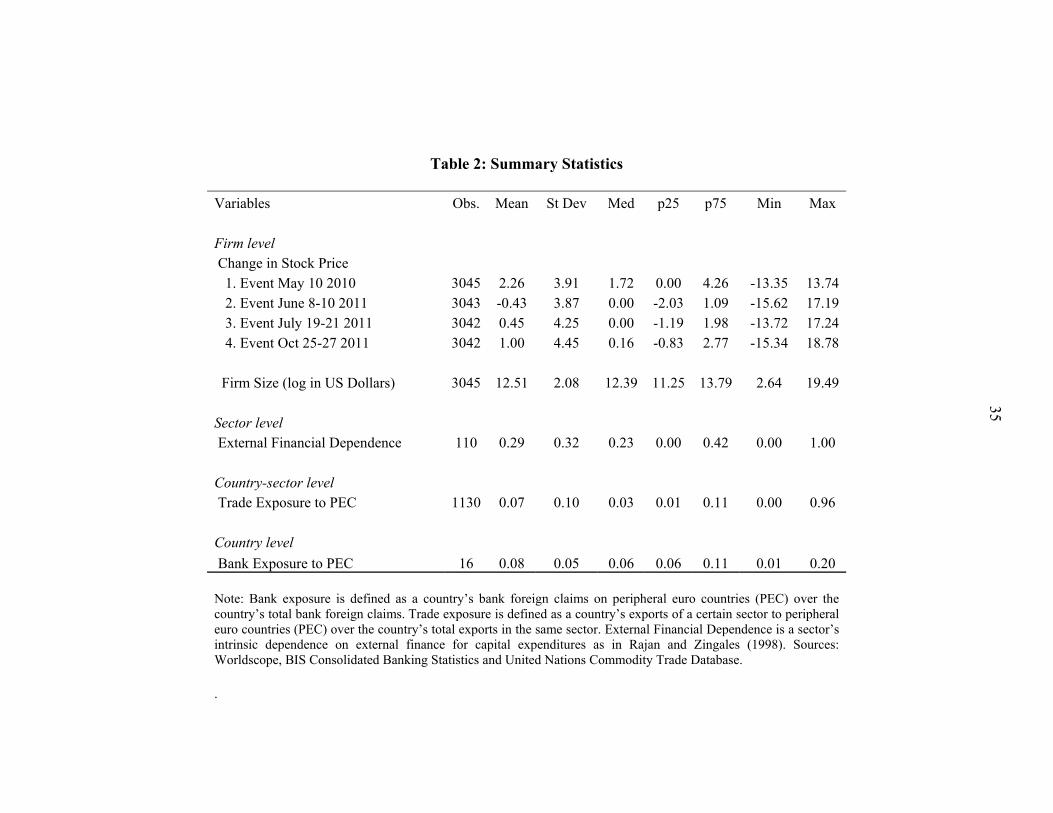
Table 2 reports summary statistics for our key dependent and explanatory variables. The
statistics show that, on average, the stock prices of individual firms increase at the
announcements of the €750 billion bail-out fund for countries in crisis (May 10, 2010), the
second bail-out for Greece (July 19-21, 2011), and the new terms for the second bail-out for
Greece (October 25-27, 2011). In contrast, firms’ stock prices dropped in general when there was
public disagreement among core euro countries on private sector participation in Greek
assistance (June 8-10, 2011). Table 2 also shows the heterogeneous response of prices to those
events: the change in prices ranges in May 2010 between -13.3 to 13.7 percent; June 2011 -15.6
to 17.19 percent; July 2011 -13.7 to 17.2 percent, and October 2011 -15.4 to 18.8 percent.
Table 2 also shows some of the heterogeneity in the firms we study, with large variations
in size. For example, the firm at the 75th percentage is eight times larger than that at the 25th
percentile. There is also much variation in our sectoral and country variables. For example,
external financing sensitivity varies between 0 and 1, with a standard deviation of 0.32. Trade
exposure to peripheral euro countries varies between 0 and 0.96 across sector-country pairs, with
14 We did not include US firms as they serve as benchmarks and may dominate the sample of firms.
16
a standard deviation of 0.1. Banking exposure to peripheral euro countries varies between 0.01
and 0.20 across creditor countries, with a standard deviation of 0.05. This makes these variables
good indicators to identify the channels by which the firm-specific responses in stock prices may
arise.
3. EMPIRICAL RESULTS
We first examine how various firm and sector features affect changes in firm’s stock
price around the announcement of the €750 billion bail-out fund (May 10, 2010). We present our
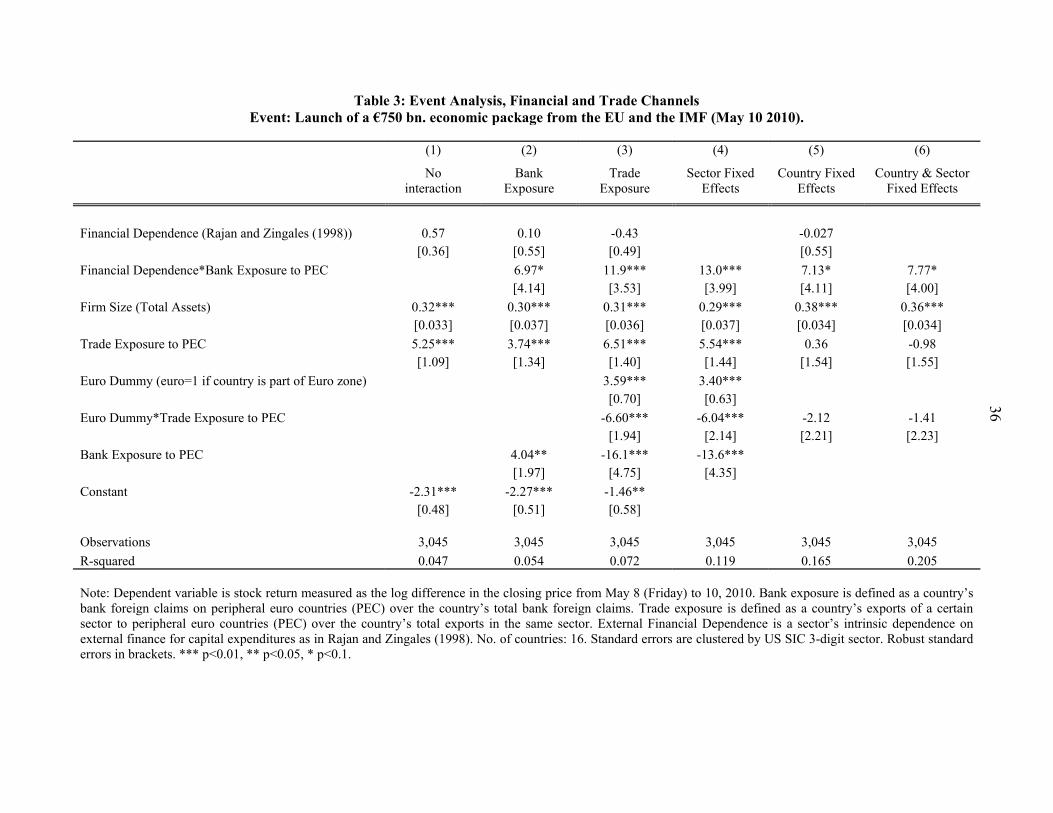
basic regression results in Table 3, which cluster standard errors at the US SIC 3-digit sector.15
In Column 1, we show that the coefficient on external financial dependence is positive,
albeit insignificant. This means that the event had more impact on firms from industries with
higher financing needs for capital expenditures. This suggests that the announcement led banks
to more willingly supply external financing to local firms as they had less concerns about their
balance sheets. We find strong evidence that the impact of the event is more pronounced for
large firms and firms with larger trade exposure to peripheral euro countries. This suggests that
the announcement of the bail-out fund implied improved expectations about the pace of the
recovery of aggregate demand in those countries. Therefore, large firms and firms from countries
and sectors that have larger trade linkages to peripheral euro countries stood to benefit more,
reflected in a large increase of their stock prices.
To evaluate the importance of the cross-border financial channel, we add the interaction
of the financial dependence index with country bank exposure in Column 2. We find this
15 R-squared values in our estimations are generally low. However, this is typical for event studies as it is hard to explain stock prices.
17
interaction to be positive and significant. That is, the stock returns are higher for firms with
higher natural external financial dependence located in countries whose banking systems are
more exposed to peripheral euro countries. This suggests that, as the creation of the €750 billion
bail-out fund was expected to enhance the value of claims on the peripheral countries, banks’
balance sheets were strengthened, which in turn allowed banks to more easily finance firms.
In Column 3, we explore further the importance of trade as a transmission channel. We
include in our regression a dummy variable “Euro dummy” which equals 1 if the country is part
of the euro-zone and zero otherwise. In addition, we interact the Euro dummy and the trade
exposure to peripheral euro countries. We expect differences between euro and non-euro-zone
countries in the importance of trade for two reasons. On the one hand, euro countries are more
closely integrated with peripheral euro countries through trade and financial linkages and these
firms and their stock prices could thus be expected to gain more at the time of the event. On the
other hand, since the euro appreciated around the time of the event, euro firms could be expected
to experience lower stock price movements as they did lose competitiveness at the same time.
We find the coefficient on the Euro dummy to be positive and significant, suggesting that
markets expected the policy measures to improve economic prospects in the euro zone.
However, the coefficient on the interaction between the Euro dummy and the country’s trade
exposure is significantly negative. That is, stock prices of euro-zone firms with trade exposure to
peripheral euro countries increased less than those of non-euro-zone firms with similar trade
exposure (the overall effect for euro-zone firms is actually about zero, 6.6 - 6.51). This could be
due to the adverse effect of the concurrent euro appreciation. So, while the policy measures
benefited firms from say both Japan and France that export to peripheral euro countries, as
18
reflected by the positive coefficient of trade exposure, because of the simultaneous appreciation
of the euro, this event benefitted Japanese exporters more than French exporters.
In Columns 4, 5 and 6, we include sector fixed effects, country fixed effects, and both
sector and country fixed effects, respectively, in order to control for unobserved characteristics at
industry and country levels (but then we drop the respective sector and country benchmark
characteristics). The main result is that the financial channel remains statistically very
significant: firms from industries with higher external financial dependence in countries whose
banking system is more exposed to peripheral euro countries tend to have larger stock price
increases in response to the event. With respect to the trade channel, we find the coefficient of
the Euro dummy to be positive and significant and the coefficient of the interaction between this
dummy and trade exposure to be negative (although, perhaps not surprising, it becomes
insignificant when country fixed effects are included). This result suggests that the euro-
appreciation effect becomes less important after controlling for country characteristics.
Based on the results in Column 6, the stock return of a firm from the “Manufacturing of
Medical and Surgical instruments” sector (with financial dependence at the 75th percentile) in the
United Kingdom (with bank exposure at the 75th percentile) was 0.22 percent higher than that of
a firm from the “Pulp, Paper, and Paperboard Mills” sector (with financial dependence at the 25th
percentile) in Canada (with bank exposure at the 25th percentile). The difference (0.22 percent) is
large compared to the average increase in stock prices (2.26 percent). In contrast, the trade
channel is neither statistically or economically significant.
In Table 4, we report the results of our estimations for the second event: public
disagreement among core euro-zone countries on the resolution for Greek crisis (June 8-10,
2011), which was generally perceived negatively by markets. In Column 1, we find a negative
19
and significant coefficient for external financial dependence, suggesting that firms from sectors
with larger external financial needs are, in general, more vulnerable to these kinds of negative
events, and therefore show larger drops in their stock prices.
In Column 2, we add the interaction between financial dependence and bank exposure to
peripheral euro countries. Again, the drop in stock prices is more pronounced for firms from
industries with greater financial dependence, particularly in countries whose banking systems are
more exposed to those countries. This suggests that these events led to concerns about the ability
of banks in creditor countries to continue to finance firms, especially those with greater external
financing needs. In addition, trade exposure is negative and significant in Column 2. That is,
firms from countries and sectors with larger trade linkages to peripheral euro countries were
thought to be more vulnerable, with their stock prices falling more.
In Column 3, we examine further the trade channel by including an interaction between
the Euro dummy and trade exposure. The coefficient for the Euro dummy is significantly
negative (-3.63), as is the coefficient of trade exposure (-5.08). The coefficient for the interaction
term is significantly positive (6.59), probably because the euro depreciation at the same time
improved the competitiveness of firms from the euro-zone over other firms.16 Consequently,
markets expected higher profits for euro-zone area firms compared to non euro-zone firms.
In Columns 4, 5, and 6 we include sector, country and both sector and country fixed
effects, respectively, to control for unobserved characteristics at country and industry levels. In
all specifications, we find the financial channel to be important in explaining the behavior of
stock prices around the event, with coefficients all negative and significant. In addition, and
different from the results in Table 3, trade exposure is negative and significant in all three
16 The overall effect of trade exposure is positive but insignificant for euro-zone firms (i.e., 1.51 = -5.08+6.59, with an F-test of 0.28).
20
specifications, and the coefficient on the interaction of trade exposure and Euro dummy is
positive and significant. The main message is that both financial and trade channels for
transmitted shocks from peripheral euro countries to the real sectors of other economies.
Based on Column 6 of Table 4, the stock price of a firm from the “Manufacturing of
Medical and Surgical Instruments” sector (with financial dependence at the 75th percentile) in
the United Kingdom (with bank exposure at the 75th percentile) falls 0.27 percent more than that
of a firm from the “Pulp, Paper, and Paperboard Mills” sector (with dependence at the 25th
percentile) in Canada (with bank exposure at the 25th percentile). This difference (0.27 percent)
is again large compared with the average fall in stock prices (0.43 percent).
For non-euro firms, the economic impact of the trade channel is similar to that of the
financial channel. Based on Column 6, the stock price of a firm from the “Manufacturing of
Equipment for Construction” sector in Switzerland (trade exposure at the 75th percentile of 9.9
percent) was 0.34 percent lower than that of a firm from the “Rolling, Drawing, and Extruding
Nonferrous Metals” sector in Australia (trade exposure at the 25th percentile of 0.6 percent). For
firms from the euro area, however, the economic impact of the trade channel is much less
important (actually it switches sign). For example, the stock return of a firm from the
“Production of Electronic Components” sector in the Netherlands (trade exposure of 18.5 percent
at the 75th percentile among euro countries) was only 0.08 percent higher than that of a firm from
the “Production of Industrial Inorganic Chemicals” sector in Belgium (trade exposure of 8.4
percent at the 25th percentile among euro countries).
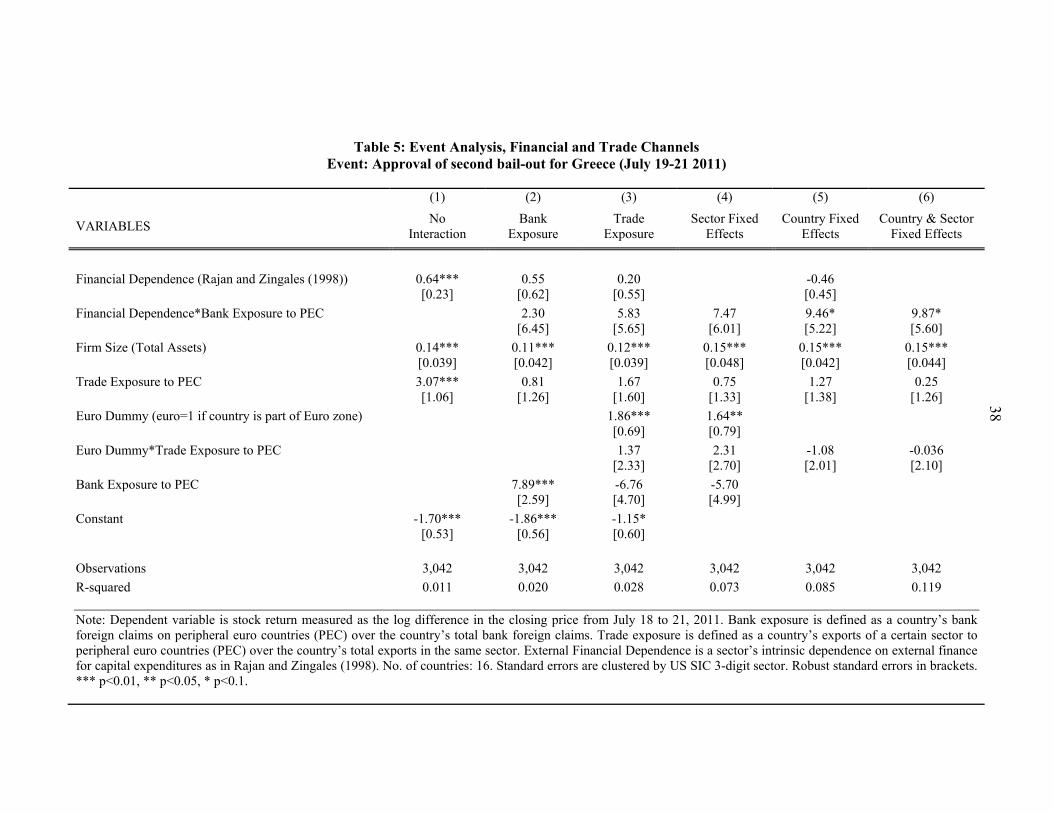
In Table 5, we report the results of our estimations for the third event, the approval of the
second bail-out package for Greece (July 19-21, 2011), which was generally perceived positively
by financial markets. Similar to the first event (the creation of the €750-billion bail-out fund), we
21
find positive effects for the financial channel in all specifications, and they remain significant
when we include country and sector fixed effects. With respect to the trade channel, we find a
positive and significant coefficient for the Euro dummy, suggesting that capital markets expected
this decision to improve economic prospects of the euro area especially. However, the interaction
term between trade exposure and the Euro dummy is insignificant, suggesting that, for this event,
the trade channel was not a key transmission mechanism.
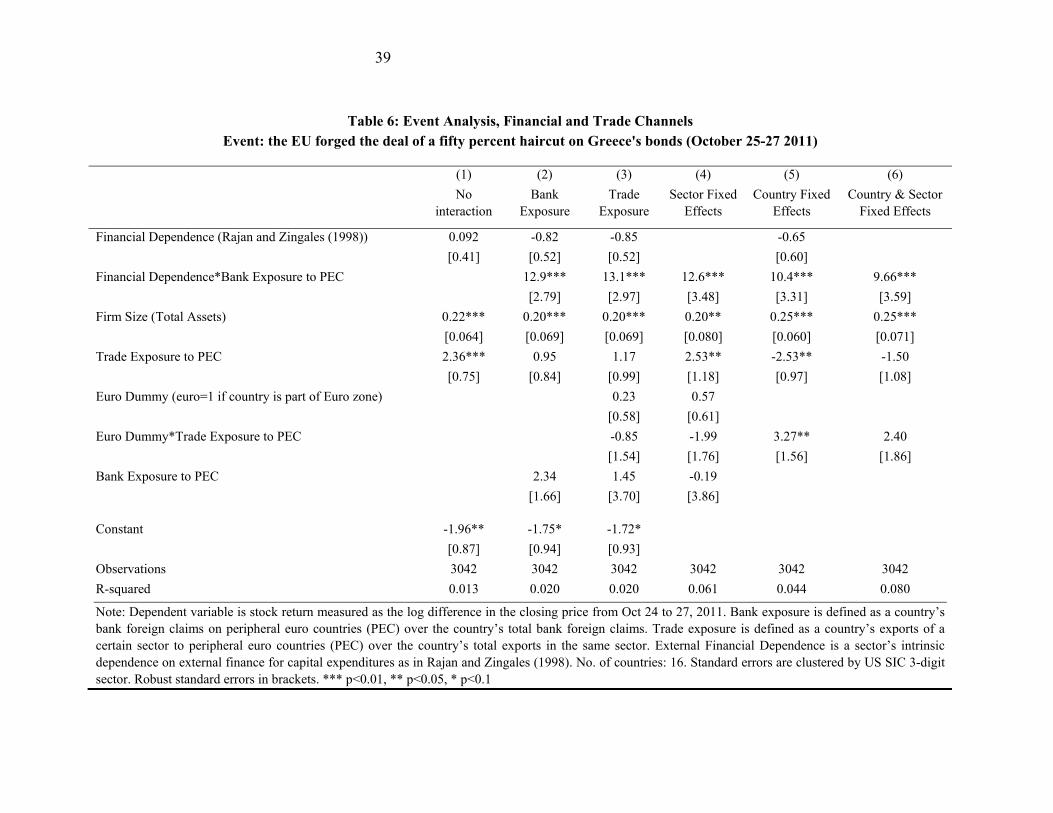
In Table 6, we report the results for the October 25-27, 2011 event. We use a 3-day
window, from the closing of Oct 24 to the closing of Oct 27, to take into account potential
leakage of news before the announcement the night of Oct 26.17 Similar to the first and third
events, we find positive effects for the financial channel in all specifications, which also remain
significant when we include country and sector fixed effects. With respect to the trade channel,
we find no consistent result for trade exposure to periphery European countries, suggesting that,
for this event, the trade channel was not a key transmission mechanism.
4. ROBUSTNESS CHECKS
In this section, we conduct some robustness checks, including examining an EU-only
sample, abnormal stock returns and performing weighted regressions. In addition, we revisit our
main results taking into account financial and trade exposure to only Greece, Ireland and
Portugal, and evaluating the financial channel using information of bank exposure to the public
sector.
17 Between October 25 and 26, there was some speculation about the participation of private creditors in write-offs and the level of the EFSF. Since the announcement was at the night of Oct 26, the window Oct 24 (closing) to 27 (closing) fully captures this event.
22
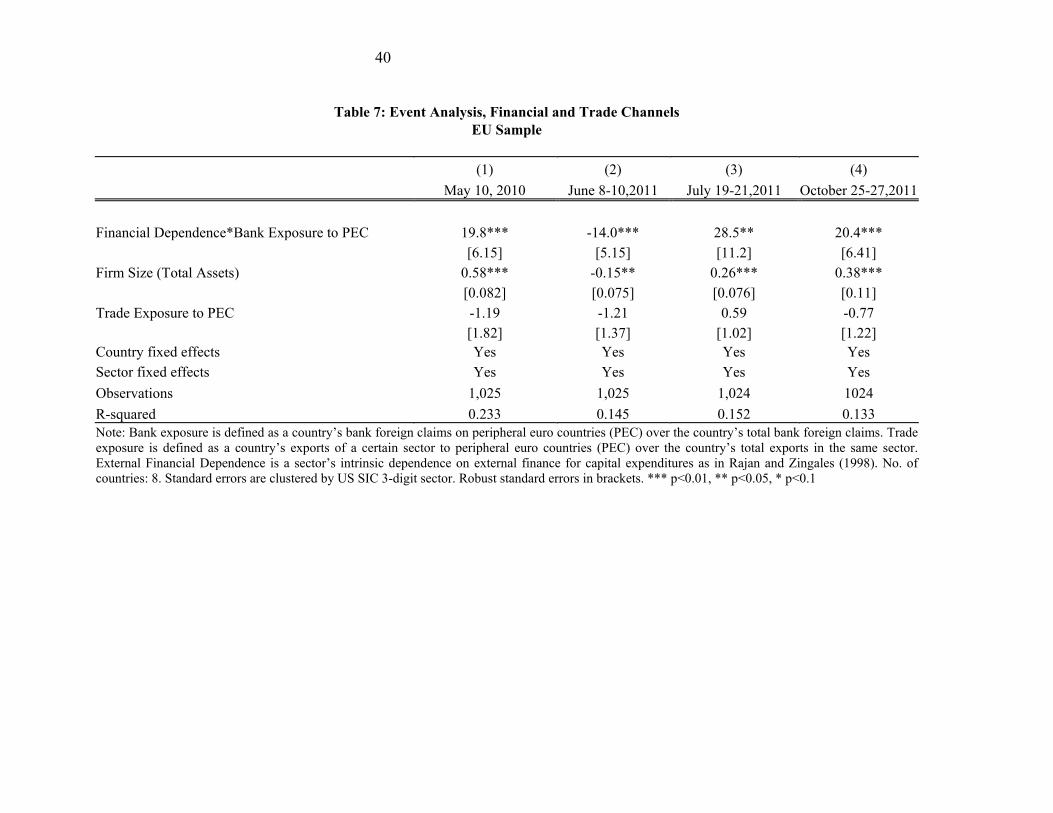
4.1 EU Sample
In Table 7, we repeat the analyses of Tables 3 to 6, but focus on non-financial firms from
the European Union, as these firms can be expected to be more affected by the events, both as
they have closer financial and trade links with the affected countries and as support may
disproportionally help their own banking systems.18 We report specifications that include both
country and sector fixed effects. Columns 1 to 4 report the results for the four respective events.
For the 1st event, May 2010, the interaction between financial dependence and bank
exposure is positive and significant. According to the results, the stock return of an European
firm from the “Manufacturing of Medical and Surgical instruments” sector (financial dependence
at the 75th percentile) in Germany (bank exposure at the 75th percentile among the euro area) is
0.66 percent larger than that of a firm from the “Pulp, Paper, and Paperboard Mills” sector
(dependence at the 25th percentile) in Austria (bank exposure at the 25th percentile). The
difference (0.66 percent) is large compared to the average increase in the euro area (3.4 percent).
Column 2 reports the results for the June 2011 event. In general, it confirms the financial
channel to be the main transmission channel of shocks from peripheral euro countries to the rest
of the EU: stock prices fall more for financially-constrained firms, especially in countries whose
banking system is more exposed to peripheral euro countries. In Column 3 and 4, we replicate
the analysis for the 3rd and 4th events. Again the interaction term between the financial
dependence index and the country’s banking system exposure is positive and significant.
The trade channel appears to be less important in transmitting shocks from peripheral
euro countries to the real sectors of other EU economies, as it is never statistically significant.
18 The countries included in this sample are: Austria (29 firms), Belgium (43 firms), Denmark (43 firms), France (169 firms), Germany (236 firms), Netherlands (50 firms), Sweden (120 firms), and the United Kingdom (335 firms).
23
Together, results suggest that the financial channel very importantly transmits shocks from
peripheral euro countries to other EU countries and that policy measures were most effective in
mitigating this channel.
4. 2 Abnormal Returns
To further evaluate the robustness of results, we conduct analyses using abnormal returns.
We construct abnormal returns employing the market model, which assumes a stable linear
relation between market and individual stock returns, and define abnormal returns as:
where i stands for company, j for sector, and k for country. We construct each firm’s beta
based on the correlation of weekly firm-level stock returns and local market returns. We then
construct each firm’s alpha as the average of the firm’s weekly average return minus the beta
multiplied by the average market return. When constructing abnormal returns, we use alpha and
beta estimated for normal times (i.e., year 2006) to avoid any impact of the crisis on the beta
estimations. We also winsorize the generated abnormal returns at the 1 percent level.19
In Column 1 of Table 8, we report results for the first event (May 2010). We find the
coefficient for the interaction between financial dependence and bank exposure to be positive
and significant, confirming the importance of the financial channel in explaining the behavior of
non-financial firms’ stock prices. In addition, Column 1 shows the coefficient for the interaction
term between trade exposure and Euro dummy to be negative and significant. Similar to Table 3,
this suggests that capital markets expected the policy measures to improve economic prospects in
19 As Alpha is constructed from weekly data, we use (1/5)*Alpha in constructing abnormal stock returns for the first event (May 2010), and (3/5)*Alpha for the second (June 2011), third (July 2011) and fourth event (October 2011).
24
the euro-zone, but euro-zone exporting firms benefited less, possibly due to the drop in their
relative competitiveness with respect to non-euro-zone exporting firms caused by the concurrent
euro appreciation. In Column 2, we examine the EU sample and again find financial dependence
interacted with bank exposure to have a positive coefficient, albeit insignificant.
In Column 3, we examine results for the second event (June 2011) using abnormal
returns. Similar to the results of Table 4, we find the coefficient for the interaction between
financial dependence and bank exposure to be negative and significant, suggesting that bank
exposure is an important transmission mechanism of this shock to non-financial corporations
around the world. In addition, we find that the coefficient of trade exposure is negative and
significant, confirming the negative effect that uncertainty regarding the public positions of
economic policymakers produced on stock capital markets’ expectations about economic
prospects in the euro zone. However, the interaction term between the Euro dummy and trade
exposure is positive and significant, suggesting euro-zone exporting firms to be less affected by
this shock, possibly as their competitiveness improved due to the concurrent depreciation of the
euro. In short, results confirm that both financial and trade channels are important mechanisms
for transmitting shocks from peripheral euro countries to the real sectors of other economies.
In Column 4, we reexamine the EU sample for the second event (June 2011). Again,
financial dependence interacted with bank exposure is significantly negative. In Columns 5 and
6, we investigate the third event (July 2011). Again we confirm our previous results of Table 5.
Finally, in Columns 7 and 8, we study the fourth event (Oct 2011). Again the earlier results in
Table 6 carry through. Overall, results with abnormal returns strongly support our earlier
findings for the general and EU sample.
25
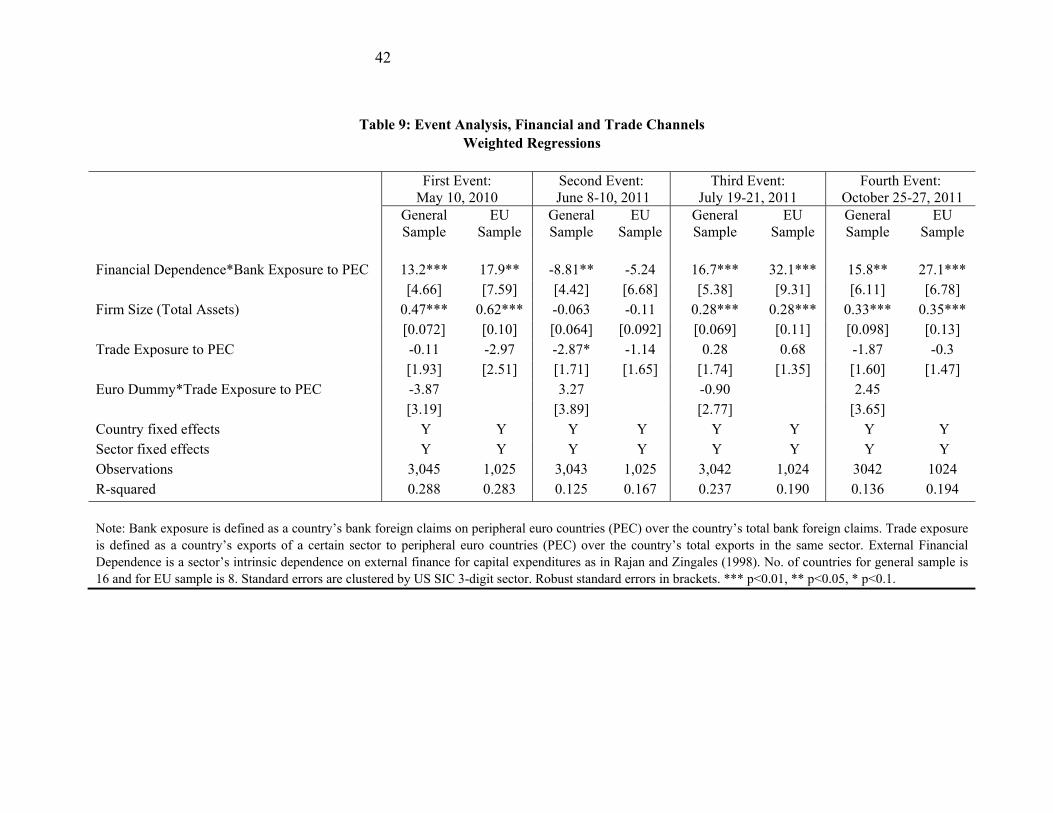
4.3 Weighted Regression
Our sample of non-financial firms is unequally distributed across countries (see Table 1).
To avoid our estimations to be biased due to overrepresentation of some countries, we next
conduct estimations considering the number of firms in each country. Specifically, we weight by
the inverse of the square root of the number of companies per country, which makes countries
overrepresented have less influence in the estimations. Overall, the weighted regressions confirm
the importance of the financial channel, but show the trade channel to be less pronounced.
Table 9, Column 1 shows the results of these weighted regressions for the first event
(May 10, 2010). As in Table 3, we find that the coefficient of the interaction term between
financial dependence and bank exposure to peripheral euro countries is positive and significant.
Moreover, we find the interaction term between the Euro dummy and trade exposure to be
negative (although it loses significance when controlling for country and sector fixed effects).
These results thus confirm our previous findings for this event. Column 2 focuses on the EU
sample and further confirms the role of financial exposure.
Column 3 reports the results of these weighted regressions for the second event (June 8-
10, 2011). We find similar results as in Table 4: the financial channel is negative and significant.
This result suggests that this event produced larger stock price falls for companies that are more
financially constrained in countries whose banking system is more exposed to peripheral euro
countries. Results carry through when we limit the analysis to the EU sample (Column 4).
Columns 5 and 6 report the results for the third event (July 19-21, 2011). Similar to the
results in Table 5, we find the financial channel to be the key transmission mechanism of this
event to countries around the world and inside the EU. The results carry over when we examine
the fourth event (Oct 25-27, 2011) in Columns 7 and 8.
26
4.4 Additional Robustness Checks
So far we have focused on the financial and trade channels. One natural question is
whether results carry through if we also control for a demand channel. We therefore classify
sectors as largely producing durable, semi-durable or non-durable goods to proxy for their
sensitivity to demand. The classification follows Braun and Larrain (2005) and Raddatz (2006)
and is based on the Bureau of Economic Analysis’s Industry Accounts. Durable goods are
assigned a 1, semi durable goods a 0.5 and nondurable goods a 0.20 We then include this variable
and its interaction with bank exposure to PEC to control for the demand channel.
Also, we focused so far on how bank exposure to PEC affects stock prices in home
countries. Another channel by which firms could be affected is through the sovereign debt in the
home country, e.g., as the creditor countries assume some (contingent) liabilities. We hence
include the change of sovereign debt credit default swap (CDS) spread over the event periods as
an additional control variable. Moreover, we include its interactions with financial dependence
and with durable goods. The specifications are otherwise similar to Table 8 (abnormal stock
return for both the general sample and the EU sample).
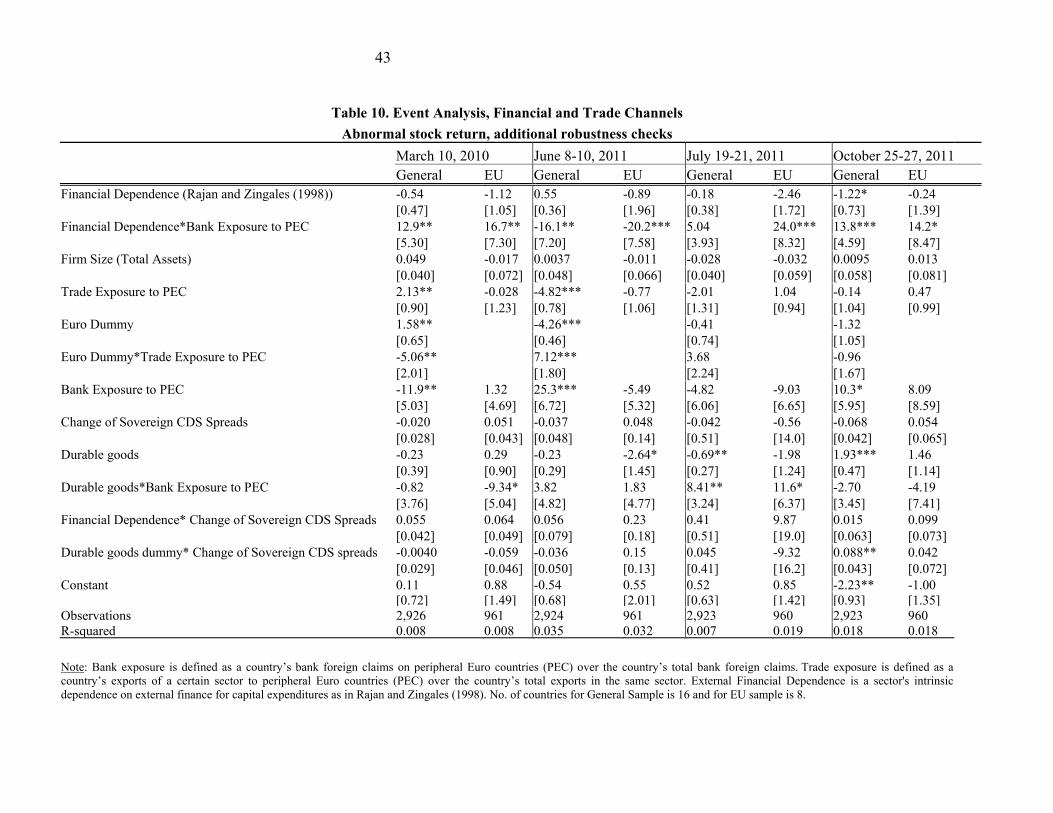
We find (Table 10) that the durable goods variable interacted with bank exposure to PEC
is mostly insignificant, although it is significantly positive in the third event for both the general
and EU samples. The interaction of sovereign CDS spread with financial dependence is not
significant for any specification. The interaction of sovereign CDS spread with durable goods is
also insignificant for most specifications. These findings suggest that the four events do not
20 The semi-durable industries are clothing, footwear, and printing. Regression results are similar is we classify these as either durable or non-durable.
27
affect stock prices through effects on home countries’ sovereign debt. Most importantly, bank
exposure to PEC interacted with financial dependence, our key explanatory variable, remains
significant. And in some cases, it is even larger and more significant compared to Table 8.
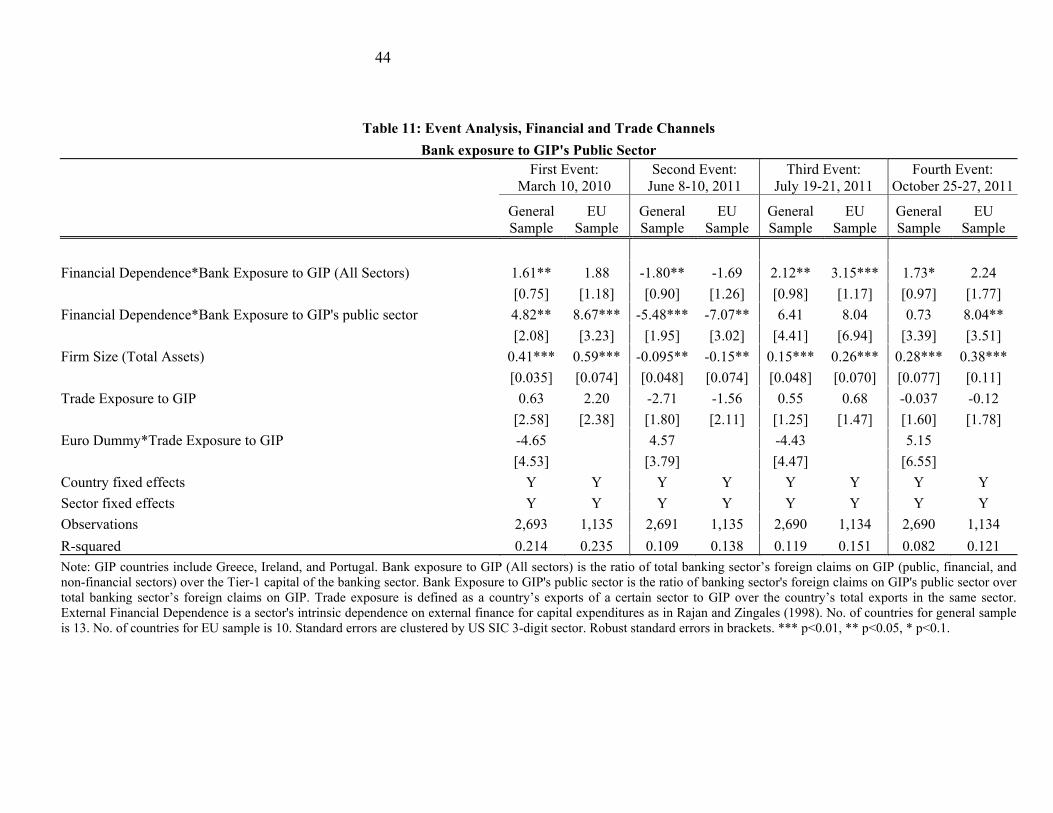
4.5 Exposure to Greece, Ireland and Portugal
So far, policies have largely focused on dealing with the (sovereign debt) problems of
PEC.21 To evaluate the robustness of our main results, we redo our analysis evaluating how bank
and trade exposures to Greece, Ireland, and Portugal (GIP) only impacted the stock prices of
non-financial firms. (We are interested in these three countries, as they actually have required
assistance from the European Union and the International Monetary Fund). We include two
variables to measure bank exposures to GIP: i) bank exposure to all sectors, defined as the ratio
of creditor country banking sector’s foreign claims on GIP to its Tier-1 capital; ii) the share of
bank exposure to GIP’s public sectors, defined as the ratio of the creditor country banking
sector’s foreign claims on GIP’s public sectors to its overall foreign claims on GIP. The
(confidential) data for banks’ consolidated ultimate-base foreign claims on GIP’s public sector
come from the BIS and the data for Tier-1 capital come from Bankscope.22 Due to availability,
data used for these calculations are based on Q2, 2009.
In Table 11, we show the results for our regressions using bank exposure to GIP for firms
in the general sample and the EU sample respectively.23 Column 1 (general sample) shows that
for the first event, May 2010, the interaction term between financial dependence and bank 21 In particular, the four events analyzed mainly relate to actions (or lack thereof) by EU policymakers as regards the Greek debt crisis, but those can be considered as indicative of approaches to the problems of other Euro-zone economies in distress, such as Ireland and Portugal, which also undergo EU(-IMF) programs. 22 See Cerutti (2011) for more details. 23 Due to data limitations, we drop five countries (Australia, Brazil, Chile, Mexico and Turkey), but for this test include Italy and Spain, which gives 13 countries.
28
exposure to GIP is positive and significant, suggesting finance to be an important transmission
mechanism. Moreover, the interaction of financial dependence and the share of bank exposure to
the GIP public sectors is positive and significant, suggesting that exposure to public sector is a
key component behind the transmission. Note that we do not include bank overall exposure to
GIP, bank exposure to GIP public sector or financial dependence as control variables, as they are
already fully covered by our country and sector fixed effects. In Column 2, we examine the EU
sample only. Reassuringly, financial dependence interacted with bank exposure to GIP’s public
sector is again positive and significant, and about twice as large as in Column 1.
Columns 3 and 4 report the results for the second event, June 2011. In Column 3 (general
sample), we find that the interaction term between financial dependence and bank exposure to
GIP is negative and significant. Moreover, the interaction of financial dependence and the share
of bank exposure to GIP public sector is also significantly negative, i.e., firms from countries
with larger bank exposure to GIP’s public sector display larger drops in prices. In Column 4, we
focus on EU firms, and the interaction term between financial dependence and bank exposure to
GIP’s public sector becomes even more pronounced.
Columns 5 and 6 report the results for the third event, July 2011. For both general and
EU samples, we find the interaction terms between financial dependence and bank exposure to
GIP (All Sectors) to be positive and significant. The interaction terms between financial
dependence and bank exposure to GIP’s public sector are still positive but are now insignificant.
One potential explanation for the weaker effect in late 2011 is that while markets’ concerns
focused initially on the public debts of GIP, these concerns extended later on to these countries’
financial and private sectors, reducing the relative sensitiveness to GIP’s public debt.
29
When we examine the fourth event, October 2011 in Columns 7 (general sample) and 8
(EU sample), we find results comparable to those for the third event.
5. CONCLUSIONS
In this paper, we study how the (ongoing) euro crisis affected global corporate valuation,
particularly for EU firms, and how policy interventions may have mitigated (or not) spillovers.
We analyze two channels through which the crisis may have affected firms: a financial channel
and a trade channel. To investigate the financial channel, we ask the question: if we classify
manufacturing firms into different baskets based on their ex-ante sensitivity to shocks to external
financing (in terms of investment needs), does this classification help us to explain the ex-post
stock performance of these firms? Similarly, if we classify these firms based on their ex-ante
exposure to trade, do firms in different groups perform differently during the crisis? To
investigate the role of cross-border linkages, we include country-level financial linkages with
peripheral euro-zone countries and euro-zone dummies, and interactions with our proxies for the
financial and trade channels, into our regression framework.
We conduct our tests by examining stock price responses to four key events during
2010-2011 for 3045 non-financial firms from 16 countries. We find that the crisis had a larger
impact on firms with greater ex-ante financial constraints, and particularly so in creditor
countries more financially exposed to peripheral euro countries through bank claims. Trade
linkages with periphery euro-countries also played a role, but more minor, by affecting export
demand, with differential effects across exporting firms in euro vs. non-euro areas, possibly
because of the effects of euro exchange rate changes vis-à-vis third (non-euro) countries.
30
On balance, we conclude that policy makers did take into account potential effects on
both the soundness of their local banks as well trade with peripheral euro countries when they
planned (or reverted course on) various support measures. From the perspective of saving the
euro, it appears most important, at least in the eyes of financial markets, to address spillovers
through cross-border banking exposures.
It is important to point out, though, that the current paper is not meant to be a
comprehensive assessment of the welfare effects of the euro as a single currency or of the types
of support measures undertaken or being considered. To do that, we need to evaluate not only the
effects of the support measures announced on firms, but also the costs of the measures, such as
their effects on households and others through, say, higher tax burdens. Furthermore, there can
be differences between short and long-run benefits and costs of the euro and support measures
used, which would require analyses of both tranquil and crisis times to make a full assessment.
We leave these questions as fruitful topics for future research.
31
References
Alessandria, George, Joseph Kaboski, and Virgiliu Midrigan, 2010, “The Great Trade Collapse of 2008–09: An Inventory Adjustment?” IMF Economic Review 58, pp. 254-94.
Arteta, Carlos, and Galina Hale, 2008, “Sovereign Debt Crises and Credit to the Private Sector,” Journal of International Economics, Vol. 74, No. 1, pp 53-69.
Behrens, Kristian, Gregory Corcos, and Giodarno Mion, 2010, “Trade Crisis? What Trade Crisis?” mimeo LSE.
Bems, Rudolfs, Robert C Johnson, and Kei-Mu Yi, 2010, “Demand Spillovers and the Collapse of Trade in the Global Recession,” IMF Economic Review, Vol. 58, pp. 295-326.
Bekaert, Geert, Michael Ehrmann, Marcel Fratzscher, and Arnaud Mehl, 2011, “Global Crisis and Equity Market Contagion,” NBER Working Paper No. 17121.
Bris, Arturo, Yrjo Koskinen, and Mattias Nilsson, 2009, “The Euro and Corporate Valuations,”
Review of Financial Studies, Vol. 22, No. 8, pp. 3171-209.
Borensztein, Eduardo, Kevin Cowan, and Patricio Valenzuela, 2007, “Sovereign Ceiling ‘Lite’? The Impact of Sovereign Ratings on Corporate Ratings in Emerging Market Economies,” IMF WP/07/75.
Braun, M., Larrain, B., 2005. Finance and the business cycle: international, inter-industry evidence. J. Finance 60, 1097 – 1128.
Cerutti, Eugenio. 2011, “Cross-Border Default Exposures and Rollover Risks: Measurement,
Evolution, and Determinants,” Mimeo, IMF.
Cetorelli, Nicola, and Linda S. Goldberg, 2011, “Banking Globalization and Monetary Transmission,” Journal of Finance forthcoming.
Claessens, Stijn, Giovanni Dell'Ariccia, Deniz Igan, and Luc Laeven, 2010, “Lessons and Policy Implications from the Global Financial Crisis,” Economic Policy, Vol. 62, pp. 269-93.
Claessens, Stijn, Hui Tong, Shang-Jin Wei, 2012, “From the Financial Crisis to the Real Economy: Using Firm-level Data to Identify Transmission Channels,” Journal of International Economics (forthcoming), and NBER Working Paper No. 17360.
Codogno, Lorenzo, Carlo Favero, and Alessandro Missale, 2003. “Yield Spreads on EMU Government Bonds,” Economic Policy, Vol. 18, No. 37, pp. 503-32.
32
Duchin, Ran, Oguzhan Ozbas, and Berk Sensoy, 2010, “Costly external finance, corporate investment, and the subprime mortgage credit crisis,” Journal of Financial Economics, 97, 418-435.
Eichengreen, Barry, Ashoka Mody, Milan Nedeljkovic, and Lucio Sarno, 2009, “How the Subprime Crisis went Global: Evidence from Bank Credit Default Swap Spreads,” NBER Working Paper No. 14904.
Ferri, Giovanni, Li-Gang Liu, and Giovanni Majnoni, 2001, “The Role of Rating Agency Assessment in Less Developed Countries: Impact of the Proposed Basel Guidelines,” Journal of Banking and Finance, Vol. 25, No. 1.
Forbes, Kristin, 2004, “Asian Flu and Russian Virus: The International Transmission of Crises in Firm-Level Data,” Journal of International Economics, Vol. 63, No. 59-92.
Forbes, Kristin, 2012, “The Big “C”: Identifying and Mitigating Contagion”, MIT-Sloan School of Management working paper.
Frankel, Jeffrey, and A. Rose, 2002, “An Estimate of the Effect of Currency Unions on Trade and Growth,” Quarterly Journal of Economics, Vol. 117, No. 2, pp. 437-66.
Kalemli Ozcan, Sebnem, Elias Papaioannou, and Jose Luis Peydro, 2010, “What Lies Beneath the Euro’s Effect on Financial Integration? Currency Risk, Legal Harmonization, or Trade?” Journal of International Economics, Vol. 81, pp. 75-88.
Kaminsky G., and Reinhart C., 2003, “The Center and the Periphery: The Globalization of Financial Turmoil,” NBER Working Papers 9479.
Hau, Harald, and Sandy Lai, 2011, “The Role of Equity Funds in the Financial Crisis
Propagation,” Mimeo INSEAD.
Horvath, Balint and Harry Huizinga, 2011, “Does the European Financial Stability Facility bail out sovereigns or banks? An event study”, CEPR Discussion Paper 8661.
Levchenko, Andrei A, Logan T Lewis, and Linda L Tesar, 2010, “The Collapse of International Trade During the 2008–09 Crisis: In Search of the Smoking Gun,” IMF Economic Review, Vol. 58, pp. 214-53.
Manganelli, Simone, and Guido Wolswijk, 2009, “What Drives Spreads in the Euro Area Government Bond Market?” Economic Policy, Vol. 24, No. 58, pp. 191-240.
Milesi-Ferretti, Gian Maria, and Cédric Tille, 2011, “The Great Retrenchment: International Capital Flows During the Global Financial Crisis,” Economic Policy, Vol. 26, No. 66, pp. 289-346, April.
Mody, Ashoka, 2009, “From Bear Stearns to Anglo Irish: How Eurozone Sovereign Spreads Related to Financial Sector Vulnerability,” IMF Working Paper WP/09/108.
33
Raddatz, C., 2006. Liquidity needs and vulnerability to financial underdevelopment. J. Fin. Econ. 80, 677 – 722.
Rose, Andrew K., and Mark M. Spiegel, 2010a, “Causes and Consequences of the 2008 Crisis: International Linkages and American Exposure,” Pacific Economic Review, Vol. 15, No. 3, pp. 340-63.
–––––, 2010b, “The Causes and Consequences of the 2008 Crisis: Early Warning,” Global Journal of Economics, forthcoming.
Sgherri, Silvia, and Edda Zoli, 2009, “Euro Area Sovereign Risk During the Crisis,” IMF Working Paper 09/222.
Tong, Hui, and Shang-Jin Wei, 2011, “The Composition Matters: Capital Inflows and Liquidity
Crunch During a Global Economic Crisis,” Review of Financial Studies, Vol. 24, No. 6, pp. 2023-52.
34
Table 1: Number of Listed Firms
Country # of firms Country # of firms Australia 182 Germany 236 Austria 29 Japan 1296 Belgium 43 Mexico 22 Brazil 63 Netherlands 50 Canada 283 Sweden 120 Chile 13 Switzerland 93 Denmark 43 Turkey 68 France 169 United Kingdom 335
TOTAL 3045 Source: Worldscope
35
Table 2: Summary Statistics
Variables Obs. Mean St Dev Med p25 p75 Min Max Firm level Change in Stock Price 1. Event May 10 2010 3045 2.26 3.91 1.72 0.00 4.26 -13.35 13.74 2. Event June 8-10 2011 3043 -0.43 3.87 0.00 -2.03 1.09 -15.62 17.19 3. Event July 19-21 2011 3042 0.45 4.25 0.00 -1.19 1.98 -13.72 17.24 4. Event Oct 25-27 2011 3042 1.00 4.45 0.16 -0.83 2.77 -15.34 18.78 Firm Size (log in US Dollars) 3045 12.51 2.08 12.39 11.25 13.79 2.64 19.49 Sector level External Financial Dependence 110 0.29 0.32 0.23 0.00 0.42 0.00 1.00 Country-sector level Trade Exposure to PEC 1130 0.07 0.10 0.03 0.01 0.11 0.00 0.96 Country level
Bank Exposure to PEC 16 0.08 0.05 0.06 0.06 0.11 0.01 0.20 Note: Bank exposure is defined as a country’s bank foreign claims on peripheral euro countries (PEC) over the country’s total bank foreign claims. Trade exposure is defined as a country’s exports of a certain sector to peripheral euro countries (PEC) over the country’s total exports in the same sector. External Financial Dependence is a sector’s intrinsic dependence on external finance for capital expenditures as in Rajan and Zingales (1998). Sources: Worldscope, BIS Consolidated Banking Statistics and United Nations Commodity Trade Database.
.
36
Table 3: Event Analysis, Financial and Trade ChannelsEvent: Launch of a €750 bn. economic package from the EU and the IMF (May 10 2010).
R-squared 0.047 0.054 0.072 0.119 0.165 0.205 Note: Dependent variable is stock return measured as the log difference in the closing price from May 8 (Friday) to 10, 2010. Bank exposure is defined as a country’s bank foreign claims on peripheral euro countries (PEC) over the country’s total bank foreign claims. Trade exposure is defined as a country’s exports of a certain sector to peripheral euro countries (PEC) over the country’s total exports in the same sector. External Financial Dependence is a sector’s intrinsic dependence on external finance for capital expenditures as in Rajan and Zingales (1998). No. of countries: 16. Standard errors are clustered by US SIC 3-digit sector. Robust standard errors in brackets. *** p<0.01, ** p<0.05, * p<0.1.
37
Table 4: Event Analysis, Financial and Trade ChannelsEvent: public disagreement among core euro-zone countries on the resolution for Greek crisis (June 8-10 2011).
Euro Dummy (euro=1 if country is part of Euro zone) -3.63*** -4.23*** [0.47] [0.51]
Euro Dummy*Trade Exposure to PEC 6.59*** 8.30*** 3.25* 4.47** [1.72] [1.78] [1.65] [1.89]
Bank Exposure to PEC -0.25 20.2*** 25.0*** [2.10] [3.74] [4.07]
Constant -0.071 -0.23 -1.05 [0.64] [0.65] [0.68] Observations 3,043 3,043 3,043 3,043 3,043 3,043 R-squared 0.007 0.009 0.028 0.073 0.079 0.109 Note: Dependent variable is stock return measured as the log difference in the closing price from June 7 to 10, 2011. Bank exposure is defined as a country’s bank foreign claims on peripheral euro countries (PEC) over the country’s total bank foreign claims. Trade exposure is defined as a country’s exports of a certain sector to peripheral euro countries (PEC) over the country’s total exports in the same sector. External Financial Dependence is a sector’s intrinsic dependence on external finance for capital expenditures as in Rajan and Zingales (1998). No. of countries: 16. Standard errors are clustered by US SIC 3-digit sector. Robust standard errors in brackets. *** p<0.01, ** p<0.05, * p<0.1.
38
Table 5: Event Analysis, Financial and Trade Channels
Event: Approval of second bail-out for Greece (July 19-21 2011) (1) (2) (3) (4) (5) (6)
R-squared 0.011 0.020 0.028 0.073 0.085 0.119 Note: Dependent variable is stock return measured as the log difference in the closing price from July 18 to 21, 2011. Bank exposure is defined as a country’s bank foreign claims on peripheral euro countries (PEC) over the country’s total bank foreign claims. Trade exposure is defined as a country’s exports of a certain sector to peripheral euro countries (PEC) over the country’s total exports in the same sector. External Financial Dependence is a sector’s intrinsic dependence on external finance for capital expenditures as in Rajan and Zingales (1998). No. of countries: 16. Standard errors are clustered by US SIC 3-digit sector. Robust standard errors in brackets. *** p<0.01, ** p<0.05, * p<0.1.
39
Table 6: Event Analysis, Financial and Trade Channels Event: the EU forged the deal of a fifty percent haircut on Greece's bonds (October 25-27 2011)
(1) (2) (3) (4) (5) (6)
No interaction
Bank Exposure
Trade Exposure
Sector Fixed Effects
Country Fixed Effects
Country & Sector Fixed Effects
Financial Dependence (Rajan and Zingales (1998)) 0.092 -0.82 -0.85 -0.65
[0.41] [0.52] [0.52] [0.60]
Financial Dependence*Bank Exposure to PEC 12.9*** 13.1*** 12.6*** 10.4*** 9.66***
Trade Exposure to PEC 2.36*** 0.95 1.17 2.53** -2.53** -1.50
[0.75] [0.84] [0.99] [1.18] [0.97] [1.08]
Euro Dummy (euro=1 if country is part of Euro zone) 0.23 0.57
[0.58] [0.61]
Euro Dummy*Trade Exposure to PEC -0.85 -1.99 3.27** 2.40
[1.54] [1.76] [1.56] [1.86]
Bank Exposure to PEC 2.34 1.45 -0.19
[1.66] [3.70] [3.86]
Constant -1.96** -1.75* -1.72*
[0.87] [0.94] [0.93]
Observations 3042 3042 3042 3042 3042 3042
R-squared 0.013 0.020 0.020 0.061 0.044 0.080
Note: Dependent variable is stock return measured as the log difference in the closing price from Oct 24 to 27, 2011. Bank exposure is defined as a country’s bank foreign claims on peripheral euro countries (PEC) over the country’s total bank foreign claims. Trade exposure is defined as a country’s exports of a certain sector to peripheral euro countries (PEC) over the country’s total exports in the same sector. External Financial Dependence is a sector’s intrinsic dependence on external finance for capital expenditures as in Rajan and Zingales (1998). No. of countries: 16. Standard errors are clustered by US SIC 3-digit sector. Robust standard errors in brackets. *** p<0.01, ** p<0.05, * p<0.1
40
Table 7: Event Analysis, Financial and Trade ChannelsEU Sample
(1) (2) (3) (4)
May 10, 2010 June 8-10,2011 July 19-21,2011 October 25-27,2011
R-squared 0.233 0.145 0.152 0.133Note: Bank exposure is defined as a country’s bank foreign claims on peripheral euro countries (PEC) over the country’s total bank foreign claims. Trade exposure is defined as a country’s exports of a certain sector to peripheral euro countries (PEC) over the country’s total exports in the same sector.External Financial Dependence is a sector’s intrinsic dependence on external finance for capital expenditures as in Rajan and Zingales (1998). No. of countries: 8. Standard errors are clustered by US SIC 3-digit sector. Robust standard errors in brackets. *** p<0.01, ** p<0.05, * p<0.1
41
Table 8: Event Analysis, Financial and Trade ChannelsAbnormal Returns
First Event: May 10, 2010 Second Event: June 8-10, 2011 Third Event: July 19-21, 2011 Fourth Event: October 25-27
General Sample EU Sample General Sample EU Sample General Sample EU Sample General Sample EU Sample
R-squared 0.006 0.002 0.025 0.007 0.004 0.013 0.010 0.007 Note: Bank exposure is defined as a country’s bank foreign claims on peripheral euro countries (PEC) over the country’s total bank foreign claims. Trade exposure is defined as a country’s exports of a certain sector to peripheral euro countries (PEC) over the country’s total exports in the same sector. External Financial Dependence is a sector’s intrinsic dependence on external finance for capital expenditures as in Rajan and Zingales (1998). No. of countries for general sample is 16 and for EU sample is 8. Standard errors are clustered by US SIC 3-digit sector. Robust standard errors in brackets. *** p<0.01, ** p<0.05, * p<0.1
42
Table 9: Event Analysis, Financial and Trade Channels Weighted Regressions
First Event:
May 10, 2010Second Event:
June 8-10, 2011 Third Event:
July 19-21, 2011Fourth Event:
October 25-27, 2011 General
SampleEU
SampleGeneral Sample
EU Sample
General Sample
EU Sample
General Sample
EU Sample
Financial Dependence*Bank Exposure to PEC 13.2*** 17.9** -8.81** -5.24 16.7*** 32.1*** 15.8** 27.1*** [4.66] [7.59] [4.42] [6.68] [5.38] [9.31] [6.11] [6.78]Firm Size (Total Assets) 0.47*** 0.62*** -0.063 -0.11 0.28*** 0.28*** 0.33*** 0.35*** [0.072] [0.10] [0.064] [0.092] [0.069] [0.11] [0.098] [0.13]Trade Exposure to PEC -0.11 -2.97 -2.87* -1.14 0.28 0.68 -1.87 -0.3 [1.93] [2.51] [1.71] [1.65] [1.74] [1.35] [1.60] [1.47]Euro Dummy*Trade Exposure to PEC -3.87 3.27 -0.90 2.45 [3.19] [3.89] [2.77] [3.65] Country fixed effects Y Y Y Y Y Y Y YSector fixed effects Y Y Y Y Y Y Y Y Observations 3,045 1,025 3,043 1,025 3,042 1,024 3042 1024R-squared 0.288 0.283 0.125 0.167 0.237 0.190 0.136 0.194
Note: Bank exposure is defined as a country’s bank foreign claims on peripheral euro countries (PEC) over the country’s total bank foreign claims. Trade exposure is defined as a country’s exports of a certain sector to peripheral euro countries (PEC) over the country’s total exports in the same sector. External Financial Dependence is a sector’s intrinsic dependence on external finance for capital expenditures as in Rajan and Zingales (1998). No. of countries for general sample is 16 and for EU sample is 8. Standard errors are clustered by US SIC 3-digit sector. Robust standard errors in brackets. *** p<0.01, ** p<0.05, * p<0.1.
43
Table 10. Event Analysis, Financial and Trade Channels
Note: Bank exposure is defined as a country’s bank foreign claims on peripheral Euro countries (PEC) over the country’s total bank foreign claims. Trade exposure is defined as a country’s exports of a certain sector to peripheral Euro countries (PEC) over the country’s total exports in the same sector. External Financial Dependence is a sector's intrinsic dependence on external finance for capital expenditures as in Rajan and Zingales (1998). No. of countries for General Sample is 16 and for EU sample is 8.
44
Table 11: Event Analysis, Financial and Trade Channels
Bank exposure to GIP's Public Sector
First Event:
March 10, 2010 Second Event:
June 8-10, 2011Third Event:
July 19-21, 2011Fourth Event:
October 25-27, 2011
General Sample
EU Sample
General Sample
EU Sample
General Sample
EU Sample
General Sample
EU Sample
Financial Dependence*Bank Exposure to GIP (All Sectors) 1.61** 1.88 -1.80** -1.69 2.12** 3.15*** 1.73* 2.24 [0.75] [1.18] [0.90] [1.26] [0.98] [1.17] [0.97] [1.77] Financial Dependence*Bank Exposure to GIP's public sector 4.82** 8.67*** -5.48*** -7.07** 6.41 8.04 0.73 8.04** [2.08] [3.23] [1.95] [3.02] [4.41] [6.94] [3.39] [3.51] Firm Size (Total Assets) 0.41*** 0.59*** -0.095** -0.15** 0.15*** 0.26*** 0.28*** 0.38*** [0.035] [0.074] [0.048] [0.074] [0.048] [0.070] [0.077] [0.11] Trade Exposure to GIP 0.63 2.20 -2.71 -1.56 0.55 0.68 -0.037 -0.12 [2.58] [2.38] [1.80] [2.11] [1.25] [1.47] [1.60] [1.78] Euro Dummy*Trade Exposure to GIP -4.65 4.57 -4.43 5.15 [4.53] [3.79] [4.47] [6.55] Country fixed effects Y Y Y Y Y Y Y Y Sector fixed effects Y Y Y Y Y Y Y Y Observations 2,693 1,135 2,691 1,135 2,690 1,134 2,690 1,134 R-squared 0.214 0.235 0.109 0.138 0.119 0.151 0.082 0.121 Note: GIP countries include Greece, Ireland, and Portugal. Bank exposure to GIP (All sectors) is the ratio of total banking sector’s foreign claims on GIP (public, financial, and non-financial sectors) over the Tier-1 capital of the banking sector. Bank Exposure to GIP's public sector is the ratio of banking sector's foreign claims on GIP's public sector over total banking sector’s foreign claims on GIP. Trade exposure is defined as a country’s exports of a certain sector to GIP over the country’s total exports in the same sector. External Financial Dependence is a sector's intrinsic dependence on external finance for capital expenditures as in Rajan and Zingales (1998). No. of countries for general sample is 13. No. of countries for EU sample is 10. Standard errors are clustered by US SIC 3-digit sector. Robust standard errors in brackets. *** p<0.01, ** p<0.05, * p<0.1.
45
Note: The average sovereign CDS spread is calculated as the cross-country average of sovereign CDS spreads of Greece, Ireland, Italy, Portugal, and Spain. We calculate the 3-day change as 100*ln(CDS spread in t/CDS spread in t-3).
-80
-60
-40
-20
0
20
40
6010
/2/2
009
11/2
/200
9
12/2
/200
9
1/2/
2010
2/2/
2010
3/2/
2010
4/2/
2010
5/2/
2010
6/2/
2010
7/2/
2010
8/2/
2010
9/2/
2010
10/2
/201
0
11/2
/201
0
12/2
/201
0
1/2/
2011
2/2/
2011
3/2/
2011
4/2/
2011
5/2/
2011
6/2/
2011
7/2/
2011
8/2/
2011
9/2/
2011
10/2
/201
1
11/2
/201
1
12/2
/201
1
Perc
ent
Figure 1: Three-day change in the average sovereign CDS spread for PEC countries
First Event, May 10 2010the EFSF was established
Second Event, June 8-10 2011Public disagreement among core euro-zone countries on the resolution of Greek crisis
Third Event, July 19-21 2011Approval of the second bail-out for Greece
Fourth Event, Oct 25-27 2011EU forged the deal of a 50 percent haircut on Greece's bonds