Page 1
Jim Grassiano – Alabama Department of Environmental Management
Savings With Pump
Efficiencies Energy Management Initiative
Tennessee Wastewater Utility Partnership
Wave Five
November 14, 2017
Page 2
Our Main Job…?
adem.alabama.gov
Page 3
San Francisco Public
Utilities PR Campaign
adem.alabama.gov
Page 4
San Francisco Public
Utilities PR Campaign
adem.alabama.gov
Page 5
The SFPUC Ads
Appeared…
• On bus stops
• In and on city buses
• 14 neighborhood papers
• In Chinese & Spanish
• Larger City-wide papers:
– San Francisco Examiner
– San Francisco Bay Guardian
• Facebook adem.alabama.gov
Page 6
PR Campaign Intended to
foster support for…
• $2.7 billion dollar, 2-yr upgrade of
City WWTPs
(So you think you have budget problems..!)
adem.alabama.gov
Page 7
adem.alabama.gov
Goals of Presentation
• Identify ways to save energy costs with pumping
• Discuss some interesting case study examples
• Introduce you to DOE’s Pumping Assessment Tool
Page 8
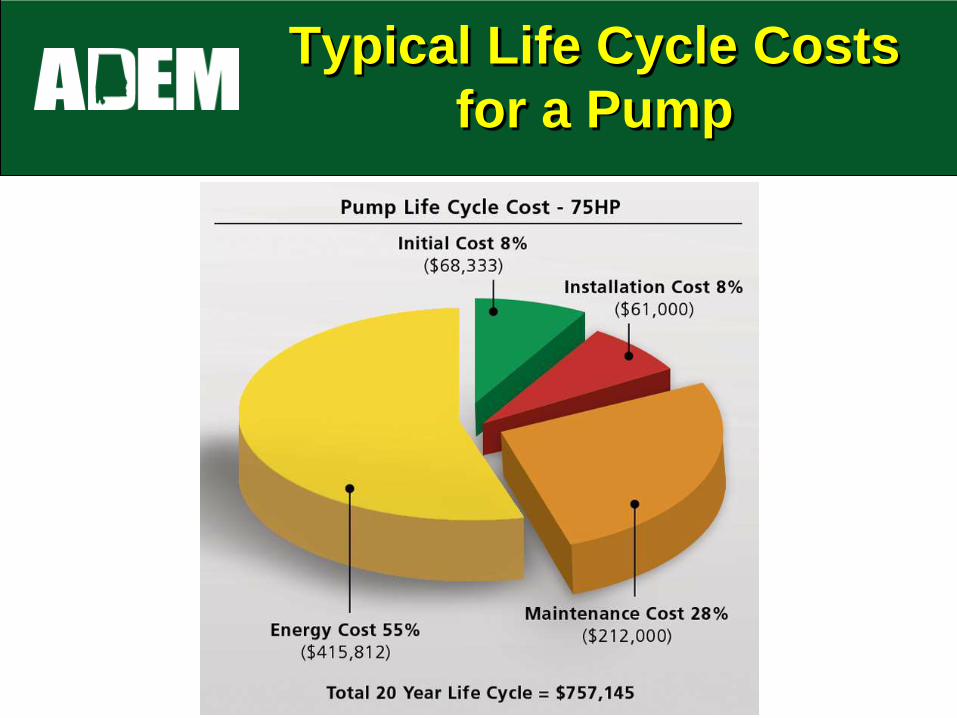
Typical Life Cycle Costs
for a Pump
adem.alabama.gov
Page 9
First, the Pumping
System Assessment Tool
• PSAT is a free on-line software tool
developed by DOE
• Primarily intended for industrial operations,
but can be helpful for water & wastewater
utilities
adem.alabama.gov
Page 10
PSAT
• Uses hydraulic institute standards &
measured pump performance data to
identify areas where pump efficiencies can
be improved
adem.alabama.gov
Page 11
PSAT
• Specifically, PSAT uses pump and motor
performance data from Hydraulic Institute
standard ANSI/HI-1.3 and MotorMaster+
database info to estimate existing,
achievable performance
(MotorMaster+ is an earlier DOE motor efficiency tool)
adem.alabama.gov
Page 12
PSAT
• Requires field measurements or estimates
of flow rate, pressure, and motor power or
current
adem.alabama.gov
Page 13
So, PSAT…
• Assesses your current pump system
operating efficiency by comparing field
measurements of power delivered to the
motor with the fluid work (flow & head)
required by the application
adem.alabama.gov
Page 14
PSAT
• Can identify the operational cost savings
from installing a new pump/pump system
adem.alabama.gov
Page 15
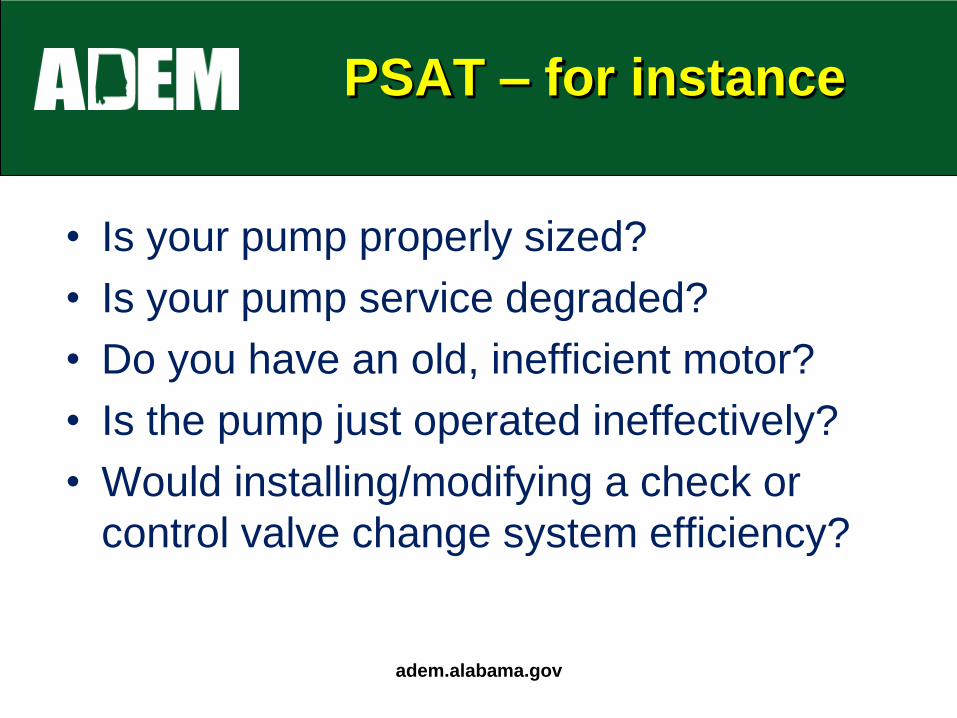
PSAT – for instance
• Is your pump properly sized?
• Is your pump service degraded?
• Do you have an old, inefficient motor?
• Is the pump just operated ineffectively?
• Would installing/modifying a check or
control valve change system efficiency?
adem.alabama.gov
Page 16
PSAT
• Gives you an optimization rating of your
existing pump compared to equivalent top
line equipment at peak efficiency (i.e., vs a
pump with a rating of 100)
• Provides annual energy use and energy
costs for existing and revised pump
equipment
adem.alabama.gov
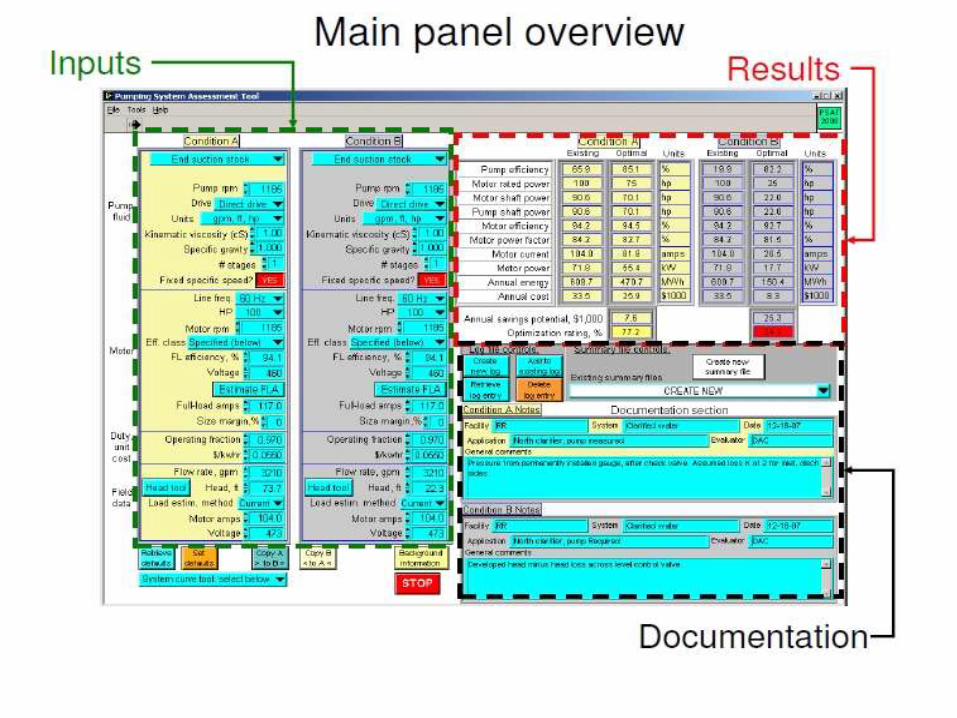
Page 17
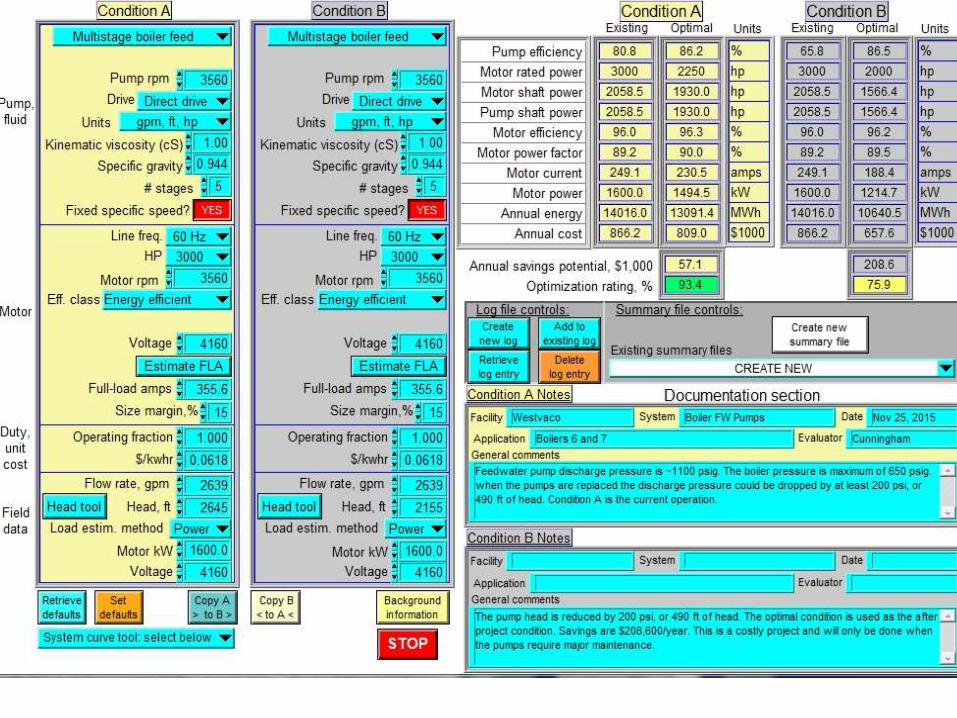
Input data Results
Page 18
An introduction to the
Pumping System
Assessment Tool (PSAT) Input data Results
Page 19
Doing a PSAT Study can
be tricky
adem.alabama.gov
• Assemble the right team of
people to work on this project
Page 20
For assistance with PSAT:
Team up with these folks
adem.alabama.gov
• TVA’s Comprehensive Services Program
– Jason Snyder
• Dr. Glenn Cunningham -Tennessee Tech
University
[email protected]
• EPA Region 4 – Brendan Held
Work as a team with your Utility electrician
Page 21
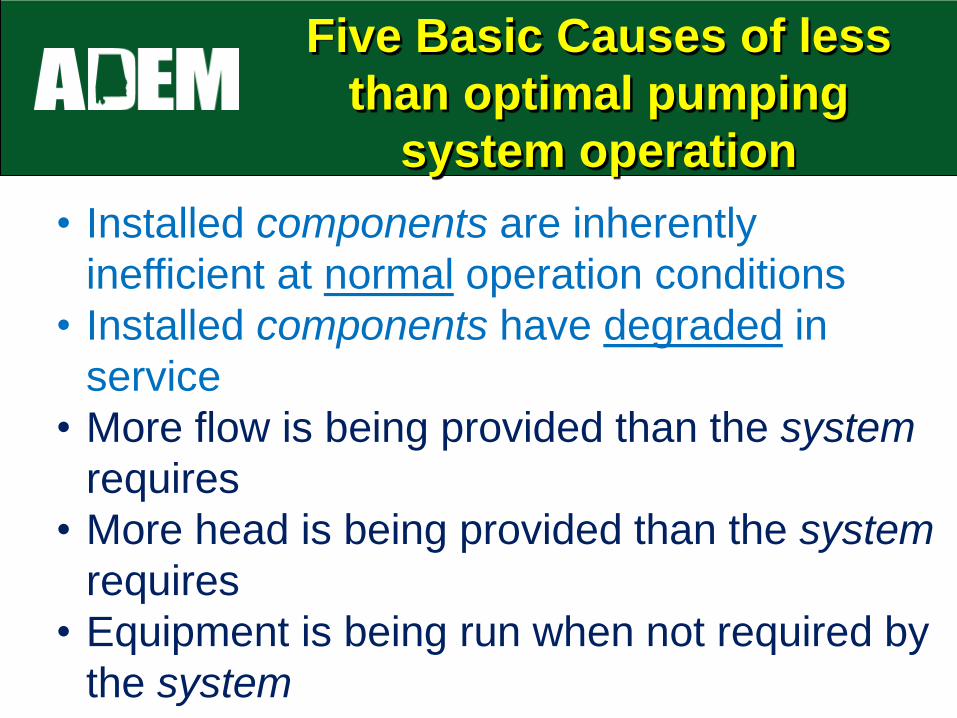
Five Basic Causes of less
than optimal pumping
system operation
• Installed components are inherently
inefficient at normal operation conditions
• Installed components have degraded in
service
• More flow is being provided than the system
requires
• More head is being provided than the system
requires
• Equipment is being run when not required by
the system
Page 22
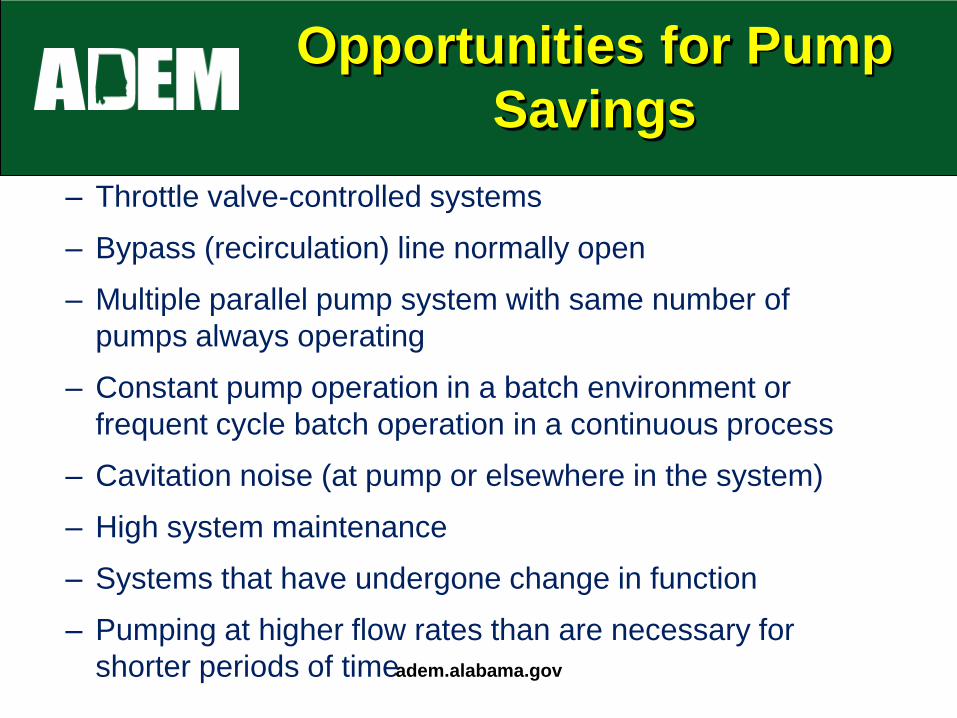
Opportunities for Pump
Savings
– Throttle valve-controlled systems
– Bypass (recirculation) line normally open
– Multiple parallel pump system with same number of
pumps always operating
– Constant pump operation in a batch environment or
frequent cycle batch operation in a continuous process
– Cavitation noise (at pump or elsewhere in the system)
– High system maintenance
– Systems that have undergone change in function
– Pumping at higher flow rates than are necessary for
shorter periods of time
adem.alabama.gov
Page 23
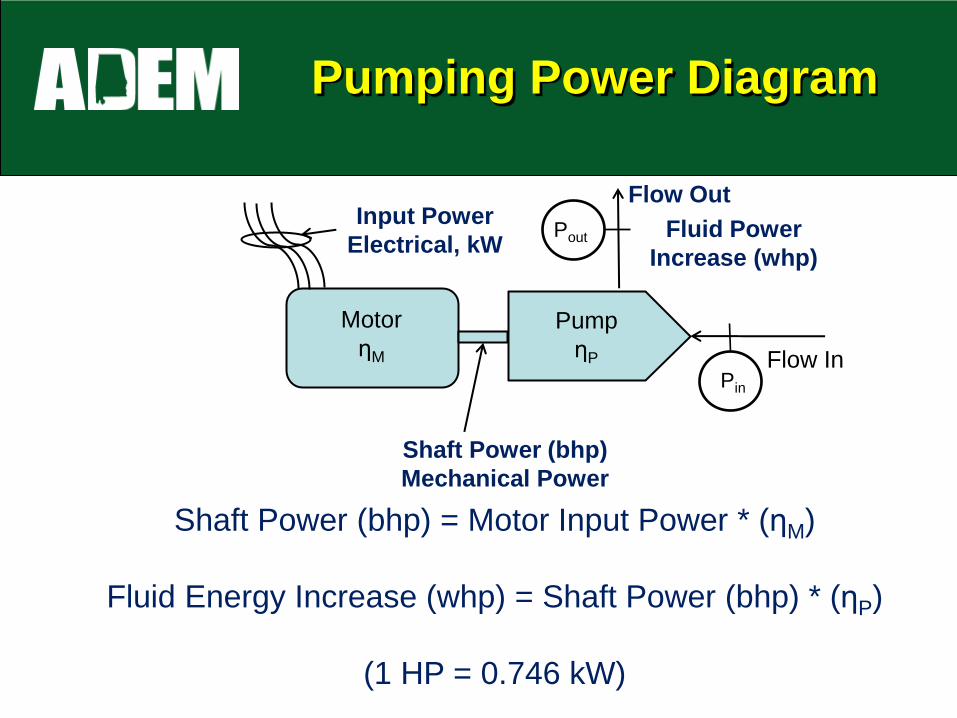
Pumping Power Diagram
Motor
ηM
Pump
ηP
Input Power
Electrical, kW Fluid Power
Increase (whp)
Flow Out
Flow In
Shaft Power (bhp)
Mechanical Power
Pin
Pout
Shaft Power (bhp) = Motor Input Power * (ηM)
Fluid Energy Increase (whp) = Shaft Power (bhp) * (ηP)
(1 HP = 0.746 kW)
Page 24
Power Costs are
Increasing
• Case in Point: One Alabama utility
reduced power usage by 38% in 2017 but
only saw a 9% cost savings because
power costs increased $49% since
2014..!!
adem.alabama.gov
Page 25
The effect of Demand
charges
$0
$1,000
$2,000
$3,000
$4,000
$5,000
$6,000
$7,000
$8,000
$9,000
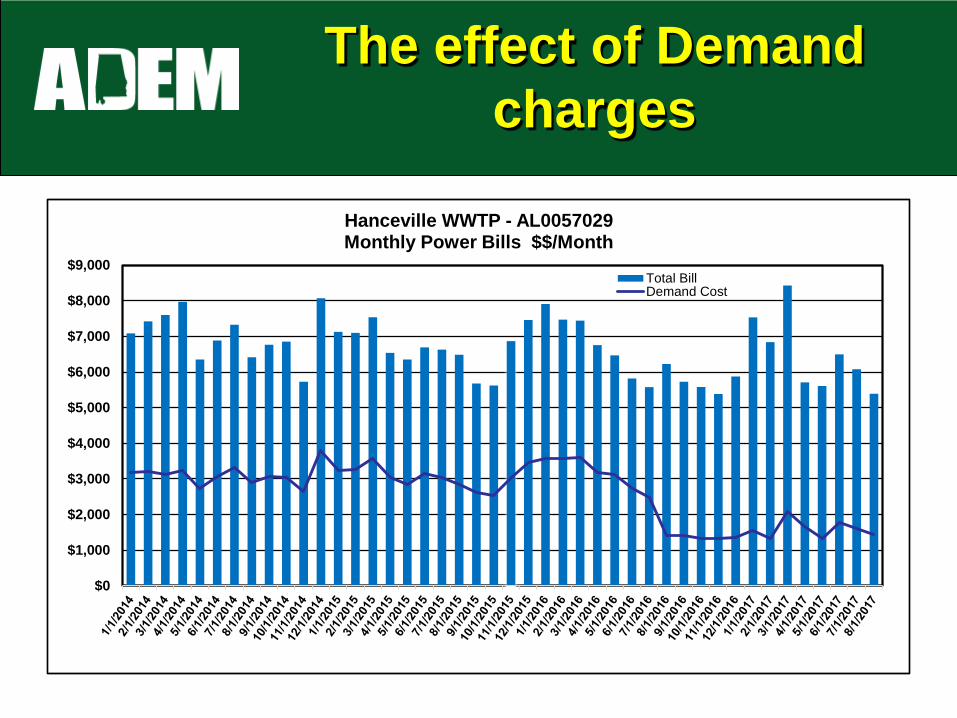
Hanceville WWTP - AL0057029 Monthly Power Bills $$/Month
Total BillDemand Cost
Page 26
The effect of Demand
charges
• So Hanceville saw a $2,100 decrease in
its monthly demand charge over a 6 month
period
• Some of this savings was due to installing
a VFD on its main influent WWTP pumps
Page 27
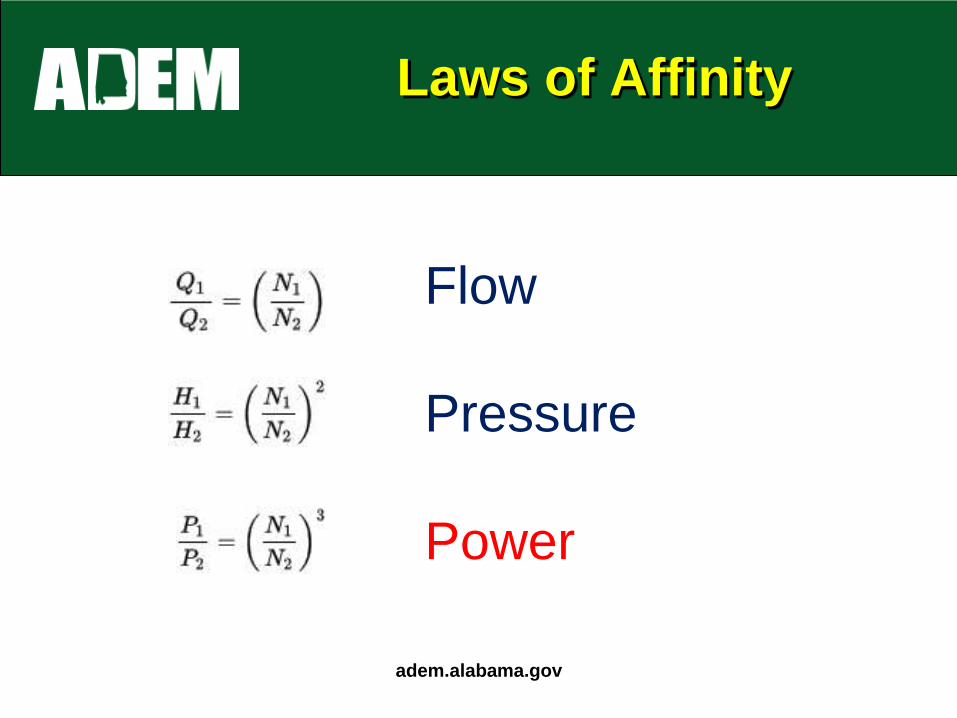
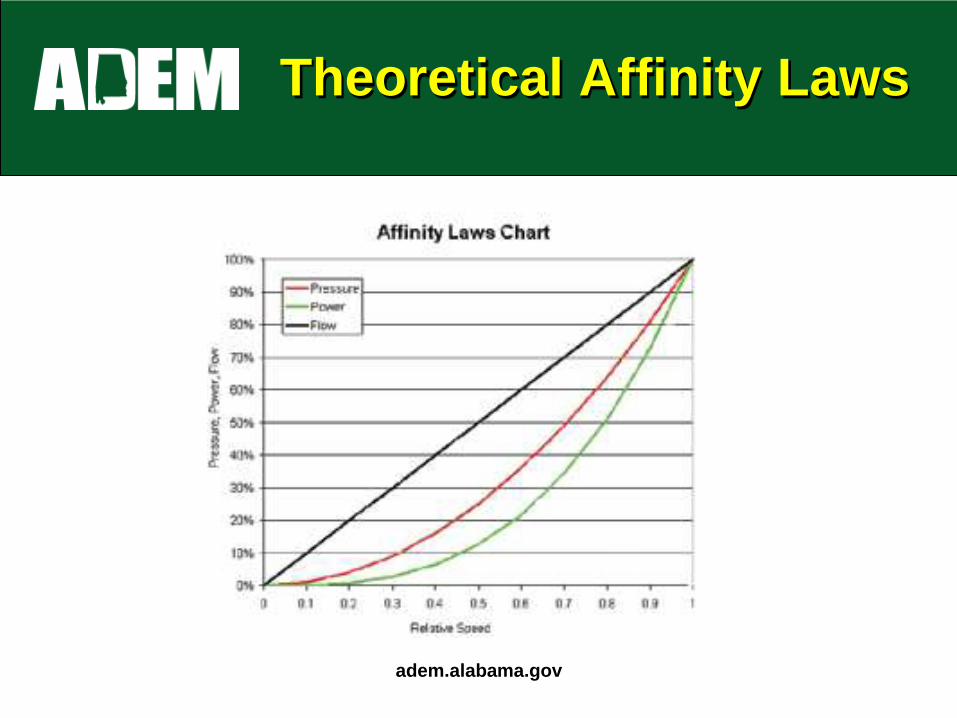
Laws of Affinity
• Flow is proportional to shaft speed
• Head (pressure) is proportional to the
square of shaft speed
• Power is proportional to the cube of shaft
speed
adem.alabama.gov
Page 28
Laws of Affinity
adem.alabama.gov
Flow
Pressure
Power
Page 29
Typical Pump Design
• On average, 80% of the time pumps
operate at 60% of their full capacity
[Source: Baldor Motors]
This indicates there is often an
opportunity to save energy by controlling
pump operation adem.alabama.gov
Page 30
Variable Frequency
Drives
Where warranted, A VFD Can:
• Provide improved process control
• Save electrical energy
• Reduce wear and tear on equipment
adem.alabama.gov
Page 31
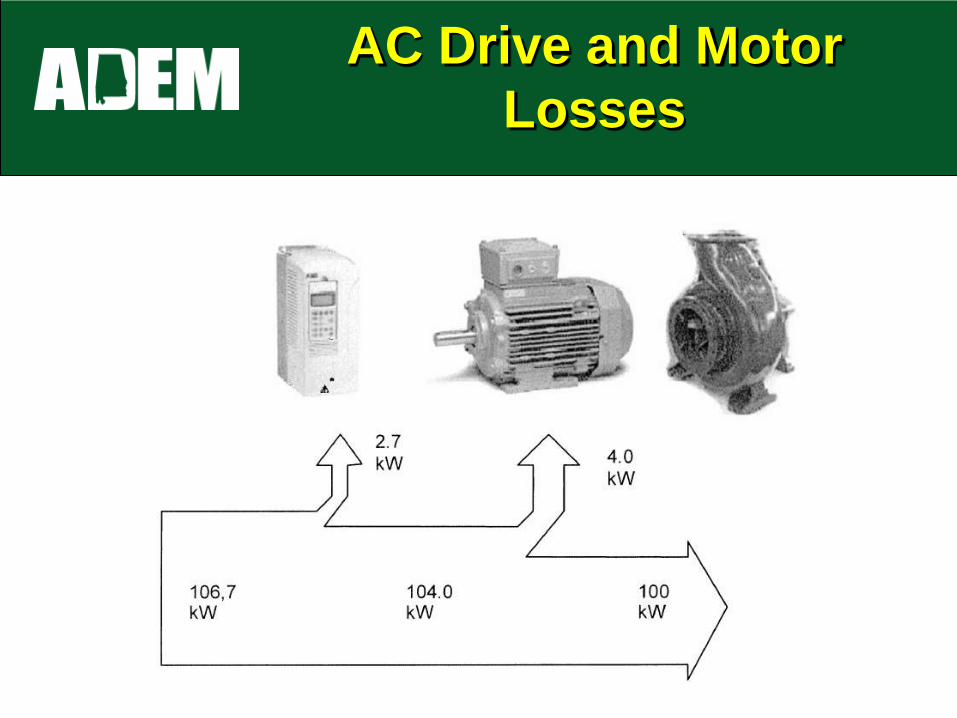
AC Drive and Motor
Losses
adem.alabama.gov
Page 32
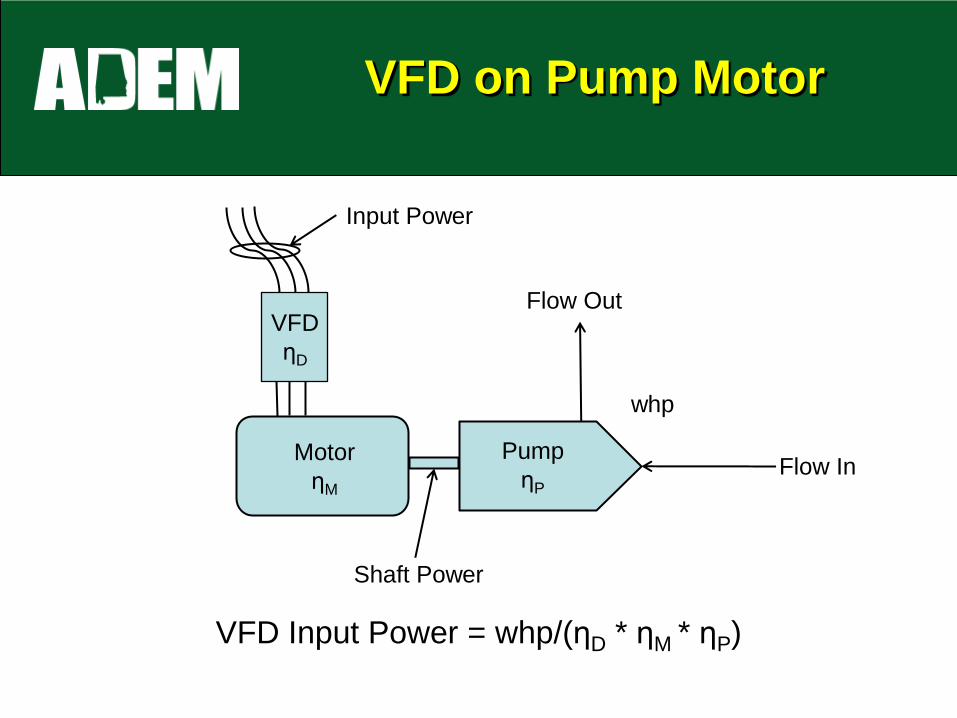
VFD on Pump Motor
VFD Input Power = whp/(ηD * ηM * ηP)
Motor
ηM
Pump
ηP
Input Power
whp
Flow Out
Flow In
Shaft Power
VFD
ηD
Page 33
A VFD has limitations
• Generates Heat (2-3 % loss)
• Generate harmonics (current distortion)
So, a VFD adds a degree of inefficiency
adem.alabama.gov
Page 34
BUT, overall…
• VFDs save energy by using less overall
power
– Power a pump consumes is proportional to
the cube of velocity. Theoretically, if you run
a pump at 80% speed, you can save 51% of
full load power)
• VFDs run at a high power factor- Results
in potential cost savings and increase in
motor life
adem.alabama.gov
Page 35
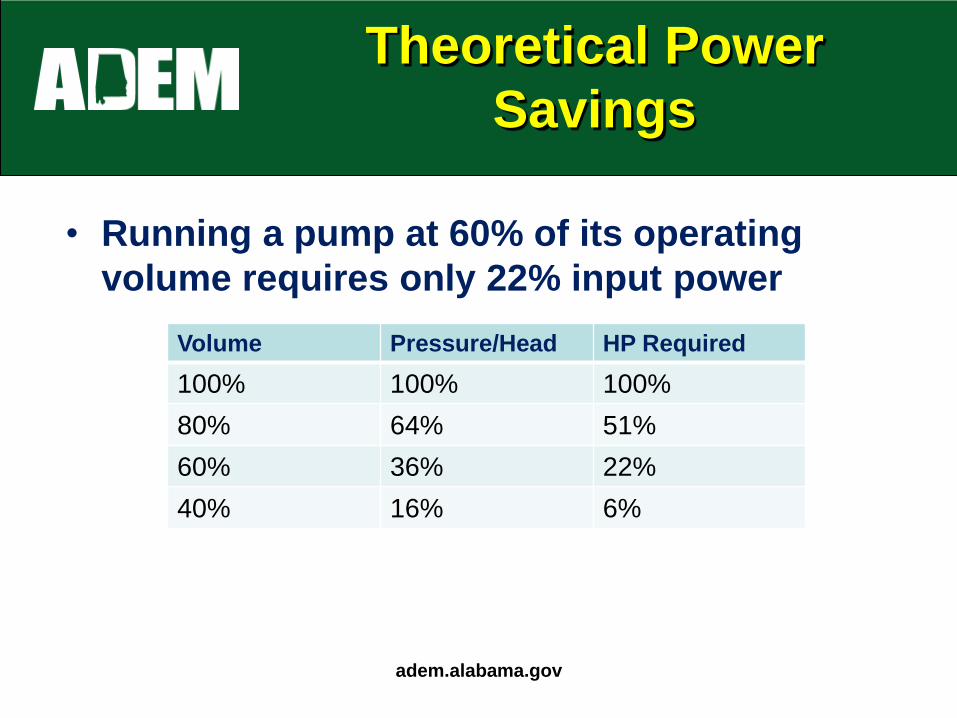
Theoretical Power
Savings
• Running a pump at 60% of its operating
volume requires only 22% input power
adem.alabama.gov
Volume Pressure/Head HP Required
100% 100% 100%
80% 64% 51%
60% 36% 22%
40% 16% 6%
Page 36
Theoretical Affinity Laws
adem.alabama.gov
Page 37
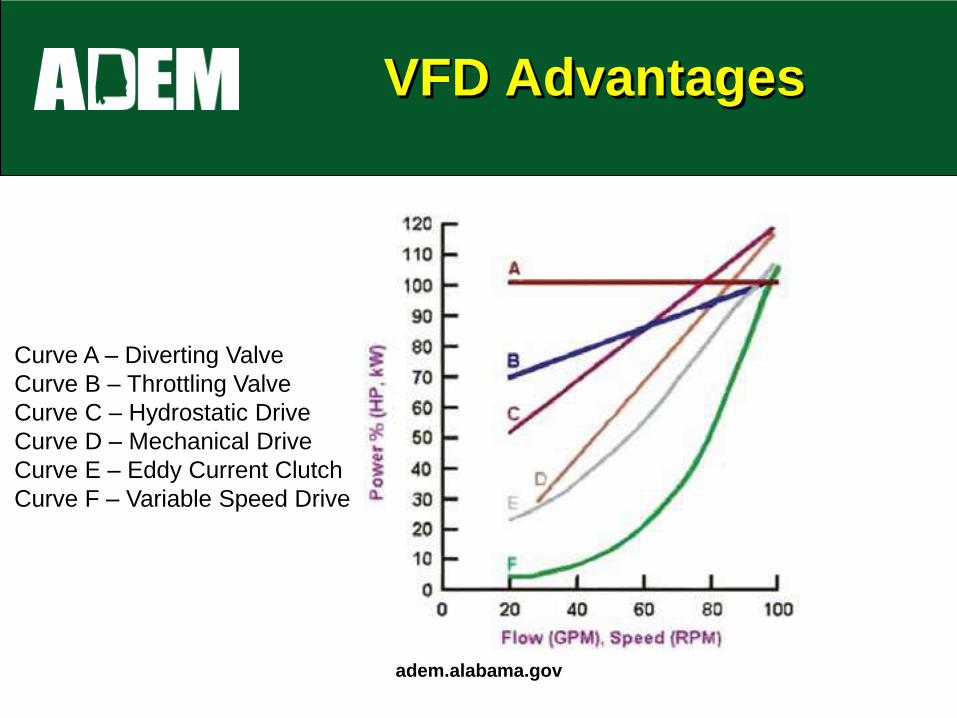
VFD Advantages
adem.alabama.gov
Curve A – Diverting Valve
Curve B – Throttling Valve
Curve C – Hydrostatic Drive
Curve D – Mechanical Drive
Curve E – Eddy Current Clutch
Curve F – Variable Speed Drive
Page 38
So, a VFD…
• Comes closest to achieving the theoretical
maximum efficiency of a pump
adem.alabama.gov
Page 39
Energy Cost Savings
For a centrifugal pump:
• An adjustable AC drive can save a great
deal of energy if a pump is designed to
operate at somewhere between 40-80 %
speed
• Savings: 10 to 60 %
adem.alabama.gov
Page 40
Power/Demand Fee
Structure Trend
TVA – Lower unit power cost but higher
demand charge
Southern Company – Higher unit power cost
but lower demand charge
adem.alabama.gov
Page 41
Example Usage/Demand
Charge
Lift Station Pump: 200 hp, Single Speed
Centrifugal Pump
Utility Costs: $14.36/kW Demand Charge
This pump runs for ten 30-min cycles/day
adem.alabama.gov
Page 42
Example: Energy Usage
Cost
Energy Cost:
Pumping at 92% efficiency
Lift Station Pump: 200 hp, Single Speed
Centrifugal Pump
adem.alabama.gov
Page 43
Energy Consumed
Unit Cost of $0.10/kWh
Pumping at 92% efficiency
Energy Use:
200 hp x 0.746 kW/hp x 5 hr/day x 30
days/mo x 0.92 = 20,600 kWh/Mo
adem.alabama.gov
Page 44
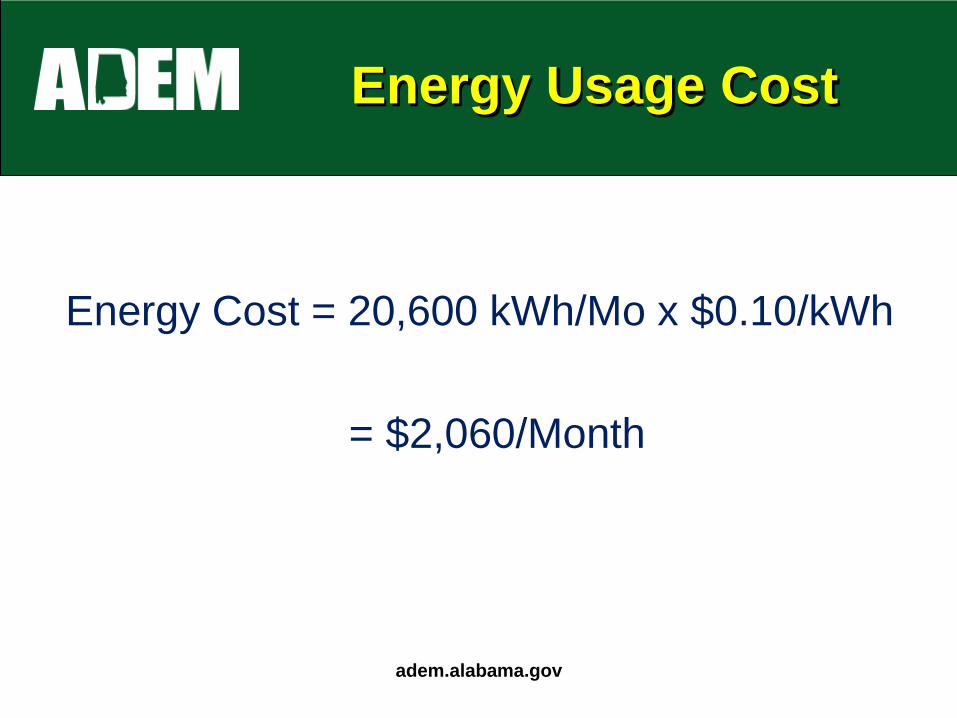
Energy Usage Cost
Energy Cost = 20,600 kWh/Mo x $0.10/kWh
= $2,060/Month
adem.alabama.gov
Page 45
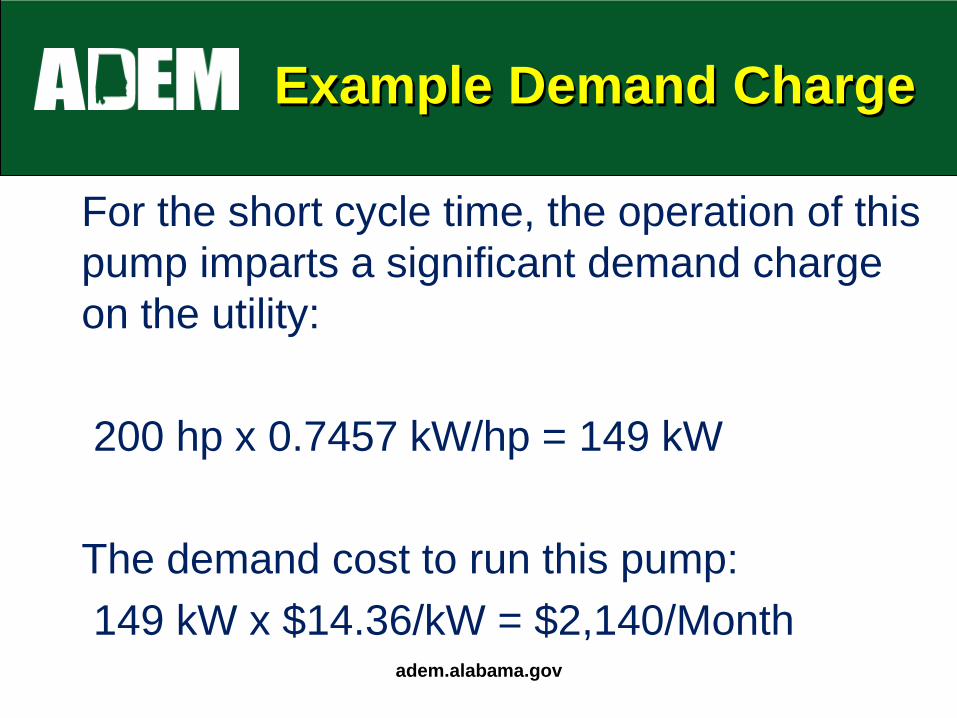
Example Demand Charge
For the short cycle time, the operation of this
pump imparts a significant demand charge
on the utility:
200 hp x 0.7457 kW/hp = 149 kW
The demand cost to run this pump:
149 kW x $14.36/kW = $2,140/Month adem.alabama.gov
Page 46
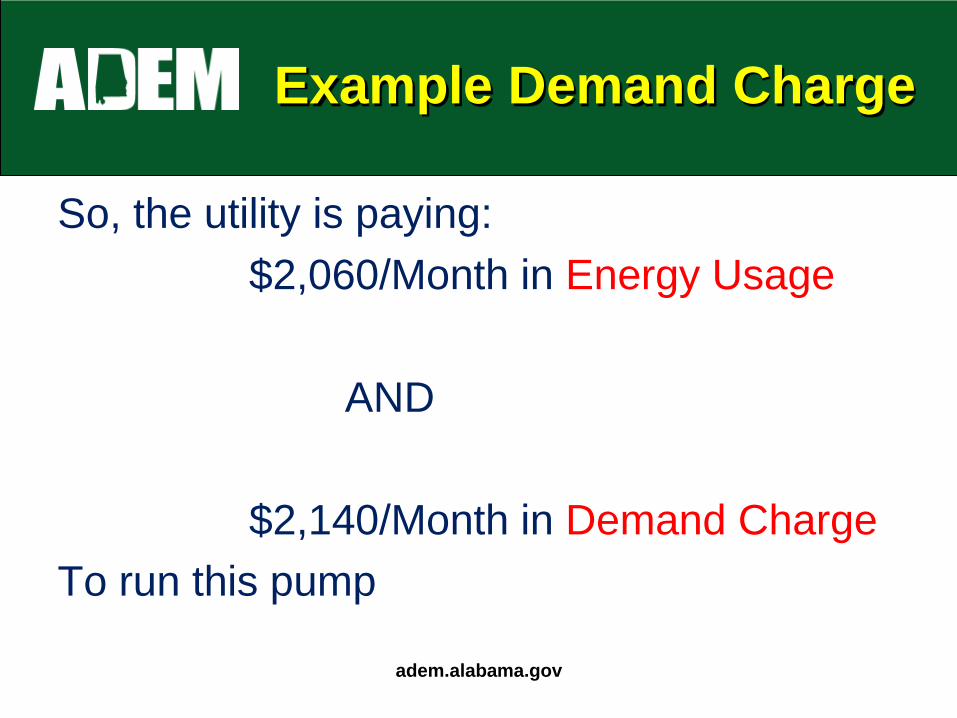
Example Demand Charge
So, the utility is paying:
$2,060/Month in Energy Usage
AND
$2,140/Month in Demand Charge
To run this pump
adem.alabama.gov
Page 47
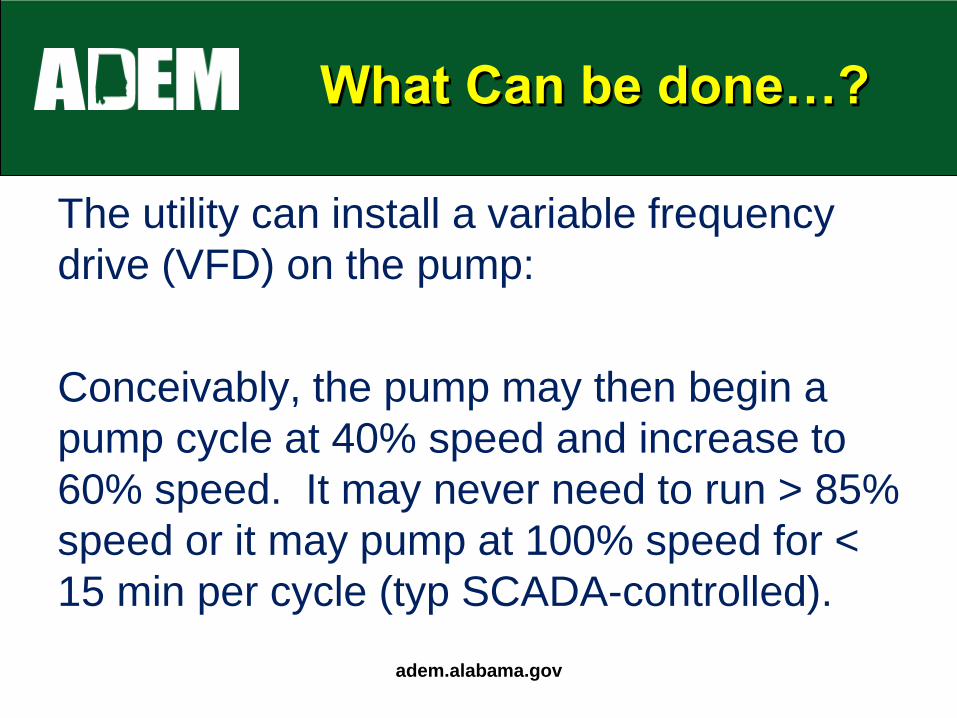
What Can be done…?
The utility can install a variable frequency
drive (VFD) on the pump:
Conceivably, the pump may then begin a
pump cycle at 40% speed and increase to
60% speed. It may never need to run > 85%
speed or it may pump at 100% speed for <
15 min per cycle (typ SCADA-controlled).
adem.alabama.gov
Page 48
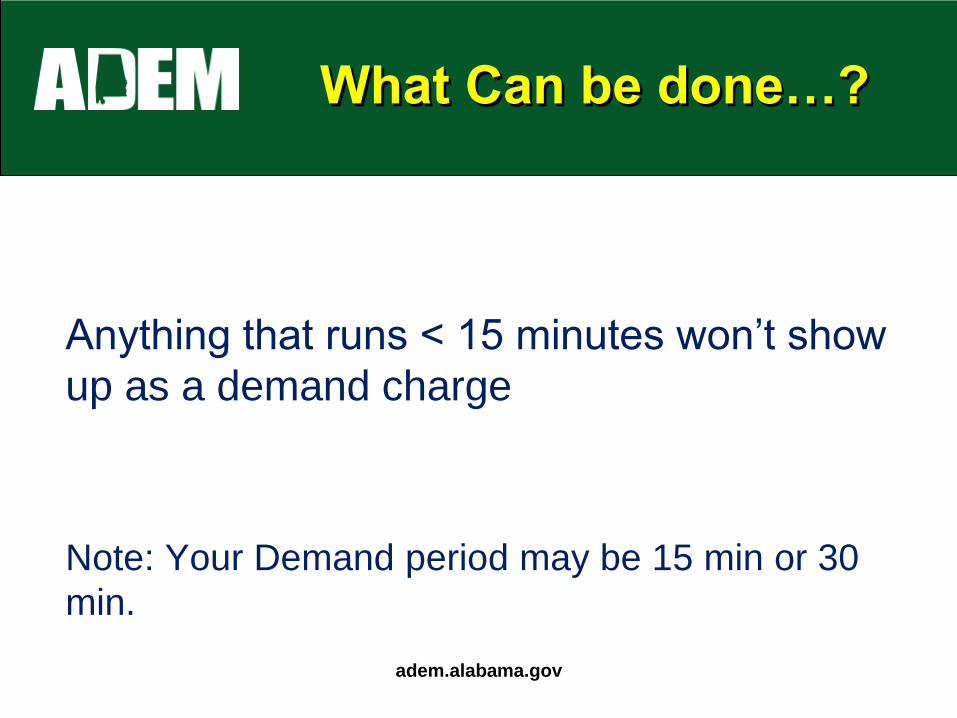
What Can be done…?
Anything that runs < 15 minutes won’t show
up as a demand charge
Note: Your Demand period may be 15 min or 30
min.
adem.alabama.gov
Page 49
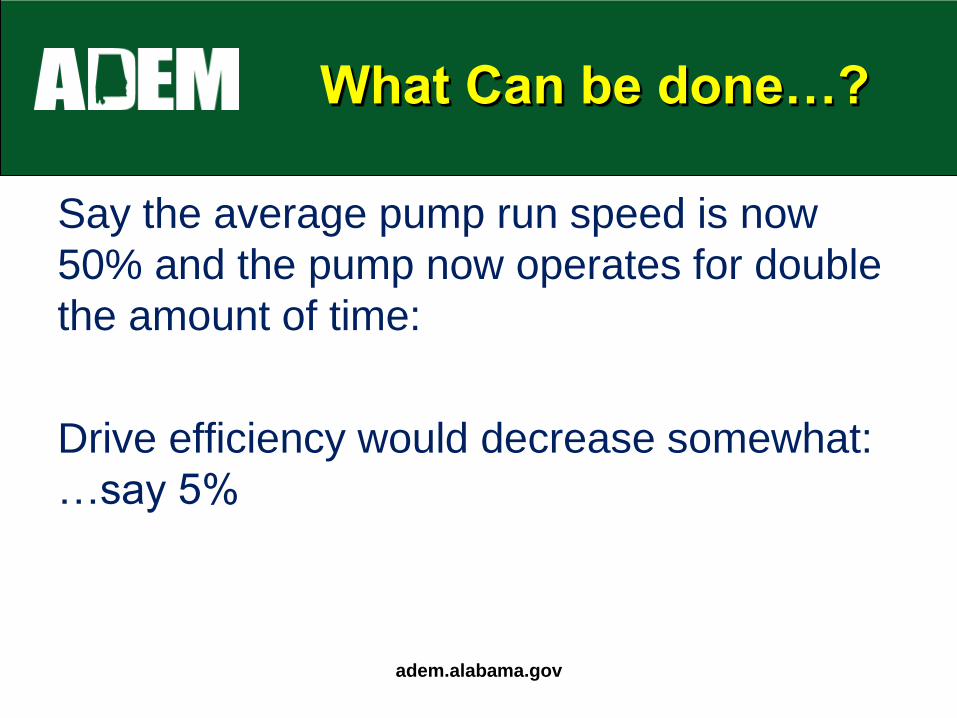
What Can be done…?
Say the average pump run speed is now
50% and the pump now operates for double
the amount of time:
Drive efficiency would decrease somewhat:
…say 5%
adem.alabama.gov
Page 50
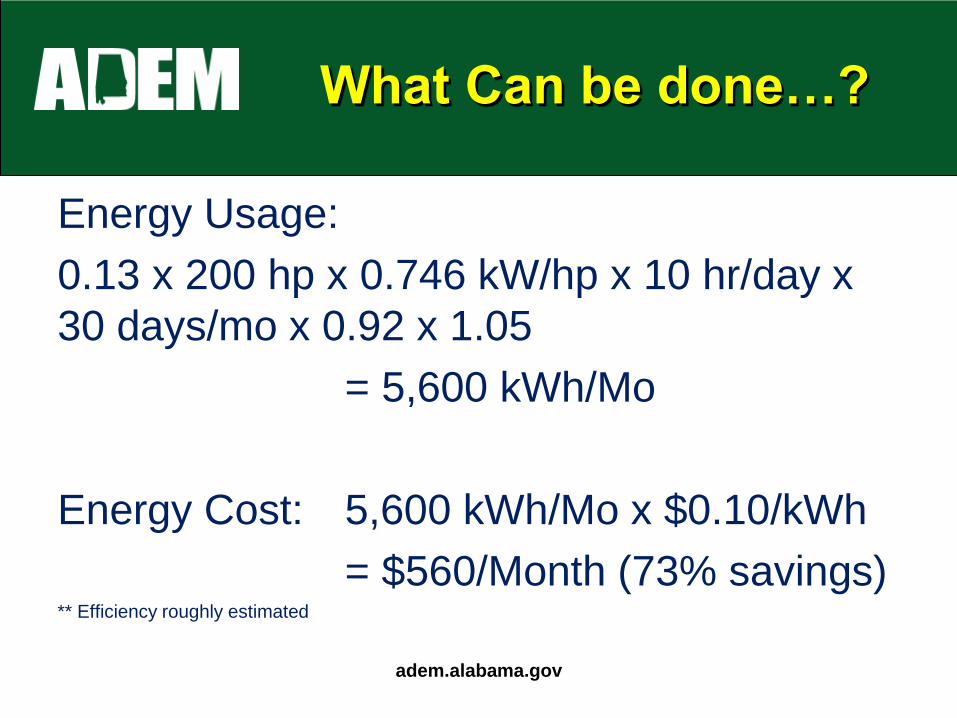
What Can be done…?
Energy Usage:
0.13 x 200 hp x 0.746 kW/hp x 10 hr/day x
30 days/mo x 0.92 x 1.05
= 5,600 kWh/Mo
Energy Cost: 5,600 kWh/Mo x $0.10/kWh
= $560/Month (73% savings) ** Efficiency roughly estimated
adem.alabama.gov
Page 51
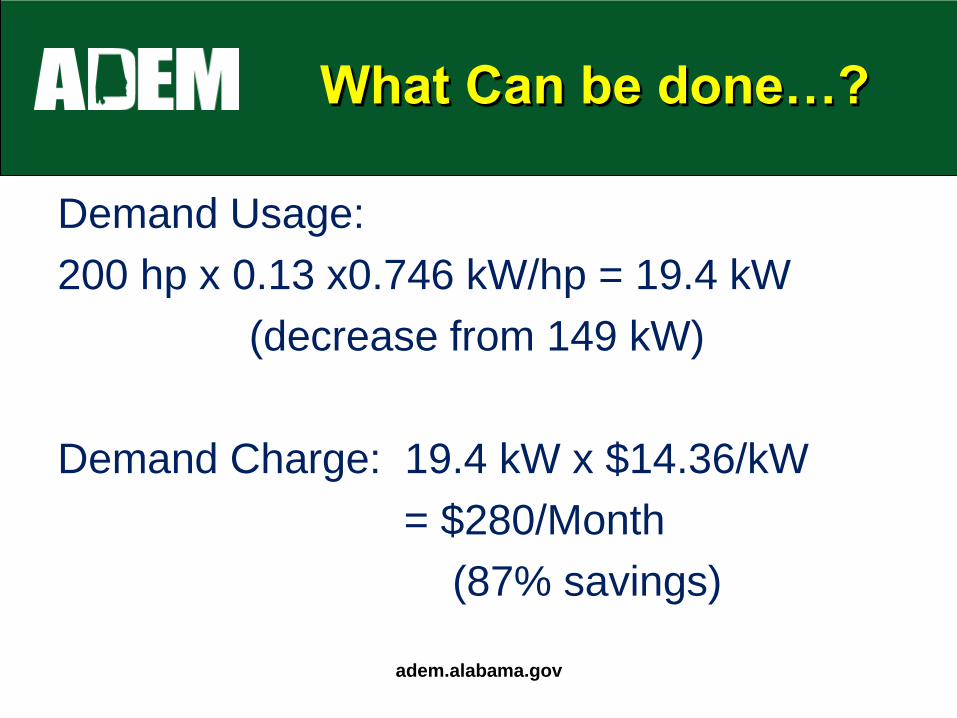
What Can be done…?
Demand Usage:
200 hp x 0.13 x0.746 kW/hp = 19.4 kW
(decrease from 149 kW)
Demand Charge: 19.4 kW x $14.36/kW
= $280/Month
(87% savings)
adem.alabama.gov
Page 52
Resulting Savings from
VFD Installation
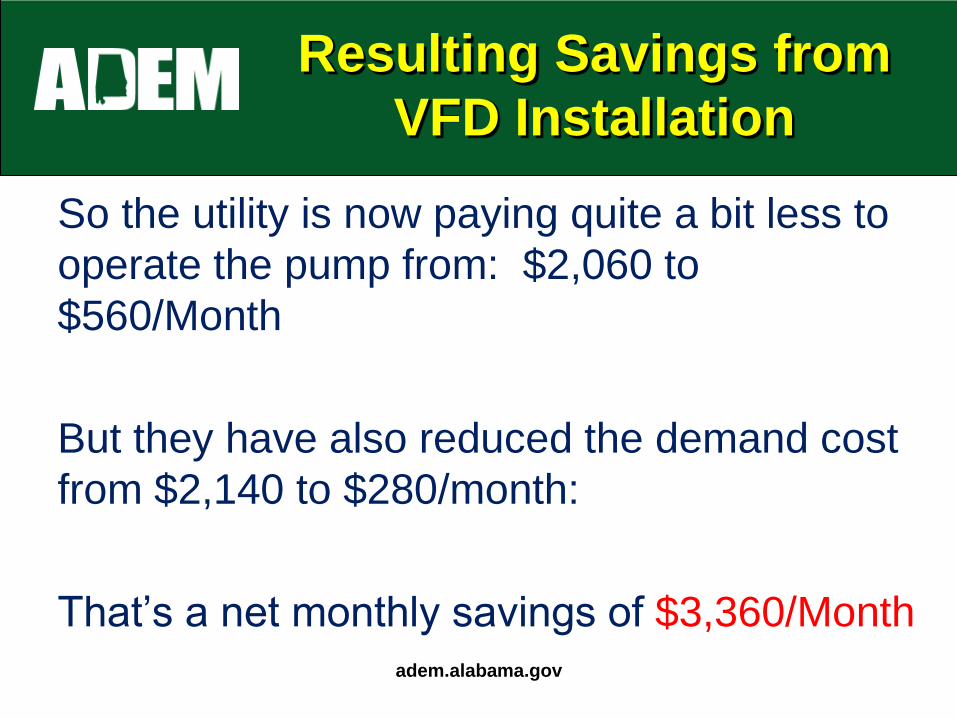
So the utility is now paying quite a bit less to
operate the pump from: $2,060 to
$560/Month
But they have also reduced the demand cost
from $2,140 to $280/month:
That’s a net monthly savings of $3,360/Month
adem.alabama.gov
Page 53
Resulting Savings from
VFD Installation
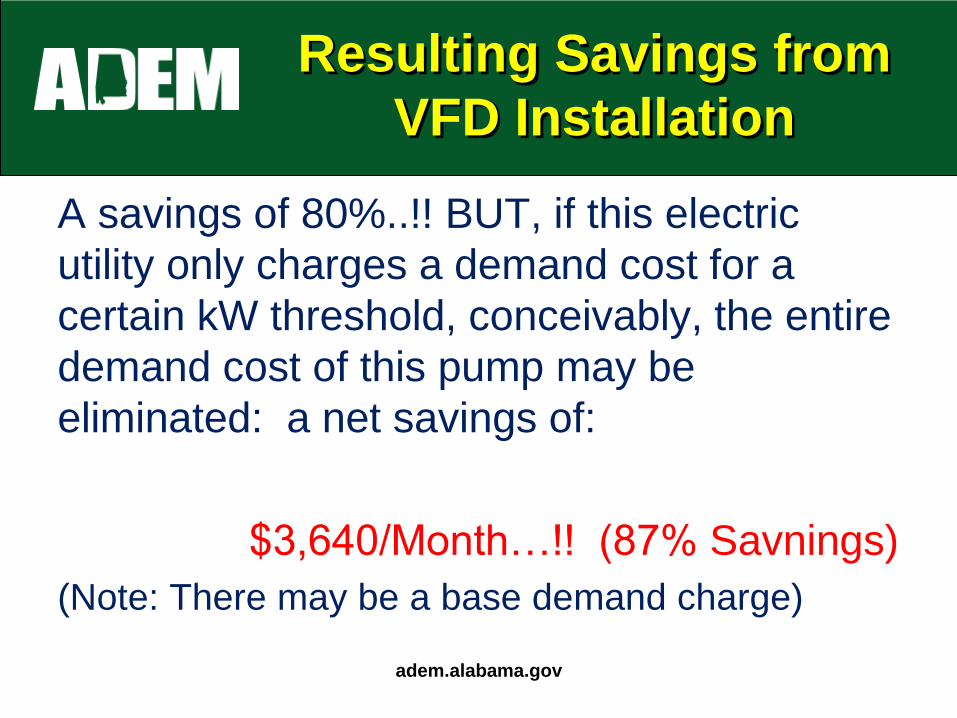
A savings of 80%..!! BUT, if this electric
utility only charges a demand cost for a
certain kW threshold, conceivably, the entire
demand cost of this pump may be
eliminated: a net savings of:
$3,640/Month…!! (87% Savnings)
(Note: There may be a base demand charge)
adem.alabama.gov
Page 54
VFDs can be expensive
• But in many applications, the payback
period is < 2 years
• And annual cost savings continue..!
adem.alabama.gov
Page 55
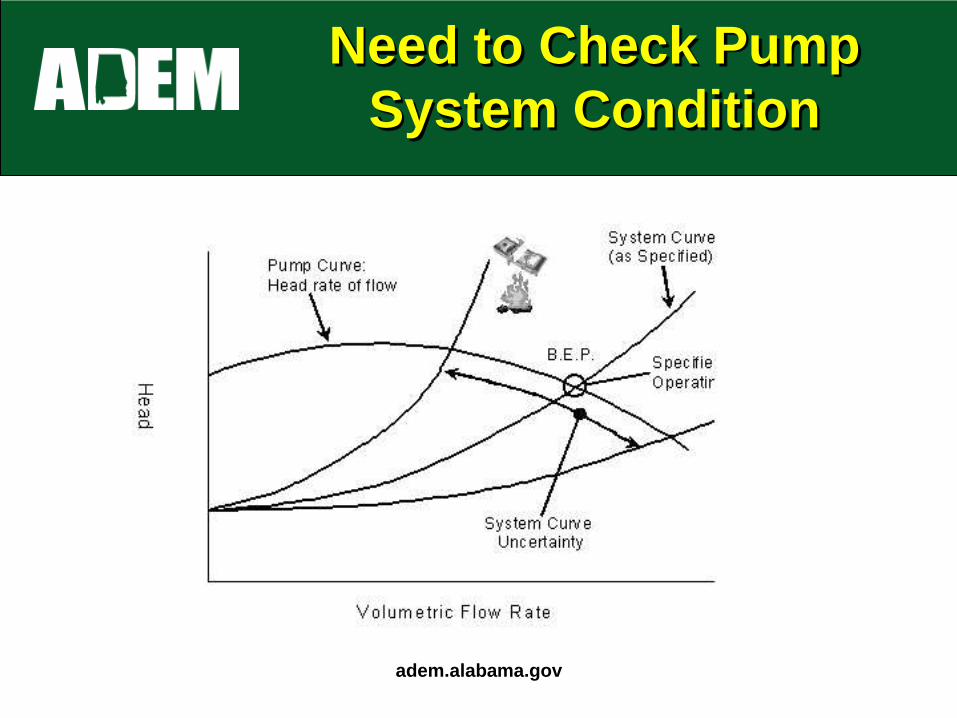
Need to Check Pump
System Condition
adem.alabama.gov
Page 56
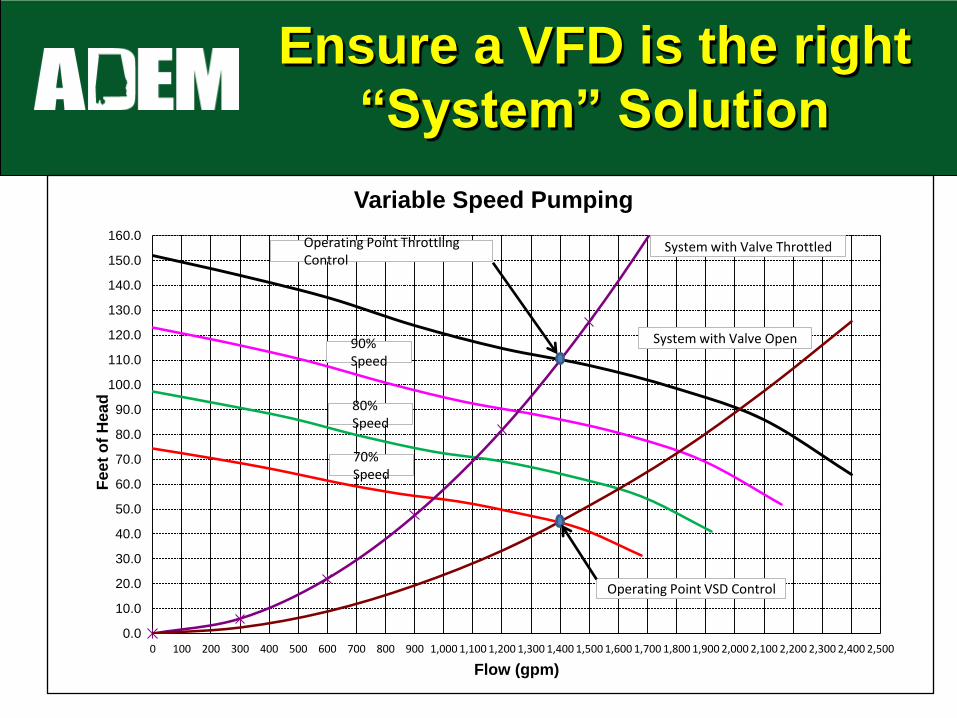
Ensure a VFD is the right
“System” Solution
0.0
10.0
20.0
30.0
40.0
50.0
60.0
70.0
80.0
90.0
100.0
110.0
120.0
130.0
140.0
150.0
160.0
0 100 200 300 400 500 600 700 800 900 1,000 1,100 1,200 1,300 1,400 1,500 1,600 1,700 1,800 1,900 2,000 2,100 2,200 2,300 2,400 2,500
Fee
t o
f H
ea
d
Flow (gpm)
Variable Speed Pumping
90% Speed
80% Speed
70% Speed
System with Valve Throttled
System with Valve Open
Operating Point Throttling Control
Operating Point VSD Control
Page 57
You need to assess each
site-specific Application
adem.alabama.gov
Determine if the pump design and
system design will facilitate reliable
control & operation by using a VFD for
turndown
Page 58
OK…so this is a fan
company
adem.alabama.gov
Page 59
But if you have a REALLY
big pump…
adem.alabama.gov
It warrants a close look
Page 60
Questions..?
Jim Grassiano
Chief, Compliance Assistance & Operator Certification Programs
[email protected]
334-279-3071