Workshop Report Friday 16 October 2009 12:00pm to 3:00pm Charles Barton Auditorium, 10 th Floor Spring Hill Office Complex 477 Boundary Road Spring Hill Queensland Theme: Bringing improvements in asphalt pavements to practice through new design methods, evaluation of products and accelerated pavement testing
Transcript
Workshop Report
Friday 16 October 2009
12:00pm to 3:00pm
Charles Barton Auditorium,
10th Floor Spring Hill Office Complex
477 Boundary Road
Spring Hill
Queensland
Theme:
Bringing improvements in asphalt pavements to practice through new
design methods, evaluation of products and accelerated pavement
testing
PROVISIONAL AGENDA FOR WORKSHOP
When: Friday 16 October 2009, 12:00pm to 3:00pm
Where: Charles Barton Auditorium, 10th Floor Spring Hill Office Complex, 477 Boundary Road, Spring Hill, Queensland
Theme: Bringing improvements in asphalt pavements to practice through new design methods, evaluation of products and accelerated pavement testing
12:00 Registration and snacks 12:10 Welcome Ian Reeves - GM Engineering & Technology, TMR 12:15 Review of challenges to Queensland pavements & surfaces Dave Hubner TMR Peter Bryant TMR 12:30 Presentations by International guest participants
Dr Randy West – Director, National Centre for Asphalt Technology (NCAT) at Auburn University Dr Ramon Bonaquist – Chief Operations Officer, Advanced Asphalt Technologies, Virginia USA General Topics: • Role of NCAT in supplying performance evaluation of asphalt pavements through
accelerated testing and the advantages to Road Authorities and Road Builders • Update on the NCAT Pavement Test Track and associated development work
o Project reports: Use of high percentages of RAP / Perpetual pavement evaluation
o Structural assessment findings against mechanistic-empirical framework o Future plans, State participation and extra benefits of the accelerated
test facility • Validating the endurance limits for hot mix asphalt pavements
01:30 Questions and discussion on topics Ross Guppy facilitator 01:45 APT needs & options Mike Moffat ARRB 02:00 APT experiences in Africa Pablo Balmaceda Hyder 02:10 Workshop & discussion “What to do about knowing more about Queensland pavements?” ”Who should be involved?” “ List to the steps to be taken & timetable to deliver” Ross Guppy facilitator Process: There will be short presentations by local presenters and International Guests with facilitated discussion to improve understanding and to assess possible advantages for Queensland.
1
10/20/2009
Stra
tegi
c A
llian
ce
Stra
tegi
c A
llian
ce W
orks
hop
Wor
ksho
p16
Oct
ober
200
916
Oct
ober
200
9
Accelerated pavement testing, evaluating products & new design methods 1
Workshop Meeting Reportincludes presentations x6 per page
Welcome – Ian Reeves
Road pavement challenges facing DTMR – David Hubner
Pavement Design Challenges – Peter Bryant
NCAT Test Track Overview – Dr Randy West
Plan for validating HMA pavement endurance limits – Dr Ramon Bonaquist
APT needs and options – Mike Moffat
APT in South Africa – Pablo Balmaceda
Workshop - directions
References – Henderson / Yeo paper at ET Forum 2009
Click on each title to show on screen or “right click” and save to your PC
Stra
tegi
c A
llian
ce
Stra
tegi
c A
llian
ce W
orks
hop
Wor
ksho
p16
Oct
ober
200
916
Oct
ober
200
9
Accelerated pavement testing, evaluating products & new design methods 2
What do we need to do to better understand Queensland pavements?
1.State of flux – understand the problems
2.Establish competencies & knowledge requiredInvestmentInternal & external developmentHow do we organise and manage it
3.Where are we exposed - which roads- indentify (in network)
4.Perhaps can’t rely on methodology of the past
5.Design tools need rethinking- trial pavements - poor design methods
6.Look at the sources - don’t reinvent the wheel (ALF)
7. TSD data linked to pavement materials / type / GPR data
8. APT to characterize pavements- use potential future conditions?
9. Relook at pavement design models (subgrade up)
10. Micro-monitoring – data basesMacro – develop performance models
11. Awareness of imposed loads12. Budget allocation $15-20m / 5yrs
or $30m/10yrs13. USA work in asphalt
- potential savings in Qld14. Links to USA to learn from their
experience- Personal exchange – Scanning Tour- Share research - Sponsor APT sections
Normal Distribution Graphs_pavement performance.ppt 1
Heavy Vehicle_PBS_networ k access_research initiatives.ppt
TMR / AAPA Alliance Workshop16 Oct 2009
Welcome ‘sweat’ the pavements
Ian Reeves
Heavy Vehicle_PBS_networ k access_research initiatives.ppt
MaterialsDocumentation
Standards
Design
Funding
Delivery
Planning
RainfallCompetence
RehabilitationMaintenance
Capability
Traffic
Environment
PAVEMENT DNA / GENETICS
Performance
Heavy Vehicle_PBS_networ k access_research initiatives.ppt
No M ea nin gful D efa ul t L RPRDe fau lt L RP RFi lte red Poi nts R eg ressio n L RPRAll Po ints Reg ressio n L RPRNe tw ork Pro fil ePe rce nt >= LR PR (2n d Y a xis)
Good60%
P oor15%
Fair25%
Proba bility D ensity Func tion C umulative D ensity Func tion
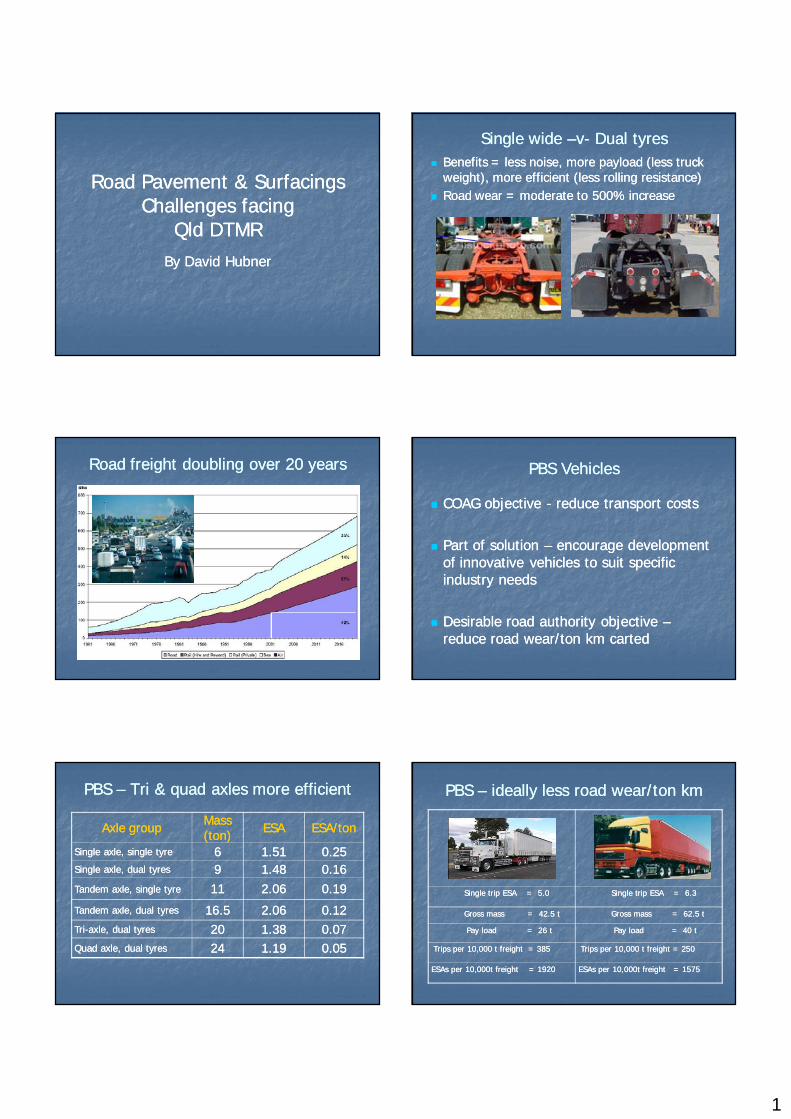
Single wide Single wide ––vv-- Dual tyresDual tyresBenefits = less noise, more payload (less truck Benefits = less noise, more payload (less truck weight), more efficient (less rolling resistance)weight), more efficient (less rolling resistance)Road wear = moderate to 500% increaseRoad wear = moderate to 500% increase
Road freight doubling over 20 yearsRoad freight doubling over 20 years PBS VehiclesPBS Vehicles
COAG objective COAG objective -- reduce transport costsreduce transport costs
Part of solution Part of solution –– encourage development encourage development of innovative vehicles to suit specific of innovative vehicles to suit specific industry needsindustry needs
Desirable road authority objective Desirable road authority objective ––reduce road wear/ton km carted reduce road wear/ton km carted
PBS PBS –– Tri & quad axles more efficientTri & quad axles more efficient
Axle groupAxle group Mass Mass (ton)(ton) ESAESA ESA/tonESA/ton
Single axle, single tyre Single axle, single tyre 66 1.511.51 0.250.25Single axle, dual tyresSingle axle, dual tyres 99 1.481.48 0.160.16Tandem axle, single tyreTandem axle, single tyre 1111 2.062.06 0.190.19
PBS PBS –– ideally less road wear/ton kmideally less road wear/ton km
Single trip ESA = 5.0Single trip ESA = 5.0 Single trip ESA = 6.3Single trip ESA = 6.3
Gross mass = 42.5 tGross mass = 42.5 t Gross mass = 62.5 tGross mass = 62.5 t
Pay load = 26 tPay load = 26 t Pay load = 40 tPay load = 40 t
Trips per 10,000 t freight = 385Trips per 10,000 t freight = 385 Trips per 10,000 t freight = 250Trips per 10,000 t freight = 250
ESAs per 10,000t freight = 1920ESAs per 10,000t freight = 1920 ESAs per 10,000t freight = 1575ESAs per 10,000t freight = 1575
2
PBS PBS –– suit specific industry needsuit specific industry need(Super B(Super B--doubles for bigger shipping containers)doubles for bigger shipping containers)
PBS PBS –– ideally below the blue lineideally below the blue line
Other Pavement design issuesOther Pavement design issuesTri & quad axle road wear Tri & quad axle road wear –– not based on sound not based on sound research (as per single & tandem axles)research (as per single & tandem axles)
Rapid loading by multiple axle vehicles Rapid loading by multiple axle vehicles –– not not accurately researchedaccurately researched
Dynamic load from each axle Dynamic load from each axle –– related road related road wear not fully understoodwear not fully understood
Surfacing shear loadings Surfacing shear loadings –– heavier trucks pulling heavier trucks pulling up grades, more tri & quad axles turning corners up grades, more tri & quad axles turning corners
Possible Solutions to pavement issuesPossible Solutions to pavement issues
Single wide tyresSingle wide tyresAssess overall impacts and benefitsAssess overall impacts and benefitsIf positive, limit use to ‘low wear’ single tyresIf positive, limit use to ‘low wear’ single tyresFurther improve ‘low wear’ aspectsFurther improve ‘low wear’ aspects
Freight doublingFreight doublingEncourage ‘low wear’ PBS vehiclesEncourage ‘low wear’ PBS vehiclesExtent PBS network (B triple network) Extent PBS network (B triple network) Allow high axle loads via ‘user pays’ Allow high axle loads via ‘user pays’
Possible Solutions to pavement issuesPossible Solutions to pavement issuesResearchResearch
Numerical assessment Numerical assessment –– Austroads projectAustroads projectBasic research Basic research –– need new ALFs (several ALFs, need new ALFs (several ALFs, 1,2,3 & 4 axles, 100% overloads, lab and insitu 1,2,3 & 4 axles, 100% overloads, lab and insitu testing, many samples across network)testing, many samples across network)
Possible Solutions to pavement issuesPossible Solutions to pavement issuesResearch (continued)Research (continued)
Network Assessment technologyNetwork Assessment technologyfor opening road after inundation &for opening road after inundation &assessing long term freight carrying redundancyassessing long term freight carrying redundancy
•• Must be low cost and high speedMust be low cost and high speed•• high speed deflectograph (strength)high speed deflectograph (strength)•• ground penetrating radar (moisture & thickness)ground penetrating radar (moisture & thickness)•• Thornswaite index (climate)Thornswaite index (climate)•• pavement moisture sensitivity (sealed shoulders, low or pavement moisture sensitivity (sealed shoulders, low or
poorly drained formation, bound pavement, general geology, poorly drained formation, bound pavement, general geology, quality of maintenance) quality of maintenance)
Possible Solutions to pavement issuesPossible Solutions to pavement issuesResearch (continued)Research (continued)
Better surfacings Better surfacings -- SMA SMA –– Austroads projectAustroads project
Lack of binder in manufactured gravels Lack of binder in manufactured gravels –– rapid potholings rapid potholings -- add low add low amounts of cement/limeamounts of cement/lime
Pavement Types in QueenslandTMR network length is 33,700 kmAbout 98% unbound granular or cement treated granular with thin bituminous surfacing (bitumen sealed or asphalt);Only about 2% are thick asphalt (more than just the surface) or concrete.
Traffic in QldAADT < 20 to AADT > 130,000
0
5
10
15
20
25
30
35
No Data
<= 99
100 t
o 249
250 t
o 999
1,000
to 4,
999
5,000
to 9,
999
10,00
0 to 1
4,999
15,00
0 to 2
4,999
25,00
0 to 3
9,999
>= 40,0
00
AADT Category
Perc
enta
ge o
f Que
ensl
and
Mai
n R
oads AADT T raffic Categ ory Len gth (km) Percentage
No Data 994 3.0<= 99 10,361 30.8
100 to 249 6,220 18.5250 to 999 8,463 25.1
1,000 to 4 ,999 5,490 16.35,000 to 9 ,999 899 2.7
10,000 to 14,999 432 1.315,000 to 24,999 394 1.225,000 to 39,999 264 0.8
>= 40,000 165 0.5TOT AL 33,683 100.0
Typical Heavy Duty Full Depth Asphalt Pavement in Qld
40 mm open graded asphaltPMB waterproofing seal50 mm size 14 mm dense graded asphalt (PMB)300 mm size 20 mm dense graded asphalt (C600)150 mm cement modified granular working plat.Selected fill &/or existing subgrade
Existing Design Models
Asphalt fatigue based on Shell (1978)
5
360 ⎥⎥⎦
⎤
⎢⎢⎣
⎡ +=
με S1.08) V6918(0.856 RF N .
mix
B
Future (& current) ChallengesDesigning beyond the intent of existing design proceduresIncreasing freight taskClimate ChangeNew materials, recycled materialsInnovationsMaintaining technical capabilityTraditional pavement types unsuitable or need improvement
17/10/2009 Page 2
Asphalt Fatigue Endurance Limit
Current designs have surpassed 500 mm of asphaltIs this beyond calibration of current design procedure?In 08/09 MR commissioned ARRB to undertake a literature review
Fatigue Endurance Limit
Source: AASHTO (1998)
Asphalt Fatigue Endurance Limit
Laboratory fatigue life is much greater at low strain levels than predicted by extrapolating performance at higher strain levelsExisting studies suggest a fatigue limit of 70 to 100 microstrainAn upper limit in asphalt thickness may be possible
Asphalt Fatigue Endurance Limit
Source: Nunn et al. (1997)
Conclusions
What do we need to do to better understand Queensland pavements?
Missed opportunities
1
at Auburn University
2
NCAT Pavement Test Track
3
The NCAT Pavement Test Track• 1.7 mile oval asphalt track• 45 experimental test sections, each 200 ft. long• Test sections are sponsored by highway agencies and
businesses to evaluate specific materials and/or pavement design strategies
• Realistic traffic applies 10 million ESALs in each two year cycle
• This year begins the 4th cycle of the test track
4
• Fine and coarse mixes perform similarly• Modified binders cut rutting approximately in half• Dense-graded mixes perform as well as SMA• Lower Ndesign is OK• Aggregate specifications
– F&E for SMA & OGFC– Polishing prone aggregates– Elimination of Restricted Zone– Gravel performs well in SMA & OGFC
• High RAP Mixes perform well
Test Track Research Findings
5
• Drainable, quite OGFC• Performance limits
– Air voids– Asphalt Pavement Analyzer– Flow Number
• Top-down cracking prediction methodology• Validation of pavement temperature models
Test Track Research Findings
6
• Mechanistic (σ-ε) models validated and calibrated – Measured vs. predicted HMA tensile stresses
and compressive stresses in unbound layers– Seasonal effects on pavement layers– Traffic wander– Transfer functions for strain damage– Speed vs strain / load pulse – Field fatigue thresholds– Atypical HMA response
Test Track Research Findings
2
The NCAT Test Track The 4th Cycle
2009 Group Experiment
Conventional Permeable Low Surface High Surface Foamed Additized Thiopave Thiopave Kraton UniqueDense Surface on RAP % RAP % Warm Warm Warm Warm Modified BinderHMA Dense HMA High Base High Base Mix Mix Sulfur Sulfur Mix Mix
Thickness Thickness Thickness
7 inches 7 inches 7 inches 7 inches 7 inches 7 inches 7 inches to be to be to be
• Evaluate the performance of each test section with regard to rutting, fatigue cracking, raveling, smoothness, etc.
• Evaluate responses of test sections in structural analyses– Refine models relating mix properties to structural
response of a pavement for any load and environment
– Link between lab properties and field performance
21
Lab Testing
at Auburn University
Field Correlation of Performance Tests
• Permanent Deformation– NCAT Test Track– APA, Flow Number, E*
• Fatigue Cracking/Top Down Cracking– No experimental design– Fracture Energy, Bending Beam, TOT, Energy
Ratio– 2009 GE+ sections– AMPT Continuum Damage test
23
Asphalt Pavement Analyzer• Test procedure:
– AASHTO TP 63– SGC or field cores– Sample voids: 7±0.5%– Wheel load: 100 lbs– Hose pressure: 100 psi
5
Repeated Load Triaxial Permanent Deformation
• Test method – Developed under NCHRP 9-19– Lab prepared specimens
• Test equipment (AMPT or SPT)– Developed under NCHRP 9-29
• Development of rutting model– NCHRP 9-30A
Experimental PlanFn
Ndes 120lb / 120psi
7% 100lb / 100psi
7% 70psi / 10psi
N1 FL Super 67-22 0 12.5 6 6 3N2 FL Super 76-22 0 12.5 6 6 3N8 OK SMA 76-28 0 12.5 6 6 3
N10 MO Super 70-22 0 12.5 6 6 3S2 MS Super 76-22 15 9.5 6 6 3S6 TN 411-D 64-22 15 12.5 6 6 3
S7A IN Super 64-22 0 12.5 6 6 3S7B IN Super 64-22 0 12.5 6 6 3S8A IN Super 64-22 0 12.5 6 6 3S8B IN Super 64-22 0 12.5 6 6 3S11 AL Super 76-22 0 9.5 6 6 3S12 TX D-A 76-22 0 9.5 6 6 3
72 72 36No. of Test Sepecimens
APASect. Sponsor Mix Type Binder RAP% NMAS
APA Acceptance Criterion
r = 0.795, p-value = 0.002
0.0
2.0
4.0
6.0
8.0
10.0
12.0
0 5 10 15 20 25 30 35 40
Field Rut Depth (mm)
APA_
7%_1
00lb
/psi
_Aut
o (m
m)
APA_7%_100lb/psi_Auto Linear (APA_7%_100lb/psi_Auto)
• Combines the practicality of empirical methods with the technical soundness of mechanistic solutions.
• Uses mechanistic analysis, to determine the pavement responseto imposed loads…then applies “empirical” formulations (i.e. “transfer functions”) to determine the development of distressdue to the load-induced pavement response.
Max Tensile Strain
Pavement Foundation
High Modulus Mix(Varies As Needed)
Flexible Fatigue ResistantAsphalt Mix 3 - 4”
1.5 - 3” SMA, OGFC or Superpave
4”to6”
Zone of HighCompression
•Perpetual PavementsPerpetual Pavements Perpetual Pavement versus Conventional Design
7
Structural Design & Analysis
Temperature-Strain Relationship
N1y = 0.1049x1.9224
R2 = 0.788
N2y = 0.0053x2.5672
R2 = 0.7274
N3y = 0.1044x1.7348
R2 = 0.8987N4
y = 0.0072x2.3567R2 = 0.8656
N5y = 0.0281x2.1196
R2 = 0.9092
N7y = 0.0169x2.2355
R2 = 0.7454
N8y = 0.318x1.5002
R2 = 0.6389
N6y = 0.0412x2.0461
R2 = 0.9176
0
200
400
600
800
1000
1200
1400
40 50 60 70 80 90 100 110
Temperature
Stra
in, m
icro
stra
in N1
N2
N3
N4
N5
N6
N7
N8
Dr. David Timm
at Auburn University
Mechanistic-Empirical DesignLoad Configurations
Material Properties
Layer Thicknesses
Mechanistic Model Stress, Strain, Deflection
211
k
kN ⎟⎠⎞
⎜⎝⎛=ε
Miner’s Hypothesis
∑=NnD
D>1?D<<1?
Yes
Final Design
No
at Auburn University at Auburn University
1
10
100
1000
10000
25 35 45 55 65 75 85 95 105 115 125
Mid depth Temperature, F
HM
A S
tiffn
ess,
ksi
N1N2N3N4N5N6N7N8
HMA Characterization
21
ββε Tt = 21
ββε Tt =
TeE 21
αα=
at Auburn University at Auburn University
8
at Auburn University
2006 Structural Experiment Cross SectionsFL AL FHWA OK MO
Strain Instrumentation and Wireless Data Acquisition
• Criteria1. No fatigue cracking2. Substantial trafficking3. Not overdesigned
10
0%
10%
20%
30%
40%
50%
60%
70%
80%
90%
100%
0 100 200 300 400 500
Microstrain
Perc
entil
e Average+15-15N3N4
1
Advanced Asphalt Technologies, LLC
“Engineering Services for the Asphalt Industry”
NCHRP 9-44
Developing a Plan for Validating an Endurance Limit for HMA Pavements
Ramon Bonaquist, P.E.Chief Operating OfficerAdvanced Asphalt Technologies, LLC
Advanced Asphalt Technologies, LLC
“Engineering Services for the Asphalt Industry”
Is There an Endurance Limit?
• Well documented field studies indicate that bottom-up fatigue cracking does not occur in thick flexible pavements.
• Laboratory studies support a change in the slope of the strain versus number of cycles relationships at low strain levels.
Advanced Asphalt Technologies, LLC
“Engineering Services for the Asphalt Industry”
University of Illinois Data
Advanced Asphalt Technologies, LLC
“Engineering Services for the Asphalt Industry”
Definition
• Endurance Limit for HMA Pavements is:
A level of strain below which there is no cumulative damage over an indefinite number of load cycles.
Advanced Asphalt Technologies, LLC
“Engineering Services for the Asphalt Industry”
Project Objective
• To prepare a work plan and associated cost estimate for a future study to validate the endurance limit for asphalt concrete.
Advanced Asphalt Technologies, LLC
“Engineering Services for the Asphalt Industry”
Approach
• Incorporate the concept of an endurance limit for HMA into a mechanistic-empirical algorithm for bottom initiated fatigue cracking in flexible pavements.
• Validate the methodology using performance data from full-scale pavement sections.
2
Advanced Asphalt Technologies, LLC
“Engineering Services for the Asphalt Industry”
Hypothesis
• HMA does exhibit an endurance limit. • This endurance limit, however, does not reflect an
absence of load induced damage in the HMA. • It is the result of a balance of damage caused by
loading and healing or damage recovery that occurs during rest periods.
Advanced Asphalt Technologies, LLC
“Engineering Services for the Asphalt Industry”
Threshold Strain
• Strain below which fatigue damage does not accumulate
• Depends on– Material properties– Temperature– Rest period
Advanced Asphalt Technologies, LLC
“Engineering Services for the Asphalt Industry”
Pavement Design Objective
• Ensure that the damage induced by loading remains small enough so that healing occurs between traffic loads and there is no accumulation of damage over the life of the pavement
• Any pavement can be a perpetual pavement– Thicker pavements for heavier loads,
shorter rest periods, and poorer subgrade support
Advanced Asphalt Technologies, LLC
“Engineering Services for the Asphalt Industry”
Threshold Strain Design
• Compute strain at the bottom of the asphalt layer.– Seasonal variations– Mixed traffic
• Compare to threshold strain.• Applied strain < threshold strain
Advanced Asphalt Technologies, LLC
“Engineering Services for the Asphalt Industry”
Proposed Research
• Phase 1– Laboratory determination of threshold
strains– M-E Algroithm
• Phase 2– Field verification and caliabration
Advanced Asphalt Technologies, LLC
“Engineering Services for the Asphalt Industry”
Laboratory ExperimentsExperiment Topic Factors
1 Mixture Compositional Factors Affecting Healing in HMA
• Binder Type • Binder Age • Effective Binder Content • Air Voids • Design Compaction • Gradation • Filler Content
2 Effect of Applied Strain on Healing
• Strain Level • Healing Rate From Experiment 1
3 Effect of Temperature and Rest Period Duration on Healing
• Temperature • Rest Period Duration
4 Development of Testing and Analysis Procedures to Determine Threshold Strain Levels
• Healing Rate From Experiment 1 • Mixtures From NCHRP 9-38
5 Estimation of Threshold Strain Levels from Mixture Composition
• design traffic required very heavy duty pavement• needed a low risk solution• four main pavement options being considered:
rigid – jointed unreinforced concrete US$48/m2
asphalt on cement treated subbase US$46/m2
asphalt on unbound granular US$41/m2
two coat spray seal on unbound granular
US$26/m2
www.arrb.com.au 12
ALF test of actual construction in-situ undertaken:– test of new spray sealed granular pavement design– new high standards for construction– aimed to prove pavement could carry heavy traffic and
reduce risk
10/17/2009
3
www.arrb.com.au 13
Results:
• structural adequacy of the pavement was confirmed
• higher construction standards adopted elsewhere
• extensive lengths of this pavement type were constructed at a significant cost advantage compared to other designs
• BCR of 5.4 resulted from the research
• long term pavement performance monitoring commenced
www.arrb.com.au 14
uncertainty
www.arrb.com.au 15
2007
Need means of predicting performance of unbound materials
APT – Controlled loading to simulate long term in-service loading conditionsAccelerated accumulation of damageControlled testing environmentStarted with AASHTO road testThree types: full scale mobile, full scale fixed, and mobile Simulation of many years of traffic within weeks or months
APT in South AfricaFirst HVS prototype: 1968Initiation of HVS programme with 3 HVS units: 1978Development of Multi-depth Deflectometer: 1980First TRH4 Guideline: 1980First draft of SAMDM: 1980 – Freeme, Maree, PattersonTesting on road and airport pavements: granular layers, GEMS, cemented layers, LAMBS: 1980 - 1993Development of temperature control chamber and new data acquisition system for HVS: 1993 – 1994
HVS testing on Caltrans Trial Sections in SA after sell of two units to Caltrans: 1994HVS testing on superlight pavements, porous asphalt: 1995Another HVS unit sold to the US Corps of Engineers: 1995Update of SAPMDM and THR4: 1996 - TheyseDevelopment of 3D stress sensor and laser profilometer: 1996 – 1997Delivery of a HVS units to RRL in Finland and Sweden: 1997Testing on various pavements types including LI built ones
HVS - GeneralOriginally developed in 1968More than 500 test sectionsHydraulically operated loading assembly carrying single/dual wheelWheel Loads from 20 to 100 kN at 14 km/h and 200 kN for airport pavements (Bigfoot)Track with: 1.5 m, track length: 8 mHVS test facilities in California, Florida, CRREL, Sweden-Finland
Established in 1998 by MLS Test Systems in Stellenbosch 20 APT research projects since 1998MLS10: 3m x 3m x 2.4m frame4 wheel bogies at 26 km/h, 7200 axle loads/hour - UnidirectionalHydraulically operatedIN 2004, APT in Mozambique
Standarized field and laboratory set-ups Tests in dry heated or wet heated modes4 bogies, 1 axle/bogie, 1 wheel/axleMaximum tracking with: 80 mmLoad/wheel: 1900 @ 560kPa or 2700 @ 800 kPa. So loads are scales but real tyre pressures7,200 load applications/hourSuitable to explore performance of upper 125 mm of pavement
Numerous Technical Developments and Design Guidelines for a large array of pavement materials: subgrade, asphalt, granular (crushed stone, gravel, sands), CTB, ETB, GEMS, FBMB, UTCRCP in various pavement configurations, compaction ranges and environmental conditions.Overlay thickness designsInput on construction practices and specificationsInput on pavement materials mix designs and testingInput on quality control by better defining correlations between HVS tests and laboratory indicator testsSubstantial economic benefits from APT implementation