SBP audit report for Energy and GHG data (SAR) Version 1.2, March 2018 SBP audit report on Energy and GHG data (SAR) (For Biomass Producers) SBP certificate Holder number: SBP-07-04 SBP Certificate Holder name: Granules LG inc. Reporting period: Dates To / From March 31 st , 2019 - April 1 st , 2018 Static Date References (SDIs) included in this report: SBP-07-04-03 (sold at the mill's gate); SBP-07- 04-04 (sold at port of Grand Anse)
Transcript
SBP audit report for Energy and GHG data (SAR)
Version 1.2, March 2018
SBP audit report on Energy and GHG data (SAR)
(For Biomass Producers)
SBP certificate Holder number: SBP-07-04
SBP Certificate Holder name: Granules LG inc.
Reporting period: Dates To / From March 31 st , 2019 - April 1 st , 2018
Static Date References (SDIs) included in this repo rt: SBP-07-04-03 (sold at the mill's gate); SBP-07-04-04 (sold at port of Grand Anse)
SBP audit report for Energy and GHG data (SAR)
Version 1.2, March 2018
GENERALITIES
PART 1 – Administrative information Basic information on the Certification Body (CB)
Date of audit (on site) 3 July 2019
Name of the Certification Body NEPCon
Audit team members Christian Rahbek
Qualifications of team members
M.Sc. (Forestry) from University of Copenhagen. Has passed NEPCon Lead Auditor Training for FSC and PEFC FM and CoC certification and has completed SBP Lead auditor training.
General Information on the legal owner
Company name Granules LG inc.
Contact person on site André L’Heureux
Contact person’s f unction Research and development director
Address (physical location of the biomass production unit)
Telephone
750 Chemin de la Moraine, St-Félicien (Québec) G8K 0A1,
tel.: (418) 275-5222 ext. 331
fax: (418) 275-5242
Describe the location and the surroundings of the production unit:
(for example, in an industrial estate, in forest area, next to a sawmill, next to a harbour...)
The mill is located in the industrial zone of Saint-Félicien. They
are next to another mill supplying biomass fuel to Granules LG
for drying purposes.
Geographic coordinates of biomass production unit:
48.640761, -72.415891
Please indicate company office address if different from the production unit Address
n/a
Description of activity occurring at
this location
Telephone / Fax company office
SBP audit report for Energy and GHG data (SAR)
Version 1.2, March 2018
Please indicate address of off-site storage, handli ng or trans-shipment facility, if any Address
Port de Grand-Anse
Chemin de la Grande-Anse
La Baie (Québec) G7B 0G3
Description of activity occurring at
this location
Storage - Logistic site
Telephone / Fax company office
Telephone: (418) 687-0250
Fax : (418) 697-0243
Operating licence of the legal owner
Type and reference number Dossier 2010092434
Place and date of issue Québec, 01/12/2010
Issued by Gouvernement du Québec
Certifications held by the legal owner (if applicab le)
Certification type and reference number
(SBP, ISO 9001:2000, ISO 14001:2004, SA 8000:2001, Other…)
PEFC CoC
BNQ-PEFC-COC-51574
Place and date of issue Ville de Québec, 09/01/2017
Certification Body Bureau de normalisation du Québec (BNQ)
Certification type and reference number
(SBP, ISO 9001:2000, ISO 14001:2004, SA 8000:2001, Other…)
CANplus/ENplus, CA 003
Place and date of issue North Vancouver, 17/06/2016
Certification Body Control Union
SBP audit report for Energy and GHG data (SAR)
Version 1.2, March 2018
Geographic location of the production unit Insert the location of the biomass factory on a reg ional map:
Insert the location of any port facility on a regi onal map:
SBP audit report for Energy and GHG data (SAR)
Version 1.2, March 2018
SECTION A: Input Groups for Biomass Production
Feedstock sourcing and certification Introduction This part has been designed for essentially woody biomass. Nevertheless, please mention any other type of bio fuel that is used as feedstock if applicable. On the following pages, it is necessary to list all the main sources of feedstock suppliers for each Input Group for Biomass Production. Input Groups for Biomass Production shall be defined in compliance with the requirements specified in Instruction Document 5B, section 4.1 Setup of Input Groups for Biomass Production. This Section (A) shall be completed for each Input Group for Biomass Production. Description of the Input Groups for Biomass Product ion FEEDSTOCK ID# 1 (If different Input Groups for Biomass Production are used, please use one copy of this table for each.) Country / region of origin: Canada >99%: Provinces of Québec, Ontario and New Brunswick USA <1%: States of New York, Vermont, New Hampshire, Maine
mass ratio (this Input Group for Biomass Production / Total feedstock) for the Reporting Period: 100 %
Type, origin and form of the feedstock as received
Transport data
1) TYPE (Tick only one box), � primary feedstock from forests (products or residues)
� woody energy crops (primary feedstock)
X wood industry residues (secondary feedstock)
� post-consumer wood (tertiary feedstock)
2) PHYSICAL FORM More than one physical form is allowed in one group.) x sawdust
x shavings
� wood offcuts
� wood chips
� wood bark
� roundwood
� wood logs
� tree bark
Select all types of vehicle used:
� conveyor belt
X truck
� train
� river boat
� other (specify)
Maximum distance to the BP per vehicle type used: 316 km
Average distance to the BP per vehicle type used: 62,7 km
Average load per vehicle tonne:
14 metric tonne
In-forest use of chemicals - Not applicable
To be completed in compliance with ID5B section 5.2.
Per metric tonne of feedstock:
SBP audit report for Energy and GHG data (SAR)
Version 1.2, March 2018
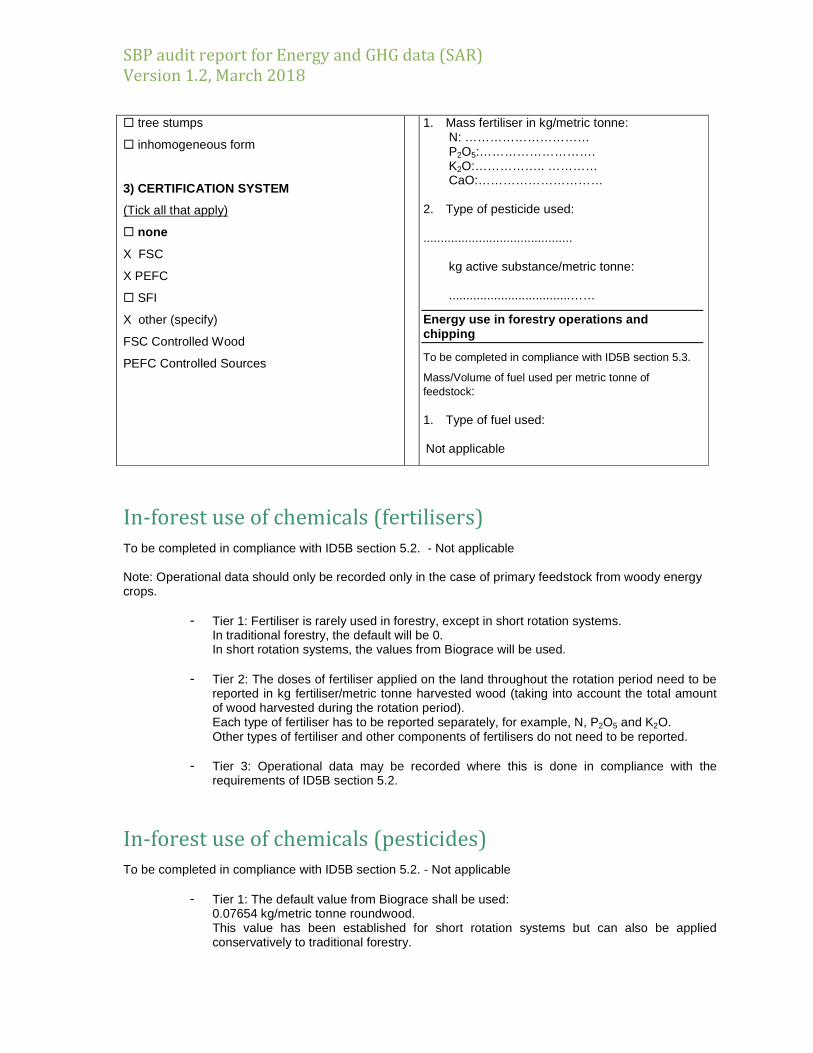
� tree stumps
� inhomogeneous form
3) CERTIFICATION SYSTEM
(Tick all that apply)
� none
X FSC
X PEFC
� SFI
X other (specify)
FSC Controlled Wood
PEFC Controlled Sources
1. Mass fertiliser in kg/metric tonne: N: ………………………… P2O5:………………………. K2O:…………….. ………… CaO:…………………………
2. Type of pesticide used: ...........................................
kg active substance/metric tonne: ...................................……
Energy use in forestry operations and chipping
To be completed in compliance with ID5B section 5.3.
Mass/Volume of fuel used per metric tonne of feedstock:
1. Type of fuel used: Not applicable
In-forest use of chemicals (fertilisers)
To be completed in compliance with ID5B section 5.2. - Not applicable Note: Operational data should only be recorded only in the case of primary feedstock from woody energy crops.
- Tier 1: Fertiliser is rarely used in forestry, except in short rotation systems. In traditional forestry, the default will be 0. In short rotation systems, the values from Biograce will be used.
- Tier 2: The doses of fertiliser applied on the land throughout the rotation period need to be reported in kg fertiliser/metric tonne harvested wood (taking into account the total amount of wood harvested during the rotation period). Each type of fertiliser has to be reported separately, for example, N, P2O5 and K2O. Other types of fertiliser and other components of fertilisers do not need to be reported.
- Tier 3: Operational data may be recorded where this is done in compliance with the requirements of ID5B section 5.2.
In-forest use of chemicals (pesticides)
To be completed in compliance with ID5B section 5.2. - Not applicable
- Tier 1: The default value from Biograce shall be used: 0.07654 kg/metric tonne roundwood. This value has been established for short rotation systems but can also be applied conservatively to traditional forestry.
SBP audit report for Energy and GHG data (SAR)
Version 1.2, March 2018
- Tier 2: The dose of pesticide used in the forest throughout the rotation period needs to be
reported in kg active substance/metric tonne harvested wood (taking into account the total amount of wood harvested during the rotation period). The concentration of the active substance is taken into account in the calculation.
- Tier 3: Operational data may be recorded where this is done in compliance with the requirements of ID5B section 5.2.
Energy use in forestry operations and chipping
To be completed in compliance with ID5B section 5.3. - Not applicable As energy expenses in forestry are difficult to monitor, tier 1 or 2 can be used instead of tier 3.
- Tier 1: In the absence of readily available data, a default value may be used:
1.67 litre diesel / metric tonne roundwood (computed from Biograce).
- Tier 2: If there are specific data based on statistics for the relevant region, they can be used.
- Tier 3: All the fuel use throughout the rotation period is reported. The amount is divided by the total amount of wood harvested during the rotation period (litre fuel / metric tonne roundwood).
Other relevant information, including justification s for data provided and methodologies used:
On average, direct suppliers are located within 40km to the mill. Only one direct supplier is located more than 300km from the facility. No primary feedstock is received, fertilizer, pesticides and fuel use for forestry and chipping is not applicable.
Validation by the CB Parameter Comments/information
Geographical origin of the feedstock used for making the pellets
What evidence was available on site to confirm this origin? (for example, CMR, supplier invoices, supplier contracts, registers)
The system for registering the name of the supplying industries was verified on-site, along with verification of supplier records and the reverse invoices to the suppliers. Sub-suppliers were identified and documented on the platform woodsupplychain.com and allowed to define more precisely the whole supply base of the facility.
Are the average distances validated by checking locations on a map?
Yes, this was carried out against the names of the supplying industries their
SBP audit report for Energy and GHG data (SAR)
Version 1.2, March 2018
locations on google maps, and the interactive map of the FMUs supplying these industries, which was provided by the BP in the online tool at www.woodsupplychain.com
Types of feedstock
What evidence was available on site to confirm what type of feedstock is used? (for example, CMR, supplier invoices, supplier contracts, registers, physical evidence on site)
The feedstock types and physical from was verified based on inputs being received, samples of inputs awaiting analysis for MC, supplier invoices and the physical stocks of feedstock on-site.
Transport systems
Was the auditor able to confirm the type of vehicles / transport facilities used to transport the feedstock to the production site? (visual checking?)
The size and type of truck was confirmed by visual checking, and review of weighbridge slips on site.
Certification systems
If the delivered feedstock is wood certified against a recognised international forestry standard, please provide the approved certificate numbers or references. Please explain in detail what is covered by the wood certification scheme (for example, the BP itself, some of its suppliers, all of its suppliers, the feedstock). All feedstock from one supplier (Produits Forestiers Resolu - SAI-PEFC-1607950) are received and purchased as 100% PEFC Certified; all other feedstock supplies are received and purchased PEFC Controlled Sources under the BP’s own PEFC Due Diligence System.
SBP audit report for Energy and GHG data (SAR)
Version 1.2, March 2018
SECTION B: Energy use for biomass production
PART 2 – Biomass production chain General data
Annual production
Recent effective production:
Data should be based on the Reporting Period 101,931 metric tonnes of pellets/year The above reported production has been achieved during the following period: April 1st 2018 – March 31st 2019
Production capacity 109,000 metric tonnes of pellets/year
Expected production (if an expansion is expected) :
n/a metric tonnes of pellets/year
CB. What evidence is available to substantiate the reported annual pellet production? Options include: internal registers, annual reports or sales documents.
The BP provided detailed production reports as documentation for the annual production volume in the reporting period, which is also the fiscal year of the BP.
Supplier of the processing equipment (mills, densifiers) if applicable
� Andritz (Sprout-Matador, ADR Geldrop)
� California Pellets Mill
� Kemyx
☒ Other, specify: Pellet Mills: 2 BLISS from 2002 and 1 BLISS from 2004.
Date of commissioning of the biomass production plant December, 2010
SBP audit report for Energy and GHG data (SAR)
Version 1.2, March 2018
Describe the biomass production process, focusing on any variation from accepted practice, and including a detailed description of the processes undergone by feedstock. In particular, at each stage, mention elements that might influence the calculation of the net fossil CO2 emissions. Production stage Description Feedstock delivery, storage and handling
All feedstock delivery is done by truck departing from 1st processing and 2nd processing facilities to our location. Trucks are weighted on arrival at our facility. Material is received and unloaded in yard with handling done by diesel loaders.
Reception - Dry material is stored in warehouse. - Humid material is stored in wood yard and dried with
rotary (LG1) and flash fuel (LG2) dryers. (fuel is dryed biomass material (LG1); natural gas for LG2; electricity is used to activate rotary (LG1+LG2)))
Milling - Dry material is mixed together, sawdust and shavings,
and processed to desired sieves. (electricity activates milling process).
- Final humidity content is obtained with energy produced with biomass boiler.
Pelletising - Desired input is pellitized.
Pellets are cooled. Biomass storage, handling and shipping - Pellets are stored in silos for shipping.
- Pellets are sieved before loading trucks for export.
Energy fibre supply - Material flow described as “Logs and energy fibre supply” in diagram on the following page consists solely of fibre used as fuel in dryers, and strict segregation is maintained from feedstock
The description should include pictures of at least the following:
- Feedstock storage - Overview of biomass manufacturing plant - Dryer(s) (if any) - Press(es) - Biomass storage and handling
A ground plan of the facilities and / or a flowchart should also be included if available.
1 If any feedstock enters the site as logs, please specify clearly what machinery is used to crush the logs before they can enter the process together with the rest of the feedstock. In particular, the energy source used for this crushing must be stated and mentioned in section 4 of the document.
SBP audit report for Energy and GHG data (SAR)
Version 1.2, March 2018
SBP audit report for Energy and GHG data (SAR)
Version 1.2, March 2018
This table should only be completed if no drying is undertaken.
Moisture content
Initial moisture of the feedstock, as received
Explain, with reference to its origin, why the moisture content of the feedstock is sufficiently low to enable the production of pellets without prior drying.
Biomass moisture content
SBP audit report for Energy and GHG data (SAR)
Version 1.2, March 2018
This table should only be completed if drying is un dertaken.
Dryer information
Manufacturer
MEC Dryer
Type � drum dryer � belt dryer � other (specify)…Flash dryer…………
Energy carrier (The energy carrier is the transfer medium circulated in pipes and used to transport the heat from the boiler/burner to the dryer.)
� steam � hot water � hot air / flue gases � other (specify)…………………………
Heat consumption
If a heat meter is installed, calculate how much heat energy from the boiler is provided to the dryer and give details of the calculation.
If no heat meter is installed, there is no need to provide a figure.
� heat meter installed : consumption = .................kWh / metric tonne reference period..................................... details of the calculation.........................
CHP efficiency ...........% = (valorised heat + net electricity) / primary energy input
Moisture content
Initial moisture of the feedstock 45 % moisture content for feedstock sawdust (wet basis)
If any of the feedstock is not fresh wood (moisture content <45%) explain its moisture content (for example, wood is from dead trees, sawdust is from an industry working with dry material).
12% moisture content for feedstock dried shavings
Moisture of feedstock at the dryer outlet, if measured (target moisture)
8-9 % (wet basis)
Moisture of the pellets (final moisture)
5.75 % (wet basis)
SBP audit report for Energy and GHG data (SAR)
Version 1.2, March 2018
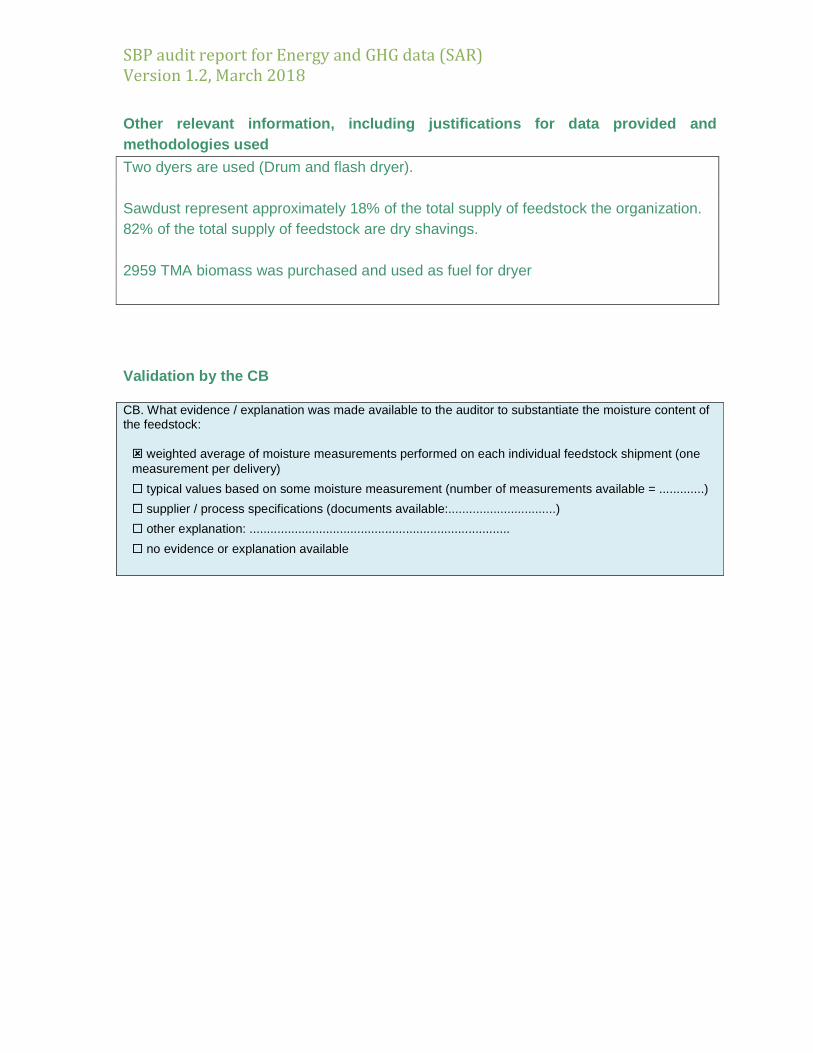
Other relevant information, including justification s for data provided and methodologies used
Two dyers are used (Drum and flash dryer). Sawdust represent approximately 18% of the total supply of feedstock the organization. 82% of the total supply of feedstock are dry shavings. 2959 TMA biomass was purchased and used as fuel for dryer
Validation by the CB CB. What evidence / explanation was made available to the auditor to substantiate the moisture content of the feedstock: � weighted average of moisture measurements performed on each individual feedstock shipment (one measurement per delivery)
� typical values based on some moisture measurement (number of measurements available = .............)
� supplier / process specifications (documents available:...............................)
� other explanation: ...........................................................................
� no evidence or explanation available
SBP audit report for Energy and GHG data (SAR)
Version 1.2, March 2018
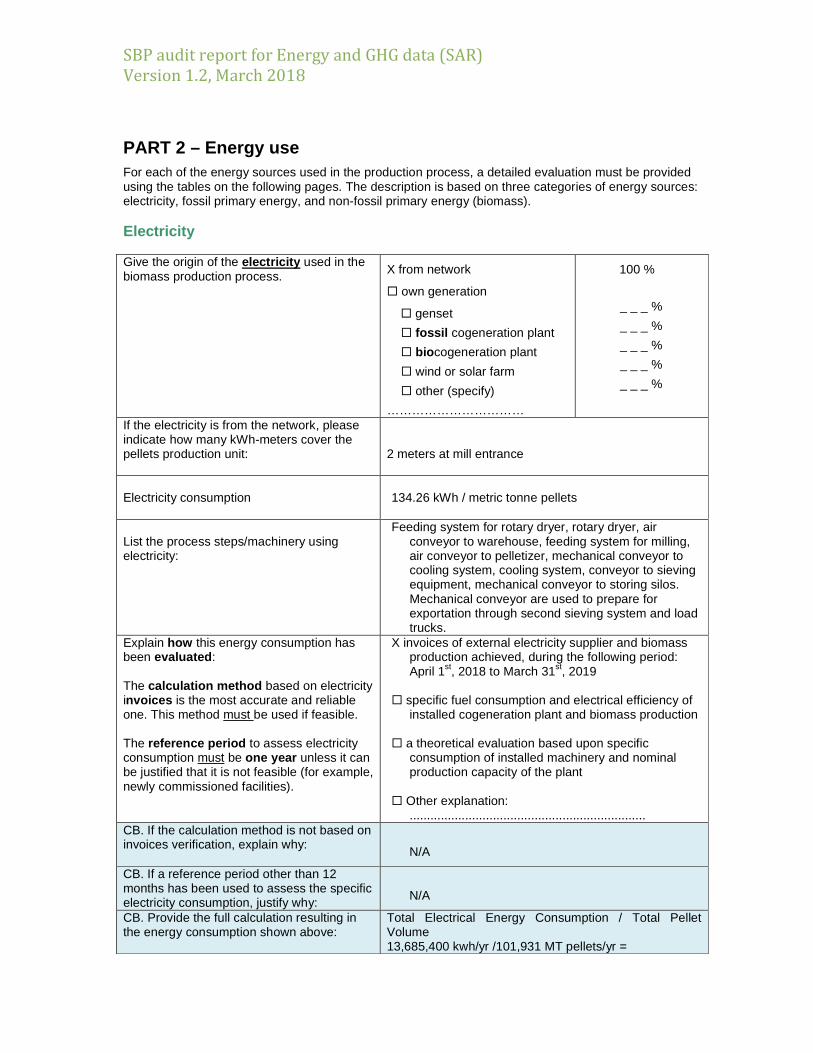
PART 2 – Energy use For each of the energy sources used in the production process, a detailed evaluation must be provided using the tables on the following pages. The description is based on three categories of energy sources: electricity, fossil primary energy, and non-fossil primary energy (biomass). Electricity Give the origin of the electricity used in the biomass production process. X from network
� own generation
� genset
� fossil cogeneration plant
� bio cogeneration plant
� wind or solar farm
� other (specify)
……………………………
100 %
_ _ _ %
_ _ _ %
_ _ _ %
_ _ _ %
_ _ _ %
If the electricity is from the network, please indicate how many kWh-meters cover the pellets production unit:
2 meters at mill entrance
Electricity consumption
134.26 kWh / metric tonne pellets
List the process steps/machinery using electricity:
Feeding system for rotary dryer, rotary dryer, air conveyor to warehouse, feeding system for milling, air conveyor to pelletizer, mechanical conveyor to cooling system, cooling system, conveyor to sieving equipment, mechanical conveyor to storing silos. Mechanical conveyor are used to prepare for exportation through second sieving system and load trucks.
Explain how this energy consumption has been evaluated : The calculation method based on electricity invoices is the most accurate and reliable one. This method must be used if feasible. The reference period to assess electricity consumption must be one year unless it can be justified that it is not feasible (for example, newly commissioned facilities).
X invoices of external electricity supplier and biomass production achieved, during the following period: April 1st, 2018 to March 31st, 2019
� specific fuel consumption and electrical efficiency of
installed cogeneration plant and biomass production � a theoretical evaluation based upon specific
consumption of installed machinery and nominal production capacity of the plant
� Other explanation:
.................................................................... CB. If the calculation method is not based on invoices verification, explain why:
N/A
CB. If a reference period other than 12 months has been used to assess the specific electricity consumption, justify why:
N/A
CB. Provide the full calculation resulting in the energy consumption shown above:
Total Electrical Energy Consumption / Total Pellet Volume 13,685,400 kwh/yr /101,931 MT pellets/yr =
SBP audit report for Energy and GHG data (SAR)
Version 1.2, March 2018
134.26 kwh/MTP Natural Gas If any natural gas is used, specify in which part of the process:
� handling
� chipping / crushing
� drying
� other (specify) biomass boiler back-up/final feedstock conditioning
Fuel consumption Report the natural gas consumption in terms of energy and in terms of volume.
CB. Provide the full calculation that results in the energy consumption shown above:
264,433 Nm3 gas/101,931 MT = 2.59 Nm3/MT
2.59 Nm3/MT * 37.89 MJ/Nm3 = 98.14 MJ/MT
SBP audit report for Energy and GHG data (SAR)
Version 1.2, March 2018
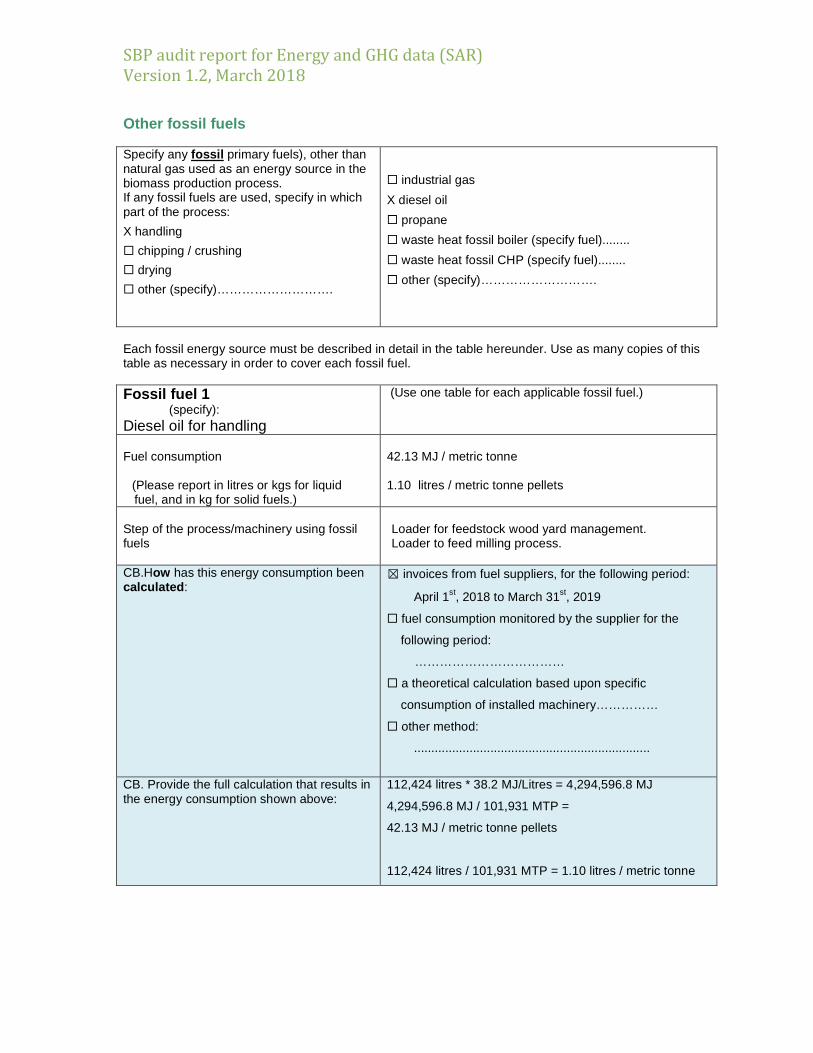
Other fossil fuels Specify any fossil primary fuels), other than natural gas used as an energy source in the biomass production process. If any fossil fuels are used, specify in which part of the process:
X handling
� chipping / crushing
� drying
� other (specify)……………………….
� industrial gas
X diesel oil
� propane
� waste heat fossil boiler (specify fuel)........
� waste heat fossil CHP (specify fuel)........
� other (specify)……………………….
Each fossil energy source must be described in detail in the table hereunder. Use as many copies of this table as necessary in order to cover each fossil fuel. Fossil f uel 1 (specify): Diesel oil for handling
(Use one table for each applicable fossil fuel.)
Fuel consumption
(Please report in litres or kgs for liquid fuel, and in kg for solid fuels.)
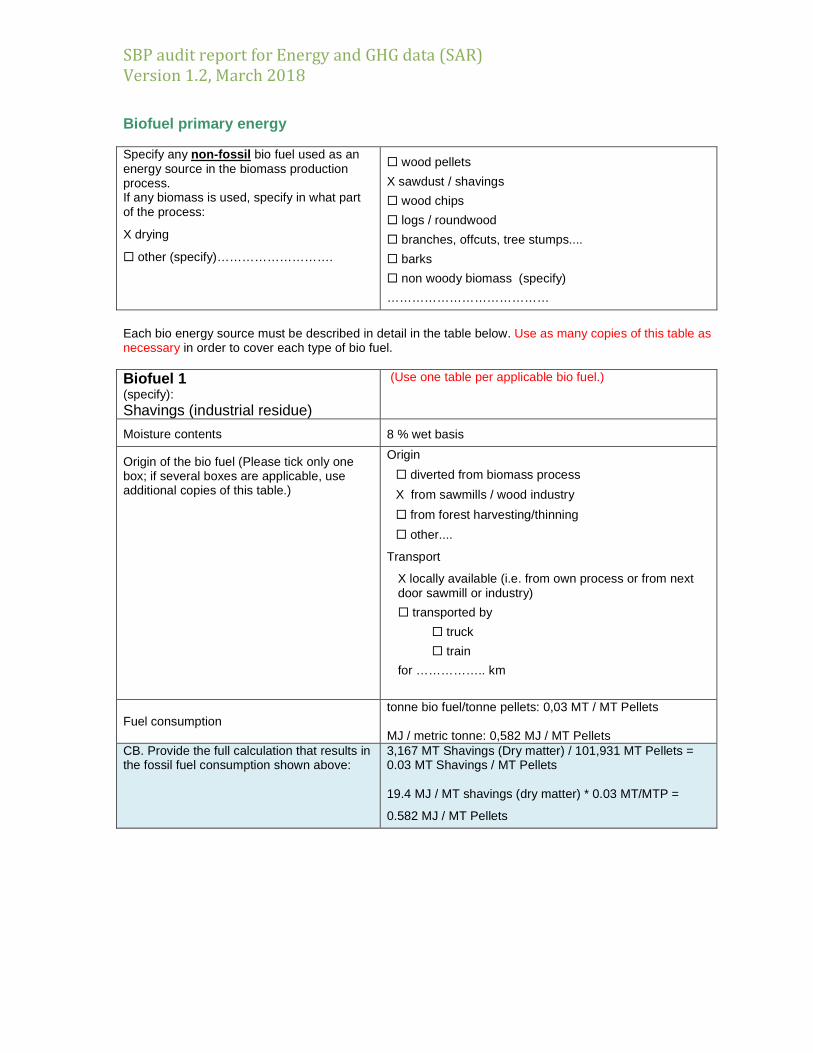
Biofuel primary energy Specify any non -fossil bio fuel used as an energy source in the biomass production process. If any biomass is used, specify in what part of the process:
X drying
� other (specify)……………………….
� wood pellets
X sawdust / shavings
� wood chips
� logs / roundwood
� branches, offcuts, tree stumps....
� barks
� non woody biomass (specify)
…………………………………
Each bio energy source must be described in detail in the table below. Use as many copies of this table as necessary in order to cover each type of bio fuel. Bio fuel 1 (specify): Shavings (industrial residue)
(Use one table per applicable bio fuel.)
Moisture contents 8 % wet basis
Origin of the bio fuel (Please tick only one box; if several boxes are applicable, use additional copies of this table.)
Origin � diverted from biomass process
X from sawmills / wood industry
� from forest harvesting/thinning
� other....
Transport
X locally available (i.e. from own process or from next door sawmill or industry)
Other relevant information, including justification s for data provided and methodologies used.
Bottled propane is also used on-site for powering fork lifts. These are only used to transport bagged wood pellets which are never sold with an SBP claim, and hence the use of bottled propane is not related to the SBP pellet production.
SBP audit report for Energy and GHG data (SAR)
Version 1.2, March 2018
SECTION C: Energy use for transport of biomass This Section (C) shall be completed for each Static Data Indicator (SDI). Use a separate copy of the table to describe each SDI. Static Data Indicator: SBP-07-04-03 Sold at Mill's gate - no transport dat a applicable Static Data Indicator: SBP-07-04-04
PART 1 – General transport data Transport scheme (For each relevant item of the transport scheme, check the applicable box and fill in the related details.)
� Inland road transportation
Road distance
K=...……145…. km
Load of the trucks
Q=...…39…metric tonnes
Transport from/to:
From City/Town of Saint-Félicien To City/Town of Port de Grande-Anse � train station X sea harbour � river harbour � power plant
Truck powered by: X fossil diesel oil � bio-diesel � bio-ethanol � other .................................................
� Inland rail transportation
Distance
K=...…………………. km
Station of origin: City/Town of ……………………… Transport to:
City/Town of ………………………
� train station � sea harbour � river harbour � power plant
� International sea or river transportation Distance K=...…………………. km
Sea Harbour of origin:
From City/Town of ……………………… Transfer to: Destination port area
Contract type � Free-on-Board (FOB) � Cost Insurance Freight (CIF)
PART 2 – Sea transport Not applicable
PART 3 – Storage, handling and trans-shipment
Description of any storage, handling or trans-shipment Storage in warehouse at Grande-Anse Port, sea harbour.
Quantity of biomass handled at the different storage, handling and trans-shipment locations
10,000 metric tonnes of pellets
Energy usage data
Electricity for ventilation of warehouse and vessel loading conveyor.
0,071 kwh/MT
Diesel fuel for trucks transferring pellets from warehouse to vessel loading conveyor.
0,085 litre/ MT
Justification for the approach followed and the values provided
Diesel fuel consumption based on fuel consumption per kilometer and number of 4 metric tonne transfers from warehouse to vessel loading conveyor.
Estimation from sea harbour management based on electricity costs.
Electricity for ventilation of warehouse and vessel loading
SBP audit report for Energy and GHG data (SAR)
Version 1.2, March 2018
conveyor. Ventilation: - Area of warehouse : 540 000 pi³ or 15 291 m³ - Number of air exchanges per hour : 1 - Require: 4 blower of 4000 m³/hr at 495 watt blower - Total : 1980 watt/hr or 1,98 kwh
- 0.85 litre/ 2 km or 0.85 litre/10 MT per truck = 0.085 litres diesel /MT
Total : 0,085 litre/MT Other relevant information, including justification s for data provided and methodologies used.
Not applicable
Validation by CB The auditor must review the information delivered above and verify the data focusing on two parameters
that play an important role in the CO2 emissions:
- type of vehicles used for transport (visual check of vehicles / transport facilities on site)
- destination and distances (to be checked on a map)
The auditor must add a map and should comment on the validation of the transport scheme as necessary.
The SDI SBP-07-04-03 (sold at the mill's gate); describes the sales directly from the storage silos at the pellet mill in St-Felicien. Any energy or fuel use for this, e.g. for conveyor belts, is already included in the energy usage for the site. The SDI SBP-07-04-04 (sold at port of Grand Anse) includes the transport and handling from the BP site under the BP’s ownership to a FOB position in the port of Grand Anse, Quebec as per the map below. Any other transport or emissions data will be reported in an SREG document as confirmed by the BP during the audit.
SBP audit report for Energy and GHG data (SAR)
Version 1.2, March 2018
Geographic map: SBP-07-04-04
SBP audit report for Energy and GHG data (SAR)
Version 1.2, March 2018
PART 4 – Dynamic Batch Sustainability Data Record all biomass supplied with Dynamic Batch Sustainability data (as defined in Instruction Document 5A section 2.3) during the reference period. N/A Biomass Category Tonnage
SBP audit report for Energy and GHG data (SAR)
Version 1.2, March 2018
Contact details and audit report signature Certificate Holder
Date 3/07/2019
Name, signature and optional stamp of representative filling in the declaration
I certify that the data gathered in this form has been checked and validated in compliance with SBP Standard #5 and SBP certification procedures. Signature
Christian Rahbek, Lead Auditor
SBP audit report for Energy and GHG data (SAR)
Version 1.2, March 2018
Technical reviewer
Date and place 18/7/2019 Brno, Czech Republic
Name of the reviewer Eva Komárková
I certify that the data gathered in this form has been checked and validated in compliance with SBP Standard #5 and SBP certification procedures. Signature
Certification decision maker
Date and place 18/7/2019 Madrid, Spain
Name of the Certification decision maker Pilar Gorría Serrano
I certify that the data gathered in this form has been checked and validated in compliance with SBP Standard #5 and SBP certification procedures. Signature
SBP audit report for Energy and GHG data (SAR)
Version 1.2, March 2018
SAR Validation
Date and place
Name of the reviewer
I certify that the data gathered in this form has been checked and validated in compliance with SBP Standard #5 and SBP certification procedures.
Signature
SAR Validation SBP Chief Executive Officer
Date and place
Name of the SBP CEO
I certify that the data gathered in this form has been checked and validated in compliance with SBP Standard #5 and SBP certification procedures.