South Carolina Solid Waste Management Annual Report Catherine E. Heigel, Director S.C. Department of Health & Environmental Control 25 th Anniversary of the S.C. Solid Waste Policy & Management Act FISCAL YEAR 2015
Transcript
South CarolinaSolid Waste Management
Annual Report
Catherine E. Heigel, DirectorS.C. Department of Health & Environmental Control
25th
Anniversary of the S.C. Solid Waste Policy
& Management Act
FISCAL YEAR 2015
About this Report“The South Carolina Solid Waste Management Annual Report” must be submitted to the Governor and General Assembly annually by March 15.
This report, which reflects solid waste management activities in fiscal year (FY) 2015 (July 1, 2014 to June 30, 2015), includes:
• The amount of material recycled by commodity and county;
• The amount and type of solid waste disposed of by county as well as imported and exported solid waste;
• A listing of permitted solid waste facilities;
• A summary of the state’s used motor oil recycling program;
• Recycling data for state agencies and colleges/universities;
• A summary of the economics of solid waste management;
• An update on solid waste planning;
• Key state programs that assist local governments in meeting the requirements of the Act; and
• Recommendations for improving solid waste management.
SECTION
Table of ContentsSECTION 2: The Year at a Glance .......................................... 3
SECTION 3: Recommendations for Improving Solid Waste Management .............................. 5
SECTION 4: The Economics of Managing Solid Waste in South Carolina ............................................ 17
SECTION 5: Recycling by Commodity.................................. 19
SECTION 6: Used Motor Oil Recycling ................................. 29
SECTION 7: Recycling – State Agencies & Colleges/Universities ....................................................... 31
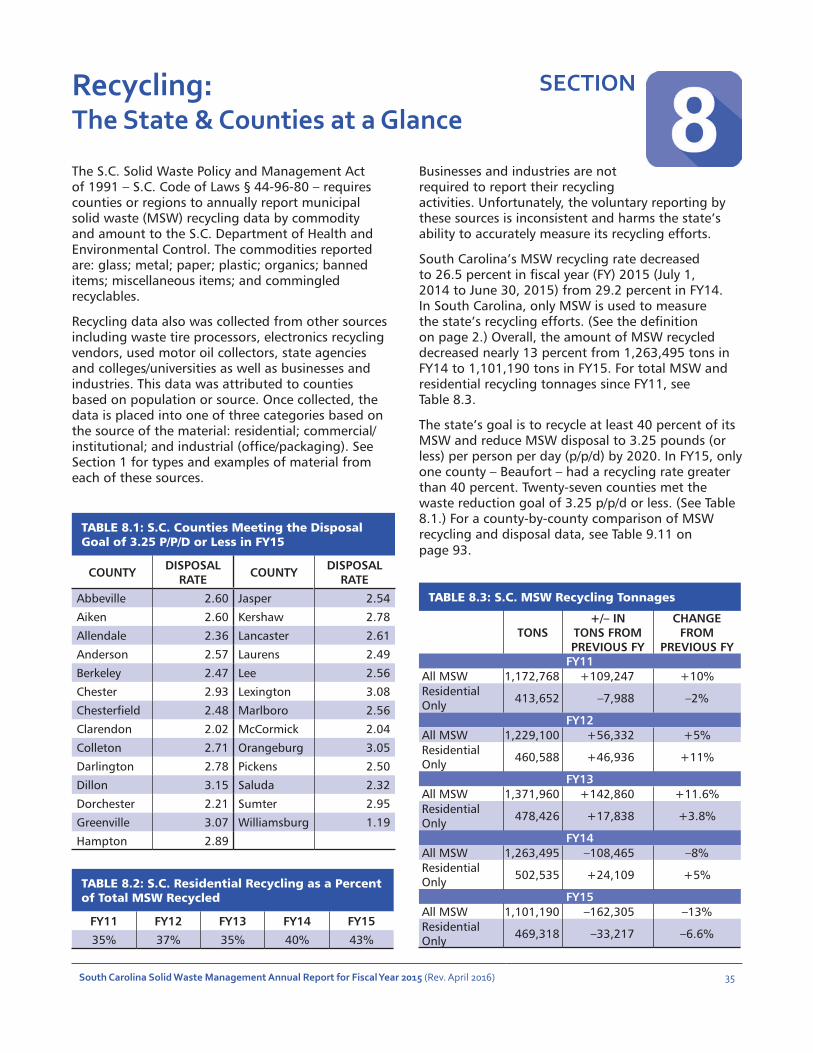
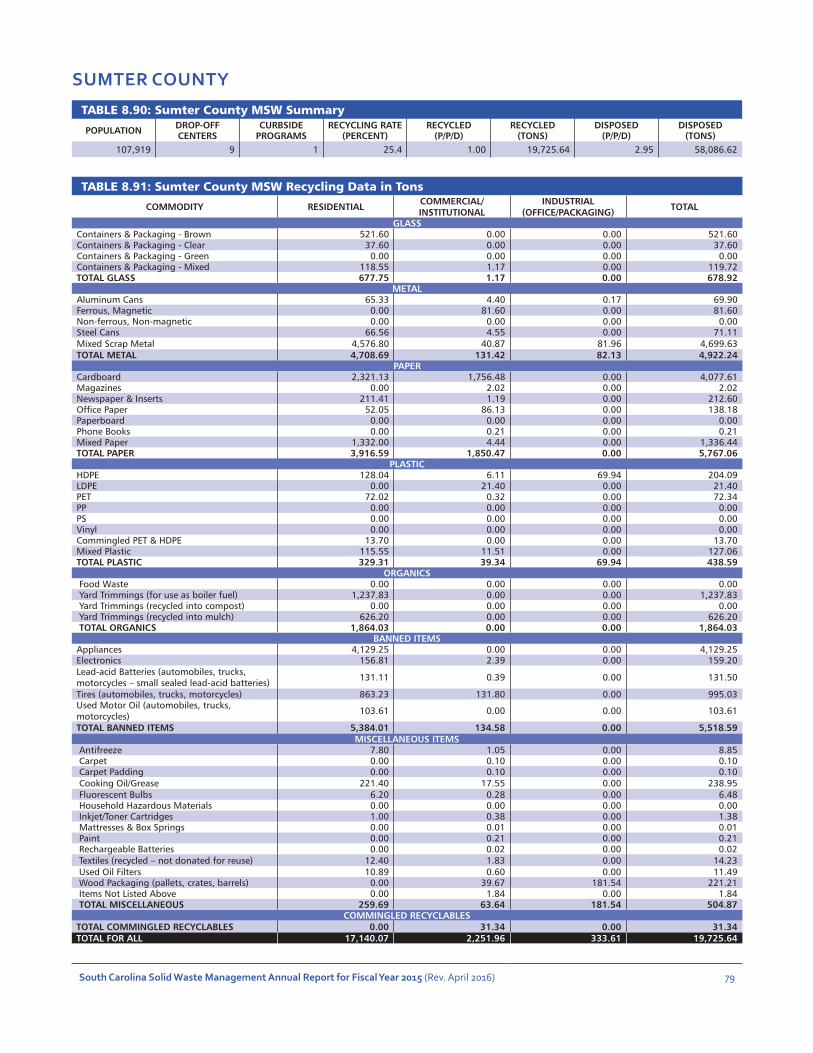
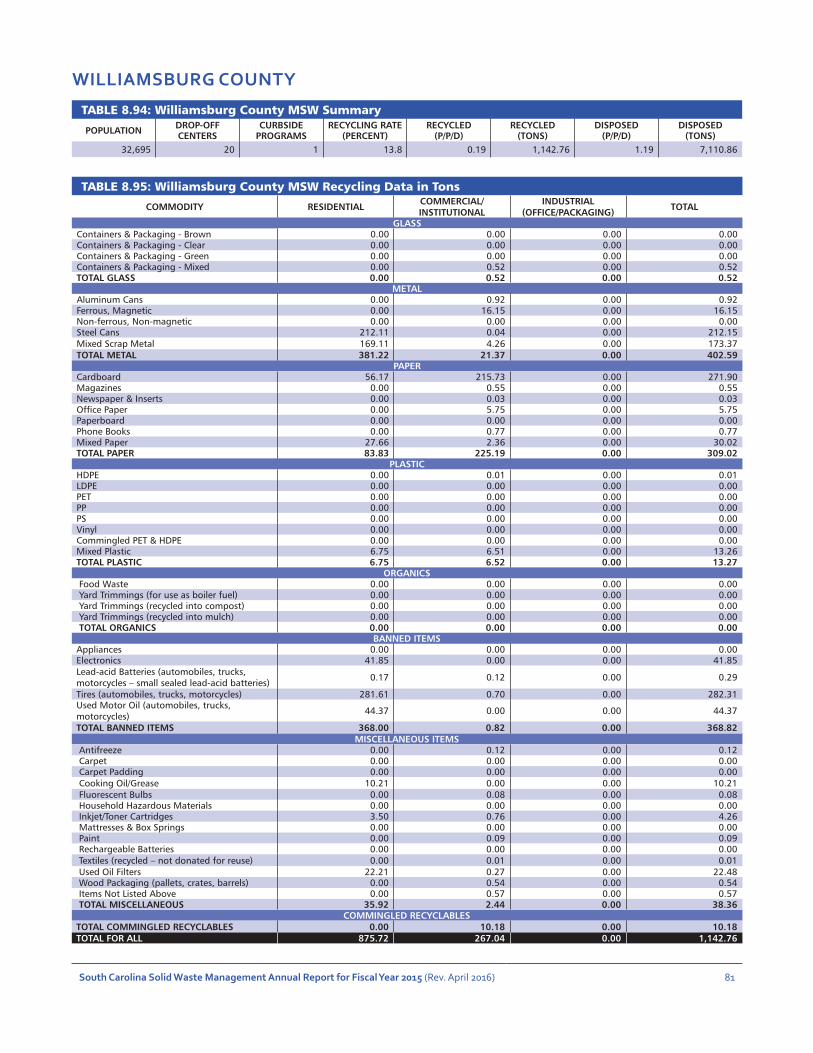
SECTION 8 Recycling – The State & Counties at a Glance ....................................................... 35
AcknowledgementsThe “South Carolina Solid Waste Management Annual Report for Fiscal Year 2015” is submitted by the S.C. Department of Health and Environmental Control (DHEC) in compliance with the S.C. Solid Waste Policy and Management Act of 1991 (S.C. Code of Laws § 44-96-60). Additionally, Act 119 of 2005 mandates that agencies provide all reports to the General Assembly electronically. This report was published on March 15, 2016 by DHEC’s Office of Solid Waste Reduction and Recycling. The report serves as an update to the State Plan.
BUREAU OF LAND & WASTE MANAGEMENT CHIEF: Daphne Neel
EDITOR: Amanda St. John
WRITERS: Richard Chesley, Stacey Washington and Jana White
LAYOUT/GRAPHICS: Gregg Glymph
CONTRIBUTORS: Heather Barberio, Amanda Edwards, Karla Isaac, Justin Koon, Michaela Kraus, Joan Litton and Stefanie Vandiver
ECONOMIC INVESTMENT DATA: S.C. Department of Commerce
The mission of the S.C. Department of Health and Environmental Control (DHEC) is to protect human health and the environment.
For the past 25 years, the S.C. Solid Waste Policy and Management Act of 1991 (Act) – S.C. Code of Laws §§ 44-96-10 et seq. – has played an integral role in furthering this mission. The Act establishes a comprehensive framework for the safe, cost-effective and efficient management of solid waste. For example it authorizes DHEC to:
• Develop and implement a regulatory framework for the proper siting, design, construction, operation and closure of solid waste management facilities (Section 44-96-260);
• Develop a state solid waste management plan (State Plan) (Section 44-96-60) and requires county governments or regions to develop plans that are consistent with the State Plan (Section 44-96-80);
• Promote waste reduction, recycling and resource conservation before disposal (Section 44-96-50); and
• Set waste reduction and recycling goals (Section 44-96-50).
The Act (Section 44-96-60) also requires DHEC to publish an annual report based in part on information that counties and solid waste facilities are required to provide.
2 South Carolina Solid Waste Management Annual Report for Fiscal Year 2015 (Rev. April 2016)
What is measured?This report measures two types of solid waste and how they are managed – municipal solid waste (MSW) and total solid waste (TSW). See Table 1.1 for definitions and examples of each.
Who reports?Permitted solid waste facilities are required by the Act and subsequent regulation to submit annual reports on disposal data to DHEC. County governments, regions, state agencies and state-supported colleges/universities are required to report recycling data annually to DHEC (Section 44-96-80 and Section 44-96-140).
TABLE 1.1: What is MSW and TSW?
MSW TSW
South Carolina voluntarily adopted the U.S. Environmental Protection Agency’s definition of MSW with few exceptions in October 2000. This change was done as part of nationwide effort to have consistency among the states on how solid waste disposal and recycling activities are measured.
TSW provides a much more comprehensive look at how much waste is generated, disposed of and recovered than MSW.
MSW is defined (Section 44-96-50) as certain waste items generated from residential, commercial, institutional and industrial sources. MSW includes appliances, automobile tires, newspapers, office paper, cans, bottles, food waste, yard trimmings (mulched or composted) and packaging. South Carolina also added tire-derived fuel, yard trimmings used as boiler fuel and motor oil recycled by do-it-yourself oil changers to its definition of MSW.
For the purposes of this report, TSW includes MSW as well as construction and demolition (C&D) debris, land-clearing debris, industrial process waste, automobile bodies and municipal sludge as well as combustion ash.
Recycling Rate EquationThe equation below is used for calculating the MSW and TSW recycling rates.
RECYCLING RATE (%) =
AMOUNT RECYCLEDX 100
AMOUNT GENERATED*
*Generated = Recycled + Disposed Of
Recycling data also is collected from municipalities, businesses and the recycling industry (and allocated to the counties where the material was generated), but these entities are not required to report. Because recycling data reporting is strictly voluntary, data collection from these sources is inconsistent from year to year. (See the recommendation for improving reporting on page 6).
When Using this ReportAll data is carefully vetted. Recycling and disposal data are combined to determine the solid waste generation tonnage. The state’s recycling rate is the amount of material recycled divided by amount of waste generated. When reviewing the tables, keep in mind that in general recycling tonnage is rounded to the nearest hundredth and disposal data is rounded to the nearest ton. Some totals do not add up due to rounding.
40% by 2020South Carolina’s goal is to recycle at least 40 percent of its MSW by FY20.
3.25 p/p/d by 2020The state’s goal is to reduce MSW disposal to 3.25 pounds (or less) per person per day (p/p/d) by FY20.
MSW Goals
South Carolina Solid Waste Management Annual Report for Fiscal Year 2015 (Rev. April 2016) 3
The Top 10 Takeaways for FY15
1 In FY15, the amount of MSW generated (recycled plus disposed of) was 4,159,578 tons. Of that amount, 1,101,190 tons (26.5 percent) were recycled and 3,058,388 tons (73.5 percent) were disposed of in MSW landfills including MSW generated in South Carolina but disposed of out of state.
2 The amount of MSW disposed of decreased 9,554 tons (0.31 percent) in FY15 from the previous FY.
3 The state’s per capita waste reduction rate was about the same at 3.47 pounds.
4 The amount of MSW recycled decreased 167,903 tons (13 percent) in FY15.
5 On average, each South Carolinian recycled 453 pounds of MSW in FY15.
6 The amount of MSW recycled fell for the second straight FY. It was, however, the seventh consecutive FY (and 11 of the past 12 FYs) that South Carolinians recycled more than 1 million tons of material. More than 18 million tons of MSW have been recycled since FY01.
7 In FY15, the amount of MSW disposed of dropped by more than 400,000 tons from the record-high 3.4 million tons disposed of in FY06.
8 Residential recycling fell 33,218 tons in FY15 from the previous FY – mostly due to a significant drop in the amount of yard trimmings recovered.
9 In FY15, the amount of TSW disposed of increased by more than 398,000 tons* from the previous FY.
10 The amount of TSW recycled dropped by half falling from 6,030,557 tons in FY14 to 2,968,766 tons in FY15.
The Year at a Glance SECTION
This report provides an overview of the amount of solid waste generated, disposed of and recycled in South Carolina for fiscal year (FY) 2015 (July 1, 2014 to June 30, 2015) as required by the S.C. Solid Waste Policy and Management Act of 1991 (Act) – S.C. Code of Laws §§ 44-96-60.
This report defines and measures two specific types of solid waste – municipal solid waste (MSW) and total solid waste (TSW). (See page 2 for definitions.) As required by the Act, the focus of this report is on MSW (Section 44-96-50).
A Note on the NumbersIt is important to note that the recycling data collected for this report does not completely reflect recycling efforts across South Carolina.
The Act requires permitted solid waste facilities (e.g., landfills) to report disposal data to DHEC resulting in 100 percent of this information being collected. The Act also requires county governments, state agencies and state-supported colleges and universities to report the amount and type of material recycled. Businesses are not required to report, but can voluntarily provide information on their recycling activities.
It is estimated that MSW generation is about 60 percent residential and 40 percent commercial. Given that businesses are not required to report, the data collected from this source is inconsistent and incomplete and impacts the state’s annual MSW recycling rate.
S.C. Recycling Rate
FY15
26.5%
S.C. Waste Reduction Rate
FY15
3.47 p/p/d
*Pounds Per Person Per Day
*Rev. April 2016
4 South Carolina Solid Waste Management Annual Report for Fiscal Year 2015 (Rev. April 2016)
CHART 2.2: Tons of MSW Disposed of and Recycled by FY, 2001 to 2015
TABLE 2.1: S.C. Population
YEAR POPULATION
2011 4,625,364
2012 4,679,230
2013 4,723,723
2014 4,774,839
20151 4,832,482
NOTES:
1. The population data used in this report reflects the most recent estimate available from the U.S. Census Bureau.
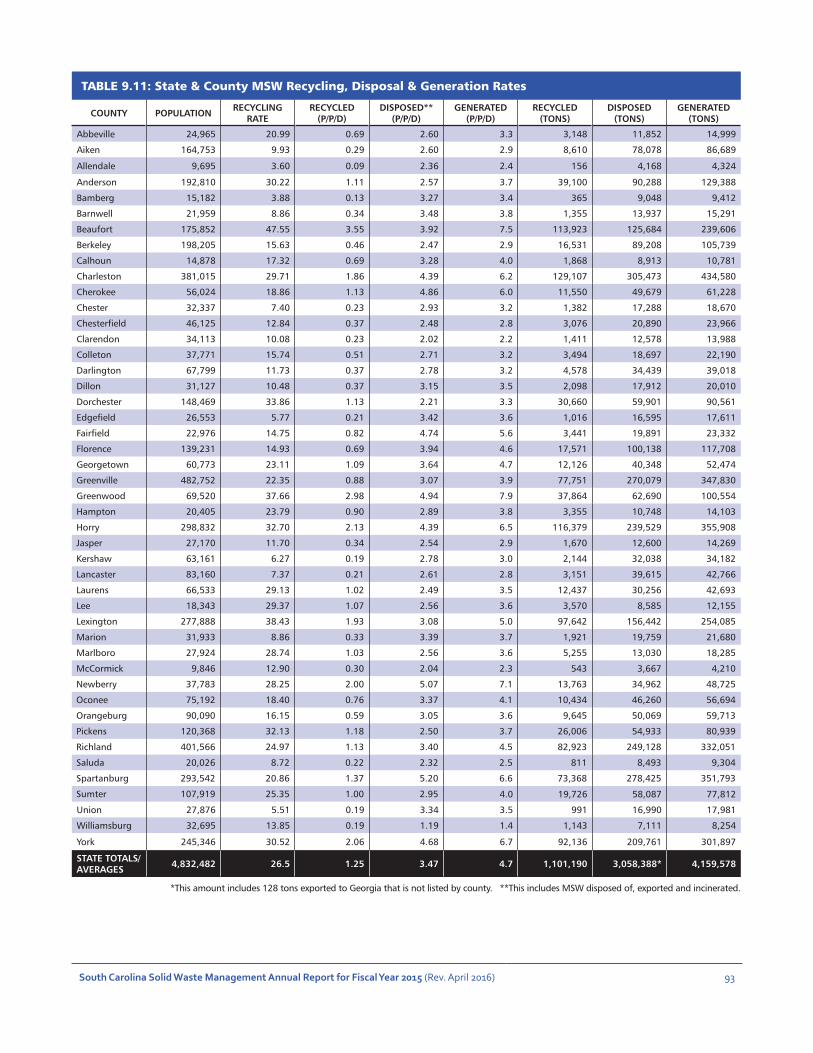
2. See Table 9.11 on page 93 for a breakdown by county of MSW recycling, disposal and generation.
FY15By the Numbers
*Rev. April 2016
South Carolina Solid Waste Management Annual Report for Fiscal Year 2015 (Rev. April 2016) 5
Recommendations for Improving Solid Waste Management
SECTION
The S.C. Solid Waste Policy and Management Act of 1991 (Act) – S.C. Code of Laws § 44-96-60 – requires the S.C. Department of Health and Environmental Control (DHEC) to make annual recommendations on how to improve solid waste management in the state.
Much has been accomplished since the passage of the Act. For example, South Carolina has fewer landfills and less illegal dumping. More rigorous requirements for landfills and other solid waste facilities are in place. Solid waste management technology has dramatically improved. Greenhouse gas emissions have been reduced.
At the same time, the state’s recycling infrastructure has grown to 93 curbside programs, 580 recycling drop-off centers and 891 used oil collection centers for do-it-yourself oil changers. Each of South Carolina’s 47 state parks and historic sites offer recycling. Companies set zero waste goals. The state’s recycling industry is growing with more than 520 companies and a $13 billion annual economic impact.
While South Carolina can enjoy the many accomplishments of the past 25 years, much remains to be done.
With more individuals, businesses, organizations, schools, colleges/universities and government agencies recycling more than ever, nearly 74 percent of the MSW generated in South Carolina was disposed of in landfills. Disposal of valuable material is a waste of resources and lost economic opportunity. What steps need to be taken to keep it out of the landfill?
More specifically, how do we prevent and recover more food waste? How do we improve construction and demolition (C&D) debris recycling? How does the state address waste-to-energy and other new technologies? What needs to be done to grow South Carolina’s recycling industry and recycling markets?
What can local governments do to better manage the rising cost of the essential solid waste services that they offer?
Beyond these challenges, there is a nationwide shift in thinking from traditional waste management (e.g., disposal, recycling) to sustainable materials management (SMM). This new approach is centered on using and reusing materials more productively throughout their entire life cycle. Looking at how materials are used throughout their life cycle provides new opportunities to reduce environmental impacts, conserve resources and lessen costs.
South Carolina is well prepared to make this transition and meet all its challenges by building on the foundation created by the policies and goals outlined in the Act. These goals and policies include:
• Ensure that landfills and other solid waste facilities are properly sited, designed, constructed, operated and closed to protect human health and the environment;
• Promote regionalization to manage solid waste more efficiently;
• Promote waste reduction, reuse and recycling above other methods that preclude further use of the material;
• Work towards achieving South Carolina’s waste reduction and recycling goals;
• Work with county governments to create and maintain 20 years of landfill capacity; and
• Provide and improve outreach, education and access of information to residents, businesses, organizations, schools and others on solid waste management issues.
The recommendations that follow support the policies and goals listed above. They are the key steps that South Carolina can take to manage its waste more safely and efficiently, meet its waste reduction and recycling goals and realize more of the economic benefits of recycling.
While South Carolina can enjoy the many accomplishments of
the past 25 years, much remains to be done.
6 South Carolina Solid Waste Management Annual Report for Fiscal Year 2015 (Rev. April 2016)
Update the State Plan.
The Act (Section 44-96-60) requires DHEC to develop a state solid waste management plan (State Plan) and outlines the types of information that must be part of the publication. The State Plan sets the direction, purpose and vision for South Carolina’s management of its solid waste. Counties and regions must develop solid waste plans that are consistent with the State Plan. Smart planning at both the state and local level provides South Carolina the opportunity to manage its solid waste in a safe, efficient and environmentally responsible manner and move towards meeting the state’s waste reduction and recycling goals.
While the State Plan is updated through the publication of the S.C. Solid Waste Management Annual Report, it has not been revised since 1999. The State Plan needs to be revised to reflect new issues, new recyclable material and significant changes in technologies and practices as well as the knowledge gained from successes and shortcomings in the past 15-plus years. A new State Plan also is necessary to meet the responsibility of providing up-to-date data and an overall direction for county governments as they update their solid waste plans.
RECOMMENDATION
Publish a new State Plan by June 30, 2017.
Improve reporting.
The focus of this report, as required by the Act, is MSW (see definition on page 2) and specifically the state’s MSW recycling rate. It is important to know that South Carolina’s recycling rate reflects what is reported to DHEC on an annual basis – not necessarily what is actually recovered for recycling. Currently, only county governments, state agencies and state-supported colleges/universities are required to report recycling efforts to DHEC. Businesses are not required to report – so it is unclear how much recycling data is missed. Lack of reporting by businesses becomes more significant when it is generally accepted that MSW generation is roughly 60 percent residential and 40 percent commercial.
There are efforts to secure commercial recycling numbers. Many counties ask businesses for recycling information, but most local governments don’t have the resources to address this issue. DHEC, through its S.C. Smart Business Recycling Program and Green Hospitality Program, provides a Web-based reporting tool. DHEC and local governments also work with processors to gather statewide commercial recycling tonnages. All of these efforts provide some numbers, but lead to incomplete and inconsistent reporting from year to year. It is important to note that permitted solid waste facilities are required to
report to DHEC all material disposed of in South Carolina landfills or exported for disposal. The state’s recycling rate is calculated by dividing the state’s total recycling tonnage by the state’s total generation tonnage (recycling total combined with disposal total). DHEC receives complete information on disposal and residential recycling, but incomplete information on commercial recycling. Given that, the state’s recycling rate is skewed and does not accurately reflect recycling efforts across all sectors.
With a goal to reduce per capita MSW disposal to 3.25 pounds or less and recycle 40 percent of all MSW generated by 2020, it is critical that the reporting of recycling efforts across all sectors (residential, commercial/institutional and industrial) improve.
RECOMMENDATIONS
Continue providing technical assistance and training to local governments to secure and provide accurate reporting of residential tonnages and ways to secure more recycling data from commercial and industrial sectors.
Promote the benefits of having accurate and comprehensive recycling data. Governments and businesses that comprise the state’s recycling industry will be able to properly plan, determine recycling behaviors from different sectors, measure recycling of specific commodities, and more efficiently maintain and/or develop recycling markets.
Encourage large industries, businesses, recycling processors and haulers to report recycling data. Work on this recommendation with the S.C. Department of Commerce. If this effort fails, consider updating the Act to require mandatory reporting for recycling processors and businesses with more than 50 employees.
Lack of reporting by businesses becomes
more significant when it is generally accepted that MSW generation is roughly 60 percent
residential and 40 percent commercial.
South Carolina Solid Waste Management Annual Report for Fiscal Year 2015 (Rev. April 2016) 7
End the myth that recycling is free.
Recycling is not free. It never was. When recycling re-emerged into the nation’s consciousness in the 1990s, it was almost always promoted to residents that recycling will pay for itself through the revenue earned from the sale of the recovered material combined with avoided disposal costs. Many residents believed it then and still believe it now as well as a second myth that every material recycled has great value.
Both of these myths need to end. Residents must be made aware that they are paying for two basic solid waste management options: disposal and recycling. Both management choices help protect human health and the environment. But once a material is disposed of in a landfill, it has no additional value and produces no additional economic activity.
Conversely, recycling offers a chance to earn revenue, avoid disposal costs and generate further economic activity. Material that is recycled and reintroduced into a manufacturing process supports economic growth and development through the creation of businesses, markets and jobs necessary to support those activities. The economic impact study (see Section 4) completed in 2014 shows the significant, positive impact the recycling industry has on South Carolina’s economy.
Residents also need to know that recyclables are commodities that are subject to the same market
fluctuations in value as other commodities. Unfortunately, it is generally accepted that the market value of recyclables are more volatile than other commodities. Those highs and lows are unpredictable. When prices are good, revenues are good. When prices are down, programs are more stressed.
Local governments should carefully consider and measure the true costs of any option to managing solid waste and communicate that information to residents. All aspects should be considered including long-term management, monitoring, post-closure, environmental impacts and lost opportunities for material recovery.
RECOMMENDATIONS
Conduct research to develop information and tools that local governments can use to promote recycling centered on the economic impact of recycling. This work will be done in partnership with the S.C. Department of Commerce and University of South Carolina’s Moore School of Business. This information should include an analysis comparing the life-cycle costs of disposal to recycling and of the jobs created by each method of material management.
Develop an information campaign to increase awareness to residents of the costs of solid waste management (i.e., disposal, recycling). Integrate that campaign into the RecycleMoreSC campaign and other potential venues.
Local governments should consider not having or promoting a separate charge for recycling or a specific commodity (e.g., electronics), but rather provide one cost with an explanation of all of the solid waste services offered.
Residents must be made aware that they are paying for two basic
solid waste management options: disposal and
recycling.
Recycling is big business in South Carolina.“The Economic Impact of the Recycling Industry in South Carolina” is a 2014 study commissioned by DHEC, the S.C. Department of Commerce and others. It shows that the industry, which is comprised of more than 520 companies, is responsible for more than 22,000 direct jobs (a 44 percent increase from 2006), $2.7 billion in annual labor income (up 80 percent from 2006) and $329 million in state and local taxes each year.
The study was completed by Dr. Frank Hefner of the College of Charleston’s Department of Economics and Finance. To view the complete study, please visit www.scdhec.gov/HomeAndEnvironment/Recycling/EconomicImpact/.
8 South Carolina Solid Waste Management Annual Report for Fiscal Year 2015 (Rev. April 2016)
Maximize food waste reduction and recovery opportunities.
Food waste is the top item thrown away by Americans accounting for 35.2 million tons (21 percent) of the nation’s discards in 2013 according to the U.S. Environmental Protection Agency (EPA). Nationally, about 1.8 tons (5 percent) of the food waste generated was recovered.
Applying those percentages to South Carolina’s MSW generation, the state produced an estimated 607,298 tons of food waste in FY15 and recovered only 1 percent (6,083 tons).
Clearly, if South Carolina is to achieve its per capita waste reduction (3.25 pounds or less) and recycling
goals (40 percent of the MSW stream) by 2020, the state must include a concentrated focus on increased food waste prevention and recovery.
Food waste reduction and recovery includes:
• Preventing food waste before it is created;• Donation; and• Composting and other options (e.g., anaerobic
digestion).
These actions have significant economic, social and environmental benefits. Preventing food waste can save businesses money through improved purchasing and food preparation practices that result in lowered disposal costs. Donation, done properly, is a safe and easy way to provide much needed food to individuals. Composting turns excess food that is not fit for consumption into a nutrient-rich soil amendment.
RECOMMENDATIONS
Develop and promote best management practices to reduce food waste. Hospitality facilities, colleges/universities, institutions (e.g., nursing homes, hospitals) and businesses should be encouraged to closely track food waste, change purchasing habits and train staff to ensure the efficient preparation of food.
Continue to promote food waste prevention and recovery throughout the region through the partnership with the Southeast Recycling Development Council.
Continue to promote food recovery through the Green Hospitality Program and the S.C. Smart Business Recycling Program.
Increase food recovery on military bases in South Carolina by continuing to work with the Department of Defense Alliance stakeholder group.
Find a regional solution for organic material in the Midlands by continuing to work with EPA, Fort Jackson, the University of South Carolina, S.C. Department of Commerce and local governments.
Increase the quality and quantity of recovered food waste by continuing to work with all stakeholders to improve infrastructure as possible.
Develop a stakeholder group to encourage efficient, proper practices of food donation.
Develop a campaign to educate residents on strategies for reducing food waste. Work with local governments and state agencies to provide technical assistance, outreach programs and grant funding if possible. As part of this effort, develop a comprehensive Web site to include a one-stop shop of information for all stakeholders including a listing of food recovery options.
Eliminating Food WasteFood waste is much more than a solid waste issue. In the United States, it is estimated that at least 31 percent of edible food goes to waste – a loss valued at more than $160 million according to EPA. A family of four on average throws away about $1,500 of uneaten food ever year according to the U.S. Department of Agriculture (USDA). At the same time about one in six Americans – about 50 million people overall – live in food insecure households according to a November 2014 study.
Added to these numbers is the loss of natural resources used to produce food that is never eaten. Steps are being taken to address this issue. In September 2015, USDA and EPA announced America’s first food waste reduction goal – committing to a 50 percent reduction by 2030.
In November 2015, another step was taken in South Carolina when DHEC, EPA and Southeast Recycling Development Council sponsored the Food Recovery Summit in Charleston. The event ended with a commitment to develop a strategic vision and plan to move forward and achieve the national goals.
Nationally, about 5 percent of the
food waste generated was recovered.
South Carolina Solid Waste Management Annual Report for Fiscal Year 2015 (Rev. April 2016) 9
Compost more yard trimmings.
Yard trimmings comprise about 34.2 million tons (13.5 percent) of the nation’s MSW waste stream according to EPA.
In South Carolina, it is estimated that more than 560,000 tons of yard trimmings were generated in FY15. Of that amount, only 35 percent (197,488 tons) was recovered.
Increased recovery of yard trimmings will decrease South Carolina’s per capita disposal and increase the state’s MSW recycling rate as well as conserve resources, produce nutrient-rich soil amendments and create jobs and businesses.
RECOMMENDATIONS
Composting should be encouraged from backyard to large-scale systems and promoted to all stakeholders including households, schools, colleges/universities, businesses, U.S. Department of Defense facilities and other government entities.
Promote residential and small-scale community composting. This strategy includes working closely with local governments to offer technical assistance, outreach programs and grant funding to support residential compost bin sales.
Attract businesses to South Carolina that want to set up large-scale composting operations to recover more material, produce valuable products and create jobs by working with the S.C. Department of Commerce’s Recycling Market Development Program and regional experts.
Expand school composting programs. Provide technical assistance, training and grant funding to increase the number of schools recovering organic material through composting and waste reduction. Develop partnerships through the “Action for a Cleaner Tomorrow” program to set up composting systems in elementary and middle schools.
Map commercial compost operations, generators of food waste and markets by continuing to work with the S.C. Department of Commerce Recycling Market Development Program.
Increase C&D debris recycling.
C&D debris is comprised of material that is generated during the construction, renovation and demolition of buildings, roads and bridges. C&D debris contains bulky, heavy material such as concrete, wood, metal, glass, new gypsum scrap, asphalt paving and other building components.
Reducing and recycling C&D debris conserves natural resources, saves landfill space, improves landfill stability and compaction, reduces the environmental impact of producing new material, creates jobs and reduces project expenses through avoided purchases and disposal costs.
Despite the many benefits, C&D debris recycling is only occurring at a small level and remains a significant challenge. South Carolina, like other states, faces two obstacles to increased recovery – low disposal costs and lack of markets. There are limited markets in the state for C&D debris and even more limited markets for specific material such as shingles and gypsum wallboard.
In addition, it is almost always less expensive for contractors and builders to dispose of the material than take the time to separate, store and find a market. Limited markets also can lead to the creation of illegal stockpiles or dumped C&D debris, when collectors fail to either recycle or properly dispose of the material.
To encourage the recycling of C&D debris, many local governments throughout the United States have adopted policies and C&D bans. Some examples are mandating a 50 percent C&D debris recovery rate.
RECOMMENDATIONS
Develop and implement a plan to promote the benefits of C&D recycling to all stakeholders that includes a Web-based clearinghouse and printed material (e.g., C&D manual, pocket guide, posters and signage).
Encourage local governments to determine whether any policy change or bans would be effective in increasing C&D debris recycling in their community.
Increased recovery of yard trimmings will
decrease South Carolina’s per capita disposal and
increase the state’s MSW recycling rate ...
C&D debris recycling is only occurring at a
small level and remains a significant challenge.
10 South Carolina Solid Waste Management Annual Report for Fiscal Year 2015 (Rev. April 2016)
Unwanted electronics, often called e-scrap, contain potentially hazardous material such as lead and mercury that can pose a risk to human health and the environment if not properly managed. Unwanted electronics also contain valuable material such as precious metals that can be recovered through responsible recycling.
Recycling electronics helps protect the environment, conserve resources and provide raw material for new products. Given that, South Carolina passed legislation in 2010 that banned the disposal of specific electronics in solid waste landfills effective July 1, 2011. In short, residents are required to recycle computers, computer monitors, printers and televisions. The legislation was revised on March 4, 2014 to add more specific requirements and recovery obligations for computer monitor and television manufacturers.
These obligations require a manufacturer of computer monitors or televisions to recycle or arrange to recycle either: 1) 80 percent of the weight
of computer monitors and televisions sold the previous year; or 2) join a representative organization (partnership) of manufacturers that provides recycling services to local governments proportionate to their market share for the previous year. Specifics of these requirements are outlined in the legislation.
If measured by the amount of material recovered, electronics recycling has been successful in South Carolina. If measured by cost to local governments to offer programs, it has been a costly endeavor. Despite funding assistance by computer monitor and television manufacturers as required by the legislation, recovery costs have dramatically increased the past several years, placing a severe burden on local government budgets.
RECOMMENDATIONS
Local governments should follow best management practices when collecting, storing and packaging material to reduce human health and environmental risk as well as potentially increase revenue for material.
Local governments should provide as much packaging and sorting to potentially increase revenue for material.
Increase recovery of hard-to-recycle items.
Many products that are part of the MSW stream are not easily recovered including carpet, paint, mercury-containing lamps, thermostats, rechargeable batteries, mattresses and many household goods (e.g., cleaners, pesticides). These products frequently are costly to recover, have limited markets and often contain hazardous material (e.g., mercury-containing lamps). There are several ways to address these products. One approach is to simply place a fee on the product when it is purchased that, in turn, is used to recover the material. Another approach is for industry to take the lead in recovering its product (e.g., Call2Recycle – the program that recovers rechargeable batteries). In this effort, industry provides outreach material, collection containers (almost always located in retail outlets) and shipping of the collected material to the recycling facility at no cost.
Another approach uses everyone involved with the product. The approach – known as product stewardship – is simply defined as all parties that
are involved in the design, manufacturing, selling and use of a product take responsibility for the environmental impact of that product throughout its entire life. Product stewardship addresses a number of factors including: the effectiveness of current collection and recycling of the product; costs to local governments to manage the material; disposal rates; toxic components of the product; interest and readiness of industry, government and markets; and life-cycle analysis.
There is only one product stewardship program in South Carolina – electronics – specifically computer monitors and televisions. By law, these manufacturers have recovery obligations that help fund the cost to recover these products. The state also is working with state and national groups involved in increasing the recovery of carpet.
RECOMMENDATIONS
Use nationally established programs to recover more material.
Work with all stakeholders to increase the collection of hard-to-recycle items.
South Carolina Solid Waste Management Annual Report for Fiscal Year 2015 (Rev. April 2016) 11
Recycling, Buying Recycled Requirements for State Government
The Act (Section 44-96-140) requires the General Assembly, Governor’s Office and Judiciary – as well as state agencies and state-supported colleges/universities – to have waste reduction and recycling programs and report those recycling activities annually to DHEC.
This section of the Act also outlines requirements and goals for these stakeholders on purchasing recycled-content products. These requirements include:
1. A goal that 25 percent of products purchased contain recycled content;
2. A system to track and report those purchases annually to DHEC; and
3. A 7.5 percent price preference for recycled-content products.
South Carolina also established an Environmentally Preferred Purchasing Policy in 2009 that provides additional information, standards, guidance and tools for state agencies as well as colleges/universities.
State agencies and colleges/universities should lead by example.
As part of South Carolina’s effort to meet its waste reduction and recycling goals, state agencies and state-supported colleges/universities are required by the Act to recycle and buy recycled-content products (See specifics in the box below).
Beyond those requirements, state agencies as well as colleges/universities should lead by example. These stakeholders not only generate significant quantities of recyclables but also can use their considerable purchasing power to buy recycled-content products to support recycling markets and South Carolina’s recycling industry.
RECOMMENDATIONS
Implement the Green Government Initiative to increase recycling and buying recycled-content products at state agencies. This campaign includes technical assistance, training and recognition as well as tools to improve reporting of recycling activities as required by the Act.
Promote the 7.5 percent price preference for recycled-content products as outlined in the Act to ensure that it is consistently implemented.
Develop a statewide system to track and report recycled-content purchases.
Update and promote the state’s Environmentally Preferred Purchasing Policy. Set up a stakeholder group to review and revise this policy.
Stimulate new recycling markets through state agency procurement practices. Educate purchasers on recycled-content products, particularly those on state contract. Ensure that the list of recycled-content products and specifications are updated annually as required by the Act.
Learn more about the recycling efforts of South Carolina’s state agencies and colleges/universities.
Visit www.scdhec.gov/recycle and select “Data and Reports.”
12 South Carolina Solid Waste Management Annual Report for Fiscal Year 2015 (Rev. April 2016)
Local governments should maximize efficiency of their recycling programs.
Local government programs are the front line of solid waste management. These services – which represent a significant investment – include collection of garbage and recyclables through curbside programs and/or drop-off centers as well as programs for composting, electronics and hazardous household material.
According to full-cost disclosure reports submitted to DHEC, local governments spent more than $323 million to manage solid waste in FY15 and more than $1.6 billion since FY11.
While some of these costs are offset by avoided disposal costs and the revenue earned from the sale of recyclables, each program should always ask how it can be more efficient, more cost-effective and more successful.
RECOMMENDATIONS
Maintain an up-to-date solid waste plan that focuses on minimizing the amount of material that is disposed of in landfills.
Provide as much education and outreach as possible to residents. Maintain up-to-date information on the Web. Review materials periodically. Make clear what is recyclable in the program and what is not.
Use roll carts for residential recycling collection as possible. The use of roll carts often increases participation and the amount of material collected.
Promote the environmental and economic benefits of recycling to community decision makers.
Develop local or regional partnerships that can improve programs (e.g., national retailers located in your community, local businesses, nearby local governments, schools, non-profits, other government agencies).
Identify improvements that can be made without additional costs to programs (e.g., adding a commodity).
Partner with local businesses and recycling processors to encourage commercial waste reduction, recycling and reporting of these activities.
RecycleMoreSC Campaign Introduced to Boost Statewide Recycling The RecycleMoreSC campaign is designed to reinvigorate recycling in South Carolina by:
• Promoting the economic and environmental benefits of recycling;
• Providing tools to local governments to present a clear, consistent message across the state; and
• Challenging residents, businesses and others to do their part and recycle more.
The campaign is the centerpiece effort of the 40by2020 Partnership. The partnership is a group of public and private stakeholders dedicated to sharing knowledge, coordinating resources and working together to help South Carolina meet or exceed its 40 percent recycling goal set for 2020.
The partnership includes Pratt Industries, Sonoco Recycling, the S.C. Beverage Association, PalmettoPride, the S.C. Department of Commerce and DHEC.
Local governments spent more than $323 million to
manage solid waste in FY15 and more than $1.6 billion since FY11.
South Carolina Solid Waste Management Annual Report for Fiscal Year 2015 (Rev. April 2016) 13
Consider pay-as-you-throw programs.
Traditionally, residents pay for waste collection through property taxes or a fixed fee regardless of how much or how little waste they generate.
Pay-as-you-throw (PAYT) programs break that tradition by treating waste collection just like electricity, gas and other utilities where consumers pay for what they use. In PAYT programs, residents are charged for the amount of waste they throw away and not charged directly for recycling. This creates a direct economic incentive to recycle more and throw away less.
PAYT programs work. Many communities with PAYT programs have reported significant increases in recycling. In addition, PAYT programs often have proven to be an effective way for local
governments to offset increased solid waste management costs.
Setting up a PAYT program is not without its difficulties and will require careful consideration, planning, time and commitment. Still, this option should be considered. Local governments should not just continue to accept the traditional methods of managing waste.
As part this effort, residents need to understand the true cost of managing solid waste. See Section 4 for more information.
RECOMMENDATIONS
Local governments should evaluate their programs and consider implementing a PAYT program.
Local governments should make their solid waste management program costs more transparent to residents.
Enhance and strengthen education and outreach.
From elementary school students to local government decision makers, education, outreach and technical assistance are essential tools to help South Carolinians understand and promote the economic and environmental benefits as well as the challenges of recycling and encourage them to do their part and participate.
South Carolina has the infrastructure to recycle far more material than is being recovered. The primary way to improve recovery is with successful outreach and education efforts that inspire people to change their behavior and make recycling a social norm.
DHEC’s Office of Solid Waste Reduction and Recycling (Office), as required by the Act, plays a key role in providing outreach and education programs and projects as well as technical assistance to schools, colleges/universities, businesses, local governments, the public and other stakeholders. The Office, however, is only one stakeholder. Every South Carolinian has the opportunity – and responsibility – to do their part.
RECOMMENDATIONS
Encourage and assist local governments to offer outreach and education programs to residents on community recycling options and to look for partnerships to promote recycling.
Encourage local governments to adopt the RecycleMoreSC outreach campaign.
Identify opportunities to promote the economic benefits of recycling to local decision makers and appropriate organizations.
Inspire more businesses to reduce waste, recycle, report these activities and use the resources of the S.C. Smart Business Recycling Program.
Increase the number of hotels, motels, restaurants and bars that are reducing their environmental impact through resources from DHEC’s Green Hospitality Program and participation in the Green Hospitality Alliance.
Encourage more teachers and schools to participate in “Action for a Cleaner Tomorrow” trainings and classroom presentations and take advantage of DHEC’s K-12 environmental education resources.
Continue to expand public-private partnerships to set up, promote and maintain recycling in public venues (e.g., airports, state and local parks, welcome centers, athletic fields). Encourage “twinning the bin” by placing a recycling receptacle beside every trash receptacle.
South Carolina has the infrastructure to recycle far more material than is
being recovered.
14 South Carolina Solid Waste Management Annual Report for Fiscal Year 2015 (Rev. April 2016)
Prevent illegal dumping of waste tires and facilitate removal of existing waste tire dumps.
South Carolinians generate an estimated 4.5 million waste tires every year. When managed improperly – dumped or stored illegally – tires can become a health hazard by holding water and attracting mosquitoes as well as creating potential fire hazards and unsightly nuisances.
Unfortunately, many waste tires do not take a direct route to a tire recycler. The state continues to see illegal dumping and is working to identify responsible parties to remove and manage illegally dumped tires. The cleanup of existing piles, however, is not a solution. Preventing the creation of waste tire piles is critical to the success of any waste tire management program.
When managed properly, tires can be used in construction activities and new products as well as burned for energy recovery. Most waste tires generated in South Carolina are chipped and burned in place of other fuels (e.g., coal). They also are used frequently as a substitute for gravel or other aggregates in septic tank drain fields or other drainage applications. Wire-free tire rubber can be used for higher-value products. Chipped tire rubber, for example, can be used in place of wood chips in playgrounds. Finely ground tire rubber can be formed into running tracks or molded into industrial mats.
The proper management of waste tires continues to be a priority. DHEC has initiated steps to prevent illegal tire dumping and to help ensure the movement of tires to recycling facilities. These initiatives include a revision to Regulation 61-107.3 Solid Waste Management: Waste Tires, which became effective in 2015. The regulation revision clarifies reporting and record keeping, and expands the operational, permitting and registration requirements for haulers, collectors and processors of waste tires. One important change is new financial assurance requirements for certain waste tire haulers. Waste tire haulers that haul tires for compensation by other persons are now required to provide $10,000 in financial assurance in order to become registered. Financial assurance is not required for persons who haul 15 or fewer tires at any time or for those who haul tires they have generated in the course of their own business.
DHEC is working with stakeholders to ensure understanding of the provisions of the regulation and provides technical assistance upon request.
RECOMMENDATIONS
Improve markets. Strong markets for waste tires can’t happen without end-users that are knowledgeable about opportunities for using recycled tire rubber in manufacturing and engineering applications and can’t be sustained without healthy waste tire processors to supply quality product. DHEC and the S.C. Department of Commerce (Recycling Market Development Program) should continue efforts in conjunction with tire manufacturers, tire processors, research institutions and others to promote higher-value uses for waste tires and a climate where the economics of waste tire processing can sustain suppliers of processed tire material.
Work with the EPA and others to gain understanding of the potential dangers of crumb tire rubber in certain applications especially playgrounds and sports turfs.
Minimize the opportunities for illegal tire disposal. DHEC efforts should include full implementation of the manifesting and registration requirements. Tire generators and retailers must verify their waste tires are hauled only by legally registered haulers and that they are delivered to appropriate facilities. DHEC should work with waste tire generators, haulers, local governments and waste tire processors to ensure that only properly bonded waste tire haulers are used to move tires.
Engage law enforcement and anti-littering organizations. DHEC should work with state and local law enforcement and anti-littering organizations to locate illegal tire dumps and waste tire stockpiles, and to identify offenders. DHEC also should work with law enforcement to deter illegal dumping and to ensure offenders are dealt with consistently and with all available force of law and regulation. DHEC should work with anti-littering agencies and non-profits to increase awareness of tire dumping issues, and to promote cooperation between law enforcement and community environmental groups.
Involve local governments. DHEC should continue to assist county and municipal governments in implementing waste tire management programs that prevent illegal dumping and encourage the purchase of high-value products made from waste tires. DHEC also should work with local governments to develop programs that expedite the removal of tire dumps and stockpiles. As of the publication date of this report, there have been no confirmed cases of Zika virus in South Carolina; however, mosquitoes also may carry West Nile virus and eastern equine encephalitis. It’s important to control the mosquito populations in our communities, and removing waste tire dumps and other sources of standing water helps eliminate mosquito breeding grounds.
When managed properly, tires can be used in
construction activities and new products as well
as burned for energy recovery.
South Carolina Solid Waste Management Annual Report for Fiscal Year 2015 (Rev. April 2016) 15
Prevent illegal dumping of other material.
Tires, C&D debris, land-clearing debris and electronics are the materials most frequently dumped illegally.
The most common practice is dumping material in a remote area. Another common problem is when material is collected for recycling and stockpiled with a minimum amount being recycled and the remainder left unmanaged. Both activities result in the creation of illegal dumping that degrades property values and puts human health and the environment at risk. Both activities also result in property owners or taxpayers paying for the cleanup.
The underlying causes of illegal dumping are varied, but generally fall into the following categories:
• Low Risk – Haulers that dump tires and land-clearing debris and other material, face a low risk of being identified because the material they dump is difficult to trace to the source. Law enforcement and judicial bodies also may not consider the impact of this dumping on the health, environmental or economic welfare of a community, resulting in low fines and penalties against dumpers.
• Cost Factors – The cost of properly recycling or disposing of certain materials creates an incentive for illegal dumping. The average fee to recycle waste tires, for example, is higher in South Carolina than the cost to properly dispose
of MSW in a landfill. In addition, when a recycled material has a low intrinsic value, the costs to process and sell the material may be greater than the revenue received from its sale. Collectors may stockpile material to avoid processing costs.
• Generator Responsibility – Waste generators sometimes encourage illegal dumping by choosing the lowest cost option available to dispose of waste, without regard for how their waste is managed.
• Statutory and Regulatory Exemptions – The Act provides regulatory exemptions for recycling activities. While this is a positive incentive for legitimate recyclers, some operators use these loopholes to claim they are performing a recycling activity when, in fact, their activities more closely resemble unpermitted landfills.
RECOMMENDATIONS
Regulatory agencies, local governments, private sector businesses and residents should work together to prevent illegal dumping.
Develop strong markets for recyclable material. The higher value a material has, the more likely it is to be treated as a commodity and the less likely it is to be dumped illegally.
Consider statutory and regulatory changes to hold haulers, processors and generators more accountable for the proper collection, transport, recycling and disposal of solid waste and recyclable material.
Implement more robust litter control policies and practices including cooperation between state and local law enforcement agencies and add litter control staff.
Tires, C&D debris, land-clearing debris
and electronics are the materials most frequently
dumped illegally.
Recycling Market Resources
The Green Resource Index, which is designed to help businesses, industry, local governments and others, is a continuously updated, Web-based directory that includes recyclers by commodity, material substitution providers, recycling service providers and equipment vendors. Visit www.scdhec.gov/recycle.
The S.C. Materials Exchange is designed to help businesses, non-profits and other organizations exchange reusable material by providing users access to information on material available or wanted. Visit www.scdhec.gov/scme.
16 South Carolina Solid Waste Management Annual Report for Fiscal Year 2015 (Rev. April 2016)
Maintain and continue to develop recycling markets.
Recycling markets and market development are an indispensable component of South Carolina’s waste management system. Markets use material that otherwise would be disposed of and keeps that material in circulation, creating jobs, conserving resources, reducing the need to build landfills and lessening negative environmental impacts. Recycling only works when there are businesses to buy and reprocess the material that is collected.
South Carolina has several key players focused on market development. The S.C. Department of Commerce’s Recycling Market Development Program and the Recycling Market Development Advisory Council work together to create and grow recycling markets and provide technical assistance as well as track growth, investment and other recycling industry indicators. In addition, the state is a member of the Southeast Recycling Development Council (SERDC). SERDC represents 11 states and works toward coordinating efforts in the region to promote recycling, recycling partnerships and markets through technical assistance and tools.
South Carolina is fortunate to have a robust recycling industry (see Section 4) as well as access to other major companies in the Southeast that need recovered material. These recycling markets, though expanding and widely available for most commodities, continue to be impacted by low regional tipping fees, price fluctuations, competition with virgin material and the economic competition of disposal.
In summary, while much has been accomplished, much remains to be done such as recovering more and cleaner material in a more efficient way and finding solutions for hard-to-recycle items such as carpet, mattresses and fluorescents.
RECOMMENDATIONS
Conduct research to provide more detailed information on the economic impact of recycling with the S.C. Department of Commerce and the University of South Carolina’s Moore School of Business. Work will include determining the benefits of increased recycling of specific commodities and comparing the costs/benefits of disposal, recycling and waste-to-energy.
Promote the economic impact of recycling to decision makers and the public.
Consider incentives to assist in the development of recycling businesses.
Consider the implementation of potential programs to stimulate and support markets for specific material.
Continue to work to attract commercial composting investment in South Carolina. While local governments can play an integral role in developing organics recovery infrastructure in the state, it simply will not work without private investment. Provide technical assistance (e.g., mapping food waste generators across the state).
Encourage the recycling industry to assist stakeholders (e.g., local governments and businesses) to improve the quantity and quality of recovered material through outreach, technical assistance and partnerships.
Work with national, regional and state stakeholders to find new or improved market-based solutions for commodities (e.g., tires, plastic, glass, carpet, C&D debris).
Work with state agencies (e.g., S.C. Department of Transportation) to increase the use of recycled-content material developed by South Carolina companies.
S.C. Smart Business Recycling and Green Hospitality ProgramsThese programs help businesses of all sizes reduce waste, recycle and lessen their environmental impact.
Both programs offer free, confidential, non-regulatory services including: best management practices fact sheets and guides; site visits and technical assistance; research and contacts for potential markets, service providers and beneficial reuse; on-demand webinars; and workshops.
To learn more, visit www.scdhec.gov/smartbusiness or www.scdhec.gov/greenhospitality.
South Carolina is fortunate to have a
robust recycling industry as well as access to other major companies in the
South Carolina Solid Waste Management Annual Report for Fiscal Year 2015 (Rev. April 2016) 17
The Economics of Managing Solid Waste in South Carolina
SECTION
The collection, proper disposal and recycling of solid waste are essential services that have long been recognized as a critical segment of a community’s infrastructure.
These services are no simple task. They are multiple and varied and include disposal, recycling, staffing, outreach/education, trucks, fuel, equipment, buildings, land, insurance and managing facilities (e.g., landfills, transfer stations). They must be done in a way to protect human health and the environment. They must be safe and efficient.
These services are also expensive. Local governments spent more than $323 million to manage solid waste in fiscal year (FY) 2015 (July 1, 2104 to June 30, 2015) and more than $1.6 billion since FY11 according to the full-cost disclosure information reported to the S.C. Department of Health and Environmental Control.
When looking at the overall cost of solid waste management, the first question frequently asked is “What is the cost of disposal compared to recycling?” Local government recycling programs compete with the consistently low cost of disposal in South Carolina – tipping fees average $40 per ton. What is often forgotten is that recycling, at a minimum, avoids disposal costs and may offer the chance to earn revenue from the sale of the material.
Unfortunately, the revenue from the sale of recyclables is at best an inconsistent benefit. Recyclables, it must be remembered, are commodities that are subject to the same changes in value as other commodities. Recycling markets are historically very inconsistent and throughout this reporting period trending downwards.
In summary, local governments face a difficult economics balancing act of cost and services. No matter the choice – disposal or recycling – there is a cost. (See the recommendation on ending the myth that recycling is free on page 7.)
The Economic Impact of RecyclingWhile local government program choices and costs are discussed and debated, it is accepted that recycling plays a significant role in the nation’s and South Carolina’s economy. The reason is simple. Material that is disposed of adds no further value. Material that is recycled and reintroduced as a
feedstock into a manufacturing process continues to generate economic activity.
Recycling creates significant economic activity in South Carolina. The state’s recycling industry is comprised of more than 520 companies that haul, collect, process and broker material, sell equipment and manufacture recycled-content products. This industry provides more than 22,000 direct jobs, $2.7 billion in annual labor income and nearly $330 million in state and local taxes every year according to a 2014 study. Overall, the industry has a $13 billion annual impact on the state’s economy.
Recycling InvestmentThe recycling industry continued to grow in 2015 with new companies coming to South Carolina and existing companies expanding their operations. Twelve new or existing companies made $260 million in capital investments and created more than 550 jobs according to the S.C. Department of Commerce Recycling Market Development Advisory Council.
Since 2011, the industry has invested more than $1.3 billion and created more than 3,500 jobs. See Table 4.1 for more information.
Estimated Lost RevenueIt is estimated that 525,543 tons of easily recyclable material – aluminum cans, cardboard, glass bottles and jars, office paper, plastic bottles and steel cans – was disposed of in FY15.* Using the state’s average tipping fee of $40 per ton, it is projected that local governments spent more than $21 million to dispose of this material.
It is also estimated that more than $157 million in potential revenue from the sale of this material was lost based on the average revenue received per ton as reported by local governments of each of these types of material.
* The estimated amount of material disposed of that could have been recycled is calculated by using the U.S. Environmental Protection Agency’s most recent municipal solid waste (MSW) generation rates to South Carolina’s FY15 generation.
18 South Carolina Solid Waste Management Annual Report for Fiscal Year 2015 (Rev. April 2016)
In 2014, the state’s recycling industry doubled its annual total economic impact to
$13 billion (from $6.5 billion in 2006).
The Economic Impact of Recycling in South Carolina*
South Carolina saw a
44% increase in recycling employment from 2006 to 2014 (a 4.7 percent
annual growth rate).
The recycling sector provides
22,403 jobs to South Carolina’s economy.
The annual average wage of the recycling sector is
$40,203 (vs. the national annual
average wage of $38,700).
The recycling sector provides
$329 million in state and local taxes each year.
In South Carolina, there are
more than 520 recycling-related companies.
The state’s recycling industry provides a total of
$2.7 billion in labor income generated annually.
* SOURCE: “The Economic Impact of the Recycling Industry in South Carolina,” Dr. Frank Hefner, College of Charleston Department of Economics and Finance. The study, which was released in April 2014, is a follow-up to the 2006 study. The annual figures reflect 2013 data.
TABLE 4.1: Recycling Investments in South Carolina
YEAR CAPITAL NEW JOBS BUSINESSES
2011 $333,000,000 837 15
2012 $463,000,000 771 19
2013 $104,000,000 765 10
2014 $156,000,000 586 9
2015 $260,000,000 565 12
TOTAL $1,315,000,000 3,524 65
South Carolina Solid Waste Management Annual Report for Fiscal Year 2015 (Rev. April 2016) 19
Recycling by Commodity SECTION
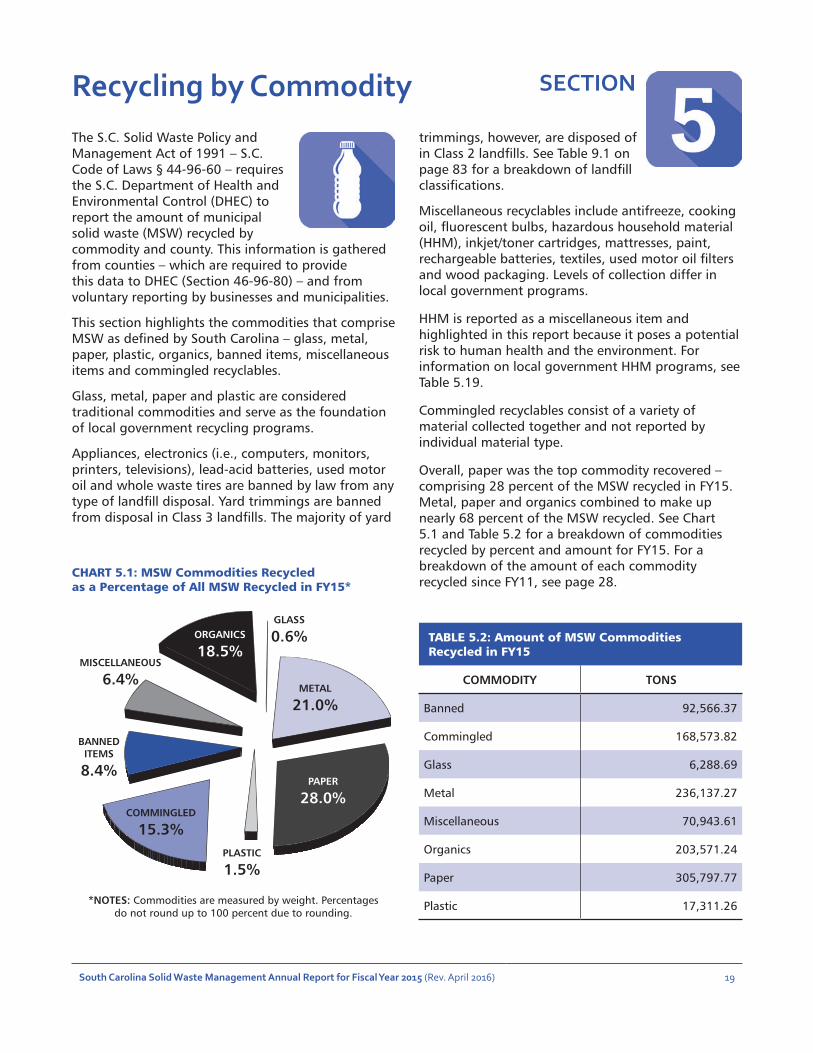
The S.C. Solid Waste Policy and Management Act of 1991 – S.C. Code of Laws § 44-96-60 – requires the S.C. Department of Health and Environmental Control (DHEC) to report the amount of municipal solid waste (MSW) recycled by commodity and county. This information is gathered from counties – which are required to provide this data to DHEC (Section 46-96-80) – and from voluntary reporting by businesses and municipalities.
This section highlights the commodities that comprise MSW as defined by South Carolina – glass, metal, paper, plastic, organics, banned items, miscellaneous items and commingled recyclables.
Glass, metal, paper and plastic are considered traditional commodities and serve as the foundation of local government recycling programs.
Appliances, electronics (i.e., computers, monitors, printers, televisions), lead-acid batteries, used motor oil and whole waste tires are banned by law from any type of landfill disposal. Yard trimmings are banned from disposal in Class 3 landfills. The majority of yard
trimmings, however, are disposed of in Class 2 landfills. See Table 9.1 on page 83 for a breakdown of landfill classifications.
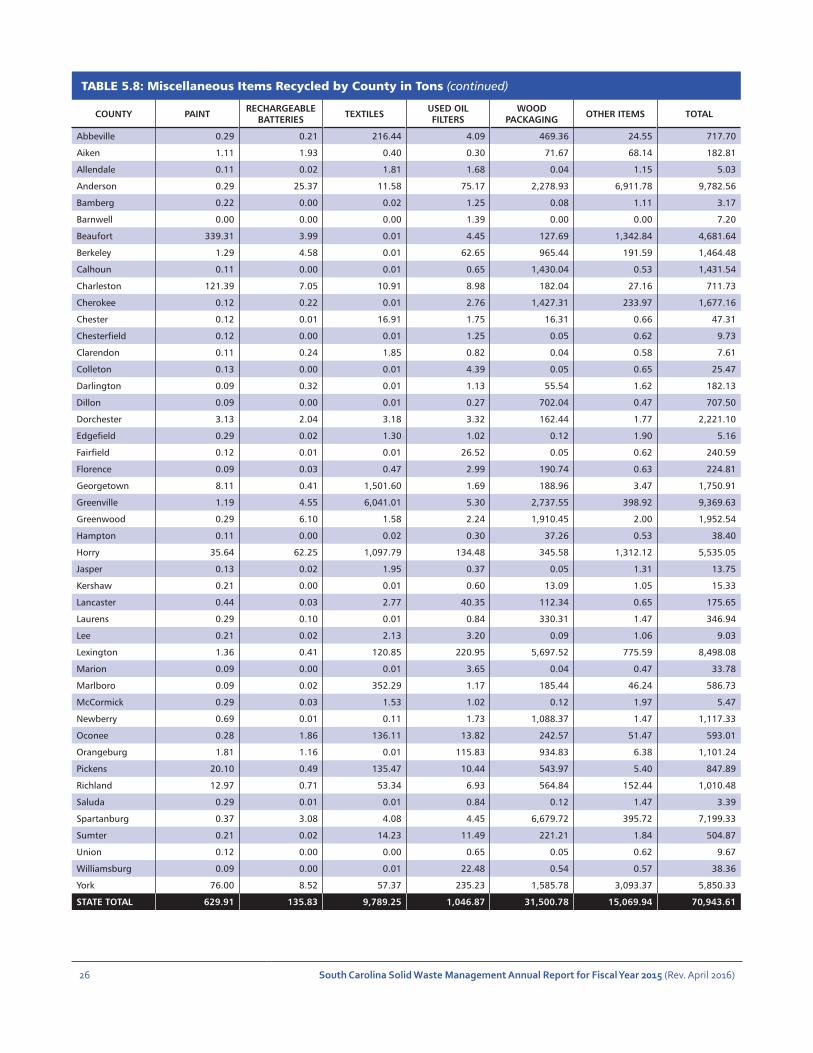
Miscellaneous recyclables include antifreeze, cooking oil, fluorescent bulbs, hazardous household material (HHM), inkjet/toner cartridges, mattresses, paint, rechargeable batteries, textiles, used motor oil filters and wood packaging. Levels of collection differ in local government programs.
HHM is reported as a miscellaneous item and highlighted in this report because it poses a potential risk to human health and the environment. For information on local government HHM programs, see Table 5.19.
Commingled recyclables consist of a variety of material collected together and not reported by individual material type.
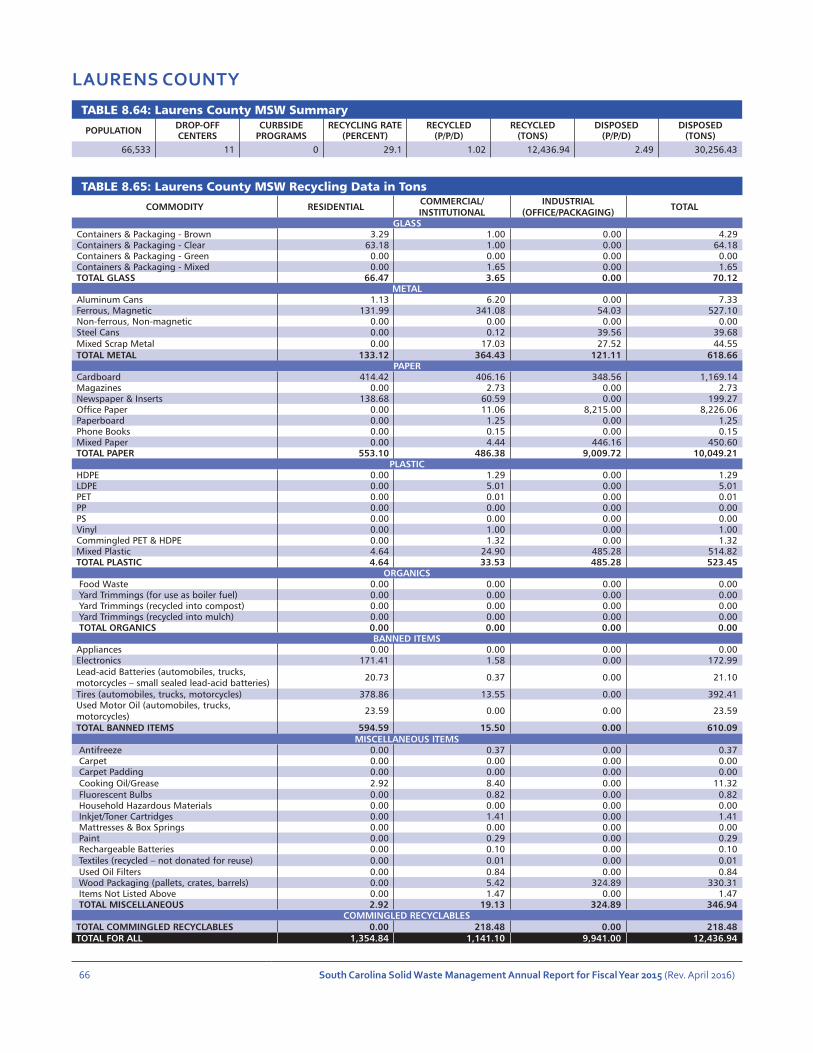
Overall, paper was the top commodity recovered – comprising 28 percent of the MSW recycled in FY15. Metal, paper and organics combined to make up nearly 68 percent of the MSW recycled. See Chart 5.1 and Table 5.2 for a breakdown of commodities recycled by percent and amount for FY15. For a breakdown of the amount of each commodity recycled since FY11, see page 28.
TABLE 5.2: Amount of MSW Commodities Recycled in FY15
COMMODITY TONS
Banned 92,566.37
Commingled 168,573.82
Glass 6,288.69
Metal 236,137.27
Miscellaneous 70,943.61
Organics 203,571.24
Paper 305,797.77
Plastic 17,311.26*NOTES: Commodities are measured by weight. Percentages do not round up to 100 percent due to rounding.
CHART 5.1: MSW Commodities Recycled as a Percentage of All MSW Recycled in FY15*
MISCELLANEOUS
6.4%
COMMINGLED
15.3%
BANNEDITEMS
8.4%
ORGANICS
18.5%
PLASTIC
1.5%
GLASS
0.6%
METAL
21.0%
PAPER
28.0%
20 South Carolina Solid Waste Management Annual Report for Fiscal Year 2015 (Rev. April 2016)
TABLE 5.3: Glass Recycled by County in Tons
COUNTY BROWN CLEAR GREEN MIXED COUNTY TOTALAbbeville 0 0 0 1.63 1.63
Aiken 0 0 0 0.59 0.59
Allendale 0 0 0 2.39 2.39
Anderson 111.43 162.15 111.46 2.09 387.13
Bamberg 0 0.03 0 1.27 1.30
Barnwell 0 0 0 0 0
Beaufort 12.01 3.26 2.01 879.87 897.15
Berkeley 0 0 0 14.22 14.22
Calhoun 0 0 0 0.59 0.59
Charleston 0.04 0.58 0 15.77 16.39
Cherokee 28.71 39.10 17.41 0.69 85.91
Chester 0 0 0 45.91 45.91
Chesterfield 0 0 0 0.69 0.69
Clarendon 0 0 67.70 0.59 68.29
Colleton 0 0 0 36.92 36.92
Darlington 0 0.25 0 0.52 0.77
Dillon 0 0 0 0.52 0.52
Dorchester 0.01 0.01 0.01 0.76 0.79
Edgefield 0 0 0 1.63 1.63
Fairfield 1.27 0 0 54.43 55.70
Florence 0 0 0 0.52 0.52
Georgetown 0.01 0.05 0 209.41 209.47
Greenville 0 2.52 0 27.76 30.28
Greenwood 0 0 0 1.63 1.63
Hampton 44.60 0.04 0.03 0.59 45.26
Horry 0.01 0.05 0 1,508.27 1,508.33
Jasper 0 0 0 0.87 0.87
Kershaw 0 0 0 21.46 21.46
Lancaster 0 0 0 0.69 0.69
Laurens 4.29 64.18 0 1.65 70.12
Lee 0 0 0 1.17 1.17
Lexington 131.05 182.01 88.26 24.72 426.04
Marion 0 0 0 0.52 0.52
Marlboro 0 0 0 0.52 0.52
McCormick 0 0 0 1.63 1.63
Newberry 0.40 0.40 0.05 85.67 86.52
Oconee 72.45 127.68 124.52 1.56 326.21
Orangeburg 0 0 0 7.66 7.66
Pickens 98.30 205.20 87.63 23.00 414.13
Richland 22.16 11.55 65.70 241.62 341.03
Saluda 0 0 0 1.63 1.63
Spartanburg 0.15 0.15 0.03 31.51 31.84
Sumter 521.60 37.60 0 119.72 678.92
Union 0 0 0 0.69 0.69
Williamsburg 0 0 0 0.52 0.52
York 135.07 199.42 122.64 5.38 462.51
STATE TOTAL 1,183.56 1,036.23 687.45 3,381.45 6,288.69
South Carolina Solid Waste Management Annual Report for Fiscal Year 2015 (Rev. April 2016) 21
TABLE 5.4: Metal Recycled by County in Tons
COUNTY ALUMINUM FERROUS NON-FERROUS STEEL MIXED SCRAP COUNTY TOTAL
Abbeville 1.35 120.23 0.00 0.12 613.82 735.52
Aiken 0.97 1.45 0.00 1.03 523.32 526.77
Allendale 0.32 1.30 0.00 4.53 50.15 56.30
Anderson 84.00 3,983.81 2.25 61.84 3,521.96 7,653.86
STATE TOTAL 6,083.47 7,300.49 104,444.94 79,517.34 203,571.24
28 South Carolina Solid Waste Management Annual Report for Fiscal Year 2015 (Rev. April 2016)
TABLE 5.11: Amount of Glass Recycled in South Carolina by FY
FISCAL YEAR TONS
2011 12,800.86
2012 10,646.59
2013 9,183.02
2014 5,979.56
2015 6,288.69
TABLE 5.12: Amount of Metal Recycled in South Carolina by FY
FISCAL YEAR TONS
2011 315,078.24
2012 323,820.77
2013 340,623.29
2014 349,233.40
2015 236,137.31
TABLE 5.13: Amount of Paper Recycled in South Carolina by FY
FISCAL YEAR TONS
2011 440,363.02
2012 395,775.10
2013 474,784.31
2014 316,216.86
2015 305,797.77
TABLE 5.14: Amount of Plastic Recycled in South Carolina by FY
FISCAL YEAR TONS
2011 17,673.39
2012 18,211.66
2013 19,813.86
2014 16,077.12
2015 17,311.26
TABLE 5.15: Amount of Banned Items Recycled in South Carolina by FY
FISCAL YEAR TONS
2011 294,894.79
2012 328,791.42
2013 337,863.96
2014 95,691.21
2015 92,566.37
TABLE 5.16: Amount of Miscellaneous Items Recycled in South Carolina by FY
FISCAL YEAR TONS
2011 44,525.46
2012 70,045.05
2013 57,141.48
2014 115,843.91
2015 70,943.61
TABLE 5.17: Amount of Organics Recycled in South Carolina by FY
FISCAL YEAR TONS
2011 1,659.97*
2012 1,624.64*
2013 8,906.25*
2014 257,980.35
2015 203,571.24
TABLE 5.18: Amount of Commingled Recycled in South Carolina by FY
FISCAL YEAR TONS
2011 47,432.22
2012 81,809.84
2013 92,550.41
2014 106,472.43
2015 168,573.82
*This amount is included in the total for Miscellaneous Items under Food Scraps.
TABLE 5.19: HHM Collected by Counties in FY15
COUNTY TONS
Beaufort* 339.18
Charleston 132.70
Chester 9.00
Georgetown* 7.98
Greenville* 0.67
Horry* 35.43
Lancaster* 0.32
Lexington 12.16
Pickens* 19.82
Richland 12.91
Spartanburg 20.77
York 85.83
*Only paint was reported.
South Carolina Solid Waste Management Annual Report for Fiscal Year 2015 (Rev. April 2016) 29
Used Motor Oil Recycling SECTION
The S.C. Solid Waste Policy and Management Act of 1991 (Act) – S.C. Code of Laws § 44-96-160 – requires the S.C. Department of Health and Environmental Control (DHEC) to publish an annual report on the state’s used motor oil recycling program for do-it-yourself oil changers (DIYers). According to the Act, the report must include:
• The amount of used motor oil collected in each county;
• The number of used motor oil collection sites available in each county; and
• A summary of local government programs receiving grant funding from DHEC.
The Act requires transporters of used motor oil to register and report to DHEC the amount hauled each calendar year. For purposes of this report, however, the amount of used motor oil collected is presented by fiscal year (FY) – July 1 to June 30 – as reported by counties.
In South Carolina, only used motor oil recycled by DIYers is counted as part of the state’s municipal solid waste recycling rate. In FY15, DIYers recycled 711,411 gallons (or about 2,490 tons) of used motor oil – a decrease of nearly 25 percent from the previous FY. Overall, there were 891 collection sites provided by local governments, retailers, quick lubes and auto parts stores.
Chart 6.1 illustrates the success of the used motor oil collection program by FY. Table 6.2 lists the number of sites and gallons collected by county as well as grant awards to the county or municipalities within that county.
There is a fee of 2 cents per quart of motor oil collected at the wholesale level. Part of this funding is used to provide grants for local governments focusing on DIY used motor oil collection and recycling. In FY15, $706,766 was awarded to local government programs and primarily used for the purchase of equipment and supplies associated with used motor oil collection sites. Funds also were used to cover costs for used motor oil filter recycling, public education and professional development of local government recycling coordinators and others.
In addition to used motor oil, most county and some municipal recycling programs also collect used motor oil filters and bottles from DIYers.
The amount of used motor oil filters and motor oil bottles recycled is difficult to determine or is not always available. For example, many counties collect and market filters with other metals. Given that, the data presented in Section 5 (Table 5.7) does not reflect the full extent of used motor oil filter recycling in the state. Likewise, motor oil bottles (if properly drained) are collected and mixed with other plastic bottles – further hindering an accurate measurement.
Overall, there are few barriers to recycling used motor oil, used motor oil filters and motor oil bottles. Markets are not an issue. Used motor oil typically is collected and burned for energy recovery. Also, scrap dealers and steel mills accept drained/crushed used oil filters. In addition, because of the recent drop in oil prices, local governments are not compensated as well for their collected used oil.
FY15 711,411 gallons
FY14 951,531 gallons
FY13 828,836 gallons
FY12 932,725 gallons
FY11 1,001,714
gallons
CHART 6.1: Gallons of Used Motor Oil Recycled by S.C. DIYers by FY
30 South Carolina Solid Waste Management Annual Report for Fiscal Year 2015 (Rev. April 2016)
TABLE 6.2: Number of DIY Used Motor Oil Collection Sites, FY15 Grants Awarded, Gallons Collected and Tonnage Equivalent by County for FY15
GRANTEE NUMBER OF SITES GALLONS TONS GRANT AMOUNTAbbeville 13 10,545.00 36.91 $6,318.00Aiken 30 31,085.00 108.80 $38,950.00
Columbia, City of t t t $5,750.00Saluda 9 1,234.00 4.32 $0.00Spartanburg 39 42,122.00 147.43 $8,930.00
Spartanburg, City of t t t $3,750.00Sumter 22 29,602.00 103.61 $11,970.00
Sumter, City of t t t $4,350.00Union 10 3,760.00 13.16 $1,400.00Williamsburg 25 12,977.00 44.37 $24,415.00York 33 35,911.00 125.69 $24,500.00
Rock Hill, City of t t t $7,110.00Three Rivers SWA1 t t t $59,165.00Tri-County SWA2 t t t $5,251.00TOTAL 891 711,411.00 2,489.94 $706,766.00
1. The Three Rivers Solid Waste Authority (SWA) provides solid waste management services to local governments in Aiken, Allendale, Bamberg, Barnwell, Calhoun, Edgefield, McCormick, Orangeburg and Saluda counties.
2. The Tri-County SWA provides solid waste management services to local governments in Edgefield, McCormick and Saluda counties.
t Grant funding awarded to municipalities and regional authorities primarily is used to promote used motor oil recycling. Collection sites operated and/or used motor oil collected by a municipality are included in the county’s total.
NOTES: The majority of sites listed above are provided by local governments, but the total number (891) includes retailers, quick lubes and auto parts stores. Gallons are converted to weight (1 gallon = 7 pounds).
South Carolina Solid Waste Management Annual Report for Fiscal Year 2015 (Rev. April 2016) 31
Recycling: State Agencies & Colleges/Universities
SECTION
The S.C. Solid Waste Policy and Management Act of 1991 (Act) – S.C. Code of Laws § 44-96-140 – requires state agencies and state-supported colleges/universities to:
• Establish recycling programs for the collection of selected material including, but not limited to, aluminum, cardboard, glass, lead-acid batteries, paper, plastic, tires and used motor oil;
• Make necessary modifications to their programs to ensure material is recycled to the maximum extent possible; and
• Report the type and amount of material recycled as well as information on the purchase of recycled-content products by September 15 of each year to the S.C. Department of Health and Environmental Control (DHEC).
DHEC is required to submit a report on this information to the governor and General Assembly by November 1 of each year.
This section is a condensed version of the report and reflects recycling and buying recycled activities for fiscal year (FY) 2015 (July 1, 2014 to June 30, 2015). To view the full report, visit www.scdhec.gov/recycle and select “Data and Reports.”
Data regarding the amount of material recycled was received either directly from the state agency or college/university that completed the survey provided
by DHEC or from vendors providing recycling services. Both public and private colleges/universities are included in this report although only state-supported colleges/universities are required by the Act to provide information.
In FY15, state agencies and colleges/universities recycled more than 23,627 tons of material – an increase of about 19 percent from the 19,771 tons recycled in FY14. This data was compiled from the information reported by 74 state agencies and 39 colleges/universities.
Overall, state agencies reported recycling 9,302 tons of material in FY15 – about a 5 percent decrease from the 9,790 tons recycled the previous FY. Paper was the most recycled commodity followed by construction and demolition (C&D) debris.
Colleges/universities reported recycling about 14,325 tons of material – a 43 percent increase from the 9,980 tons recycled the previous FY. C&D debris was the most recycled commodity followed by paper. In FY15, colleges/universities recycled more than 3,800 tons of C&D debris – an increase of 335 percent from the previous FY.
The percentage of state purchases that contain recycled material cannot be determined because no statewide system to track those purchases exists. The recycled-content products purchased most frequently by state agencies and colleges/universities were office paper and inkjet/toner cartridges.
Clemson is national champion of KAB’s GameDay Recycling ChallengeClemson University is No. 1 in recycling. The Tigers topped more than 90 colleges/universities to win Keep America Beautiful’s (KAB) 2014 GameDay Recycling Challenge by collecting 60,274 pounds of recyclables during their home football game against the University of South Carolina.
The winning effort included placing recycling bins and bag dispensers within the three-square mile tailgating area and providing more than 2,000 recycling bags to tailgaters.
KAB recognized Clemson for its winning efforts in February 2015 at a Tigers’ basketball game. In addition to the total recycling category, Clemson also finished 14th nationally in the waste diversion competition with a 63.4 percent diversion rate. Other South Carolina rankings in this category included: Coastal Carolina at No. 19 with a 53.5 percent diversion rate, The Citadel at No. 20 (51.3 percent) and the University of South Carolina at No. 32 (34.6 percent).
32 South Carolina Solid Waste Management Annual Report for Fiscal Year 2015 (Rev. April 2016)
Recycling by State AgenciesOverall, state agencies reported recycling 9,302 tons of material – a decrease of about 5 percent from FY14. Compared to the previous FY, more material was recycled single-stream, explaining a decrease in paper and plastic. In addition, more metal and glass were recycled than in FY14. The largest contribution to the decrease in recycling was wood, C&D debris and organics.
Seventy-four state agencies reported recycling and buying recycled data for FY15 with 24 agencies reporting an increase in their total recycling compared with FY14.
For a complete list of state agencies reporting for FY15, see the last page of this section.
TABLE 7.2: Commodities Recycled in Tons by State Agencies
TOTAL MISCELLANEOUS ITEMS 3,367.36TOTAL FOR ALL 9,302.90
NOTE: C&D debris is not included in the state’s MSW recycling rate.
METAL
20.5%
MISCELLANEOUS
36.2%
PAPER
26.8%
BANNED ITEMS 11.2% COMMINGLED
3.7%
ORGANICS
<1%
GLASS
0.5%
PLASTIC
<1%
CHART 7.1: Percentage of Recyclables Collected by State Agencies
NOTE: Percentages do not add up to 100 percent due to rounding of numbers.
––––––––––––––––––––––––––
The Green Government Initiative assists state agencies in meeting the requirements of the S.C. Solid Waste Policy and Management Act of 1991 and helps South Carolina meet its goal of recycling 40 percent of its waste by 2020. The goal of this program is to encourage state agencies to lead by example to reduce their environmental footprint and increase the state’s impact on recycling markets.
South Carolina Solid Waste Management Annual Report for Fiscal Year 2015 (Rev. April 2016) 33
Recycling by Colleges/UniversitiesOverall, colleges and universities reported recycling 14,325 tons of material – an increase of about 43 percent from the previous fiscal year. Compared to the past fiscal year, single stream recycling more than doubled – explaining a decrease in paper, plastic and metal. In addition, glass, wood and banned items also increased. The largest contributions to the increase were C&D debris and organics.
Thirty-nine colleges and universities reported recycling and buying recycled data for FY15 with eighteen colleges/universities reporting an increase in their total recycling compared to FY14.
For a complete list of colleges and universities reporting for FY15, see the last page of this section.
TABLE 7.4: Commodities Recycled in Tons by Colleges/Universities
TOTAL MISCELLANEOUS ITEMS 4,290.03TOTAL FOR ALL 14,325.66
NOTE: C&D debris is not included in the state’s MSW recycling rate.
PAPER
26.2%
PLASTIC
0.3%
MISCELLANEOUS
29.9%
GLASS
0.2%
COMMINGLED
11.7%
ORGANICS
23.6%
METAL
5.9%
BANNED ITEMS
2.2%
CHART 7.3: Percentage of Recyclables Collected by Colleges/Universities
NOTE: Percentages do not add up to 100 percent due to rounding of numbers.
––––––––––––––––––––––––––
RecycleU is a comprehensive program that provides technical assistance, best management practices and outreach material to South Carolina colleges and universities in order to improve waste reduction, recycling and composting programs on campus.
34 South Carolina Solid Waste Management Annual Report for Fiscal Year 2015 (Rev. April 2016)
State Agencies Reporting for FY15• Administrative Law Court
• Arts Commission
• Attorney General’s Office
• Budget & Control Board – Internal Operations
• Capitol Complex
• Commission for Minority Affairs
• Commission for the Blind
• Commission on Higher Education
• Commission on Indigent Defense
• Commission on Prosecution Coordination
• Comptroller General’s Office
• Court Administration
• Criminal Justice Academy
• Department of Administration
• Department of Administration – Surplus Property Office
• Department of Agriculture
• Department of Archives and History
• Department of Commerce
• Department of Consumer Affairs
• Department of Corrections
• Department of Disabilities and Special Needs
• Department of Education
• Department of Employment and Workforce
• Department of Health and Human Services
• Department of Health and Environmental Control
• Department of Juvenile Justice
• Department of Labor, Licensing and Regulation
• Department of Mental Health
• Department of Motor Vehicles
• Department of Natural Resources
• Department of Parks, Recreation and Tourism
• Department of Probation Parole and Pardon Services
• Department of Public Safety
• Department of Revenue
• Department of Social Services
• Department of Transportation
• Education Lottery
• Education Oversight Committee
• Emergency Management Division
• First Steps
• Forestry Commission
• Governor’s Mansion
• Governor’s School for Arts and Humanities
• Governor’s School for Science and Math
• Higher Education Tuition Grants Commission
• Human Affairs Commission
• Legislative Audit Council
• Legislative Printing, Information and Technology Systems
• Lieutenant Governor’s Office
• Office of Regulatory Staff
• Office of the State Auditor
• Patriots Point Development Authority
• Public Employee Benefit Authority
• Public Service Commission of South Carolina
• Revenue and Fiscal Affairs Office
• Santee Cooper
• SCETV
• School for the Deaf and Blind
• Sea Grant Consortium
• Secretary Of State
• SLED
• South Trust Building
• State Accident Fund
• State Budget and Control Board
• State Ethics Commission
• State Fiscal Accountability Authority – Division of Procurement Services
• State Fiscal Accountability Authority/Insurance Reserve Fund
• State Housing Finance and Development Authority
• State Information Technology
• State Library
• State Museum Commission
• Technical College System
• Vocational Rehabilitation Department
• Wil Lou Gray Opportunity School
• Workers’ Compensation Commission
Colleges/Universities Reporting for FY15• Aiken Technical College
• Bob Jones University
• Central Carolina Technical College
• Centura College
• Charleston Southern University
• Claflin University
• Clemson University
• Coastal Carolina University
• College Of Charleston
• Columbia International University
• Florence Darlington Technical College
• Francis Marion University
• Furman University
• Greenville Technical College
• Horry-Georgetown Technical College
• Medical University of South Carolina
• Midlands Technical College
• Newberry College
• Northeastern Technical College
• Orangeburg-Calhoun Technical College
• Piedmont Technical College
• Presbyterian College
• South Carolina State University
• Southern Wesleyan University
• Spartanburg Community College
• Technical College of the Lowcountry
• The Citadel
• Trident Technical College
• University of South Carolina (USC)
• USC Aiken
• USC Beaufort
• USC Lancaster
• USC School of Medicine
• USC Sumter
• USC Upstate
• Williamsburg Technical College
• Winthrop University
• Wofford College
• York Technical College
South Carolina Solid Waste Management Annual Report for Fiscal Year 2015 (Rev. April 2016) 35
Recycling: The State & Counties at a Glance
The S.C. Solid Waste Policy and Management Act of 1991 – S.C. Code of Laws § 44-96-80 – requires counties or regions to annually report municipal solid waste (MSW) recycling data by commodity and amount to the S.C. Department of Health and Environmental Control. The commodities reported are: glass; metal; paper; plastic; organics; banned items; miscellaneous items; and commingled recyclables.
Recycling data also was collected from other sources including waste tire processors, electronics recycling vendors, used motor oil collectors, state agencies and colleges/universities as well as businesses and industries. This data was attributed to counties based on population or source. Once collected, the data is placed into one of three categories based on the source of the material: residential; commercial/institutional; and industrial (office/packaging). See Section 1 for types and examples of material from each of these sources.
TABLE 8.2: S.C. Residential Recycling as a Percent of Total MSW Recycled
FY11 FY12 FY13 FY14 FY15
35% 37% 35% 40% 43%
TABLE 8.3: S.C. MSW Recycling Tonnages
TONS+/– IN
TONS FROM PREVIOUS FY
CHANGE FROM
PREVIOUS FYFY11
All MSW 1,172,768 +109,247 +10%Residential Only 413,652 –7,988 –2%
FY12All MSW 1,229,100 +56,332 +5%Residential Only 460,588 +46,936 +11%
FY13All MSW 1,371,960 +142,860 +11.6%Residential Only 478,426 +17,838 +3.8%
FY14All MSW 1,263,495 –108,465 –8%Residential Only 502,535 +24,109 +5%
FY15All MSW 1,101,190 –162,305 –13%Residential Only 469,318 –33,217 –6.6%
TABLE 8.1: S.C. Counties Meeting the Disposal Goal of 3.25 P/P/D or Less in FY15
COUNTY DISPOSAL RATE COUNTY DISPOSAL
RATE
Abbeville 2.60 Jasper 2.54
Aiken 2.60 Kershaw 2.78
Allendale 2.36 Lancaster 2.61
Anderson 2.57 Laurens 2.49
Berkeley 2.47 Lee 2.56
Chester 2.93 Lexington 3.08
Chesterfield 2.48 Marlboro 2.56
Clarendon 2.02 McCormick 2.04
Colleton 2.71 Orangeburg 3.05
Darlington 2.78 Pickens 2.50
Dillon 3.15 Saluda 2.32
Dorchester 2.21 Sumter 2.95
Greenville 3.07 Williamsburg 1.19
Hampton 2.89
SECTION
Businesses and industries are not required to report their recycling activities. Unfortunately, the voluntary reporting by these sources is inconsistent and harms the state’s ability to accurately measure its recycling efforts.
South Carolina’s MSW recycling rate decreased to 26.5 percent in fiscal year (FY) 2015 (July 1, 2014 to June 30, 2015) from 29.2 percent in FY14. In South Carolina, only MSW is used to measure the state’s recycling efforts. (See the definition on page 2.) Overall, the amount of MSW recycled decreased nearly 13 percent from 1,263,495 tons in FY14 to 1,101,190 tons in FY15. For total MSW and residential recycling tonnages since FY11, see Table 8.3.
The state’s goal is to recycle at least 40 percent of its MSW and reduce MSW disposal to 3.25 pounds (or less) per person per day (p/p/d) by 2020. In FY15, only one county – Beaufort – had a recycling rate greater than 40 percent. Twenty-seven counties met the waste reduction goal of 3.25 p/p/d or less. (See Table 8.1.) For a county-by-county comparison of MSW recycling and disposal data, see Table 9.11 on page 93.
36 South Carolina Solid Waste Management Annual Report for Fiscal Year 2015 (Rev. April 2016)
COMMINGLED RECYCLABLESTOTAL COMMINGLED RECYCLABLES 106,884.40 59,567.88 2,121.54 168,573.82 TOTAL FOR ALL 469,317.61 410,941.29 220,931.13 1,101,190.03
South Carolina Solid Waste Management Annual Report for Fiscal Year 2015 (Rev. April 2016) 37
ABBEVILLE COUNTY
TABLE 8.6: Abbeville County MSW Summary
POPULATION DROP-OFF CENTERS
CURBSIDE PROGRAMS
RECYCLING RATE (PERCENT)
RECYCLED (P/P/D)
RECYCLED (TONS)
DISPOSED (P/P/D)
DISPOSED (TONS)
24,965 10 1 21.0 0.69 3,147.84 2.60 11,851.59
TABLE 8.7: Abbeville County MSW Recycling Data in Tons
COMMINGLED RECYCLABLESTOTAL COMMINGLED RECYCLABLES 4,981.91 253.75 9.30 5,244.96 TOTAL FOR ALL 36,453.38 9,361.67 46,321.16 92,136.21
South Carolina Solid Waste Management Annual Report for Fiscal Year 2015 (Rev. April 2016) 83
DisposalThe S.C. Solid Waste Policy and Management Act of 1991 (Act) – S.C. Code of Laws §§ 44-96-10 et seq. – and subsequent regulation (R.61-107.19) require permitted private and public solid waste landfills to report the amount and type of solid waste disposed of annually to the S.C. Department of Health and Environmental Control (DHEC).
This section focuses on disposal of both municipal solid waste (MSW) and total solid waste (TSW) as defined on page 2. As required by the Act, the focus of this report is on MSW.
In fiscal year (FY) 2015 (July 1, 2014 to June 30, 2015) there were 378 solid waste facilities operating under the authority of 15 types of permits in South Carolina. (See Section 10 for a complete list of facilities.) Of that total number of facilities, 157 were landfills. There are three landfill classifications – each of which accepts specific material. See Table 9.1.
Key Disposal Indicators from FY15
The amount of material disposed of in Class 1 landfills decreased 24 percent (21,909 tons) in FY15 – dropping to 68,206 tons. This is mostly due to a decrease in storm debris and the number of Class 1 landfills in operation. See Table 9.13 for Class 1 FY15 disposal totals by county. The amount of C&D debris and certain industrial waste disposed of in Class 2 landfills increased about 0.4 percent* (11,833 tons*) to 3,067,388 tons* in FY15. See Table 9.14 for a list of Class 2 landfills including permitted annual disposal, FY15 disposal and estimated remaining life.
Of the 27 Class 3 landfills, 11 are publicly owned and 16 are privately owned. (See the map on page 86.) The privately owned landfills include seven industrial landfills (i.e., non-commercial). See Table
SECTION
9.7 for a complete list of Class 3 landfills including permitted annual rate of disposal, FY15 disposal and estimated remaining life.
South Carolinians disposed of 3,058,388 tons of MSW in FY15 – a decrease of 0.3 percent (almost 10,000 tons) from the previous FY. On average, each South Carolinian disposed of about 3.5 pounds of MSW per day – the same as the previous FY.
TSW disposal in Class 3 landfills increased about 315,000 tons in FY15 to about 5.6 million tons. Of that amount, the majority (3.8 million tons or 69 percent) was disposed of in the 16 privately owned Class 3 landfills. The remainder (1.8 million tons or 31 percent) was disposed of in the state’s 11 publicly owned Class 3 landfills.
Lee County Landfill, Oakridge Landfill, Richland Landfill and Upstate Regional Landfill accepted 51 percent (about 2.9 million tons) of the TSW disposed of in Class 3 landfills. Of those four landfills, Richland Landfill accepted 17 percent (more than 954,000 tons). See Tables 9.7 through 9.10 for an overview of disposal data.
TABLE 9.1: S.C. Landfill Classifications
TYPE NUMBER OF FACILITIES IN FY15
MATERIAL ACCEPTED
Class 1 40 Land-clearing debris
Class 2 90Construction and demolition (C&D) debris
Class 3 27MSW, C&D debris and industrial solid waste
TABLE 9.2: S.C. Waste Disposed of by FY
FY11 FY12 FY13 FY14 FY15
MSW Disposed of in Tons 3,065,806 2,935,876 2,985,852 3,067,942 3,058,338
MSW Disposed of in p/p/d 3.6 3.4 3.5 3.5 3.5
TSW Disposed of in Tons 7,824,312 7,696,559 7,906,522 7,918,780 8,317,621*
TSW Disposed of in p/p/d 9.3 9.0 9.2 9.1 9.4*
*Rev. April 2016
84 South Carolina Solid Waste Management Annual Report for Fiscal Year 2015 (Rev. April 2016)
FY15 200,164
FY14 163,089
FY13 148,146
FY12 84,897
FY11 115,780
TONS
Import and Export of Solid Waste The amount of out-of-state solid waste disposed of in South Carolina in FY15 was 655,768 tons – a decrease of 5 percent from the previous FY. (See Chart 9.4 below.) Overall, this represents about 7
NORTH CAROLINA
52%
OTHER
1%
NEW YORK
32%
GEORGIA
15%
percent of the total amount of solid waste disposed of in the state.
In FY15, the vast majority of out-of-state solid waste was disposed of in four Class 3 landfills – Lee County Landfill, Palmetto Landfill, Richland Landfill and Upstate Regional Landfill. (See Table 9.6.) Most of the solid waste imported into the state during FY15 was from North Carolina and New York. Those two states combined for 84 percent (more than 551,000 tons) of the total amount of solid waste imported to South Carolina. (See Chart 9.3 and Table 9.6.)
Also see Table 9.6 for amounts of out-of-state waste imported into the state through processing facilities. By attributing this waste to the state of origin rather than the processing facility’s county, a more accurate representation of out-of-state waste disposed of in South Carolina landfills is provided. More than 8,000 tons of waste imported to processing facilities was disposed of in the Oakridge Landfill, Richland Landfill and Twin Chimneys Landfill.
CHART 9.3: Percentage of All Solid Waste Imported into South Carolina by State in FY15
CHART 9.5: Solid Waste Exported from South Carolina
TONS
FY15 655,768
FY14 691,557
FY13
FY12
FY11
666,582
689,514
664,670
CHART 9.4: Solid Waste Imported into South Carolina
MSW IMPORTED
655,768 tonsMSW EXPORTED
200,164 tons
South Carolina Solid Waste Management Annual Report for Fiscal Year 2015 (Rev. April 2016) 85
TABLE 9.6: Solid Waste Imported into South Carolina in Tons in FY15
2. Miscellaneous represents solid waste imported from Georgia (51,415 tons) and North Carolina (20,495 tons) and disposed of in Class 1 and Class 2 landfills or through incineration. Of the solid waste imported from Georgia, 177 tons of land-clearing debris were disposed of through incineration.
3. Miscellaneous from Processing Facilities represents solid waste that went through processing facilities from Alabama (355), Arkansas (3), Arizona (626), District of Columbia (13), Delaware (17), Florida (687), Indiana (23), Iowa (40), Kansas (90), Kentucky (4), Louisiana (440), Massachusetts (22), Maryland (336), Michigan (43), Mississippi (13), New Jersey (38), Ohio (56), Pennsylvania (144), Rhode Island (30), Tennessee (750), Texas (135), Virginia (2,126), Wisconsin (43) and West Virginia (372) and disposed of in Class 3 landfills.
NOTE: Some totals may not add up due to rounding.
TIPPING FEES – the amount charged to dispose of solid waste at a landfill – were taken from landfill reports submitted to DHEC.
While tipping fee data is incomplete (only a portion of the facilities reported tipping fees), the average Class 3 Landfill tipping fee was $40 per ton in FY15, up $2 from the previous FY.
In addition, the average tipping fee for Class 2 disposal was $27 in FY15 the same as the previous FY.
The average tipping fee for Class 1 disposal was $17 up $2 from the previous FY.
South Carolina exported 200,164 tons of solid waste in FY15 – an increase of 23 percent from the previous FY (163,089 tons). This number can vary by year depending on the number of out-of-state landfills that report.
Fifteen counties (Allendale, Anderson, Chester, Chesterfield, Darlington, Florence, Greenville, Greenwood, Kershaw, Lancaster, Marlboro, Oconee, Pickens, Spartanburg and York) accounted for all of the exported waste, which was sent to Georgia and North Carolina landfills. (See Chart 9.5.)
86 South Carolina Solid Waste Management Annual Report for Fiscal Year 2015 (Rev. April 2016)
1 Abbeville County Landfill
2 Bees Ferry Landfill
3 Berkeley County Landfill
4 Georgetown County Landfill
5 Greenwood County Landfill
6 Horry County SWA Landfill
7 Three Rivers SWA Landfill
8 Twin Chimneys Landfill
South Carolina’s
Class 3 Landfillsin FY15
1
3
12
4
2
22
5
17
14
6
16
13
19
18
15
21
10
11 24
7
8 20
9
9 Wellford Landfill
10 Santee Cooper – Cross
11 Savannah River Site Z-Area Landfill
COMMERCIAL, PUBLICLY OWNED LANDFILLS
NON-COMMERCIAL, PRIVATELY OWNED LANDFILLS1
COMMERCIAL, PRIVATELY OWNED LANDFILLS
26 SCE&G – Williams Hwy. 52 Landfill
27 Sonoco Products
24 SCE&G – Cope
25 SCE&G – Wateree Landfill
21 Albemarle Corp. Landfill
22 CMC Landfill 1601
23 CMC Landfill 1602
18 Pepperhill Landfill
19 Richland Landfill
20 Upstate Regional Landfill
15 Northeast Landfill LLC
16 Oakridge Landfill
17 Palmetto Landfill
12 Anderson Regional Landfill
13 Hickory Hill Landfill
14 Lee County Landfill LLC
1. Non-commercial landfills are defined by regulation as facilities that only manage the solid waste generated in the course of normal operations on property under the same ownership or control as the facility itself (i.e., “on site”). For more information, see Section 10.
25
26
23
27
NON-COMMERCIAL, PUBLICLY OWNED LANDFILLS
South Carolina Solid Waste Management Annual Report for Fiscal Year 2015 (Rev. April 2016) 87
TABLE 9.7: Class 3 Remaining Capacity & Disposal in Tons
NA
ME
OF
CLA
SS 3
LA
ND
FILL
CO
UN
TY
LAN
DFI
LL
OW
NER
SHIP
PER
MIT
TED
AN
NU
AL
RA
TE
OF
DIS
POSA
L
FY15
DIS
POSA
L
ESTI
MA
TED
REM
AIN
ING
C
APA
CIT
Y O
F FA
CIL
ITY
(TO
NS)
ESTI
MA
TED
REM
AIN
ING
LI
FE O
F FA
CIL
ITY
BA
SED
O
N P
ERM
ITTE
D D
ISPO
SAL
RA
TE IN
YEA
RS
ESTI
MA
TED
REM
AIN
ING
LI
FE O
F FA
CIL
ITY
BA
SED
O
N C
UR
REN
T D
ISPO
SAL
RA
TE IN
YEA
RS
COMMERCIALLY OWNED LANDFILLS
Abbeville County Landfill
Abbeville Public 46,000 13,696 968,441 21.1 70.7
Anderson Regional Landfill
Anderson Private 438,000 252,574 5,928,382 13.5 23.5
Bees Ferry Landfill (Charleston)
Charleston Public 180,000 173,584 5,345,977 29.7 30.8
Berkeley County Landfill
Berkeley Public 1,000,000 202,496 4,859,003 4.9 24.0
Georgetown County Landfill
Georgetown Public 79,582 70,141 1,144,850 14.4 16.3
Greenwood County Landfill
Greenwood Public 150,000 72,467 1,714,970 11.4 23.7
Hickory Hill Landfill Jasper Private 302,000 189,961 2,031,840 6.7 10.7
TOTAL OUT-OF-STATE 583,859 177 69,135 2,598 655,769
TOTAL WASTE STREAM
5,813,482 24,364 3,067,338* 68,206 8,973,390*
*Rev. April 2016 **This amount includes 128 tons exported to Georgia that is not listed by county.
South Carolina Solid Waste Management Annual Report for Fiscal Year 2015 (Rev. April 2016) 95
TABLE 9.13: Class 1 Landfill Disposal in Tons, FY11 to FY15
COUNTY OR PLACE OF ORIGIN FY11 FY12 FY13 FY14 FY15
Abbeville 0 0 0 0 0
Aiken 10,049 10,787 11,290 12,548 11,729
Allendale 0 0 0 0 0
Anderson 21,911 16,855 18,204 14,563 18,450
Bamberg 0 0 0 0 0
Barnwell 0 0 0 0 0
Beaufort 0 0 0 0 0
Berkeley 0 0 4,217 15,267 2,668
Calhoun 0 0 0 0 0
Charleston 0 0 0 2 0
Cherokee 0 0 0 0 0
Chester 120 0 0 0 0
Chesterfield 0 0 0 0 0
Clarendon 0 0 0 0 0
Colleton 0 0 0 0 0
Darlington 0 0 0 0 0
Dillon 0 0 0 0 0
Dorchester 0 0 0 0 0
Edgefield 1,709 2,343 1,531 6,796 1,637
Fairfield 0 0 2 17 0
Florence 0 316 392 0 0
Georgetown 0 0 0 0 0
Greenville 326 621 575 437 1,365
Greenwood 1,005 1,491 970 1,960 1,800
Hampton 0 0 0 0 0
Horry 0 0 0 0 0
Jasper 305 291 252 314 0
Kershaw 3,005 3,210 3,487 0 0
Lancaster 640 3,750 3,488 2,910 3,180
Laurens 525 400 0 1,475 98
Lee 0 0 0 0 0
Lexington 4,623 5,369 3,626 5,428 10,316
Marion 0 0 0 0 0
Marlboro 0 0 0 0 0
McCormick 0 18 18 0 0
Newberry 85 66 181 122 494
Oconee 599 1,801 1,406 1,019 839
Orangeburg 0 0 0 0 0
Pickens 503 1,566 983 567 270
Richland 9,256 10,868 10,190 169 1,543
Saluda 143 162 194 114 186
Spartanburg 1,049 1,524 2,051 2,766 2,531
Sumter 241 423 0 0 0
Union 2,202 1,809 2,786 2,646 2,458
Williamsburg 0 0 0 0 0
York 4,497 7,710 7,530 8,206 6,045
TOTAL SOUTH CAROLINA
62,792 71,380 73,374 77,326 65,608
TOTAL OUT-OF-STATE
1,893 1,288 1,629 12,789 2,598
TOTAL AMOUNT DISPOSED OF
64,685 72,667 75,003 90,115 68,206
NOTE: See Table 10.3 for a list of Class 1 Landfills by name and county.
96 South Carolina Solid Waste Management Annual Report for Fiscal Year 2015 (Rev. April 2016)
COUNTY LANDFILL LANDFILL OWNERSHIP
PERMITTED ANNUAL
DISPOSAL RATETOTAL REMAINING
LIFE IN YEARS
COMMERCIAL LANDFILLSAbbeville Abbeville County Public 10,000 5,586 278.4Aiken Aiken County (Barden) Public 80,000 54,130 15.5Aiken Aiken County (Wagener) Public 134,766 3,292 54.9Aiken G.L. Williams Private 57,500 4,940 20.0Aiken Rainbow Falls Private 103,216 88,144 55.3Allendale Appleton Private 21,000 13,702 30.5Anderson Clemson University Public 25,000 427 22.0Anderson Starr Public 43,300 16,060 40.6Anderson Enterprise Material Private 68,619 30,332 26.0Anderson Greenpointe Private 57,000 24,254 25.1Bamberg Bamberg County Public 44,441 5,865 60.0Barnwell Barnwell County Public 32,000 7,412 20.8Beaufort Barnwell Resources, Inc Private 156,000 23,151 46.0Berkeley Berkeley County Public 214,703 52,194 3.0Calhoun Calhoun County Public 13,500 1,997 3.5Charleston Bees Ferry Public 200,000 10 0.4Charleston Spring Grove Private 500,000 183,034 80.8Cherokee Cherokee County Public 70,000 13,105 l
Cherokee City of Gaffney Public 8,930 4,993 29.8Chester Bennett Private 205,200 l l
Chester Chester County Public 4,800 3,914 24.3Chesterfield Furr Facility Private 32,700 20,476 39.0Clarendon Clarendon County Public 60,000 10,582 11.5Colleton Colleton County Public 30,000 13,123 23.0Darlington Darlington County Public 65,200 10,718 65.7Dillon Dillon County Public 11,700 16,976 5.5Dorchester Carolina Landfill Private 170,120 131,959 42.7Florence Florence County Public 25,000 0 20.0
Florence Lake City Public 12,900 2,938 99.7Florence Pee Dee Environmental Private 892,000 89,422 35.5Georgetown Georgetown County Public 51,000 1,151 32.6Greenville Greenville (Republic) Private 200,000 11,409 3.7Greenville Twin Chimneys/Greenville County Public 137,157 75,628 20.2Greenville WI Shiloh Private 128,000 63,101 14.3Greenwood Greenwood County Public 47,984 12,571 4.9
Orangeburg Orangeburg County Public 81,000 18,397 9.7
Pickens Hwy 93 Private 70,500 0 l
Pickens Easley - Pickens County Public 20,000 16,726 3.7
Richland Carolina Grading, Inc. Private 122,400 3 136.7
Richland Richland County Public 200,000 36,227 13.0
Spartanburg Spartanburg County - WASP Nest Public 72,161 60,226 8.3
Sumter Sumter County Public 51,332 36,103 4.0
Williamsburg Williamsburg County Public 4,370 4,777 l
York Coltharp Private 70,000 63,831 11.0
York Rogers Private 24,000 2,600 10.0
York Vernsdale Road Private 58,300 0 l
York York County Public 96,632 45,546 15.0
NON-COMMERCIAL PUBLICLY OWNED LANDFILLSAiken Savannah River Site 288-F Public n 1,174 19.7Aiken Savannah River Site 488-4D Public 25,000 28,687 1.5Aiken Savannah River Site 632-G Public 120,000 31,835 38.0Berkeley Santee Cooper (Cross Generating Station) Public n 357,810 0.5
NON-COMMERCIAL PRIVATE LANDFILLSAiken Owens Corning - Aiken Private n 13,825 13.0Anderson Owens Corning - Anderson Private n 10,009 74.3Berkeley Kapstone Private n 141,064 52.0Calhoun DAK Amerikas Private n 829 11.6Darlington Sonoco Products Company Private n 10,741 1.0Florence RockTenn Private 103,032 27,396 15.6Georgetown International Paper - Georgetown Private 120,000 41,108 2.4Greenville General Electric Private 3,500 0 l
Lexington SCE&G McMeekin Station Private 120,000 0 l
Marlboro Domtar Paper Private 12,000 2,444 55.5Oconee Duke Power - Oconee Nuclear Station Private 2,000 0 24.4Orangeburg Brewer Private n 0 l
Orangeburg SCE&G Cope Private n 85,497 107.3Richland International Paper - Eastover Private n 124,000 13.3
Richland Intertape Polymer Group Private 10,000 l l
*Rev. April 2016 l Did Not Report n No Permitted Disposal Rate NOTE: This information is provided in months and converted to years.
TABLE 9.14: Class 2 Landfill Disposal and Estimated Remaining Life (continued)
98 South Carolina Solid Waste Management Annual Report for Fiscal Year 2015 (Rev. April 2016)
The S.C. Solid Waste Policy and Management Act of 1991 – S.C. Code of Laws § 44-96-60 – requires the S.C. Department of Health and Environmental Control to provide an inventory of solid waste facilities.
In fiscal year (FY) 2015 (July 1, 2014 to June 30, 2015), there were 378 solid waste facilities operating under the authority of 15 types of permits in South Carolina.
Some permits apply to multiple facility types. For example, there are six types of solid waste processing facilities as well as three types of landfills and transfer stations. Of the 15 types of solid waste permits, only three are allowed to accept MSW – Class 3 landfills, Class 3 transfer stations and Class 3 processing facilities.
Overall in FY15, there were:
• 157 landfills;
• 108 composting and wood-grinding facilities;
• 41 transfer stations;
• 20 processing facilities;
• 16 waste tire facilities;
• 16 used oil facilities;
• 10 land-application facilities;
• Five research, development and demonstration facilities;
• Four incinerators (all Air Curtain); and
• One soil treatment facility.
Tables 10.2 to 10.9 provide a complete list of the permitted facilities at the close of FY15. The tables include (when available): the facility name; county in which the facility is located; permitted rate of disposal or storage; and the tons received.
TABLE 10.1: Permitted Rate Legend
CYPY Cubic Yards Per Year
GPY Gallons Per Year
TPA Tons Per Acre
TPD Tons Per Day
TPW Tons Per Week
TPY Tons Per Year
TABLE 10.2: Permitted Solid Waste Transfer Stations in FY15
COUNTY FACILITY NAME PERMITTED RATE
TONS RECEIVED
CLASS 1 TRANSFER STATIONS
Greenville Greenville, City of 400,000 TPY 13,074
CLASS 2 TRANSFER STATIONS
Charleston Town of Mount Pleasant 100 TPD 20,067
Colleton Clean Management 60 TPD 0
Dorchester Summerville, Town of 200 TPD 0
Greenville MRR Upstate 500 TPD 22,335
Jasper Carolina Containers 15,219
Spartanburg Broadcast Drive 140 TPY 70,853
CLASS 3 TRANSFER STATIONS
Anderson Anderson-Oconee 1,500 TPD 0
Anderson Pendleton 500 TPD 16,107
Bamberg Bamberg County 250 TPD 9,079
Barnwell Barnwell County 200 TPD 14,430
Beaufort Haig Point 15 TPD 204
Beaufort Melrose 15 TPD 5,475
Charleston Carolina Processing & Recycling
2,000 TPD 196,216
Cherokee Cherokee County 800 TPD 43,358
Chester Chester County 200 TPD 15,980
Clarendon Clarendon County 250 TPD 0
Colleton Colleton County 115 TPD 30,281
Darlington Darlington County 95 TPD 16,393
Dillon Dillon County 250 TPD 47,400
Edgefield Tri-County 320 TPD 32,252
Fairfield Fairfield County 320 TPD 16,133
Florence Florence County 740 TPD 101,554
Greenville Blackberry Valley 150 TPD 4,414
Greenville Greer, City of 150 TPY 9,790
Horry Myrtle Beach, City of 249,462 TPY 18,429
Horry North Myrtle Beach, City of 250 TPD 12,829
Lancaster Lancaster, City of 302,000 TPY 26,646
Laurens Laurens County 800 TPD 27,541
Lexington Lexington County 600 TPD 109,827
Marlboro Bennettesville, City of 50 TPD 5,061
Newberry Newberry County 400 TPD 34,074
Oconee Oconee Seneca 300 TPD 37,691
Orangeburg Orangeburg County 300 TPD 50,527
Pickens Pickens County 400 TPD 39,943
Spartanburg Greer 1,200 TPD 90,339
Spartanburg Spartanburg, City of 200 TPD 0
Sumter Sumter 400 TPD 64,373
Union Union, City of 21 TPD 3,073
York Containers Corporation of Carolina
1,200 TPD 27,515
York York County 800 TPD 125,428
Permitted Solid WasteFacilities
SECTION
South Carolina Solid Waste Management Annual Report for Fiscal Year 2015 (Rev. April 2016) 99
TABLE 10.3: Permitted Solid Waste Landfills in FY15
COUNTY FACILITY NAME PERMITTED DISPOSAL RATE
TONS DISPOSED
CLASS 1 LANDFILLS
Aiken G.L. Williams 500 TPY 104
Aiken Jack Wood 520 TPY 360
Aiken Toby Marks 4,800 TPY 1,431
Aiken Dennis Miller 20,000 TPY 5,154
Aiken Mike Williams 15,000 TPY 2,790
Aiken John Swearingen 1,000 TPY 24
Anderson Starr - Anderson County 26,000 TPY 13,178
Richland Dilmar Fluid Services Inc. Used Oil Processing Facility 125,000 GPY
Spartanburg Taylor Enterprises Inc. 500,000 GPY
Sumter Giant Resource Recovery l
Sumter Kiln Direct 4,000,000 GPY
York Diversified Recycling Inc. 2,000,000 GPYl No Permitted Limit
102 South Carolina Solid Waste Management Annual Report for Fiscal Year 2015 (Rev. April 2016)
TABLE 10.9: Other Permitted Solid Waste Facilities in FY15
COUNTY FACILITY NAME PERMITTED RATE
LAND APPLICATION
Charleston Dimare Johns Island Inc. l
Charleston Wood Not Waste LLC 5 TPA
Georgetown International Paper Company - Georgetown Mill 10 TPA
Lancaster Bowers Fibers Inc. 10 TPA
Laurens County Fresh Inc. 10 TPA
Lexington JB Enterprises Resawing Inc. 500 TPY
Lexington Mungo Company l
Marlboro Domtar Paper Company LLC 10 TPA
Orangeburg Council Energy Inc. 10 TPA
Richland International Paper Company - Eastover Mill l
RESEARCH, DEVELOPMENT & DEMONSTRATION PROJECT
Anderson Anderson Regional Landfill LLC l
Greenville Enoree Landfill l
Laurens Refresh Services l
Lexington Refresh Services l
Williamsburg ARC Technology 14,924 TPY
SOIL TREATMENT
Sumter TK Tank Services Inc. l
l No Permitted Limit
South Carolina Solid Waste Management Annual Report for Fiscal Year 2015 (Rev. April 2016) 103
Solid Waste Planning SECTION
The S.C. Solid Waste Policy and Management Act of 1991 (Act) – S.C. Code of Laws § 44-96-60 – requires the S.C. Department of Health and Environmental Control (DHEC) to develop a state solid waste management plan (State Plan).
The Act (Section 44-96-80) also requires county governments or regions to develop plans that are consistent with the State Plan. This section outlines the planning and other responsibilities of state and county governments.
The State Plan is required to address a 20-year planning period and include:
• An inventory of the amount and type of solid waste currently being disposed of;
• Solid waste disposal projections;
• An analysis of the types of facilities that will be needed to manage solid waste;
• An estimate of the current capacity in the state to manage solid waste;
• An evaluation of current solid waste management practices;
• Recommendations on how the state can meet its waste reduction and recycling goals; and
• A description of public education programs developed in partnership with local governments, businesses, industry and other organizations to – among other objectives – promote waste reduction and recycling.
The State Plan was adopted in 1992 and revised in 1999. In 2006, a revision established limits for facilities that use emerging technologies.
This annual report is an update to the State Plan as required by the Act.
Local Planning ResponsibilitiesCOUNTY/REGIONAL SOLID WASTE MANAGEMENT PLANS
As outlined above, each county is required to have a comprehensive solid waste management plan to ensure adequate disposal capacity. Counties may create and implement regional solid waste management plans.
These local plans – which also are required to address a 20-year planning period – must be consistent with the State Plan and include:
• The amount and type of solid waste projected to be disposed of within the county or region;
• An estimate of the current capacity within that county or region to manage its solid waste;
• An analysis of existing and new facilities that will be needed to manage the solid waste generated;
• A description of the recycling program including material collected, type of public education/outreach initiatives offered to promote the program and the designation of a recycling coordinator;
• An outline of how the county or region expects to meet the state’s recycling and disposal goals; and
• An estimate of the cost of implementing the plan.
DHEC considers local plans when making consistency determinations for solid waste facilities. Because the local government is responsible for providing management of all solid waste, the local plan should address all solid waste streams, applicable facility types and methods of treatment.
DHEC encourages counties and regions to:
• Review their solid waste management plan periodically to assess the impact of regulatory changes, new permits, population changes and waste generation trends and update their plan as needed;
• Provide opportunities for cities, towns, the public and other affected parties within the county or region to have input in the plan revisions; and
• Consult the most recent copy of the “South Carolina Solid Waste Management Annual Report” for updated solid waste data.
104 South Carolina Solid Waste Management Annual Report for Fiscal Year 2015 (Rev. April 2016)
State Planning ResponsibilitiesBeyond the State Plan, DHEC has additional responsibilities including:
• Determining consistency with state and local or regional solid waste management plans;
• Determining consistency with local zoning and other local land-use ordinances; and
• Approving Demonstration of Need (DON) for certain solid waste management facilities.
CONSISTENCY DETERMINATIONS
Before a solid waste management facility can be permitted, it must be determined to be consistent with the State Plan, the local county or regional solid waste management plan as well as local zoning and land-use requirements.
Although a county or region is responsible for developing the local solid waste management plan, zoning ordinances and/or other land-use ordinances, DHEC is responsible for making an independent consistency determination.
DHEC looks at many factors when reviewing the county/regional plan and making its consistency decision. Chiefly, DHEC considers the amount of waste that the county or region is projected to generate during the 20-year planning period and reviews the county or region’s proposed means of managing that waste through a combination of transfer, disposal, incineration and/or recycling.
DEMONSTRATION OF NEED (DON)
DON refers to the criteria established for the geographical placement and allowable annual disposal rate of new and expanding solid waste management facilities. The original DON regulation was put into effect in June 2000. On June 26, 2009, a revision to Regulation 61-107.17 SWM: Demonstration-of-Need became effective.
The DON regulation addresses commercial Class 3 landfills, commercial Class 2 landfills, commercial solid waste incinerators that incinerate waste other than wood waste or yard trimmings and commercial solid waste processing facilities that process waste destined for disposal at Class 3 landfills. The DON regulation stipulates that where there are at least two commercial solid waste management facilities of the same type within a specified planning area, no new facility is allowed.
CLASS 2 LANDFILLS
Class 2 landfills accept land-clearing debris, certain construction and demolition debris, certain household furniture and under certain conditions, animal carcasses. Class 2 landfills have a 20-mile
TABLE 11.1: DON Requirements for New Solid Waste Management (SWM) Facilities
COMMERCIAL SWM FACILITY
PLANNING AREA AROUND
FACILITY
NUMBER OF FACILITIES ALLOWED WITHIN PLANNING AREA
THROUGHPUT/ANNUAL TONNAGE CALCULATION FOR NEW FACILITIES
Class 2 Landfills 20 miles 2 100 percent of host county tonnage plus 30 percent of generation from other counties in planning area
Class 3 Landfills 75 miles 2 Total of 100 percent of host county tonnage and 50 percent of tonnage of counties in planning area without a Class 3 landfill; cannot exceed 30 percent of total state generation
Solid Waste Incinerators 75 miles 2 Based on the manufacturer’s design of the incinerator not to exceed 600 tons per day
Solid Waste Processing Facilities
75 miles 2 Total of 100 percent of host county tonnage and 50 percent of tonnage of other counties in planning area
Non-commercial FacilitiesIn South Carolina, a facility is defined as “non-commercial” if it manages only the solid waste generated in the course of normal operations on property under the same ownership or control as the facility itself (i.e., “on site”). Non-commercial facilities are not required to demonstrate need.
South Carolina Solid Waste Management Annual Report for Fiscal Year 2015 (Rev. April 2016) 105
planning radius. (See Pages 110-111 for a map detailing Class 2 landfill locations and planning radii.)
DHEC calculates allowable annual disposal at new Class 2 landfills using:
• 100 percent of the host county generation; and
• 30 percent of the generation in other counties within the planning area.
Tonnage increases for existing Class 2 facilities are allowed only if the facility is operating within 20 percent of its permitted amount, (i.e., the amount of waste disposed per year is 80 percent or more of the annual permitted capacity).
If a Class 2 landfill qualifies for an increase, it can receive the lesser of the amount that disposal in the planning area has increased since the facility last received a permitted increase or 50,000 tons.
Class 2 landfills operating on the effective date of the regulation are allowed variances from certain DON requirements with respect to replacement facilities, tonnage increases and expansions.
See Table 11.2 for Class 2 waste generated for disposal by county for use in DON.
CLASS 3 LANDFILLS
Class 3 landfills accept municipal solid waste (MSW), industrial solid waste, sewage sludge, non-hazardous MSW incinerator ash and other non-hazardous waste. For new commercial Class 3 landfills, allowable tonnage is calculated using:
• 100 percent of the host county generation; and
• 50 percent of the waste generated in other counties within the planning area. (None is counted from other counties that have an existing Class 3 landfill.)
Class 3 landfills have a 75-mile planning radius. (See Pages 112 and 113 for a map detailing Class 3 landfill locations and planning radii.)
The yearly disposal rate at an existing landfill is allowed to increase only if the facility is within 20 percent of its permitted disposal rate (i.e., the amount of waste disposed of per year is 80 percent or more of the annual permitted capacity). If a Class 3 landfill qualifies for an increase, it can receive the lesser of the amount that disposal in South Carolina has increased since the facility last received a permitted increase or 150,000 tons.
In addition, the allowable yearly disposal rate at any Class 3 landfill cannot exceed 30 percent of the total solid waste generated in South Carolina that is destined for disposal in Class 3 landfills. Class 3 landfills operating on the effective date of the regulation are allowed variances from certain DON requirements. See Table 11.3 for Class 3 waste generated for disposal by county for use in DON.
SOLID WASTE INCINERATORS
The yearly throughput for a solid waste incinerator is based on the manufacturer’s design of the incinerator, but it cannot exceed 600 tons per day. The DON regulation does not apply to air curtain incinerators that receive only wood waste and yard trimmings. The planning area for a solid waste incinerator is 75 miles. There are no permitted MSW incinerators in the state.
SOLID WASTE PROCESSING FACILITIES
The maximum allowable yearly throughput of a solid waste processing facility that processes waste destined for disposal at a Class 3 landfill is equal to:
• 100 percent of the solid waste destined for disposal that is generated in the host county; and
• 50 percent of the waste generated in each county other than the host county, that falls wholly or partially within the 75-mile planning radius.
See Pages 114-115 for a map detailing Class 3 Solid Waste Processing Facility locations and planning radii.
106 South Carolina Solid Waste Management Annual Report for Fiscal Year 2015 (Rev. April 2016)
TAB
LE 1
1.2
: C
lass
2 W
aste
Gen
erat
ed f
or
Dis
po
sal
in T
on
s fo
r U
se i
n D
emo
nst
rati
on
of
Nee
d
CO
UN
TYFY
03FY
04FY
05FY
06FY
07FY
08FY
09FY
10FY
11FY
12FY
13FY
14FY
15
Abb
evill
e1,
191
13,5
104,
550
6,59
73,
256
2,55
48,
180
7,04
95,
527
6,71
97,
091
5,89
26,
495
Aik
en88
,655
88,7
1779
,529
90,1
0010
2,92
722
,443
81,5
75
78,3
4876
,801
81,3
8389
,518
99,4
1993
,335
Alle
ndal
e3,
534
1,57
83,
128
2,35
42,
171
1,50
91,
586
10,4
823,
440
3,08
14,
060
3,63
19,
429
And
erso
n52
,417
37,3
1635
,817
51,3
1170
,823
63,6
7048
,079
45,2
5664
,807
72,5
0867
,203
72,4
2256
,114
Bam
berg
5,78
84,
883
4,81
16,
175
6,38
112
618
,871
5,35
713
,693
5,60
95,
730
5,44
67,
339
Barn
wel
l12
,749
8,32
910
,411
10,9
2110
,700
11,6
8611
,868
9,
481
6,60
47,
539
7,58
89,
934
8,40
7
Beau
fort
102,
287
121,
464
139,
916
141,
752
130,
391
86,2
8867
,541
60,0
5061
,081
65,4
6468
,058
61,1
9553
,698
Berk
eley
58,1
3766
,023
73,2
2810
1,41
198
,516
121,
267
54,2
66
33,8
9034
,347
51,0
2542
,724
46,8
9761
,378
Cal
houn
4,06
74,
139
3,55
44,
474
3,17
63,
057
3,50
1 3,
932
3,10
92,
369
3,28
82,
818
2,04
7
Cha
rles
ton
189,
168
296,
129
281,
444
333,
332
341,
113
440,
913
239,
234
208,
667
157,
689
149,
081
207,
029
216,
115
260,
770
Che
roke
e8,
586
10,6
5821
,604
16,2
409,
818
10,4
0210
,613
15,5
0923
,385
23,8
5315
,844
14,4
1218
,518
Che
ster
27,8
9721
,894
4,37
373
,343
4,51
725
1,97
220
,566
21
,426
30,2
0018
,907
19,4
7710
,118
14,8
59
Che
ster
field
15,1
9212
,805
16,1
9414
,738
12,1
810
11,8
5511
,946
11,3
7315
,453
24,3
2016
,920
12,1
80
Cla
rend
on4,
605
5,50
09,
296
8,95
110
,288
7,35
210
,194
9,49
110
,086
10,0
869,
800
9,76
4**
10,5
88
Col
leto
n13
,295
13,1
5713
,823
17,4
3920
,900
23,6
6819
,522
21,5
7716
,966
15,5
0117
,066
19,5
9813
,344
Dar
lingt
on19
,662
12,6
1417
,358
16,2
6416
,755
11,7
2116
,100
23
,934
24,6
8120
,946
19,0
8821
,349
16,1
91
Dill
on10
,096
11,4
1240
,344
8,35
210
,549
11,2
3311
,310
8,34
210
,263
9,81
77,
729
9,10
512
,151
Dor
ches
ter
10,0
440
63,9
1077
,295
82,0
9994
,641
57,6
12
24,1
3033
,078
36,2
4938
,540
31,9
3144
,030
Edge
field
3,97
23,
442
3,24
413
,116
12,4
796,
119
9,64
45,
145
2,91
96,
015
8,69
33,
671
7,56
1
Fair
field
311
126
209
399
284
780
343
859
1,51
061
41,
103
1,80
160
5
Flor
ence
68,5
3493
,715
34,1
1427
,002
54,0
6932
3,91
796
,557
12
1,92
870
,964
70,2
7494
,574
108,
384
129,
379
Geo
rget
own
22,1
1433
,680
30,0
8751
,581
34,2
7049
,886
27,7
65
26,5
5822
,886
17,4
3124
,573
11,0
825,
512
Gre
envi
lle14
8,15
287
,157
142,
780
163,
834
161,
738
210,
924
168,
463
145,
991
185,
015
165,
827
193,
009
184,
304
206,
475
South Carolina Solid Waste Management Annual Report for Fiscal Year 2015 (Rev. April 2016) 107
CO
UN
TYFY
03FY
04FY
05FY
06FY
07FY
08FY
09FY
10FY
11FY
12FY
13FY
14FY
15
Gre
enw
ood
12,2
838,
908
14,6
9620
,174
26,7
1421
,063
28,9
0813
,838
29,5
879,
221
8,84
322
,847
21,2
12
Ham
pton
3,22
17,
444
8,59
07,
786
8,99
37,
462
10,4
663,
001
3,90
12,
837
3,40
83,
039
13,4
28
Hor
ry13
5,64
817
0,85
615
5,67
622
6,67
233
2,58
314
1,00
710
9,95
382
,451
80,6
8790
,370
90,0
6510
4,53
713
2,21
8
Jasp
er1,
028
812
176
3,68
14,
907
5,83
73,
137
3,04
73,
885
3,50
04,
321
4,33
94,
486
Kers
haw
30,4
5233
,277
41,9
2552
,688
42,3
4641
,652
41,0
2695
,973
38,3
4334
,417
41,4
1528
,500
27,1
84
Lanc
aste
r34
,499
34,0
0931
,067
26,7
9827
,344
65,8
0129
,834
47
,791
46,6
9957
,214
55,4
3842
,678
27,8
52
Laur
ens
17,1
5619
,634
6,65
511
,435
16,8
6012
,811
7,35
99,
990
13,9
8218
,761
13,1
5414
,527
11,8
92
Lee
00
00
00
00
152
810
00
Lexi
ngto
n26
3,04
123
9,92
424
6,78
523
7,17
821
7,46
522
3,50
315
3,66
5 14
1,97
513
9,90
213
0,36
616
6,32
215
8,04
316
1,37
0*
Mar
ion
10,9
8216
,493
29,8
1862
,965
31,2
9919
,419
18,8
7512
,642
14,4
597,
846
11,7
1240
,577
35,7
15
Mar
lbor
o1,
034
1,04
084
51,
212
2,49
10
10,4
86
7,81
010
,219
7,85
07,
366
6,27
26,
833
McC
orm
ick
820
957
1,33
54,
409
1,66
91,
009
1,02
31,
616
349
572
820
652
1,16
9
New
berr
y63
299
71,
098
2,26
31,
219
10,5
777,
024
7,65
77,
430
8,33
98,
675
11,5
5717
,973
Oco
nee
23,5
7729
,279
19,8
6723
,838
26,3
8524
,337
22,5
7720
,181
19,7
5372
16,1
0918
,361
22,2
34
Ora
ngeb
urg
21,5
7924
,097
20,9
1526
,419
27,3
6050
,573
29,9
22
24,5
8120
,653
17,6
9317
,362
14,4
7919
,225
Pick
ens
30,3
2323
,880
34,7
5417
,951
20,8
0721
,867
19,8
0615
,726
17,2
2918
,417
15,5
4717
,166
18,7
85
Rich
land
220,
088
206,
332
216,
945
216,
246
196,
701
198,
115
199,
056
123,
076
217,
915
199,
102
225,
910
266,
021
290,
518
Salu
da1,
116
1,17
61,
149
1,96
01,
465
1,61
41,
601
1,52
141
637
681
81,
331
1,55
8
Spar
tanb
urg
39,8
1271
,553
71,9
1771
,047
72,1
6180
,217
65,2
2960
,479
91,6
6794
,359
89,5
4774
,514
92,6
02
Sum
ter
51,9
6342
,747
38,9
3455
,714
50,6
2550
,656
4,19
346
,213
43,2
2844
,695
45,3
1141
,427
43,9
26
Uni
on2,
928
1,01
81,
236
8,42
12
63,
082
3,79
05,
273
7,41
62,
595
2741
Will
iam
sbur
g3,
818
2,58
52,
386
7,22
06,
491
3,28
03,
860
2,78
64,
065
4,59
45,
339
3,77
25,
338
York
50,7
1899
,277
98,0
2997
,493
125,
969
113,
171
74,2
02
76,6
0381
,573
115,
906
76,0
7782
,750
97,7
43
TOTA
L1,
827,
171
1,98
4,54
32,
078,
522
2,42
0,55
12,
441,
257
2,85
0,10
51,
840,
529
1,70
2,09
51,
761,
791
1,72
9,76
01,
882,
260
1,91
3,86
32,
103,
707*
NO
TE: T
his
data
is u
sed
for
calc
ulat
ing
annu
al t
onna
ge li
mit
s as
rel
ated
to
R.61
-107
.17
– ef
fect
ive
June
26,
200
9. T
he h
isto
rica
l dat
a re
port
ed h
as b
een
adju
sted
to
refl
ect
chan
ges
in t
he D
ON
reg
ulat
ion.
*Rev
. Apr
il 20
16
**Th
is t
onna
ge w
as u
pdat
ed b
ased
on
Cla
rend
on C
ount
y’s
Cla
ss 2
FY1
4 La
ndfi
ll Re
port
.
108 South Carolina Solid Waste Management Annual Report for Fiscal Year 2015 (Rev. April 2016)
TAB
LE 1
1.3
: C
lass
3 W
aste
Gen
erat
ed f
or
Dis
po
sal
in T
on
s fo
r U
se i
n D
emo
nst
rati
on
of
Nee
d
CO
UN
TYFY
03FY
04FY
05FY
06FY
07FY
08FY
09FY
10FY
11FY
12FY
13FY
14FY
15
Abb
evill
e25
,909
18,8
1715
,836
17,2
1917
,959
15,6
1113
,987
13
,874
15,8
4415
,874
17,4
1620
,811
14,5
33
Aik
en11
1,93
514
9,51
513
1,28
510
1,56
312
5,79
612
7,49
1 1
20,0
5811
4,55
613
1,59
613
3,03
011
0,03
912
0,72
411
3,76
2
Alle
ndal
e6,
540
5,90
36,
990
5,81
310
,990
7,93
27,
209
6,52
26,
268
6,59
35,
344
7,83
38,
987
And
erso
n14
8,23
214
8,84
916
1,61
013
8,78
313
0,50
913
5,79
411
5,66
7 13
0,95
513
1,03
415
6,56
711
0,99
413
2,28
815
7,90
2
Bam
berg
13,7
6811
,652
11,2
8011
,857
10,6
6510
,799
10,4
57
9,46
19,
505
9,22
19,
610
10,1
739,
142
Barn
wel
l18
,247
19,3
7320
,128
17,6
8319
,488
17,4
7415
,705
15
,753
14,8
3913
,870
14,1
8414
,761
19,4
13
Beau
fort
151,
624
167,
383
181,
849
199,
029
177,
278
163,
868
177,
291
148,
470
149,
520
140,
405
141,
785
142,
490
155,
081
Berk
eley
309,
398
353,
891
314,
269
379,
387
636,
603
501,
690
339,
890
324,
793
310,
367
329,
172
321,
016
290,
429
281,
704
Cal
houn
9,65
98,
660
12,1
4310
,615
11,1
0911
,100
15,3
31
23,0
6219
,165
18,2
9923
,926
14,3
9213
,970
Cha
rles
ton
191,
932
391,
841
285,
117
256,
089
281,
938
270,
676
274,
636
325,
997
497,
192
646,
461
416,
222
415,
193
624,
004
Che
roke
e73
,943
71,3
3271
,145
69,1
0688
,008
52,1
3777
,652
85
,767
143,
803
97,1
2186
,507
81,0
7379
,813
Che
ster
44,4
3537
,070
37,8
4743
,496
33,3
2363
,758
30,1
15
26,2
9723
,799
27,7
8520
,945
24,3
7833
,673
Che
ster
field
24,5
1421
,941
20,2
0617
,543
15,1
6815
,428
13,5
72
18,3
3519
,282
18,6
1516
,002
12,8
3724
,104
Cla
rend
on10
,932
18,4
038,
112
10,6
7116
,377
16,3
6415
,514
15
,644
14,9
8814
,271
13,6
4912
,689
12,6
58
Col
leto
n31
,938
35,0
7138
,826
39,0
1439
,358
44,6
8338
,032
10
0,13
735
,435
32,4
8532
,421
32,4
8635
,471
Dar
lingt
on68
,953
52,0
5751
,823
47,3
3370
,796
88,0
0890
,953
38
,461
37,7
3655
,183
40,2
2769
,572
44,1
73
Dill
on49
,694
26,9
7034
,416
31,4
9238
,616
35,3
1725
,246
24
,321
20,6
9826
,619
20,0
0629
,507
19,7
97
Dor
ches
ter
97,9
3416
3,93
013
9,40
514
9,20
212
1,36
612
5,82
612
3,10
5 98
,774
89,4
2380
,904
81,3
7010
8,82
011
6,59
2
Edge
field
14,8
7013
,969
13,4
0613
,371
14,4
7315
,531
15,1
58
13,1
1912
,096
14,5
3212
,431
17,9
7818
,631
Fair
field
23,0
7622
,546
21,9
8120
,721
22,0
4121
,306
22,9
27
21,2
1420
,804
21,4
3824
,338
103,
560
24,2
48
Flor
ence
151,
123
152,
909
154,
874
149,
919
135,
663
139,
811
165,
766
132,
582
237,
630
143,
999
140,
552
62,9
7713
5,70
3
Geo
rget
own
70,5
3149
,736
50,7
0954
,719
51,8
7042
,675
43,0
11
48,4
4658
,651
54,8
0661
,184
74,3
5999
,517
Gre
envi
lle61
3,41
758
9,20
467
3,24
967
4,57
468
2,51
160
2,82
5 5
26,4
0245
1,34
443
3,49
043
0,66
653
3,13
843
2,92
348
4,57
2
South Carolina Solid Waste Management Annual Report for Fiscal Year 2015 (Rev. April 2016) 109
CO
UN
TYFY
03FY
04FY
05FY
06FY
07FY
08FY
09FY
10FY
11FY
12FY
13FY
14FY
15
Gre
enw
ood
91,7
1910
9,40
712
0,32
011
7,34
111
2,85
810
2,69
384
,863
98
,963
79,0
5382
,206
95,4
3577
,371
88,2
75
Ham
pton
22,0
3918
,188
22,9
9117
,322
18,6
0918
,266
12,5
61
13,1
7911
,738
11,3
4711
,664
11,3
0110
,899
Hor
ry21
2,68
622
7,46
922
2,93
523
7,58
224
6,12
624
8,98
823
5,31
4 22
8,84
322
7,39
522
3,91
522
5,74
423
7,93
223
9,69
4
Jasp
er17
,692
27,0
3922
,100
22,0
5032
,139
32,9
6630
,904
18
,928
13,5
0819
,992
19,7
0621
,405
15,7
65
Kers
haw
45,5
9740
,162
44,2
3343
,368
41,9
0437
,705
37,2
40
43,6
9133
,342
45,0
4036
,894
36,6
1243
,669
Lanc
aste
r35
,088
35,6
2331
,561
33,8
4230
,489
34,1
1430
,054
28
,506
30,6
1930
,151
27,4
9427
,532
40,6
64
Laur
ens
57,9
4051
,636
73,0
9049
,210
42,4
7539
,671
42,9
78
45,5
8648
,658
39,2
0530
,929
33,8
7743
,838
Lee
14,6
7014
,981
15,4
2514
,737
14,9
4115
,837
14,6
37
71,9
6582
,942
97,2
7289
,214
80,5
4990
,343
Lexi
ngto
n22
1,32
325
6,22
617
1,69
219
3,26
819
0,58
318
8,29
517
1,12
4 16
9,82
016
0,94
118
4,18
820
7,56
317
4,85
018
8,22
7
Mar
ion
4,79
621
,673
14,3
8021
,683
26,1
4130
,454
21,2
41
18,7
3317
,015
8,87
916
,576
11,6
4519
,932
Mar
lbor
o15
,289
21,8
1512
,004
13,2
7612
,332
10,3
1412
,063
14
,913
15,5
4714
,653
17,0
8228
,715
15,3
22
McC
orm
ick
11,8
695,
183
4,85
84,
524
4,50
54,
232
4,26
4 5,
120
5,09
94,
611
4,21
54,
225
4,54
7
New
berr
y47
,893
48,5
9150
,420
49,9
5148
,603
39,3
3040
,574
41
,072
38,6
5737
,991
40,4
2240
,731
45,9
19
Oco
nee
45,2
6045
,533
49,3
6853
,302
56,4
0854
,865
49,3
38
51,2
6949
,056
50,7
6743
,655
20,9
6876
,007
Ora
ngeb
urg
98,3
5092
,969
94,3
8210
0,98
889
,386
79,2
4575
,717
70
,448
72,9
8390
,870
114,
552
82,5
9385
,572
Pick
ens
56,9
3859
,873
54,9
6651
,255
58,1
0452
,715
53,4
94
52,2
5757
,259
55,2
5951
,939
64,7
8659
,949
Rich
land
327,
966
349,
087
341,
907
376,
435
354,
977
353,
135
348,
475
457,
204
376,
749
360,
689
330,
810
317,
862
308,
418
Salu
da9,
197
9,68
414
,687
11,8
7011
,116
11,0
259,
680
12,6
7322
,074
42,5
348,
052
8,50
78,
707
Spar
tanb
urg
418,
942
373,
060
351,
908
381,
084
381,
750
484,
612
412,
680
476,
809
562,
235
452,
484
389,
482
458,
943
463,
065
Sum
ter
119,
698
135,
220
156,
345
163,
056
108,
801
101,
854
94,4
52
86,8
2484
,673
78,3
0476
,653
60,9
3010
1,65
9
Uni
on12
,835
18,9
8828
,309
14,1
7818
,775
19,8
0330
,702
20
,335
20,2
1721
,802
18,7
3116
,397
21,1
97
Will
iam
sbur
g26
,100
25,5
8228
,259
39,0
4545
,506
79,6
9852
,614
34
,282
17,8
429,
620
11,1
767,
914
7,18
1
York
147,
720
152,
150
166,
059
161,
476
167,
139
160,
675
172,
941
148,
718
141,
161
143,
618
215,
786
144,
308
220,
219
TOTA
L4,
324,
211
4,67
1,16
14,
548,
705
4,63
0,04
24,
865,
572
4,72
6,59
64,
315,
594
4,39
8,02
24,
601,
925
4,59
3,31
04,
337,
078
4,20
2,20
44,
726,
520*
NO
TE: T
his
data
is u
sed
for
calc
ulat
ing
annu
al t
onna
ge li
mit
s as
rel
ated
to
R.61
-107
.17
– ef
fect
ive
June
26,
200
9. T
he h
isto
rica
l dat
a re
port
ed h
as b
een
adju
sted
to
refl
ect
chan
ges
in t
he D
ON
reg
ulat
ion.
*Thi
s am
ount
doe
s no
t in
clud
e 12
8 to
ns e
xpor
ted
to G
eorg
ia t
hat
is n
ot li
sted
by
coun
ty.
110 South Carolina Solid Waste Management Annual Report for Fiscal Year 2015 (Rev. April 2016)
South Carolina Solid Waste Management Annual Report for Fiscal Year 2015 (Rev. April 2016) 111
CLASS 2• Limits waste streams as
specified in Regulation 61-107.19 SWM: Solid Waste Landfills and Structural Fill
• Waste that is characterized as less than 10 times the maximum contaminant level (MCL) and approved by DHEC may be added to the permit for acceptance/disposal
• Operational Criteria:
• Unauthorized waste may be stored at the facility for 30 days; except that putrescible waste must be removed within 72 hours
• An annual survey to determine landfill capacity used and the remaining permitted capacity may be required on a case-by-case basis
• Require scales – but exempts scales for facilities permitted for less than 10,000 tons per year and on-site landfills
• Design Criteria:
• Require settlement calculations on the bottom elevation
• Require DHEC to inspect the landfill prior to waste placement
• Set cap requirements at 2 feet of soil
• Establish certain buffers when “Notice of Intent to File a Permit Application” is published
• Require groundwater monitoring and corrective action
• Set post-closure (20 years)
• Require closure and post-closure financial assurance
112 South Carolina Solid Waste Management Annual Report for Fiscal Year 2015 (Rev. April 2016)
South Carolina Solid Waste Management Annual Report for Fiscal Year 2015 (Rev. April 2016) 113
Demonstration of Need Map
Class 3 LandfillsAs of June 30, 2015
CLASS 3• Requires waste
characterization through the Special Waste Analysis and Implementation Plan
• Requirement to inspect 10 percent of incoming loads
• Landfills that were permitted as Industrial Solid Waste Landfills prior to the effective date of this regulation are exempt from design criteria provided the waste streams remain below 30 times the MCLs
• Leachate recirculation allowed under permit modification
• Buffers established when “Notice of Intent to File a Permit Application” is published
• Notification required within 72 hours of receipt of hazardous or PCB wastes
• Monofills that accept coal combustion by-products testing less than 10 times MCL can be constructed with a clay liner system