32
SCA Wettability Short Course Advanced measurements of wettability: Pore Scale Imaging Dr. Matthew Andrew Oil and Gas Technologist Carl Zeiss Microscopy GmbH

SCA Wettability Short Course
Advanced measurements of wettability: Pore Scale Imaging
Dr. Matthew Andrew
Oil and Gas Technologist
Carl Zeiss Microscopy GmbH
Outline
1 Introduction – Why look at the pore scale?
2
New developments – towards automation4
Measuring spatially resolved contact angles
6 Other technologies – cryo SEM
Applications – flow, real systems and curvature5
One application in depth – a heterogeneous carbonate3
2
Who am I?
Undergraduate and Masters from Queens’ College, Cambridge in
Geological Sciences. PhD from Imperial College in Petroleum
Engineering, where I developed the first reservoir condition in situ rig,
integrated with the Versa XRM, allowing for pore-scale imaging of
multiphase flow.
Now I direct O&G & Geoscience within Zeiss Microscopy
• Menke, Reynolds, Andrew et al., 2017. 4D multi-scale imaging of reactive flow in carbonates: Assessing the impact of heterogeneity on dissolution
regimes using streamlines at multiple length scales. Chemical Geology (In Press)
• Andrew et al. 2018. The Usage of Modern Data Science in Segmentation and Classification: Machine Learning and Microscopy
• Andrew, M., Bijeljic, B. & Blunt, M.J., 2013. Pore-scale imaging of geological carbon dioxide storage under in situ conditions. Geophysical Research
Letters, 40(15), pp.3915–3918.
• Andrew, M., Bijeljic, B. & Blunt, M.J., 2014. New frontiers in experimental geoscience : X-ray microcomputed tomography and fluid flow., Microscopy
and Analysis (February), pp.4–7.
• Andrew, M., Bijeljic, B. & Blunt, M.J., 2014a. Pore-by-pore capillary pressure measurements using X-ray microtomography at reservoir conditions:
Curvature, snap-off, and remobilization of residual CO2. Water Resources Research, 50, pp.8760–8774.
• Andrew, M., Bijeljic, B. & Blunt, M.J., 2014b. Pore-scale contact angle measurements at reservoir conditions using X-ray microtomography. Advances
in Water Resources, 68, pp.24–31. Available at: http://dx.doi.org/10.1016/j.advwatres.2014.02.014.
• Andrew, M., Bijeljic, B. & Blunt, M.J., 2014c. Pore-scale imaging of trapped supercritical carbon dioxide in sandstones and carbonates. International
Journal of Greenhouse Gas Control, 22, pp.1–14. Available at: http://dx.doi.org/10.1016/j.ijggc.2013.12.018.
• Andrew, M.G. et al., 2015. The Imaging of Dynamic Multiphase Fluid Flow Using Synchrotron-Based X-ray Microtomography at Reservoir Conditions.
Transport in Porous Media, 110, pp.1–24.
• Menke, H.P. et al., 2015. Dynamic Three-Dimensional Pore-Scale Imaging of Reaction in a Carbonate at Reservoir Conditions. Environmental
Science & Technology, p.150323102837000. Available at: http://pubs.acs.org/doi/abs/10.1021/es505789f.
Matthew Andrew, PhD

4Carl Zeiss X-ray Microscopy
Continuum vs. Pore Scale
Continuum Scale
Medical CT
Krevor et al. 2012
Voxel Size: 0.5mm
Each voxel consists of averaged
property, giving a saturation
distribution.
This saturation can then be
averaged across the core, to form
a relative permeability curve, or
can be associated with core scale
features affecting flow (e.g.
sedimentary structures / bedding
layers)
Pore Scale
XRM
1.5” – 4”
5mm – 1”
Voxel Size: <1µm
Each voxel uniquely describes a single phase (e.g. rock
grain, oil or brine), giving truly pore-scale information.
This information can be used to examine connected vs.
disconnected saturation, wettability changes, changes in
saturation structure or a wide range of different
phenomena fundamentally controlling macroscopic flow
and transport phenomena.
10 – 100 µm
4
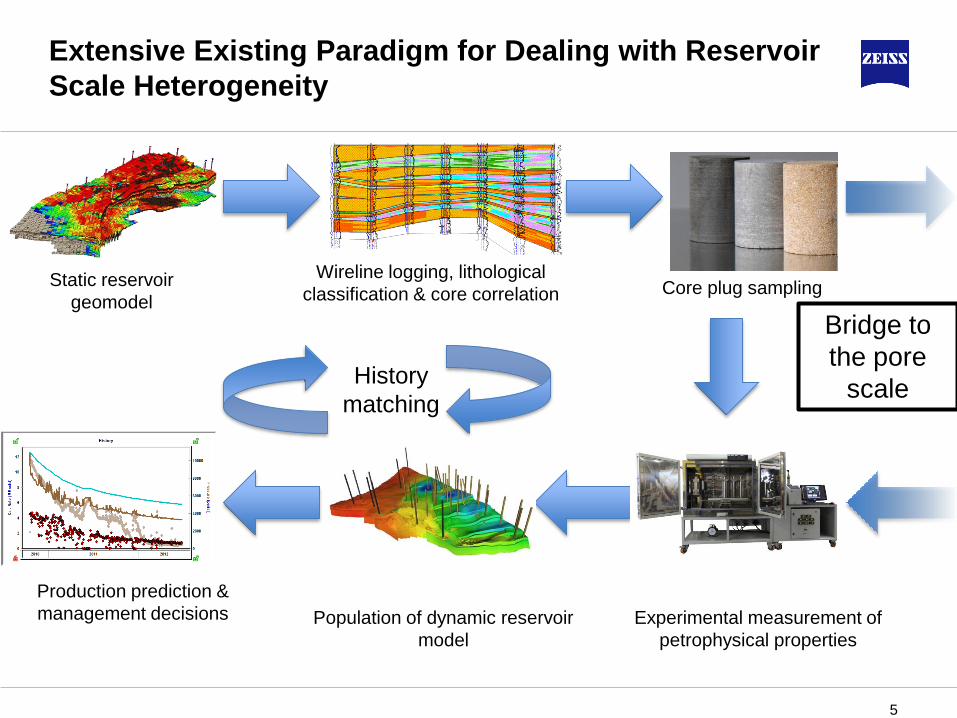
Static reservoir
geomodel
Wireline logging, lithological
classification & core correlation Core plug sampling
Experimental measurement of
petrophysical properties
Bridge to
the pore
scale
Population of dynamic reservoir
model
Production prediction &
management decisions
History
matching
Extensive Existing Paradigm for Dealing with Reservoir
Scale Heterogeneity
5

Pore scale vs. grain scale:
Fluid flow rooted at the pore scale
𝑞 =𝑟2
8𝜇
𝑑𝑃
𝑑𝑥
Multi-phase: Governs pore snap-off &
invasion capillary pressureSingle phase: Hagen–Poiseuille equation
Threshold capillary pressures:
Drainage:
Imbibition:
Flow fundamentally rooted at the scale of the pore throat
Matthew Andrew, PhD
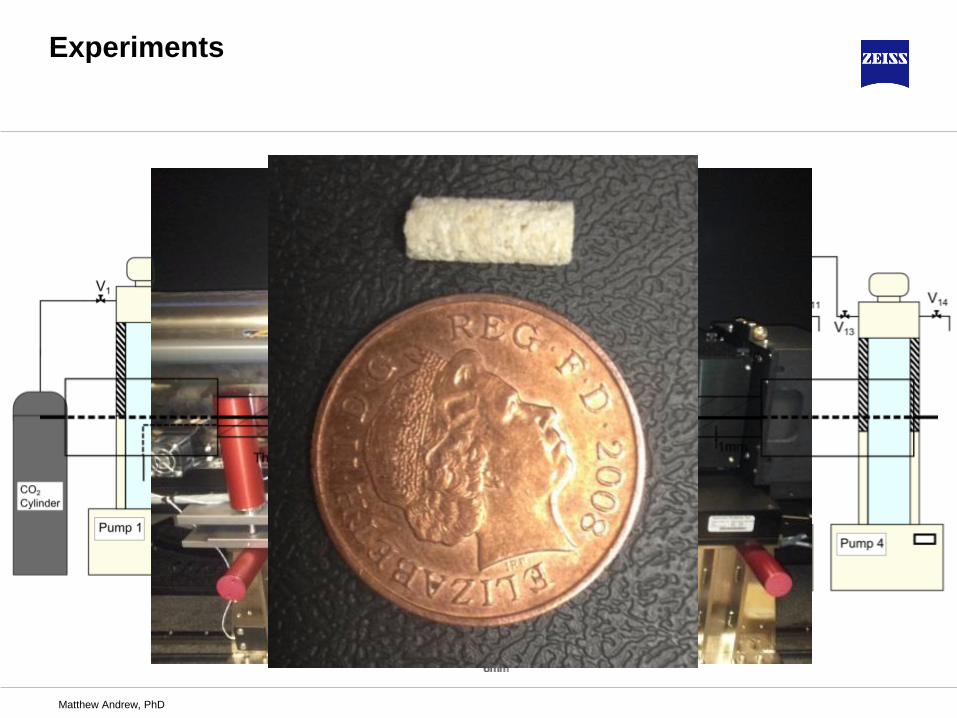
Experiments
Matthew Andrew, PhD
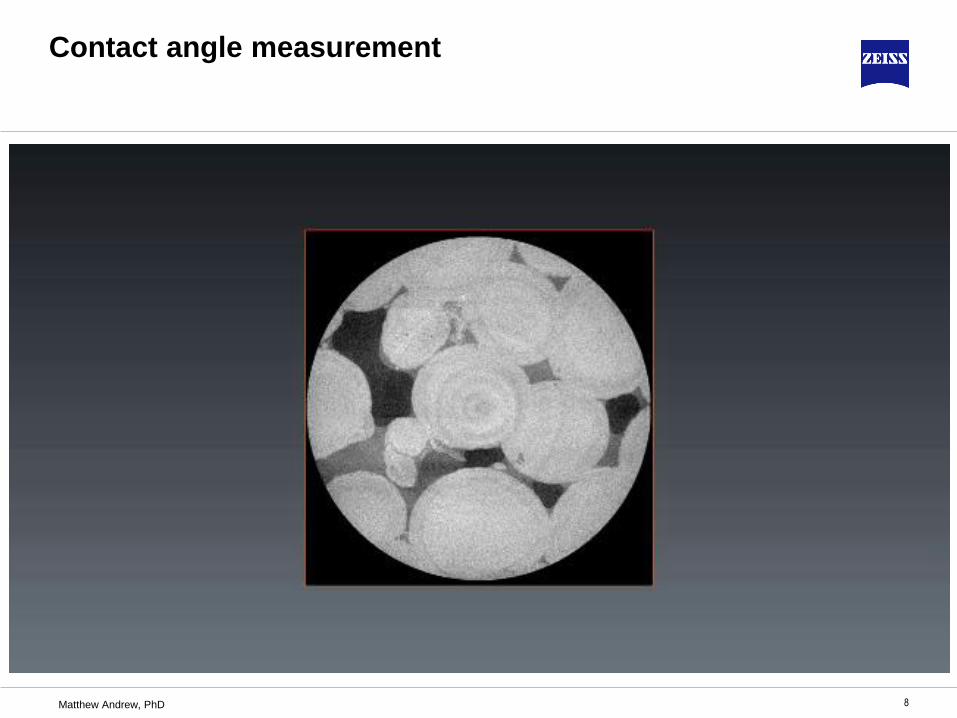
Contact angle measurement
8Matthew Andrew, PhD
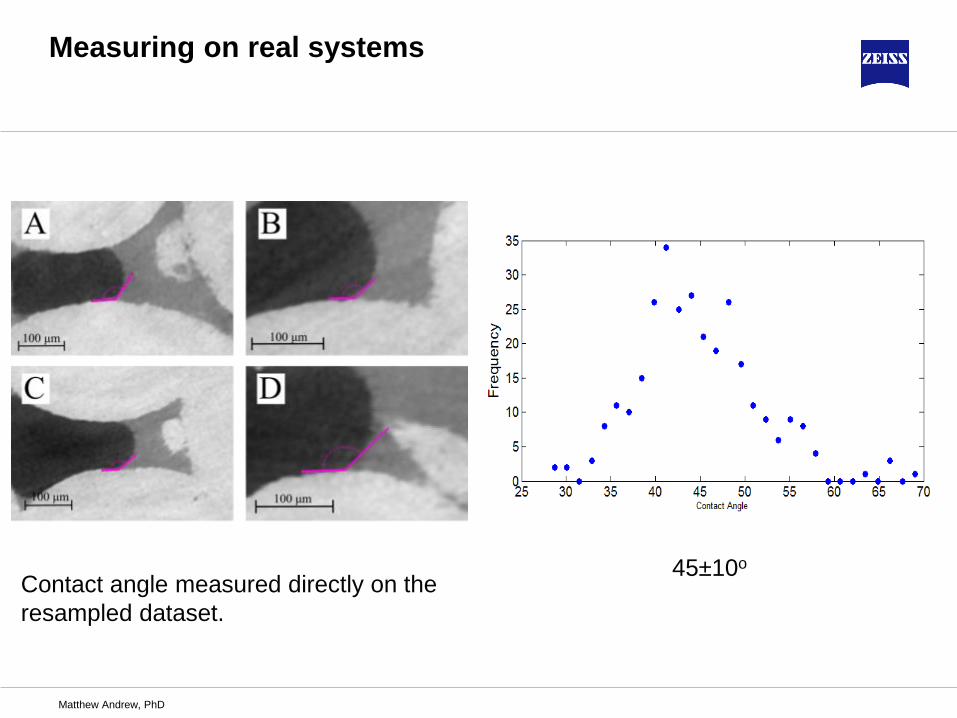
Measuring on real systems
Contact angle measured directly on the
resampled dataset.
45±10o
Matthew Andrew, PhD

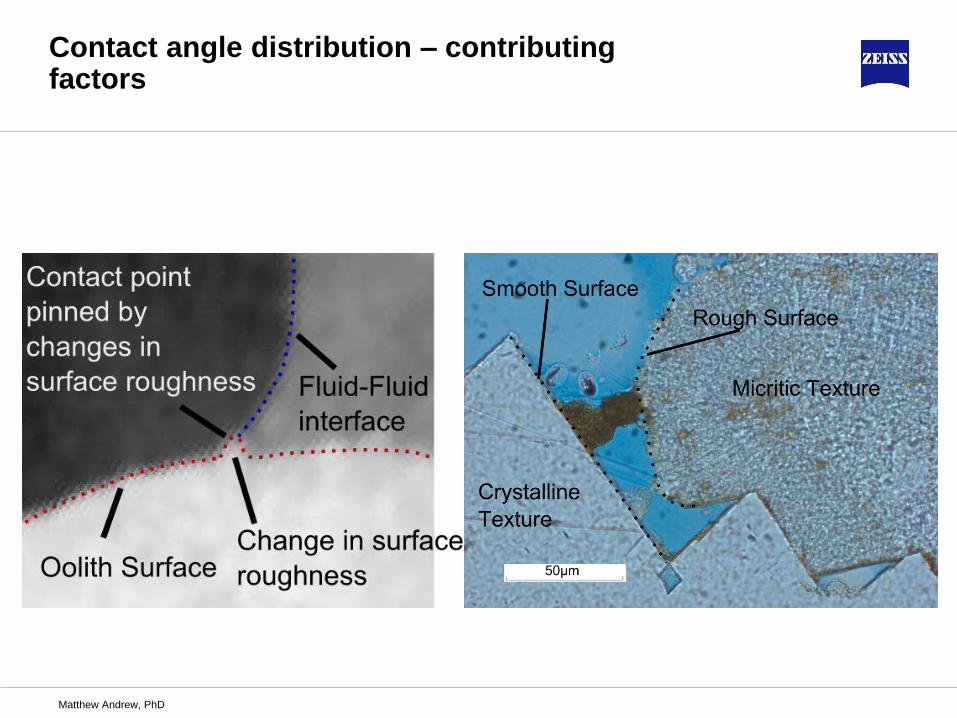
Contact angle distribution – contributing factors
Matthew Andrew, PhD
Contact angle distribution – contributing factors
Matthew Andrew, PhD

Contact angle distribution – contributing factors
Matthew Andrew, PhD
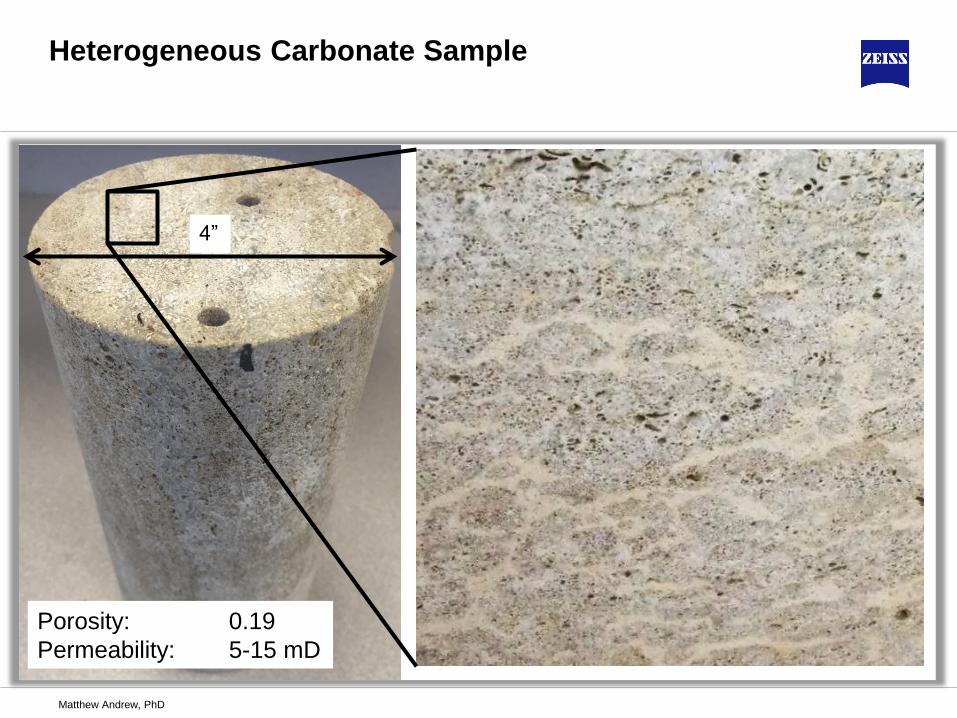
4”
Porosity: 0.19
Permeability: 5-15 mD
Heterogeneous Carbonate Sample
Matthew Andrew, PhD

4”
4”
4”
1”
4”
Results
Macroscopic Scanning
Matthew Andrew, PhD
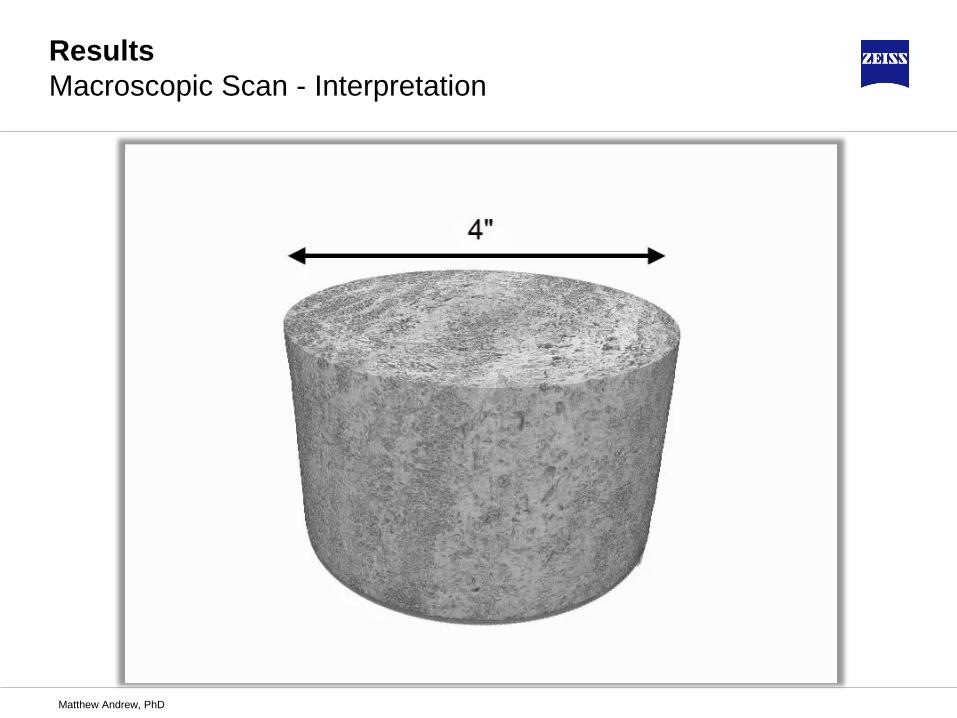
Results
Macroscopic Scan - Interpretation
Matthew Andrew, PhD

Results
Macroscopic Scan - Classification
Matthew Andrew, PhD
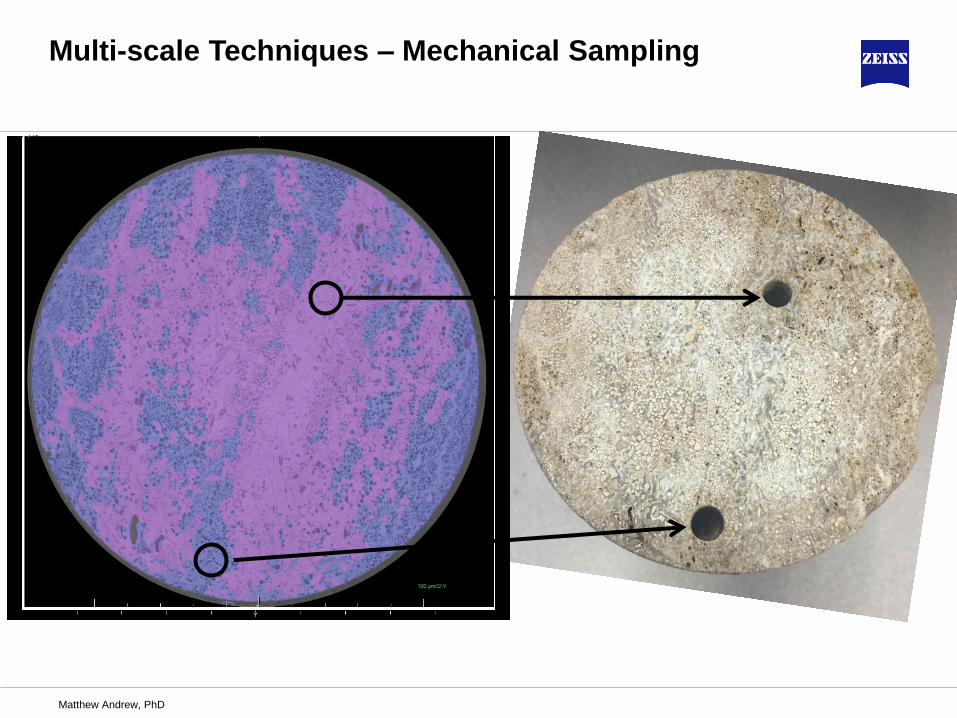
Multi-scale Techniques – Mechanical Sampling
Matthew Andrew, PhD
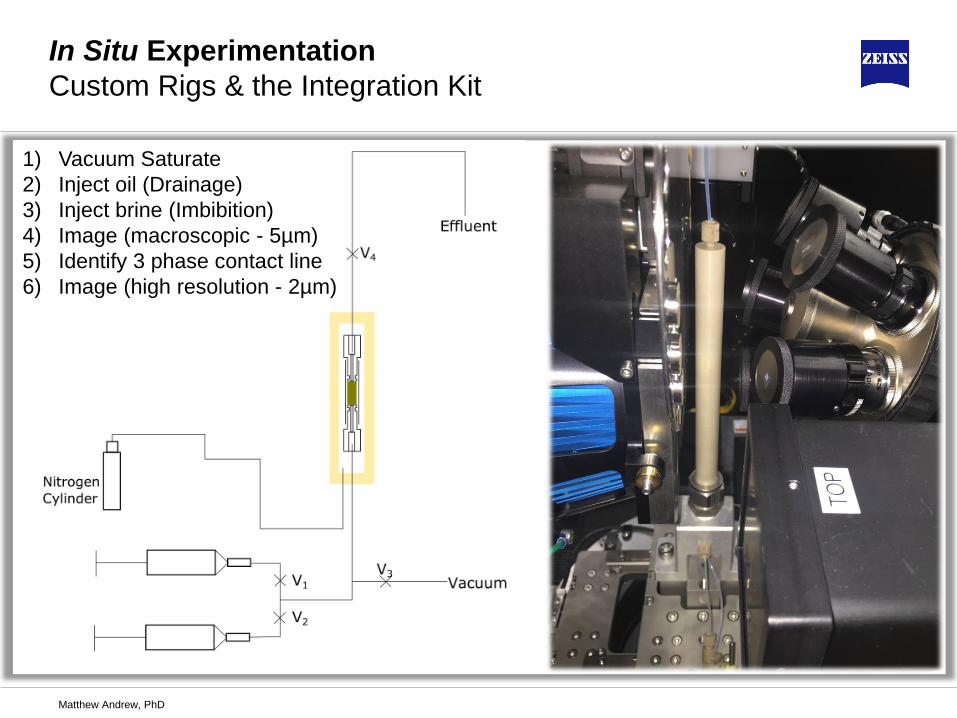
1) Vacuum Saturate
2) Inject oil (Drainage)
3) Inject brine (Imbibition)
4) Image (macroscopic - 5µm)
5) Identify 3 phase contact line
6) Image (high resolution - 2µm)
In Situ Experimentation
Custom Rigs & the Integration Kit
Matthew Andrew, PhD
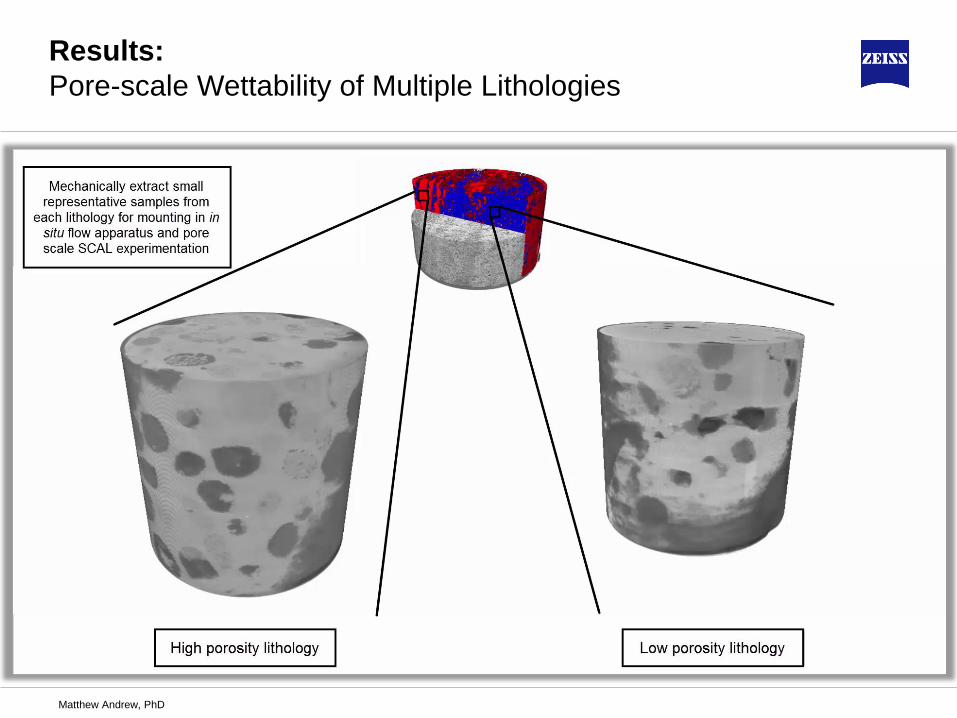
Results:
Pore-scale Wettability of Multiple Lithologies
Matthew Andrew, PhD

Causes & Correlative Microscopy
Matthew Andrew, PhD

Towards automation
Matthew Andrew, PhD
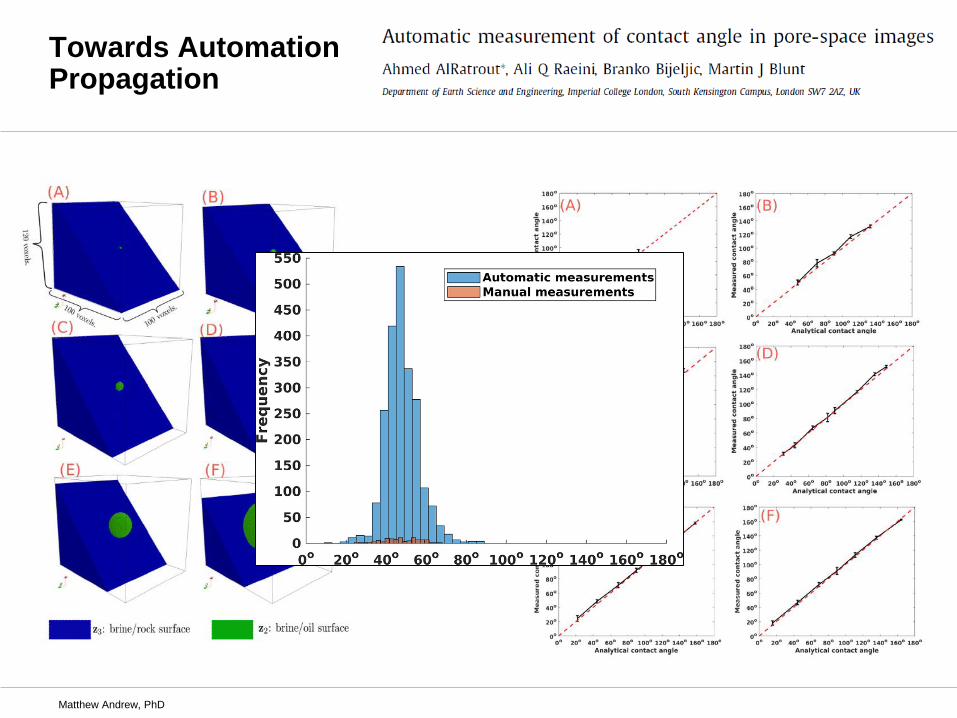
Towards AutomationPropagation
Matthew Andrew, PhD
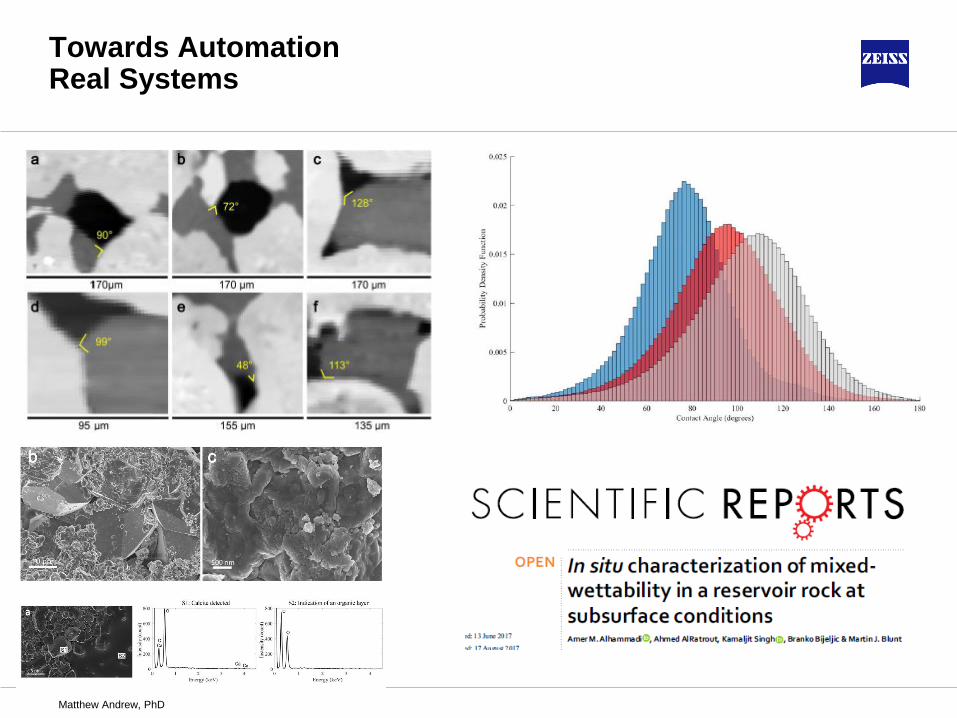
Towards AutomationReal Systems
Matthew Andrew, PhD
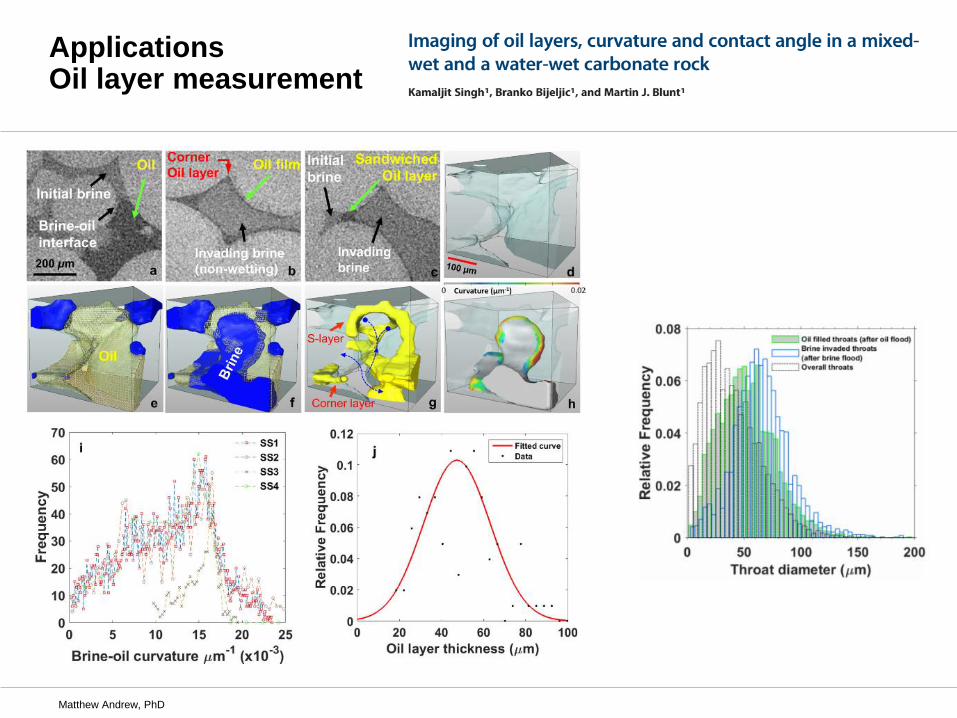
ApplicationsOil layer measurement
Matthew Andrew, PhD

ApplicationsDuring steady state flow
Matthew Andrew, PhD

ApplicationsProppant embedment
Matthew Andrew, PhD
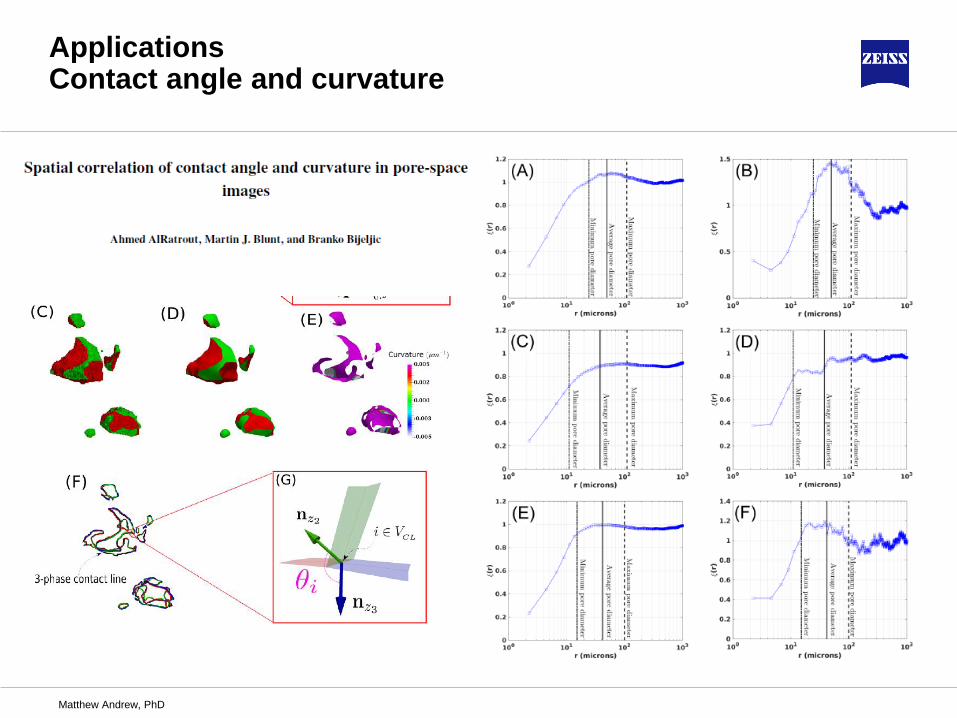
ApplicationsContact angle and curvature
Matthew Andrew, PhD

Kowalewski et al. 2003, Journal of Petroleum Science and
Engineering, Volume 39, Page 377, DOI: 10.1016/S0920-
4105(03)00076-7
cryo-SEM - origins
oil
Brine
Grain
Matthew Andrew, PhD
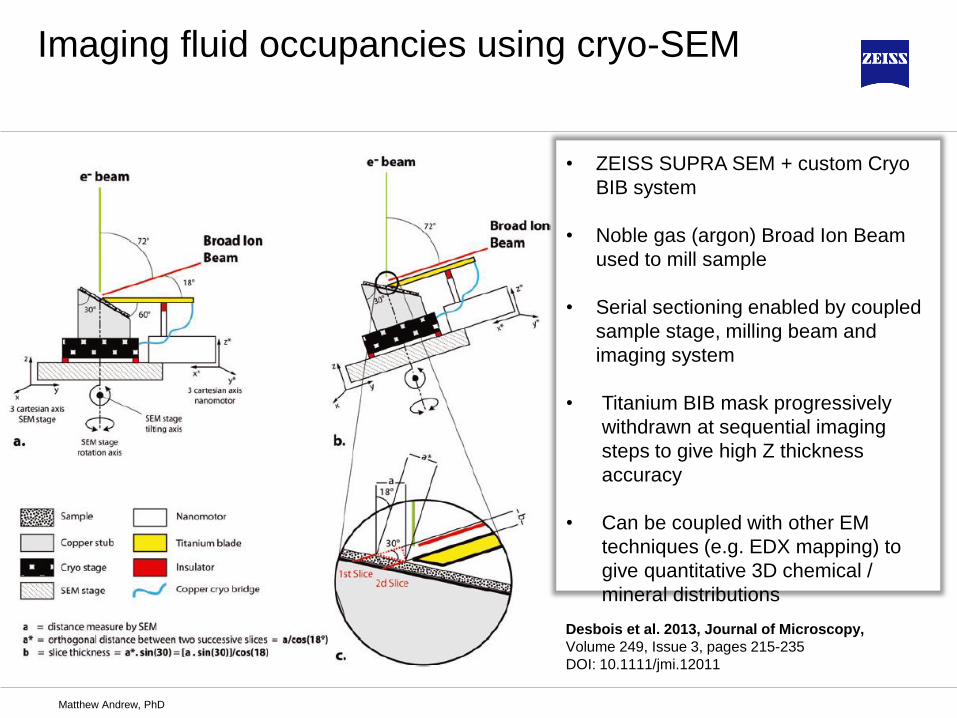
Desbois et al. 2013, Journal of Microscopy,
Volume 249, Issue 3, pages 215-235
DOI: 10.1111/jmi.12011
Imaging fluid occupancies using cryo-SEM
• ZEISS SUPRA SEM + custom Cryo
BIB system
• Noble gas (argon) Broad Ion Beam
used to mill sample
• Serial sectioning enabled by coupled
sample stage, milling beam and
imaging system
• Titanium BIB mask progressively
withdrawn at sequential imaging
steps to give high Z thickness
accuracy
• Can be coupled with other EM
techniques (e.g. EDX mapping) to
give quantitative 3D chemical /
mineral distributions
Matthew Andrew, PhD
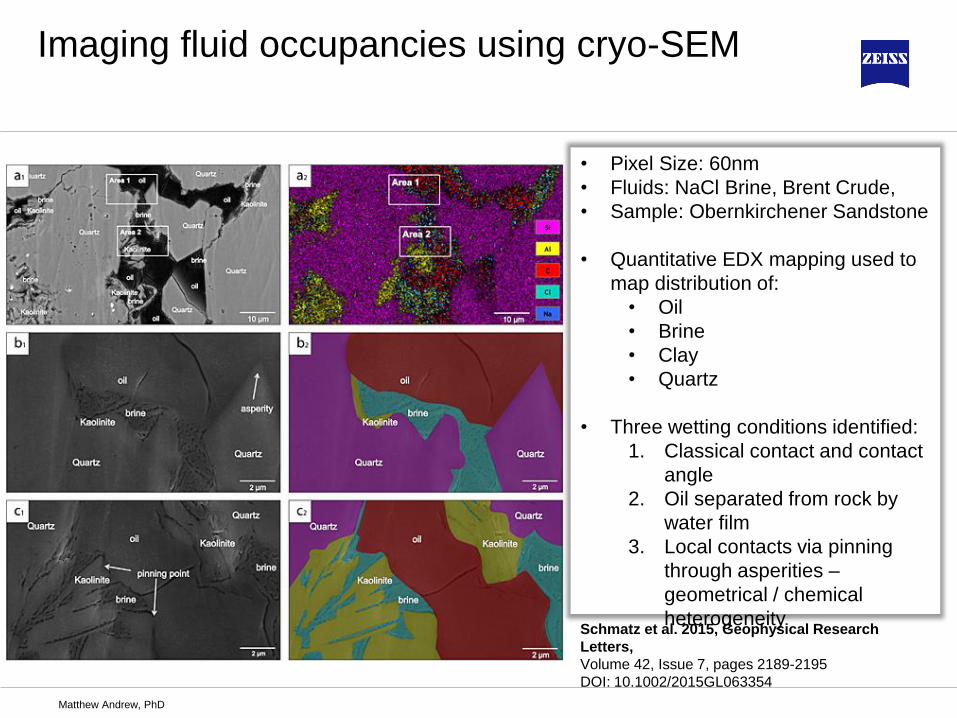
Imaging fluid occupancies using cryo-SEM
Schmatz et al. 2015, Geophysical Research
Letters,
Volume 42, Issue 7, pages 2189-2195
DOI: 10.1002/2015GL063354
• Pixel Size: 60nm
• Fluids: NaCl Brine, Brent Crude,
• Sample: Obernkirchener Sandstone
• Quantitative EDX mapping used to
map distribution of:
• Oil
• Brine
• Clay
• Quartz
• Three wetting conditions identified:
1. Classical contact and contact
angle
2. Oil separated from rock by
water film
3. Local contacts via pinning
through asperities –
geometrical / chemical
heterogeneity
Matthew Andrew, PhD
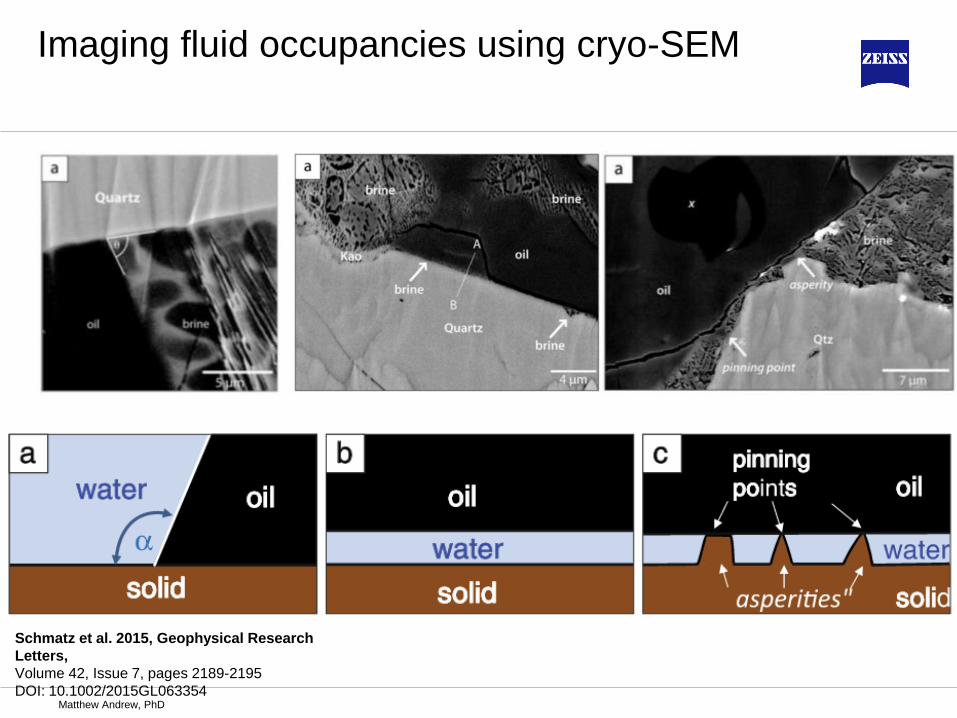
Imaging fluid occupancies using cryo-SEM
Schmatz et al. 2015, Geophysical Research
Letters,
Volume 42, Issue 7, pages 2189-2195
DOI: 10.1002/2015GL063354Matthew Andrew, PhD

Matthew Andrew, PhD


