38
© 2013 EDB All rights reserved. 1 Scalability And Performance Improvements In PostgreSQL 9.5 • Amit Kapila | 2015.06.19
| Date post: | 06-Feb-2018 |
| Category: |
Documents |
| Upload: | nguyenduong |
| View: | 220 times |
| Download: | 2 times |

© 2013 EDB All rights reserved. 1
Scalability And Performance Improvements In PostgreSQL 9.5
• Amit Kapila | 2015.06.19
2
● Read Scalability
● Further Improvements In Read Operation
● Other Performance Work In 9.5
● Page Writes
● Write Scalability
Contents
3
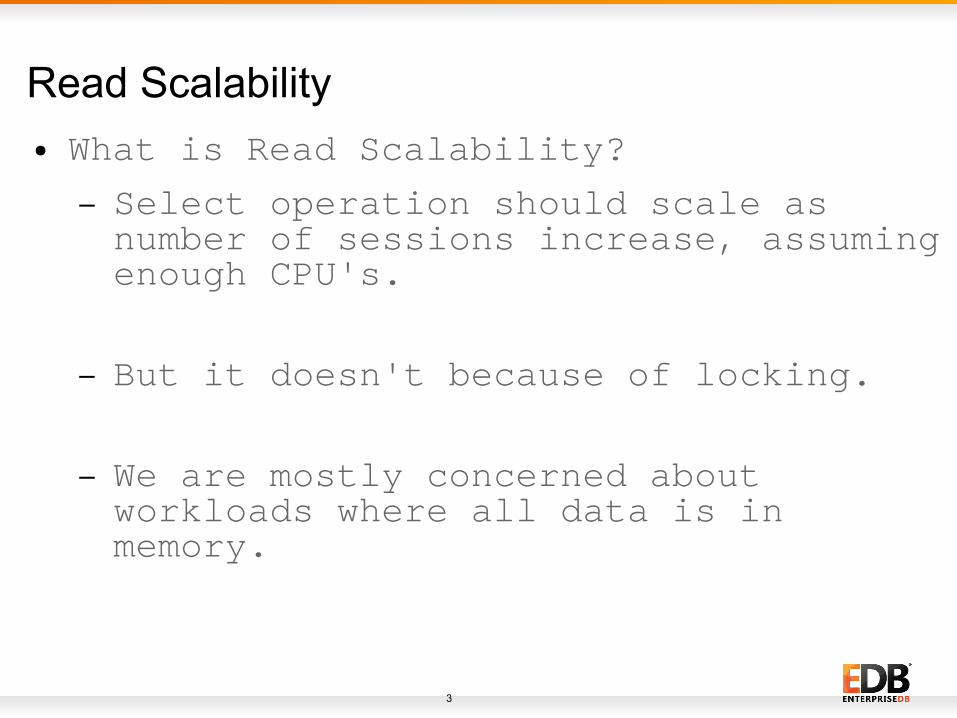
Read Scalability● What is Read Scalability?
– Select operation should scale as number of sessions increase, assuming enough CPU's.
– But it doesn't because of locking.
– We are mostly concerned about workloads where all data is in memory.
4
Read Scalability● Good boost in scalability.
– When data fits in shared_buffers
– When data fits in RAM
5
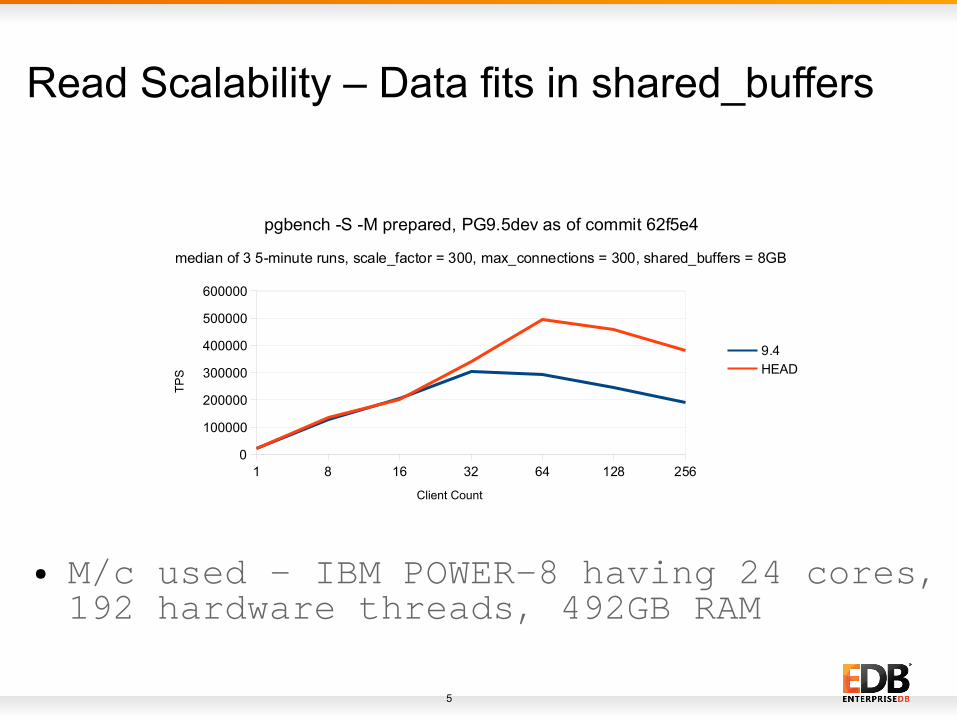
Read Scalability – Data fits in shared_buffers
1 8 16 32 64 128 2560
100000
200000
300000
400000
500000
600000
pgbench -S -M prepared, PG9.5dev as of commit 62f5e4
median of 3 5-minute runs, scale_factor = 300, max_connections = 300, shared_buffers = 8GB
9.4
HEAD
Client Count
TP
S
● M/c used - IBM POWER-8 having 24 cores, 192 hardware threads, 492GB RAM
6
Read Scalability● In 9.4 it peaks at 32 clients, now it peaks at 64 clients and we can see the performance improvement upto (~98%) and it is better in all cases at higher client count starting from 32 clients
● The main work which lead to this improvement is commit – ab5194e6 (Improve LWLock scalability)
7
Read Scalability● The previous implementation has a bottleneck around spin locks that were acquired for LWLock Acquisition and Release and the implementation for 9.5 has changed the LWLock implementation to use atomic operations to manipulate the state.
8
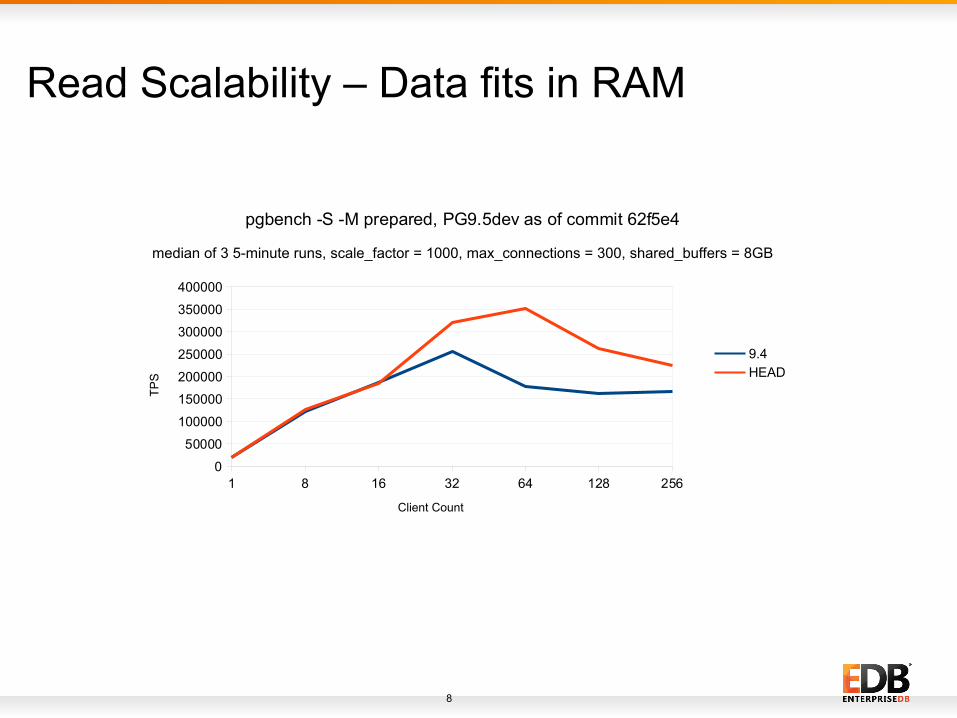
Read Scalability – Data fits in RAM
1 8 16 32 64 128 2560
50000
100000
150000
200000
250000
300000
350000
400000
pgbench -S -M prepared, PG9.5dev as of commit 62f5e4
median of 3 5-minute runs, scale_factor = 1000, max_connections = 300, shared_buffers = 8GB
9.4
HEAD
Client Count
TP
S
9
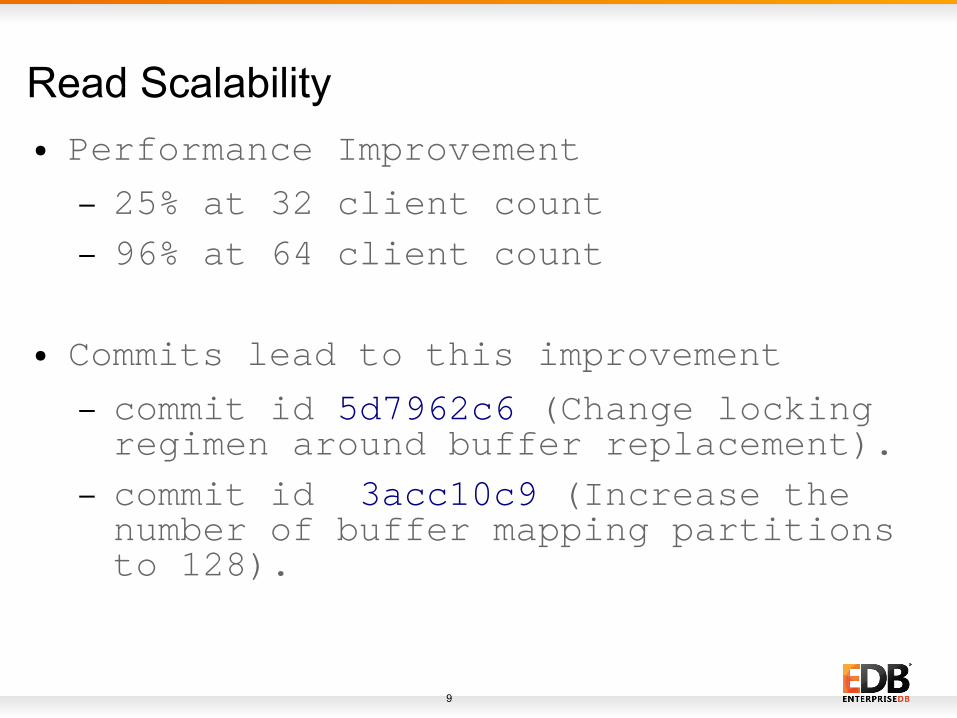
Read Scalability● Performance Improvement
– 25% at 32 client count
– 96% at 64 client count
● Commits lead to this improvement
– commit id 5d7962c6 (Change locking regimen around buffer replacement).
– commit id 3acc10c9 (Increase the number of buffer mapping partitions to 128).
10
Read Scalability● 2 main bottlenecks
– a BufFreeList LWLock was getting acquired to find a free buffer for a page
– to change the association of buffer in buffer mapping hash table a LWLock is acquired on a hash partition to which the buffer to be associated belongs and as there were just 16 such partitions, there was huge contention when multiple clients starts operating on same partition
11
Read Scalability● To reduce the bottleneck due to first problem, used a spinlock which is held just long enough to pop the freelist or advance the clock sweep hand, and then released.
● To reduce the bottleneck due to second problem, increase the buffer partitions to 128.
● The crux of this improvement is that we had to resolve both the bottlenecks together to see a major improvement in scalability.
12
● Read Scalability
● Further Improvements In Read Operation
● Other Performance Work In 9.5
● Page Writes
● Write Scalability
Contents
13
Further Improvements In Read Operation
● Dynahash tables
- Current Number of Partitions sufficient?
- Bottleneck is around the spinlock used to protect any addition or deletion in hash table (in particular nentries and freeList).
● Snapshot Acquire
- Contends with transaction end
14
● Read Scalability
● Further Improvements In Read Operation
● Other Performance Work In 9.5
● Page Writes
● Write Scalability
Contents
15
Sorting Improvements● Use abbreviated keys for faster sortingof text, numeric, datum
● This can be much faster than the old way of doing sorting if the first few bytes of the string are usually sufficient to resolve the comparison.
16
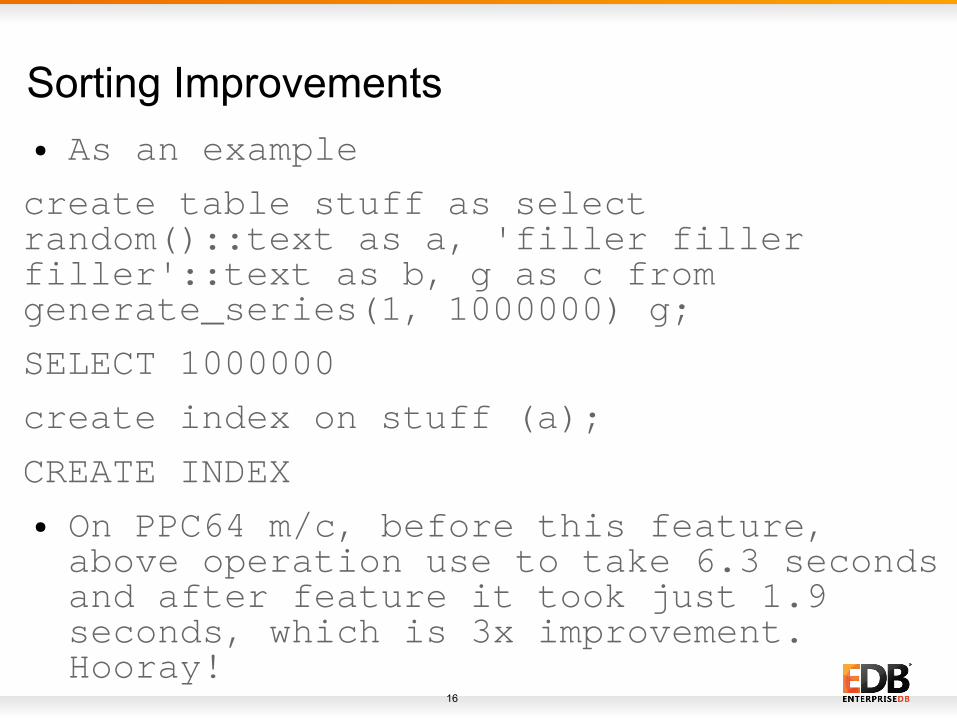
Sorting Improvements● As an example
create table stuff as select random()::text as a, 'filler filler filler'::text as b, g as c from generate_series(1, 1000000) g;
SELECT 1000000
create index on stuff (a);
CREATE INDEX
● On PPC64 m/c, before this feature, above operation use to take 6.3 seconds and after feature it took just 1.9 seconds, which is 3x improvement. Hooray!
17
PLpgsql Improvements● Impressive speed gains for plpgsql functions that do element-by-element access or update of large arrays.
● Reduce IO casting and used binary casting for assignment among non-identical variable types wherever possible.
18
BRIN● Block Range Index
● Stores only bounds-per-block-range
● Default is 128 blocks
● Very small indexes
● Scans all blocks for matches
● Used for scanning large tables
19
Parallel Vacuumdb● vacuumdb can use concurrent connections
● Add -j<n> to command line
● This option reduces the time of the processing but it also increases the load on the database server, so use it cautiously.
20
WAL Compression● Optional compression for full page images in WAL
● wal_compression=off
● Smaller WAL
● Faster writes, faster replication
● Costs CPU
● Only compresses FPIs
21
Reduce Lock Level● Reduce lock levels to ShareRowExclusive for the following SQL
CREATE TRIGGER (but not DROP or ALTER)
ALTER TABLE ENABLE TRIGGER
ALTER TABLE DISABLE TRIGGER
ALTER TABLE … ADD CONSTRAINT FOREIGN KEY
22
Miscellaneous Performance Improvements● Improved performance for Index Scan on ">" condition. We can see
performance improvement from 5 to 30 percent.
● Improved speed for CRC calculation which will help in reducing WAL record formation time.
● Reduced memory allocations during transaction start time. This has small but measurable performance improvement for simple transactions.
23
● Read Scalability
● Further Improvements In Read Operation
● Other Performance Work In 9.5
● Page Writes
● Write Scalability
Contents
24
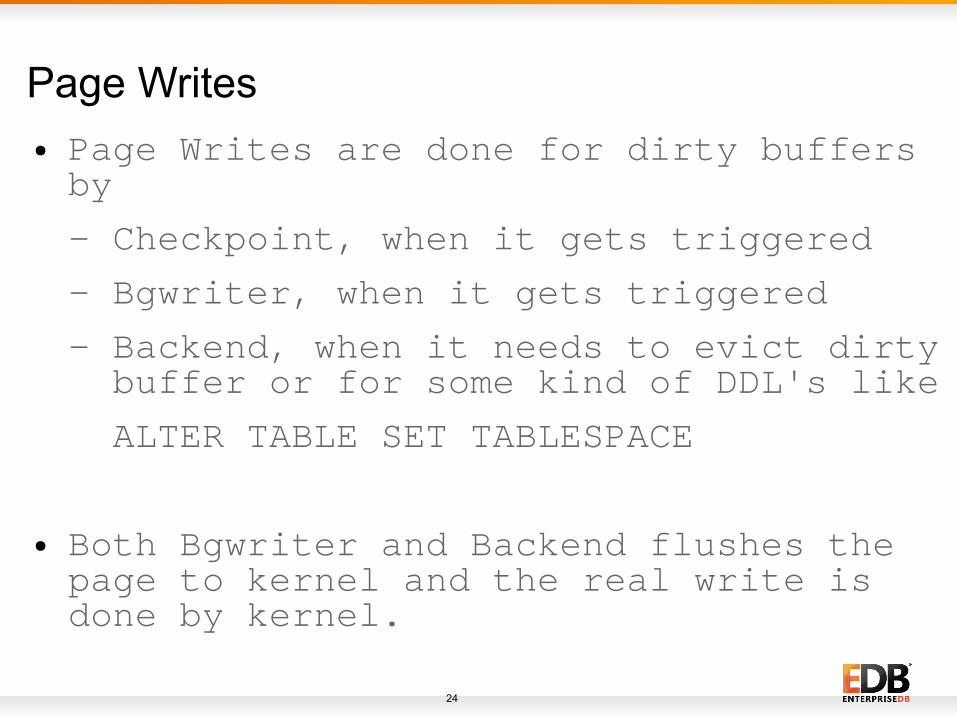
Page Writes● Page Writes are done for dirty buffers by
- Checkpoint, when it gets triggered
- Bgwriter, when it gets triggered
- Backend, when it needs to evict dirty buffer or for some kind of DDL's like
ALTER TABLE SET TABLESPACE
● Both Bgwriter and Backend flushes the page to kernel and the real write is done by kernel.
25
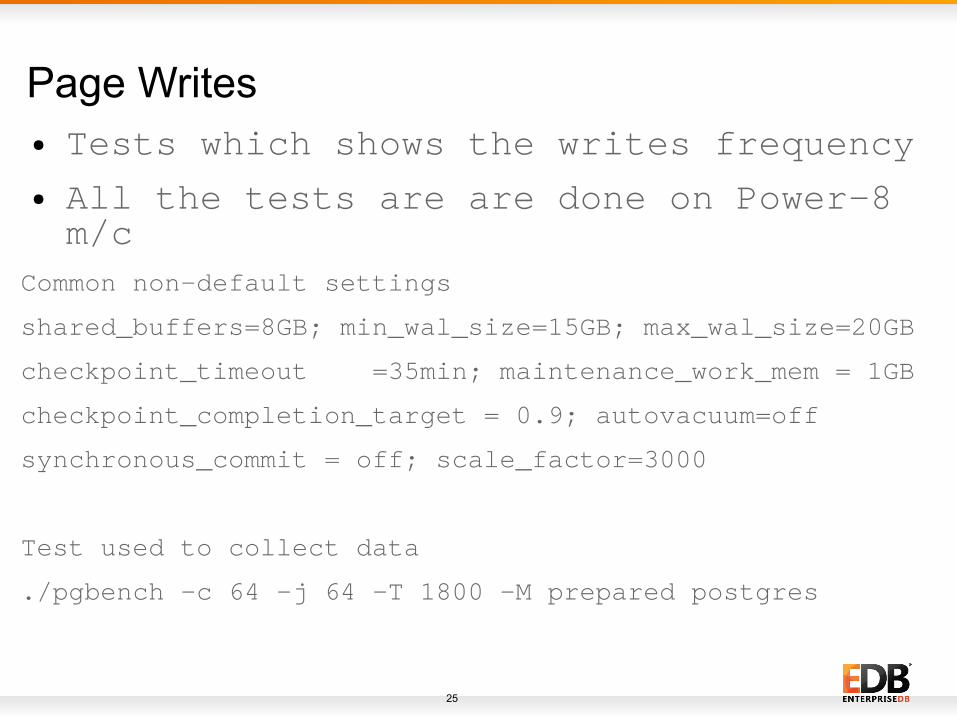
Page Writes● Tests which shows the writes frequency
● All the tests are are done on Power-8 m/c
Common non-default settings
shared_buffers=8GB; min_wal_size=15GB; max_wal_size=20GB
checkpoint_timeout =35min; maintenance_work_mem = 1GB
checkpoint_completion_target = 0.9; autovacuum=off
synchronous_commit = off; scale_factor=3000
Test used to collect data
./pgbench -c 64 -j 64 -T 1800 -M prepared postgres
26
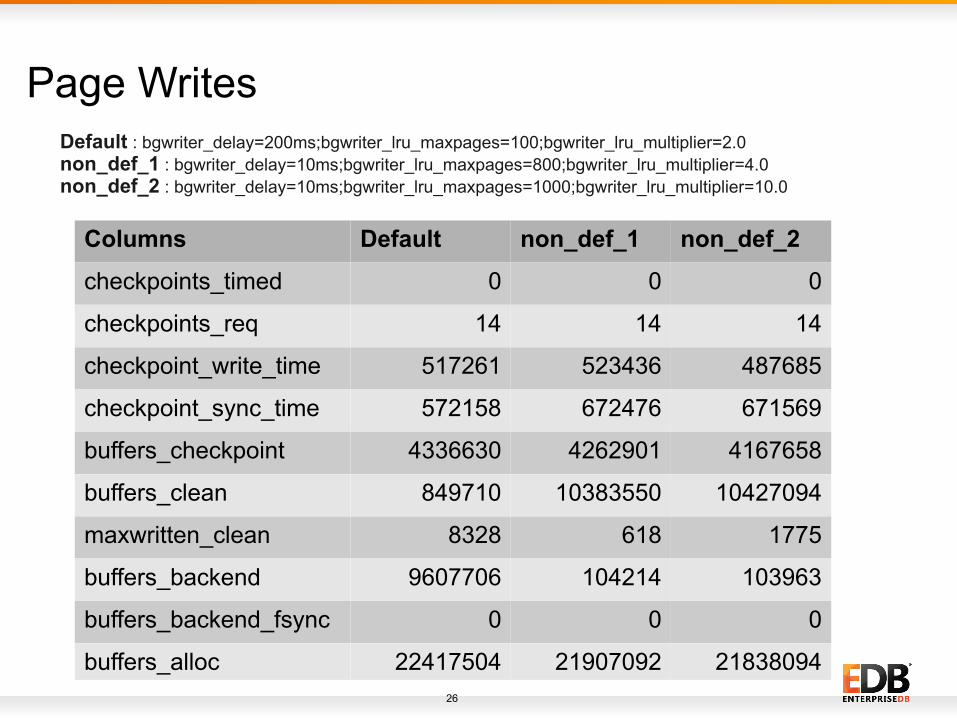
Page Writes
Columns Default non_def_1 non_def_2
checkpoints_timed 0 0 0
checkpoints_req 14 14 14
checkpoint_write_time 517261 523436 487685
checkpoint_sync_time 572158 672476 671569
buffers_checkpoint 4336630 4262901 4167658
buffers_clean 849710 10383550 10427094
maxwritten_clean 8328 618 1775
buffers_backend 9607706 104214 103963
buffers_backend_fsync 0 0 0
buffers_alloc 22417504 21907092 21838094
Default : bgwriter_delay=200ms;bgwriter_lru_maxpages=100;bgwriter_lru_multiplier=2.0non_def_1 : bgwriter_delay=10ms;bgwriter_lru_maxpages=800;bgwriter_lru_multiplier=4.0non_def_2 : bgwriter_delay=10ms;bgwriter_lru_maxpages=1000;bgwriter_lru_multiplier=10.0
27
Page Writes - Observations● Backend writes (buffers_backend) have been reduced significantly on changing bgwriter specific settings.
● Even at most aggressive settings (non_def_2), the writes have not been reduced to zero.
● Reduced writes by backend improves performance by just 3~4%.
– Writing to kernel is not that costly.
28
● Read Scalability
● Further Improvements In Read Operation
● Other Performance Work In 9.5
● Page Writes
● Write Scalability
Contents
29
Write Scalability● What is Write Scalability?
– Write operations (Insert/Update/Delete) should scale as as number of sessions increases assuming enough CPU's.
– But it doesn't, because of locking done during Commit operation.
– We are mostly concerned about workloads where data fits in memory.
30
Write Scalability Performance Data
● Data is mainly taken for 2 kind of modes
– synchronous_commit = on
– synchronous_commit = off
● 2 kind of scale factors are used
– when all the data fits in shared buffers (scale_factor = 300)
– when all the data can't fit in shared buffers, but can fit in RAM (scale_factor = 3000)
31
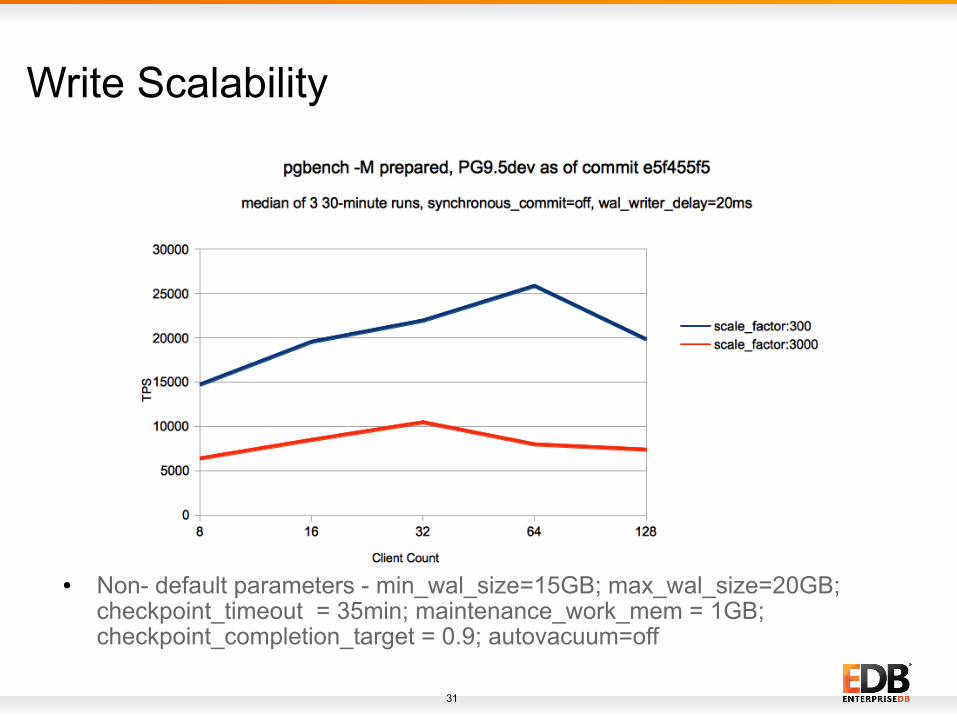
Write Scalability
● Non- default parameters - min_wal_size=15GB; max_wal_size=20GB; checkpoint_timeout = 35min; maintenance_work_mem = 1GB; checkpoint_completion_target = 0.9; autovacuum=off
32
Write Scalability● Data fits in shared_buffers (scale_factor = 300)
– Performance increase upto 64 client count with TPS being approximately 75 percent higher at 64 client-count as compare to 8 client count.
● Data doesn't fit in shared buffers, but fit in RAM (scale_factor = 3000)
– we can see performance increase upto 32 client-count with TPS being 64 percent higher than at 8 client-count and then it falls there on.
33
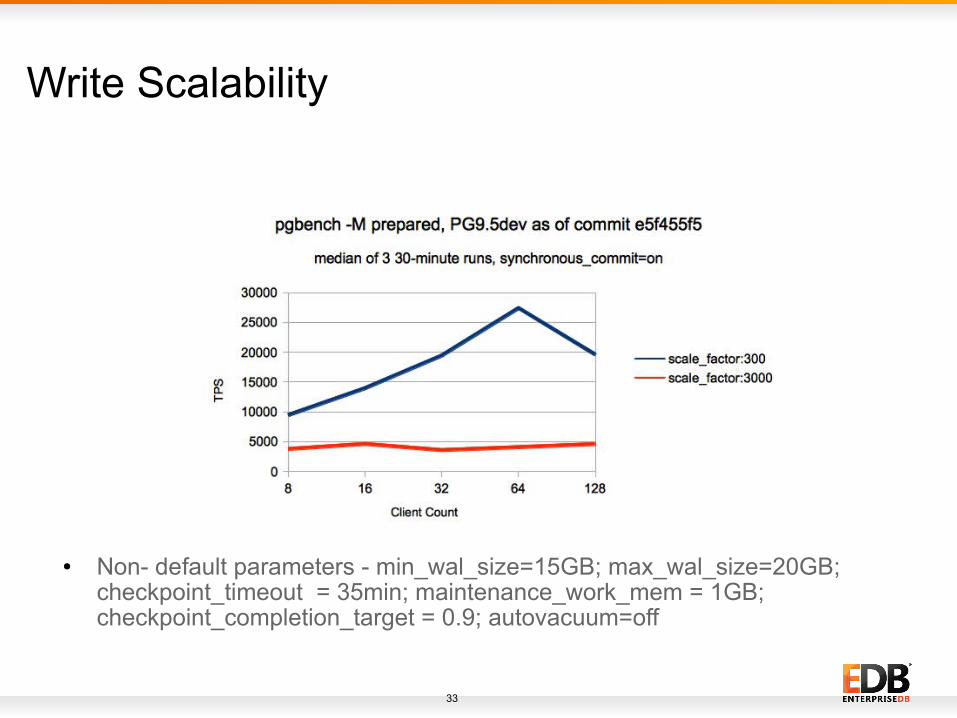
Write Scalability
● Non- default parameters - min_wal_size=15GB; max_wal_size=20GB; checkpoint_timeout = 35min; maintenance_work_mem = 1GB; checkpoint_completion_target = 0.9; autovacuum=off
34
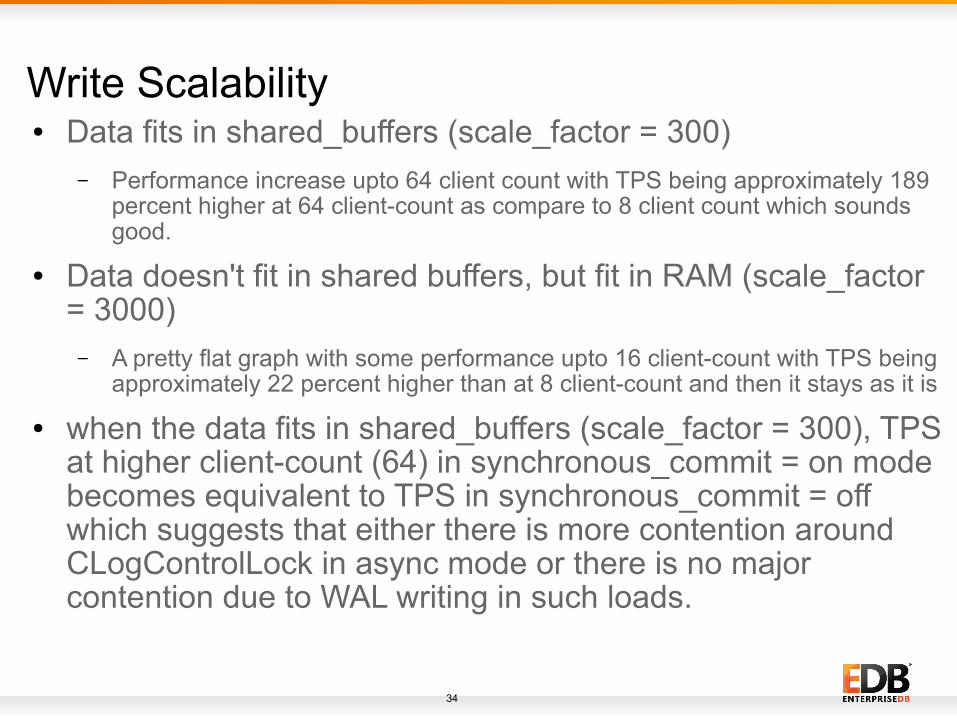
Write Scalability● Data fits in shared_buffers (scale_factor = 300)
– Performance increase upto 64 client count with TPS being approximately 189 percent higher at 64 client-count as compare to 8 client count which sounds good.
● Data doesn't fit in shared buffers, but fit in RAM (scale_factor = 3000)– A pretty flat graph with some performance upto 16 client-count with TPS being
approximately 22 percent higher than at 8 client-count and then it stays as it is
● when the data fits in shared_buffers (scale_factor = 300), TPS at higher client-count (64) in synchronous_commit = on mode becomes equivalent to TPS in synchronous_commit = off which suggests that either there is more contention around CLogControlLock in async mode or there is no major contention due to WAL writing in such loads.
35
Write Scalability – General observations● For both the cases (Asynchronous and Synchronous commit)
when the data doesn't fit in shared_buffers (scale_factor = 3000), the TPS is quite low and one reason is that backends might be performing writes themselves.
36
Write Scalability – Concurrency BottlenecksAs per my knowledge, the locks that can lead to contention for this workload are:
a. ProcArrayLock (used for taking snapshot and at transaction commit)
b. WALWriteLock (used for performing WALWrites)
c. CLOGControlLock (used to read and write transaction status)
d. WALInsertLocks (used for writing data to WAL buffer)

37
Questions?

38
Thanks!


